

Bees of the Buenos Aires National Wildlife Refuge—A Preliminary Report on a Bee Survey in a Vulnerable Semi-Desert Grassland of the Sonoran Desert
Links
- Document: Report (8.78 MB pdf) , HTML , XML
- Data Release: USGS data release - Native bees of the Buenos Aires National Wildlife Refuge, Arizona—Taxonomic data and site photos
- Download citation as: RIS | Dublin Core
Acknowledgments
We thank Ann Chenevert-Steffler, former wildlife biologist at Buenos Aires National Wildlife Refuge, and other Refuge staff for their assistance with providing historical records, fire data, lodging, and logistical support. We also thank Dr. Wendy Moore, Wesley “Gene” Hall, and the University of Arizona Insect Collection for providing deoxyribonucleic acid (DNA) barcoding identification for select bee specimens and for the use of their holdings to verify specimen identifications. DNA barcoding was funded by a University of Arizona Technology and Research Initiative Fund (TRIF) grant titled “Proof of Concept: Using DNA Barcodes to Identify Arizona's Insects of Importance to Agriculture, Natural Areas, and Human Health” led by Dr. Moore. Dr. Terry Griswold of the U.S. Department of Agriculture Agricultural Research Service provided information on additional collections at the Refuge. Dr. Jessica Miller of the U.S. Fish and Wildlife Service provided information on the listing status of Bombus sonorous (Sonoran bumble bee). We thank Drs. Wendy Moore, Kim Franklin (Arizona Sonora Desert Museum), and Mitch Sternberg (U.S. Fish and Wildlife Service) for critical reviews of this manuscript. U.S. Geological Survey biological technician Atticus Wolf provided operational support. This project was funded by the U.S. Geological Survey/U.S. Fish and Wildlife Service Science Support Program and Ecosystems Mission Area. Any use of trade, firm, or product names is for descriptive purposes only and does not imply endorsement by the U.S. Government.
Abstract
Pollinators are vital to the continued existence and seed production of about 87.5 percent of all flowering plants (Ollerton and others, 2011). In the semi-desert grasslands of Buenos Aires National Wildlife Refuge, in the Sonoran Desert of the United States, flowering forbs provide seed vital to the food base of wildlife, including the 136 species of resident and migratory birds using the Refuge’s grasslands and, notably, the endangered Colinus virginianus ridgwayi (masked bobwhite quail) for which the Refuge was established. The Sonoran Desert is known for its high diversity of native bees, but these pollinators have not been extensively described at the Refuge. We conducted a survey of native bees at the Refuge from late May 2019 through early February 2020. Of all bees collected, we subsampled, curated, and identified over 3,300 bees representing 39 genera within four families (Andrenidae, Apidae, Halictidae, Megachilidae). For about 8 percent of the sampled bees, we further identified 36 species and several potentially new, undescribed species using either visual or deoxyribonucleic acid (DNA) barcoding methods. Sampling was done using bee bowls and blue-vane traps. Our initial results suggest the Refuge is species rich in native bees and supports diverse bee faunas across subtle differences in plant composition and location within the Refuge. Continued survey, inventory, and focused monitoring of the bee populations of the Refuge will be valuable in understanding the relationship of bee populations with the health and productivity of seed-bearing plants, effect of prescribed fire on bee fauna, the ongoing dynamics of bee-plant interactions, and how the bee pollinator community of the Refuge is responding to stressors, such as invasive species proliferation and changing climate conditions.
Introduction
Native bees (order Hymenoptera, clade Anthophila) provide pollination services vital to the reproduction of seed-bearing plants, which, in turn, support higher biota in natural systems (Ollerton and others, 2011). Despite the major role native bees play in the health of ecosystems, they are historically under-surveyed (Frankie and others, 2002) and infrequently monitored, especially in more remote natural areas. Without baseline occurrence data, tracking the status of bee populations over time within an area of conservation concern is not possible.
Knowledge of native bees, such as their activity levels throughout the seasons and their preferred host plants, can inform conservation and land management practices, including the restoration and maintenance of seed-bearing plants. Without the services provided by pollinators, seed production is reduced or could even be non-existent for some plants. Plant community composition could change to favoring plants that are wind or self-pollinated (Tepedino, 1979; Kearns and others, 1998), and the plant-pollinator food chain would be disrupted with cascading impacts for herbivores and seed feeding wildlife (Buckley and Nabhan, 2016; Meiners and others, 2019).
Some of Earth’s highest bee diversity has been reported within the broader Sonoran Desert region (Minckley and Radke, 2021; Orr and others, 2021). However, published systematic studies of bee fauna in natural areas of the Sonoran Desert have been few. We provide here a preliminary report on a survey, done late May 2019 through early February 2020, of bees at the U.S. Fish and Wildlife Service (FWS) Buenos Aires National Wildlife Refuge (hereafter the Refuge; fig. 1) in southern Arizona. We collected bees at eight sites that were characterized by a presumed south to north precipitation gradient, and different vegetation community structure. We curated and identified a representative sample of all bees collected, and for these sampled bees, we examined their composition among the sites and activity as indicated by number of genera sampled at a site and by the time of year. We also examined sample differences in bee bowls compared with blue-vane traps in closely placed sites and how the location of a site affected the genus composition of sampled bees. Project data are available at Hoover and others (2024).
Methods
Study Area
The Refuge (117,464 acres) is located at the southern end of the Altar Valley, southwest of Tucson, Arizona. The Refuge is bisected by State Route 286, which extends north from the United States-Mexico border at Sasabe, Arizona, for about 24 miles to the northern end of the Refuge (fig. 1). Although originally a working cattle ranch, in 1985, the Refuge was established by the FWS with an emphasis on managing the semi-desert grassland habitat supporting the federally endangered masked Colinus virginianus ridgwayi (bobwhite quail; FWS, 2003). In addition to this quail, other species regulated under the Endangered Species Act (16 U.S.C. 35 1531 et seq.) and at the Refuge include the endangered Coryphantha scheeri var. robustispina (Pima pineapple cactus) and the threatened Coccyzus americanus (yellow-billed cuckoo). The Refuge supports a rich fauna that includes other species of concern such as the Gopherus morafkai (Sonoran Desert tortoise), the Danaus plexippus (candidate monarch butterfly), and the five bat species of special concern: the Choeronycteris mexicana (Mexican long-tongued bat), Leptonycteris verbabuenae (lesser long-nosed bat), Myotis velifer (cave myotis), Myotis thysanodes (fringed myotis), and Eumops underwoodi (Underwood’s mastiff bat). Markedly, 136 (41 percent) of the Refuge’s documented 325 bird species utilize the grasslands at some point during their life cycle (FWS, 2003). Many of these grassland birds, including the masked bobwhite quail, require seed-bearing plants for food resources and are, thus, dependent upon the health of pollinators at the Refuge.
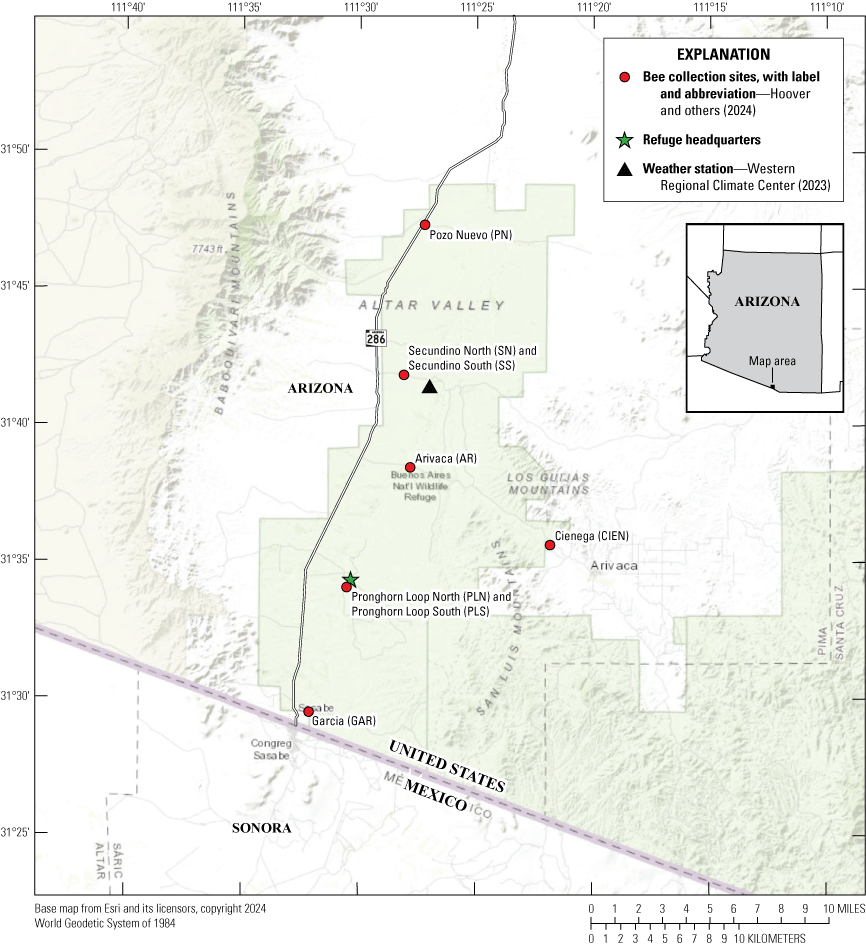
Map showing the general location of Buenos Aires National Wildlife Refuge within Arizona and the location of bee collection sites at the Refuge. The Pronghorn Loop and Secundino sites were paired, and each site was less than 60 meters from its pair. Also shown are the locations of the Refuge headquarters and Sasabe weather station.
Around 94 percent of the Refuge supports semi-desert grassland with patches of higher shrub cover (grassland-steppe) or mesquite trees (grassland-savanna). Although native bunchgrasses remain, large areas of the Refuge have been invaded by the non-native Eragrostis lehmanniana (Lehmann lovegrass). The native bunchgrasses typically have more bare ground between the grass-stem bases than the lovegrass. Although the grasses do not rely on insect pollinators, the dominant woody species of the Refuge, Prosopis glandulosa (honey mesquite) does, as do many of the shrub species, and most, if not all, of the forbs within the grassland. Within the grasslands, biennial and annual forbs can be common; 810 plant species have been documented at the Refuge, many of which produce flowers and can require insect pollination (Austin, 2005). In addition to the encroachment of invasive grass and forbs (for example, the annual forb Salsola spp. [Russian thistle]), the vegetation of the Refuge is affected by the exclusion of livestock grazing (excepting occasional trespass grazing) and by fire caused by lightning or through the active prescribed fire program of the Refuge.
Forb occurrence and abundance are dependent on seasonal precipitation at the Refuge, which can be quite variable from year to year. The average yearly rainfall at the Refuge from 1992 to 2020 was 13.14 inches (SD 3.39), and the highest precipitation for these 28 years was 20.22 in. and the lowest 4.5 in. (Western Regional Climate Center, 2023). Precipitation has a strong bimodal pattern. Summer monsoons (with the official monsoon season 15 June through 30 September) originate from the south and southeast and generally occur as strong thunderstorms. During the cooler months (1 October through 14 June), rainfall originates from the northwest or west and falls in gentler rainy events. During the survey interval (late May 2019 through early February 2020), precipitation was lower than average in the early spring, near average in the summer months, and much higher than average in November (fig. 2). Temperatures at the Refuge in the spring during the study period were slightly lower in February, May, and June than the average long-term spring temperature (1992–2020) but were similar in other seasons (fig. 3).
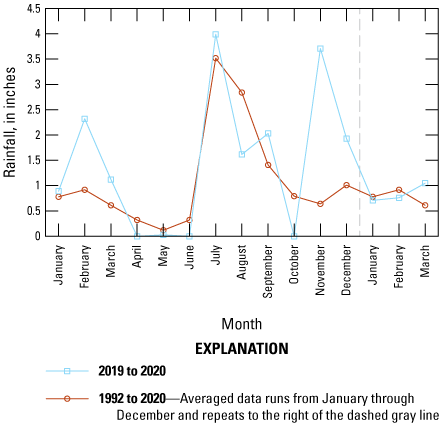
Graph showing precipitation (inches), by month, for 2019 and the early months of 2020 (blue lines) compared with average precipitation, by month, from January 1992 through March 2020 (red lines). Precipitation records were obtained from Remote Automatic Weather Stations (Western Regional Climate Center, 2023) data for the Sasabe, Arizona, station (fig. 1).
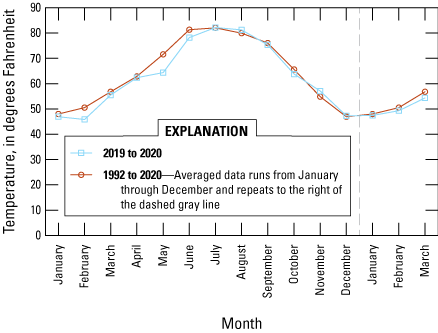
Graph showing average temperature (degrees Fahrenheit), by month, for 2019 and the early months of 2020 (blue lines) compared with average temperature, by month, from January 1992 through March 2020. Temperature records were obtained from Remote Automatic Weather Stations (Western Regional Climate Center, 2023) data for the Sasabe, Arizona, station (fig. 1).
As moisture moves northward from Mexico during the monsoon season, a gradient of summer precipitation is expected; the south is expected to get the most precipitation and the north is expected to get the least. However, this precipitation gradient has not been formally documented.
Survey Sites
We set bee traps at eight sites (fig. 1; fig. 4; table 1); six “core” sites (Pozo Nuevo, Pronghorn Loop North and South, Secundino North and South, and Garcia) were established in May 2019 and two (Arivaca and Cienega) sites were established later in August of the same year. Of the initial core sites, Pronghorn Loop North and South and Secundino North and South were paired; blue-vane traps (Tronstad and others, 2022) were installed within 50 meters of each other at the Pronghorn Loop pair and were also installed within 60 meters of each other at the Secundino pair. Otherwise, the core sites were apart by 5.5 miles (Garcia to Pronghorn Loop North and South), 9.2 miles (Pronghorn Loop North and South to Secundino North and South), and 6.4 miles (Secundino North and South to Pozo Nuevo). All sites were located off dirt roads that had occasional vehicle traffic. The two sites established later were located to document bee occurrence near a desert wash-cienega system (Cienega) and an altered rain overflow area (Arivaca). However, each of these water systems remained dry during the study period.
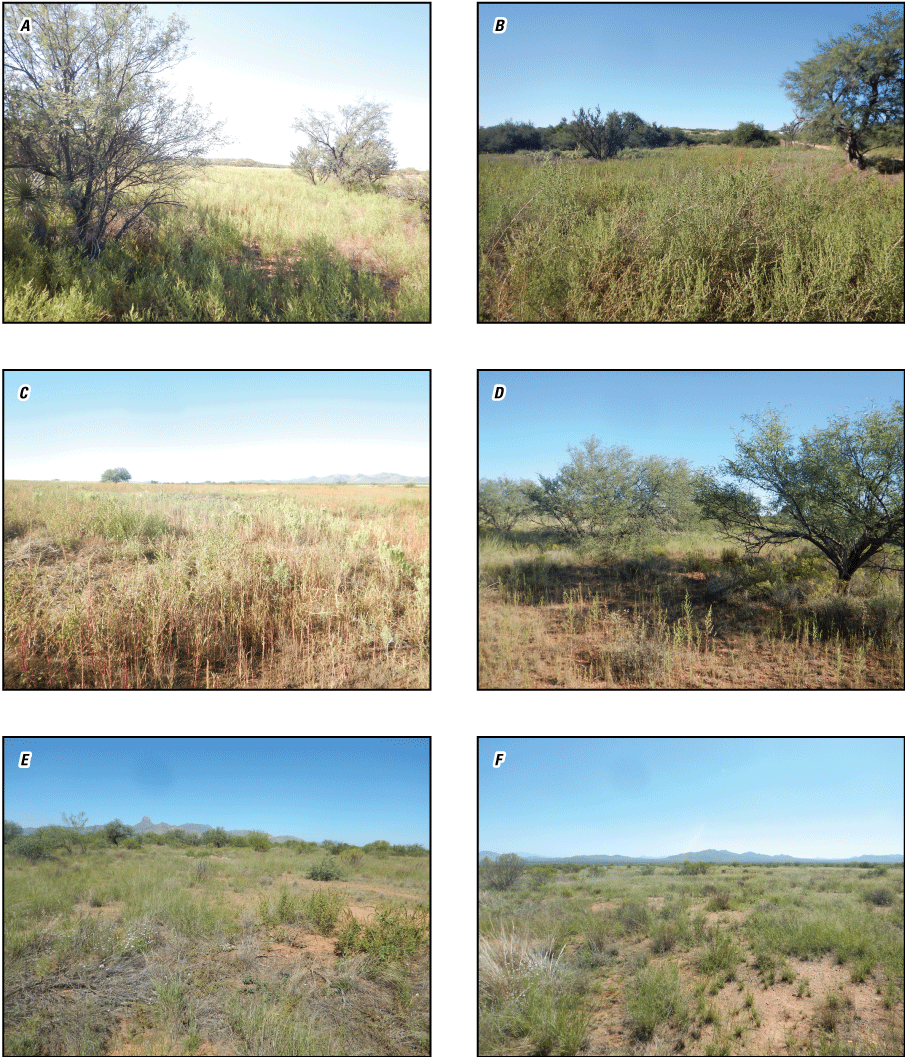
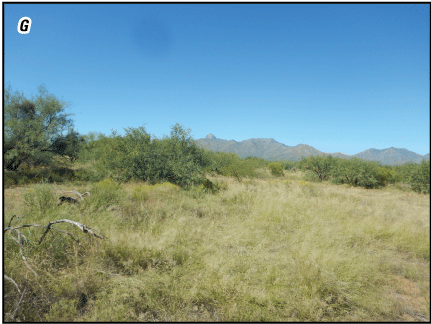
Photographs showing representative vegetation at collection sites: A, Arivaca; B, Garcia; C Pronghorn Loop South; D, Pronghorn Loop North; E, Secundino South; F, Secundino North; and G, Pozo Nuevo. The Cienega site was under cottonwoods and is not shown. Photographs by Atticus Wolf and Kathryn Thomas, U.S. Geological Survey.
Table 1.
Survey site characteristics.[Site elevation, vegetation cover by life form and presence of the invasive annual forb Salsola tragus (prickly Russian thistle, a tumbleweed) are shown. Abundance within 10 meters of the blue-vane trap location was estimated in the field for woody plants (trees and shrubs), grasses, bare ground, and Salsola tragus and is indicated by category: (1) rare or uncommon, (2) moderate abundance, or (3) abundant. Appendix 1 tables include the geographic coordinates and fire history for each site (table 1.1) and a list of plant species observed during the study (table 1.2). m, meter]
Field Sampling
Insects were collected from late May 2019 to early February 2020. Bee bowls and blue-vane traps (fig. 5) were set at each site until mid-August (table 2). After mid-August, we used blue-vane traps only. We defined a collection event as the trapping of bees at one site at one date and with one trap type, except as noted below.
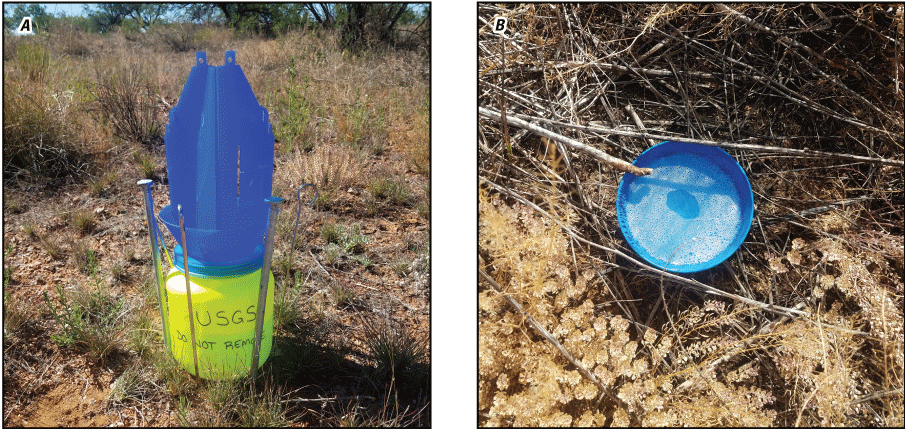
Photographs of A, a blue-vane trap and B, bee bowl deployed at Buenos Aires National Wildlife Refuge. Both trap types use soapy water to catch insects. Unlike the bee bowls, blue-vane traps were secured using aluminum stakes and were always placed in the exact same location for each collection event. Bee bowls were only used during collections from May 30 through July 25th. Photographs by Kathryn Thomas.
Table 2.
Survey collection dates.[Project data are available at Hoover and others (2024). Collection events (“Collection event start date”) were scheduled roughly 2 weeks apart from late May through October 2019 and then once a month from November 2019 through early February 2020. Initially, bee bowls (BB) or blue-vane traps (BVT) (see “Trap type”) were deployed and left in the field for different lengths of times (“Collection days”), but beginning in August, only blue-vane traps were deployed for 2 days (~48 hours) during each collection event. The number of bees sampled for each collection event across all sites is indicated (“Bees sampled”). Dates shown in year.month.day. BB, bee bowls; BVT, blue-vane traps]
Specimen Preparation and Identification
For each collection event, trap contents were strained and washed free of soap and debris, and insects were placed into sealable plastic bags containing 70 percent ethanol with a field label indicating the site, date, and trap type. Insects were then coarsely sorted into three categories for each collection event: (1) small bees, (2) medium to large bees, and (3) all insects other than bees (non-target insects). Bees were stored in a freezer when not being processed, and non-target insects were also freezer stored but were not further processed during this study.
We sampled the small and medium to large bees for each collection event by selecting bee morphotypes (specimens grouped into operational taxonomic units [OTUs], Speight and others, 1999). As many as five specimens were selected for each OTU; however, often less than five specimens for an OTU were available at a single collection event. Selected specimens were placed into a mason jar with a mesh lid and dried using a hairdryer. Once dry, they were fully curated using standard practices; they were either pinned or point mounted, depending on body size, and labeled with the collection event details. Each specimen was assigned a unique identification number formatted as “BANWR-xxxxxx.” These numbers were used to track specimens during the taxonomic identification steps. Each OTU was identified to the genus level using a dissecting microscope and dichotomous keys (Mitchell, 1962; Michener and others, 1994; Michener, 2007; and Ascher and Pickering, 2012). When possible, identifications were narrowed to the species level using the keys.
To obtain additional species-level identifications, some bees were selected for deoxyribonucleic acid (DNA) barcoding. DNA barcoding involves obtaining a 650-base-pair fragment of cytochrome oxidase I (COI), a mitochondrial gene, evolving at a rate like the rate of speciation in many animals. Species-level identifications can be achieved by comparing the unique pattern of nucleotides (adenine, thymine, cytosine, and guanine) within the COI fragment from an unidentified bee with sequences obtained from expertly identified specimens that have been published and curated and that are in the Barcode of Life Data System (BOLD, https://www.boldsystems.org/).
For barcoding, we selected 202 specimens from the five most abundant genera (Melissodes, Diadasia, Lasioglossum, Halictus, and Ceratina). Each specimen was photographed next to its label. Specimen metadata and these photos were submitted to BOLD and the Global Biodiversity Information Facility (GBIF, https://www.gbif.org/). The right middle leg of each specimen was removed with sterilized forceps and transferred to a pre-labeled tube filled with DNA extraction buffer.
Total genomic DNA was extracted from the legs, and the COI gene was polymerase chain reaction (PCR)-amplified. Purified PCR products were quantified, normalized, and sequenced in the forward and reverse directions at the University of Arizona Genetics Core using an Applied Biosystems 3730 DNA Analyzer. The Chromaseq version 1.51 package (Maddison and Maddison, 2019a) in Mesquite version 3.5 (Maddison and Maddison, 2019b) was used along with the programs Phred version 0.020425.c (Green and Ewing, 2002) and Phrap version 0.990319 (Green, 2009) to assemble the chromatograms into contigs and to resolve ambiguous base calls. Raw data files and the edited consensus sequences were uploaded to the BOLD database. Species-level identifications were achieved by comparing the DNA sequences of our bee specimens with DNA sequences obtained from expertly identified specimens previously published and curated in BOLD.
After identification, pinned bees were provided an additional label with the specimens’ taxonomic identity and the identifier’s name. A subset of specimens identified to the genus level were designated as a reference collection to be deposited with the Refuge. DNA barcoding voucher specimens were deposited in the University of Arizona Insect Collection. All other curated specimens, as well as the unprocessed specimens, are stored at the U.S. Geological Survey Southwest Biological Science Center for future identification to species level.
Analysis
Site data and specimen identity data were collated in Microsoft Excel spreadsheets (Microsoft Corporation, 2024) and were checked for logical consistency, completeness, and correspondence to notes taken during specimen processing. To identify any possible transcription errors, the processing notes for all bees were compared to the labels, and where the labels (by site or site-date or trap-type) could not be confirmed with processing notes, these data were not included in any analyses requiring collection event or trap type documentation. Transcription errors were discovered for Arivaca and Cienega site labels on multiple dates, so specimens for those two sites were included only in overall tabulation of families, genera, and species (see table 3). For several analyses of the six core sites, some collection events were excluded because of possible transcription errors. Likewise, analysis using the paired sites at Secundino and Pronghorn Loop used collection events with no transcription errors and for which we used bee bowls and blue-vane traps. For analysis of the south to north gradient, we used only one site from each of the paired sites, so the sites used in this analysis did not include both sites at Secundino and Pronghorn Loop.
While the study ran from late May 2019 through early February 2020 (table 2), the first few collection events (starting May 30 and June 11) were pilot in nature in that we were determining the length of time for trap deployment and which trap types to use. From August 4th through February 2nd, each collection event consisted of 2 trap days using only the blue-vane trap. However, we combined the results for the blue-vane trap (1 day) on June 27 and the bee bowls (1 day) on June 28, to indicate 2 days of trapping. Likewise, we combined the blue-vane and bee bowl results on July 11th and those on July 25th to indicate 2 days of trapping (one each for each trap type) for each date. We used these 13 2-day collections for most analyses, except for the summary of all bee genera sampled over all eight sites and all collection events. Analyses were done using Microsoft Excel (Microsoft Corporation, 2024) and R package vegan (Oksanen and others, 2022).
Results
Our sampling at the Refuge over 9 months yielded an estimated 10,000–15,000 collected bees using bee bowls and blue-vane traps. We subsampled each collection event (by trap type) by morphospecies and curated and identified 3,353 bee specimens; these bees, which we report on in this section, are referred to henceforth as the sampled bees.
General Trends in Composition, Occurrence, and Activity Times
The sampled bees belonged to four families: Apidae (47.9 percent of total), Halictidae (47.5 percent), Megachilidae (4.1 percent), and Andrenidae (0.5 percent); (fig. 6). A listing of the taxonomic assignments of all specimens by site, date, collection duration, and trap type are reported in Hoover and others (2024).
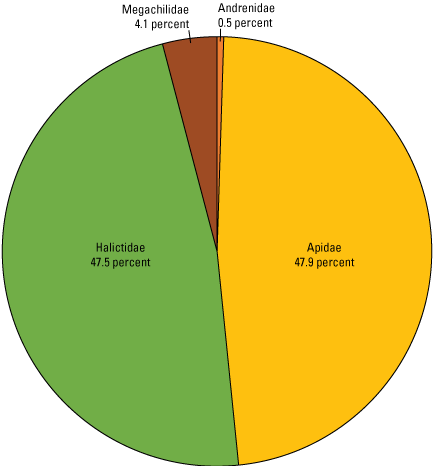
Pie chart showing bee family composition across all eight Refuge collection sites. Of the 3,353 bees sampled, 95.4 percent were in the families Apidae and Halictidae. This figure is based on project data in Hoover and others (2024).
The sampled bees comprised 39 genera among the four taxonomic families (table 3): Andrenidae (4 genera), Apidae (19 genera), Halictidae (9 genera), and Megachilidae (7 genera). The number of specimens identified within each genus varied from 1 to 955. These numbers reflect the relative abundance of species in each genus; the more abundant genera had a proportionately higher number of sampled morphospecies at each collection event. The higher numbers may indicate a genus is either represented by multiple species, that a single species of the genus is very abundant, or both. However, most morphospecies sampled at a collection event had fewer than five representative specimens. For example, after identification, 42 percent of all collection events had only a single specimen for some morphospecies. Identifying the species level for all bees collected was beyond the scope of this project; but stored specimens may be identified to species level in a future project.
Bee Families
Seven bee families occur worldwide, and six of these families are in the United States. At Buenos Aires National Wildlife Refuge, four bee families were identified: Andrenidae, Apidae, Halictidae, and Megachilidae. Bees in the families Colletidae and Melittidae were not documented.
What Do We Know About These Bee Families?
Andrenidae—This is a large bee family worldwide, but at the Refuge, we sampled fewer specimens (18) and fewer genera (4) than for other families. All bees in the Andrenidae create their nests in the earth, and bees in this family are sometimes called mining bees for that trait. This family includes the genus Perdita, one of the smallest bees in the United States.
Apidae—This is also a large bee family worldwide, and at the Refuge, it was represented by the most specimens (1,605), the most genera (19), and the most common genera: Melissodes (624 specimens) and Diadasia (362 specimens). This family includes the well-known Apis mellifera (honeybee) and other large bees such as Bombus spp. (bumble bees) and Xylocopa spp. (carpenter bees).
Halictidae—The Halictids are another family of bees nesting almost entirely underground. At the Refuge, 9 genera were identified, a bit over half of the 16 genera of this family in the United States. At the Refuge, the genus Lasioglossum had the most (953) specimens. Like other genera in the Halictidae, these bees are often called “sweat bees” because they often land on skin to lick sweat off a perspiring human.
Megachilidae—This family was represented by seven genera at the Refuge but had the second lowest number of specimens. Some are colorful, others metallic, and others mostly black and white. These bees carry pollen on their abdomen instead of their legs, as other bees do, and are very diverse in the microhabitats where they nest.
General reference: Wilson and Carril, 2016.
Across all sampling events, 12 genera were rare and had less than 4 total specimens (table 3). Nine genera had fewer than 25 specimens; 11 genera had 26 to 100 specimens; and 7 genera had greater than 100 specimens. The most abundant seven genera were in Apidae (Ceratina, 199 specimens; Diadasia, 362 specimens; Melissodes, 624 specimens; and Svastra, 139 specimens) and Halictidae (Agapostemon, 219 specimens; Halictus, 303 specimens; and Lasioglossum, 953 specimens).
Thirty-six species were identified (table 3) using DNA barcoding for 202 specimens or by using keys for 77 specimens. Not all specimens submitted for barcoding could be adequately sequenced (nine specimens), and four specimens within three genera were not registered in BOLD. These specimens, as well as the specimens assigned “mex 18” and “A3” in the barcoding (table 3), may all be undescribed species.
Table 3.
Bee genera sampled across all sites.[Identification to genus was made using keys or keys/deoxyribonucleic acid (DNA) barcoding for a limited number of specimens to species. The abbreviation for near (nr.) means the identification is near to a particular species. The samples column indicates the number of specimens identified for that family and genus. For species, the number in parenthesis indicates the number of specimens in that species for the genus. The BOLD Bin numbers for each species identified with barcoding are in the accompanying data release (Hoover and others, 2024). Genera with no species identified are indicated with n.d. (no data).]
Diadasia macswaini is not known to entomologists familiar with southern Arizona bee fauna (K. Franklin, Director of Conservation Education and Science, Arizona Sonora Desert Museum, written commun., February 22, 2024). Potentially, the Barcode of Life Data System reference specimen may be misidentified and may be a Diadasia spp., such as D. rinconis, a species more expected in southern Arizona.
Mex18 and A3 are listed in Barcode of Life Data System but are yet to have species description and species epithet identification.
The specimens identified as Ptilothrix sumichrasti in BOLD have been included in the description of P. chiricahua in a recent revision of the genus (Flórez-Gómez and Danforth, 2023; T. Griswold, research entomologist, U.S. Department of Agriculture, Agricultural Research Service, written commun., January 11, 2024).
Generalist or Specialist?
Bees vary in their behavior, especially as to the plants they choose to use for nectar and pollen resources. Generalist bees visit many flower types, whereas specialists gain their nourishment from one flower type.
A well-known example of a generalist bee is the introduced, non-native Apis mellifera (honeybee). Honeybees collect pollen and nectar from a very broad range of plants and have been known to outcompete and have other negative effects on native bees (Iwasaki and Hogendoorn, 2022). Honeybees were collected during the survey yet were not in high numbers.
Specialist bees forage for pollen on select plant families, genera, and sometimes single species and were also part of our sampled specimens. For example, bees of the genus Perdita are nearly all specialists. Another important genus of specialist bees is Diadasia; some species of this genus collect pollen only from cactus and others only from flowers such as mallow, sunflowers, or bindweed. Important for the Refuge is one species, Diadasia rinconis (cactus bee), that is a primary pollinator for the endangered Coryphantha scheeri var. robustipina (Pima pineapple cactus; McDonald and McPherson, 2005). Both Perdita and Diadasia species live on the Refuge, but Diadasia was more abundant (362 species) in our sample.
Bee Activity
From mid-June until late July, at which time the summer monsoon season had started, the number of sampled bee specimens increased, with a maximum of 561 bee specimens sampled across all sites in late July (fig. 7). The number of bee specimens resulting from each collection event declined after late July to a low in January 2020 when two sites resulted in no specimens, but five specimens were obtained among the other sites. February had increased specimens, but our survey ended after that date. Unfortunately, we were not able to continue collections until May, an entire year, because of coronavirus disease (COVID-19) restrictions.
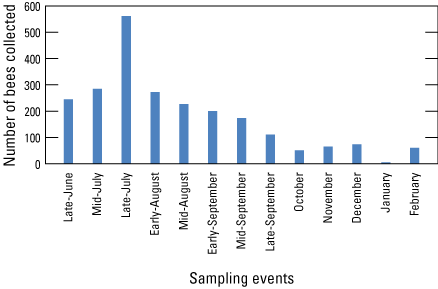
Bar graph showing bee activity at the six core sites (Pozo Nuevo, Secundino North, Secundino South, Pronghorn Loop North, Pronghorn Loop South, and Garcia) as represented by number of specimens sampled for the late June–February collections (total exampled =2,323). Arivaca and Cienega and May 30 and June 11 collection events are not included. We considered bee bowl traps and blue-vane traps to each represent a collection day, when both trap types were used, making collection events with bee bowls and blue-vane traps comparable to 2-day collection events with only blue-vane traps. The monsoon rains began between the mid-July and late-July collection events at the Refuge in 2019. This figure based on project data at Hoover and others (2024).
We examined the number of genera sampled for the six core sites during the late June-February collections using the same dataset as for bee abundance (see fig. 8), but without Pronghorn Loop South and Secundino South for the mid-August collection to eliminate potential label transcription errors (total examined =2,252). The number of genera rose from late June to a maximum in the summer months and varied among the sites: late July for Secundino North, Secundino South, Pronghorn Loop North, and Pronghorn Loop South; early August for Garcia; and mid-August for Pozo Nuevo. For all sites, bee genera decreased to none or one from fall to January at each site, but for all sites, the number of genera sampled rose again in February. The most genera sampled in a single collection event was in early August at Garcia (18 genera); the next highest was at Pronghorn Loop North (16 genera) in late July.
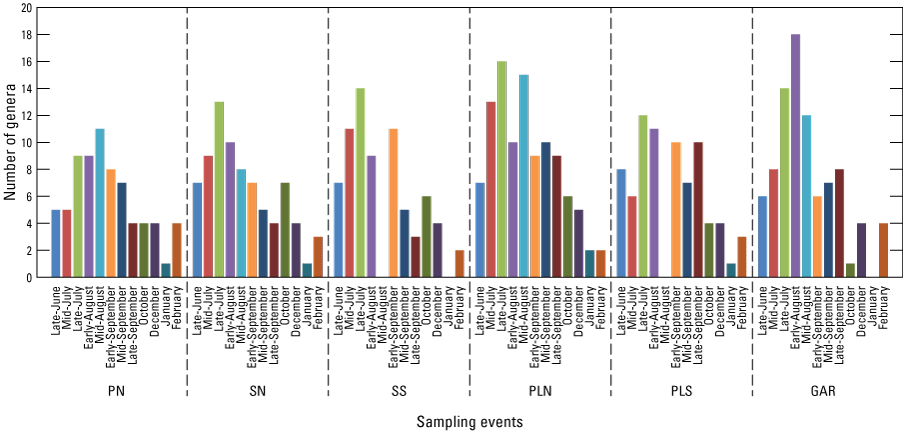
Bar graph showing the number of bee genera sampled at core sites during the late June–February collections (excluding Pronghorn Loop South and Secundino South for mid-August). The latitudinal arrangement also represents the assumed gradient of monsoon precipitation with the driest sites at the left of the graph and the wettest at the right. Sites are arranged by latitude with the furthest north site, Pozo Nuevo, to the left and furthest south, Garcia, to the right. PN, Pozo Nuevo; SN, Secundino North; SS, Secundino South; PLN, Pronghorn Loop North; PLS, Pronghorn Loop South; GAR, Garcia. This figure based on data at Hoover and others (2024).
We also examined the number of specimens, by genera sampled, during the late June–February collections for the seven most common genera at the six core sites (total examined=1,953; fig. 9). Lasioglossum had the most specimens (641), had the highest number of specimens sampled at the late July collection event, and was the only abundant genus with specimens sampled on at least one site for every collection event. Melissodes was next in number of specimens sampled (474), and its peak number of specimens was also in late July (80). Lasioglossum, Melissodes, Diadasia, and Halictus had high counts early in the season, suggesting these genera may also be abundant in the spring, but our collection activities did not encompass early spring dates to verify. Ceratina and Svastra had shorter periods of activity, with the peak specimen count for Ceratina in late July and for Svastra in mid-September.
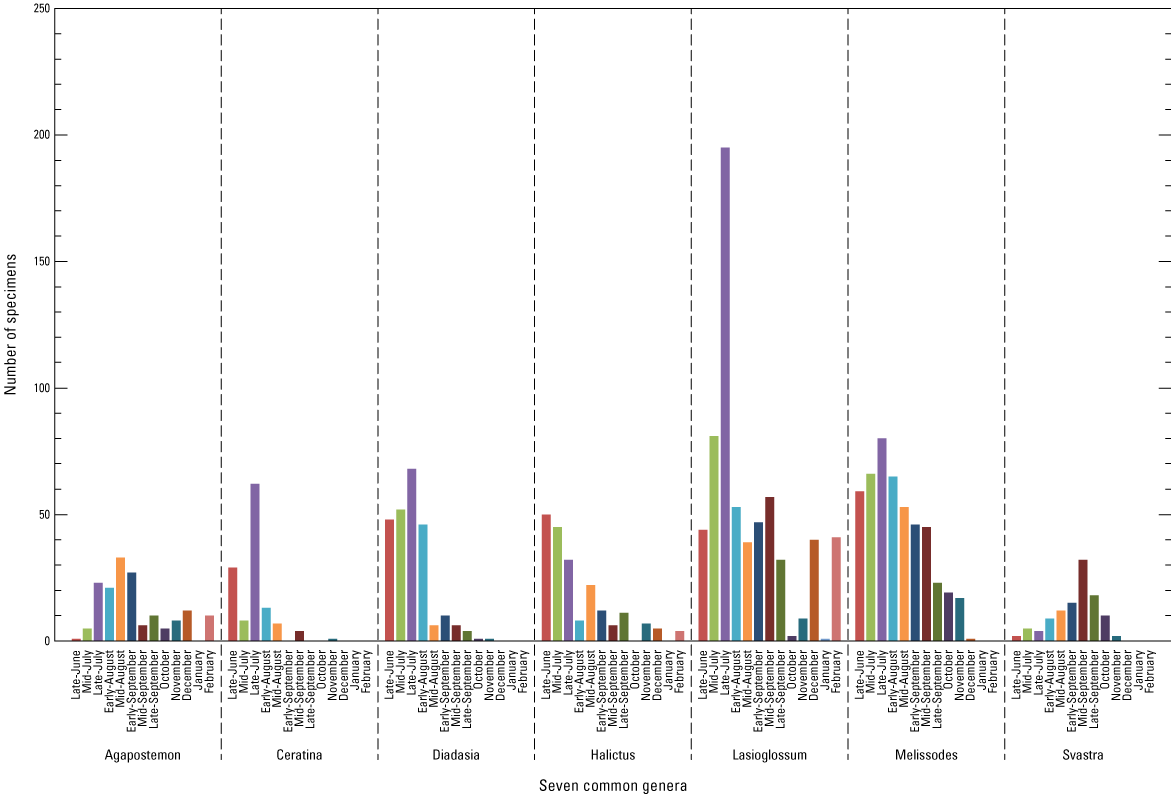
Bar graph showing the number of specimens of the seven most common genera at the six core sites across collection events from late June through early February. This figure based on data at Hoover and others (2024).
Sampling Considerations
Trap type—Comparisons between the genera sampled at different trap types were made for the paired sites, Pronghorn Loop North and South and Secundino North and South, for the collection events June 27/28 and July 11. Regardless of the site and date, more specimens were sampled from the bee bowls (p<.001, one-tailed Student’s t test, fig. 10) and more genera were sampled in the bee bowls than the blue-vane traps (p=0.01, one-tailed Student’s t test, table 4). Each trap type sampled unique genera not in the other type, but at each collection event, the bee bowls had more unique genera than the blue-vane traps. Seven genera were caught only in bee bowls, although in very low numbers: Agapostemon, Apis, Augochlorella, Centris, Hoplitis, Peponapis, and Perdita.
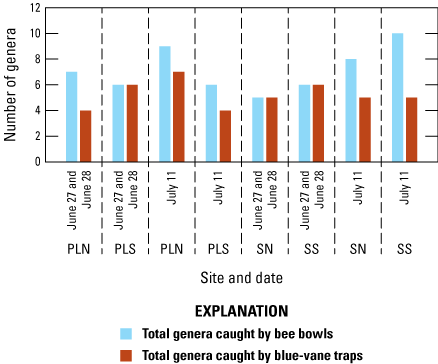
Bar graph showing the number of genera caught by bee bowls versus blue-vane traps at paired sites (Pronghorn Loop North, Pronghorn Loop South, Secundino North, and Secundino South) for June 27/28 (blue-vane traps for 1 day on June 27 and bee bowls for 1 day on June 28) and for July 11th (both trap types were deployed for 1 day). PLN, Pronghorn Loop North; PLS, Pronghorn Loop South; SN, Secundino North; SS, Secundino South; BB, bee bowls; BVT, blue-vane traps. This figure is based on data from Hoover and others (2024).
Table 4.
Comparison in number and uniqueness of genera sampled in bee bowls and blue-vane traps.[Bee genera sampled from the two trap types for the Pronghorn and Secundino paired sites for collection events on July 27/28 (A) and July 11 (B). Blue-vane traps were deployed on June 27 and bee bowls on June 28; both traps were deployed on July 11. Project data are available at Hoover and others (2024).]
We also examined the differences in genera sampled on the same dates for the paired sites at Pronghorn Loop and Secundino. Although there were no statistical differences in the number of genera between north and south, unique genera were in each north and south collection site (table 5), despite the short distances between the paired sites.
Table 5.
Comparison of the number and uniqueness of genera sampled between the north and south paired sites.[Bee genera sampled from two sites (north and south) for the Pronghorn Loop and Secundino paired sites for collection events on July 27/28 (A) and July 11 (B). Blue-vane traps were deployed on June 27 and bee bowls on June 28; both traps were deployed on July 11. Project data are available at Hoover and others (2024).]
Bee Composition and Occurrence Across Four Gradient Sites
At the four gradient sites (Pozo Nuevo, Secundino North, Pronghorn Loop North, and Garcia), 1,454 specimens were sampled during the late June–February collections. Family composition (fig.11) showed the highest percentage of Apidae and lowest number of Halictidae specimens at Garcia, the site furthest south, and the opposite at Pozo Nuevo, the site furthest north.
Among the four gradient sites, 33 genera were documented. The sites varied in the number of specimens sampled and number of genera: Pozo Nuevo had 305 specimens representing 19 genera; Pronghorn Loop North had the most specimens, 444, representing 26 genera; Secundino North had 386 specimens representing 25 genera; and Garcia had 319 specimens representing the most genera, 27. Genera not sampled at the gradient sites were Andrena, Calliopsis, Lithurge (identified at the Arivaca sites), Conanthalictus (sampled at Pronghorn Loop South), and Habropoda (sampled at Secundino South), each represented by only one specimen. Lithurgopsis was not sampled at the gradient sites before late June but was sampled on all gradient sites during the May 30 10-day collection event.
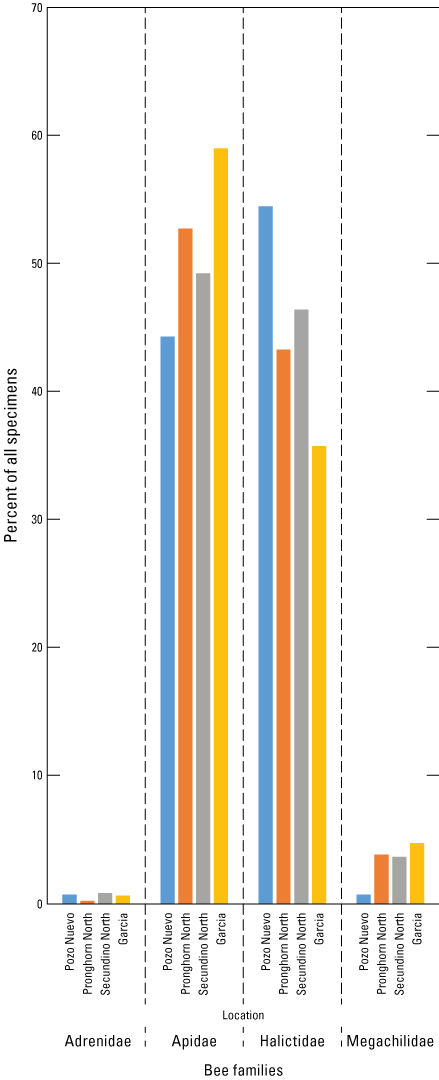
Bar graph showing bee family composition, by percent sampled, within each family at the four gradient sites (Pozo Nuevo, Secundino North, Pronghorn Loop North, and Garcia). This figure is based on data from Hoover and others (2024).
Finally, we examined potential environmental correlates of bee composition and occurrence among the gradient sites using Non-metric Multi-dimensional Scaling (NMDS) to examine the ecological distance between the sites (fig. 12). The first axis (non-metric multi-dimensional scaling axis one) suggests that the south-north gradient, presumed to be precipitation driven, affects bee fauna because the greatest ecological distance is between the Pozo Nuevo and Garcia sites and which also represent the end points of the presumed monsoonal precipitation gradient with the most precipitation in the south (Garcia) and the least in the north (Pozo Nuevo). We suspect these effects are caused by precipitation driven effects on vegetation and the composition of flowering plants. We also suspect the second axis (non-metric multi-dimensional scaling axis two) may also reflect differences in vegetation. However, as our documentation of vegetation was informal, no strong inferences can be made.
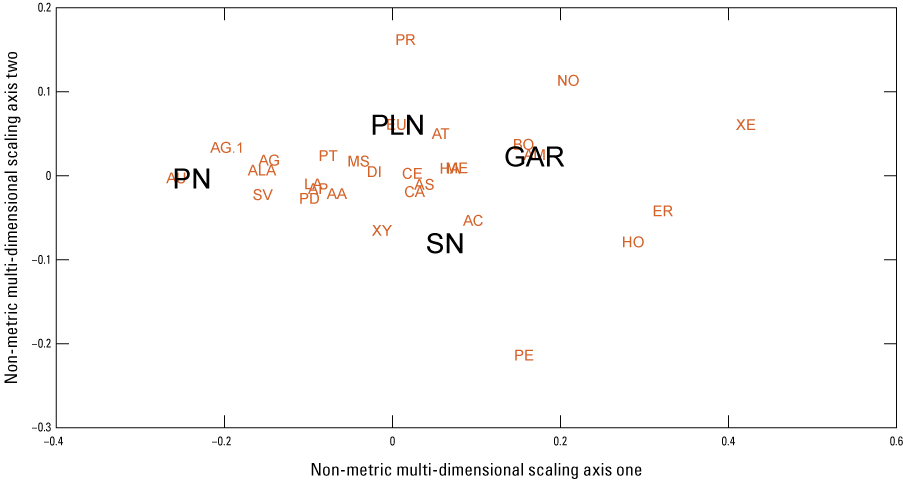
Ordination distances using Non-metric Multi-Dimensional Scaling (NMDS) between sites. The default Bray-Curtis dissimilarity was used as the distance measure (Oksanen and others, 2022). Sites, shown in black, are PN, Pozo Nuevo; PLN, Pronghorn Loop North; SN, Secundino North; and GAR, Garcia. Genera, in red, are AA, Anthophora; AC, Augochloropsis; AG, Augochlorella; AG.1, Agapostemon; ALA, Anthophorula; AM, Anthidium; AP, Apis; AS, Ashmeadiella; AT, Atoposmia; AU, Augochlora; BO, Bombus; CA, Ceratina; CE, Centris; DI, Diadasia; ER, Ericrocis; EU, Eucera; EX, Exomalopsis; HA, Halictus; HO, Hoplitis; LA, Lasioglossum; MA, Macrotera; ME, Megachile; MS, Melissodes; NO, Nomia; PE, Peoponapis; PD, Perdita; PR, Protodufourea; PT, Ptilothrix; SV, Svastra; TR, Triepeolus; XE, Xenoglossa; and XY, Xylocopa. This figure based on data from Hoover and others (2024).
Discussion
Bee Diversity
Of all the bees collected, we sampled and identified 3,353 specimens to genus, and of these, 279 specimens (~8 percent of all sampled) were further identified to represent at least 36 species. Our survey provides an initial view of the Refuge’s contribution to the diversity of bees in the southwestern deserts and lays the groundwork to continue developing our understanding of bee fauna in Sonoran semi-desert grasslands.
We can compare this preliminary survey of the bee fauna of the Refuge to a well-documented Southwest desert survey led by Minckley and Radke (2021) about bee composition and richness within a 16 square kilometer area in the San Bernardino Valley of northeast Chihuahuan Desert, about 145 miles east of the Refuge Headquarters (fig. 1). That study encompassed multiple years and multiple collection methods but also provided results for a 5-month effort in 2001 (mid-April through mid-September) using bee bowl traps. In 2001, the authors documented 54 genera from 21,399 specimens. In comparison, at the Refuge, 39 genera were documented from 3,353 specimens. Thirty-one of the 54 genera documented at the San Bernadino site were also documented at the Refuge. An additional two genera identified at the Refuge were documented in later surveys in the San Bernadino Valley. Two genera documented at the Refuge were not documented in the San Bernadino Valley. Of the 36 species documented at the Refuge, 30 were also documented in the San Bernadino Valley.
This comparison suggests that the Refuge may have similar bee species richness as the San Bernadino Valley. Minckley and Radke (2021) reported 277 species in 2001, and their full study, done over 9 years, documented 473 species and is considered to be one of the greatest species densities reported worldwide. Minckley and Radke (2021) noted four bee surveys in North America with more bee species than their study, yet each of these surveys encompassed greater areas surveyed than in San Bernadino Valley. A full survey of bees at the Refuge would also encompass more area than that surveyed in San Bernadino Valley. Our initial results and comparison with Minckley and Radke (2021) suggest the Refuge is especially rich in native bee species.
Seasonal and Spatial Trends in Bee Distribution
Our various analyses indicate some of the temporal patterns of bee activity apparent in the bee fauna of the Refuge. First, bees were collected in all months that we sampled, even in winter. Although we missed the March to mid-May collection window, the higher number of specimens sampled from our first collection event in May 2019 and the rise in specimens sampled in our last collection event in February 2020 (table 2) suggest that bee activity would have continued to rise in the spring of 2020 to levels comparable to May of 2019. We also found the greatest bee abundance with the onset of the monsoon (fig. 7), but for most sites, the maximum number of genera could be delayed by 2 (Garcia) to 4 weeks (Pozo Nuevo, fig. 9). These two sites were the southern- and northern-most (respectively) sites of the assumed south-north precipitation gradient, supporting the potential importance of precipitation on bee ecology at the Refuge (fig. 11).
Sampling Considerations
The bee bowls resulted in larger samples and more unique genera than co-located blue-vane traps. However, we had logistical problems with the bee bowls that did not make them as attractive for use in the field. Propylene glycol was not used as a trap fluid in the study, but we did have excessive evaporation of the soapy water mix in the bee bowls. Moreover, wind or animals would tip over the bowls, and animals likely drank from the bowls, stepped in the bowls, and possibly ate collected insects in the bowls. The blue-vane traps were more enclosed, which decreased loss of trapping fluids to evaporation and animal encounters. We could leave the blue-vane traps in the field with just soapy water without excessive evaporation. Blue-vane traps were also easier to secure so that they were less susceptible to being tipped by wind or animals. Unfortunately, in the arid environment and particularly during the dry spells, small mammals could detect the water sources in blue-vane traps, which resulted in several drowning deaths of small mammals after their jumping into the trap. Even though the traps were left out for only 2 days, this was sufficient time for the arrival of necrophagous flies and resulted in fly maggots in our field collections. Given that unique genera were in each trap, employing a strategy of mixed trap types may be most effective in collecting all genera and species.
Recent literature has compared trapping methods in different environments. Our methods were passive in contrast to active methods, such as netting. Wilson and others (2008) examined differences in species catch between bee bowls and netting in a Southwest desert context. They found a significant difference in the species composition, with some genera caught only with netting. Other comparison studies have noted differences in the species that are collected using netting versus bee bowls or blue-vane traps (Prendergast and others, 2020) and have recommended a combination of techniques be used for full inventory. At the Refuge, continued inventory could employ bee bowls in an array around a blue-vane trap, perhaps all elevated to minimize disturbance by animals, and with additional targeted netting.
Habitat had a notable effect on the bee fauna sampled. We observed that even paired sites within 50–60 meters of each other harbored different genera. At these sites, even subtle differences in the surrounding environment were important for differences in bee diversity, such as illustrated in differences in cover by lifeform in table 1 and in species composition as shown in table 1.2. Gathmann and Tscharntke (2002) found that foraging distance was correlated with body length for solitary bees, with a maximum foraging distance for the bees they studied of between 150 and 600 meters. In a different study, social bees were shown to have larger foraging ranges than solitary bees (Grüter and Hayes, 2022). As far as is known for our sampled bees, most were solitary, indicating the potential for short foraging ranges for most Refuge bees. Our initial findings suggest habitat patch diversity on a fine scale is important in supporting native bee diversity at the Refuge.
Social or Solitary?
Another key distinction among bees is their type of “living arrangements.” People are often surprised to learn that only about 1 percent of all bee species live socially with a queen and workers, such as the introduced, non-native Apis mellifera (honeybees) and Bombus spp. (bumble bees). Most bees are solitary and nest in the ground or in vegetation. Solitary bees, though, have variations in how they arrange their nests. Some, such as Diadasia spp., nest in groups called aggregations, wherein many solitary nests are built in the same general area. Others may share the same nest entrance but have separate “quarters” in cells below ground, such as seen with the genus Anthophorula, for example. Other solitary bees nest in vegetation. The carpenter bee, genus Xylocopa, a large bee, uses plant material and, on the refuge, uses the dead stalks of Yucca and Agave plants to chew a hole into the plants and nests in “galleries” in the stalk interior.
We also saw differences in the abundance and composition of bee fauna at a landscape scale. We have speculated that this is due to a south to north gradient of monsoonal precipitation and the subsequent seasonal response of floral resources in their blooming and abundance. However, the fire history of the sites differed somewhat in the number of fires since Refuge establishment and the years from last fire (table 1.1). The scope of our study was not sufficient to evaluate vegetation changes over longer periods of time in response to fire history or long-term precipitation trends.
A Bumble Bee of Concern—The Sonoran Bumble Bee
The Refuge has at least one bee of special concern. The Bombus sonorus (Sonoran bumble bee) is being considered for listing as a threatened or endangered species by the U.S. Fish and Wildlife Service under the Endangered Species Act. This bumble bee is considered by some to be the same species as Bombus pensylvanicus (the American bumble bee), as known in Eastern and Midwestern States; by others, it is considered a subspecies and yet by others as its own species. More molecular genetic study will be needed to determine this bee’s taxonomic uniqueness. As a conspecific with B. pensylvanicus, the Sonoran bumble bee was petitioned in 2021 for listing as an endangered species (Center for Biological Diversity and Bombus Pollinators Association of Law Students, 2021), and the Service is now doing a status review to determine if a listing is warranted; a decision is expected in 2026. At the Refuge, 14 putative Sonoran bumble bees were identified to be B. sonorus, although other Bombus spp. specimens were collected but not identified to the species level.
Like other bumble bees, the Sonoran bumble bee is a “buzz” pollinator. Buzz pollination is especially adapted to flowers that have a unique structure to their anthers, the pollen bearing structure of the flower, that essentially encapsulates the pollen. The pollinating bees strongly vibrate the anther allowing the pollen to be released (Buchmann, 1983). The plants with this type of anther require buzz pollination, and not all bees have that capacity, including honeybees.
The nuances of different trapping types, complexity of habitat types, and seasonal responses of floral resources are all considerations in continued survey for the purpose of a comprehensive inventory of bees at the Refuge. To go beyond a listing of species to an understanding of the drivers of their ecology and health may require focused field techniques, such as suggested by Portman and others (2020) and evolving standards (Woodard and others, 2020).
Summary and Conclusion—Continued Survey, Monitoring, and Unraveling Plant-Insect Ecology at the Refuge
This survey is one step in developing an inventory of the bee fauna of the Refuge. The survey itself is only partially complete because of all the specimens collected only the sampled part are identified to genus or species. Full inventories of bee fauna are difficult to obtain. As shown in Minckley and Radke (2021), 9 years of effort led to doubling the number of species documented in 1 year. Our bee survey is the first known systematic survey effort at the Refuge; however, others have collected bees at the Refuge. Researchers with the U.S. Department of Agriculture Agricultural Research Service Pollinating Insects Collection have done occasional collections at multiple sites in the Refuge from 2015 to 2020 in connection with trips to “The Bee Course”: a workshop held yearly at the American Museum of Natural History’s Southwestern Research Station in Portal, Arizona. Bees were collected by netting and pan traps and all sites were georeferenced (T. Griswold, research entomologist, U.S. Department of Agriculture, Agricultural Research Service, written commun., January 11, 2024).
Many factors contribute to the difficulties in obtaining a full inventory aside from time and funding. These difficulties include the necessary taxonomic expertise needed to identify species and the effort needed to detect species that are largely solitary, that may have high fidelity to select microhabitats, and that have short lifespans (Meiners and others, 2019). Bees often emerge as adults for only brief periods during the year, and some are specialists on a limited number of host plants that themselves have spotty distributions. Arid areas, such as the Refuge, are prone to climatic pulse events, sometimes experiencing strong rainfall that supports host plants and then at other times, years of poor rain coupled with high temperature resulting in poor growing conditions for host plants (Harris and others, 2018). Some specialist bees can remain in extended diapause underground, waiting for conditions to improve, and may not emerge as adults each year (Meiners and others, 2019).
With widespread concerns on insect declines and on pollinator health (Dicks and others, 2021; Parreño and others, 2022), there has been increasing attention on characterizing and understanding the ecology of bees in various ecosystems. Efforts are being made in academia and Federal agencies to encourage development of taxonomic expertise sufficient to characterize bee fauna. However, developing such expertise takes concentrated effort, and once acquired, is somewhat of an exclusive skill because of the time it takes and the continued risk of loss of expertise locally to other endeavors and life events. The DNA barcoding, done as a pilot in conjunction with the project, is a tool for species identification that can mitigate the need for exclusive taxonomic expertise. With barcoding, species identification depends on an original correct taxonomic identification within the BOLD database. It is possible that a rare specimen in this molecular database could be initially misidentified, leading to consequent misidentifications in barcode identified species. Also, specimens that have never had vouchers deposited in the BOLD database do not return any species matches after barcoding. Regardless, DNA-based barcoding for bee fauna is an emerging method (Sheffield and others, 2017; Creedy and others 20206) and could provide a forward-looking approach to developing a more complete genetically based library for the species of the Refuge, particularly in respect to the Refuge’s proximity to potential university-based barcoding and taxonomic resources.
Monitoring bee populations is important for developing depth of understanding of the ecology and dynamics of an areas’ bee fauna. Monitoring entails systematic collections at the same locations using standardized methods and consistent collection intervals. Monitoring allows detection of trends in species composition, phenology, and abundance, all of which are tied to bee population health. With the concern for bee populations have come calls for coordinated bee monitoring efforts. We used the national protocol developed by the U.S. Geological Survey and FWS (Droege and others, 2016) as a guide to our initial setup. At the time of this report, an effort is ongoing toward developing a national program for the monitoring of bees (Woodard and others, 2020).
Monitoring, although useful for overall trends, may be best deployed in design with the intent to investigate targeted ecological, management, or natural history questions. There are several apparent questions about plant-pollinator relationships at the Refuge that could be explored to provide valuable input for Refuge management and promote enhanced understanding of bee ecology in the wider semi-desert grasslands of the Sonoran Desert. For example:
-
• Does the exclusion of grazing in a semi-desert grassland affect bee fauna composition and activity? Grazing, except for occasional trespass grazing, has been excluded from the Refuge since its founding in 1985, but surrounding semi-desert grasslands of the Altar Valley are actively grazed.
-
• How do the bees of the Refuge respond to the pulse precipitation and periodic drought of the Southwest? Does bee composition and activity respond to increasing temperatures?
-
• How does bee fauna composition and activity respond to prescribed fire?
-
• What is the relationship of Refuge bee species to the pollination of endangered plants, such as the Pima pineapple cactus, or with the spread of invasive forbs, such as Russian thistle?
As a protected natural area, the Refuge can provide an important contribution toward understanding the drivers and dynamics of native bee pollinator health (Stevenson and others, 2022) in the semi-desert grasslands of the Sonoran Desert and more widely as a representative location where insects are facing a rapidly warming climate. This report offers one step toward filling those gaps in knowledge.
References Cited
Ascher, J.S., and Pickering, J., 2012, Bee genera guide (Hymenoptera: Apoidea: Anthophora): Discover Life web page, accessed August 2020–August 2022 at https://www.discoverlife.org/.
Austin, D.F., 2005, Buenos Aires National Wildlife Refuge: SEINet, Arizona-New Mexico Chapter web page, accessed November 22, 2023, at https://swbiodiversity.org/seinet/checklists/checklist.php?clid=2662&pid=24.
Buckley, S., and Nabhan, G.P., 2016, Food chain restoration for pollinators—Regional habitat recovery strategies involving protected areas of the southwest: Natural Areas Journal, v. 36, no. 4, p. 489–497. [Also available at https://doi.org/10.3375/043.036.0414.]
Center for Biological Diversity and Bombus Pollinators Association of Law Students, 2021, Petition to list the American Bumble bee Bombus pensylvanicus (De Greer, 1773) as an endangered species under the U.S. Endangered Species Act: Center for Biological Diversity and Bombus Pollinators Association of Law Students petition, accessed August 18, 2023, at https://www.biologicaldiversity.org/species/invertebrates/pdfs/Center-et-al-2021-Petition-to-List-the-American-Bumble-bee.pdf.
Creedy, T.J., Norman, H., Tang, C.Q., Chin, K.Q., Andujar, C., Arribas, P., O’Connor, R.S., Carvell, C., Notton, D.G., and Vogler, A.P., 2020, A validated workflow for rapid taxonomic assignment and monitoring of a national fauna of bees (Apiformes) using high throughput DNA barcoding: Molecular ecology resources, v. 20, no. 1, p. 40–53.
Dicks, L.V., Breeze, T.D., Ngo, H.T., Senapathi, D., An, J., Aizen, M.A., Basu, P., Buchori, D., Galetoo, L., Garibaldi, L.A., Gemmill-Herren, B., Howlett, B.G., Imperatriz-Fonseca, V.L., Johnson, S.D., Kovács-Hostyánszki, A., Kwon, Y.J., Lattorff, H.M.G., Lungharwo, T., Seymour, C.L., Vanbergen, A.J., and Potts, S.G., 2021, A global-scale expert assessment of drivers and risks associated with pollinator decline: Nature Ecology & Evolution, v. 5, no. 10, p. 1453–1461. [Also available at https://doi.org/10.1038/s41559-021-01534-9.]
Flórez-Gómez, N., and Danforth, B., 2023, The North American bees of the genus Ptilothrix Cresson, 1878 (Hymenoptera, Apidae, Emphorini), with the description of two new species: Journal of Hymenoptera Research, v. 95, p. 275–293. [Also available at https://doi.org/10.3897/jhr.95.96025.]
Frankie, G.W., Vinson, S.B., Thorp, R.W., Rizzardi, M.A., Tomkins, M., and Newstrom-Lloyd, L.E., 2002, Monitoring—An essential tool in bee ecology and conservation, in Kevan, P.G., Imperatriz-Fonseca, V.L., eds., Pollinating bees—The conservation link between agriculture and nature—Proceedings of the Workshop on the Conservation and Sustainable Use of Pollinators in Agriculture, with Emphasis on Bees, São Paulo, October 1998: Brasília, Brazil, Ministry of Environment, p. 187–198.
Gathmann, A., and Tscharntke, T., 2002, Foraging ranges of solitary bees: Journal of Animal Ecology, v. 71, no. 5, p. 757–764. [Also available at https://doi.org/10.1046/j.1365-2656.2002.00641.x.]
Green, P., 2009, Phrap (ver. 0.990319): Laboratory of Phil Green, Genome Sciences Department, University of Washington web page, accessed October 29, 2020, at http://phrap.org.
Green, P., and Ewing, B., 2002, Phred (ver. 0.020425.c): Laboratory of Phil Green, Genome Sciences Department, University of Washington web page, accessed October 29, 2020, at http://phrap.org.
Grüter, C., and Hayes, L., 2022, Sociality is a key driver of foraging ranges in bees: Current Biology, v. 32, no. 24, p. 5390–5397.E3. [Also available at https://doi.org/10.1016/j.cub.2022.10.064.]
Harris, R.M.B., Beaumont, L.J., Vance, T.R., Tozer, C.R., Remenyi, T.A., Perkins-Kirkpatrick, S.E., Mitchell, P.J., Nicotra, A.B., McGregor, S., Andrew, N.R., Letnic, M., Kearney, M.R., Wernberg, T., Hutley, L.B., Chambers, L.E., Fletcher, M.S., Keatley, M.R., Woodward, C.A., Williamson, G., Duke, N.C., and Bowman, D.M.J.S., 2018, Biological responses to the press and pulse of climate trends and extreme events: Nature Climate Change, v. 8, no. 7, p. 579–587. [Also available at https://doi.org/10.1038/s41558-018-0187-9.]
Hoover, A.M., Busby, M.K., and Thomas, K.A., 2024, Native bees of the Buenos Aires National Wildlife Refuge, Arizona—Taxonomic data and site photos: U.S. Geological Survey data release, https://doi.org/10.5066/P14RBPX6.
Kearns, C.A., Inouye, D.W., and Waser, N.M., 1998, Endangered mutualisms—The conservation of plant-pollinator interactions: Annual Review of Ecology and Systematics, v. 29, no. 1, p. 83–112. [Also available at https://doi.org/10.1146/annurev.ecolsys.29.1.83.]
Maddison, D.R., and Maddison, W.P., 2019a, Chromaseq—A package for processing chromatograms and sequence data in Mesquite (ver. 1.60, April 2023): Chromaseq web page, accessed April 20, 2023, at http://chromaseq.mesquiteproject.org.
Maddison, W.P., and Maddison, D.R., 2019b, Mesquite—A modular system for evolutionary analysis (ver. 3.5): Mesquite software release, accessed April 20, 2023, at http://www.mesquiteproject.org.
McDonald, C.J., and McPherson, G.R., 2005, Pollination of Pima pineapple cactus (Coryphantha scheeri var. robustispina)—Does pollen flow limit abundance of this endangered species?, in Connecting mountain islands and desert seas—Biodiversity and Management of the Madrean Archipelago II—Proceedings of the 5th Conference on Research and Resource Management in the Southwestern Deserts, Tucson, Arizona, May 11–15, 2004: Fort Collins, Colo., U.S. Department of Agriculture, Forest Service, Rocky Mountain Research Station, Proceedings RMRS–P–36, p. 529–532.
Michener, C.D., 2007, The bees of the world (2nd ed.): Baltimore, Md., Johns Hopkins University Press, 953 p. [Also available at https://doi.org/10.56021/9780801885730.]
Minckley, R.L., and Radke, W.R., 2021, Extreme species density of bees (Apiformes, Hymenoptera) in the warm deserts of North America: Journal of Hymenoptera Research, v. 82, p. 317–345. [Also available at https://doi.org/10.3897/jhr.82.60895.]
Ollerton, J., Winfree, R., and Tarrant, S., 2011, How many flowering plants are pollinated by animals?: Oikos, v. 120, no. 3, p. 321–326. [Also available at https://doi.org/10.1111/j.1600-0706.2010.18644.x.]
Oksanen, J., Simpson, G.L., Blanchet, F.G., Kindt, R., Legendre, P., Minchin, P.R., O'Hara, R.B., Solymos, P., Stevens, M.H.H., Szoecs, E., Wagner, H., Barbour, M., Bedward, M., Bolker, B., Borcard, D., Carvalho, G., Chirico, M., De Caceres, M., Durand, S., Evangelista, H.B.A., FitzJohn, R., Friendly, M., Furneaux, B., Hannigan, G., Hill, M.O., Lahti, L., McGlinn, D., Ouellette, M.-H., Cunha, E.R., Smith, T., Stier, A., Ter Braak, C.J.F., and Weedon, J., 2022; vegan—Community ecology package: R package version 2.6-4, accessed at December 21, 2023, at https://cran.r-project.org/web/packages/vegan/index.html.
Orr, M.C., Hughes, A.C., Chesters, D., Pickering, J., Zhu, C.-D., and Ascher, J.S., 2021, Global patterns and drivers of bee distribution: Current Biology, v. 31, no. 3, p. 451–458.E4. [Also available at https://doi.org/10.1016/j.cub.2020.10.053.]
Parreño, M.A., Alaux, C., Brunet, J.L., Buydens, L., Filipiak, M., Henry, M., Keller, A., Klein, A.M., Kuhlmann, M., Leroy, C., Meeus, I., Palmer-Young, E., Piot, N., Requier, F., Ruedenauer, F., Smagghe, G., Stevenson, P.C., and Leonhardt, S.D., 2022, Critical links between biodiversity and health in wild bee conservation: Trends in Ecology & Evolution, v. 37, no. 4, p. 309–321. [Also available at https://doi.org/10.1016/j.tree.2021.11.013.]
Portman, Z.M., Bruninga-Socolar, B., and Cariveau, D.P., 2020, The state of bee monitoring in the United States—A call to refocus away from bowl traps and towards more effective methods: Annals of the Entomological Society of America, v. 113, no. 5, p. 337–342. [Also available at https://doi.org/10.1093/aesa/saaa010.]
Sheffield, C.S., Heron, J., Gibbs, J., Onuferko, T.M., Oram, R., Best, L., deSilva, N., Dumesh, S., Pindar, A., and Rowe, G., 2017, Contribution of DNA barcoding to the study of the bees (Hymenoptera: Apoidea) of Canada—Progress to date: Canadian Entomologist, v. 149, no. 6, p. 736–754. [Also available at https://doi.org/10.4039/tce.2017.49.]
Tronstad, L., Bell, C., and Crawford, M., 2022, Choosing collection methods and sample sizes for monitoring bees: Agricultural and Forest Entomology, v. 24, no. 4, p. 531–539. [Also available at https://doi.org/10.1111/afe.12518.]
Western Regional Climate Center, 2023, Sasabe, Arizona: Western Regional Climate Center website, accessed October 27, 2023, at https://wrcc.dri.edu/cgi-bin/rawMAIN.pl?azASAS.
Wilson, J.S., and Carril, O.M., 2016, The bees in your backyard—A guide to North America’s bees: Princeton, N.J., Princeton University Press, 287 p. [Also available at https://doi.org/10.1515/9781400874156.]
Wilson, J.S., Griswold, T., and Messinger, O.J., 2008, Sampling bee communities (Hymenoptera: Apiformes) in a desert landscape—Are pan traps sufficient?: Journal of the Kansas Entomological Society, v. 81, no. 3, p. 288–300. [Also available at https://doi.org/10.2317/JKES-802.06.1.]
Woodard, S.H., Federman, S., James, R.R., Danforth, B.N., Griswold, T.L., Inouye, D., McFederick, Q.S., Morandin, L., Paul, D.L., Sellers, E., Strange, J.P., Vaughn, M., Williams, N.M., Branstetter, M.G., Burns, C.T., Cane, J., Cariveau, A.B., Cariveau, D.P., Childers, A., Childers, C., Cox-Foster, D.L., Evan, E.C., Graham, K.K., Hackett, K., Huntzinger, K.T., Irwin, R.E., Jha, S., Lawson, S., Liang, C., Lopez-Uribe, M.M., Melathopoulos, A., Moylett, H.M.C., Otto, C.R.V., Ponisio, L.C., Richardson, L.L., Rose, R., Singh, R., and Wehling, W., 2020, Towards a U.S. national program for monitoring native bees: Biological Conservation, v. 252, article 108821, 14 p.
Appendix 1. Supplemental Tables
Table 1.1.
Site geographic coordinates and fire history.[Geographic coordinates use North American Datum of 1983. Fire data was provided to project in the form of multiple geographic information system (GIS) layers by Refuge staff. Fire dates and number of fires up to the study date of 2019 were extracted from the GIS layer. Years from last fire indicates the number of years between the last fire data and the study date of 2019. UTM, Universal Transverse Mercator; n.d. no data]
Table 1.2.
Vegetation observed at each site during study (late May 1999–early February 2020).[Informal notes were made on species observed at each site. Abundance was visually estimated within each site by lifeform—trees, shrubs, grasses, and forbs within 10 meters of the blue-vane trap location are indicated as: “1” rare or uncommon, “2” moderate abundance, or “3” abundant. An “x” indicates the species was present, but notes were not made on its abundance. PN, Pozo Nuevo; SN, Secundino North; SS, Secundino South; PLN, Pronghorn Loop North; PLS, Pronghorn Loop South; GAR, Garcia; CIEN, Cienega; AR, Arivaca]
Conversion Factors
Temperature in degrees Celsius (°C) may be converted to degrees Fahrenheit (°F) as follows:
°F = (1.8 × °C) + 32.
Temperature in degrees Fahrenheit (°F) may be converted to degrees Celsius (°C) as follows:
°C = (°F – 32) / 1.8.
Datums
Vertical coordinate information is referenced to the North American Vertical Datum of 1988 (NAVD88).
Horizontal coordinate information is referenced to the North American Datum of 1983 (NAD 83).
Elevation, as used in this report, refers to distance above the vertical datum.
Abbreviations
AR
Arivaca collection site
BOLD
Barcode of Life Data System
CIEN
Cienega collection site
COI
cytochrome oxidase I
DNA
deoxyribonucleic acid
FWS
U.S. Fish and Wildlife Service
GAR
Garcia collection site
NMDS
Non-metric Multi-dimensional Scaling
Nr.
near, as in identification is near to a particular species
OTU
operational taxonomic unit
PCR
polymerase chain reaction
PLN
Pronghorn Loop North collection site
PLS
Pronghorn Loop South collection site
SN
Secundino North collection site
SS
Secundino South collection site
For more information about this report, contact:
Director, Southwest Biological Science Center
U.S. Geological Survey
2255 N. Gemini Drive
Flagstaff, AZ 86001
https://www.usgs.gov/centers/southwest-biological-science-center
Publishing support provided by the Baltimore Publishing Service Center
Disclaimers
Any use of trade, firm, or product names is for descriptive purposes only and does not imply endorsement by the U.S. Government.
Although this information product, for the most part, is in the public domain, it also may contain copyrighted materials as noted in the text. Permission to reproduce copyrighted items must be secured from the copyright owner.
Suggested Citation
Thomas, K.A., Hoover, A.M., and Busby, M.K., 2024, Bees of the Buenos Aires National Wildlife Refuge—A preliminary report on a bee survey in a vulnerable semi-desert grassland of the Sonoran Desert: U.S. Geological Survey Open-File Report 2024–1032, 21 p., https://doi.org/10.3133/ofr20241032.
ISSN: 2331-1258 (online)
Study Area
| Publication type | Report |
|---|---|
| Publication Subtype | USGS Numbered Series |
| Title | Bees of the Buenos Aires National Wildlife Refuge—A preliminary report on a bee survey in a vulnerable semi-desert grassland of the Sonoran Desert |
| Series title | Open-File Report |
| Series number | 2024-1032 |
| DOI | 10.3133/ofr20241032 |
| Publication Date | June 13, 2024 |
| Year Published | 2024 |
| Language | English |
| Publisher | U.S. Geological Survey |
| Publisher location | Reston, VA |
| Contributing office(s) | Southwest Biological Science Center |
| Description | Report: vii, 21 p.; Data Release |
| Country | United States |
| State | Arizona |
| Online Only (Y/N) | Y |
| Additional Online Files (Y/N) | N |