

Total Phosphorus and Suspended-Sediment Concentrations and Loads from Two Main Tributaries to Upper Klamath Lake, Oregon, 2014–20
Links
- Document: Report (4 MB pdf) , HTML , XML
- NGMDB Index Page: National Geologic Map Database Index Page (html)
- Download citation as: RIS | Dublin Core
Acknowledgments
Funding provided by the Oregon Watershed Enhancement Board, grant number 218-4026-15978, in cooperation with the Klamath Tribes. The success of this project would not have been possible without the efforts of the U.S. Geological Survey Klamath Falls Field Station. Contributing team members included Justin Willhite, Justin VonTungeln, Marcia (Marty) Erickson, Sara Blocker, Kathryn Beauto, and Zach Leininger.
Abstract
Total phosphorus (TP) and suspended-sediment concentrations (SSC) and loads were computed at two U.S. Geological Survey (USGS) streamgages in the upper Klamath River Basin on the Sprague (USGS site ID 11501000) and Williamson (USGS site ID 11502500) Rivers using high temporal resolution turbidity and streamflow data to develop surrogate regression models. Regression models were updated and validated for TP at the Williamson River site, and additional data improved a prior published TP model, increasing the coefficient of determination (R2) from 0.73 to 0.88. A new TP regression model was developed for the Sprague River site using 2 years of data and showed promising results with an R2 of 0.93. Suspended-sediment concentration (SSC) surrogate models were also updated at these sites using a longer period of record than the TP models and improved characterization of sediment transport conditions at these monitoring sites.
Computations of TP loads were compared to the annual loading capacity dictated by the total maximum daily load (TMDL) for Upper Klamath Lake and showed that the combined TP load of the Williamson and Sprague Rivers approaches the annual loading capacity in water years with high annual streamflow. TP loads were also compared to loads computed by the Klamath Tribes using a long-term dataset and a regression and interpolation algorithm (RIA). The comparison showed that the two methods report similar annual loads, with the surrogate regression method generally reporting lower loads than the RIA, and the RIA annual loads falling within the range of uncertainty of the surrogate regression model results. Determining the effect of habitat and stream restoration on basin-scale TP and suspended-sediment loading is challenging using the surrogate regression method at these sites given the short period of record that TP and suspended-sediment load (SSL) data are available. However, long-term analysis by the Klamath Tribes in their larger monitoring network could provide insight into the impact of restoration at smaller spatial scales compared to the basin-wide assessment produced in this study.
Introduction
Water supply in the upper Klamath River Basin is subjected to a growing list of competing demands, affecting the availability of water for aquatic species, agricultural and domestic use, and Clean Water Act (CWA) and Endangered Species Act (ESA) requirements. These competing uses affect water availability within the tributaries to Upper Klamath Lake, the lake itself, and the lower Klamath River. The hypereutrophic Upper Klamath Lake supports large blooms of cyanobacteria from May to October each water year, causing violations of CWA and State of Oregon water-quality standards, in addition to creating conditions that are harmful to two species of suckers listed as endangered under the ESA, the Lost River sucker (Deltistes luxatus) and the shortnose sucker (Chasmistes brevirostris), which are culturally important to the Klamath Tribes.
Phosphorus (P) is a limiting nutrient for the growth of the dominant cyanobacterium in Upper Klamath Lake, Aphanizomenon flos-aquae. A total maximum daily load (TMDL) for Upper Klamath Lake published in 2002 identified a 40 percent reduction in external loads of TP to Upper Klamath Lake to improve water quality conditions in the lake (Oregon Department of Environmental Quality, 2002). Recent studies by the U.S. Geological Survey (USGS) modeled the 40 percent TP reduction in external loads to Upper Klamath Lake and its effect on TP concentrations in Upper Klamath Lake, and found that a 40 percent decrease could result in reduced lake-wide TP concentrations in 10–30 years (Wherry and Wood, 2018). Restoration efforts aimed at reducing TP loads have therefore been ongoing for many years in the upper Klamath River Basin as opportunities arise.
Sediment-bound P, or particulate P, is an important component of the TP loads to Upper Klamath Lake, especially where it results from erosion and land-use modifications (Walker and others, 2015). Phosphate ions are easily adsorbed by sediments, particularly those sediments containing iron and aluminum oxide minerals (Stumm and Morgan, 1981) or are bound in rocks from the region’s volcanic sources of the region. These sediments can then act as a transport mechanism for P in the fluvial environment once the sediments are entrained. Storm events are particularly prone to transporting large quantities of P from irrigated lands in the Klamath River Basin (Ciotti and others, 2010). The sediment-bound P can then become bioavailable in Upper Klamath Lake when phosphate ions are released through various biotic or abiotic mechanisms including elevated pH, reduced conditions, bioturbation, macroinvertebrate excretion, and microbial mineralization (Stumm and Morgan, 1981; Zhou and others, 2005; Wood and others, 2013). Therefore, variations and dynamics in suspended-sediment loads (SSLs), in addition to TP loads, have important implications for resource managers.
The Klamath Tribes Natural Resource Department has managed a long-term water quality monitoring program at multiple locations in upper Klamath River Basin tributaries to Upper Klamath Lake since 1991. Technical reports by the Klamath Tribes have evaluated these long-term datasets and calculated annual TP loads since 1991, in addition to other constituents (Kann and Walker, 1999; Walker and others, 2012, 2015; Kann, 2017a, b; Walker and Kann, 2020, 2022). These efforts utilized a load computation regression/interpolation algorithm (RIA) applied to TP concentrations observed every 2 weeks along with instantaneous streamflow to calculate TP loads on daily, monthly, and annual timesteps. The most recent evaluation of the Klamath Tribes’ long-term datasets generated long-term mean annual TP mass balances from water years (WY) 1992–2018 at several locations in the upper Klamath River Basin (Walker and Kann, 2022). The mass balance results showed that 45 percent of the total external TP load to Upper Klamath Lake comes from the Sprague and Williamson Rivers combined (fig. 1).
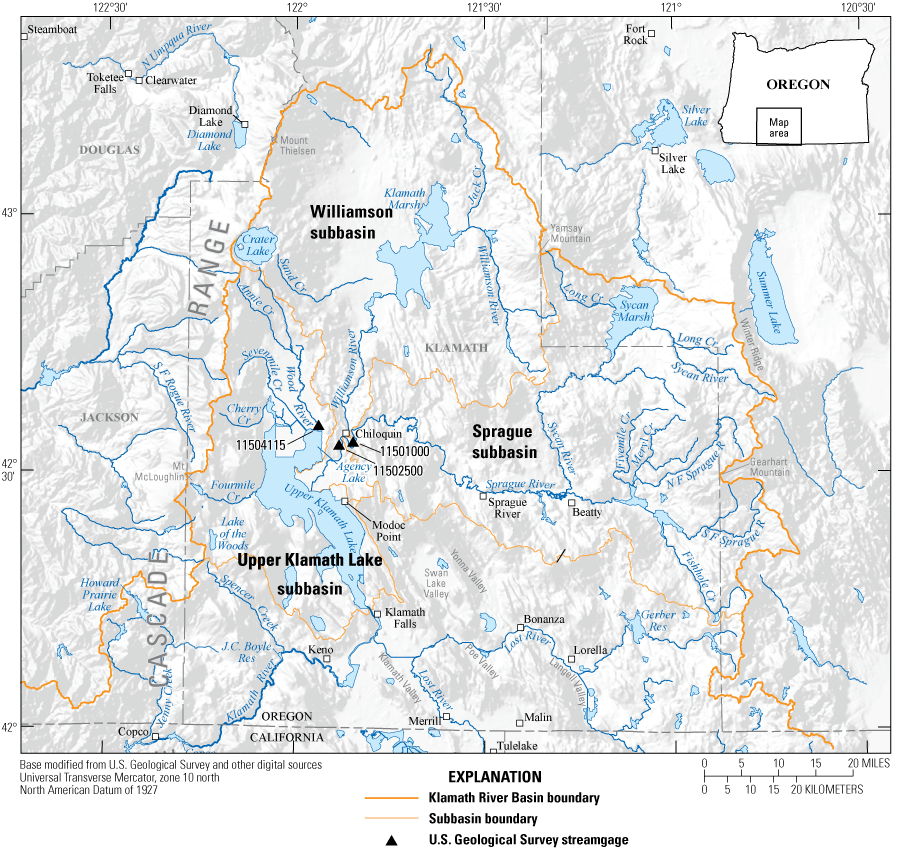
Area map showing upper Klamath River Basin total phosphorus and suspended-sediment monitoring locations.
In 2014, the USGS was funded by the Bureau of Reclamation (Reclamation) to investigate techniques to assess TP and suspended-sediment loading at high temporal resolutions and provide near real-time concentrations and loads of TP and suspended sediment at streamgages located on two tributaries to Upper Klamath Lake, the Wood (USGS site ID 11504115; U.S. Geological Survey, 2023) and Williamson (USGS site ID 11502500; U.S. Geological Survey, 2023) Rivers (Schenk and others, 2016). Turbidity and acoustic backscatter were evaluated with streamflow at these two sites as surrogates for TP and SSC using ordinary least squares (OLS) regression models. Turbidity data had been collected at the Williamson River site since WY 2008 as part of separate agreements with the Klamath Tribes to evaluate turbidity-SSC regressions. The results showed promising initial results for turbidity-TP models at the Williamson River streamgage with a limited number of samples, and for turbidity/backscatter-TP models at the Wood River streamgage. Following the conclusion of that study, USGS funded additional sample collection until 2018, when the Klamath Tribes obtained a monitoring grant from the Oregon Watershed Enhancement Board (OWEB). The Tribes entered into a cooperative agreement with USGS to build on the initial Reclamation-funded efforts by collecting additional TP samples and turbidity data at the Williamson River site to improve model statistics and develop models that could be used to compute TP concentrations and loads in near real time. In addition to continuing data collection efforts on the Williamson River, the new agreement added in TP data collection on the Sprague River upstream from the confluence with the Williamson River. Continued SSC sample collection was also conducted as part of this effort at both sites to validate existing turbidity-SSC models from prior studies (available in Schenk, 2023a, 2023b).
Purpose and Scope
This report summarizes the OLS regression models used to compute continuous 15-minute TP and suspended-sediment concentrations and loads at two USGS streamgages: the Williamson River below Sprague River near Chiloquin (USGS site ID 11502500; U.S. Geological Survey, 2023) and the Sprague River near Chiloquin (USGS site ID 11501000; ; U.S. Geological Survey, 2023; fig. 1). At the Williamson River site, surrogate regression models were updated with additional years of data for a total period of record from WY 2014–20, and a new TP regression model was developed at the Sprague River site for a total period of record from WY 2018–20. The models use turbidity as a surrogate for TP and SSC concentrations, and the streamflow data are used to compute continuous TP and suspended-sediment loads at both locations. Details for SSC regression methods and results are described in the two associated data releases (Schenk, 2023a, b).
Description of Study Area
The upper Klamath River Basin, including the Upper Klamath Lake, Williamson River, and Sprague River subbasins (fig. 1), encompasses about 3,770 square miles. The basin is in south-central Oregon and occupies a broad, faulted, volcanic plateau that spans the boundary between the Cascade Range and the Basin and Range geologic provinces (Gannett and others, 2007). A regional groundwater study by Gannett and others (2007) in the larger upper Klamath River Basin comprising the entire drainage basin upstream from Iron Gate Dam on the Klamath River provides detailed basin setting, regional groundwater movement, historical precipitation patterns, water budgets, and geologic framework of the basin. An additional study in the Sprague River subbasin provides detailed information on geomorphologic conditions and flood-plain and near-channel vegetation (O’Connor and others, 2015).
The Williamson River and Sprague River subbasins combined constitute 79 percent of the total drainage area and about 50 percent of the streamflow to Upper Klamath Lake (Walker and Kann, 2022). Forested land is the predominant land-use type in the Williamson River (80 percent) and Sprague River (68 percent) subbasins. Agriculture in both river subbasins is minimal in terms of overall watershed area, with about 9 and 8 percent of subbasin land use listed as pasture and grass hay for the Williamson River and Sprague River subbasins, respectively, and 2 percent of each of the subbasins listed as irrigated lands. However, agricultural grazing activities that occur near the Sprague and Williamson Rivers and their tributaries reduce riparian vegetation as well as widen and shallow the channel cross sections, which can lead to increased sediment and nutrient inputs to the fluvial systems.
On an annual basis, the Sprague River provides a substantial amount of streamflow to the Williamson River (Hess and Stonewall, 2014). Upstream from the confluence of the Williamson and Sprague Rivers, Spring Creek provides most of the streamflow to the Williamson River at base flow, and the Williamson River between the outlet of the Williamson River canyon and the Sprague River confluence is a system with a large component of groundwater discharge that responds relatively slowly to storm events and snowmelt runoff (Gannett and others, 2007).
Data Collection and Methods
The USGS collected high-frequency (15-minute [min]) turbidity and streamflow data at both study sites as well as discrete TP and SSC samples during storm events and at moderate and base-flow conditions. These data were then used to develop site-specific TP/SSC-turbidity OLS regression models at both sites. The models were then used to compute continuous (15-min) TP and SSC concentrations.
Turbidity
Continuous turbidity data were collected during the study period at both sites, using Forest Technology Systems DTS-12 turbidity sensors deployed in the water column, which reported turbidity in Formazin Nephelometric Units (FNU). The turbidity sensors used near-infrared light sources in the range of 780–900 millimeters (mm) with a single detector at 90 degrees to the light beam. Management of turbidity sensors and processing and approval of data followed USGS protocols in Wagner and others (2006) and Rasmussen and others (2009). Turbidity data were collected every 15 min at both sites and were stored in the USGS National Water Information System using method codes specific to the instrument type (U.S. Geological Survey, 2023). Turbidity sensors were equipped with wipers and were programmed to wipe the sensor face prior to taking a measurement. One limitation of the DTS-12 sensors is that the wiper is not activated at temperatures less than 2 degrees Celsius (°C), a condition that often is encountered during the winter at both sites, although generally during periods when both flow and turbidity are low.
Streamflow Data
Streamflow was measured following USGS guidelines, and streamflow discharge data were computed using USGS guidelines (Turnipseed and Sauer, 2010) and reported in cubic feet per second (ft3/s) every 15-min.
Total Phosphorus and Suspended-Sediment Sample Collection
Sample collection and processing at both sites followed USGS protocols outlined in the National Field Manual (Edwards and Glysson, 1999) or USGS techniques and methods publications on the collection of water-quality data (Wilde and others, 2002; Wilde, 2006). Equal-width increment (EWI) methods were used to collect samples for WY 2008–2018; equal-discharge increment (EDI) methods were used to collect samples for WY 2019–20. These techniques sample at multiple locations along the channel cross section and are representative of the cross-section composite concentrations in the channel. At the Williamson River site, all samples were collected from the cableway, and at the Sprague River site samples were collected from a bridge using a three- or four-wheel crane. Samples were collected using a DH-95 isokinetic sampler suitable for collecting depth-integrated water-quality samples. EWI/EDI samples used a DH-95 isokinetic sampler when stream velocities exceeded 0.46 meters per second (m/s; 1.5 feet per second [ft/s]). When stream velocities were less than 0.46 m/s (1.5 ft/s), either a grab sample was collected from the left bank or a multiple vertical non-isokinetic sample was collected from either the cableway (Williamson River site) or the bridge (Sprague River site) by removing the isokinetic sample nozzle from the sampler and collecting water from 3 to 5 locations in the cross section. Sample water was composited into a 3-liter (L) acid washed plastic bottle and transferred to a churn splitter. Samples intended for TP analysis were transferred from the churn splitter into 125-milliliter (mL) white plastic bottles and preserved with 4.5 normality sulfuric acid. Samples for dissolved phosphorus were also collected from the churn splitter and filtered through a 0.45-micrometer (µm) in-line capsule filter using a peristaltic pump with acid-washed tubing, collected in an amber plastic bottle. All field samples were stored on ice and delivered to the Klamath Tribes Sprague River Water Quality Lab (SRWQL) on the same day the samples were collected.
SSC sample collection methods were similar to TP sample collection using a DH-95 sampler. The main difference in sample collection methods between SSC and TP was that SSC sample water was composited into a 3-L polypropylene bottle, not a churn splitter. The 3-L bottle was then sent to the SRWQL for analysis of sediment concentration in milligrams per liter (mg/L) and percent of sample less than 62.5 microns. Additional details on SSC sample collection methods can be found in two associated data releases and model archives for sediment surrogate regressions at the Sprague and Williamson Rivers (Schenk, 2023b, a).
Discrete Sample Quality Assurance
Quality assurance (QA) samples were collected periodically at both sites as replicate and blank samples. Replicates were collected either as split-replicates or sequential-replicates. Split-replicate samples were collected from the same churn during sample processing, representing a split of one EWI sample, and providing an estimate of variability introduced in the laboratory analysis. Sequential-replicate samples were collected as two separate sample volumes during the EWI samples and processed separately and provide a combined estimate of variability owing to both field and laboratory sources. Sequential replicate samples collected during storm events represented rapidly changing hydrologic conditions and, therefore, were more variable than the split-replicate samples because of the additional time required to collect two sample volumes, during which actual concentrations of constituents in the stream are expected to change. Equipment blank samples were collected at each site to test the cleanliness of sample equipment and for field contamination. Eleven QA samples were collected during WY 2014–20 at the Williamson River site, representing 27 percent of the total number of samples collected, and 7 QA samples were collected during WY 2018–20 at the Sprague River site, representing 28 percent of the total number of samples collected.
All discrete TP samples used in the regression analysis were reviewed using the WQReview package in R (Mills and Penn, 2022). This process involved evaluating replicate sample results and blank sample results to determine if data quality was acceptable for release to the public. Additional information on QA procedures for SSC can be found in the model archive summaries for both sites (Schenk, 2023b, a).
Surrogate Regression Methods
Surrogate regression models for TP were evaluated at both sites. Error statistics were developed for nine models for the Sprague River and seven models for the Williamson River, and a best-fit model was selected to produce time series of TP. Turbidity and streamflow were evaluated as explanatory variables, and TP was evaluated as the dependent variable. Linear, multiple linear, and nonlinear models with various axis transformations were developed and tested. The best model was chosen relying primarily on model standard prediction error (MSPE) to evaluate model differences, but also considered other factors such as root mean square error (RMSE), coefficient of determination (R2), and to limit homoscedastic errors.
Owing to the amount of time required for the collection of an EWI/EDI sample, multiple turbidity and streamflow values were recorded during the period of sample collection. To generate data pairs of potential explanatory variables (turbidity or streamflow) for the TP model calibration dataset, the nearest approved unit values of turbidity and streamflow were paired to the sample time associated with the TP sample within a matching window of plus or minus 15 min.
Total Phosphorus and Suspended-Sediment Load Calculations
Final time series of TP and SSC concentrations calculated from the regression models were used to calculate instantaneous values of TP loads (TPL) and suspended-sediment loads (SSL) in tons per second using equations 1 and 2:
whereTPLi
is instantaneous total phosphorus load, in tons per second;
SSLi
is instantaneous total sediment load, in tons per second;
TPCi
is instantaneous total phosphorus concentration, in milligrams per liter;
SSCi
is instantaneous suspended-sediment concentration, in milligrams per liter;
Qi
is instantaneous streamflow, in cubic feet per second; and
C
is the constant 3.121×10⁻⁸, to convert to tons per second.
Instantaneous TP loads in tons per second were aggregated monthly by summing the daily TP loads for each month of interest, and then were converted to kilograms. At the Williamson River site, 59 days of missing turbidity data occurred between May 3 and June 30, 2015, which did not allow for calculating unit values of TP and SSC using turbidity regression models. To calculate missing days of TP loads, an exponential regression was developed relating daily TP loads in tons to mean daily streamflow as well as for upper- and lower-90 percent prediction intervals (fig. 2). The exponential regressions were then used to compute daily TP loads and daily prediction intervals for the 59 days of missing turbidity data and are considered estimated values.
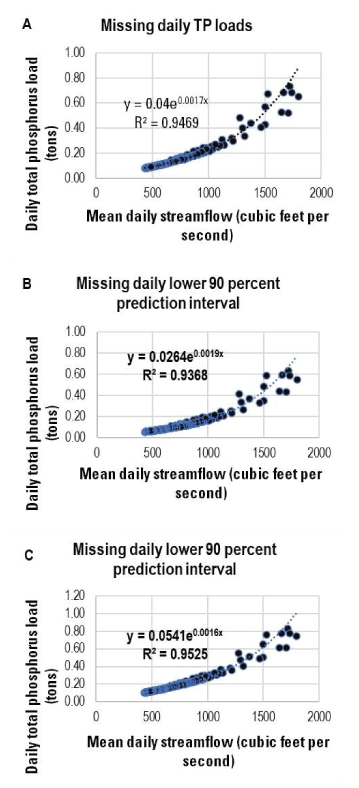
Exponential regressions used to compute (A) missing days of total phosphorus (TP) loads, (B) lower 90 percent prediction interval, and (C) upper 90 percent prediction interval at Williamson River below Sprague River, Oregon, U.S. Geological Survey site ID 11502500 (U.S. Geological Survey, 2023).
Results
Sprague River Near Chiloquin Total Phosphorus Regression Model
A regression with the square root of turbidity as the independent variable was selected as the best-fit regression model to compute TP for the study period (table 1; fig. 3). The calibration dataset used for the model is shown in table 2. The model was applied to the time series of turbidity collected at the Sprague River site to compute time series concentrations of TP for WY 2018–20 during which TP samples were collected. During this period, the maximum recorded turbidity was 94.7 FNU, and the maximum turbidity sampled during sample collection was 76.1 FNU on March 26, 2018. Only 0.14 percent (150-unit values) of the computed TP values were computed with turbidity values that exceeded the limits of the regression (turbidity values greater than 76.1 FNU). Computed time series of TP concentrations and 90 percent prediction intervals are shown in figure 4.
The best-fit SSC surrogate model at the Sprague River site used log-transformed turbidity as the explanatory variable (Schenk, 2023a).
Table 1.
Best fit model results for total phosphorus regression models at Sprague River near Chiloquin and Williamson River below Sprague River near Chiloquin, Oregon (data from U.S. Geological Survey, 2023).[Abbreviations: USGS, U.S. Geological Survey; TP, total phosphorus in micrograms per liter; Turb, turbidity; n, number of observations; R2, coefficient of determination; RMSE, root mean square error; MSPE, model standard percentage error; %, percent]
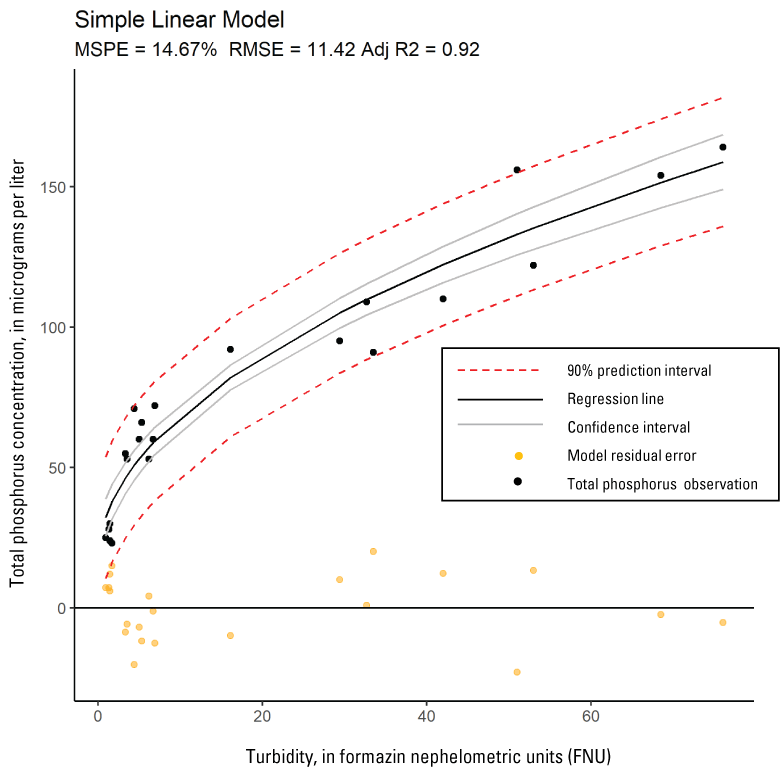
Scatter plot of turbidity and total phosphorus at Sprague River near Chiloquin, Oregon (USGS site ID 11501000; U.S. Geological Survey, 2023), with regression model precisions, confidence intervals, 90 percent prediction intervals, and residual model errors. [USGS, U.S. Geological Survey; ID, identification number; %, percent; MSPE, model standard prediction error; RMSE, root mean square error; Adj R2, adjusted coefficient of determination]
Table 2.
Model calibration dataset for total phosphorus regression models at Sprague River near Chiloquin and Williamson River below Sprague River near Chiloquin, Oregon (U.S. Geological Survey site ID 11501000; U.S. Geological Survey, 2023).[Abbreviations: MM/DD/YYYY, month/day/year; HH:MM, hours:minutes; ft3/s, cubic foot per second; FNU, formazin nephelometric units; ug/L, micrograms per liter]
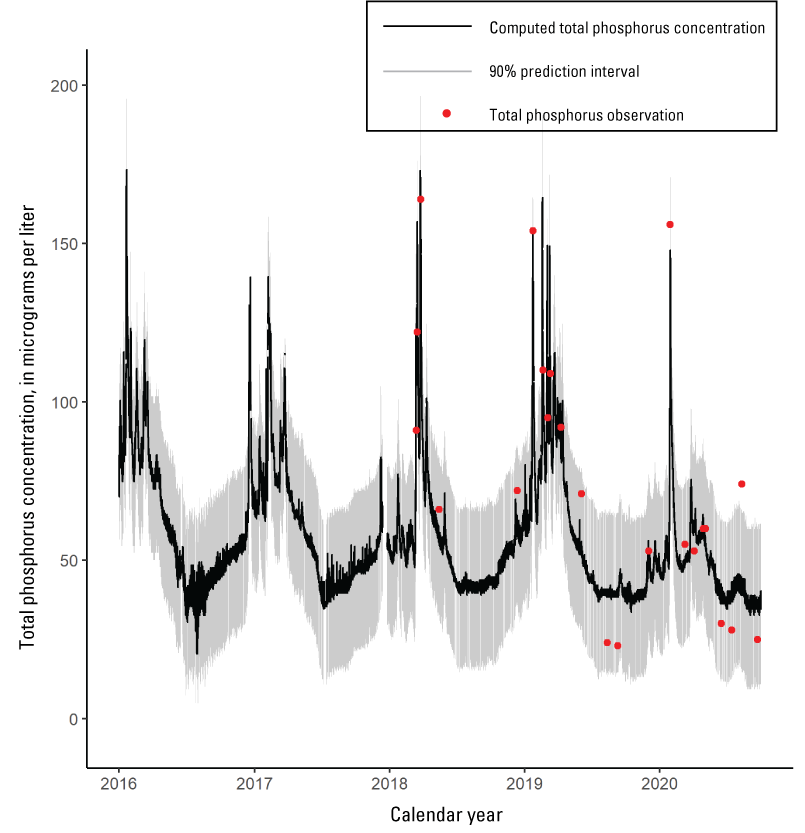
Time series of 15-minute computed total phosphorus concentrations, 90 percent (%) prediction intervals, and observed total phosphorus concentrations at Sprague River near Chiloquin, Oregon, U.S. Geological Survey site ID 11501000 (U.S. Geological Survey, 2023).
Williamson River Below Sprague River Total Phosphorous Regression Model
A linear TP-turbidity model was selected as the best-fit regression model to compute TP for the study period (table 1; fig. 5). The calibration dataset for this model is shown in table 3. The linear model was applied to the time series of turbidity collected at the Williamson River site to compute time series concentrations of TP for WY 2014–20 and supersedes the prior-published model from water year (WY) 2014–15 (table 1). During WY 2014–20, the maximum recorded turbidity was 71.8 FNU, and the maximum turbidity sampled during sample collection was 59.1 FNU on March 26, 2018. Only 0.07 percent (176 unit values) of the computed TP values were computed with turbidity values that exceeded the limits of the regression (turbidity values greater than 59.1 FNU). Computed TP concentrations and 90 percent prediction intervals for the time series are shown in figure 6. The model reported in this report supersedes the model published in Schenk and others (2016). The current model was used to revise previously published data since the initial model was developed with only 10 observations, was applied to a short time period (WY 2014–15; table 1), and was a proof-of-concept effort.
Table 3.
Model calibration dataset for total phosphorus regression models at Williamson River below Sprague River near Chiloquin, Oregon (U.S. Geological Survey site ID 11502500; U.S. Geological Survey, 2023).[Date and time: MM/DD/YYYY, month/day/year; HH:MM, hours:minutes. Abbreviations: ft3/s, cubic foot per second; FNU, formazin nephelometric units; ug/L micrograms per liter]
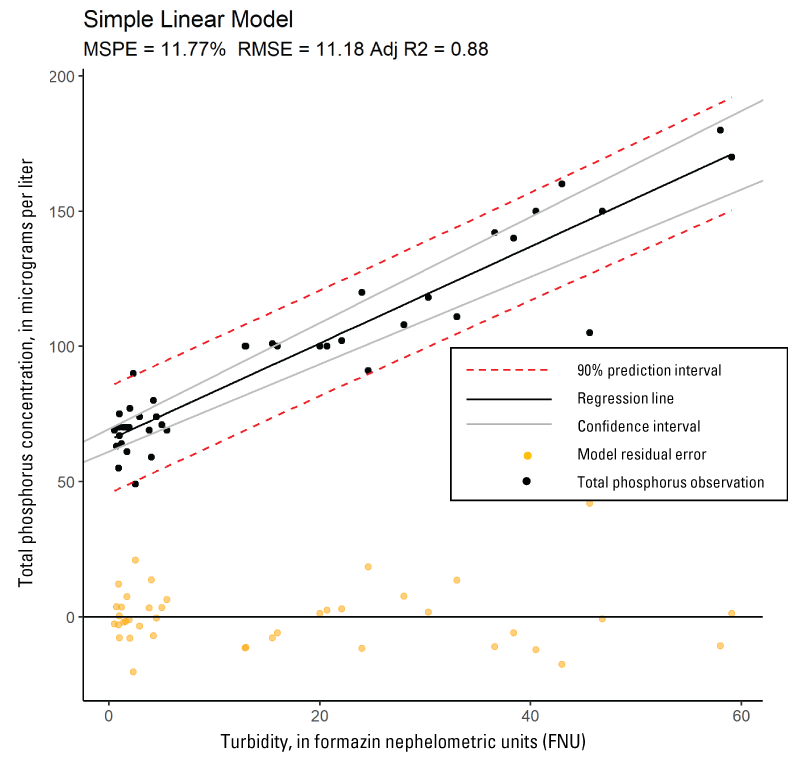
Scatter plot of turbidity and total phosphorous at Williamson River below Sprague River near Chiloquin, Oregon (USGS site ID 11502500; U.S. Geological Survey, 2023), with regression model, confidence intervals, 90 percent prediction intervals, and model residual errors. [USGS, U.S. Geological Survey; ID, identification number; %, percent; MSPE, model standard prediction error; RMSE, root mean square error; Adj R2, adjusted coefficient of determination]
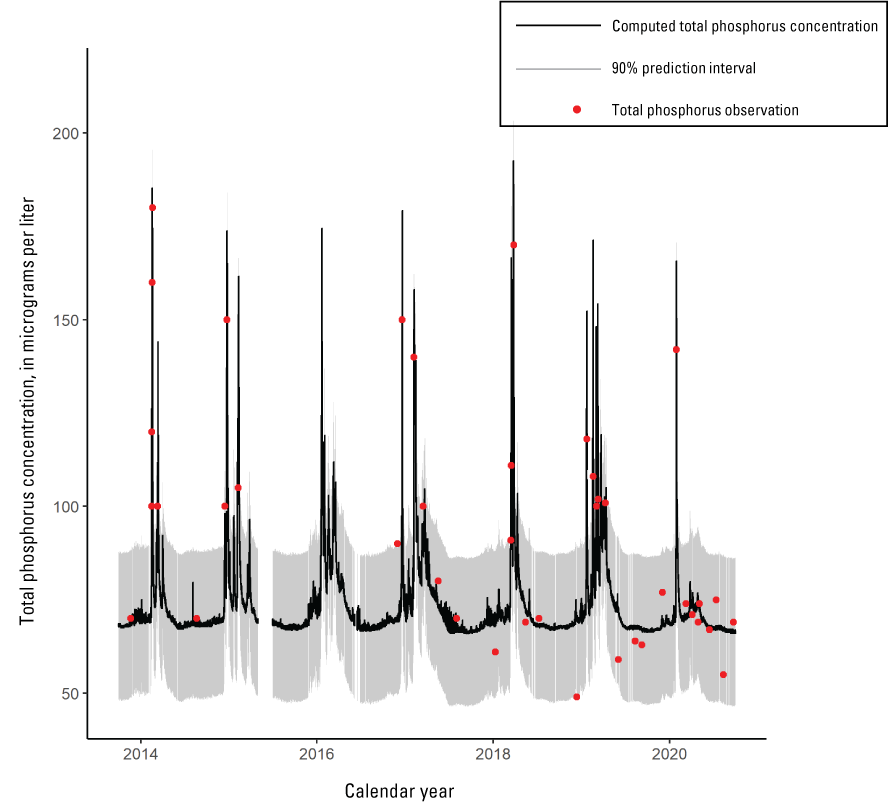
Time series of 15-minute computed total phosphorus concentrations, 90 percent (%) prediction intervals, and observed total phosphorus concentrations at Williamson River below Sprague River near Chiloquin, Oregon (U.S. Geological Survey site ID 11520500; U.S. Geological Survey, 2023).
Total Phosphorus and Suspended-Sediment Loads to Upper Klamath Lake from the Sprague and Williamson Rivers
Annual TPL and SSL at the Williamson and Sprague Rivers using the methods described in this report are shown in tables 4 and 5 and figures 7A, and 8A. Data are reported from WY 2018–20 for the Sprague River TP loads, and WY 2014–20 for the Williamson River TP and suspended-sediment loads at both sites. Mean annual streamflow at the streamgages is also reported in table 4 to examine the load values in a hydrologic context.
Table 4.
Total phosphorus loads at the Sprague and Williamson Rivers, 2014–20.[Abbreviations: ft3/s, cubic foot per second; kg, kilograms; ND, no data; TPL, total phosphorous load; +, plus; %, percent; −, minus]
Table 5.
Total suspended-sediment loads at the Sprague and Williamson Rivers, 2014–20.[Abbreviations: ft3/s, cubic foot per second; SSL, suspended-sediment load; kg, kilograms; TPL, total phosphorus load; −, minus; %, percent; +, plus; ND, no data]
![A, Annual suspended-sediment loads at Sprague River near Chiloquin (U.S. Geological
Survey [USGS] site ID 11501000) and Williamson River below Sprague River, Oregon (USGS
site ID 11502500), water year [WY] 2014–20, and B, relative contributions of annual
suspended-sediment loads measured at Williamson River below Sprague River from WY
2014–20, using loads calculated with turbidity surrogate models.](https://pubs.usgs.gov/of/2024/1034/images/ofr20241034_fig07.png)
A, Annual suspended-sediment loads at Sprague River near Chiloquin (U.S. Geological Survey [USGS] site ID 11501000; U.S. Geological Survey, 2023) and Williamson River below Sprague River, Oregon (USGS site ID 11502500), water year [WY] 2014–20, and B, relative contributions of annual suspended-sediment loads measured at Williamson River below Sprague River from WY 2014–20, using loads calculated with turbidity surrogate models.
![A, Annual total phosphorus loads calculated at the Williamson River below Sprague
River, near Chiloquin, Oregon (USGS site ID 11502500), using turbidity surrogate methods
compared to total annual phosphorus loads reported by the Klamath Tribes, and B, relative
contributions of total phosphorus loads measured at Williamson River below Sprague
River from 2018 to 2022 using loads calculated with turbidity surrogate models. [TMDL,
total maximum daily load, TP, total phosphorus, kg, kilograms, Error bars represent
90 percent prediction intervals of the turbidity surrogate model]](https://pubs.usgs.gov/of/2024/1034/images/ofr20241034_fig08.png)
A, Annual total phosphorus loads calculated at the Williamson River below Sprague River, near Chiloquin, Oregon (USGS site ID 11502500; U.S. Geological Survey, 2023), using turbidity surrogate methods compared to total annual phosphorus loads reported by the Klamath Tribes, and B, relative contributions of total phosphorus loads measured at Williamson River below Sprague River from 2018 to 2022 using loads calculated with turbidity surrogate models. [USGS, U.S. Geological Survey; ID, identification number; UKL, Upper Klamath Lake; TMDL, total maximum daily load; TP, total phosphorus; kg, kilograms; error bars represent 90 percent prediction intervals of the turbidity surrogate model]
Discussion
The use of surrogate models at the study sites has been successful in computing near real-time concentrations of TP and SSC, both from prior efforts (Schenk and others, 2016) and with the ongoing validation of the regression models in this report and prior model archives (Schenk, 2023a, b). The TP-turbidity surrogate model at the Williamson River site was greatly improved with the additional samples since the initial attempt at using turbidity as a surrogate in WY 2014 (table 1). Additional SSC sampling has also improved the SSC-turbidity surrogate models at both sites (Schenk, 2023a, b).
The Williamson River represents the combined sediment and nutrient loads from the Sprague River and the Williamson River subbasins. To evaluate the relative contributions of SSL and TPL from the subbasins, the annual loads at the Sprague River site were subtracted from the annual loads at the Williamson River site. Comparing annual SSL at both sites show more sediment transport to Upper Klamath Lake sourced from the Sprague River Basin compared to the Williamson River Basin (fig. 7B). This is consistent with observations in prior studies (Schenk and others, 2016) and shows the importance of the Sprague River as a sediment source to Upper Klamath Lake.
The Klamath Tribes have analyzed their long-term monitoring datasets in the upper Klamath River Basin since 1999 through several technical reports (see “Background” section). Those reports describe methods by which the authors compute nutrient loads at several sites in the upper Klamath River Basin utilizing a regression and interpretation algorithm (RIA) to compute daily loads using samples collected every 2 weeks over a long period of record (see appendix B, table B1 in Walker and others [2012]). The use of surrogate regressions to compute TP loads as described in this report allows for a comparison of the results of the two methods at the Williamson River site for WY 2014–18. The TP load values reported in the most recent Klamath Tribes technical report (Walker and Kann, 2022) includes TP loads at the Williamson River site from 1991 to 2018. Comparing the loads for WY 2014–18, show that the loads reported in Walker and Kann (2022) are typically higher than the loads computed using the USGS turbidity surrogate model with the exception of WY 2015, but are within the range of uncertainty in the regression model annual load results (fig. 8A). The differences between the two reported load values are likely due to differences in the modeling approaches and model structures, and temporal resolution of datasets. The Klamath Tribes’ long-term monitoring dataset covers decades (1991–2018), whereas the USGS TP datasets began in WY 2014 at the Williamson River site. Both modeling approaches have their merits and complement each other, with the Klamath Tribes’ datasets more accurately characterizing long-term trends, and the turbidity surrogate approach more accurately characterizing short-term loading dynamics with high resolution data.
One of the key questions this study intended to inform was whether TP loads are decreasing in the upper Klamath River Basin as a cumulative result of restoration efforts in the basin. Because the surrogate regression approach has only been used in recent years, more data would be needed to evaluate long-term trends in TP loading using these methods. Additionally, evaluating TP loads at the terminus of these large basins makes difficult the ability to discern what may be contributing to loading dynamics at smaller spatial scales. The Walker and Kann (2022) report evaluated trends in TP loads from WY 1992–2018 at several locations throughout the basin, including the Williamson River below Sprague River. The report showed no significant trend in annual TP loads at their monitoring site on the Williamson River (see appendix G, figure G2 in Walker and Kann [2022]), suggesting that the large reductions in TP loads needed to comply with the TMDL have not been met to-date. The authors did report variable loading dynamics (both increasing and decreasing P loads) at some locations within the large monitoring network throughout the upper Klamath River Basin and during different analysis time periods. Therefore, determining the overall effect of restoration on P loads at the basin-scale is difficult, but more insight could be achieved by evaluating results at smaller spatial scales within the Tribes’ monitoring network.
The 2002 TMDL for Upper Klamath Lake set an annual loading capacity for TP, which applies to all external sources of phosphorus to Upper Klamath Lake, including major and minor tributaries, springs, and water pumped into Upper Klamath Lake from agricultural lands. The total annual loading capacity was set at 109,130 kilograms (kg) of TP. The Williamson River, which represents TP loads from the Williamson River and Sprague River subbasins combined, has been shown to generate annual TP loads approaching the total loading capacity in water years with high streamflow (fig. 8A). The Williamson River and Sprague River subbasins combined have been shown to contribute 45 percent of the TP loads to Upper Klamath Lake, so the annual loading capacity including all sources to Upper Klamath Lake is likely frequently exceeded in water years with near- or above-average streamflow, such as WY 2017 and 2019.
Additional evaluation of the TP loads calculated with regression models for WY 2018–20 shows that the Williamson River Basin contributed a larger fraction of the TP load to Upper Klamath Lake in the low water years of 2018 (69 percent of the 106-year mean annual streamflow of 999 ft3/s) and 2020 (60 percent of the 106-year mean) than the near-average water year of 2019 (93 percent of 106-year mean) from the Sprague River Basin (fig. 8B). Prior studies on the Williamson River have shown that dissolved phosphorus comprises an average of 82 percent of TP during base-flow conditions (Schenk and others, 2016). Although the Sprague River contributes more suspended-sediment and near-identical TP loads during average and high-water years compared to the Williamson River, in low water years most of the TP load from these two subbasins combined will likely be sourced from the Williamson River Basin and will be mainly in dissolved form.
This study has shown the utility of surrogate regression models in computing near real-time concentrations and loads of TP and SSC. Continued monitoring and modeling of TP and sediment loading dynamics in the upper Klamath River Basin will allow better understanding of the effect of large watershed disturbances on TP and suspended-sediment concentrations and loads such as the 2021 Bootleg Fire in the Sprague River and Williamson River subbasins. Continued monitoring will also help resource managers and restoration practitioners understand the basin-scale effect of restoration efforts on TP and suspended-sediment concentrations and loads.
References Cited
Ciotti, D., Griffith, S.M., Kann, J., and Baham, J., 2010, Nutrient and sediment transport on flood-irrigated pasture in the Klamath Basin, Oregon: Rangeland Ecology and Management, v. 63, no. 3, p. 308–316, accessed March 22, 2023, at https://doi.org/10.2111/08-127.1.
Edwards, T.K., and Glysson, G.D., 1999, Field methods for measurement of fluvial sediment, 89 p., accessed March 22, 2023, at https://doi.org/10.3133/twri03C2.
Gannett, M.W., Lite, K.E., Jr., La Marche, J.L., Fisher, B.J., and Polette, D.J., 2007, Ground-water hydrology of the Upper Klamath Basin, Oregon and California: U.S. Geological Survey Scientific Investigations Report 2007–5050, accessed March 22, 2023, at https://doi.org/10.3133/sir20075050.
Hess, G.W., and Stonewall, A.J., 2014, Comparison of historical streamflows to 2013 streamflows in the Williamson, Sprague, and Wood Rivers, Upper Klamath Lake Basin, Oregon: U.S. Geological Survey Open-File Report 2014–1128, 30 p., accessed March 22, 2023, at https://doi.org/10.3133/ofr20141128.
Mills, T.J., and Penn, C.A., 2022, WQReview—Discrete water-quality data review and exploration toolbox: R package version 2.3, accessed January 7, 2023, at https://code.usgs.gov/cpenn/WQ-Review.
O’Connor, J.E., McDowell, P.F., Lind, P., Rasmussen, C.G., and Keith, M.K., 2015, Geomorphology and flood-plain vegetation of the Sprague and lower Sycan Rivers, Klamath Basin, Oregon: U.S. Geological Survey Scientific Investigations Report 2014–5223, 138 p., accessed March 22, 2023, at https://doi.org/10.3133/sir20145223.
Oregon Department of Environmental Quality, 2002, Upper Klamath Lake drainage total maximum daily load (TMDL) and water quality management plan (WQMP): State of Oregon Department of Environmental Quality, 188 p., accessed Jan 14, 2023, at https://www.oregon.gov/deq/FilterDocs/UKtmdlwqmp.pdf.
Rasmussen, P.P., Gray, J.R., Glysson, G.D., and Ziegler, A.C., 2009, Guidelines and procedures for computing timeseries suspended-sediment concentrations and loads from in-stream turbidity-sensor and streamflow data: U.S. Geological Survey Techniques and Methods book 3, chap. C4, 53 p., accessed March 24, 2023, at https://doi.org/10.3133/tm3C4.
Schenk, L.N., 2023a, Model archive summary for suspended-sediment concentration at station 11501000, Sprague River near Chiloquin, OR WY 2008–2017 revision and computation for WY 2008–2020: U.S. Geological Survey data release, accessed June 13, 2023, at https://doi.org/10.5066/P9QGFMFY.
Schenk, L.N., 2023b, Model archive summary for suspended-sediment concentration at USGS site 11502500, Williamson River below Sprague River near Chiloquin, OR: U.S. Geological Survey data release, accessed June 13, 2023, at https://doi.org/10.5066/P9OYBSLE.
Schenk, L.N., Anderson, C.W., Diaz, P., and Stewart, M.A., 2016, Evaluating external nutrient and suspended-sediment loads to Upper Klamath Lake, Oregon, using surrogate regressions with real-time turbidity and acoustic backscatter data: U.S. Geological Survey Scientific Investigations Report 2016–5167, 46 p., accessed March 22, 2023, at https://doi.org/10.3133/sir20165167.
Turnipseed, D.P., and Sauer, V.B., 2010, Discharge measurements at gaging stations—U.S. Geological Survey Techniques and Methods book 3, chap. A8, 87 p., accessed March 22, 2023, at https://doi.org/10.3133/tm3A8.
U.S. Geological Survey, 2023, National Water Information System: U.S. Geological Survey web interface, https://doi.org/10.5066/F7P55KJN.
Wagner, R.J., Boulger, R.W., Jr., Oblinger, C.J., and Smith, B.A., 2006, Guidelines and standard procedures for continuous water-quality monitors: Station operation, record computation, and data reporting: U.S. Geological Survey Techniques and Methods 1–D3, 51 p., accessed March 22, 2023, at https://doi.org/10.3133/tm1D3.
Walker, J., and Kann, J., 2020, Inflow/outflow phosphorus loading dynamics in Upper Klamath Lake, OR: Walker Environmental Research, prepared for U.S. Fish and Wildlife Service, 46 p., accessed March 22, 2023, at https://walkerenvres.com/projects/klamath-inflow-outflow/.
Walker, J.D., and Kann, J., 2022, Water and nutrient balances of Upper Klamath Lake, water years 1992–2018: Zenodo, data set, 80 p., accessed March 22, 2023, at https://doi.org/10.5281/zenodo.6476840.
Walker, J.D., Kann, J., and Walker, W.W., 2015, Spatial and temporal nutrient loading dynamics in the Sprague River Basin, Oregon: Zenodo, 91 p., accessed March 22, 2023, at https://doi.org/10.5281/zenodo.7377354.
Wherry, S.A., and Wood, T.M., 2018, A metabolism-based whole lake eutrophication model to estimate the magnitude and time scales of the effects of restoration in Upper Klamath Lake, south-central Oregon: U.S. Geological Survey Scientific Investigations Report 2018–5042, 43 p., accessed March 22, 2023, at https://doi.org/10.3133/sir20185042.
Wilde, F.D., 2006, Chapter A4—Collection of water samples: U.S. Geological Survey Techniques of Water-Resources Investigations 09-A4, 231 p., accessed March 22, 2023, at https://doi.org/10.3133/twri09A4.
Wilde, F.D., Radke, D.B., Gibs, J., and Iwatsubo, R.T., 2002, Chapter A5—Processing of water samples: U.S. Geological Survey Techniques of Water-Resources Investigations, book 9, chap. A5, accessed March 22, 2023, at https://doi.org/10.3133/twri09A5.
Wood, T.M., Wherry, S.A., Carter, J.L., Kuwabara, J.S., Simon, N.S., and Rounds, S.A., 2013, Technical evaluation of a total maximum daily load model for Upper Klamath and Agency Lakes, Oregon: U.S. Geological Survey Open-File Report 2013–1262, 75 p., accessed March 22, 2023, at https://doi.org/10.3133/ofr20131262.
Zhou, A., Tang, H., and Wang, D., 2005, Phosphorus adsorption on natural sediments—Modeling and effects of pH and sediment composition: Water Research, v. 39, no. 7, p. 1245–1254, accessed March 22, 2023, at https://doi.org/10.1016/j.watres.2005.01.026.
Conversion Factors
International System of Units to U.S. customary units
Temperature in degrees Celsius (°C) may be converted to degrees Fahrenheit (°F) as follows:
°F = (1.8 × °C) + 32.
Concentrations of chemical constituents in water are given in micrograms per liter (µg/L), which is approximately equivalent to parts per billion (ppb) or milligrams per liter (mg/L).
Datums
Vertical coordinate information is referenced to the North American Vertical Datum of 1988 (NAVD 88) unless otherwise noted.
Horizontal coordinate information is referenced to the North American Datum of 1983 (NAD 83).
Elevation, as used in this report, refers to distance above the vertical datum.
Abbreviations
Adj R2
adjusted coefficient of determination
EWI
equal-width-increment
EDI
equal-discharge-increment
FNU
Formazin Nephelometric Unit
MSPE
model standard prediction error
P
phosphorus
Q
streamflow
QA
quality-assurance
R2
coefficient of determination
RIA
regression and interpolation algorithm
SSC
suspended-sediment concentration
SSL
suspended-sediment load
TMDL
total maximum daily load
TP
total phosphorus (the combination of dissolved and particulate phosphorus)
USGS
U.S. Geological Survey
WY
water year
For information about the research in this report, contact
Director, Oregon Water Science Center
U.S. Geological Survey
601 SW Second Avenue, Suite 1950
Portland, Oregon 97204
https://www.usgs.gov/centers/oregon-water-science-center
Manuscript approved on May 20, 2024
Publishing support provided by the U.S. Geological Survey
Science Publishing Network, Tacoma Publishing Service Center
Disclaimers
Any use of trade, firm, or product names is for descriptive purposes only and does not imply endorsement by the U.S. Government.
Although this information product, for the most part, is in the public domain, it also may contain copyrighted materials as noted in the text. Permission to reproduce copyrighted items must be secured from the copyright owner.
Suggested Citation
Schenk, L.N., and Simeone, C., 2024, Total phosphorus and suspended-sediment concentrations and loads from two main tributaries to Upper Klamath Lake, Oregon, 2014–20: U.S. Geological Survey Open-File Report 2024–1034, 18 p., https://doi.org/10.3133/ofr20241034.
ISSN: 2331-1258 (online)
Study Area
| Publication type | Report |
|---|---|
| Publication Subtype | USGS Numbered Series |
| Title | Total phosphorus and suspended-sediment concentrations and loads from two main tributaries to Upper Klamath Lake, Oregon, 2014–20 |
| Series title | Open-File Report |
| Series number | 2024-1034 |
| DOI | 10.3133/ofr20241034 |
| Publication Date | June 27, 2024 |
| Year Published | 2024 |
| Language | English |
| Publisher | U.S. Geological Survey |
| Publisher location | Reston, VA |
| Contributing office(s) | Oregon Water Science Center |
| Description | viii, 18 p. |
| Country | United States |
| State | Oregon |
| Online Only (Y/N) | Y |