

Identifying Transportation Data and System Needs for a Federal Lands Transportation Data Platform
Links
- Document: Report (1.42 MB pdf) , HTML , XML
- Download citation as: RIS | Dublin Core
Acknowledgments
We appreciate the in-kind staff time and expertise contributed by the agencies and organizations represented by the authors and workshop participants. This work would have not been possible without the diversity of disciplines and agency and organizational perspectives represented here. Funding to support this work came from the Federal Lands Highway Technical Assistance program. We would like to thank two anonymous reviewers for their comments and revisions.
Executive Summary
Modern transportation and land-use planning efforts include information from many sources to address topics such as safety, efficiency, commercial, and social needs. This wide breadth of topics provides opportunities for collaboration and development of common tools for diverse users. In many cases, different information systems provide the spatial data and geographic content necessary for transportation and land-use planners to consider multiple lines of evidence. The Federal Highway Administration Office of Federal Lands Highway (FLH) and Federal Land Management Agency partners use detailed spatial and quantitative data to inform transportation decisions. However, logistic challenges to data sharing exist because data are often managed by separate agencies; data-exchange frameworks and interagency data agreements are insufficient; and consistency from aggregated data requires maintenance, coordination, and supporting infrastructure.
The FLH and U.S. Geological Survey collaboratively examined (1) use and availability of spatial data for transportation planning and (2) a possible mechanism to use more shared and consistent data in a common planning environment. The goals of this collaborative effort were to describe data needs from the perspective of planners and to identify opportunities for shared data resources. Results presented here focus on two workshops and a subsequent investigation of data and tools available from partner agencies. The objectives of this report are to (1) describe information used in transportation planning with geographic data; (2) identify spatially explicit data that inform transportation plans and could be shared among all partners; and (3) describe current platforms, planning and administrative opportunities, and potential barriers to developing an integrated planning tool.
Key information and data needs were identified in three major classes: system, user, and influential factors. System data are parts of the transportation network and information about the condition of individual segments and the network. User data provide details about the function of the system and insights into potential needs; for example, user trips between source and destinations inform road and network demands that can lead to congestion and safety issues (in the future, user data might also include scenarios and projections based on land-use plans). Influential data represent social and environmental factors that influence transit demands and network conditions. These factors could be popular locations or seasonal events that influence demand and congestion; wildlife habitat or migration intersections that affect safety and management priorities; or geologic features that influence hazards, maintenance, and safety. Responses described here provide specific information for web-tool design and give a framework for interagency communication and cooperation to address specific information needs for integrated planning. Existing web-mapping and web-services, and the data that inform them, are also described. Commonly, these data are created and published by one agency, and the core users are outside of that agency; for example, threatened species distributions are published by the U.S. Fish and Wildlife Service for consideration by planners in advance of National Environmental Policy Act (42 U.S.C. 4321 et seq.) evaluation.
This report is provided to inform FLH leaders and Federal Land Management Agency partners by articulating user needs and requirements for integrated planning tool(s). Programmers creating a secure web-based data-sharing platform (with data-viewing, -analysis and -download functions) can use the information presented here to organize data and user interfaces. This integrated perspective can help FLH and Federal Land Management Agency partners develop transportation networks that better serve the needs of people in local communities and across States and the Nation.
Introduction
This project was initiated to help the Federal Highway Administration Office of Federal Lands Highway (FLH) integrate transportation-planning information among partners across transportation networks. Multiple agencies use similar data for planning, although individual efforts can result in duplicated work and inconsistencies across efforts. The lack of a single authoritative information system can also create confusion. Modern transportation and land-use planning efforts address safety, efficiency, and commercial and social needs; therefore, demand for consistent information is increasing. This growing need also requires collaboration and codevelopment of data and tools as needed. Integrated planning that represents multiple interests, projects, and entities is on the horizon of transportation planning, and the U.S. Department of Transportation and FLH are positioned at the hub of this effort.
Moving transportation networks into alignment with growing populations and evolving demands for improved user options, increased safety on roadways, and multiple travel modes will require planning professionals to adopt new perspectives and address multiple priorities. For example, information about the surface condition and traffic volume for all road segments in a network is often sufficient for planning for safe connections. However, a more effective transportation network can be developed when additional information about transportation networks is considered. Factors such as the type of travel and activities possible at each node, the size and values at nodes, as well as the local demand for multiple travel modes can all be used in conjunction with agency plans to improve transportation networks. Additional information that provides context for transportation can play an important role in determining the long-term suitability of a transportation network because this information helps identify social context and emerging conditions that create new transportation demands. The specific objectives for this report are as follows:
-
1. Articulate key data used in planning processes and distinguish importance among the different types.
-
2. Identify context with which data are used in planning environments and document known sources and potential data gaps.
-
3. Investigate current Federal Land Management Agency (FLMA) data sharing and planning platforms to recognize desirable functions and identify an adoptable tool, if available.
-
4. Identify potential barriers and opportunities to improve Federal data sharing and ways to use existing capabilities for data handling and information technology security.
-
5. Describe specifications and an approach for a data-sharing platform based on purpose, framework, and specifications identified during this process.
Modern transportation planning and management practice already includes spatial data that covers large areas, are collected and managed by different offices, and are exchanged and redistributed through various applications. The FLH and its FLMA partners already use a variety of spatial data to monitor networks and inform decisions. Therefore, providing digital resources to improve consistency, accuracy, and openness among all partners will support and improve the existing planning environment. Further, directives for coordinating land use and transportation suggest that the consideration of even more data from a wide array of sources will better inform plans and decisions representing a multitude of land-use, ownership, and transportation features (for example, refer to the Federal Highway Administration [FHWA] Planning Processes—Land Use and Transportation web page https://www.fhwa.dot.gov/planning/processes/land_use/). Various FLMA partners already address many of the land-use features and conditions relevant for integrated land-use planning. As a result, providing the means to share data will support development of complementary methods in other agencies and will allow FLMA partners to consider neighbor plans and values in land-use planning. Even without a fully integrated approach, considering land-use and transportation networks in neighboring areas is prudent for planning because of transboundary interactions and exchanges.
To help bridge the gap for transportation data and information exchange among partner agencies, FLH and the U.S. Geological Survey (USGS) inventoried data, tools, and applications used for transportation planning to identify opportunities for data sharing and integration of common information. Current technology is sufficient and demand for spatial data and analyses exists and is growing. Although data are available, they are not compiled, formatted, or served in a manner conducive to common use. Therefore, developing a data-serving system with tools to facilitate data use and integration across multiple sources and users is the next logical step. Data integration provides the following:
-
1. An accurate, current, and rapid information exchange.
-
2. A reduced need for data manipulation after acquiring.
-
3. A reduced time and cost for data management.
-
4. An increased value of data from cooperative contributions.
-
5. An increased ability to combine transportation data with other content.
-
6. A reduced redundancy of data and platforms.
Government agencies possess abundant road data, but private enterprises providing map services (such as navigation and internet mapping) appear to have the most current and complete information. These data include detailed near-real-time information about traffic volume and congestion (for example, https://www.streetlightdata.com, https://www.urbansdk.com). Compiling and providing authoritative roads data—including all sizes, owners, and administrators, from local to interstate—would facilitate planning and network analyses and elevate the U.S. Department of Transportation (DOT) as a data provider. Accurate representation of the complete network is relevant for context even when planning has a different focus; for example, highway access ramps affect local volume and congestion. The organizational framework and hierarchy provided by the “Applications of Enterprise Geographic Information System (GIS) for Transportation” (AEGIST) project for compiling and reconciling linear referenced road data from a local to national scale should fill this core need. Alternatively, a private contractor could be employed to supplement existing data and would be responsible for updates and revisions.
One of the important messages from transportation planners, which is often echoed in other disciplines, is that simply adding more tools is not a good solution. Many tools already exist, and multiple platforms are often required to use different data sources. Although it is unlikely that a single tool could fill all needs and replace all old systems, it is important that new development should directly consider integration or replacement of existing tools as a possible means to improve the planning environment.
Methods
The project team documented (1) transportation data needs identified by FLH and FLMA staff and (2) data availability from Federal and non-Federal sources. The approach for collecting this information incorporated six parts:
Identify key deliverables.—The project began with identifying the types of planning deliverables and decisions users typically interact with in a Federal lands planning context. These deliverables included Long-Range Transportation Plans (LRTP), Transportation Improvement Programs, and supporting plans and studies.
Develop qualitative questions.—After identifying the key deliverables, questions and issues were defined to focus information gathering on the types of data staff use and need. These questions were organized into themes to structure conversations during the subsequent workshops (table 1).
Table 1.
Themes and questions developed to guide the expert-opinion workshops.[Questions for each theme were determined before the workshop and were designed to guide workshop discussion. In each question, “we” refers to workshop participants. Fed-aid, Federal Highway Administration Federal-aid Division; FLH, Office of Federal Lands Highway; DOT, U.S. Department of Transportation; FLMA, Federal Land Management Agency]
Conduct a workshop with the FHWA.—First, an internal FHWA virtual workshop was convened with FLH planning staff on January 27, 2022, with Federal-Aid Division Office staff, as well as staff from the Resource Center Transportation Performance Management program, the Office of Asset Management, and the Office of Fright Management and Operations. Google Jamboard was used for a facilitated brainstorming session on basic questions about planning and information use (table 1). The project team then synthesized and condensed input into themes.
Conduct a workshop with FLMA external partners.—Following the internal FHWA workshop, a second workshop was facilitated with planning and data management staff from various FLMA partners on May 16, 2022. Participants represented the U.S. Department of the Interior (DOI) National Park Service (NPS), U.S. Fish and Wildlife Service (FWS), and Bureau of Land Management (BLM); the U.S. Department of Agriculture Forest Service (FS); the U.S. Army Corps of Engineers (Corps); and the Bureau of Reclamation (Reclamation).
Analyze findings from both workshops for common themes.—Following both workshops, the workshop results were analyzed for common themes, gaps, and opportunities that inform current tasks in this study and the larger effort. The findings are summarized in this report. The virtual whiteboard contents of the FHWA and FLMA workshop are provided in appendix 2.
Review current data access and availability.—Data and online interfaces for transagency planning available from DOI partners, including BLM, Reclamation, FWS, and NPS; Corps; and FS, were reviewed. We sought data and applications used among FHWA and FLH partners that might be shared for mutual benefit nationally or across large regions. Evaluation of online resources was combined with workshops to describe current capabilities for posting and exchanging planning data.
Results
The following sections—"System Data,” “User Data,” and “System Influencing Data”—describe information identified during the two workshops. The information presented here was identified by participants experienced in planning with the purpose of guiding data integration and analytical tool development (app. 1; fig. 1.1). Figures 2.1–2.8 provide digital captures of the virtual whiteboard used as the participant discussion tool during the first workshop on January 27, 2022. Figures 2.9–2.14 provide digital captures of the virtual whiteboard used as the participant discussion tool during the first workshop on May 16, 2022. Three dominant categories of information were identified as being needed for transportation planning: transportation network or system, users and user-experiences, and influential factors such as economic foci, seasonal demand and conditions, and environmental hazards. These sections provide a brief discussion of each information type and a summary of the needs described by workshop participants. Other considerations identified by participants during or after workshops that did not fit into previous categories are also summarized. Finally, a summary of existing data services allows consideration of available resources that help fill needs described here.
System Data
System data are features and information identified as core parts of a transportation network, especially transportation features and infrastructure. Agency and user needs for system data are shown in figures 2.1, 2.2, 2.9, and 2.10, whereas potential sources of data are shown in figure 2.3. The primary data need for planning and managing transportation networks is accurate and comprehensive representation of roads, trails, rails, waterways, associated infrastructure, and connections to other transportation modes (such as air and space). For modern integrated planning applications, this data need likely includes comprehensive representation of roads and the administrations responsible for managing them, such as Federal, State, county, municipal, and other local governments and groups. Although not all routes and types are needed for every planning effort, a comprehensive system makes pertinent information (such as transjurisdiction information for communication and integration) readily available. In addition, a complete system of transportation may include freight and passenger rail lines and stations, airports, seaports, bicycle routes, pedestrian trails, off-road routes, rivers, canals, and light rail (elevated, surface, or subway).
Currently, similar information is being compiled and served by OpenStreetMap (for example, https://www.openstreetmap.org), but this source lacks the authority and attribution needed for documented planning efforts. Because of a rapidly evolving internet and web enabled capabilities, many data are available from outside sources and could be compiled and documented for applications with sustained funding and capacity for storage and maintenance. The AEGIST program, an FHWA effort, is currently working to build capacity and authority for these data (refer to the “Managed Service Platform” section). In many cases, baseline information may not be accurately and consistently recorded in digital form; therefore, variability in content, currency, accuracy, and resolution of data among Metropolitan Planning Organizations, States, and agencies needs to be addressed during compilation so data can be shared.
Using detailed spatial information with segment and network analyses can support decisions about transportation-network maintenance, expansions, modifications, and improvements by recognizing the role and condition of a route in the context of network function (that is, how each segment affects traffic flow). Comprehensive and maintained system data was listed first among required baseline information indicated by practitioners. Programs that include quantitative assessments of system performance as part of performance-based plans require additional information about the transportation system, which can be identified in system data. The FHA uses performance-based planning to set national performance goals and works with partner agencies to achieve desired transportation outcomes. National performance goals and associated guidance identify five types of system data that can benefit from consistent spatial representation and widespread availability (Grant and others, 2014):
-
1. safety,
-
2. infrastructure condition,
-
3. congestion reduction,
-
4. system reliability and efficiency, and
-
5. freight movement and economic vitality.
A transportation network is defined primarily by linear features, or edges, such as roads, trails, waterways, and rails. In geographic data, these line features can be buffered to provide area, divided into multiple pieces (segments) for distinction, aggregated to show network associations, and joined with other features to create specialized attributes. Nodes represent connections between adjacent edges and can have attributes that contribute context and details, which help determine needs and specifications for a road network (for example, the daily mix of private and commercial vehicles that moves in and out of a city or routes that connect commercial resources to a transit hub). A node for one plan could be the entire network in another plan. Coupled with user data, network analyses might be used to identify influential nodes (like an intersection that has cascading effects on congestion or road segments with high volume and few alternatives) to inform risk assessment and project prioritization. Quality network data may be comprehensive, consistent, and attributed with accurate representation of linear, point, and polygonal features. Tools that integrate network components with user and influential data will be an important function for most analyses; therefore, system data provide critical data structure.
System data as defined by the workshops with FLH staff and FLMA partners fall into two primary categories. First, basic identification of assets and asset conditions create the core data representing all linear segments and endpoints (or nodes) of the multimodal network, which may include truck, car, bike, pedestrian, and rail transit. Additional system-specific information for transportation networks includes classification, ownership, traffic, condition, age, Federal Lands Transportation Program (FLTP) and Federal Lands Access Program (FLAP) designations, right of way, culvert and bridge conditions, and commercial and freight-vehicle use. Thus, this information includes any data associated with the five performance goals and additional information such as ownership or class that provide context. Status-based planning can target integrated priorities, such as improvements targeted for low-condition scores in high-use commercial zones, when multiple attributes connect to road segments.
Second, network analysis can include data pertaining to multimodal function, safety, crashes, volume, efficiency, distinguished subnetworks, slopes, hazards, bottlenecks, connectivity gaps, and congestion. These data inform performance goals and provide important perspective on the flow of people and goods. For example, two roads with similar condition and safety scores might be prioritized differently because one road is a network bottleneck and another is a fire-defense route. System data also include spatial information associated with the base condition of transportation facilities and their condition and function across the network; when all facilities are represented, these data can directly inform integrated planning and evaluation. Data may be acquired from a variety of sources, and system data are often compiled by one office, department, or agency and used by one or more different groups. Specific examples (and sources) include driver behaviors (local law enforcement), accidents and collisions (law enforcement and medical), wildlife fatalities (State and local maintenance and State agencies), bridge conditions (national inventory and inspection), fish passage (State agencies and FWS), multimodal uses (local government), driver origins and destinations, and natural hazards. Locally specific data such as surface conditions within a management unit could be valuable for decisions made by an adjacent jurisdiction.
Because of the extent and complexity of road networks within the United States, a comprehensive inventory requires hierarchical compilation and organization of data from local to State or national scales with reconciliation and quality control at each step. The primary source for information on road locations, conditions, and use is often the entity that owns, maintains, and otherwise manages each road (which is usually the civic, county, State, regional or Federal Government that built the road). Therefore, the complete transportation network covering the continental United States is a vast tapestry of ownership, but the data are compiled and distributed by different levels of government. A well-structured, hierarchical system of compiling accurate road data from local, county, and State, to regional and national level datasets that have known accuracy and regular updates and revisions, is needed to consistently provide data. Once compiled from the multiple sources, road data need to be made available to planners and other users in a timely fashion so that planning efforts can use contemporary information. Quality control during compilation steps can ensure that common attributes are available and spatial configurations are compatible.
User Data
Beyond baseline information about roadways, the behaviors and demands of users directly inform transportation-network planning. Data on users provide information about the vehicles, people, and goods that travel along transportation routes, and how each move through the network. These data can be used to describe the function of the network. Understanding and managing the function of a road network requires data representing the movement of vehicles, people, and goods through the system. Agency and user needs for user data are shown in figures 2.4 and 2.11, whereas potential sources of data are shown in figures 2.5 and 2.12. User data provide insights about the choices made by members of the public and can be used to demonstrate patterns of public interaction with the network. Destinations such as civic and economic activities, cultural and historic sites, or outdoor recreation reflect differences in destination popularity and expectations. Parking availability, visitor hours, use and parking fees, and recreation opportunities influence demand and vehicle types. Industrial and commercial enterprises often develop consistent source and destination patterns with mappable demands.
There is a large variety of information that reflects people’s choices and behaviors, which might be used in land-use and transportation planning; however, only a small amount of information will be relevant for a project, unit, or region. Data identified in workshops focused on distribution of users and drivers in the network, such as the timing and location of heavy use. Specifically, participants recognized the value of data reflecting indicators of network use:
-
1. travelers’ origin and destination;
-
2. domestic, commercial, or industrial;
-
3. capacity and congestion;
-
4. trip frequency;
-
5. timing of trips.;
-
6. mode of travel and types of vehicles; and
-
7. opportunities and activities for users at destinations.
-
• a reason for individual trips, such as freight, work commute, recreation commute, vacation;
-
• creators of regional travel, such as business and commerce, access to resources, and special events;
-
• economic development and tourism enhancement described in other reports and plans;
-
• location and distribution of repeat, cyclic, single-pass trips;
-
• duration of visits (time between trips); and
-
• permitting and capacity management.
This information helps characterize when, where, and how transportation networks coincide with the people and commerce that the networks serve. Many user data require processing (data engineering) and interpretation for effective use, but the added effort provides insight into variations and trends in demand; for example, processed data may provide spatial comparison of intensity maps or morning compared to evening “hot spot” comparison. User data can be challenging to acquire because these data summarize public opinions from a noncaptive audience across a diverse environment, leading to diverse areas of interest and different opinions about those places. Sources of useful opinion data may include direct public feedback from transportation and visitor surveys, online comments, industry reporting by agreement, and staff observations. For applicability in network analyses, linking opinion data to locations or decomposing general data to fit local conditions is often advisable, such as noting the increased probability of boat trailers on roads that terminate at water.
Although much user information can be tied spatially to the edges and nodes of a road network, other user information may be more general and may not be spatially explicit. For example, the locations; dispersal; and juxtaposition of residential, commercial, recreational, and industrial areas have a strong influence on network needs and demands, but user data on these areas may not be trip-based or easily connected to road segments. These patterns and demands affect timing and location of traffic. Similarly, the location of ports, railyards, and airports are primary origin points and determine the flow of people and freight. The presence of a node is important, and knowing traffic patterns associated with that location affects the network. Depending on the perspective, user information may include directives and mandates not immediately associated with transportation, such as resource protection, visitor experience, and economic development. User data can facilitate interpretation and application of nontransportation priorities. For example, the combination of user and visitor demand, parking capacity, and resource sensitivity may require addressing resource protection and visitor-experience priorities along with the capacity and condition of the network. Data about users is particularly influential when trying to balance multiple mandates and demands with network limitations. Flexibility and options for adding and removing data to address specific issues are fundamental components of incorporating user data and other influential, nonnetwork, information to management plans. Uploading user data should be facilitated for the project-level application, and these data may require specific protocols for quality control, security, and access.
Workshop participants also identified private companies that generate data needed for local planning and observed that these companies’ data might be used with contracts or similar agreements. User data are particularly conducive to private contracting because of the abundance of personal information and algorithms used for processing this data without transferring personally identifiable information (which is controlled). At least two private companies offer user data specifically for transportation and land-use planning: StreetLight Data (https://www.streetlightdata.com) and Urban SDK (https://www.urbanskd.com). User behavior products from private providers include average daily traffic counts, multimodal counts, busiest routes, origins and destinations, turning movements, travel times, miles traveled, average speed, hours delayed, link analysis, trip purpose, trip attributes, congestion maps, crash rates and risks, places and points of interest, location attributes, and infrastructure. Data-sharing contracts might be established with private providers that would facilitate collection and processing of this information.
Social data are often proprietary and sensitive; therefore, surveys and data management must be undertaken with care and respect for laws and regulations governing privacy and personal information, making data collection more challenging. The U.S. Census Bureau, State and local economic development departments, consulting firms, State and regional tourism surveys, and the national household transportation survey all provide user information across multiple jurisdictions. Through interpretation and application development, these types of data may inform transportation plans, although summarizing across larger units (polygons) may result in coarse spatial resolution. Although much user data will be of specific interest and concern to one agency or unit, some information—like traffic volume and congestion in neighboring areas—influences demand, volume, and congestion within the planning unit, making transboundary data useful in this category also.
System Influencing Data
System influences are social, economic, and natural environmental conditions that affect traffic volume and safety, maintenance, construction, and road conditions but are not features of the roads themselves. There are many factors that influence the timing and distribution of drivers, vehicles, and their cargo in a multimodal transportation system, and some of this diverse information is used in land-use and transportation planning. Agency and user needs for data on system influencers are shown in figures 2.6 and 2.13, whereas potential sources of data are shown in figure 2.7. There is more information that might be used, but the challenge of translating indirectly related information onto regional maps and creating meaningful attributes is a barrier. Factors that influence the transportation system are diverse including social-political expectations, built environment, historic-cultural protections, and Tribal and international borders. Usable influential data often represent transportation networks that are complicated shapes, such that spatial calculations might be needed to attach attributes to road segments (data engineering). Features or protections unique to an FLMA partner or particular unit may be common, especially when visitor management, resource, and asset protection create specific requirements. Influential information covers diverse subjects and therefore comes from diverse sources, such as environmental conditions; natural, cultural, and social features; population estimates; State and metropolitan land-use plans; connectivity analyses; natural barriers and hazards; economic development areas; and industrial uses such as logging, solar, oil and gas fields.
Workshop participants specified that regional plans, economic-development districts, U.S. Census Bureau data, and similar social structures provide information relevant for transportation plans, but this information may be embedded in formats other than geographic data. Often, that information is in tables, figures, reports, or similar formats. Influential information may come from diverse sources and represent extensive areas, which makes it important for planning but challenging to use in spatial analyses until directives are interpreted for application. For example, increased access for a feature identified by an oval on a map may require development of alternate access routes, lane expansion, shoulder and bridge improvements, or specific actions not specified in the original directive. Useful information might translate the implications of economic-development zones, metropolitan planning and statistical units, U.S. Census Bureau Urban Area Census statistics, and North American Industry Classification System data.
Additionally, some projections, such as population change, traffic growth, visitation, and socioeconomic monitoring, are not spatially explicit at fine scales. However, these projections often include information with immediate planning implications because they help predict when, where, and how many users might affect the transit system. Commodity prices and government incentives can also affect activities in many industries, including energy, timber, and agriculture, and projections may not be spatially explicit, although trends in these industries affect freight demands. Tables, reports, guidance, and similar nonspatial digital resources that are commonly used and support specific directives could be organized and provided as aspatial tools if the utility is clear and the information is current. Participants identified a diverse list of influential topics that may be considered for data development and potential integration:
-
• population and economic trends;
-
• State and local economic development plans;
-
• industrial uses (current and planned);
-
• recreation and tourism timing and locations;
-
• agency mission and goals, especially resource protection;
-
• regional planning and monitoring organizations;
-
• iconic, historic, recreation areas with high use or seasonal use;
-
• fish-passage inventory and attributes;
-
• conditions of overpasses and underpasses for migratory wildlife;
-
• seasonal restrictions for habitat, flood, mud, snow, wind, and fire;
-
• mode preferences and options, local interests, and possible user conflicts; and
-
• visitor (driver) experience from surveys.
The NPS is developing a planning tool and database (Innovative and Sustainable Transportation Evaluation Process; INSTEP) as part of their National LRTP (NPS, 2017), which will outline a systematic rating system for NPS transportation projects based on seven principal topics to guide evaluation: (1) planning context, (2) natural resources, (3) cultural resources, (4) visitor experience, (5) energy and climate change, (6) materials and construction, and (7) innovation and custom strategies. This approach could be adopted for other agencies by incorporating different priorities into the framework and using similar steps to guide integration of multiple priorities and datasets.
Sources of influential data and the information they provide is diverse. It is likely that a small set of system data will be broadly applicable, and much more data will remain the purview of individual partners. For example, U.S. Census Bureau data are applicable for planning at most levels, but not all attributes will be needed for land-use and transportation planning. Manipulation of transportation-focused data could be used to select key data from external sources. Other data that could be universally useful include cultural and historic districts, endangered species habitats (terrestrial and aquatic), topographic and geologic hazards, flood zones and Federal Emergency Management Agency designations, and local planning units and attributes. Important sources include the Federal geospatial data committee, U.S. Department of Commerce, economic development districts, the USGS Protected Areas Database, U.S. Environmental Protection Agency (EPA), and the National Map.
Other Considerations
Several potentially important topics emerged from workshops but did not fit into previous sections. Some of these topics supplement discussion of the core categories and others expand to new perspectives for planning (figs. 2.8 and 2.14). First, FLMA partners typically use internal data for the most current or accurate version, and those data may not be publicly available. In some cases, using internally maintained data may be necessary to ensure version stability and proper documentation for coherence within and among planning cycles. Therefore, coordinating updates, controlling versioning, and precluding unexpected changes during interim periods are specifications to support stability and consistency. In addition, coordinated FLH and partner data services will depend on a network of data managers with protocols for data revisions and updates. System improvements over existing desktop approaches will encourage transitioning to a new platform. Example improvements include intuitive and recognizable graphical user interface (GUI), which can allow users of the application to view and interact with data. These improvements can enable increased stability and security in data and records, consistent reporting and terms for easy translation to plans, and rapid and efficient data processing.
Second, agencies have different funding levels and capacities for planning, especially transportation planning, so benefitting all users regardless of capacity is an important conceptual and practical target. In addition, priorities vary among agencies and units, which affects the role transportation plays in land-use plans. Core infrastructure data matter at all levels of transportation planning, but project priorities and connections between transportation and agency missions vary. Therefore, flexibility to combine shared data between agencies and to project specific information in a single environment tailored for analyses, presentations, and reports will increase applicability for existing practices and demands. Some processes and analyses will, however, remain separate.
Existing Tools and Approaches
The FHWA provides guidance for project planning in the Environmental Review Toolkit, which facilitates the National Environmental Policy Act (NEPA; 42 U.S.C. 4321 et seq.) process and informs transportation decisions (FHWA, undated). According to this approach, planning can provide (1) a clear description of project purpose consistent with local land-use plans; (2) development alternatives; (3) social, economic, environmental, and other possible effects; (4) right-of-way acquisition and relocation assistance; and (5) public comment and involvement. Geographic information systems may offer potential roles in these provisions (except for public comment and involvement) through analysis and display of spatial data. Shared spatial data could assist in communicating alternative plans by providing access to complete and consistent data for rapid and comprehensive comparisons. Shared spatial data could provide content for social, economic, and other values under consideration, and an online tool may provide a mechanism for using those data. This mechanism could include a simple spatial query for reporting attributes and modules for more expansive summaries, scenario tests, comparisons, and correlations to customize information and results.
The EPA Smart Location Database is a resource that provides location efficiency as part of the Smart Location Mapping project (for example, https://www.epa.gov/smartgrowth/smart-location-mapping). This database was identified as a source for data, but this forward-thinking initiative also supports connections between land use, development patterns, transportation options, and human behavior and includes information and an approach that could immediately benefit transportation planning. The Smart Location Database describes about 90 indicators of efficiency in built environments, including street network design and accessibility metrics. Spatial resolution is currently restricted to U.S. Census Bureau blocks and, therefore, data may be most useful for regional planning and less useful when local details are needed.
The FHWA introduced the AEGIST initiative to lead deployment of enterprise GIS for asset-data management to build capacity and improve data quality. Objectives of that initiative include establishing standards and management rules to create and maintain an integrated geospatial data and information system that can improve consistency, organization, and accuracy among agencies, States, and other partners. This initiative is building national-level enterprise data for linear-referenced features by motivating and directly supporting State-level efforts. Data inputs will likely include records from pavement and asset-management systems, traffic data, crashes, and local assets. Records attach to the linear reference system using GIS and enterprise database format; the workflow also integrates GIS, computer-aided design and drafting, and building information modeling data. Compiled data could be redistributed using an existing data service such as All Road Network of Linear Referenced Data, Highway Performance Monitoring System, Model Inventory of Roadway Elements, or National Road Network Pilot Program, and applied directly to applications in planning, design, construction, and maintenance. The “Complete Streets” concept, which is being implemented in many States and regions, outlines the use of spatial data to inform multiple aspects of asset management and establishes demand for detailed spatial data and the virtual services that make them usable.
The FWS online mapping and data reporting tool EcoSphere database (Environmental Conservation Online System [ECOS]) supports inquiries into FWS-regulated species and habitats. It is not typically used for FWS transportation planning but provides a working example of a map tool supporting user-defined spatial queries.
The NPS INSTEP planning framework and rating system uses a series of criteria with questions to guide projects with the stated purpose of achieving a sustainable transportation system. The NPS approach is a framework informed by data at multiple steps, but the framework and the data are separate entities. The INSTEP structure is suited for organizing transportation-planning processes. Steps in the process could be used to identify user needs and prepare responses. If applied more broadly, modifications could be developed to meet needs of other agencies.
Integration Opportunities and Challenges
Different missions of FLMA partners affect priorities for transportation and considerations when planning; therefore, additional unique data will likely be needed by most agencies. In most cases, agencies have existing methods and data for mission-specific considerations and so only need accommodation. Some agency-specific datasets may be generally useful if standardized (for example, for consistent attribution) and expanded beyond unit boundaries. Aside from these differences, there are many common datasets that are needed by multiple planning entities. Significant time and resources could be redirected if these datasets are compiled and distributed by web-based tools.
Ideally, integrated data include all locations and jurisdictions, but differences in priority and funding affect consistency in data collection, precision, and revision cycles. Some nontransportation data may be broadly relevant and could be supplied by a new tool as an accurate and consistent data source; such data would be available when needed and easily ignored when not needed. For example, data specifying elevation and topography, geohazards, weather hazards, climate change, and marine environment include information of broad applicability but are not needed for all planning efforts.
Land-use and transportation planning occurs at multiple levels of government (for example, the FHWA provides guidance and top-down perspectives). Different FLMA partners have varying resources and organization structures with national and local expertise dispersed within the organization. Metropolitan planning organizations (MPOs) often have massive, complicated networks and insufficient funding for maintenance and improvements, regional planning authorities typically address large areas with transportation challenges driven by geography and land use, and counties and smaller municipalities vary tremendously in capacity and responsibility. Integrated planning efforts can, and should, involve multiple levels of government, MPOs, and entities; therefore, consistent data across boundaries is necessary, but this effort may require financial support and time to improve data quality before distribution. Enhancing data quality may require navigation of intergovernmental relations, including cooperative and competitive relationships such as Federal–State, State–municipal, and large–small cities and planning units. Different staff within an agency may address different planning questions, such as, is there a need for a cooperative community of practice to connect to other entities with similar planning challenges and needs?
Possible nontransportation information sources and consultation topics included social-science coordination (such as user experience statistics), socioeconomic monitoring, and visitation and traffic counts. Several additional datasets and planning efforts were noted by participants as containing supporting information:
-
• BLM National Ground Transportation Linear Features Map Service spatial data with linear features and State or district-level roads and trails (https://cmerwebmap.cr.usgs.gov/catalog/item/5d810723e4b0c4f70d0581aa);
-
• BLM Travel and Transportation Management Manual (sec. 1626) describes an integrated travel-management approach (BLM, 2016);
-
• Collaborative Visitor Transportation Survey is a multiagency effort to gather feedback and describe user experiences for planning and adaptive management (https://highways.dot.gov/federal-lands/programs-planning/cvts);
-
• DOI Federal Project Budget Management System records project-level information (https://www.doi.gov/pmb/fbms); and
-
• NPS Visitor Use Statistics, economics and valuation, demographics, and sociomonitoring data (https://www.nps.gov/subjects/socialscience/visitor-use-statistics.htm).
Additional perspectives and collaboration may be needed to accurately represent local planning needs. Regional and integrated perspectives of MPO planners were repeatedly recognized in discussions, but State or regional planners did not contribute (during this workshop). Meaningful communication with planners at different levels of government and different planning regions will be challenging because of the number and dispersion of planners. Multistate organizations, such as the Western Governors Association and Appalachian Regional Commission, could provide conceptual and technical support for some integrated planning efforts. To start, they could be notified and included when large areas that transcend State boundaries are affected.
Logistics and Data Management
Compiling and managing a complete linear referenced dataset with accurate local resolution for the continental United States is a large undertaking requiring substantial computing resources, hierarchical reporting, different management sectors, and cooperation among many different levels of governance. Each of these considerations is a logistical challenge. Comprehensive system data, projection of current and future traffic volume, knowledge of future land-cover and land-use patterns would all be valuable for forming plans, but this information can be difficult to obtain. Current traffic volume is valuable user data to include with information needs. Projections of future volumes will require outside information and synthetic efforts. Similarly with land-cover and land-use data, current conditions and mandates (such as avoidance of wetlands, connecting urban areas, and providing access to recreation areas) can be addressed in current plans, but a projection of possible future conditions is more difficult and requires integration with land-cover or land-use scenarios.
Clear providence tracking and data versioning will be critical if data are created by one agency and distributed by another. Credit for creation, ownership, and maintenance of data must be maintained, and federally created data must be publicly available even though data created by other agencies may be proprietary or restricted. Information about data creation and manipulation is generally stored as metadata, but shifting standards, source differences, and user practices can result in inconsistencies (in information or data storage). Data redistribution by FLH or their partners should not circumvent established revision cycles or security, and appropriate authorities should remain responsible for data accuracy and maintenance.
Summary of Data Services and Online Systems
Following workshops, we assessed the current availability of spatial data and online tools among FLMA partners. The purpose of this assessment was recognition of available systems and data-providing information and services similar to needs described in workshops. We consulted several partners directly and reviewed online data resources to describe existing geographic information capabilities and geospatial applications that are available for comprehensive transportation planning approaches identified in the workshops (app. 2; table 2.1). We describe online resources supported by several agencies and available for planning.
The FWS created the ECOS database with user-interface to access FWS data and support reporting based on user supplied areas. The database was designed to inform planning but not necessarily FWS planning. The format supports options for user interface and provides predefined pathways for data exploration, regulatory preview, and a full biological assessment. Among other products, it provides a list of species and critical habitat that should be considered and information for working with a local field office. Multiple modules have been created to customize interactions with the ECOS database, and this multiple-interface approach could be used for a planning database system. In this way, different planning exercises and different stages of planning (that is, different ways of interacting with data) could be developed as separate workflows.
The BLM has several online data portals that inform planning, including the Geospatial Business Hub, Landscape Approach Data Portal, and ePlanning (NEPA specific). The newest of these tools, the Geospatial Business Platform, provides interactions with large amounts of data that are useful for planning. Graphic display facilitates data exploration and selection, and data can be downloaded for analyses. This tool did not include online processing or reporting at the time of this assessment.
The NPS database system includes Navigator, Integrated Resource Management Applications; Planning, Environment and Public Comment; Science and Infrastructure Management System, and Park Atlas. The NPS Navigator includes links to Pathweb, providing segment attributes and road surface video. This approach and functions appear directly relevant to FLH planning. The NPS INSTEP planning criteria is a framework with planning steps for using multiple data inputs. A process similar to INSTEP could be used to structure data use for other planning applications.
The Reclamation provides extensive data specific to Reclamation properties with their Reclamation Information Sharing Environment and Reclamation Water Information System. This system is an open-access data platform for viewing and downloading Reclamation water and water-related data (Reclamation Information Sharing Environment, Reclamation Water Information System, Open Water Data) powered by ArcGIS. Interactive processing and planning functions are not included and extensive data are available.
The Corps provides data for the National Inventory of Dams, Navigation tools, military and civil infrastructure, water infrastructure, and regulations and emergency management through an open-data platform. An interactive viewer provides custom scale and extent, but interactive functions are not included. These outward-facing data are important for many planning efforts.
The FS Geospatial Data Discovery Tool uses an ArcGIS map viewer and query tool for data selection. It does not offer online tools, but an area of interest can be user-defined, and content can be downloaded or connected through an ArcGIS REST API (a conforming application programming interface). The ArcGIS software and the ArcGIS REST API support custom processing.
The FLH maintains programs and databases directly relevant for planning professionals: National Highway Planning Network, Highway Performance Monitoring System, National Bridge Inventory, Freight Analysis Framework, and Long-Term Bridge Performance Program. These data are available for secure download but not as part of a tool.
The FHWA created the Office of Planning, Environment, and Realty to host data for planning and real estate spatial applications. The Screening Tool for Equity Analysis of Projects allows interactive viewing that combines the road network with social data and data regarding air quality, crashes, and metropolitan planning designations. This tool established a precedent by using programmatic data services in Federal planning departments.
Data from U.S. States and other regional and local entities may inform an integrated planning platform. Most States have adopted open data policies facilitated by GIS technology and open-source and commercial software. These adoptions result in catalogued and API-supported, public-facing data. The amount and diversity and representation of data for each State differs, but all States provide system information and most provide additional user information. Few of these systems provide planning tools, so an integrated service platform could provide integration and linkage with existing State data sources.
Discussion
The FLH is taking direct and informative steps to advance transportation and land-use planning by (1) envisioning the benefits of data sharing and integrating planning processes, (2) developing partnerships and frameworks for compiling key transportation information for broad consumption, and (3) creating an information platform to serve integrated data used for transportation and other land-use planning. As a result of compiled data, planners gain the ability to (1) look beyond unit boundaries throughout the planning process, (2) consider priorities of neighboring agencies or regional plans, and (3) develop informed collaborations, including opportunities made apparent from network analyses and route connections. The FLH benefits from more consistent planning processes among partners organized by reviewed and compiled data and common analyses.
Information is compiled in this report to describe specifications and build a service platform and tools. The report also identifies several steps useful for moving this process forward. There is an opportunity for FLH to increase outward-looking perspectives and collaboration in land-use planning by using common interests and efforts and providing network-wide coordination and access to relevant information. The DOT is ideally positioned to coordinate and host these data because the agency is already experienced as a hub for information and as the industry leader. Also, existing partnerships will support coordination and cooperation. Lastly, the DOT’s analytical and policy roles make it a key benefactor of compiled transportation-network data.
Findings
Finding 1.—The most important information for widespread spatially integrated transportation planning is a complete and comprehensive Linear Reference Dataset for all roads. The AEGIST project is working towards creation of this enterprise dataset with a uniform spatially explicit inventory of roads. Digital-system and data-management framework has been created, and direct engagements with partners, especially State department of transportations, will help inform and insure availability of high-quality local information across boundaries for the entire Nation. In addition to linear components, critical features such as bridge inventory and safety-related information could be compiled and served as baseline system information. Planners and technical advisors agreed on this priority.
Finding 2.—A platform with data services that extend to all Federal agencies to hold and distribute enterprise data are needed. This platform was also proposed in the safety analysis (refer to the “Managed Service Platform” section). Whether hosted by FHWA or another Federal agency, a secure data platform that controls user access and permissions but enables broad sharing of system, user, and influential data for transportation planning is also necessary for integrated planning. A functional service will include tools that enable interaction with data for summary and analyses and contribution (upload) of project-level information needed for local information. Planners and technical advisors also agreed on this priority.
Finding 3.—Additional data, especially in user and influential categories, will need development. Most agencies publish some data, but the most current and internally relevant data may be stored on agency servers with restricted availability. In many cases, published and served FLMA data are designed for outside users rather than within agency use. For example, the FWS system provides data and tools that help developers, planners, and the public work with FWS when plans affect protected or threatened species. Despite differences, all FLMA have existing, inwardly focused planning processes. Variations in content, relevance, and complexity of these data suggest codevelopment of agency-specific applications will provide the best utility.
Finding 4.—Priorities vary among FLMA partners, and often among regions, districts, and units within these agencies; so, although safety, volume, and surface conditions matter to all agencies, project priorities and connections among agency missions and means of transportation vary. Furthermore, because agencies collect and manage data differently, there will be differences among data attributes, spatial resolution, and temporal frequency; some agencies may have missing data. Therefore, routine integration of local- and project-specific information is a needed capability for a planning support tool. Some user-supplied data may need review or revision before posting; other user data might remain limited in scope and require less support. Security and quality control mechanisms will be needed for files and content.
Finding 5.—High-level planning can address questions like, where do we (whether as a society, State, city, or region) want more roads, fewer roads, bigger roads, or alternate routes? However, simple answers are not typically provided, and therefore transportation planners use other land-use plans and policy directives to provide guidance. By using these additional plans and directives, transportation planners often incorporate unclear ideas such as how to better serve the local population; encourage commerce, trade and tourism; and decrease negative effects such as noise, contamination, and unsafe conditions into specific transportation opportunities. The incorporation of these ideas into modern integrated planning will require shared spatial data.
Finding 6.—The roles of transportation and funding levels within and among FLMA differ, which creates different capabilities and perspectives among potential users. Some agencies have limited transportation assets compared to an expanse of official mandates and responsibilities, for example, Reclamation and FWS. Other agencies manage small geographic extents but provide critical transportation resources, such as roads managed by the NPS that help fulfill the visitation mission. Two agencies manage extensive road networks associated with recreation, economic development, and resource management: the FS and BLM. Including this complexity is part of the task for data and tool development.
Next Steps
The following steps were determined based on workshop discussions and identified information needs.
Next Step 1.—Create a nationally contiguous and comprehensive linear referenced database. The linear referenced database of transportation networks created by the AEGIST program was identified as the backbone of monitoring and analyses of the transportation system. Many network summaries and analyses depend on spatially combining environmental factors and road segments.
Next Step 2.—Coordinate compilation and distribution of the following data types used for integrated transportation planning: land cover, land use, social values, and resource management. A clear role for interagency coordination exists, whereby data representing transportation assets with conditions, plans, and priorities can be coupled with land-use context from multiple relevant perspectives. The context needed to inform transportation planning comes from attributes and factors found in a variety of social, environmental, and economic information.
Next Step 3.—Create and implement a framework for identifying, acquiring, and serving informative user and influential data. Collaboratively develop a framework for acquiring and updating data that can document system users and key influences on the system to complement AEGIST plans for creating the system data. This collaboration will require collective participation; partners will need to standardize and provide their data, and FLH will lead compilation, review, and data release. The system data may also need additional attribution; therefore, data engineering can address integration from both directions.
Next Step 4.—The recent FHWA Office of Safety Research and Development report (Hamilton and others, 2022), “Development of Safety and Traffic Data Collection System and Analysis Framework for Federal Lands Highway,” also identified the need for spatial information for transportation planning and analyses. The technical details in Hamilton and others (2022) complement the user perspective on data and information needs described in this report. Among the objectives for developing and implementing integrated safety analyses identified in Hamilton and others (2022) are formal data-sharing relationships with partner agencies, common road data, shared and complementary data analyses, enterprise spatial data service, and refined data collection and analyses. The objectives described by Hamilton and others (2022) are strong validation of the need for shared data and a data-sharing platform, and safety analysis would make an excellent case study of defined user scenario(s) with application of shared geospatial data.
Managed Service Platform
Hamilton and others (2022) describe a Managed Service Platform (MSP) as a system of software and hardware (which may be cloud based) that would allow secure access to centrally managed data (especially geospatial data) needed for network analyses. These analyses used data from multiple sources linked to transportation infrastructure through the Linear Reference System, which created the data backbone. Multiple sources of evidence for safety and road conditions were combined with direct samples in some locations and modeled risk in other areas. Specific information needs and analyses related to safety assessments identified appropriate data, alternatives, and data acquisition. Data development for multiple important topics such as bridge condition, surface condition, and flood risk need further development as enterprise products.
With a broader perspective that considers all assets including roads, rails, bridges, ports, structures, and other infrastructure and influential conditions like safety, surface, environmental, social, economic, and historic, this report addresses similar data-sharing as analyses described in Hamilton and others (2022). The common objective is a virtual forum for sharing spatial data between Federal partners engaged in transportation and land-use planning. Addressing safety and other management issues in the modern era demands use of rigorous spatial data that are consistent and communicated among partners. Necessary data sharing may be achieved with the mechanisms described in this report and those mechanisms identified in Hamilton and others (2022). Specifically, we suggest the development of an enterprise data service accompanied by tools for using the data that inform key steps in the planning process such as analysis, reporting, and communicating with interagency availability. Extending use of the same data to States and other planners, as soon as possible, is highly desirable.
Hamilton and others (2022) focus on improving highway and roadway safety through risk assessment and implementation of safety measures. Risk assessment and system monitoring can be impeded by lack of suitable information (for example, in rural areas), making data development and integration important for network analyses. Using GIS, safety action plans and road-safety audits can be integrated with surface condition and crash data. Key tasks for filling safety information gaps and developing actionable plans to improve safety include (1) establishing high-level logistics, coordination, and approvals; (2) creating spatial-data repository and exchange system; (3) defining and implementing data-collection framework for spatial information; (4) conducting safety and traffic analyses using segments and networks; (5) conducting case studies to demonstrate and refine; and (6) implementing nationally. The first step in this list was initiated by the team that conducted Hamilton and others (2022).
User Audience
The Safety and Traffic Data group is focused on Federal partners only. Because it is open to all Federal partners, agencies such as the USGS, Bureau of Indian Affairs, and other Federal staff are potential users. To ensure comprehensive accessibility across agencies, access authentication through “Login.gov” is being developed. Unlike other Login.gov accesses, where the public can create an account for access, the MSP approach would be limited to login credentials specific to the Federal Government. In this manner, only Government employees issued a Personal Identity Verification would have access. Availability for other agencies, such as State DOT, which requires crossing Federal, State, local, and private security barriers and protocols, has not yet been addressed.
Intended Function
The purpose of the MSP is serving a variety of transportation data in a single, user-friendly platform. Technical experts identified five principal types of information to be managed by an enterprise data management system (app. 2; table 2.2). Data identified in this report will also fit into these categories.
Intended functions for these data include (1) layering and integration of otherwise disparate datasets and (2) addition of new, revised, and local data. In this way, the MSP should function like ArcGIS Online and similar platforms that allow multiple users to rapidly access, add, and combine datasets linked back to a single (authoritative) source. The data content is the most important distinction from ArcGIS, but intended functions also allow users to develop workflows that require greater geoprocessing capabilities and information exchanges between various datasets that were not possible in the past.
Technical Challenges
There are two technical challenges. First, road-condition data are collected on a 5-year basis, which determines how current the information collected can be. More current data may become available with systematic, hierarchical compilations and revisions. The FLH receives the data from respective owners or creators (for example, States) and generates consolidated data; the consolidated data are owned and distributed by FLH. The data could be hosted on non-FLH servers. Currently, the process of compilation and redistribution requires considerable ushering and management to maintain agreements, data quality, and access. This process needs to be more automated for modern workflows and to handle data revisions and updates. The framework for compilation and updates supported by formal agreements needs to be created.
Second, some data and analyses may be proprietary (for example, financial). This information needs to remain secure, whereas other data can be publicly available. User management that includes options for different access permissions depending on agency, planning groups, individual, or other designations is needed.
Managed Service Platform Timeline
The timeline for the creation of an MSP is not defined, but a plan for development and implementation has been developed. An FLH project team is working with the DOT Chief Information Officer for agency approval to use DOT servers to host data for users outside of DOT based on the Login.gov authentication process. Following Chief Information Officer approval, the project team is planning to focus on data coordination, workflow, and tools development. Lasty, the team will conduct partner-useability testing and deployment of the MSP.
If the MSP project is unable to establish a platform with suitable security clearance and accessibility, this task will likely remain a priority for subsequent efforts. The ability to serve data back to partners is an essential part of moving towards coordinated planning and data integration. Data-handling capabilities and restrictions are not the same among Federal agencies, and another (non-DOT) agency with the appropriate server and data capabilities might be needed to provide the hosting solution.
Conclusions
This report summarizes information about the data needs of traffic planners as well as the availability and use of spatial data to help meet these needs. The report also summarizes information collected during two collaborative workshops with traffic planners to articulate their user needs and requirements. The intent of this report is to inform Office of Federal Lands Highway leaders and Federal Land Management Agency partners by providing an integrated perspective on data, data needs, and integrated planning tools.
References Cited
Bureau of Land Management, 2016, 1626—Travel and transportation management manual (public): Bureau of Land Management, 44 p., accessed February 10, 2024, at https://www.blm.gov/sites/blm.gov/files/uploads/mediacenter_blmpolicymanual1626.pdf.
Federal Highway Administration [FHWA], [undated], NEPA—Transportation decisionmaking: U.S. Department of Transportation Federal Highway Administration website, accessed February 10, 2024, at https://www.environment.fhwa.dot.gov/nepa/trans_decisionmaking.aspx.
Grant, M., McKeeman, A., Bowen, B., Bond, A., Bauer, J., LaSut, L., Barnes, B., and D’Ignazio, J., 2014, Model long range transportation plans—A guide for incorporating performance-based planning: U.S. Department of Transportation Federal Highway Administration, prepared by ICF International, report no. FHWA-HEP-14-046, 176 p., accessed February 10, 2024, at https://rosap.ntl.bts.gov/view/dot/67101.
Hamilton, I., Cohen, T., Amoabeng, M., Spear, M., and Chestnutt, C., 2022, Development of safety and traffic data collection system and analysis framework for Federal lands—Final report: Federal Highway Administration, prepared by I. Hamilton, report no. FHWA-FLH-23-006, 224 p., accessed March 2024 at https://highways.dot.gov/sites/fhwa.dot.gov/files/2024-05/FLH%20Systemic%20GIS%20Final%20Report%20FHWA-FLH-23-006.pdf.
National Park Service [NPS], 2017, National long range transportation plan: National Park Service, report no. NPSG 999/126905A, 150 p. [Also available at https://rosap.ntl.bts.gov/view/dot/32531.]
Appendix 1. Schematic of Integrated Tool Development
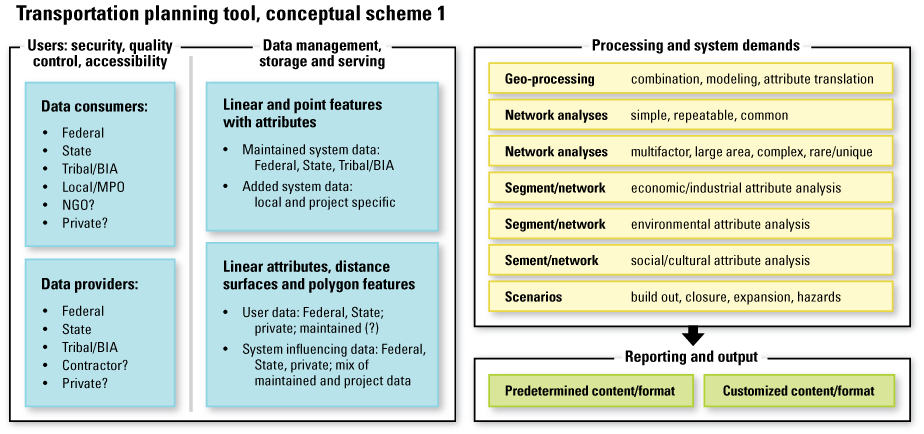
Schematic diagram of integrated tool development showing major components envisioned for an enterprise data system with user tools. Question marks indicate items that were posed to workshop participants intended to promote discussion. [BIA, Bureau of Indian Affairs; MPO, metropolitan planning organization; NGO, nongovernmental organization]
Appendix 2. Graphical Contributions and Data Types and Access System Summaries from Virtual Workshops
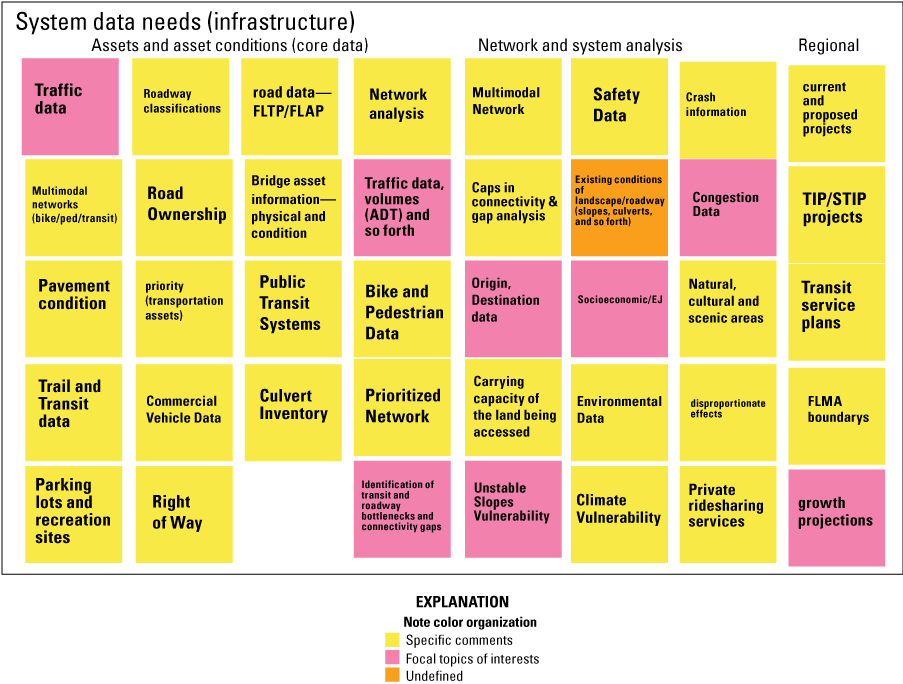
System data needed for enterprise data and planning tools identified by participants of the first workshop with Federal Highway Administration staff on January 27, 2022. This figure identifies the primary information for asset inventory and network analyses and was captured with Google Jamboard, a tool for facilitating brainstorming sessions with workshop participants. Workshop participants included Federal Lands Highway planning staff from the Federal-Aid Division Office, Resource Center Transportation Performance Management program, the Office of Asset Management, and the Office of Fright Management and Operations. Color coding of comment boxes originated as organizational tools to distinguish focal topics of interest (pink) from specific comments (yellow). Undefined colors indicated notes that were not defined and do not imply importance or meaning. The content and formatting were modified and summarized by the authors to capture the main ideas. Font size does not imply meaning. [ped, pedestrian; FLTP, Federal Lands Transportation Program; FLAP, Federal Lands Access Program; ADT, average daily traffic; EJ, environmental justice; TIP, Transportation Improvement Program; STIP, State-wide transportation improvement project; FLMA, Federal Lands Management Agency]
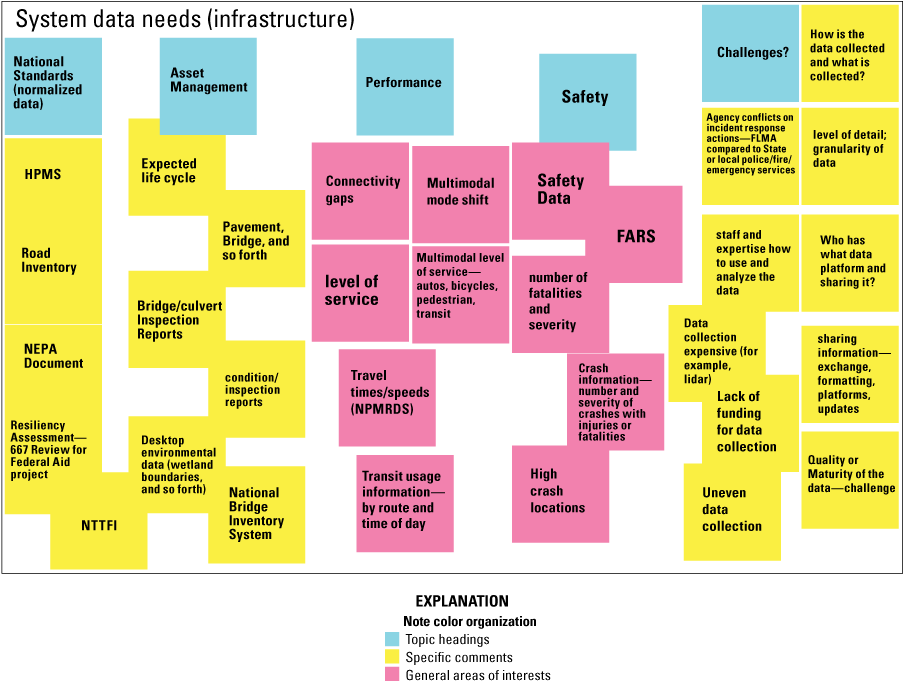
System indicators of infrastructure condition, safety, and evaluation for enterprise data and planning tools identified by participants of the first workshop with Federal Highway Administration staff on January 27, 2022. This figure was captured with Google Jamboard, a tool for facilitating brainstorming sessions with workshop participants. Workshop participants included Federal Lands Highway planning staff from the Federal-Aid Division Office, Resource Center Transportation Performance Management program, the Office of Asset Management, and the Office of Fright Management and Operations. Color coding of comment boxes originated as organizational tools to distinguish topic headings (blue) and general areas of interest (pink) from specific comments (yellow). The content and formatting were modified and summarized by the authors to capture the main ideas. Font size does not imply meaning. Question marks indicate items that were discussed workshop participants but did not reach consensus. [HPMS, Highway Performance Monitoring System; NEPA, National Environmental Policy Act; NTTFI, National Tribal Transportation Facility Inventory; NPMRDS, National Performance Management Research Data Set; FARS, fatality analysis reporting system; lidar, light detection and ranging; FLMA, Federal Lands Management Agency]
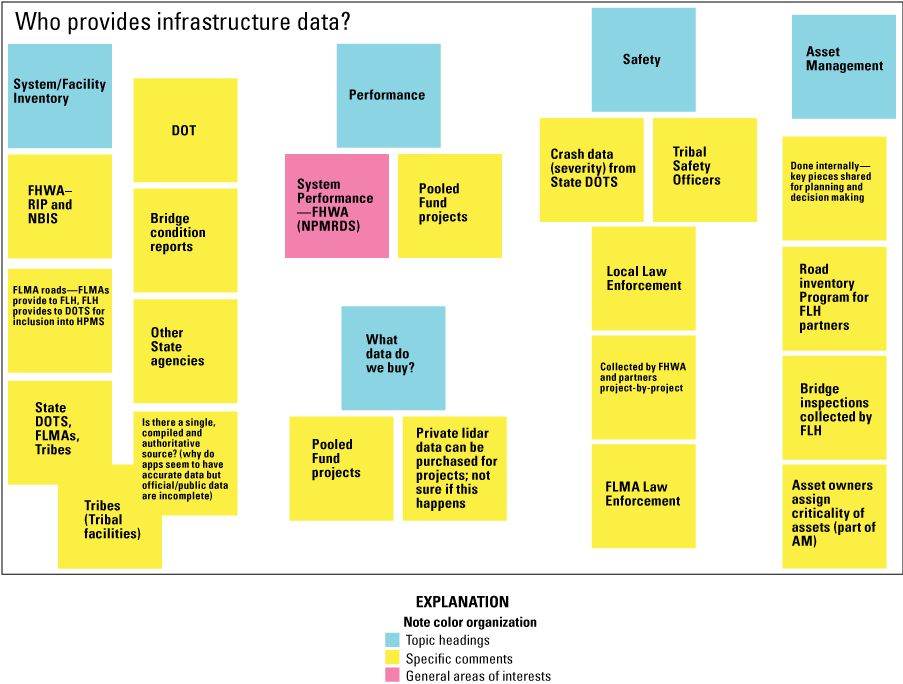
Important system information data sources for enterprise data and planning tools identified by participants of the first workshop with Federal Highway Administration staff on January 27, 2022. This figure was captured with Google Jamboard, a tool for facilitating brainstorming sessions with workshop participants. Workshop participants included Federal Lands Highway planning staff from the Federal-Aid Division Office, Resource Center Transportation Performance Management program, the Office of Asset Management, and the Office of Fright Management and Operations. Color coding of comment boxes originated as organizational tools to distinguish topic headings (blue) and general areas of interest (pink) from specific comments (yellow). The content and formatting were modified and summarized by the authors to capture the main ideas. Font size does not imply meaning. [FHWA, Federal Highway Administration; RIP, Road Inventory Program; NBIS, National Bridge Inspection Standards; FLMA, Federal Lands Management Agency; FLH, Office of Federal Lands Highway; DOTS, department of transportations; HPMS, highway performance monitoring system; NPMRDS, national performance management research data set; LiDAR, light detection and ranging; AM, asset management]
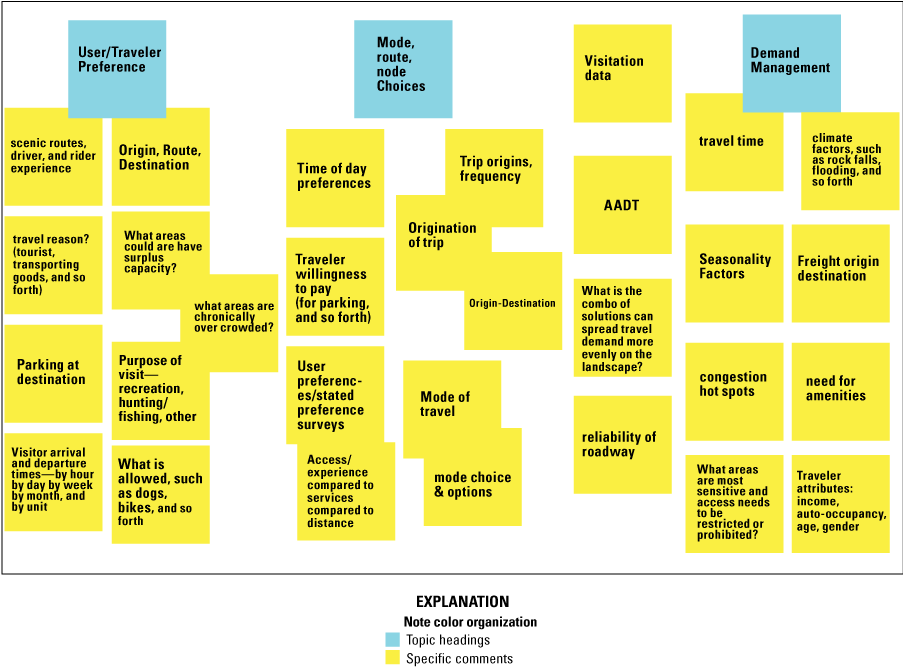
Important types of user data identified by participants of the first workshop with Federal Highway Administration staff on January 27, 2022. This figure was captured with Google Jamboard, a tool for facilitating brainstorming sessions with workshop participants. Workshop participants included Federal Lands Highway planning staff from the Federal-Aid Division Office, Resource Center Transportation Performance Management program, the Office of Asset Management, and the Office of Fright Management and Operations. Color coding of comment boxes originated as organizational tools to distinguish topic headings (blue) from specific comments (yellow). The content and formatting were modified and summarized by the authors to capture the main ideas. [AADT, average annual daily traffic]
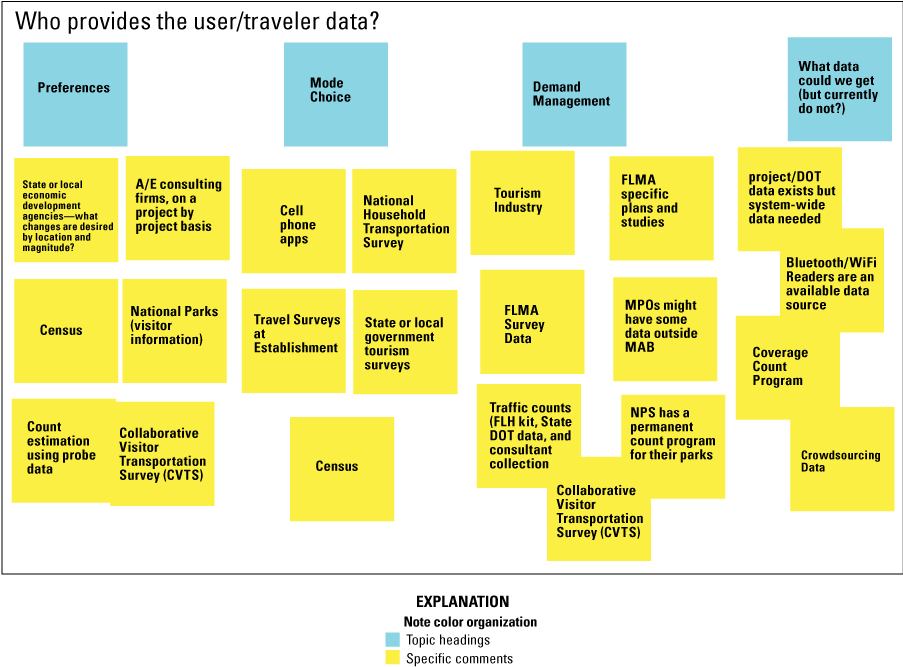
Sources of relevant user data and related information for enterprise data and planning tools identified by participants of the first workshop with Federal Highway Administration staff on January 27, 2022. This figure was captured with Google Jamboard, a tool for facilitating brainstorming sessions with workshop participants. Workshop participants included Federal Lands Highway planning staff from the Federal-Aid Division Office, Resource Center Transportation Performance Management program, the Office of Asset Management, and the Office of Fright Management and Operations. Color coding of comment boxes originated as organizational tools to distinguish topic headings (blue) from specific comments (yellow). The content and formatting were modified and summarized by the authors to capture the main ideas. Font size does not imply meaning. [A/E, architectural/engineering; FLMA, Federal Lands Management Agency; DOT, department of transportation; MPO, metropolitan planning organization; FLH, Office of Federal Lands Highway]
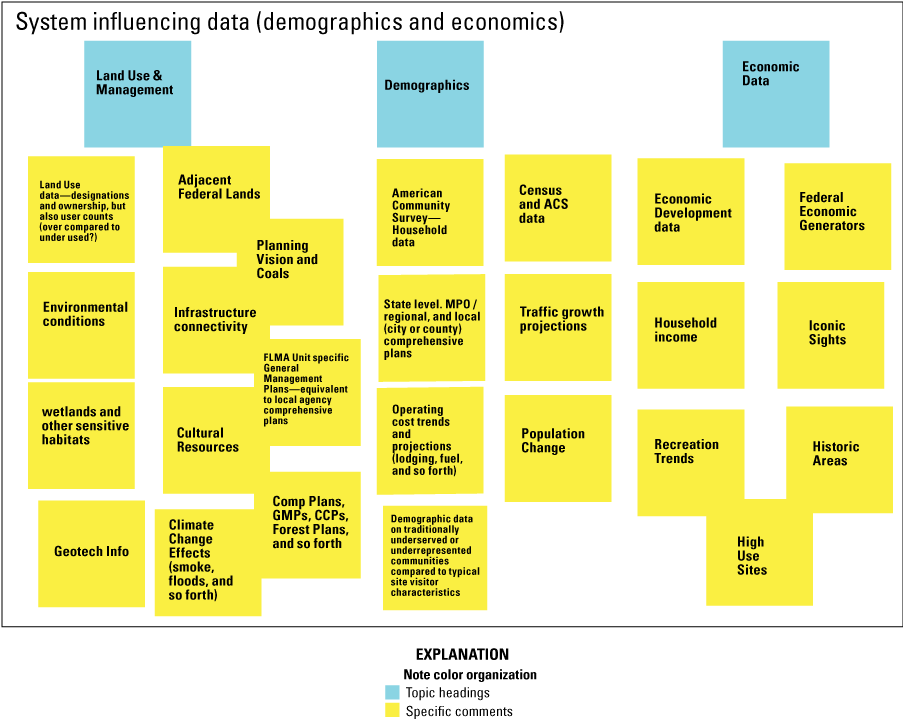
System influencing data such as including land use, integrated planning, demographic and economic information for enterprise data and planning tools identified by participants of the first workshop with Federal Highway Administration staff on January 27, 2022. This figure was captured with Google Jamboard, a tool for facilitating brainstorming sessions with workshop participants. Workshop participants included Federal Lands Highway planning staff from the Federal-Aid Division Office, Resource Center Transportation Performance Management program, the Office of Asset Management, and the Office of Fright Management and Operations. Color coding of comment boxes originated as organizational tools to distinguish topic headings (blue) from specific comments (yellow). The content and formatting were modified and summarized by the authors to capture the main ideas. Font size does not imply meaning. [ACS, American Community Survey; MPO, metropolitan planning organization; FLMA, Federal Land Management Agency; GMP, game management plans; CCP, comprehensive conservation plans; info, information]
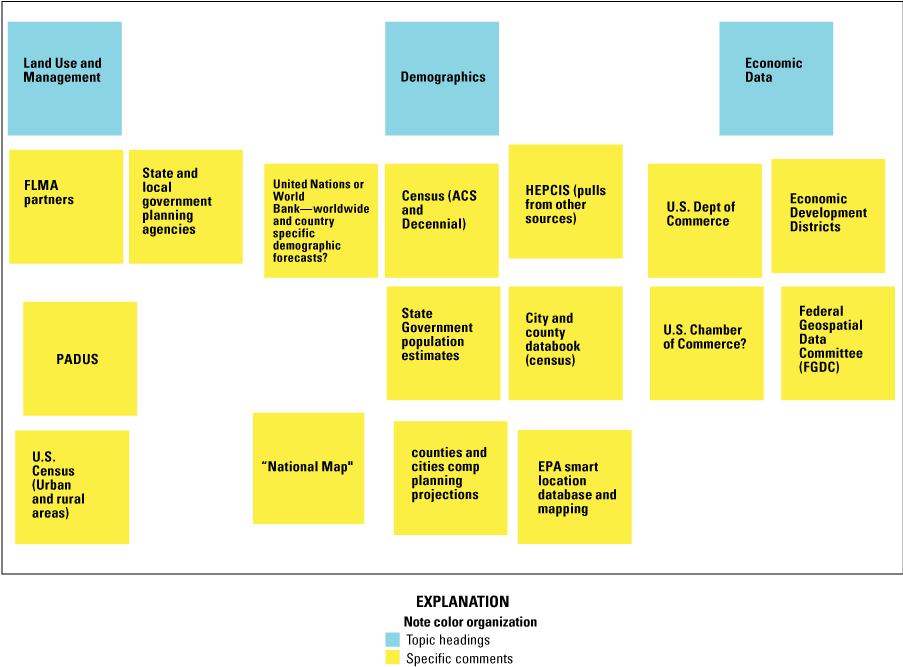
Important sources for system influencing data for enterprise data and planning tools identified by participants of the first workshop with Federal Highway Administration staff on January 27, 2022. This figure was captured with Google Jamboard, a tool for facilitating brainstorming sessions with workshop participants. Workshop participants included Federal Lands Highway planning staff from the Federal-Aid Division Office, Resource Center Transportation Performance Management program, the Office of Asset Management, and the Office of Fright Management and Operations. Color coding of comment boxes originated as organizational tools to distinguish topic headings (blue) from specific comments (yellow). The content and formatting were modified and summarized by the authors to capture the main ideas. Font size does not imply meaning. Question marks indicate items that were discussed workshop participants but did not reach consensus. [FLMA, Federal Lands Management Agency; PADUS, Protected Areas Database of the United States; ACS, American Community Survey; HEPGIS, Web-based Interactive Geographic Map Server Enhancement; US, United States; Dept., Department; EPA, U.S. Environmental Protection Agency]
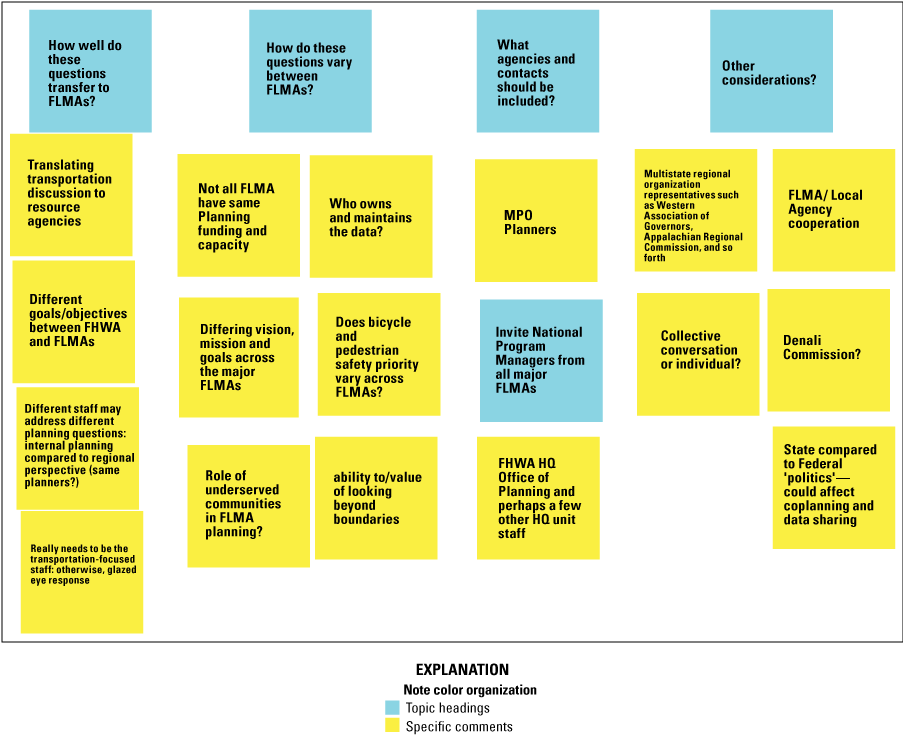
Other considerations for user perspectives on enterprise data and planning tools expressed by Office of Federal Lands Highway staff. Color coding of comment boxes originated as organizational tools to distinguish topic headings (blue) from specific comments (yellow). The content and formatting were modified and summarized by the authors to capture the main ideas. Font size does not imply meaning. [FLMA, Federal Lands Management Agency; MPO, metropolitan planning organizations; FHWA, Federal Highway Administration; HQ, headquarters]
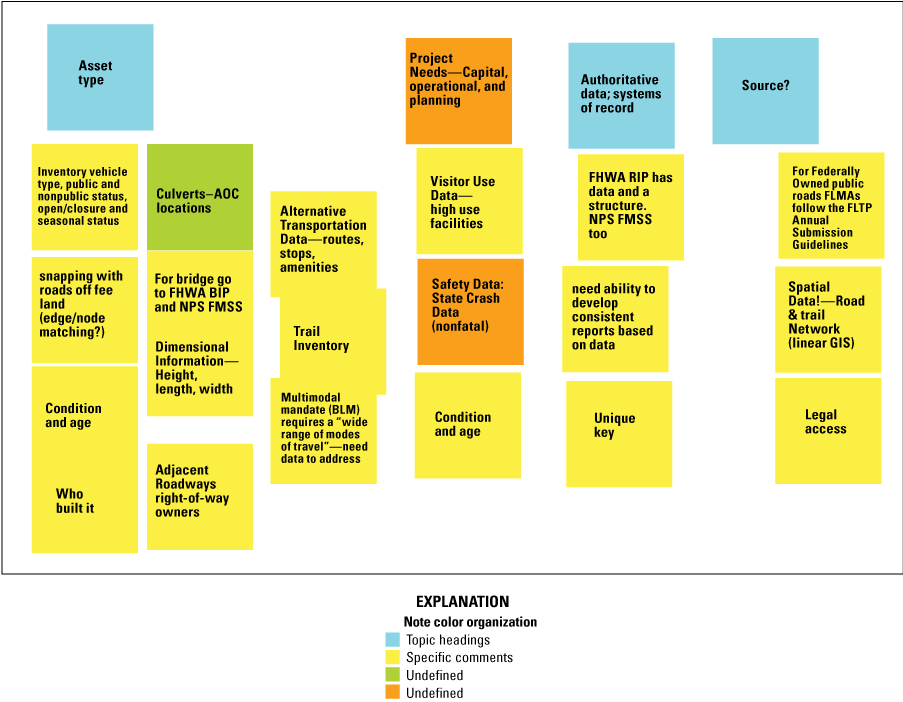
System data identified by Federal Land Management Agency partners at the second workshop with Federal Highway Administration staff on May 16, 2022. This figure was captured with Google Jamboard, a tool for facilitating brainstorming sessions with workshop participants. System data are the primary information for asset inventory and network analyses and are therefore a core component of enterprise data and planning tools. Color coding of comment boxes originated as organizational tools to distinguish topic headings (blue) from specific comments (yellow). Undefined colors indicated notes that were not defined and do not imply importance or meaning. The content and formatting were modified and summarized by the authors to capture the main ideas. Font size does not imply meaning. [AOC, aquatic organism crossing; FHWA BIP, Federal Highway Administration; Bridge Investment Program; NPS FMSS, National Park Service Facility Management Software System; info, information; BLM, Bureau of Land Management; FLTP, Federal Lands Transportation Program; FLMA RIP, Federal Lands Management Agency Road Inventory Program; FLTP, Federal Lands Transportation Program; GIS, geographic information system]
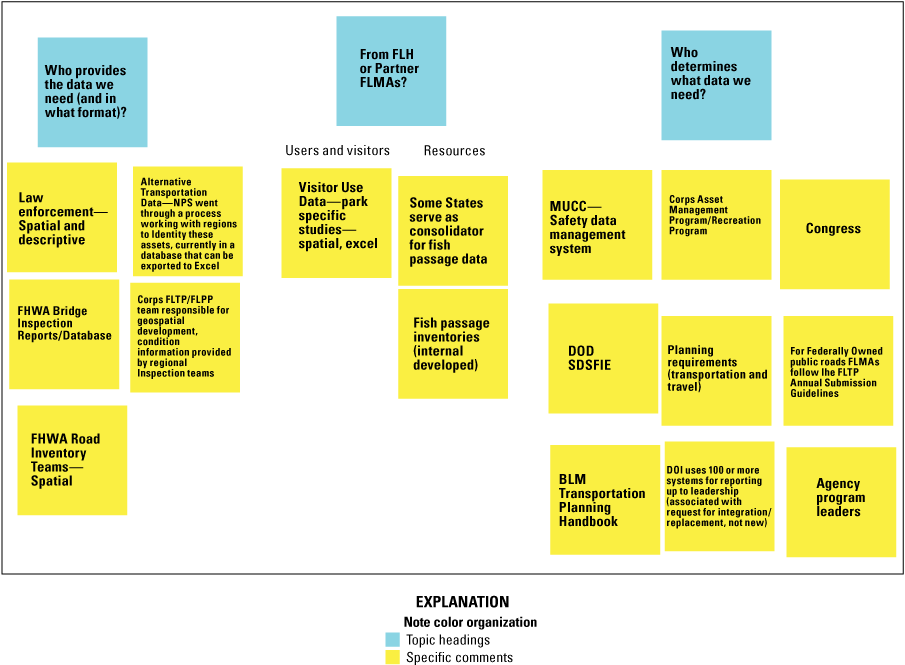
Indicators of infrastructure condition, safety, and evaluation for system data partners at the second workshop with Federal Highway Administration staff on May 16, 2022. This figure was captured with Google Jamboard, a tool for facilitating brainstorming sessions with workshop participants. Color coding of comment boxes originated as organizational tools to distinguish topic headings (blue) from specific comments (yellow). The content and formatting were modified and summarized by the authors to capture the main ideas. Font size does not imply meaning. [FHWA, Federal Highway Administration; NPS, National Park Service; Corps, U.S. Army Corps of Engineers; FLTP, Federal Lands Transportation Program; FLPP, Federal Lands Planning Program; FLH, Office of Federal Lands Highway; DOD, U.S. Department of Defense; SDSFIE, spatial data standards for facilities, infrastructure and environment; BLM, Bureau of Land Management; MUCC, minimum uniform crash criteria; DOI, U.S. Department of the Interior; FLMA, Federal Lands Management Agency]
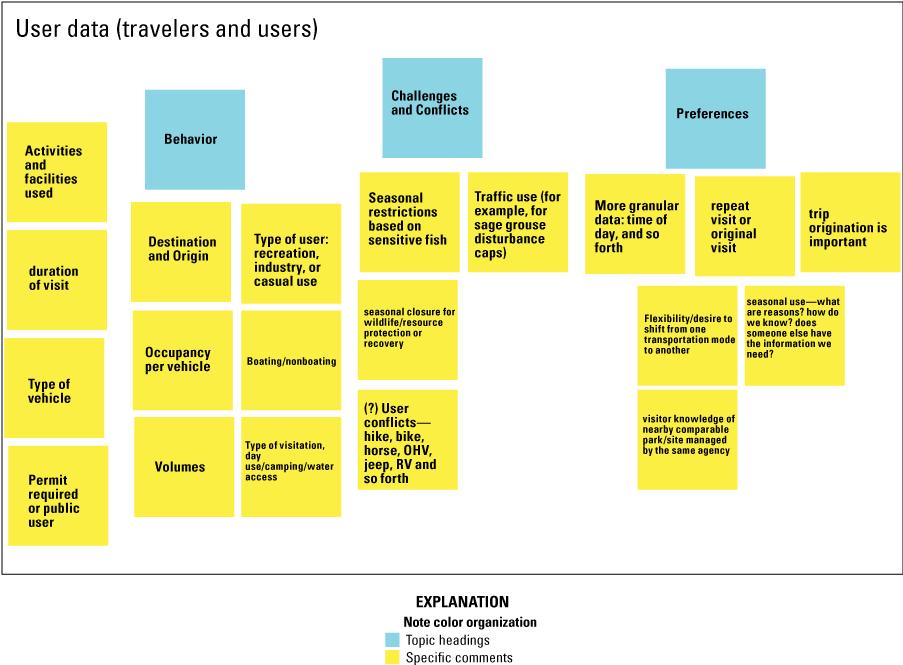
Important types of user data for enterprise data and planning tools identified by partners at the second workshop with Federal Highway Administration staff on May 16, 2022. This figure was captured with Google Jamboard, a tool for facilitating brainstorming sessions with workshop participants. Color coding of comment boxes originated as organizational tools to distinguish topic headings (blue) from specific comments (yellow). The content and formatting were modified and summarized by the authors to capture the main ideas. Font size does not imply meaning. [OHV, off highway vehicles; RV, recreational vehicle]
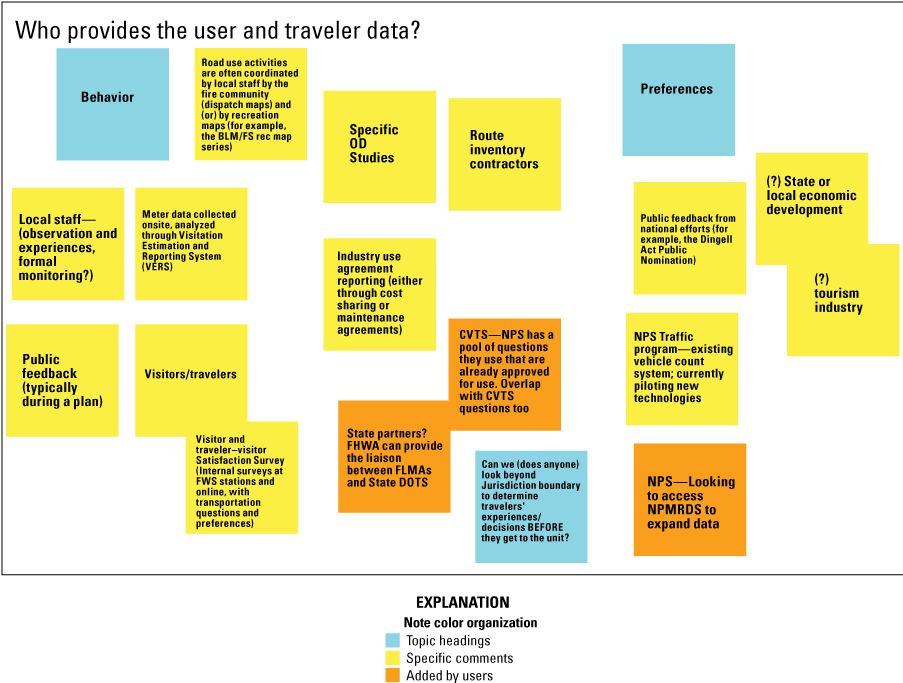
Sources of relevant user data for gathering information for enterprise data and planning tools identified by partners at the second workshop with Federal Highway Administration staff on May 16, 2022. This figure was captured with Google Jamboard, a tool for facilitating brainstorming sessions with workshop participants. Color coding of comment boxes originated as organizational tools to distinguish topic headings (blue) from specific comments (yellow) and comments added by users (orange). The content and formatting were modified and summarized by the authors to capture the main ideas. Font size does not imply meaning. [BLM, Bureau of Land Management; FS, U.S. Department of Agriculture Forest Service; FWS, U.S. Fish and Wildlife Service; OD, origin-destination; FHWA, Federal Highway Administration; DOTS; department of transportations; CVTS, collaborative visitor transportation survey; NPS, National Park Service; NPMRDS, National Performance Management Research Data Set]
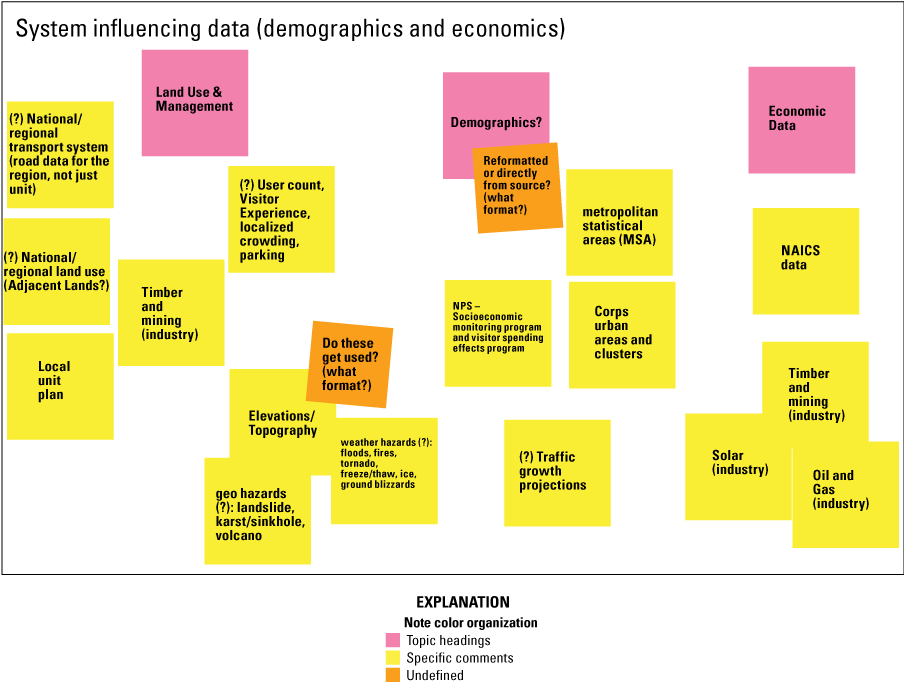
Relevant information regarding influences in system conditions and functions, including land use, integrated planning, demographic, and economic data identified by partners at the second workshop with Federal Highway Administration staff on May 16, 2022. This figure was captured with Google Jamboard, a tool for facilitating brainstorming sessions with workshop participants. Color coding of comment boxes originated as organizational tools to distinguish topic headings (pink) from specific comments (yellow) and comments added by users (orange). The content and formatting were modified and summarized by the authors to capture the main ideas. Font size does not imply meaning. [geo, geologic; NPS, National Park Service; UACE, U.S. Army Corps of Engineers; NAICS, North American Industry Classification System]
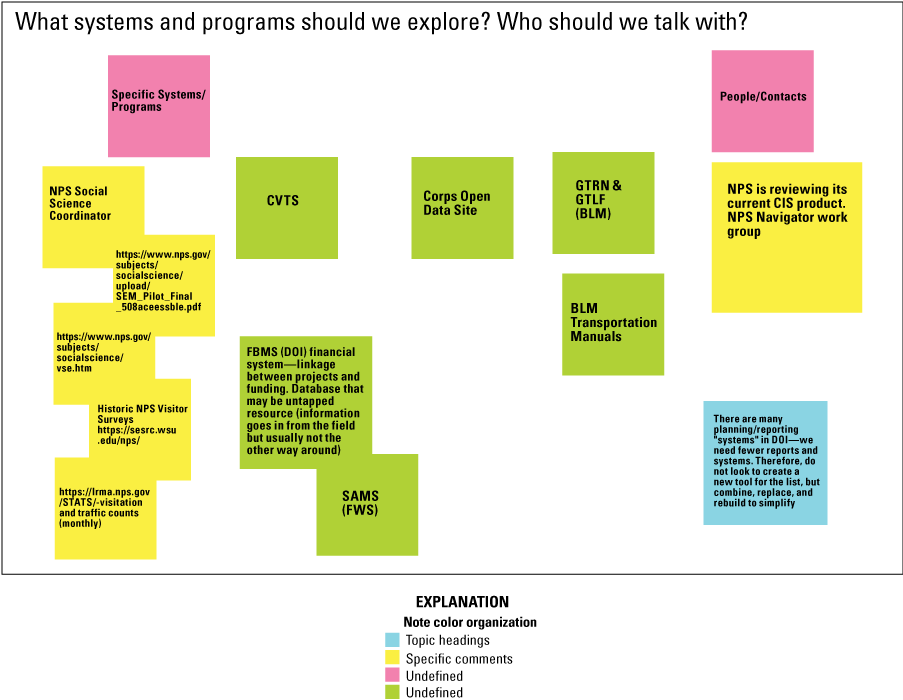
Existing programs and systems recommended by Federal Land Management Agency partners for consideration as contributors to enterprise data and planning tools. Color coding of comment boxes originated as organizational tools to distinguish topic headings (blue) from specific comments (yellow) and comments added by users (green). Undeclared colors indicated notes that were not defined and do not imply importance or meaning. The content and formatting were modified and summarized by the authors to capture the main ideas. Font size does not imply meaning. [NPS, National Park Service; FBMS, Financial and Business Management System; DOI, U.S. Department of the Interior; SAMS, system for award management; USFWS, U.S. Fish and Wildlife Service; USACE, U.S. Army Corps of Engineers; GTRN, ground transportation road network; GTLF, ground transportation linear feature; BLM, Bureau of Land Management; CVTS, collaborative visitor transportation survey; GIS, geographic information system; FHWA, Federal Highway Administration]
Table 2.1.
Summary of data-access systems and interaction tools from agencies, States, and private enterprises that may inform transportation planning.[Summaries of information from four States are provided as examples. Other State databases and data services exist with similar formats and functions as the ones represented here. The Representational State Transfer Application Programming Interface (REST API) conforms to REST style, allowing interaction among compatible software. GeoRSS is a lightweight community driven really simple syndication (RSS) feed for data transfer with geolocation services. FRAGMENT is a link, a section of links, or HTML content in a particular location in web interface. Data Catalog Vocabulary (DCAT) is designed to facilitation interaction between data catalogues and web display. ArcSDE is a spatial database engine provided by Esri for geographic information system (GIS) applications. Simple Object Access Protocol (SOAP) exchanges messages between systems and applications. InfoUSA is a private data service used to display geographic data. General transit feed specification (GTFS) is an open data standard used to distribute user information. NAVSTREETS is a suite of data products with street attributes from NavTeq, Navigation Technologies. Some rows represent multiple tools or datasets available from a given entity. ECOS, Environmental Conservation Online System; FWS, U.S. Fish and Wildlife Service; HTML, hypertext markup language; JSON, java script object notation; XML, extensible markup language; CSV, comma separated values; AOI, area of interest; ServCat, Service Catalog; SIMS, Asset Information Management System; IRMA, Integrated Resource Management Application; NPS, National Park Service; BLM, Bureau of Land Management; ATOM; Atom Publishing Protocol; KML, keyhole markup language; NEPA, National Environmental Policy Act; Corps, U.S. Army Corps of Engineers; NACCS, North Atlantic Coast Comprehensive Study; RISE, Reclamation Information Sharing Environment; Reclamation, Bureau of Reclamation; RWIS, Reclamation Water Information System; WWIN, Western Water Information Network; FIRM, Foundation Information Real Property Management; FS, U.S. Department of Agriculture Forest Service; RAVG, random access vector graphics; GTAC, Geospatial Technology and Applications Center; NA, not applicable; FHWA, Federal Highway Administration; OGC, open geospatial consortium; WMS, web map service; WFS, web feature service; NHPN, National Highway Performance Network; HPMS, Highway Performance Management System; NPMRDS, National Performance Management Research Datasets; NBI, National Bridge Inventory; LTBP, Long-term Bridge Performance; FAF, Freight Analysis Framework; FGDC, Federal Geographic Data Committee; EPA, U.S. Environmental Protection Agency; LEHD, longitudinal employer household dynamics; TED, Transportation Enterprise Database; NA, not applicable]
| Tool or project name | Entity | Technology | Planning environment | Adaptable to integrated planning? | Possible barriers to integration | URL |
|---|---|---|---|---|---|---|
| ECOS | FWS | Options include ArcGIS feature and Tile Service with REST API: HTML, JSON, XML, CSV options. Map viewer, and defining AOI | Multiple formats including static reports, tabular database, map view, and spatial data services such as AOI selection. Also includes landing page directs. | Yes. ECOS is designed to inform planning and has a database structure with multiple user interfaces, custom AOI, workflow options for users, and select and report. | Interaction with outside data and security and permissions | https://ecos.fws.gov/ecp/ |
| ServCat and SIMS | FWS | Unknown database | Internal access for data specific to land use, conservation, and transportation management and planning. | Unknown | Internal and agency specific | Not published or posted |
| IRMA | NPS | REST API, JSON, Map services, and Unit services | Reports, data, geospatial data, and species lists | Yes. IRMA is a planning tool and has a primary function to seek and download data. | Tool integration and geospatial processing | https://irma.nps.gov/Portal/ |
| Navigator | NPS | REST API, JSON, Map services, Unit services | Road and transit focus, segments links | Yes. Navigator is a road-trail-transit tool with a PATHWEB video link. | Tool integration and geospatial processing | https://navigator.nps.gov/ |
| ParkAtlas | NPS | REST API, JSON, Map services, Unit services | Interactive web-mapping, data access | Yes | Tool integration and geospatial processing | https://park-atlas-public-nps.opendata.arcgis.com/ |
| Innovative and Sustainable Transportation Evaluation Process (INSTEP) | NPS | Planning criteria and context | Planning steps with context, natural resources, cultural resources, visitor experience, energy and climate change, materials and construction, and innovation. | Yes. INSTEP would likely need to be translated for other organizations. | Internal, agency specific, and nonspatial data | https://www.nps.gov/articles/transinstep.htm |
| Geospatial Business Platform HUB | BLM | ArcGIS Hub includes web maps and applications. Uses REST API with GEORSS, ATOM, HTML, FRAGMENT, KML, JSON, DCAT, and CSV. | Multiple platforms, not integrated. Map viewer with data exploration, search tool, landing page gives structure. | Yes. Reporting is notable. Also includes data download. ePlanning addresses NEPA review and comments. | Agency specific | https://gbp-blm-egis.hub.arcgis.com/ |
| Landscape Approach Data Portal and ePlanning | BLM | ArcGIS Hub includes web maps and applications. Uses REST API with GEORSS, ATOM, HTML, FRAGMENT, KML, JSON, DCAT, and CSV. | Multiple platforms that are not integrated. | Yes. ePlanning addresses NEPA review and comments. | Agency specific | ttps://www.blm.gov/services/geospatial |
| Ground Transportation Road Network (GTRN) | BLM | ArcSDE geodatabase | Centralized, internal-access server, downloads ensure static versions, and managed by State offices. | Some useful layer files for administrative, boundaries, and climate datasets. Logical groups of corporate data. | Internal. Organized by State and complex structure with logical groups, subsets, and multiple layer files. | Not publicly available but referenced in workshop. Dataset name is 'GTRN_PUB_ROADS_ARC' |
| Corps Geospatial Open Data | Corps | ArcGIS Hub, web maps and applications API JSON | Map Viewer with extensive data for download. Datasets include national inventory dams, navigation features, wetland delineation, military property, civil works and water management. | Yes. Interactive viewer but no interactive functions. Includes NACCS exposure analysis, risk analysis, future mean sea-level inundation mapping and housing-density projections. | Security and update and data maintenance | https://geospatial-usace.opendata.arcgis.com/ |
| RISE, RWIS, and Open Water Data Program | Reclamation | ArcGIS Hub, Web AppBuilder for ArcGIS 2.16, API JSON | Reclamation open data systems for viewing, accessing, and downloading Reclamation's water and water-related data catalog and map viewer. | Useful functions including landing page, interactive viewer to navigate facilities and features, but does not include interactive functions. | Point locations | https://data.usbr.gov/, https://data.cnra.ca.gov/dataset/reclamation-water-information-system-rwis, |
| Reclamation GIS | Reclamation | Unknown | Enterprise GIS. Includes information from WWIN FIRM and DataSpace. | Some useful functions are included. Internal GIS system with centralized data. | Internal and not publicly available data. | Not published or posted |
| GTAC Geospatial Data Discovery Tool | FS | ArcGIS Service, REST API including SOAP, GeoSitemap, ArcGIS Hub, map services, and download capability. | Query tool in RAVG links to ArcGIS online map viewer for data query. | Yes. Abundant data—ArcGIS Online, searchable list of FS published datasets. Includes map viewer (custom AOI) and map services (query and view). | Data location (point) compared to spatially explicit data | https://www.fs.usda.gov/about-agency/gtac |
| FS Geodata Clearinghouse | FS | ArcGIS Service, REST API including SOAP, GeoSitemap, ArcGIS Hub, map services, and download capability. | Query tool in RAVG links to ArcGIS online map viewer for data query. | Yes. Abundant data—ArcGIS Online, searchable list of FS published datasets. Includes map viewer (custom AOI) and map services (query and view). | Data location (point) compared to spatially explicit data | https://data.fs.usda.gov/geodata/ |
| Natural Resource Information System (NRIS) | FS | Map services, tabular data, and applications | NA | Useful functions. Maintained applications designed to comply with laws, regulations, and policy. | Internal and includes firewall. Distribution of data | https://www.fs.usda.gov/detail/r8/landmanagement/resourcemanagement/?cid=stelprdb5291719#main_content |
| NHPN and HPMS | FHWA | Data view and data download options andincludes API, OGC WMS and WFS, GeoService, and GeoJSON. | Data for download, map viewer without data processing. Includes the NPMRDS. | Abundant data | Firewall, security, distribution of data | Not published or posted |
| NBI | FHWA | Data view and data download options and includes API, OGC WMS and WFS, GeoService, and GeoJSON. | Data for download with map viewer. No data processing | Abundant data | Firewall, security, distribution of data | https://www.fhwa.dot.gov/bridge/nbi.cfm |
| LTBP | FHWA | Data view and data download options and includes API, OGC WMS and WFS, GeoService, and GeoJSON. | Data for download with map viewer. No data processing | Abundant data | Firewall, security, distribution of data | https://data-usdot.opendata.arcgis.com/datasets/usdot::national-bridge-inventory/ |
| FAF | FHWA | Data view and data download options and includes API, OGC WMS and WFS, GeoService, and GeoJSON. | Data for download with map viewer. No data processing | NA | Nonspatial data | https://ops.fhwa.dot.gov/freight/freight_analysis/faf/ |
| PlanWorks | FHWA | Planning guidance, aspatial format | Planning guidance | Includes guidance and examples and can inform development and post for users. | Nonspatial data | https://fhwaapps.fhwa.dot.gov/planworks/Applications/Show/land-use |
| GeoPlatform | FGDC | Planning guidance, aspatial format | Resources and references | Not likely, but a good resource for methods and data distribution. | Metadata records harvested in GeoPlatform.gov provide references or links. | https://www.geoplatform.gov/, https://www.fgdc.gov/initiatives/geospatial-platform |
| Smart Location Database | EPA | Data portal, harvesting geospatial records from data.gov | Includes data download, web services, interactive viewer, and no data processing. | Yes, data source—LEHD, InfoUSA, NAVSTREETS, GTFS data, Center for Transit Oriented Development, American Community Survey, National Household Travel Survey, National Transit Database, and National Cancer Institute. | Preprocessed and static data at coarse resolution | https://www.epa.gov/smartgrowth/smart-location-mapping |
| StreetLight | Private enterprise | Cell phone monitoring and multimodal transportation metrics | Location, mobility, and integration data—travel time, traffic counts, origin-destination. Also includes foot traffic and congestion | No. Contracts with municipal governments and uses cellular data. Includes freight optimization, spending priority, bike and pedestrian use, and underserved areas. | Cost, security, longevity | https://www.streetlightdata.com |
| Urban SDK | Private enterprise | Cellular phone monitoring and multimodal transportation metrics | Location, mobility, and integration data including travel time, traffic counts, crashes, origin-destination. May also include emissions, foot traffic and congestion. | No. Collaborative or hired data supplier uses cellular networks information multimodal, congestion, crashes, origin-destination, speed, hourly flux | Cost, security, longevity | https://www.urbansdk.com |
| DataMart | Kentucky | TED | Data available for access and download and includes dashboards. | Dashboard format is useful with interactive map display and includes several useful user functions. | Limited to State boundary and is not analytical. | https://datamart.kytc.ky.gov/ |
| Colorado Department of Transportation (CDOT) Open Data | Connecticut | ArcGIS Hub with full suite of API formats. Also includes ArcGIS and Google map applications with street view data. | Open data for public and internal use (many States with similar data), data, documents, applications and maps, catalog with distribution of existing data and reports. May not generate new products and processing. | Yes. Dashboard formats are useful with interactive map display and common formats. | Limited to State boundary and is not analytical. | https://connecticut-ctdot.opendata.arcgis.com/ |
| COtrip | Colorado | ArcGIS Hub with full suite of API formats. Also includes ArcGIS and Google map applications with street view data. | Open data for public and internal use. Many States have similar data. Includes documents, applications, map catalog, anddistribution of existing data and reports. This program does not generate new products and or process data. | Yes. Open data facilitates cointegration and is interactive with real-time information and frequent updates. Also includes combination of user and planner content. | Limited to State boundary and is not analytical. Primarily for consumer of integrated data. | https://data-cdot.opendata.arcgis.com/ |
| Mississippi Geospatial Data Catalog | Mississippi | Catalog with ArcGIS Hub | Open data for public and internal use, with data for access and download. Also includes user applications. | Not likely. Data source with search and download | Limited to State boundary and is not analytical. Primarily for consumer of integrated data. | https://opendata.gis.ms.gov/ |
Table 2.2.
A summary of the data types identified by spatial data managers to maintain and serve within an enterprise data-service platform.[Different data types provide differing levels of technical content and service. Information was compiled from the two Federal Highway Administration Office of Federal Lands Highway workshops in 2022]
Abbreviations
API
application programming interface
AEGIST
Applications of Enterprise GIS for Transportation
BLM
Bureau of Land Management
Corps
U.S. Army Corps of Engineers
DOI
U.S. Department of the Interior
DOT
U.S. Department of Transportation
ECOS
Environmental Conservation Online System
EPA
U.S. Environmental Protection Agency
FLH
Office of Federal Lands Highway
FHWA
Federal Highway Administration
FLMA
Federal Land Management Agency
FLTP
Federal Lands Transportation Program
FLAP
Federal Lands Access Program
FS
U.S. Department of Agriculture Forest Service
FWS
U.S. Fish and Wildlife Service
GIS
geographic information system
GUI
graphical user interface
INSTEP
Innovative and Sustainable Transportation Evaluation Process
LRTP
Long-Range Transportation Plans
MPO
metropolitan planning organization
MSP
Managed Service Platform
NEPA
National Environmental Policy Act
NPS
National Park Service
Reclamation
Bureau of Reclamation
REST API
Representational State Transfer Application Programming Interface
USGS
U.S. Geological Survey
Publishing support provided by the Science Publishing Network, Denver Publishing Service Center
For more information concerning the research in this report, contact the Director, USGS Fort Collins Science Center
2150 Centre Ave., Bldg. C
Fort Collins, CO 80526-8118
(970) 226-9100
Or visit the Fort Collins Science Center website at:
Disclaimers
Any use of trade, firm, or product names is for descriptive purposes only and does not imply endorsement by the U.S. Government.
Although this information product, for the most part, is in the public domain, it also may contain copyrighted materials as noted in the text. Permission to reproduce copyrighted items must be secured from the copyright owner.
Suggested Citation
Manier, D., Grisham, N., Armstrong, A., Henley, E., Doolittle, J., and Inman, R., 2024, Identifying transportation data and system needs for a Federal lands transportation data platform: U.S. Geological Survey Open-File Report 2024–1038, 37 p., https://doi.org/10.3133/ofr20241038.
ISSN: 2331-1258 (online)
| Publication type | Report |
|---|---|
| Publication Subtype | USGS Numbered Series |
| Title | Identifying transportation data and system needs for a Federal lands transportation data platform |
| Series title | Open-File Report |
| Series number | 2024-1038 |
| DOI | 10.3133/ofr20241038 |
| Publication Date | July 31, 2024 |
| Year Published | 2024 |
| Language | English |
| Publisher | U.S. Geological Survey |
| Publisher location | Reston VA |
| Contributing office(s) | Fort Collins Science Center |
| Description | vi, 37 p. |
| Online Only (Y/N) | Y |