

Dissolved Oxygen Monitoring on the Souris River, 2019–23
Links
- Document: Report (3.5 MB pdf) , HTML , XML
- Dataset: USGS National Water Information System database - USGS water data for the Nation
- NGMDB Index Page: National Geologic Map Database Index Page (html)
- Download citation as: RIS | Dublin Core
Abstract
The U.S. Geological Survey (USGS) in partnership with the International Joint Commission installed and operated continuous water-quality monitors at three sites on the Souris River from May 2019 to October 2023. Continuously recorded data included dissolved oxygen (DO), water temperature, and specific conductance at the Souris River near Sherwood, North Dakota (USGS station 05114000), Souris River above Minot, N. Dak. (USGS station 05117500), and Souris River near Westhope, N. Dak (USGS station 05124000). The three sites on the Souris River were chosen for additional DO monitoring because they provided the best opportunity to capture potential effects on DO in areas downstream from major flow control structures and because identifying the connection of streamflow to DO at the international border is a focus of the International Souris River Board (ISRB).
The continuous water-quality monitoring at three sites on the Souris River from May 16, 2019, to October 1, 2023, indicated different patterns in DO among the three sites, and the different patterns indicate different factors affect DO concentrations among the sites. DO concentrations near Sherwood indicated the strong effect of algal dynamics at lower streamflow conditions with large diurnal fluctuations in DO concentration and indicated that streamflow does seem to affect DO concentrations when the streamflow is greater than about 100 cubic feet per second. DO concentrations were also frequently less than the water-quality objective (WQO) of 5 milligrams per liter in the summer and winter months, particularly during relatively low streamflow conditions in 2020 and 2021. DO concentrations above Minot had a different pattern with considerably fewer diurnal fluctuations than near Sherwood, high DO concentrations most winters except for the winter of 2021–22, and fewer instances when the DO was less than the WQO compared to Sherwood. The pattern of DO concentrations near Westhope seemed to be mainly influenced by the water chemistry coming out of J. Clark Salyer Pool 357 rather than streamflow and channel conditions at the site. The Westhope site also had the most days with daily minimum DO concentrations less than the WQO among the three sites, mainly in the winter when concentrations were consistently at or near 0 milligrams per liter for most of the winter months.
Introduction
As identified in the Operating Plan of the 1989 International Agreement for Water Supply and Flood Control in the Souris River Basin (basin), the International Souris River Board (ISRB) is responsible for ensuring compliance with flow apportionment and water-quality objectives (WQOs) adopted by Canada and the United States. Dissolved oxygen (DO) is of critical importance for aquatic life. Low DO concentrations can affect aquatic biota resulting in fish kills and can cause the release of certain constituents from the bed sediment to the water column, such as phosphate, iron, and manganese (Hem, 1985). The current WQO for DO, established by the ISRB at the international border in the Souris River, is a minimum of 5 milligrams per liter (mg/L; International Joint Commission, 2017). From historical discrete water-quality samples, DO concentrations have periodically been less than the WQO, especially during periods of lower streamflow, such as during winter months (December, January, and February; U.S. Geological Survey, 2023). Over the last 20 years, several fish kills have also been reported in the spring (March–May) after ice breakup, as well as in the summer (June–August) during periods of stagnation (Scott Gangl, North Dakota Game and Fish Department, written commun., 2023). In recent years starting in about 1970, under wetter climate conditions (Kolars and others, 2016), the Souris River has experienced relatively higher streamflow with correspondingly fewer occurrences of low DO concentrations (U.S. Geological Survey, 2023).
Drier climate conditions are expected in the future that will result in lower streamflow (Kolars and others, 2016). Also, the Aquatic Ecosystem Health Committee of the ISRB determined that critical information on DO concentrations was lacking for the Souris River and additional monitoring could help inform reservoir operation decisions and future evaluations of DO objectives. In response, the U.S. Geological Survey (USGS), in cooperation with the International Joint Commission, installed and operated continuous water-quality monitors at three sites on the Souris River from May 2019 to October 2023.
Discrete measurements collected as part of the current ISRB monitoring plan give a measure of the conditions in the river at a single point in time. DO can fluctuate greatly throughout a 24-hour period, with higher values in the afternoon to very low values during the night to early morning, particularly in the summer months when algal and plant activity affects stream DO. The discrete measurements can document if a drop in DO happened on the date the measurement was made, but does not give information on the duration of the drop or the stream conditions leading up to it. The continuous water-quality monitors were near real-time and collected measurements every 15 minutes to provide detailed information, such as diurnal changes in DO and how DO changes daily, weekly, and monthly throughout the year.
The Souris River is a complex system with multiple large and small impoundments throughout the basin. Although discrete DO samples can provide an indication of unhealthy stream conditions for aquatic life, they are not able to provide a complete picture of the duration and magnitude of potentially detrimental conditions. The continuous monitoring provides necessary data to determine the severity of any DO impairment on a 24-hour cycle, as well as site specific patterns that will provide a better understanding of factors contributing to the impairment.
Purpose and Scope
The purpose of this report is to describe the continuously recorded water-quality data at three sites on the Souris River from May 2019 to October 2023. Continuously recorded data included streamflow, DO, water temperature, and specific conductance. Data were recorded at the Souris River near Sherwood, North Dakota (USGS station 05114000), Souris River above Minot, N. Dak. (USGS station 05117500), and Souris River near Westhope, N. Dak (USGS station 05124000; fig. 1; U.S. Geological Survey, 2023). Water-quality monitoring locations were selected to represent the conditions at the international border (sites near Sherwood and near Westhope) and an intervening site (site above Minot). Discrete samples were collected at the international border sites and compared to the WQOs established by the ISRB.
Methods
Continuous water-quality monitors were operated at three locations on the Souris River (fig. 1). Water-quality monitors were installed at the three sites on May 15–16, 2019, and were operated until October 1, 2023. Monitors were equipped with sensors to measure DO, water temperature, and specific conductance every 15 minutes. The instruments were linked to the existing streamgage data-collection platforms that transmit data hourly through satellite or cellular telemetry.
The continuous monitors were maintained and calibrated, and the data were processed using methods described in Wagner and others (2006). The sites were visited about every 4 weeks for cleaning and calibration checks, unless a visit was done close to a previous visit, in which case only cleanings were made. During winter months and under ice conditions at the sites, only field meter checks to the monitors were done. At each site, monitors were removed for periods in late fall to allow ice to form and to prevent freezing conditions that could possibly damage the sensors. Once ice was formed for the winter season, the sensors were safely reinstalled under the ice. In March, the sensors were removed right before ice breakup to prevent any possible damage to the sensors and then reinstalled once the ice was cleared in the channel. All continuously recorded data can be accessed at U.S. Geological Survey (2023) using the station numbers provided in the “Purpose and Scope” section.
Streamflow data are critical for understanding water-quality conditions. Stream stage was measured continuously at the three sites (fig. 1). The continuous stage data were used with instantaneous streamflow measurements to develop stage-discharge rating curves to compute continuous streamflow using methods described in Rantz and others (1982). Data for stream stage and streamflow can be accessed at U.S. Geological Survey (2023) using the station numbers provided in the “Purpose and Scope” section.
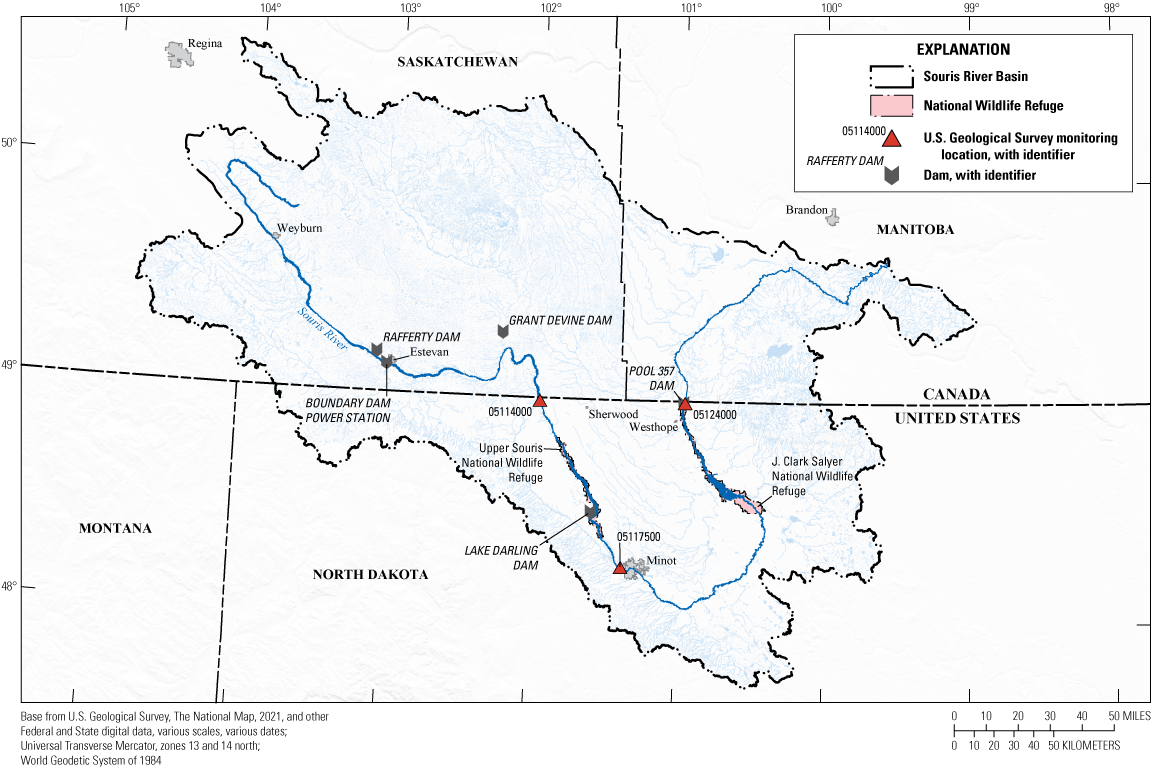
Locations of three monitoring sites on the Souris River.
Continuous Water Quality in the Souris River 2019–23
The three sites on the Souris River were chosen for additional DO monitoring because they provided the best opportunity to capture potential influences on DO in areas downstream from major flow control structures and because identifying the connection of streamflow to DO at the international border is a focus of the ISRB. The Souris River near Sherwood, N. Dak. (USGS station 05114000) is downstream from Saskatchewan reservoirs Rafferty, Boundary, and Grant Devine (fig. 1). These reservoirs are operated to ensure a reliable water source for municipal, domestic, irrigation, and recreational use in Saskatchewan, as well as provide flood control for Saskatchewan and North Dakota. The Souris River above Minot, N. Dak. (USGS station 05117500) is downstream from Lake Darling, a reservoir on the Upper Souris National Wildlife Refuge. The Souris River near Westhope, N.Dak (USGS station 05124000) is downstream from J. Clark Salyer National Wildlife Refuge, which contains a series of water control structures and wetlands. The Upper Souris and J. Clark Salyer are managed and operated by the U.S. Fish and Wildlife Service for wildlife habitat and flood control. All three sites are locations where fish kills have been observed in the past (Scott Gangl, North Dakota Game and Fish Department, written commun., 2023). This section describes the streamflow and DO conditions at the three sites from May 16, 2019, to October 1, 2023. Although water temperature and specific conductance were recorded at the three sites, they are not discussed in this section and are presented in figures only for comparison to the DO and streamflow conditions.
Souris River near Sherwood, N. Dak
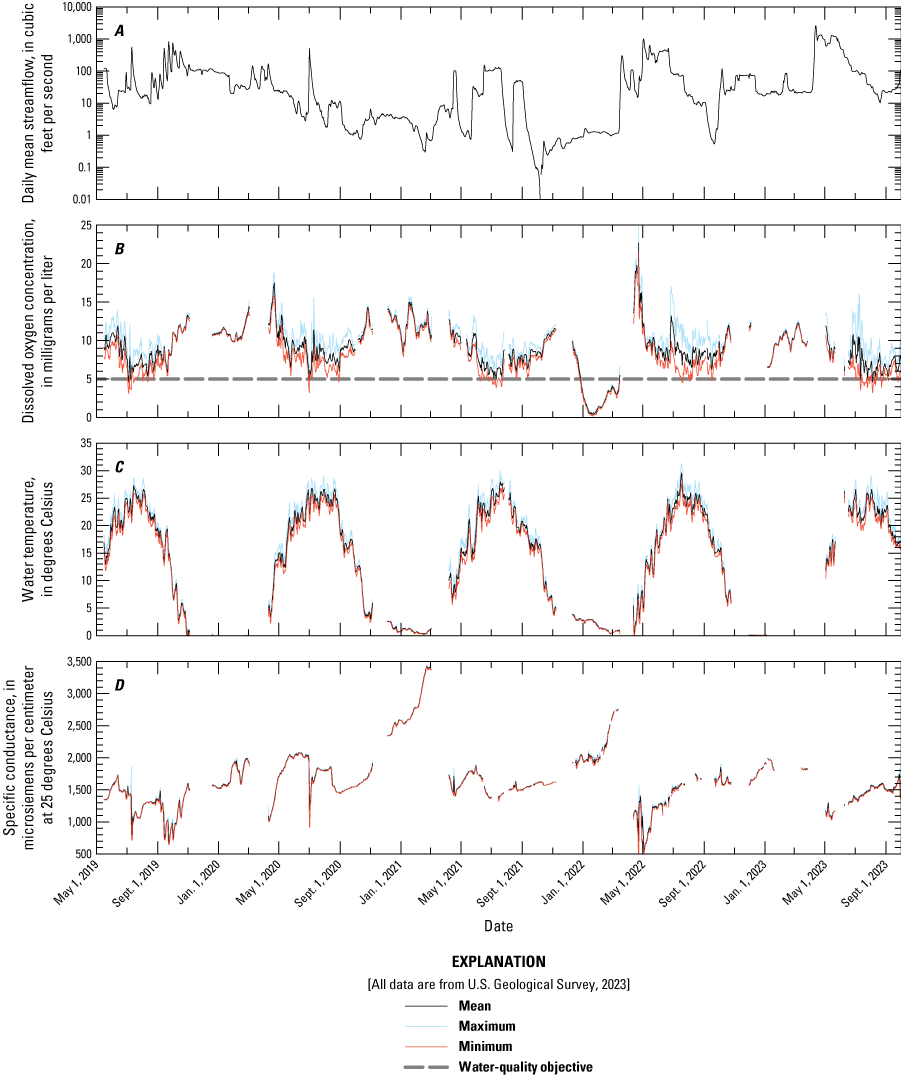
Variability in water-quality conditions is often dependent on streamflow conditions at a site. The streamflow at the Sherwood site from May 16, 2019, to October 1, 2023, was extremely variable with mean daily streamflow ranging from 8.7 cubic feet per second (ft3/s) in 2021 to 149 ft3/s in 2023 (table 1; U.S. Geological Survey, 2023). In 2021 and 2022, daily mean streamflow was often less than 1 ft3/s, particularly in the winter months (fig. 2). Among the 5 years of monitoring, streamflow was the greatest in 2022 and 2023, particularly in the spring. Daily mean streamflow ranged from 3.1 to 111 ft3/s in 2019 (May–December), and from 1.4 to 151 ft3/s in 2020 (fig. 2). In comparison, daily mean streamflow ranged from 0 to 222 ft3/s in 2021, 0 to 1,070 ft3/s in 2022, and 0.5 to 1,590 ft3/s in 2023 (January to October; fig. 2).
The solubility of DO is affected by several factors including water temperature and atmospheric pressure: it increases with decreasing water temperature, decreases with increasing water temperature, increases with increasing atmospheric pressure, and decreases with decreasing atmospheric pressure (Hem, 1985). DO is also important in chemical reactions in water and in the life cycles of aquatic organisms (Hem, 1985). Sources of DO in surface waters primarily are atmospheric reaeration and photosynthetic activity of aquatic plants. DO is consumed by the respiration of aquatic plants, ammonia nitrification, and the decomposition of organic matter in a stream (Hem, 1985).
DO concentrations measured near Sherwood were highly variable from May 16, 2019, to October 1, 2023. In particular, diurnal fluctuations (changes in DO in a 24-hour cycle), were observed in the summer months in 2020 and 2021when streamflow was less than about 10 ft3/s (fig. 2). Diurnal fluctuations were relatively diminished in the summers in 2022 and 2023 when streamflow was higher compared to the other years. DO concentrations ranged from 0.6 to 18.4 mg/L in 2020 and from 0 to 29.2 mg/L in 2021 (table 1 and fig. 2). In comparison, DO concentrations ranged from 4.3 to 19.5 mg/L in 2022 and from 4.8 to 11.7 mg/L in 2023. The lowest minimum DO concentrations generally were in the summer and winter months, although DO was not measured in most of the winter months near Sherwood because of extreme low streamflow conditions that resulted in a lack of water in channel to support the operation of the sensor. The highest daily maximum DO concentrations were also recorded in the summer months, likely because of algal photosynthesis that can increase DO in the channel during the day (Hem 1985). The highest daily mean values often were in the spring (March–May) and fall (September–November) when water temperatures were colder, algal growth is reduced, and streamflow is somewhat higher compared to other times of the year. Missing data in the continuous record in the late fall and early spring in each year was from the normal operation of removing the sensor while ice formed in the channel and removal of the sensor before ice breakup to prevent damage to sensors.
The daily minimum DO concentrations often were less than the WQO of 5 mg/L, particularly in the summer and winter in 2020 and 2021. However, DO was not measured in most of the winter periods except for 2019 because of low streamflow conditions (less than 1 ft3/s) that resulted in a lack of water in the channel to support the operation of the sensor. The daily minimum DO was less than the WQO for 47 days in 2019, 142 days in 2020, 124 days in 2021, 12 days in 2022, and only 1 day in 2023 (table 1 and fig. 2). The daily mean DO was less than the WQO for 50 days in 2020 and 25 days in 2021 (table 1).
Table 1.
Summary of streamflow and dissolved oxygen concentrations from the Souris River near Sherwood, North Dakota (U.S. Geological Survey station 05114000), Souris River above Minot, N. Dak (U.S. Geological Survey station 05117500), and Souris River near Westhope, N. Dak. (U.S. Geological Survey station 05124000), May 16, 2019, to October 1, 2023. Data summarized from U.S. Geological Survey, 2023.[DO, dissolved oxygen; concen., concentration; WQO, water-quality objective]
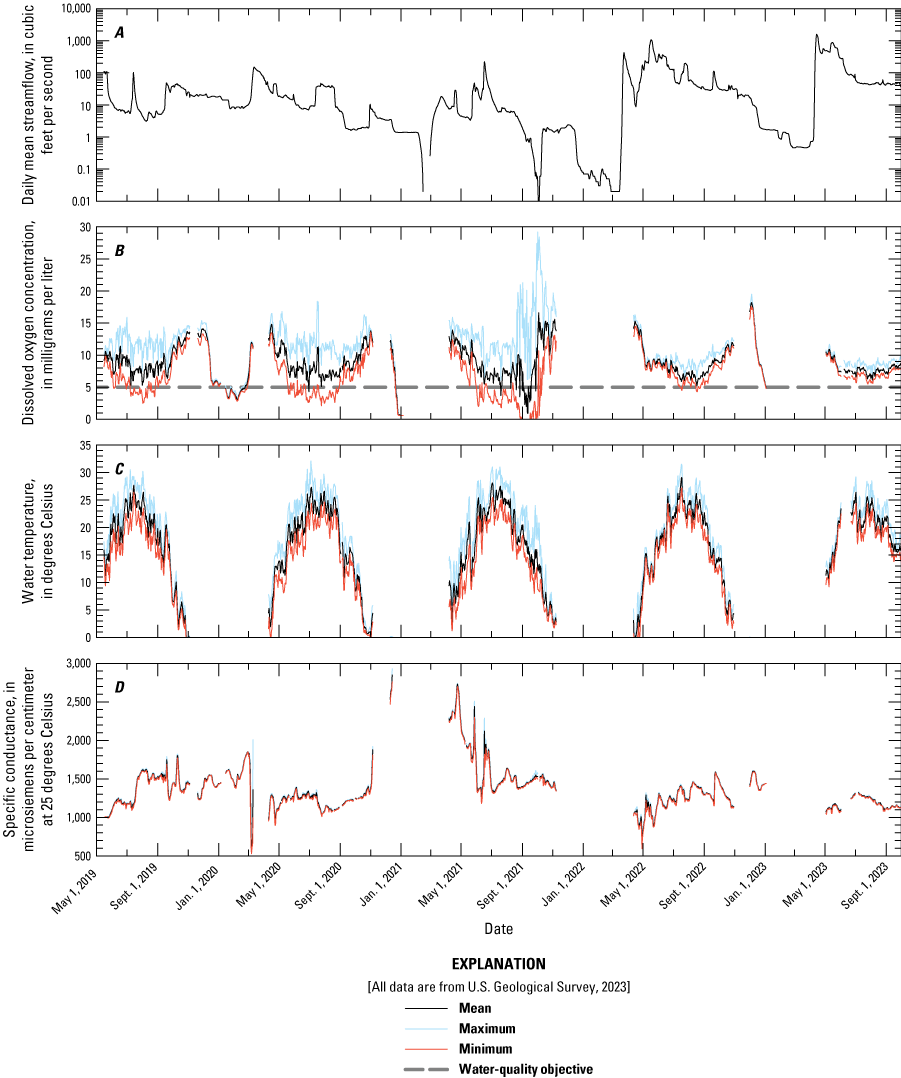
Daily values for (A) continuous streamflow, (B) dissolved oxygen, (C) water temperature, and (D) specific conductance at the Souris River near Sherwood, North Dakota (U.S. Geological Survey station 05114000), May 16, 2019, to October 1, 2023.
The continuously recorded data provided a more complete assessment of how the Souris River is affected by low DO concentrations compare to the discrete DO measurements that were collected as part of an ongoing water-quality sampling program near Sherwood. Samples were collected about seven times a year near Sherwood (fig. 3). In evaluating the WQO, the discrete samples only indicated three instances where DO concentrations were less than 5 mg/L from May 16, 2019, to October 1, 2023, compared to the continuously recorded data where the daily minimum concentration was less than WQO for a total of 326 days and the daily mean concentration was less than the WQO for 76 days.
Diurnal variations often reflect algal processes in a stream. During the day, when solar radiation is the greatest, aquatic plants use photosynthesis for growth, which produces oxygen and consumes carbon dioxide (CO2). During the night, aquatic plants undergo respiration, which produces CO2 and consumes oxygen (Allan, 1995). During extended low-streamflow conditions in the summer, when water temperatures are greater and the water column has more light penetration than other periods of the year, algal growth can occur more readily. The discrete samples were always collected during the day when DO concentrations would generally be higher compared to if samples were collected at night or early morning when DO concentrations were lowest in the summer months. This resulted in less instances when the DO was less than the WQO compared to the continuously recorded data.
One reason for the collection of continuous water-quality data on the Souris was that the ISRB was interested in how DO concentrations are related to streamflow at the international border. DO is complex in that several factors can affect concentrations including water temperature, atmospheric pressure, dissolved solids concentration, algal photosynthesis and respiration, organic matter decay, and aeration caused by wind, dams, riffles, or higher stream velocity (Hem, 1985). Streamflow conditions can affect several of these factors. At higher streamflow conditions, stream velocities often are higher than at low streamflow conditions. With higher streamflow conditions and velocities, DO concentrations could be higher because algae have less opportunity to grow in a single location, increased aeration can entrain more DO into the water column and reduce the decay of organic matter, and dissolved solids concentrations generally are more diluted. At low streamflow conditions and lower velocities, DO concentrations are often lower because stagnant and warmer water can allow for increased algal growth, reduced aeration and more organic matter decay, and more concentrated dissolved solids concentrations. The reduction of aeration and increase in organic matter decay can also be accentuated in the winter months when there is ice cover on the channel in combination with low streamflow conditions.
A comparison was made between the daily minimum DO concentration and the daily mean streamflow to evaluate the relation between the two measurements (fig. 4). Less than a streamflow of about 100 ft3/s, there does not seem to be a clear pattern that indicates a direct relation between DO concentration and streamflow with wide ranging DO concentrations at similar streamflow values. In general, when streamflow was less than 1 ft3/s, DO was mostly less than the WQO. However, there may be a pattern of increasing DO concentration with increasing streamflow when streamflow was greater than about 100 ft3/s near Sherwood (fig. 4).
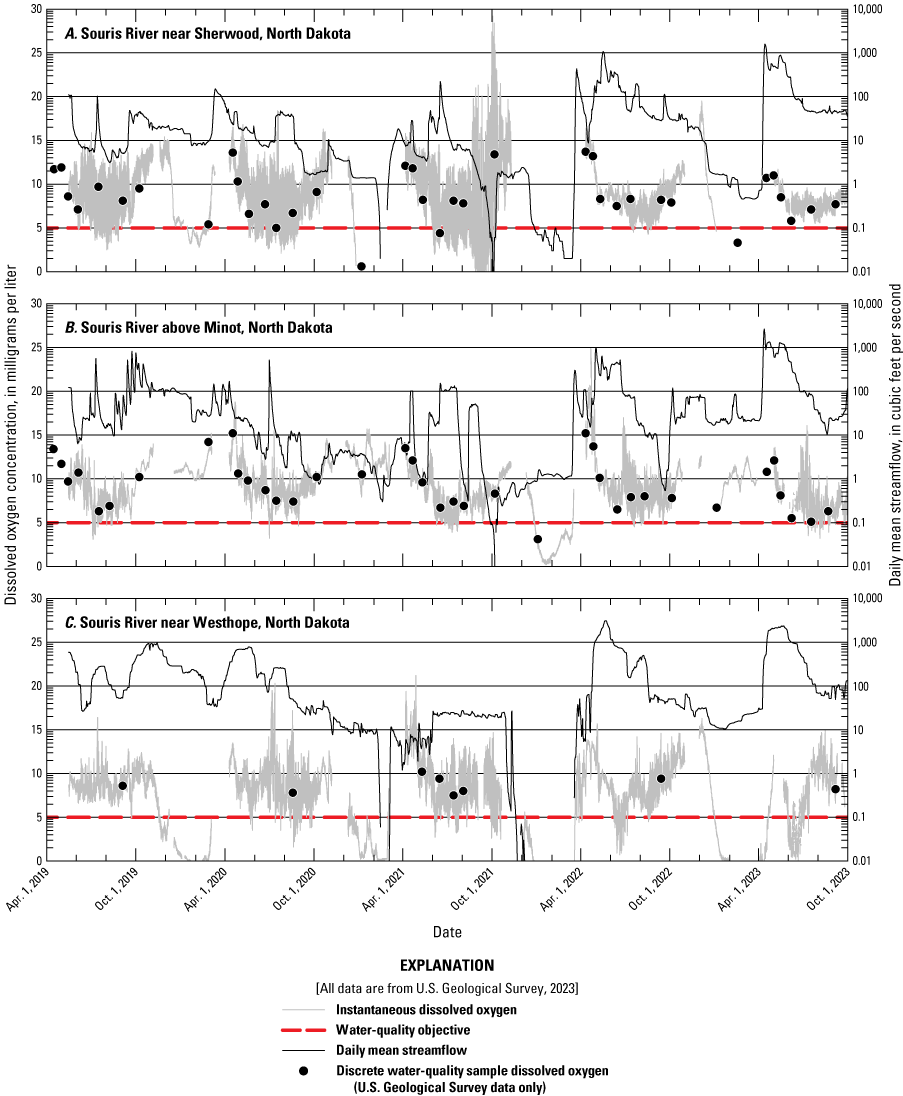
Daily streamflow and instantaneous dissolved oxygen with discrete measurements of dissolved oxygen at the Souris River near Sherwood, North Dakota (A; U.S. Geological Survey station 05114000), Souris River above Minot, N. Dak (B; U.S. Geological Survey station 05117500), and Souris River near Westhope, N. Dak. (C; U.S. Geological Survey station 05124000), May 16, 2019, to October 1, 2023.
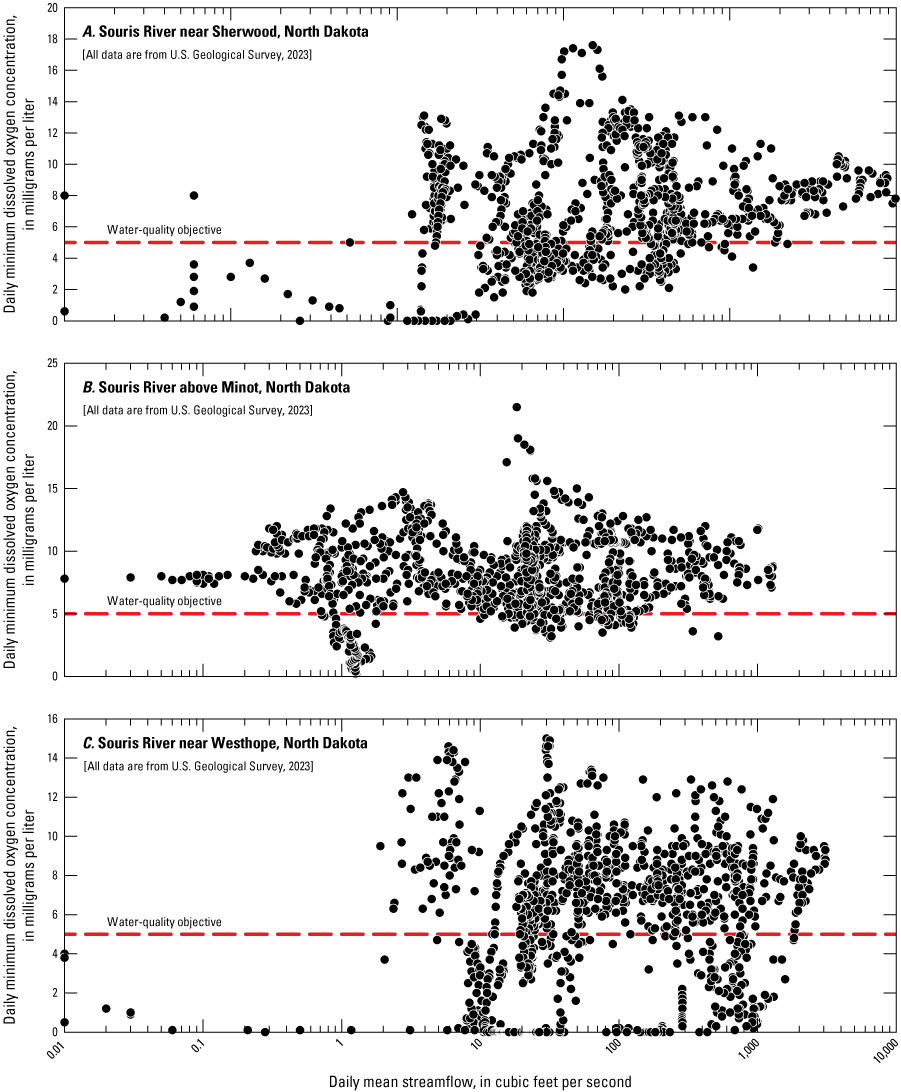
Comparison of daily mean streamflow to daily minimum dissolved oxygen concentration at the Souris River near Sherwood, North Dakota (A; U.S. Geological Survey station 05114000), Souris River above Minot, N. Dak (B; U.S. Geological Survey station 05117500), and Souris River near Westhope, N. Dak. (C; U.S. Geological Survey station 05124000), May 16, 2019, to October 1, 2023.
Souris River above Minot, N. Dak
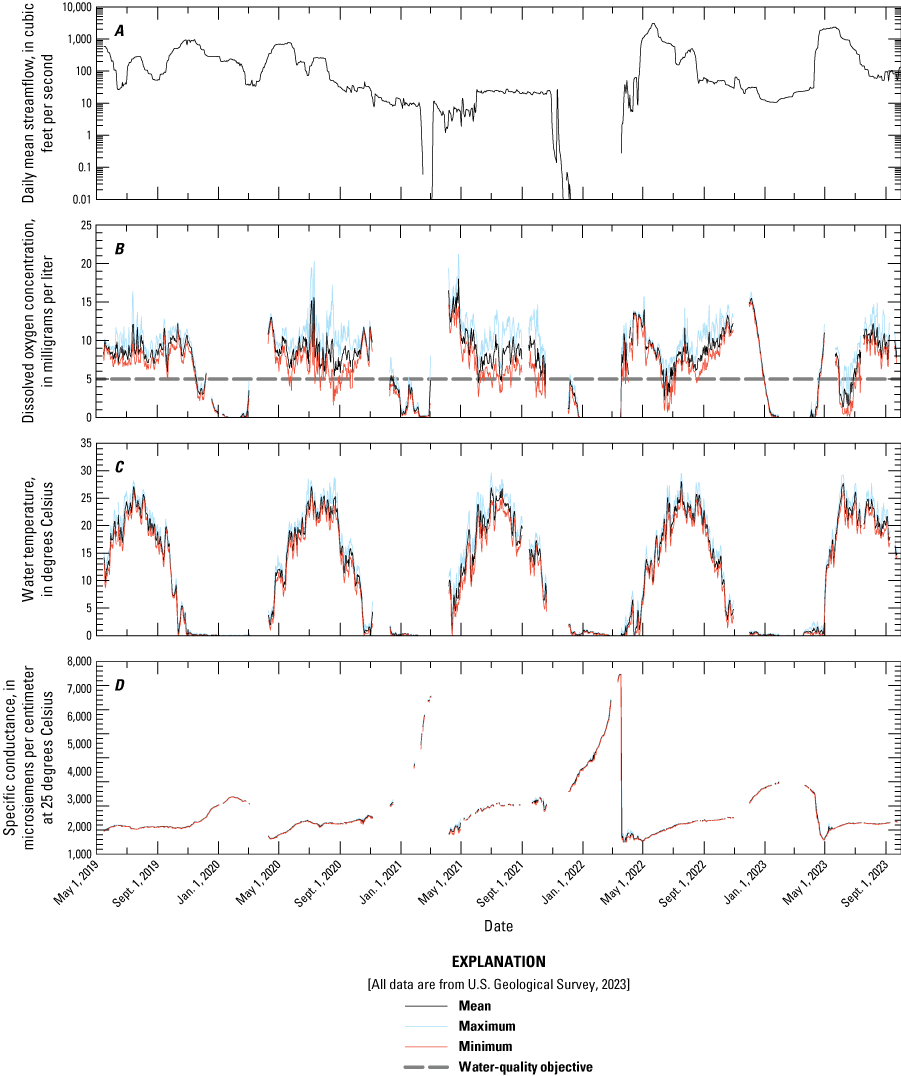
Similar to the streamflow near Sherwood, the streamflow at the site above Minot was extremely variable (U.S. Geological Survey, 2023) with mean daily streamflow ranging from 18.7 ft3/s in 2021 to 259 ft3/s in 2023 (table 1). Daily mean streamflow less than 1 ft3/s was observed in the fall and winter in 2021 and 2022 but was observed less often than at Sherwood (fig. 5). Among the 5 years of monitoring, streamflow was the greatest in 2022 and 2023, particularly in the spring. Daily mean streamflow ranged from 6.3 to 824 ft3/s in 2019 (May–December), and from 0.8 to 520 ft3/s in 2020 (fig. 5). In comparison, daily mean streamflow ranged from 0 to 153 ft3/s in 2021, 0.5 to 1,010 ft3/s in 2022, and 10.2 to 2,640 ft3/s in 2023 (January–October; fig. 5).
Daily values for (A) continuous streamflow, (B) dissolved oxygen, (C) water temperature, and (D) specific conductance at the Souris River above Minot, North Dakota (U.S. Geological Survey station 05117500), May 16, 2019, to October 1, 2023.
DO concentrations measured above Minot were less variable than observed near Sherwood from May 16, 2019, to October 1, 2023. In particular, diurnal fluctuations were less prominent than those observed near Sherwood and were observed more in the summer months in 2022 when streamflow was less than about 10 ft3/s compared the other years (fig. 5). DO concentrations ranged from 3.2 to 18.8 mg/L in 2020 and from 3.2 to 15.7 mg/L in 2021 (table 1 and fig. 5). In comparison, DO concentrations ranged from 0.2 to 24.8 mg/L in 2022 and from 3.2 to 16.1 mg/L in 2023. The lowest minimum DO concentrations generally were in the summer months each year except for the winter of 2021–22 that had the lowest DO concentrations for the entire period. The highest daily maximum concentrations often were in the spring and fall (September–November) when water temperatures were reduced, algal growth was reduced, and streamflow was somewhat higher compared to other times of the year. In 2022 and 2023, high maximum concentrations also were observed in the summer, likely because of algal dynamics in the channel. Missing data in the continuous record in the late fall and early spring in each year were from the normal operation of removing the sensor while ice formed in the channel to prevent damage and removal of the sensor before ice breakup to prevent damage to sensors from ice flows.
The daily minimum DO concentrations were not frequently less than the WQO of 5 mg/L at the site above Minot, except in the winter of 2021–22 when concentrations were near 0 mg/L for a several days (fig. 5). The DO concentrations in the winter months for the other years were mostly above 5 mg/L. It is unknown why DO concentrations were higher in the winter at this site compared to the other two sites, although it might be attributed to inputs from the Des Lacs River that flows into the Souris River upstream from the site, control structures in the channel that remained open during ice conditions and caused aeration, or possibly less organic matter material in the channel that can decay and decrease DO. Also, different from the pattern observed near Sherwood, the daily minimum concentrations were less than the WQO more often in the summer of 2023 when streamflow was greater than 10 ft3/s compared to other years. The daily minimum DO was less than the WQO for 14 days in 2019, 3 days in 2020, 30 days in 2021, 82 days in 2022, and 32 days in 2023 (table 1 and fig. 5). The daily mean DO was less than the WQO for 74 days in 2022, 4 days in 2021, and 1 day in 2019, 2020, and 2023 (table 1).
Samples were collected about seven times a year as part of an ongoing water-quality sampling program at Minot (fig. 3). In evaluating the WQO, the discrete samples only indicated one instance where DO concentrations were less than 5 mg/L from May 16, 2019, to October 1, 2023, compared to the continuously recorded data where the daily minimum concentration was less than WQO for a total of 161 days and the daily mean concentration was less than the WQO for 81 days.
At the site above Minot, there does not seem to be a clear pattern that indicates a direct relation between DO concentration and streamflow; rather, across the entire range of streamflow values, a wide range of DO concentrations were observed for similar streamflow values (fig. 4). Similar to the site near Sherwood, there may be a slight pattern of increasing DO concentration with increasing streamflow at streamflows greater than about 100 ft3/s above Minot, although the pattern is less distinct than observed near the Sherwood (fig. 4).
Souris River near Westhope, N. Dak
The streamflow near Westhope is highly controlled by the operation of the J. Clark Salyer Pool National Wildlife Refuge pools and water control structures, specifically pool 357. The pool 357 outflow structure is a little less than 1 mile upstream from the Westhope site. The mean daily streamflow ranged from 11.8 ft3/s in 2021 to 478 ft3/s in 2023 (table 1). Daily mean streamflow was less than 1 ft3/s only for periods in the winters of 2020–21 and 2021–22 (fig. 6). Similar to the other sites, among the 5 years of monitoring, streamflow was the greatest in 2022 and 2023, particularly in the late spring and early summer. Daily mean streamflow ranged from 26.3 to 956 ft3/s in 2019 (May–December), and from 7.7 to 780 ft3/s in 2020 (fig. 6). In comparison, daily mean streamflow ranged from 0 to 27.5 ft3/s in 2021, 0 to 3,090 ft3/s in 2022, and 10.6 to 2,360 ft3/s in 2023 (January–October; fig. 6).
The pattern of DO concentrations measured near Westhope was considerably different than observed near Sherwood and above Minot from May 16, 2019, to October 1, 2023. This may be attributed to the proximity of the site to the outlet of J. Clark Salyer Pool 357. Diurnal fluctuations in DO concentrations were observed near Westhope, particularly in the summer in 2020 and 2021 when streamflow was less than 100 ft3/s (fig. 6). DO concentrations ranged from 0 to 20.3 mg/L in 2020 and from 0 to 21.2 mg/L in 2021 (table 1 and fig. 6). In comparison, DO concentrations ranged from 0 to 16.3 mg/L in 2022 and from 0 to 14.9 mg/L in 2023. The lowest minimum DO concentrations generally were in the winter months under ice conditions, where DO concentrations were consistently at or near 0 mg/L. Also, likely because of algal dynamics in the channel, the highest daily maximum DO concentrations were recorded mostly in the summer months, although the highest concentrations were in the spring of 2021 and in the late fall of 2022. Missing data in the continuous record in the late fall and early spring in each year was from the normal operation of removing the sensor to prevent damage while ice formed in the channel and removal of the sensor before ice breakup.
The daily minimum DO concentrations were frequently less than the WQO of 5 mg/L near Westhope, mainly in the winter and during some periods in the summer. The DO concentrations in the winter months were consistently less than 5 mg/L during the winter for the entire monitoring period (fig. 6). The daily minimum DO was less than the WQO near Westhope for the most days among the three sites. The daily minimum DO was less than the WQO for 36 days in 2019, 109 days in 2020, 129 days in 2021, 111 days in 2022, and 147 days in 2023 (table 1 and fig. 6). The daily mean DO was less than the WQO for 17 days in 2019, 38 days in 2020, 47 days in 2021, 33 days in 2022, and 63 days in 2023 (table 1). The low winter DO concentrations likely reflect the water chemistry being discharged from J. Clark Salyer Pool 357 in combination with ice cover preventing aeration of the water column. J. Clark Salyer Pool 357 is part of a National Wildlife Management system maintained by the U.S. Fish and Wildlife Service. Because J. Clark Salyer Pool 357 sustains a large population of waterfowl, it likely has a large amount of organic material within the pool that can consume a considerable amount of DO, particularly under ice cover that prevents mixing and aeration from wind.
Samples were only collected annually by the USGS near Westhope because Environment and Climate Change Canada (ECCC) does most of the water-quality sampling at the site (fig. 3). Additional samples were collected in 2021 by the USGS because ECCC was unable to travel in the field that year. With few samples, none of the discrete DO measurements were less than the WQO of 5 mg/L from May 16, 2019, to October 1, 2023, compared to the continuously recorded data where the daily minimum concentration was less than the WQO for a total of 532 days and the daily mean concentration was less than the WQO for 426 days.
At the site near Westhope, there does not seem to be any pattern that indicates a direct relation between DO concentration and streamflow with wide-ranging DO concentrations at similar streamflow values across the entire range of streamflow values (fig. 4). In general, when streamflow was less than 1 ft3/s, DO was consistently less than the WQO and close to 0 mg/L. As mentioned earlier, DO concentrations near Westhope are likely more influenced by the water chemistry in J. Clark Salyer Pool 357 rather than streamflow-related factors.
Daily values for (A) continuous streamflow, (B) dissolved oxygen, (C) water temperature, and (D) specific conductance at the Souris River near Westhope, North Dakota (U.S. Geological Survey station 05124000), May 16, 2019, to October 1, 2023.
Implications
The continuous water-quality monitoring at three sites on the Souris River from May 16, 2019, to October 1, 2023, indicated different patterns in DO among the three sites, and the different patterns indicate different factors affect DO concentrations among the sites. DO concentrations near Sherwood indicated the strong effect of algal dynamics at lower streamflow conditions with large diurnal fluctuations in DO concentration and indicated that streamflow does seem to affect DO concentrations when the streamflow is greater than about 100 ft3/s. DO concentrations were also frequently less than the WQO in the summer and winter months, particularly during relatively low streamflow conditions in 2020 and 2021. DO concentrations above Minot had a different pattern with considerably fewer diurnal fluctuations than near Sherwood, high DO concentrations most winters except for the winter of 2021–22, and fewer instances when the DO was less than the WQO compared to Sherwood. The pattern of DO concentrations near Westhope seemed to be mainly influenced by the water chemistry coming out of J. Clark Salyer Pool 357 rather than streamflow and channel conditions at the site. The Westhope site also had the most days with daily minimum DO concentrations less than the WQO among the three sites, mainly in the winter when concentrations were consistently at or near 0 mg/L for most of the winter months.
One of the interests of the ISRB for this study was an understanding of the relation of DO concentrations and streamflow. The continuous monitoring of DO and streamflow indicated that most of the time there does not seem to be a pattern that indicates a direct relation between the two measurements. At the sites near Sherwood and above Minot, there seems to be some relation of increasing DO concentration with increasing streamflow when streamflow was greater than 100 ft3/s, and no relation at any range of streamflow at the site near Westhope. The DO concentrations near Westhope seem to be more influenced by the water being discharged from J. Clark Salyer Pool 357 more than other factors such as streamflow. DO concentrations were consistently less than the WQO when streamflow was less than about 1 ft3/s near Sherwood and near Westhope but not at the site above Minot.
For a more complete understanding of the DO dynamics at these sites, other sensors that more directly measure some of the factors that can affect DO concentrations could be used in combination with the DO sensors to help explain the variability of the concentrations in future monitoring efforts. It was observed that at certain times of the year and at certain streamflow conditions, factors such as algal growth and respiration and organic matter decay may strongly influence DO concentrations. Sensors are available that measure chlorophyll a to estimate the relative changes in algae biomass in the water column at a site. Sensors are also available that can measure fluorescent dissolved organic matter that would provide the relative changes in dissolved organic matter in the stream.
The continuous water-quality monitoring provided a more complete assessment of low DO concentration conditions in the Souris River compared to discrete measurements. It is unknown what the effects of long periods of DO concentrations at or near 0 mg/L that were measured with the continuous sensors could have on the aquatic ecosystem. The evaluation of the effects was beyond the scope of this monitoring study, but the methods and data collected as part of the study could be used in future efforts to evaluate mitigation strategies for low DO conditions or in the assessment of ecosystem effects of low DO conditions in the Souris River.
Summary
The U.S. Geological Survey (USGS) in partnership with the International Joint Commission installed and operated continuous water-quality monitors at three sites on the Souris River from May 2019 to October 2023. Continuously recorded data included dissolved oxygen (DO), water temperature, and specific conductance at the Souris River near Sherwood, North Dakota (USGS station 05114000), Souris River above Minot, N. Dak. (USGS station 05117500), and Souris River near Westhope, N. Dak. (USGS station 05124000). The three sites on the Souris River were chosen for additional DO monitoring because they provided the best opportunity to capture potential effects on DO in areas downstream from major flow control structures and because identifying the connection of streamflow to DO at the international border is a focus of the International Souris River Board (ISRB).
DO concentrations measured near Sherwood were highly variable from May 16, 2019, to October 1, 2023. Large diurnal fluctuations were observed in the summer months in 2020 and 2021 when streamflow was less than about 10 cubic feet per second (ft3/s). Diurnal fluctuations were relatively diminished in the summers in 2022 and 2023 when streamflow was higher compared to the previous years. The lowest minimum DO concentrations generally were in the summer and winter months, although DO was not measured in most of the winter months because of extremely low streamflow conditions. The daily minimum DO concentrations often were less than the water-quality objective (WQO) of 5 milligrams per liter (mg/L), particularly in the summer and winter of 2020 and 2021. Discrete samples only indicated three instances where DO concentrations were less than 5 mg/L, but the continuously recorded data had daily minimum concentrations less than the WQO for a total of 326 days and daily mean concentrations less than the WQO for 76 days.
DO concentrations measured above Minot were less variable than observed near Sherwood. In particular, diurnal fluctuations were less prominent than was observed near Sherwood and were observed more in the summer months in 2022 when streamflow was less than about 10 ft3/s compared the other years. The lowest minimum DO concentrations generally were in the summer months each year except for the winter of 2021–22, which had the lowest DO concentrations for the entire period. The highest daily maximum values often were in the spring and fall months (September–November). In 2022 and 2023, high maximum values were also observed in the summer months, likely because of algal dynamics in the channel. The daily minimum DO concentrations were not frequently less than the WQO of 5 mg/L, except in the winter of 2021–22 when concentrations were near 0 mg/L. In evaluating the WQO, the discrete samples only indicated one instance where DO concentrations were less than 5 mg/L compared to the continuously recorded data where the daily minimum was less than the WQO for a total of 161 days and the daily mean was less than the WQO for 81 days.
The pattern of DO concentrations measured near Westhope was considerably different than observed near Sherwood and above Minot. This may be attributed to the proximity of the site in relation to the outlet of J. Clark Salyer Pool 357, which is a little less than 1 mile upstream from the site. Diurnal fluctuations in DO concentrations were observed near Westhope, particularly in the summer in 2020 and 2021 when streamflow was less than 100 ft3/s. The lowest minimum DO concentrations generally were in the winter months and under ice conditions, where DO concentrations were consistently at or near 0 mg/L. Also, likely because of algal dynamics in the channel, the highest daily maximum DO concentrations were recorded mostly in the summer months, although the highest concentrations were in the spring 2021 and in the late fall in 2022. The daily minimum DO concentrations were frequently less than the WQO of 5 mg/L near Westhope, mainly in the winter and during some periods in the summer. The daily minimum DO concentrations were less than the WQO for a total of 532 days and the daily mean concentrations were less than the WQO for 426 days.
One of the interests of the ISRB was an understanding of the relation of DO concentrations and streamflow. The continuous monitoring of DO and streamflow indicated that most of the time there does not seem to be a pattern that indicates a direct relation between the two measurements. At the sites near Sherwood and above Minot, there seems to be some relation of increasing DO concentration with increasing streamflow when the streamflow was greater than about 100 ft3/s, and no relation at any range of streamflow at the site near Westhope.
References Cited
Hem, J.D., 1985, Study and interpretation of the chemical characteristics of natural water: U.S. Geological Survey Water-Supply Paper 2254, 263 p. [Also available at https://doi.org/10.3133/wsp2254.]
International Joint Commission, 2017, A review of international water quality objectives in the Souris, Red, Rainy-Lake of the Woods and St. Croix River Basins: International Joint Commission, accessed April 26, 2022, at https://ijc.org/en/review-international-water-quality-objectives-souris-red-rainy-lake-woods-and-st-croix-river-basins.
Kolars, K.A., Vecchia, A.V., and Ryberg, K.R., 2016, Stochastic model for simulating Souris River Basin precipitation, evapotranspiration, and natural streamflow: U.S. Geological Survey Scientific Investigations Report 2015–5185, 55 p., accessed December 1, 2023, at https://doi.org/10.3133/sir20155185.
Rantz, S.E., and others, 1982, Measurement and computation of streamflow—Volume 2, Computation of discharge: U.S. Geological Survey Water-Supply Paper 2175, p. 285–631. [Also available at https://doi.org/10.3133/wsp2175.]
U.S. Geological Survey, 2023, USGS water data for the Nation: U.S. Geological Survey National Water Information System database, accessed November 18, 2023, at https://doi.org/10.5066/F7P55KJN.
Wagner, R.J., Boulger, R.W., Jr., Oblinger, C.J., and Smith, B.A., 2006, Guidelines and standard procedures for continuous water-quality monitors—Station operation, record computation, and data reporting: U.S. Geological Survey Techniques and Methods, book 1, chap. D3, 51 p., 8 attachments, accessed February 26, 2013, at https://doi.org/10.3133/tm1D3.
Supplemental Information
Specific conductance is in microsiemens per centimeter at 25 degrees Celsius (µS/cm at 25 °C).
Concentrations of dissolved oxygen in water are given in milligrams per liter (mg/L).
For more information about this publication, contact:
Director, USGS Dakota Water Science Center
821 East Interstate Avenue
Bismarck, ND 58503
1608 Mountain View Road
Rapid City, SD 57702
605–394–3200
For additional information, visit: https://www.usgs.gov/centers/dakota-water.
Publishing support provided by the
Rolla and Baltimore Publishing Service Centers
Disclaimers
Any use of trade, firm, or product names is for descriptive purposes only and does not imply endorsement by the U.S. Government.
Although this information product, for the most part, is in the public domain, it also may contain copyrighted materials as noted in the text. Permission to reproduce copyrighted items must be secured from the copyright owner.
Suggested Citation
Galloway, J.M., 2024, Dissolved oxygen monitoring on the Souris River, 2019–23: U.S. Geological Survey Open-File Report 2024–1043, 13 p., https://doi.org/10.3133/ofr20241043.
ISSN: 2331-1258 (online)
Study Area
| Publication type | Report |
|---|---|
| Publication Subtype | USGS Numbered Series |
| Title | Dissolved oxygen monitoring on the Souris River, 2019–23 |
| Series title | Open-File Report |
| Series number | 2024-1043 |
| DOI | 10.3133/ofr20241043 |
| Publication Date | September 25, 2024 |
| Year Published | 2024 |
| Language | English |
| Publisher | U.S. Geological Survey |
| Publisher location | Reston, VA |
| Contributing office(s) | Dakota Water Science Center |
| Description | Report: iv, 13 p.; Dataset |
| Country | Canada, United States |
| State | North Dakota |
| Other Geospatial | Souris River |
| Online Only (Y/N) | Y |
| Additional Online Files (Y/N) | N |