Groundwater Quality and Groundwater Levels in Dougherty County, Georgia, April 2020 Through January 2023
Links
- Document: Report (5.45 MB pdf) , HTML , XML
- Data Release: USGS Water Data for the Nation - USGS NWIS database
- NGMDB Index Page: National Geologic Map Database Index Page (html)
- Download citation as: RIS | Dublin Core
Acknowledgments
The author wishes to thank Albany Utilities for working with the U.S. Geological Survey to collect hydrologic data. Thanks also goes out to the homeowners, farmers, and businesses that allowed access to their property.
This project would not have happened without assistance from U.S. Geological Survey colleagues. Alan Cressler was fundamental in groundwater-sample collection. John McCranie and Gary Holloway collected groundwater-level measurements.
Abstract
The Upper Floridan aquifer is the uppermost reliable groundwater source in southwest Georgia. The aquifer lies on top of the Claiborne, Clayton, and Cretaceous aquifers, all of which exhibited water-level declines in the 1960s and 1970s. The U.S. Geological Survey has been working cooperatively with Albany Utilities to monitor groundwater quality and availability in these aquifers since 1977.
Flow direction in the Upper Floridan aquifer is to the south and toward the Flint River. During the past 3 years, water levels varied above and below period-of-record median values. Water levels in the Upper Floridan aquifer were primarily above or at median levels during 2020 and 2021 and at or below median levels during 2022. Water levels in the Claiborne aquifer were above median levels, whereas water levels in the Clayton aquifer were at or below median levels, and in the Cretaceous aquifer system were close to median levels.
During January 2021, eight wells were sampled for major ions, including nitrate plus nitrite as nitrogen (N). Nitrate plus nitrite as N concentrations ranged from 2.3 to 10.5 milligrams per liter (mg/L). During December 2021, seven wells were sampled for major ions, including nitrate plus nitrite as N. Nitrate plus nitrite as N concentrations ranged from 3.9 to 9.9 mg/L. During November 2022, eight wells were sampled for major ions, including nitrate plus nitrite as N. Nitrate plus nitrite as N concentrations ranged from 3.9 to 10.0 mg/L. Two wells were also sampled for per- and polyfluoroalkyl substances during November 2022.
Introduction
The U.S. Geological Survey (USGS) has been working with Albany Utilities, Dougherty County, Georgia (Ga.) (fig. 1), to monitor groundwater quality and availability since 1977. Heavy pumping since the 1960s and 1970s from the Claiborne, Clayton, and Cretaceous aquifer system, which underlie the Upper Floridan aquifer, has resulted in substantial water-level declines in the Albany area (fig. 2; Hicks and others, 1981). To meet increasing demands, Albany Utilities developed a large well field that was put online during October 2003 (fig. 3). The well field is made up of eight supply wells that primarily withdraw water from the Upper Floridan aquifer. The Upper Floridan aquifer is a highly productive and porous limestone aquifer and is the uppermost reliable groundwater source in the area. Because of the karstic landscape and the local recharge to the aquifer, groundwater levels and quality may be affected by local and regional land use. During 1997, the Dougherty County Health Department collected water samples from the Upper Floridan aquifer from a well in the southwestern Albany area, Georgia, that supplied drinking water to a private school. These samples contained concentrations of nitrate greater than 10 milligrams per liter (mg/L), which is the primary maximum contaminant level for public drinking-water supplies (40 CFR, part 141, subpart B). The contaminated samples prompted the Dougherty County Health Department to sample over 700 wells in the area and identify a zone of nitrate contamination in the vicinity of the public-supply well field southwest of Albany, Ga. (Wenner and Reyher, 1999). Water from 12 percent of the wells sampled had nitrate concentrations above the 10-mg/L primary maximum contaminant level (40 CFR, part 141, subpart B; Wenner and Reyher, 1999). Each of the contaminated wells are open to the Upper Floridan aquifer, which supplies water for the public-supply well field and most domestic and irrigation wells in the southwest Albany area.
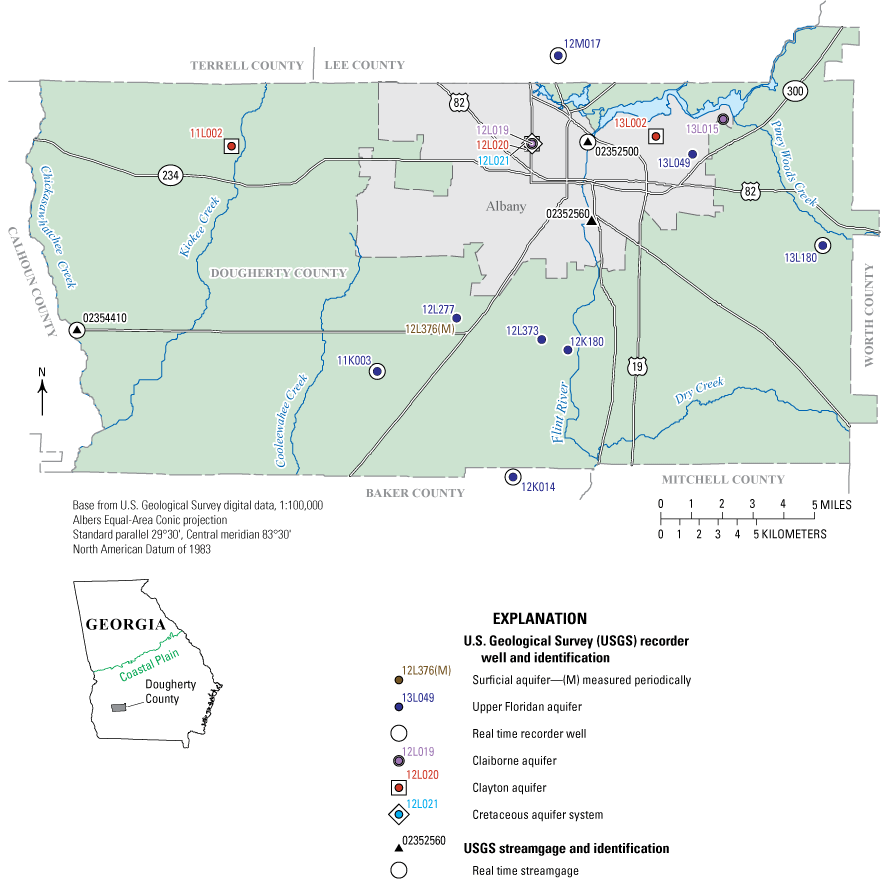
Wells and streamgages with continuous groundwater and surface-water-level recorders, Dougherty County, Georgia.
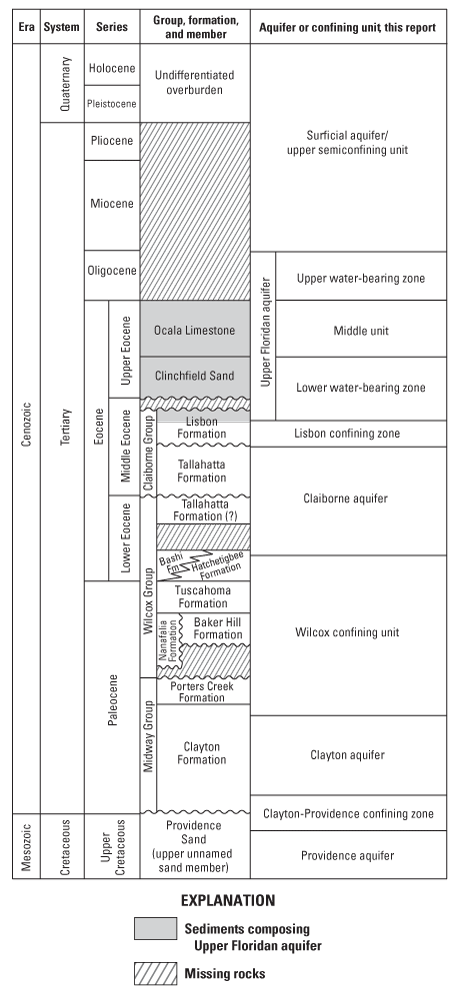
Generalized stratigraphy and water-bearing units underlying Albany and surrounding areas, southwestern Georgia.
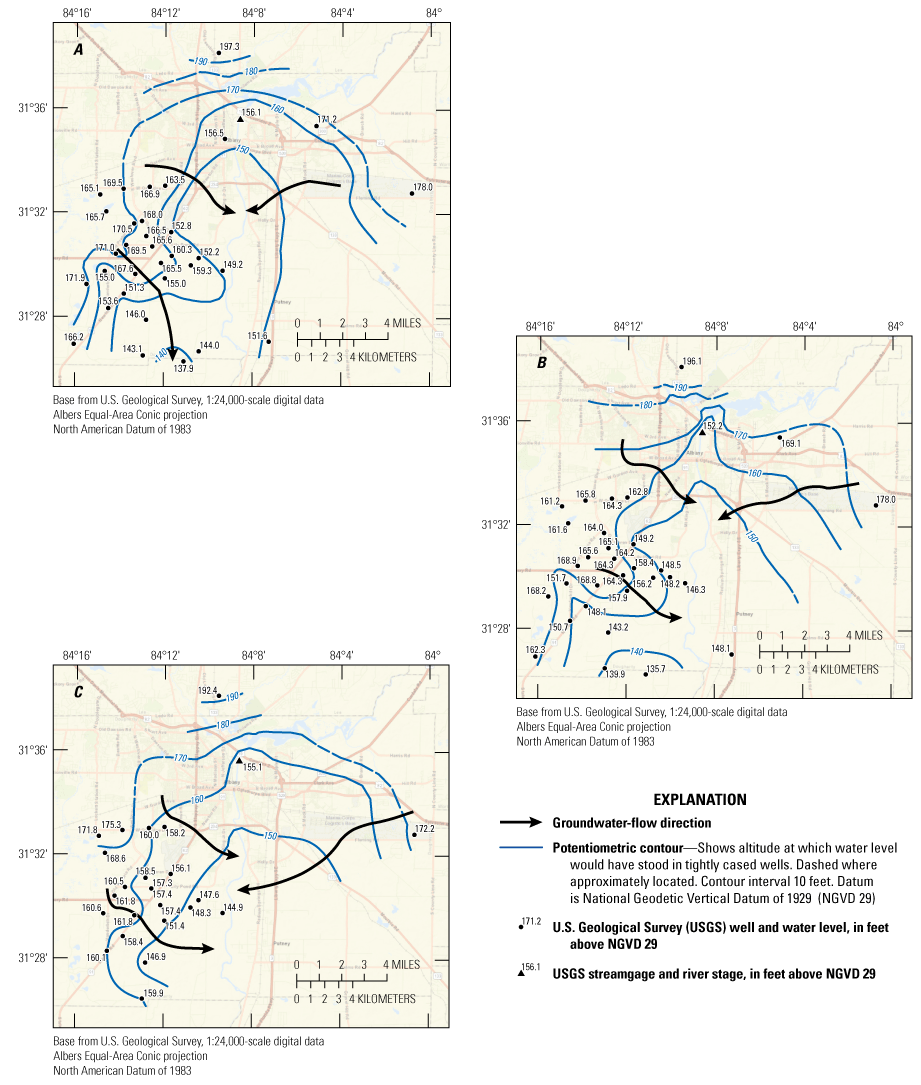
Potentiometric surface and groundwater flow directions of the Upper Floridan aquifer, Dougherty County, Georgia, using groundwater levels from selected wells during A, January 2021, B, December 2021, and C, November 2022. Vertical coordinate information is referenced to the National Geodetic Vertical Datum of 1929. Horizontal coordinate information is referenced to North American Datum of 1983.
The USGS maintains a project website, “Groundwater Monitoring - Albany-Dougherty County Area, Georgia,” that contains a summary of the project, maps, and related publications (USGS, 2020a). The website also has a list of continuous monitoring wells with links to the USGS Water Data for the Nation database, allowing the user to access the data from that site.
Purpose and Scope
The purpose of this report is to provide a summary of data collected during a 3-year period (April 2020 through January 2023). The report includes an overview of groundwater conditions, a summary of water-quality data collected, a nitrate graph, and an explanation of trends since 1998. This report is the latest in a series of reports summarizing this program (Gordon, 2008, 2009; Gordon and others, 2012; Gordon, 2020). The objectives of the study were to (1) augment the current level of understanding of the hydrogeologic framework of the Upper Floridan aquifer in the Albany area of southwest Georgia, (2) monitor water-level fluctuations in the four aquifers used in the area, and (3) monitor water quality in the Upper Floridan aquifer as pumping patterns and land-use activities change. These objectives were met by completing the following tasks:
-
• groundwater-level monitoring of 14 continuous wells (fig. 1) and periodic measurement of water levels in about 32–39 wells annually;
-
• water-quality monitoring near the southwestern Albany area, including annual nitrate monitoring; and
-
• maintaining the USGS National Water Information System (NWIS) database, which includes groundwater, surface-water, and water-quality data.
Samples also were collected to analyze the occurrence of per- and polyfluoroalkyl substances (PFAS) during November 2022 from Albany Utilities’ supply wells. These wells draw water from the Claiborne and Clayton aquifers, below the Upper Floridan aquifer.
Relevance and Benefits
Part of the USGS mission is to provide reliable, impartial, and timely scientific information to manage and understand the water resources of the Nation through a program of shared efforts with Federal, State, and local partners. The USGS, through these partnerships, seeks to solve real-world problems by developing tools to improve the application of hydrologic information to the management of water resources while ensuring that USGS information and tools are available to all potential users (USGS, 2020b).
The study supports the USGS Water Strategic Science Plan, 2012–22 (Evenson and others, 2012), with emphasis on evaluating the effects of land use and population increases on water resources, including drinking-water availability, water quality, and hydrologic system management. The data will provide water managers with information needed for groundwater-resources sustainability and development in the Albany, Ga., area.
Groundwater Levels
Water-level data were obtained from selected wells open to the Upper Floridan aquifer on an annual basis. During January 2021, water levels were collected from 35 wells and ranged from about 138 feet (ft) above the National Geodetic Vertical Datum of 1929 (NGVD 29) in the southern part of the study area to about 197 ft above NGVD 29 in the northern part of the study area (fig. 3). During December 2021, water levels were collected from 32 wells and ranged from about 136 to 196 ft above NGVD 29. During November 2022, water levels were collected from 39 wells and ranged from about 145 to 192 ft above NGVD 29. The hydraulic gradient of the Upper Floridan aquifer generally slopes southward and toward the Flint River at a rate of about 3–20 feet per mile but is generally around 7 feet per mile in the Albany area. The Flint River is a major discharge area for the aquifer; however, when the river is high, the gradient may reverse in the southern part of the study area (Peck and others, 2013).
Water levels are continuously monitored by the USGS in the study area in the Upper Floridan, Clayton, and Claiborne aquifers and Cretaceous aquifer system and are routinely measured in the surficial aquifers. The water-level data are available on the USGS NWIS database via the Albany project website (USGS, 2024; https://www.usgs.gov/centers/sawsc/science/groundwater-monitoring-albany-dougherty-county-area-georgia). Below is a summary of groundwater levels within these five aquifers during April 2020 through January 2023 relative to period-of-record median water levels. An example of a hydrograph from each aquifer (not including the surficial aquifer), along with the period-of-record median water levels for the well, is presented in figure 4. Water levels in each aquifer respond to drought conditions because of variations in recharge and (or) irrigation pumping. Figure 5 shows the areal percentages of Dougherty County, Ga. in U.S. Drought Monitor categories during March 1, 2020, through February 28, 2023 (National Drought Mitigation Center, 2024). The graph shows that Dougherty County experienced only short periods of abnormally dry (D0) conditions during March 2020 through October 2021. One hundred percent of the county experienced longer periods of abnormally dry (D0) conditions and moderate drought (D1) conditions from November 2021 through January 2023 (fig. 4). Hydrographs of wells 12L020 and 12L021 show water-level response to nearby pumping (fig. 5C–D). More information on current groundwater levels in Georgia is available on the USGS “Groundwater Conditions of Georgia” website at https://ga.water.usgs.gov/infodata/gwconditions/. The following water-level observations were made for the time period between April 2020 through January 2023:
-
• Water levels in the surficial aquifer at well 12L376 ranged from 19.3 ft below land surface during May 2020 to 33.3 ft below land surface during November 2022 (USGS, 2024).
-
• Water levels in well 12L277 (Upper Floridan aquifer) were above median levels from April 2020 through March 2022 and close to median levels from spring 2022 through January 2023 (fig. 5A). Water levels in well 13L180 (Upper Floridan aquifer) were below median levels throughout the study period.
-
• Water levels in the Claiborne aquifer were above median levels in well 12L019 (fig. 5B) throughout the study period. Water levels in well 13L015 were above median levels from January 2021 through July 2022 and near median levels from August 2022 through January 2023.
-
• Water levels in the Clayton aquifer were below median levels from April 2020 through January 2023 in wells 11L002 and 13L002 (not shown), and near median levels in well 12L020 (fig. 5C).
-
• Water levels in well 12L021 (Cretaceous aquifer system) were near median levels from January 2021 to August 2022, above median levels until December 2022, then below median levels through January 2023 (fig. 5D).
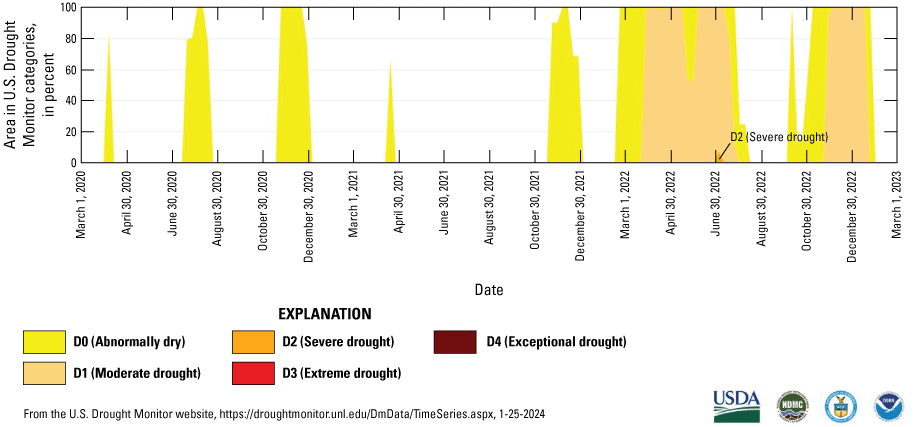
Areal percentages of Dougherty County, Georgia, in U.S. Drought Monitor categories during March 1, 2020, through February 28, 2023 (National Drought Mitigation Center, 2024).
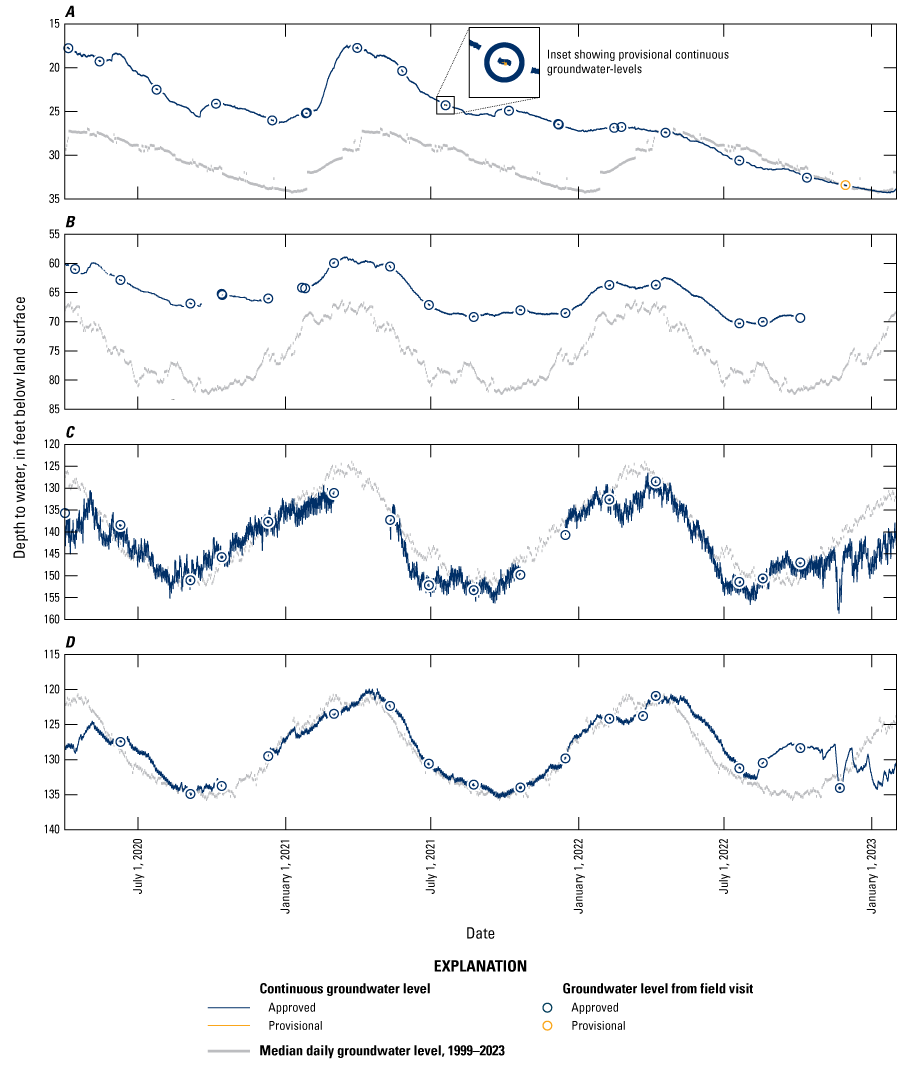
Hydrographs for selected wells in Dougherty County, Georgia, April 2020 through January 2023. A, well 12L277 in the Upper Floridan aquifer; B, well 12L019 in the Claiborne aquifer; C, well 12L020 in the Clayton aquifer; and D, well 12L021 in the Cretaceous aquifer system. Vertical coordinate information is referenced to the National Geodetic Vertical Datum of 1929 (NGVD 29); USGS, U.S. Geological Survey.
Groundwater Quality
Samples have been collected according to standard USGS methods (USGS, variously dated) annually—typically after the growing season in the fall or early winter—since 1998 from as many as 19 wells in the Upper Floridan aquifer and the Flint River for water-quality analyses. The samples have primarily been analyzed for nitrate plus nitrite as N concentrations because of historically high concentrations of nitrate originally documented in well 12L061. Well 12L061 was abandoned during 2012, and sampling resumed at a new well (12L405) on the same property during 2014. Three wells in the northern part of the study area were sampled for pesticide concentrations, but none were detected (fig. 6). Nitrate plus nitrite as N concentrations from well 12L405 ranged from 7.6 mg/L during 2014 to 8.6 mg/L during 2016, which may indicate that the higher levels of 11–13.4 mg/L from well 12L061 could, in part, have been due to compromised well construction (fig. 7). Nitrate plus nitrite as N concentrations were below 1 mg/L from 2003 to 2012 at Flint River site 02352560 (figs. 6 and 7). Water-quality samples were collected and analyzed for major ions, including nitrate plus nitrite as N, at eight wells in January 2021, seven wells in December 2021, and eight wells in November 2022. Nitrate plus nitrite as N concentrations ranged from 2.3 mg/L in well 12L344 (Upper Floridan aquifer) to 10.5 mg/L in well 12L376 (surficial aquifer) during January 2021, 3.9 mg/L in well 12K180 (Upper Floridan aquifer) to 9.9 mg/L in well 12L277 (Upper Floridan aquifer) during December 2021, and 3.9 mg/L in well 12K180 (Upper Floridan aquifer) to 10.0 mg/L in well 12L376 (surficial aquifer) during November 2022 (figs. 6 and 7; table 1). During the last 3 years, nitrate plus nitrite as N concentrations in most of the wells, except for well 12K175, have remained about the same or decreased slightly (fig. 7). Concentrations in well 12K175 increased from 6.8 mg/L in January 2021 to 7.3 mg/L in November 2022 (table 1).
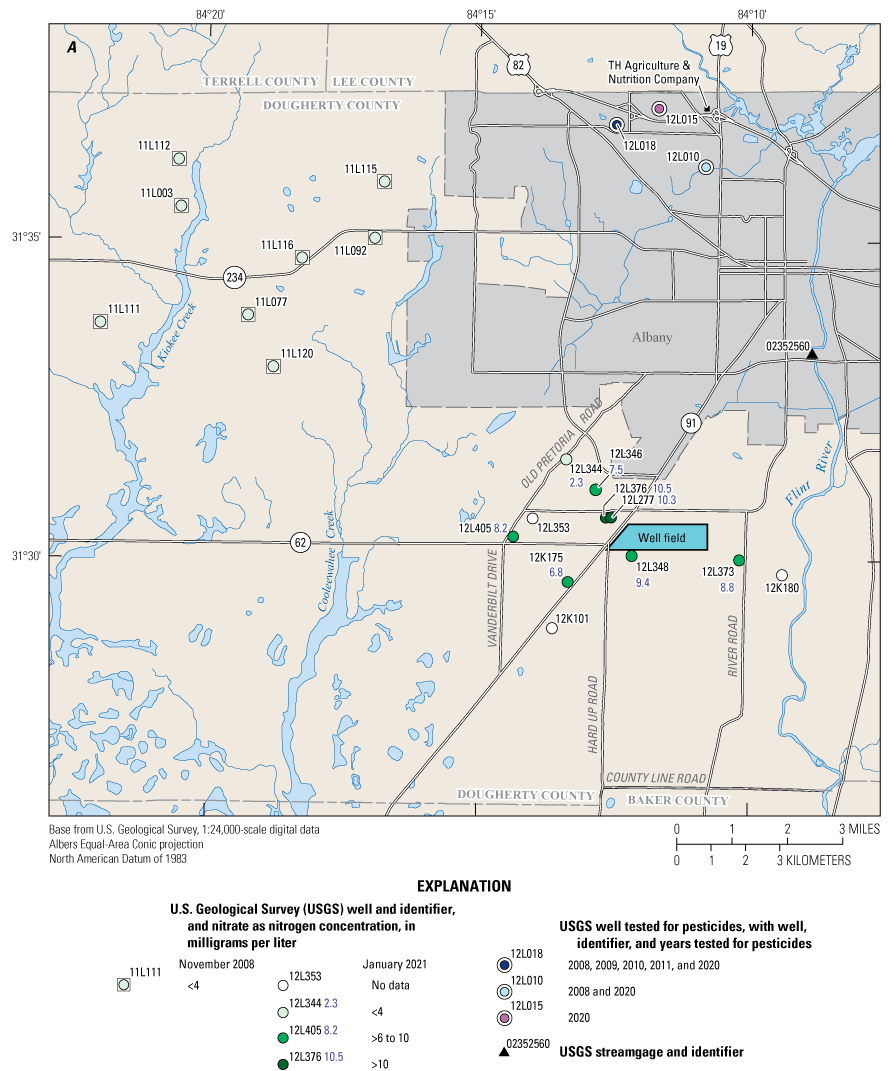
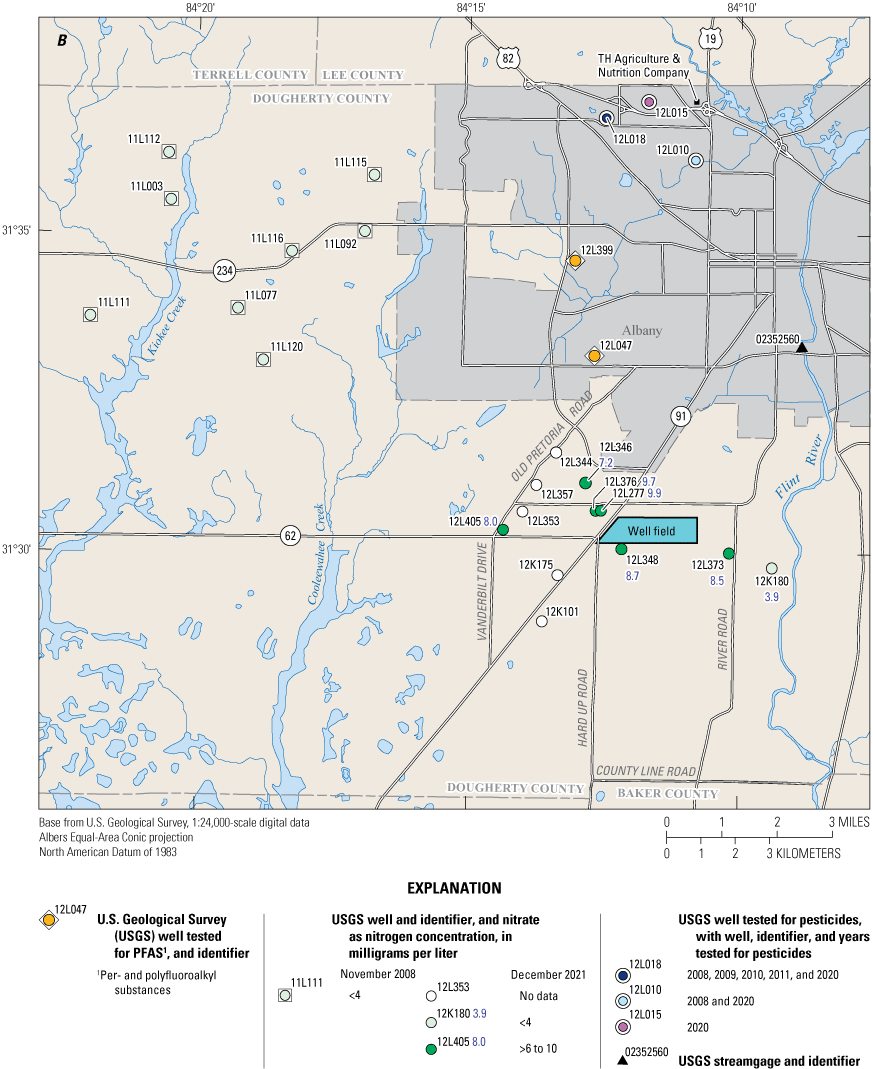
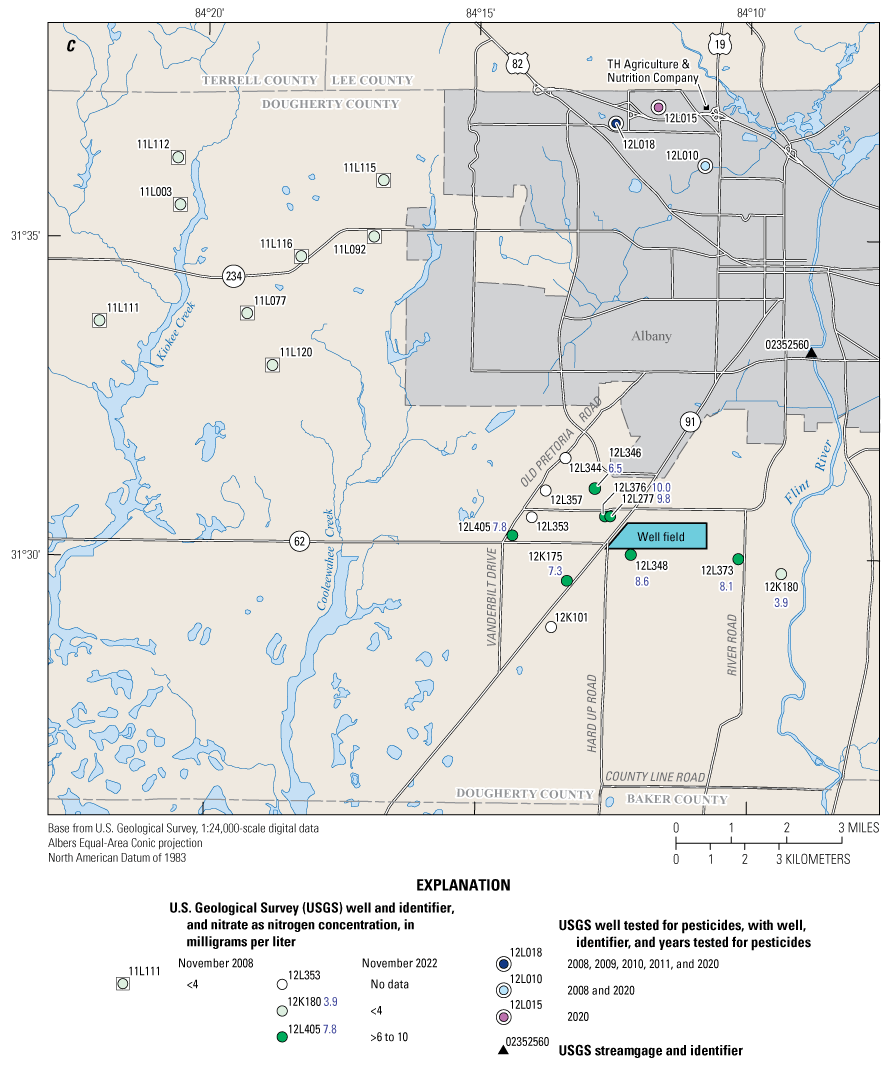
Nitrate plus nitrite as nitrogen concentrations in the Upper Floridan aquifer for A, January 2021, B, December 2021, and C, November 2022; wells sampled for pesticides during 2008–11 and 2020; and wells sampled for per- and polyfluoroalkyl substances during 2021, Albany area, Georgia. All wells completed in Upper Floridan aquifer except for well 12L376, which is completed in surficial aquifer, and wells 12L010, 12L015, 12L018, 12L047, and 12L399, which are completed in the Claiborne and Clayton aquifers.
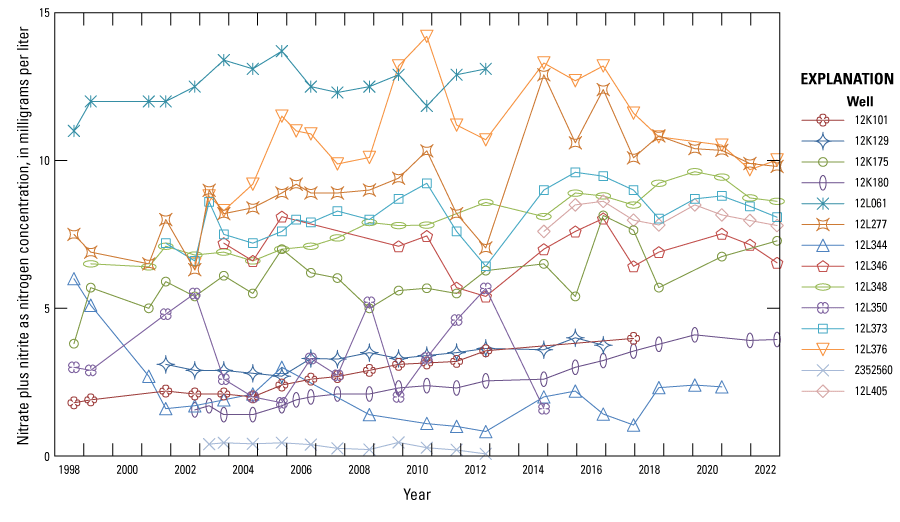
Concentrations of nitrate plus nitrite as nitrogen for select wells and the Flint River, 1998–2022, Albany area of Georgia.
Table 1.
Concentrations of nitrate plus nitrite as nitrogen, in milligrams per liter, for select wells, January 2021–November 2022, Albany area of Georgia.[ND, no data]
Nitrate plus nitrite as N trend lines were fit using simple linear regression for the period of 1998 through 2022. Statistical significance was determined for the trend lines using the p-value of the regression fit, with a criterion of less than 0.05 indicating significance (StatsDirect Ltd, 2000). Of the nine wells sampled for nitrate plus nitrite as N during 2021 and 2022, six were determined to have significant nitrate plus nitrite as N trends—five wells have significant increasing trends, and one well has a significant decreasing trend. Four of the wells with significant nitrate plus nitrite as N trends were chosen to represent trends in the study area and are shown in figure 8. Well 12L277, downgradient from the previously described area of elevated nitrate plus nitrite as N concentrations and upgradient from the well field (fig. 6), has an increasing nitrate plus nitrite as N trend of 0.16 milligram per liter per year. The nitrate plus nitrite as N concentrations in well 12L277 range from 6.3 mg/L during 2002 to 12.9 mg/L during 2014 (fig. 8) but have dropped to just below the U.S. Environmental Protection Agency maximum contaminant level of 10 mg/L (40 CFR, part 141, subpart B) for nitrate in drinking water in December 2021 (9.9 mg/L) and November 2022 (9.8 mg/L). Water-quality results from well 12L344 indicate that concentrations of nitrate plus nitrite as N were 6.0 mg/L in 1998 but have been at or below 3.0 mg/L since 2001 (fig. 8). This well is adjacent to an area of past organic fertilizer application (Wenner and Reyher, 1999; Warner and Lawrence, 2005). The trend analysis was run for well 12L344 a second time without the data points from 1998 and 1999 and showed no significant trend. The decrease from 1999 may indicate that the nitrate plus nitrite as N has reached a steady-state condition in this area. Nitrate plus nitrite as N concentrations in well 12L348 increased at a rate of 0.13 milligram per liter per year since 1998; however, levels have decreased from 9.6 mg/L during January 2020 to 8.6 mg/L in November 2022. Well 12L373 has an overall increasing nitrate plus nitrite as N trend from 1998 through 2022; however, recent sample results indicate a decreasing trend from 2016 through 2022 (fig. 8).
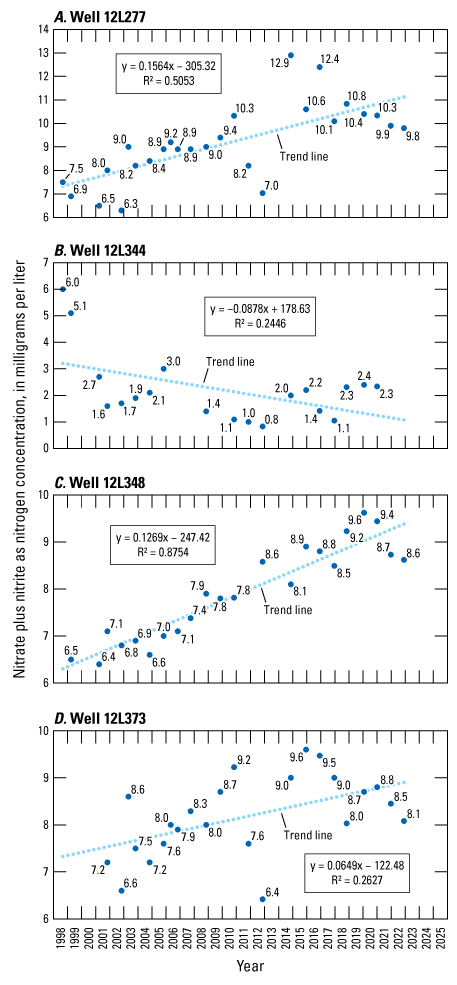
Concentrations and linear regression trend line of nitrate plus nitrite as nitrogen for select wells, 1998–2022, Albany area of Georgia.
Two Albany Utility production wells, 12L047 and 12L399, were sampled for PFAS as part of a larger study conducted by the USGS (fig. 6; Smalling and others, 2023). Well 12L047 had one count of PFAS detected, perfluorobutanesulfonic acid at 3.8 nanograms per liter (ng/L), which is an estimate because it is below the reporting limit. Newly proposed maximum contaminant levels for perfluorooctane sulfonic acid (PFOS; 4 ng/L) and perfluorooctanoic acid (PFOA; 4 ng/L) were released in March 2023 by the U.S. Environmental Protection Agency as part of the National Primary Drinking-water Standards Rule (U.S. Environmental Protection Agency, 2023). Water-quality data for the Flint River and wells sampled as part of this investigation may be obtained from the USGS NWIS database at https://nwis.waterdata.usgs.gov/usa/nwis/qw (USGS, 2024).
Summary
The U.S. Geological Survey has been working cooperatively with Albany Utilities to monitor groundwater quality and availability since 1977. Groundwater in the Upper Floridan aquifer generally flows southward and toward the Flint River. During April 2020 through January 2023, water levels in the Upper Floridan and Claiborne aquifers were generally above median levels, based on the period of record data. Water levels in the Clayton and Cretaceous aquifers were near or below median levels.
Groundwater samples were collected from eight wells during January 2021, seven wells during December 2021, and eight wells during November 2022. Nitrate plus nitrite as nitrogen concentrations ranged from 9.7 to 10.5 milligrams per liter (mg/L) in the surficial aquifer and from 2.3 to 9.9 mg/L in the Upper Floridan aquifer. Upper Floridan aquifer well 12L277 has had nitrate plus nitrite as nitrogen concentrations between 9.8 and 12.9 mg/L since 2014. No pesticides were detected in the samples.
References Cited
Evenson, E.J., Orndorff, R.C., Blome, C.D., Böhlke, J.K., Hershberger, P.K., Langenheim, V.E., McCabe, G.J., Morlock, S.E., Reeves, H.W., Verdin, J.P., Weyers, H.S., and Wood, T.M., 2012, Strategic directions for U.S. Geological Survey water science, 2012–2022—Observing, understanding, predicting, and delivering water science to the Nation: U.S. Geological Survey Open-File Report 2012–1066, 42 p., accessed June 5, 2024, at https://doi.org/10.3133/ofr20121066.
Gordon, D.W., 2008, Ground-water conditions and studies in the Albany area of Dougherty County, Georgia, 2007: U.S. Geological Survey Open-File Report 2008–1328, 49 p., accessed September 25, 2024, at https://pubs.usgs.gov/of/2008/1328/.
Gordon, D.W., 2009, Groundwater conditions and studies in the Albany area of Dougherty County, Georgia, 2008: U.S. Geological Survey Open-File Report 2009–1244, 54 p., accessed October 31, 2024, at https://doi.org/10.3133/ofr20091244.
Gordon, D.W., 2020, Groundwater quality and groundwater levels in Dougherty County, Georgia, April 2019 through March 2020: U.S. Geological Survey Open-File Report 2020–1120, 12 p., accessed September 25, 2024, at https://doi.org/10.3133/ofr20201120.
Gordon, D.W., Painter, J.A., and McCranie, J.M., 2012, Hydrologic conditions, groundwater quality, and analysis of sink hole formation in the Albany area of Dougherty County, Georgia, 2009: U.S. Geological Survey Scientific Investigations Report 2012–5018, 60 p., accessed September 25, 2024, at https://doi.org/10.3133/sir20125018.
National Drought Mitigation Center, 2024, U.S. Drought Monitor: National Drought Mitigation Center database, accessed January 25, 2024, at https://droughtmonitor.unl.edu/DmData/TimeSeries.aspx.
Peck, M.F., Gordon, D.W., and Painter, J.A., 2013, Groundwater conditions in Georgia, 2010–2011: U.S. Geological Survey Scientific Investigations Report 2013–5084, 63 p., accessed September 25, 2024, at https://pubs.usgs.gov/sir/2013/5084.
Smalling, K.L., Romanok, K.M., Bradley, P.M., Morriss, M.C., Gray, J.L., Kanagy, L.K., Gordon, S.E., Williams, B.M., Breitmeyer, S.E., Jones, D.K., DeCicco, L.A., Eagles-Smith, C.A., and Wagner, T., 2023, Per- and polyfluoroalkyl substances (PFAS) in United States tapwater—Comparison of underserved private-well and public-supply exposures and associated health implications: Environment International, v. 178, accessed October 31, 2024, at https://doi.org/10.1016/j.envint.2023.108033.
StatsDirect Ltd, 2000, P Values: StatsDirect web page, accessed July 8, 2020, at https://www.statsdirect.com/help/basics/p_values.htm.
U.S. Environmental Protection Agency, 2023, Per- and polyfluoroalkyl substances (PFAS)— Proposed PFAS national primary drinking water regulation: U.S. Environmental Protection Agency web page, accessed September 25, 2024, at https://www.epa.gov/sdwa/and-polyfluoroalkyl-substances-pfas.
U.S. Geological Survey [USGS], variously dated, National field manual for the collection of water quality data: U.S. Geological Survey Techniques and Methods, book 9, chaps. A0–A10, accessed September 29, 2020, at https://www.usgs.gov/mission-areas/water-resources/science/national-field-manual-collection-water-quality-data-nfm?qt-science_center_objects=0#qt-science_center_objects.
U.S. Geological Survey [USGS], 2020a, Groundwater monitoring—Albany-Dougherty County, Georgia: U.S. Geological Survey web page, accessed July 24, 2020, at https://www.usgs.gov/centers/sa-water/science/groundwater-monitoring-program-albany-dougherty-county-area.
U.S. Geological Survey [USGS], 2020b, USGS cooperative matching funds: U.S. Geological Survey web page, accessed July 23, 2020, at https://www.usgs.gov/mission-areas/water-resources/science/usgs-cooperative-matching-funds?qt-science_center_objects=0#qt-science_center_objects.
U.S. Geological Survey [USGS], 2024, USGS water data for the Nation: U.S. Geological Survey National Water Information System database, accessed January 13, 2024, at https://doi.org/10.5066/F7P55KJN. [Groundwater information directly accessible at https://nwis.waterdata.usgs.gov/usa/nwis/gwlevels.]
Warner, D., and Lawrence, S.J., 2005, Ground-water flow and water quality of the Upper Floridan aquifer, southwestern Albany area, Georgia, 1998–2001: U.S. Geological Survey Scientific Investigations Report 2005–5047, 77 p., accessed September 25, 2024, at https://pubs.usgs.gov/sir/2005/5047/.
Wenner, D.B., and Reyher, S.M., 1999, Investigation of the source of nitrate contamination in the Upper Floridan aquifer near Albany, Georgia, in Hatcher, K.J., ed., Proceedings of the 1999 Georgia water resources conference, Athens, Ga., March 20–22, 1999: Athens, Ga., The University of Georgia, p. 507–510.
Conversion Factors
Datums
Vertical coordinate information is referenced to the National Geodetic Vertical Datum of 1929 (NGVD 29).
Horizontal coordinate information is referenced to North American Datum of 1983 (NAD 83).
Supplemental Information
Concentrations of chemical constituents in water are given in milligrams per liter (mg/L) or nanograms per liter (ng/L).
For more information about this publication, contact
Director, South Atlantic Water Science Center
U.S. Geological Survey
1770 Corporate Drive, suite 500
Norcross, GA 30093
For additional information, visit
https://www.usgs.gov/centers/sawsc
Publishing support provided by
Lafayette Publishing Service Center
Disclaimers
Any use of trade, firm, or product names is for descriptive purposes only and does not imply endorsement by the U.S. Government.
Although this information product, for the most part, is in the public domain, it also may contain copyrighted materials as noted in the text. Permission to reproduce copyrighted items must be secured from the copyright owner.
Suggested Citation
Gordon, D.W., 2024, Groundwater quality and groundwater levels in Dougherty County, Georgia, April 2020 through January 2023: U.S. Geological Survey Open-File Report 2024–1060, 14 p., https://doi.org/10.3133/ofr20241060.
ISSN: 2331-1258 (online)
Study Area
| Publication type | Report |
|---|---|
| Publication Subtype | USGS Numbered Series |
| Title | Groundwater quality and groundwater levels in Dougherty County, Georgia, April 2020 through January 2023 |
| Series title | Open-File Report |
| Series number | 2024-1060 |
| DOI | 10.3133/ofr20241060 |
| Publication Date | November 05, 2024 |
| Year Published | 2024 |
| Language | English |
| Publisher | U.S. Geological Survey |
| Publisher location | Reston, VA |
| Contributing office(s) | South Atlantic Water Science Center |
| Description | Report: vi, 14 p.; Data Release |
| Country | United States |
| State | Georgia |
| County | Dougherty County |
| Online Only (Y/N) | Y |


