

Topographic and Bathymetric Survey in Support of the Effectiveness Assessment of the Living Shoreline Restoration in Gandys Beach, New Jersey
Links
- Document: Report (11.3 MB pdf) , HTML , XML
- Data Release: USGS Data Release - Topo-bathymetric survey at Gandys Beach, New Jersey, 2018
- NGMDB Index Page: National Geologic Map Database Index Page (html)
- Download citation as: RIS | Dublin Core
Acknowledgments
This study was funded by the National Fish and Wildlife Foundation (project no. 55032). We are grateful to Moses Katkowski, Adrianna Zito-Livingston (The Nature Conservancy), Eric Schrading, Danielle Mcculloch (U.S. Fish and Wildlife Service), and Kelin Hu (Tulane University) for their assistance in field data collection.
We also thank Chris Witzigman and Michael Noll (U.S. Geological Survey) for their assistance in field data collection and analysis.
Abstract
High resolution topobathymetric field surveys were conducted by the U.S. Geological Survey in collaboration with Northeastern University and in cooperation with the U.S. Fish and Wildlife Service and The Nature Conservancy in a selected shoreline along Gandys Beach, New Jersey, from January to April 2018. These data are a critical model input for hydrodynamic and wave models and can affect the accuracy of model outputs such as wave height, water surface elevation, current velocity, and sediment transport. Gandys Beach is a living shoreline where constructed oyster reefs (CORs) were built to protect the shoreline and enhance habitat for oyster and other species. Because of the complex topography and bathymetry of the study area, higher spatial resolution topobathymetric data are required to resolve the vertical variations near the CORs. During the field survey, the global navigation satellite system positioning method was used to establish the elevation of a benchmark referenced to the North American Vertical Datum of 1988. The topobathymetric data were collected using a total station. Horizontal accuracy of plus or minus 0.05 foot (ft) and vertical accuracy of plus or minus 0.10 ft were calculated using root mean square error between duplicate surveys. Two existing datasets were integrated with the survey data to create an updated topobathymetric dataset for model input and analysis: (1) the U.S. Geological Survey Coastal National Elevation Database 1-meter resolution data developed after Hurricane Sandy and (2) The Nature Conservancy 2017 elevation monitoring data at 10-meter resolution. A root mean square error analysis comparing survey data with the new topobathymetric dataset versus the survey data compared to the original Coastal National Elevation Data dataset showed errors of 0.31 and 2.61 ft, respectively. This improved dataset can be used for wave and hydrodynamic modeling in support of the effectiveness assessment of the CORs and living shoreline restoration along Gandys Beach.
Introduction
Since Hurricane Sandy (2012), the construction of living shoreline structures along the northeast and mid-Atlantic coasts has become a prevalent method to restore damaged shorelines and provide protection from future storms. Living shoreline projects utilize a variety of organic materials such as constructed oyster reefs (CORs), wetland plants, and submerged aquatic vegetation to stabilize shorelines, protect coastal marshes from erosion, and enhance habitat for oyster and other species (Manis and others, 2015; Sharma and others, 2016; Polk and Eulie, 2018; Chowdhury and others, 2019; Wiberg and others, 2019; Morris and others, 2021). Whether or not a living shoreline project can protect the coastal shoreline area from storm-induced erosion and enhance habitat for oyster and other fishery species is dependent on the capacity of the living shoreline structure to attenuate wave energy and therefore affect water current fluxes driving sediment transport, the major forces driving shoreline change (Wiberg and others, 2019; Zhu and others, 2020).
For CORs to attenuate wind-driven waves, there is a strong dependency on the ratio between the freeboard (the vertical distance from the water surface to the crest of the COR) and incident wave height (Wiberg and others, 2019; Zhu and others, 2020; Morris and others, 2021). When the CORs are emergent, up to 60 percent of wave energy can be attenuated by the structure (Zhu and others, 2020; Wang and others, 2021a). The wave attenuation capacity of these structures diminishes with increased inundation depth. For example, there will be only up to 35 percent attenuation if the structure is slightly submerged (Zhu and others, 2020). In contrast, during high tide when the structure is deeply submerged, there will be limited wave attenuation or even wave height amplification at the leeside of the submerged living shoreline structure (Zhu and others, 2020; Wang and others, 2021a; Salatin and others, 2022). This wave attenuation dependency is attributed to complex nearshore processes including wave shoaling, wave diffraction, and wave focusing (Zhu and others, 2020). Wave attenuation by living shoreline structures depends on factors including structure configuration (for example, crest freeboard), surrounding topography, and local wave parameters (for example, swell or wind wave dominant, wave period, and swell direction). Therefore, accurate elevation data are critical to defining water depth in relation to the living shoreline structure and thus to evaluating wave attenuation and circulation pattern change.
Coastal shorelines are dynamic ecosystems with changing geomorphology in space and time that necessitates timely collection of topobathymetric data. In addition to being a fundamental step for shoreline change detection and prediction, topobathymetric surveys provide important input data to numerical wave and hydrodynamic models. Accurate topobathymetric data are needed to define model grids for simulating wave height, water surface elevation, current velocity, and sediment transport (mass and concentration), which are critical hydrological forces in determining the effects of living shoreline structures on reduction of wave energy and sediment erosion. For wind-driven wave modeling, a finer spatial resolution is desirable to capture the rapid variation of wave height over shallow water estuaries in a short distance from offshore to nearshore (for example, Chen and others, 2005; Bak and others, 2019; Zhu and others, 2020; Salatin and others, 2022).
During January–April 2018, the U.S. Geological Survey (USGS), in collaboration with Northeastern University and in cooperation with the U.S. Fish and Wildlife Service and The Nature Conservancy (TNC), conducted a monitoring and modeling study of wave height, current velocity, and sediment transport dynamics in living shorelines along the northeast Atlantic Coast with living shoreline structures that were constructed in 2016. These parameters were measured along Gandys Beach, New Jersey, shorelines with and without living shoreline structures in order to assess the effectiveness of the living shoreline structures in wave attenuation, circulation pattern change, and sediment transport dynamics and to develop a modeling system for predicting the effectiveness of the living shoreline structures under future storm conditions (Wang and others, 2021a). This report describes an approach for collecting and refining high resolution topobathymetric data.
Study Area
Gandys Beach is a 2,700-acre preserve managed by TNC along the southern shore of New Jersey (fig. 1) (TNC, 2024). It includes approximately (≈) 1 mile of Delaware Bay coastline bounded by the Nantuxent Creek to the north, the community of Money Island to the north and east, and Delaware Bay to the west and south (fig. 1). The area is undeveloped, with irregularly spaced dwellings along the shoreline and agricultural land to the east. The lunar tide in the area is semidiurnal with a range of 6 feet (ft) (Zhu and others, 2020; Wang and others, 2021a). The land includes vegetated marsh areas (consisting of Phragmites spp. and Spartina alterniflora), mudflats, and sandy beaches. The marsh shows varying degrees of vegetation fragmentation, with many areas exhibiting exposed root systems. The Gandys Beach shoreline area provides a habitat for marine fish, invertebrates, and mammals and is a nesting area for various shorebirds (Wang and others, 2021a).
The shoreline of Delaware Bay is prone to erosion from large coastal storms and frequent high energy events, which cause storm-tide flood inundation (Zhu and others, 2020). In 2012, Hurricane Sandy impacted the area and prompted the installation of CORs as a part of the Gandys Beach living shoreline project (3,000-ft linear green infrastructure of CORs, shell bags, and coir logs). These CORs are made from concrete blocks that have a proprietary formulation to promote oyster colonization and growth. The blocks interlock and provide a stable structure for oyster reefs to form. The CORs in the study area are ≈18 ft long, ≈6 ft wide, and ≈3 ft tall and composed of five stacked layers (fig. 2).
A section of the Gandys Beach living shoreline, consisting of six CORs, was selected as the study area (fig. 1) for data collection from January to April 2018. This time of year was chosen because of a higher likelihood for the occurrence of high energy events (such as nor’easters), thereby providing an opportunity to collect wave, current, and sediment data across a wider range of environmental conditions to better assess the effectiveness of the CORs in attenuating wave and current energy and thus protecting the shoreline from erosion (Wang and others, 2021a).
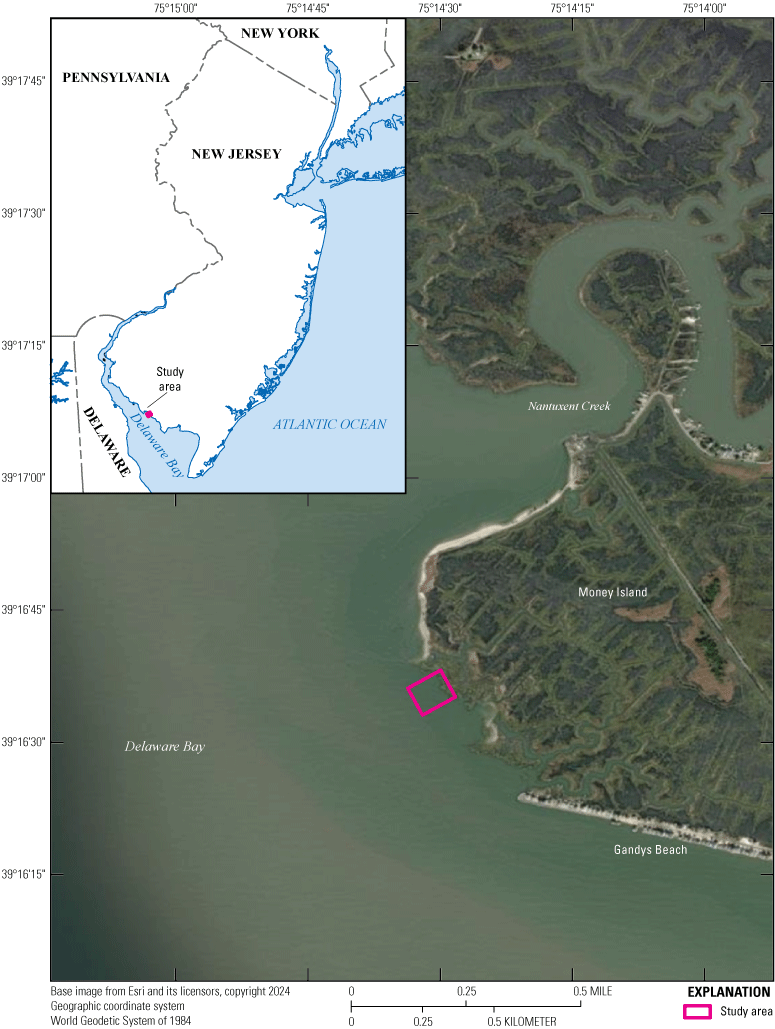
Location of the study area along the southern shore of New Jersey.
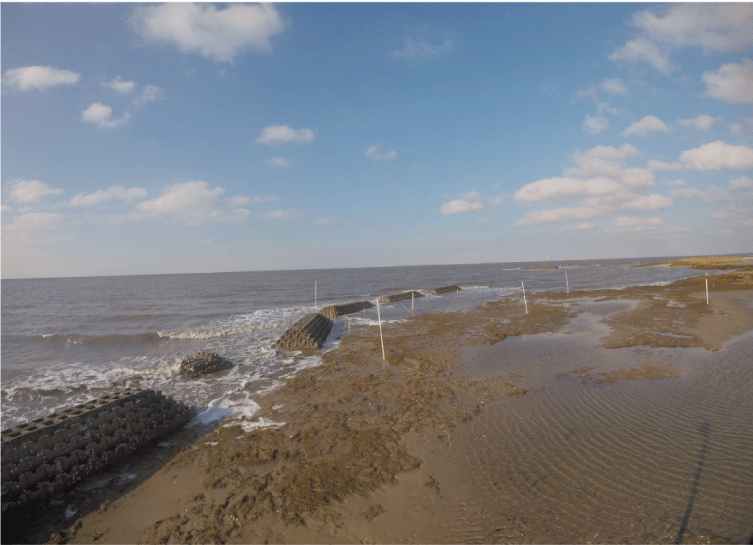
Examples of the constructed oyster reefs along the living shoreline in Gandys Beach, New Jersey. Photograph by Hongqing Wang, U.S. Geological Survey, February 2, 2018.
Methods
Six submersible pressure transducers (Ocean Sensor Systems, Inc., OSSO-010-003C) were deployed as wave gages (WGs) to measure wave height, wave period, and water level elevation. Four WGs were arranged in a transect through the CORs (transect 1), and two WGs were arranged in a control transect with no CORs (transect 2) (fig. 3A). Seven tilt current meters (TCMs) (Lowell Instruments, LLC) were deployed adjacent to the CORs and three of the WGs (fig. 3A; one TCM, TCM3, was not recovered). Six of the TCMs were the TCM-1 model (75 centimeters [cm] long, speed range 0–80 centimeters per second [cm/s]), and one TCM was the TCM-4 shallow water model (25 cm long, speed range 0–75 cm/s). All wave and current data were used to evaluate the capacity of CORs in attenuating wave energy and changing current patterns both horizontally and vertically (Zhu and others, 2020; Wang and others, 2021a; Salatin and others, 2022; Zhu and others, 2023). These hydrodynamic data were also used to aid in calibrating and validating the wave and hydrodynamic models (Salatin and others, 2022; Zhu and others, 2023). Wave and current data were published in USGS data releases for wave data (Wang and others, 2020) and for current velocity data (Wang and others, 2021b). At the same time that the wave and current data were being collected, sediment accumulation on the marsh surface and in the water column (1 ft above bed surface), marsh edge erosion, and sediment properties (grain size distribution) were measured using sediment traps, marsh pins, and sediment cores (fig. 3B). Sediment data and analysis results were published in Wang and others (2021a).
The USGS Coastal National Elevation Database (CoNED) (Danielson and others, 2016) includes a 1-meter (m) resolution topobathymetric digital elevation model (TBDEM) compiled in 2015 for New Jersey and Delaware (USGS, 2015), and TNC provided topographic change monitoring data from 2017 at 10-m resolution for the Gandys Beach living shoreline project area (TNC, written commun., 2018). To supplement these datasets, higher resolution topobathymetric surveys were conducted in the study area by using global navigation satellite system (GNSS) and total station survey methods. Both real-time network (RTN) and static satellite techniques were utilized to determine elevation in feet above the North American Vertical Datum of 1988 (NAVD 88).
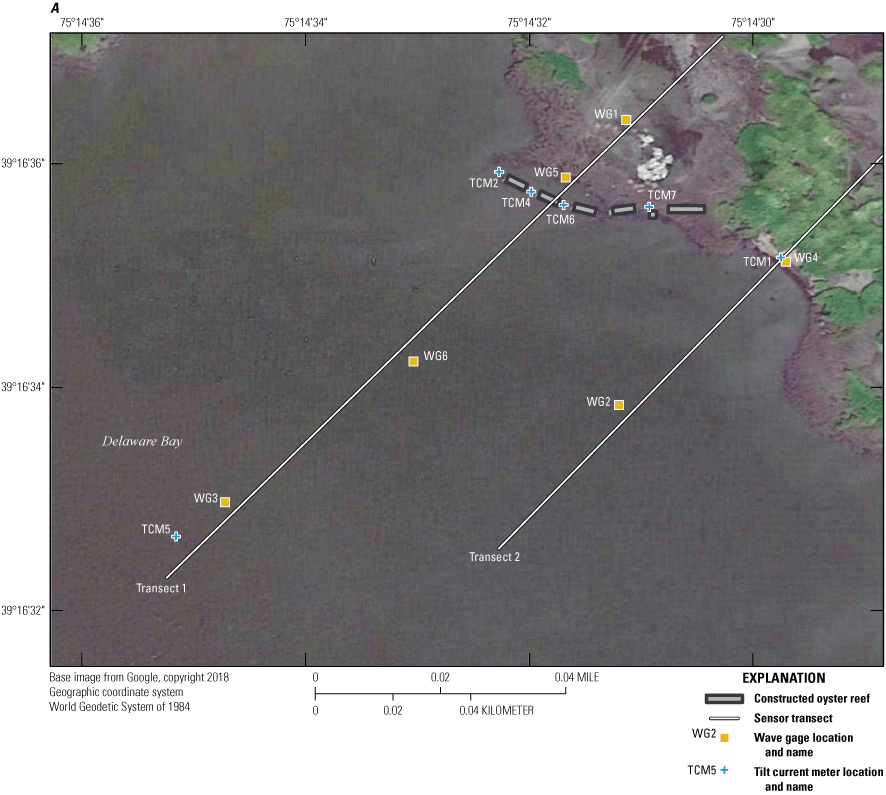
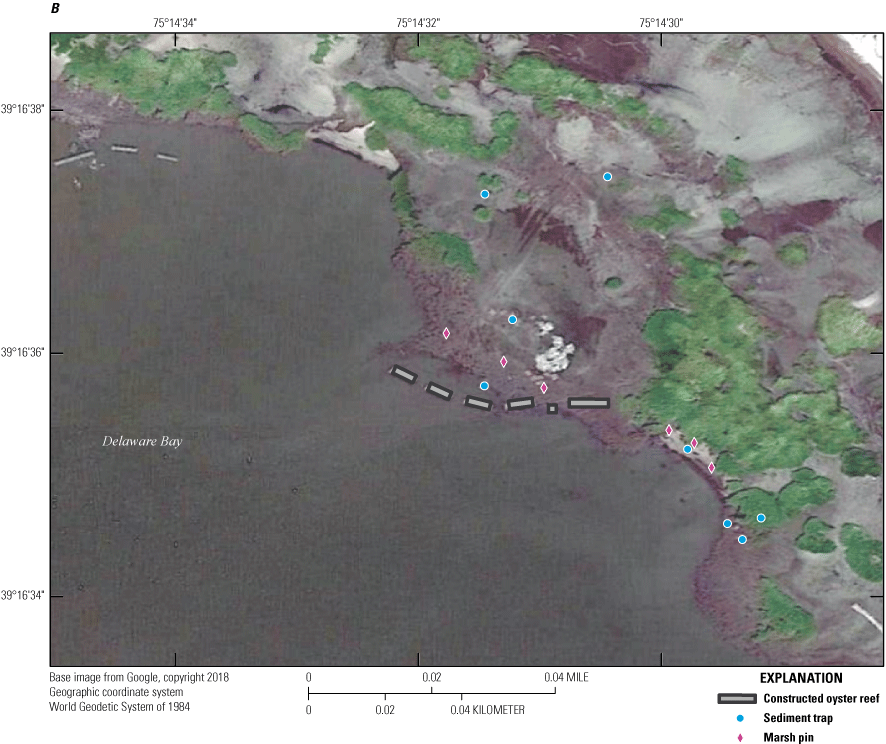
Locations of A, wave gages (WG), tilt current meters (TCM), B, sediment trap/pin sets, and marsh edge erosion pins along the selected Gandys Beach living shoreline project area, New Jersey.
Global Navigation Satellite System Survey
Static, rapid static (RS), and RTN GNSS surveys were conducted to ensure an accurate elevation for the primary benchmark and to compare the methods of each approach (Rydlund and Densmore, 2012) for future deployments. Static surveys involve a GNSS antenna set up over a ground point that collects positional data over time. These data are then processed with positional data from nearby continuously operated reference stations to obtain accurate coordinates of the ground point (Rydlund and Densmore, 2012). However, those results require at least 2 hours of occupation time with the antenna remaining stable. An RS survey follows the same outline as a static survey, but a difference in postprocessing algorithms allows for position computed from as little as 15 minutes of occupation time.
RTN surveys require an antenna collecting position data that is working with a controller connected to the internet. The controller receives information from nearby control stations and corrects the antenna data in real time. This type of survey can compute an elevation in 180 epochs (about 3 minutes) but requires check measurements on benchmarks of known quality and elevation, as well as cellular data coverage for the controller’s internet connection.
On January 30, 2018, a 1-m Feno spike (Berntsen International Inc.) was installed and monumented as the primary benchmark designated “Gandys Beach benchmark” (GBBM) on a high dune with firm, dry sand, ≈300 ft northwest of the CORs (fig. 4). This mark was used as the vertical control point for all trigonometric surveying, and an accurate elevation was obtained with GNSS surveys.
All GNSS surveys were conducted with a combined antenna and receiver unit (Trimble R10 and TSC3) adhering to USGS level III standards (Rydlund and Densmore, 2012). On January 31, 2018, a 3-hour static GNSS survey was collected, and the observation was later postprocessed through the National Geodetic Survey (NGS) Online Positioning User Service (OPUS). A 15-minute RS survey was also collected and postprocessed through OPUS-RS. On April 5, 2018, a 2.5-hour static survey and 15-minute RS survey were conducted and postprocessed to measure any change in elevation.
On March 16, 2018, an NGS benchmark (designated “AA7211”) was recovered ≈4 miles from the study area and was used to provide ground truth for the RTN surveys. The mark is described as a disk in concrete with an elevation of 9.751 ft above NAVD 88. RTN surveys checked in and out on this mark. Following USGS blunder check procedures described by Rydlund and Densmore (2012), duplicate occupations were done for AA7211 and GBBM, and the results were averaged for a final elevation. The RTN survey was repeated on April 3, 2018, during the wave and current sensor retrieval.
Total Station Surveys
Five total station surveys (fig. 4) were conducted during three site visits (January, March, and April 2018), and the combined results provided the sediment elevation surface, COR dimensions, and sensor elevation data necessary for the wave and current data analysis and hydrodynamic modeling described in Zhu and others (2020) and Wang and others (2021a). All points were measured using a total station (Trimble 5603 DR200+ and TSC2) and an adjustable-height prism pole equipped with a flat topo shoe. The surveys were collected on a local horizontal coordinate system, and baselines were established between GBBM (fig. 4) and WG1 (fig. 3A). Instrument setups and the inshore WGs (WG1, WG4, and WG5; fig. 3A) had North American Datum of 1983 (NAD 83) coordinates recorded with the Wide Area Augmentation System-enabled internal antenna of the TSC3 controller (plus or minus 10 ft) to orient the survey during postprocessing.
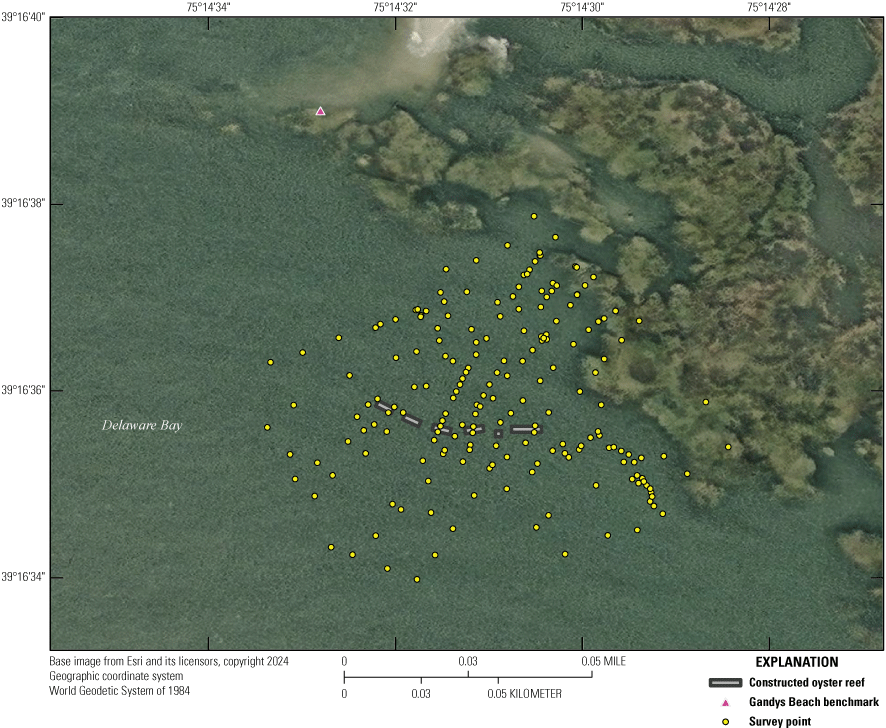
Distribution of elevation survey points across the shoreline with and without constructed oyster reefs along the selected Gandys Beach living shoreline project area, New Jersey.
To transform (rotate and translate) the local horizontal coordinate system to NAD 83, the Esri Spatial Adjustment tool was used (Esri, 2024a). The tool inputs survey points with both local horizontal coordinates and NAD 83 coordinates (instrument setups and inshore WGs), calculates the transformation, and outputs all survey points with the calculations applied. Additionally, the vertical components of the survey points were recomputed after GNSS results were processed and an accurate NAVD 88 elevation was available for GBBM.
Positioning of Survey Points
The placement of WGs, TCMs, and sediment measurements across the study area (fig. 3A, B) was determined by considering cross-shore and along-the-shore wave, current, and sediment movement; the impacts of the CORs were also considered. The position and density of survey points were determined on the basis of the following criteria: (1) covering the study area cross-shore with CORs and without CORs from offshore to onshore, (2) covering the study area along the shore to include the variation in topography along the shoreline, and (3) collecting higher densities in areas with large topobathymetric variations (for example, places near the CORs and boundaries between marsh edge and mudflat) (Wang and others, 2021a).
Two points of each COR, the tops of the alongshore ends, were surveyed, and the dimensions (height, width, and length) were measured with a tape (fig. 5). Together, the data allowed three-dimensional CORs to be included in the model and to be evaluated in how their crest and freeboard relate to dissipation of wave energy during coastal storms (Zhu and others, 2020).
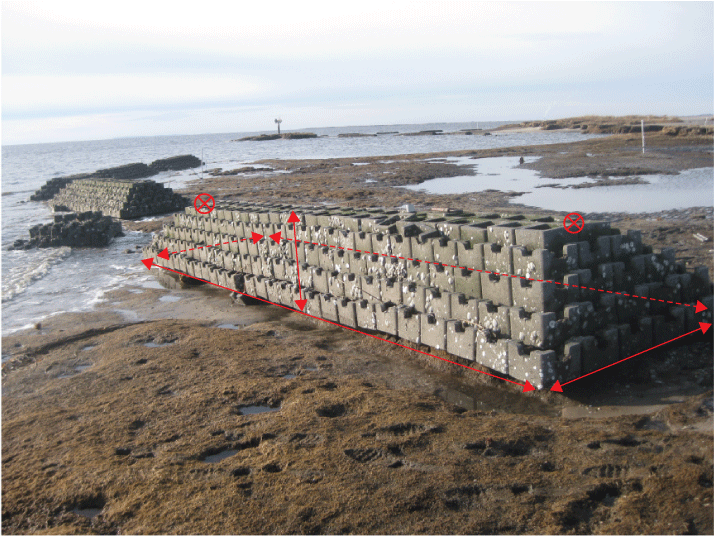
Measurements collected to represent constructed oyster reefs in hydrodynamic models for predicting the effectiveness of the living shoreline structures under future storm conditions along the living shoreline in Gandys Beach, New Jersey. Red circled X’s represent positions collected in the total station survey. Red arrows indicate dimensions measured with a tape. Photograph by Hongqing Wang, U.S. Geological Survey, February 2, 2018.
Integration of Field Survey With USGS CoNED and TNC Survey Data
The USGS CoNED TBDEM for New Jersey and Delaware (USGS, 2015) along Gandys Beach was downloaded using the CoNED Viewer and download tool (https://topotools.cr.usgs.gov/topobathy_viewer/). TNC provided topography data after the construction of the CORs, with data representing elevations in 2017 (TNC, written commun., 2018).
The CoNED TBDEM was refined on the basis of both the TNC data and the survey data collected in this study by using RGFGrid, the grid generation module of Delft3D (Deltares, 2018). The point features in the study area with latitude, longitude, and elevation from the updated TBDEM were exported in XYZ format with a spatial resolution of 0.2 m and converted to raster data format by using the Point to Raster tool in ArcGIS (Esri, 2024b).
Results and Discussion
The following results are organized into three sections: (1) analyzing the accuracy of the total station survey based on GNSS survey results, (2) comparing the total station survey and 2017 TNC elevation data with the 2015 CoNED TBDEM, and (3) assessing the updated TBDEM for accuracy and improvement.
Topobathymetric Survey Data Distribution and Accuracy
The topobathymetric survey produced a total of 196 points along the Gandys Beach living shoreline (Capurso and others, 2022) (fig. 4). For numerical accuracy of spatial data, the National Standard for Spatial Data Accuracy method that computes the root mean square error (RMSE) at the 95-percent confidence level of the survey data is acceptable (Wilson and Richards, 2006; Rydlund and Densmore, 2012). Horizontal accuracy of plus or minus 0.05 ft and vertical accuracy of plus or minus 0.10 ft were calculated using the RMSE between duplicate survey points (WGs and TCMs). The accuracies of the elevation measurements using the GNSS static and RS methods were determined using point measurements at the control point (GBBM). The overall RMSEs using the static method were 0.043 and 0.046 ft for deployment and retrieval periods, respectively (table 1). The methods in Rydlund and Densmore (2012) require an overall RMSE of less than or equal to 0.16 ft for a level III survey. For the RS method, the normalized RMSEs were 0.334 and 0.336 (dimensionless) for the deployment and retrieval periods, respectively (table 1). The methods in Rydlund and Densmore (2012) require a normalized RMSE between 0.1 and 1 for a level III survey. For the GNSS RTN method, the accuracy of elevation measurements was determined by the difference between measured and known elevation values at GBBM and the NGS benchmark AA7211 during the check visit and retrieval period. AA7211 was last recovered in 2013 and has a stability rating C, which is described as follows: “May hold, but of type commonly subject to surface motion” (Hailegeberel and others, 2018, p. 6). The differences were –0.211 to –0.186 ft for the check visit and –0.176 to –0.172 ft for the retrieval period (table 2).
Table 1.
Global navigation satellite system static and rapid static survey results for vertical control point Gandys Beach benchmark at Gandys Beach, New Jersey.[Elevation is referenced to the North American Vertical Datum of 1988; ft, foot; %, percent; RMSE, root mean square error; NA, not applicable]
Table 2.
Global navigation satellite system real-time network survey results for vertical control point Gandys Beach benchmark (GBBM) at Gandys Beach, New Jersey.[Elevation is referenced to the North American Vertical Datum of 1988; ft, foot; PDOP, position dilution of precision; GNSS, global navigation satellite system; RT, real-time; NGS, National Geodetic Survey; AA7211, NGS benchmark; —, no data]
The OPUS solutions for all static and RS surveys, as well as the RTN surveys, were analyzed to determine if GBBM shifted during the deployment period. Within the accuracy limits of the survey methods (previously described), it did not appear that GBBM shifted, and the final elevation used to process raw survey data was the average of the static surveys: 2.641 ft above NAVD 88. It should be noted that, during the retrieval, GBBM was stable but protruding from the sediment surface, indicating ≈0.3 ft of sediment erosion during the period from January to April 2018 (Wang and others, 2021a). Nevertheless, the elevation measurements of GBBM indicate that there was no land subsidence measured during the deployment period. Less vertical erosion (less than 0.1 ft in the control area and the area protected by the CORs) was found in the vegetated shoreline in the study area compared to the unvegetated benchmark location (Wang and others, 2021a).
Spatial Variations in Shoreline Topobathymetric Changes at Gandys Beach
Two transects with survey points were selected to compare the vertical variations among the CoNED TBDEM, the TNC data, and the data from this survey in 2018 (fig. 6). The topobathymetric profiles are shown in figure 7.
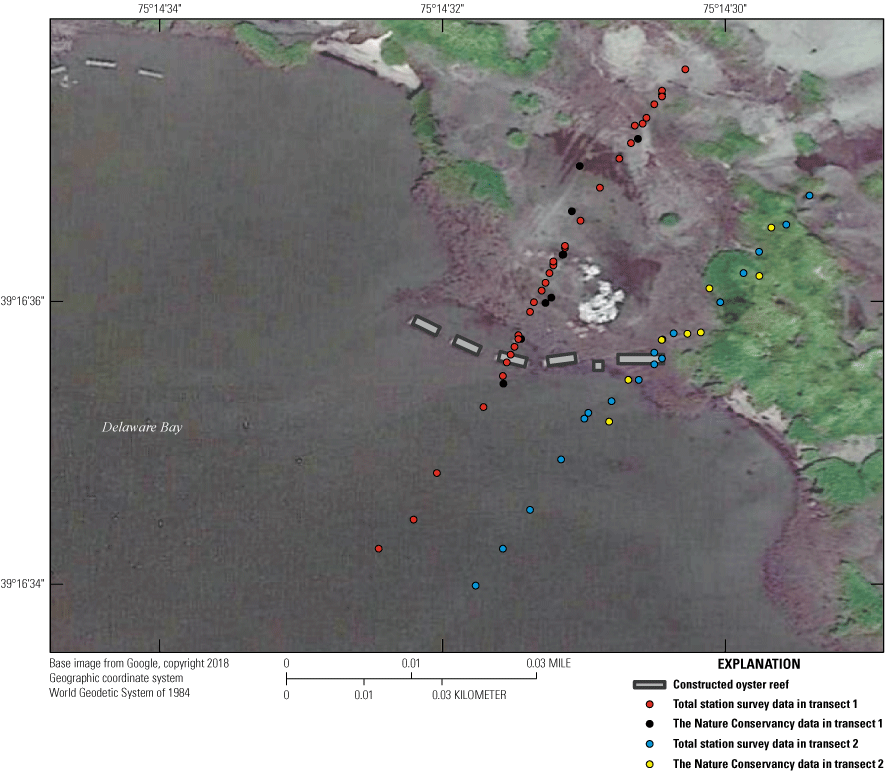
The locations for the two topobathymetric profiles of the constructed oyster reef (COR)-centered transect (transect 1) and the COR-adjacent transect (transect 2) along the selected Gandys Beach living shoreline project area, New Jersey. The transects are shown in figure 3A.
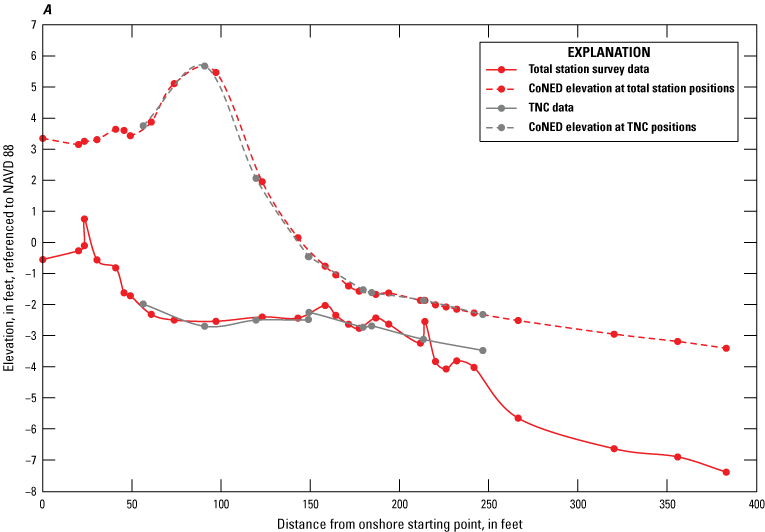
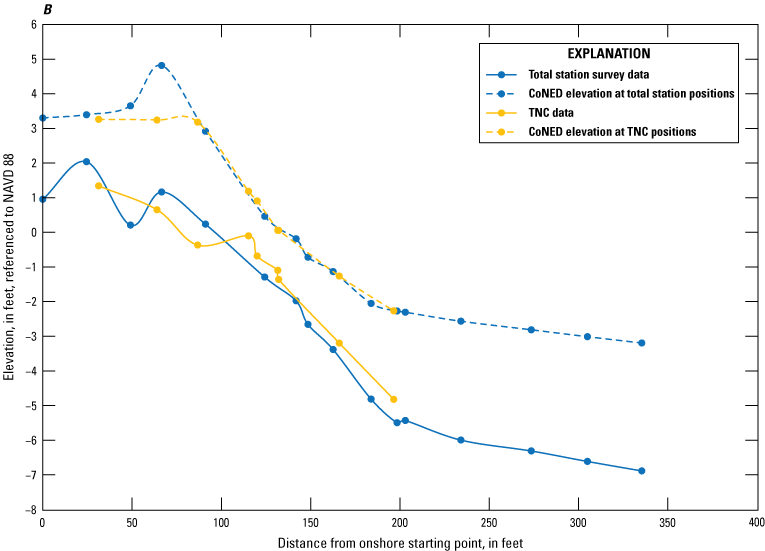
Comparisons of elevation values from the total station survey data (Capurso and others, 2022), the Coastal National Elevation Database (CoNED) data (U.S. Geological Survey, 2015), and The Nature Conservancy (TNC) survey data (TNC, written commun., 2018) over A, the constructed oyster reef (COR)-centered transect (transect 1) and B, the COR-adjacent transect (transect 2) along the selected Gandys Beach living shoreline project area, New Jersey. Each profile labeled CoNED uses the same horizontal coordinates as the survey data with elevation extracted from the CoNED digital elevation model. The transects are shown in figure 3A. NAVD 88, North American Vertical Datum of 1988.
Data from the 2018 total station survey indicated that the elevation decreased from –1.0 ft NAVD 88 near the onshore starting point to –7.5 ft NAVD 88 at the offshore end along the two transects (fig. 7A, B). The 2018 survey data showed elevation measurements along the two transects similar to the TNC 2017 survey data, indicating less than 1 ft of elevation change in the study area between 2017 and 2018 (fig. 7A, B). In contrast, there were large differences in elevation (greater than 7 ft) between the CoNED data and the 2018 survey data along the transect centered on the CORs, transect 1 (fig. 7A). For the transect adjacent to the CORs (transect 2), the elevation change was ≈4 ft (fig. 7B). Elevation differences found in the vertical profiles between the CoNED data and the 2018 total station survey data indicate that topobathymetric data for Gandys Beach can be updated with recent survey data to reflect changes in geomorphology and to more accurately assess the effectiveness of living shoreline structures in attenuating wave and current energy.
Improvement of Topobathymetric Data for Gandys Beach
Measurements of vertical change during January–April 2018 made by using sediment traps in the nearshore vegetated area near the CORs indicated a range of elevation change from an increase of 0.01 ft (vertical accretion) to a decrease of 0.08 ft (vertical erosion), as well as a large vertical erosion of ≈0.3 ft during the same period at one benchmark location (Wang and others, 2021a).
An accuracy assessment was conducted for the updated topobathymetric data by comparing the extracted elevation values from the updated TBDEM with the measured elevation data at the locations with WGs and TCMs that were not used in refining the CoNED data. Results indicated that the TBDEM was significantly improved, with the RMSE reduced from 2.61 ft (estimated from the original CoNED) to 0.31 ft from the CoNED refined with TNC data and elevation data from this study. With this updated, finer resolution topobathymetric data, modeling of wind waves and wave attenuation in shallow estuaries can be substantially improved compared to wave modeling using coarse resolution topobathymetric data (for example, Chen and others, 2005; Salatin and others, 2022).
Summary
Along Gandys Beach, New Jersey, in the upper Delaware Bay, constructed oyster reefs (CORs) were built in 2016 as a restoration measure after the passage and damage of Hurricane Sandy in 2012 in order to protect the shoreline from future storms. Numerical models are required to predict wave, current, and sediment dynamics in the living shoreline project area with and without COR protection. To conduct accurate wave and hydrodynamic modeling over shorelines with complex topobathymetric features, a fine resolution digital elevation model is needed to resolve the large vertical variations over a relatively small area and their impacts on nearshore wave processes such as shoaling, breaking, and focusing.
High resolution topobathymetric field surveys were conducted by the U.S. Geological Survey in collaboration with Northeastern University and in cooperation with the U.S. Fish and Wildlife Service and The Nature Conservancy in a selected section of the shoreline along the Gandys Beach living shoreline project area from January to April 2018. Topobathymetric data were collected by using global navigation satellite system and total station surveys. Both real-time network and static satellite techniques were utilized to determine the elevation of survey points across the study area with horizontal accuracy of plus or minus 0.05 foot and vertical accuracy of plus or minus 0.10 foot. Data from this study (conducted in 2018) were combined with 2015 U.S. Geological Survey Coastal National Elevation Database data (1-meter resolution) and 2017 The Nature Conservancy survey data (10-meter resolution) to create a higher resolution (0.2-meter resolution) topobathymetric digital elevation model (CORs in the study area were also incorporated) for wave, hydrodynamic, and sediment transport modeling.
With the updated topobathymetric digital elevation model for the Gandys Beach living shoreline study area, numerical models can better assess and predict the effects of living shoreline structures and local topobathymetric features on wave height, water surface elevation, current velocity, and sediment transport. Modeling results can be used for adaptive shoreline management under future climate change scenarios with increased frequency and intensity of storms.
References Cited
Capurso, W.D., Niemoczynski, L.M., Wang, H., Chen, Q., Snedden, G., and Zhu, L., 2022, Topo-bathymetric survey at Gandys Beach, New Jersey, 2018: U.S. Geological Survey data release, https://doi.org/10.5066/P9D1E202.
Esri, 2024a, About spatial adjustment: Esri web page, accessed August 16, 2024, at https://desktop.arcgis.com/en/arcmap/latest/manage-data/editing-existing-features/about-spatial-adjustment.htm.
Esri, 2024b, Tool reference—Point to Raster: Esri web page, accessed August 16, 2024, at https://desktop.arcgis.com/en/arcmap/latest/tools/conversion-toolbox/point-to-raster.htm.
Hailegeberel, M., Glassmire, K., Johnson, A., Samant, M., and Dusek, G., 2018, User’s guide to vertical control and geodetic leveling for CO-OPS observing systems: Silver Spring, Md., National Oceanic and Atmospheric Administration, National Ocean Service, Center for Operational Oceanographic Products and Services, 64 p., accessed August 16, 2024, at https://tidesandcurrents.noaa.gov/publications/Users_Guide_to_Vertical_Control_and_Geodetic_Leveling_for_CO-OPS_Observing_Systems-May_2018.pdf.
Morris, R.L., La Peyre, M.K., Webb, B.M., Marshall, D.A., Bilkovic, D.M., Cebrian, J., McClenachan, G., Kibler, K.M., Walters, L.J., Bushek, D., Sparks, E.L., Temple, N.A., Moody, J., Angstadt, K., Goff, J., Boswell, M., Sacks, P., and Swearer, S.E., 2021, Large-scale variation in wave attenuation of oyster reef living shorelines and the influence of inundation duration: Ecological Applications, v. 31, no. 6, p. 1–15, accessed June 10, 2022, at https://doi.org/10.1002/eap.2382.
Rydlund, P.H., Jr., and Densmore, B.K., 2012, Methods of practice and guidelines for using survey-grade global navigation satellite systems (GNSS) to establish vertical datum in the United States Geological Survey: U.S. Geological Survey Techniques and Methods, book 11, chap. D1, 102 p. with appendixes.
Salatin, R., Wang, H., Chen, Q., and Zhu, L., 2022, Assessing wave attenuation with rising sea levels for sustainable oyster reef-based living shorelines: Frontiers in Built Environment, v. 8, p. 1–16, accessed July 17, 2022, at https://doi.org/10.3389/fbuil.2022.884849.
The Nature Conservancy [TNC], 2024, Places we protect—Gandy’s Beach Preserve, New Jersey: The Nature Conservancy web page, accessed April 17, 2024, at https://www.nature.org/en-us/get-involved/how-to-help/places-we-protect/gandys-beach-preserve/.
U.S. Geological Survey [USGS], 2015, CoNED Applications Project TBDEM data and metadata download—Topobathymetric model for New Jersey and Delaware, 1880 to 2014: U.S. Geological Survey database, accessed June 10, 2018, at https://topotools.cr.usgs.gov/topobathy_viewer/dwndata.htm.
Wang, H., Capurso, W.D., Chen, Q., Zhu, L., Niemoczynski, L.M., and Snedden, G., 2021a, Assessment of wave attenuation, current patterns, and sediment deposition and erosion during winter storms by living shoreline structures in Gandys Beach, New Jersey: U.S. Geological Survey Open-File Report 2021–1040, 37 p., accessed June 10, 2022, at https://doi.org/10.3133/ofr20211040.
Wang, H., Capurso, W.D., Chen, Q., Zhu, L., Niemoczynski, L.M., and Snedden, G., 2021b, Field observation of current velocities (2018) in Gandys Beach, New Jersey with living shoreline structures: U.S. Geological Survey data release, accessed June 10, 2022, at https://doi.org/10.5066/P9N4NOWZ.
Wang, H., Zhu, L., Chen, Q., Capurso, W.D., Niemoczynski, L.M., Hu, K., and Snedden, G., 2020, Field observations and spectral evolution of wind waves in upper Delaware Bay with living shorelines: U.S. Geological Survey data release, accessed June 10, 2022, at https://doi.org/10.5066/P9YEUNTM.
Zhu, L., Chen, Q., Ding, Y., Jafari, N., Wang, H., and Johnson, B.D., 2023, Towards a unified drag coefficient formula for quantifying wave energy reduction by salt marshes: Coastal Engineering, v. 180, article 104256, 14 p., accessed August 16, 2024, at https://doi.org/10.1016/j.coastaleng.2022.104256.
Datums
Vertical coordinate information is referenced to the North American Vertical Datum of 1988 (NAVD 88).
Horizontal coordinate information is referenced to the North American Datum of 1983 (NAD 83), unless otherwise noted.
Elevation, as used in this report, refers to distance above the vertical datum.
Abbreviations
≈
approximately
CoNED
Coastal National Elevation Database
COR
constructed oyster reef
GBBM
Gandys Beach benchmark
GNSS
global navigation satellite system
NGS
National Geodetic Survey
OPUS
Online Positioning User Service
RMSE
root mean square error
RS
rapid static
RTN
real-time network
TBDEM
topobathymetric digital elevation model
TCM
tilt current meter
TNC
The Nature Conservancy
USGS
U.S. Geological Survey
WG
wave gage
For more information about this publication, contact
Director, Wetland and Aquatic Research Center
U.S. Geological Survey
700 Cajundome Blvd.
Lafayette, LA 70506–3152
For additional information, visit
https://www.usgs.gov/centers/wetland-and-aquatic-research-center-warc
Publishing support provided by
Lafayette Publishing Service Center
Disclaimers
Any use of trade, firm, or product names is for descriptive purposes only and does not imply endorsement by the U.S. Government.
Although this information product, for the most part, is in the public domain, it also may contain copyrighted materials as noted in the text. Permission to reproduce copyrighted items must be secured from the copyright owner.
Suggested Citation
Capurso, W.D., Niemoczynski, L.M., Wang, H., Chen, Q., Snedden, G., and Zhu, L., 2024, Topographic and bathymetric survey in support of the effectiveness assessment of the living shoreline restoration in Gandys Beach, New Jersey: U.S. Geological Survey Open-File Report 2024–1072, 15 p., https://doi.org/10.3133/ofr20241072.
ISSN: 2331-1258 (online)
Study Area
| Publication type | Report |
|---|---|
| Publication Subtype | USGS Numbered Series |
| Title | Topographic and bathymetric survey in support of the effectiveness assessment of the living shoreline restoration in Gandys Beach, New Jersey |
| Series title | Open-File Report |
| Series number | 2024-1072 |
| DOI | 10.3133/ofr20241072 |
| Publication Date | December 19, 2024 |
| Year Published | 2024 |
| Language | English |
| Publisher | U.S. Geological Survey |
| Publisher location | Reston, VA |
| Contributing office(s) | Wetland and Aquatic Research Center |
| Description | Report: viii, 15 p.; Data Release |
| Country | United States |
| State | New Jersey |
| Other Geospatial | Gandys Beach |
| Online Only (Y/N) | Y |