

Review of the Lake Washington Ship Canal and Ballard Locks Model, Seattle, Washington, 2014–20
Links
- Document: Report (11.8 MB pdf) , HTML , XML
- NGMDB Index Page: National Geologic Map Database Index Page (html)
- Download citation as: RIS | Dublin Core
Executive Summary
The Hiram M. Chittenden (Ballard) Locks and Lake Washington Ship Canal connect freshwater Lake Washington and saline Shilshole Bay of Puget Sound in Seattle, Washington. The locks and canal allow for ships to traverse this reach. Anadromous salmonids also migrate through, transitioning between saline and freshwater environments, and making use of a fish ladder at the locks when traveling upstream. WEST Consultants, Inc., constructed a two-dimensional hydrodynamic and water-quality model (CE-QUAL-W2) simulating flow, water temperature, and salinity for the Ballard Locks and the Lake Washington Ship Canal. An initial model was built for calendar years 2014–15, and the model was updated using a more recent and modern dataset for calendar years 2016–20. The U.S. Army Corps of Engineers requested that the U.S. Geological Survey review this model and its documentation to evaluate the technical aspects of its development and calibration. Findings from this review include the following:
-
• Overall, the Lake Washington Ship Canal CE-QUAL-W2 model was well-documented and constructed largely following typical model-development methods.
-
• The Lake Washington Ship Canal model was built with CE-QUAL-W2 model version 4.5, compiled and released by Portland State University in April 2021. CE-QUAL-W2 updates and improvements are regularly released with bug fixes and new features, so any model updates would benefit from the use of the most-recent software release.
-
• The model grid that represents the Lake Washington Ship Canal bathymetry was 9.2 kilometers (5.7 miles) long, matching the expected length of the waterway. The deepest model segments were near sampling site LLLW (Large Locks site) near the locks. Lake Union is reported to constitute most of the volume of the Lake Washington Ship Canal and is depicted as such in the model grid.
-
• The model includes several water outflows at Ballard Locks, including the large and small locks, a saltwater drain, a spillway, smolt flumes, and a fish ladder. Flows from the spillway, smolt flumes, and fish ladder were combined into one structure outflow in the model and assigned one withdrawal elevation from the Lake Washington Ship Canal. The smolt flume and spillway withdraw from the same elevation, but the fish ladder flow withdraws from a higher elevation in Lake Washington Ship Canal, and that flow could be separated into its own withdrawal.
-
• The model input files were created using the Coordinated Universal Time standard instead of the more typical choice of using local standard time. This is not incorrect, but sub-daily results would need to be converted to local time for science-communication purposes.
-
• The meteorological dataset had some unexpected anomalies, such as a baseline shift in the wind-speed dataset. Other nearby meteorological datasets could be used instead or used to correct the current meteorological inputs.
-
• The upstream boundary was configured with water-temperature data from a continuous monitor buoy in Lake Washington. The boundary salinity was set at 0 parts per thousand for the duration of the model simulation. A more realistic estimate of salinity at the upstream boundary could be constructed using data from the same buoy.
-
• Saline inflow at the downstream boundary of the Lake Washington Ship Canal model through lock exchanges at the large lock was included as a tributary in the model. Salinity and temperature inputs in this tributary at the large locks were set as constant values for the entire simulation. Saline inflow through the small lock was not included in the model because few data were available, and the input was likely to be small because of the smaller surface area and volume of the small lock relative to the large lock.
-
• The model did not include any flow, water temperature, or salinity inputs to the Lake Washington Ship Canal other than at the locks and at the upstream boundary. Any point sources, small tributaries, or stormwater inputs were omitted from the model. It is unclear whether this is a substantial omission relative to model results.
-
• Most model parameters were set as defaults or to reasonable values. However, the value of the WINDH parameter, the height of the wind speed measurement, was different than the height of the meteorological site.
-
• Compared to measured data, the model simulated water-surface elevations and water temperatures with reasonable accuracy. Differences in the modeled and measured salinities revealed some opportunities to improve the simulation of salinity, both baseline salinity and the salinity maxima in summer and autumn.
Introduction
The Hiram M. Chittenden Locks (Ballard Locks or locks) are a navigational structure operated by the U.S. Army Corps of Engineers, Seattle District (USACE), at the downstream endpoint of the Lake Washington Ship Canal in Seattle, Washington. The Lake Washington Ship Canal connects Lake Washington to Shilshole Bay in Puget Sound (fig. 1), is in a heavily urbanized environment, and is frequented by large numbers of commercial and recreational vessels throughout the year.
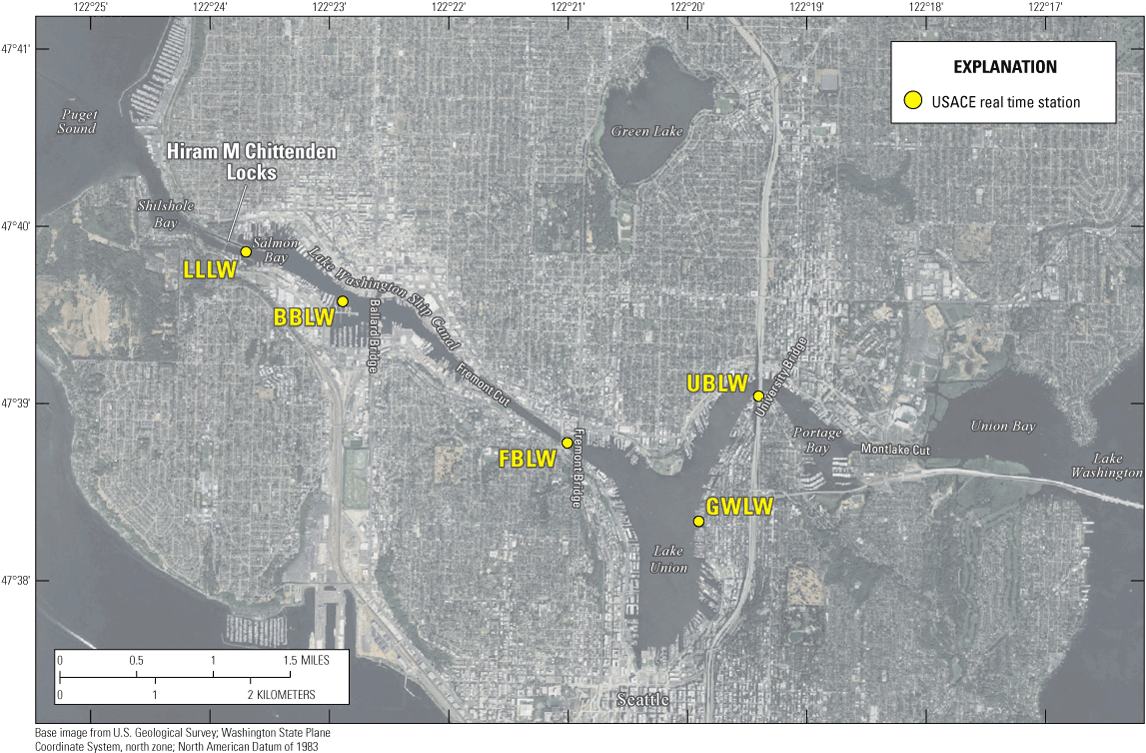
Hiram M. Chittenden (Ballard) Locks and Lake Washington Ship Canal connecting Lake Washington and Shilshole Bay of Puget Sound in Seattle, Washington. Five U.S. Army Corps of Engineers (USACE) monitoring sites measure water temperature and salinity at various depths (see tables 1 and 2 for details).
Table 1.
Monitoring site depths and model goodness-of-fit statistics for water temperature, 2014–20 for Lake Washington Ship Canal connecting Lake Washington and Shilshole Bay of Puget Sound in Seattle, Washington.[Bias is the average of (modeled-measured), mean absolute error (MAE) is the average absolute difference between measured and modeled values, and root mean square error (RMSE) is the standard deviation of the residuals. SiteID, Site identifier]
Table 2.
Monitoring site depths and model goodness-of-fit statistics for salinity, 2014–20 for Lake Washington Ship Canal connecting Lake Washington and Shilshole Bay of Puget Sound in Seattle, Washington.[Bias is the average of (modeled-measured), mean absolute error (MAE) is the average absolute difference between measured and modeled values, and root mean square error (RMSE) is the standard deviation of the residuals. SiteID, Site identifier]
The Lake Washington Ship Canal is an engineered connection resulting from a historical drainage diversion of the Sammamish River and Cedar River within the Black/Duwamish River watersheds. The construction lowered the elevation of Lake Washington, creating a uniform water-surface elevation between Lake Union and Lake Washington. Today, the locks help control water levels within Lake Washington and Lake Union.
The hydrologic modifications during the Lake Washington Ship Canal construction redirected the migration of native anadromous salmonids from historical Cedar River routes through the Lake Washington Ship Canal. Native salmonids include Chinook salmon (Oncorhynchus tshawytscha), steelhead (Oncorhynchus mykiss), and bull trout (Salvelinus confluentus), all listed as threatened under the Endangered Species Act (ESA; Public Law 93–205, 87 Stat. 884, as amended), as well as coho salmon (Oncorhynchus kisutch), listed as an ESA species of concern (Shared Strategy Development Committee, 2007; Urgenson and others, 2021). To complete their life cycle, anadromous salmonids migrate between saltwater and freshwater environments; therefore, fish ladders were included in the locks to facilitate fish passage.
The initial Lake Washington Ship Canal construction also converted Salmon Bay (fig. 1, upstream of the locks) from a saltwater/brackish estuary to a freshwater environment, as the Ballard Locks are an abrupt barrier between the freshwater drainage from the Lake Washington Ship Canal and the salt water of Puget Sound. The locks manage upstream saltwater intrusion through a design that includes a saltwater drain and saltwater barrier (U.S. Army Corps of Engineers, 2017). The locks are operated to maintain salinity levels less than Washington Department of Ecology water-quality standards at University Bridge, not exceeding 1 part per thousand (ppt; Washington Administrative Code Chapter 173–201A-602). However, during the summer season when water levels and downstream flows are low and when vessel transits are frequent, salt water intrudes farther upstream and has been observed as far upstream as the University Bridge just downstream from Lake Washington (King County, 2017; WEST Consultants, Inc., 2017).
Additionally, the Lake Washington Ship Canal tends to have high water temperature during summer. As an average during 2009–19, 12 to 24 percent of the measured water temperatures at the shallowest monitoring site depths were greater than 22 degrees Celsius (°C; Urgenson and others, 2021). Elevated water temperature and low dissolved-oxygen concentrations could contribute to direct and stress-related mortality of salmonids during residence or migration within the Lake Washington Ship Canal (Urgenson and others, 2021).
The USACE contracted WEST Consultants, Inc., to develop and calibrate a two-dimensional hydrodynamic and water-quality model (CE-QUAL-W2) capable of simulating hydraulic, temperature, and salinity dynamics in the Lake Washington Ship Canal (WEST Consultants, Inc., 2017). CE-QUAL-W2 is a two-dimensional laterally averaged model that often is used to model narrow waterbodies that tend to stratify (Wells, 2021). The Lake Washington Ship Canal CE-QUAL-W2 model by WEST (LWSC model) initially considered a 2-year period (January 2014–December 2015) but was later updated and re-calibrated for the 5-year period of 2016–20, using a more modern dataset and with the goal of improving water-temperature calibration (Rinehimer and Walton, 2022); this update did not revisit the 2014 or 2015 datasets. The model considers bathymetry, meteorology, inflow/outflow, water temperature, and salinity. Calibration and validation of the model used water-surface elevations near the locks and water temperature and salinity observations from five monitoring sites within the Lake Washington Ship Canal installed and maintained by the USACE (fig. 1).
The U.S. Geological Survey (USGS) was asked to review the existing LWSC model to help improve its performance and allow for a more accurate simulation of operations. An updated and improved Lake Washington Ship Canal CE-QUAL-W2 model would allow the USACE to better understand temperature and salinity dynamics in the Lake Washington Ship Canal.
Purpose and Scope
The purpose of this report is to document a technical review of the LWSC model. The review included an evaluation of the model development and calibration. Model strengths, limitations, and opportunities for improvement were identified.
The model was constructed with CE-QUAL-W2, a two-dimensional, laterally averaged, open-source hydrodynamic and water-quality model that has been applied to hundreds of lakes, reservoirs, and rivers around the world (Wells, 2021). The LWSC model was configured to simulate flow, velocity, water age, water temperature, and salinity.
The model’s geographical scope included the Lake Washington Ship Canal from the western end of Union Bay at Montlake Cut to the Hiram M. Chittenden Locks (fig. 1). Lake Union was included as a connected branch in the model.
The USACE provided the USGS with a model that covered the period from January 2014 to December 2020; it was constructed and calibrated to simulate existing conditions.
USGS Open-File Reports (OFR) are a limited-use series used for the dissemination of information that is preliminary or provisional in nature and are often superseded by a final information product in another USGS publication series, such as the Professional Paper series, the Scientific Investigations Report series, or the Techniques and Methods series (USGS SM 1100.3). Contingent on future USACE Army Civil Works Program appropriations, this OFR documenting the model review could be superseded by another USGS publication series documenting the implementation of model improvements and data release of the updated model through ScienceBase (https://www.sciencebase.gov/catalog/) in accordance with USGS Fundamental Science Practices (U.S. Geological Survey, 2017). For more information on the CE-QUAL-W2 model and associated input and output files that were evaluated during this review, contact the U.S. Army Corps of Engineers, Seattle District, Water Management Branch [Eric.S.Zimdars@usace.army.mil].
Methods
The USACE provided the USGS with model files, USACE data, and WEST Consultants, Inc., python processing scripts and reports. The model was run and checked against the provided model output. Model files, datasets, and python processing scripts were examined through various approaches. Visualization of model results was completed using W2 Animator software (Rounds, 2024) written in Perl. Model inputs, outputs, and calibration data were assessed with R statistical software (R Core Team, 2023).
The R package “metrics” (Hamner and Frasco, 2022) was used to help calculate goodness-of-fit statistics for calibration analysis, computing similar statistics used by the WEST Consultants, Inc., processing scripts. In this study, measured values and modeled values at the same location, depth, and time were compared using three statistics. The “bias” statistic is defined as the average of modeled minus measured values, such that a negative bias would indicate that on average modeled values were less than measured values. Mean absolute error (MAE) is defined as the average absolute difference between measured and modeled values and is a measure of typical average prediction error. Root mean square error is another goodness-of-fit statistic that may be thought of as the standard deviation of the model errors relative to measurements. All statistics were calculated for each USACE calibration site and depth (tables 1 and 2).
Model Review
Model Inputs and Development
The LWSC model was well-documented (WEST Consultants, Inc., 2017; Rinehimer and Walton, 2022; U.S. Army Corps of Engineers and WEST Consultants, Inc., 2023) and constructed largely following typical CE-QUAL-W2 model development methods (Wells, 2021). Comments in this section refer to the model for the period from January 2014 to December 2020, unless otherwise noted.
Model Version and Run Time
CE-QUAL-W2 undergoes regular development, incorporating bug fixes and new features. The model software used for the LWSC model was labeled as version 4.5 and was compiled on April 8, 2021, by the developers at Portland State University (Wells, 2021). More recent releases of version 4.5 are available and this updated software could be applied to the LWSC model.
The model runtime for the 2014–20 model was 9 hours and 25 minutes on a laptop with a 12th-generation Intel Core i7 1.8-gigahertz processor and 32 gigabytes of random-access memory. The average model timestep was 11 seconds.
Model Grid
An accurate representation of the bathymetry of a waterbody is important in simulating water temperature and salinity because the bathymetry affects the modeled surface area, depth, volume, water age, and travel time. A CE-QUAL-W2 model grid was formed from model segments that connect in the direction of flow (fig. 2). Each segment has layers of defined height that typically decrease in width from the top of the grid to the channel bottom, approximating a cross-sectional shape of stacked rectangular layers that are laterally integrated (example segment cross-sections are documented in WEST Consultants, Inc., 2017). A series of segments are grouped into “branches” and groups of branches into “waterbodies” that define specific reaches.
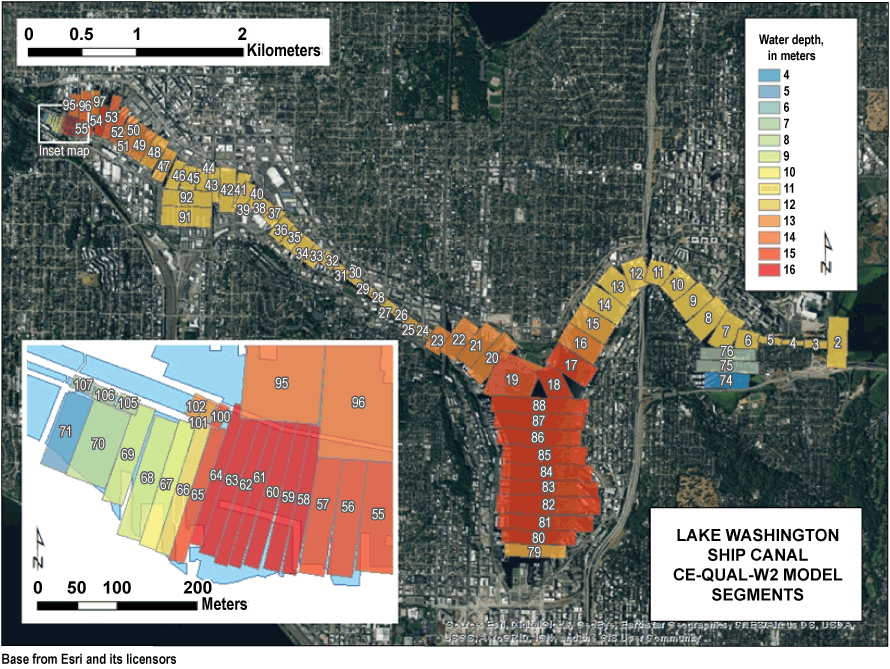
Lake Washington Ship Canal two-dimensional hydrodynamic and water-quality model (CE-QUAL-W2) segments, Seattle, Washington (reproduced from WEST Consultants, Inc., 2017). Color indicates maximum depth at a lake elevation of 22 feet (Corps datum; 18.75 feet North American Vertical Datum of 1988) to nearest 0.5 meter for each segment. Each segment was divided into 0.5-meter layers vertically. Inset map shows details within the Ballard Locks.
The LWSC model grid consisted of one waterbody, seven branches, and 108 segments. Layer height was 0.5 meters (m) throughout. Branch 1 was the main-stem Lake Washington Ship Canal, with 70 of the model segments. These segments had an average segment length of 129.7 m, with a minimum of 15.7 m and maximum of 426.7 m. Added together, the length of these main-stem LWSC model segments is 9.2 kilometers (km; 5.7 miles [mi]), which matches the actual length of the Lake Washington Ship Canal, as estimated in Google Earth. The deepest model segments were segments 63 and 64 near sampling site LLLW (Large Locks site; figs. 1, 2). During the model run, the maximum water depth at segment 64 was 16.7 m (54.8 feet [ft]).
The model branch that Lake Union comprises includes model segments 79–88 (fig. 2) and is also one of the deeper areas of the model grid. The Lake Union model branch connects to the main stem at model segment 18. Lake Union is reported to represent most of the surface area and volume of the Lake Washington Ship Canal (King County, 2017). That source reports the total Lake Washington Ship Canal volume as 32.1×10⁶ m3 and Lake Union volume as 23.4×10⁶ m3 (73 percent of total). The model grid, considered at a typical water-surface elevation, indicates the main-stem ship canal branch volume as 34.3×10⁶ m3 and the Lake Union volume (including the Lake Union model branch and the main-stem segments typically considered as part of Lake Union) as 21.3×10⁶ m3 (62 percent of total). Although some difference exists between these values, these Lake Union volumes estimated by King County and as represented in model grid are relatively close. Some uncertainty is inherent in this comparison; for example, the King County (2017) report did not note the water-surface elevation that was considered in that calculation.
Outflow Structures and Withdrawals
The main-stem branch terminates at the Ballard Locks spillway. At this location, outflow occurs over the spillway, through smolt flumes, and through surface flow into the fish ladder. These three outflow time series were combined into one time-series boundary condition for the model, with an assigned centerline elevation of 4.5 m for the structure outflow. This approach would make sense if all three outflows released water from the Lake Washington Ship Canal at the same elevation. The smolt flume was constructed at the spillway, so releases from the spillway and smolt flume did occur at the same elevation. The fish ladder, however, released water from the Lake Washington Ship Canal from a higher elevation (U.S. Army Corps of Engineers, 2017), and that outflow time series could be implemented separately in the model. The surface freshwater fish ladder flow was relatively small (23 cubic feet per second most of the year), so changing this may not have much of an effect on overall model results. However, for waterbodies that undergo thermal or water-quality stratification, the elevation at which water is released or withdrawn from a waterbody can affect conditions downstream and in the waterbody itself (Casamitjana and others, 2003; Sullivan and Rounds, 2005; Carr and others, 2020). The outflows at the large locks and saltwater drain were modeled as withdrawals, and the outflows from the small locks were modeled as structure releases.
Model Inputs and Parameters
Time Zone
The CE-QUAL-W2 model framework uses a Day of Year format, such that typically Day 1.0 is midnight local time and 1.5 is noon in the local time zone, which would be Pacific Standard Time (PST) for the Lake Washington Ship Canal. The use of the local time zone is critical if the user is using the model to calculate the flux of short-wave solar energy because the model would compute that flux based on latitude, longitude, cloud cover, and time of day; the LWSC model, however, provided measured solar radiation as an input. The LWSC model start date, however, corresponded to “2014-01-01 00:00:00 UTC” and all input time series were configured using the Coordinated Universal Time (UTC) standard. A model in the UTC time standard is not incorrect if the short-wave solar energy fluxes are provided as an input (as opposed to computed by the model). Still, sub-daily model outputs in UTC would need to be converted to local time for science communication purposes.
Meteorological data—obtained from University of Washington Atmospheric Sciences-Geophysics Building and Boeing Field/King County International Airport—were interpolated to hourly UTC values using a pre-processing python script. Other input time series (Lake Washington Buoy profiles and USACE monitoring sites for the locks, spillway, smolt gate, and fish ladder) were initially adjusted for daylight savings to PST by the USACE, then interpolated to hourly values in UTC (shifting forward 8 hours) either in spreadsheets or using pre-processing python scripts. The LWSC model generated time-series output at a 3-hour (0.125 day) frequency in UTC over the modeled period. The segments and depths for model output were chosen to match the locations and depths of sites with measured data along the Lake Washington Ship Canal.
When model results are converted to local time (PST), the start and end times are offset by 8 hours. Adjusting the LWSC model start and end time with an 8-hour offset (and incorporating that offset into the processing of input time series) to “2014-01-01 08:00:00 UTC” would correctly represent midnight locally.
Meteorology
Most data for the model’s meteorological input file came from a site on the roof of the University of Washington’s Atmospheric Sciences-Geophysics (ATG) Building, about 1 km north of the Lake Washington Ship Canal. These input data included air temperature, dew-point temperature, wind speed, wind direction, and solar radiation. Cloud-cover data for model input came from the King County International Airport Metar site, about 12 km south of the Lake Washington Ship Canal. All meteorological model inputs were configured for an hourly timestep.
Some unexpected anomalies were noted in some of the meteorological data. For instance, the minimum wind speed values were near 0 meter per second (m/s) for the first years of the dataset, but the minimums shifted upward to a new baseline greater than 1 m/s in the later years (fig. 3). The annual maximum solar radiation rate also varied over the years, which is unusual (fig. 3). University of Washington personnel were contacted as part of this review, and they noted that the ATG dataset underwent minimal quality assurance (David Warren, University of Washington, written commun., May 9, 2024).
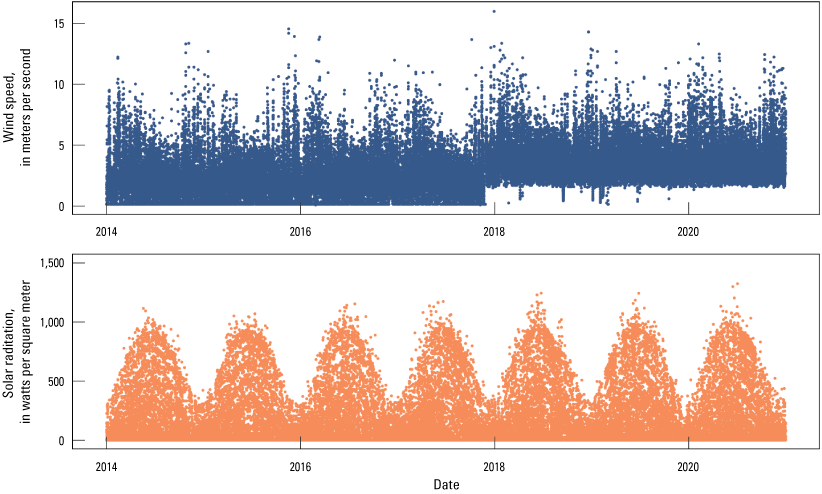
Model input wind speed (top graph) and solar radiation (bottom graph) at hourly time intervals, 2014–20.
Other nearby meteorological datasets could be compared to the ATG dataset. If higher-quality meteorological data were identified, those replacement data could be used in the model, or could be used to correct the ATG dataset. The presence of anomalies in the model inputs, however, is problematic and is worth further investigation. Wind and air-temperature data from the Metar site and the Lake Washington profiling buoy were already tested during model development according to the model documentation (WEST Consultants, Inc., 2017).
Upstream Boundary
The upstream boundary of the model was at the Montlake Cut, near Union Bay and the outflow of Lake Washington (fig. 1). This inflow into the model was set up as an external head (stage) boundary in the model. Three model input files defined that boundary condition: water-surface elevation, water temperature, and water quality (salinity). The water-temperature input file was created using data from a profiling buoy in Lake Washington, at an approximately 3-hour frequency. The input file for upstream water quality set the salinity time series as 0 ppt at all depths for the entire simulation.
The same profiling buoy in Lake Washington that measured water temperature also measured specific conductance. Example data from 2018 are shown in figure 4. Specific conductance can be used to estimate salinity or total dissolved solids (Hem, 1985) and could be used to create a more realistic estimate of inflow salinity for the model; that more-realistic salinity would still likely be low, but nonzero.
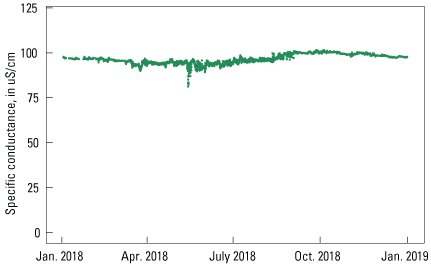
Measured specific conductance at an approximately hourly interval, from the water quality monitor in Lake Washington, maintained by King County, Washington, during 2018. µS/cm, microsiemens per centimeter at 25 degrees Celsius; Jan., January; Apr., April; Oct., October.
Downstream Tributary
Inflow into the Lake Washington Ship Canal from the large Ballard Locks during lock exchange was implemented as a tributary in the model. The three model input files defining that boundary were: flow, water temperature, and water quality (salinity). The exchange inflow was determined with an exchange coefficient that was adjusted during model calibration. The water temperature was set as a constant 13.7 °C and the salinity set at 25 ppt for the entire 2014–20 period. These values represented the mixed water within the lock chamber, after filling the lock and before opening the upstream gate. These values were determined during model calibration, with reference to year-2004 salinity and temperature data in Shilshole Bay (WEST Consultants, Inc., 2017). Available water temperature and salinity data near or inside the locks would help to improve the model, an assertion that also was acknowledged by the model developers (WEST Consultants, Inc., 2017).
Inflow from lock exchange from the small Ballard Locks was not included in the model because of less available information and the much smaller surface area and volume of these small locks compared to the large locks (WEST Consultants, Inc., 2017). The large lock surface area is 66,000 square feet (ft2) and the small lock surface area is 4,500 ft2. Should data become available, the inclusion of a tributary inflow to characterize lock exchange from the small locks may also improve the model’s simulation of actual conditions.
Within-Reach Tributaries
The model included inputs at the upstream boundary at Montlake Cut and downstream at the Ballard Locks, but no other inflows were included in the model in the 9.2 km (5.7 mi) between these locations. A King County (2017) report noted that additional sources of water to the Lake Washington Ship Canal could include combined sewer overflows, vessel discharge, groundwater, and the Densmore Drain, a system of pipes that transports base and storm flows to an outfall near Lake Union.
Leaving these sources out of the model may have been decided by a lack of data needed to define their flows, water temperatures, and salinities to create model input files. Or perhaps the effect of these sources was determined to be minor. If so, this should have been noted in the model documentation. Otherwise, any available datasets describing these sources could be explored for possible inclusion in the model.
Model Parameters
Most of the model parameters (variables) were set as model defaults or set to reasonable values. The exception was the WINDH parameter, which is the height (in meters) of the wind speed measurement. The formulations of wind speed in the model are referenced to this height. The WINDH variable in the model was set at 10 m, but the height of the ATG building, where wind was measured, is 58 m (David Warren, University of Washington, written commun., May 9, 2024).
Typically, wind speed increases with increasing height above the Earth’s surface. Wind measured at 58 m but marked as measured at 10 m in the model would create wind speeds in the model that were too large. It is not known how high above the rooftop of the ATG building the wind speed was measured; if the rooftop was sufficiently large to mimic ground-level wind shear, then a WINDH value less than 58 m (plus the height of the measurement above rooftop level) could be justified, but it is likely that the WINDH parameter value of 10 m is too small.
The Wind Sheltering Coefficient (WSC) variable in CE-QUAL-W2 is a multiplier of wind speed, with a default value of 1.0. The WSC values in the LWSC model were set at 0.85, which would reduce wind speed by 15 percent. So, the larger wind speeds from the (too-small) WINDH parameter were somewhat counteracted by reducing the WSC values. The higher wind speeds in the model also may act to account for vertical mixing and horizontal dispersion caused by boat and ship engines and propellors that were not accounted for otherwise in the model.
The waterbody type (WTYPEC) parameter for the LWSC model was set to “SALT,” instead of the other option, “FRESH.” This parameter affects the water density calculation in the LWSC model and specifies whether the total dissolved solids (TDS) or salinity constituent is expected in units of parts per thousand for salinity (“SALT”) or milligrams per liter for TDS (“FRESH”). The Lake Washington Ship Canal has areas of both saline and fresh water, so the effect of this parameter could be explored in sensitivity testing.
Model Results
Flow and Water Age
The Lake Washington Ship Canal water-surface elevation varied from 5.0 to 5.8 meters North American Vertical Datum of 1988, with minimums during the winter holding period, which often begins on December 1 (U.S. Army Corps of Engineers and WEST Consultants, Inc., 2023), and maximums in late May through early summer. Modeled water-surface elevations echoed this annual pattern in water-surface elevation (WEST Consultants, Inc., 2017; Rinehimer and Walton, 2022).
The LWSC model simulated water age, an estimate of residence time, for each model segment and layer (figs. 5–6). In an example year (2019), modeled volume-average water age of the Lake Washington Ship Canal was less than (<) 30 days from November through mid-June (fig. 5). Water age of the main-stem Lake Washington Ship Canal near Lake Union increased to more than (>) 30 days in late June and July. In mid-August through mid-October, the main-stem reach from Lake Union to the Ballard Locks had lower throughflow and greater resulting water age of >30 days. Some differences in the modeled water age occurred vertically through the water column at some times and locations (fig. 6).
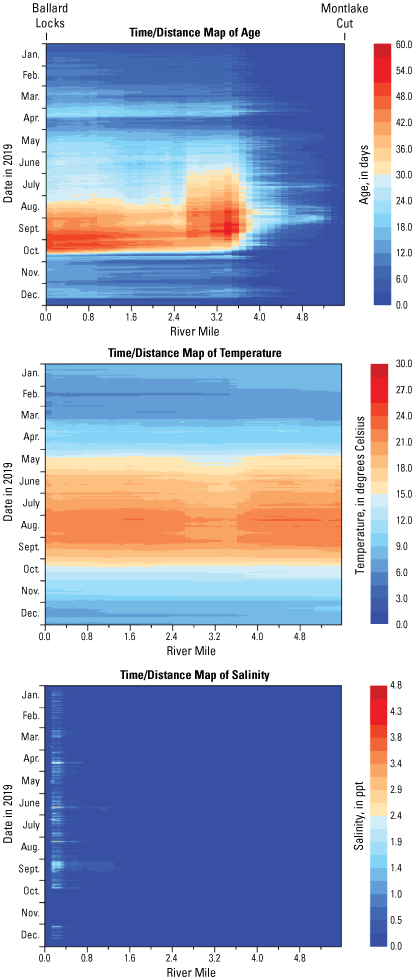
Time-distance view showing model results for water age (top), water temperature (middle), and salinity (bottom) for the main-stem Lake Washington Ship Canal model, Seattle, Washington, 2019. Values are volume-averaged for each model segment. Jan., January; Feb., February; Mar., March; Apr., April; Aug., August; Sept., September; Oct., October; Nov., November; Dec., December
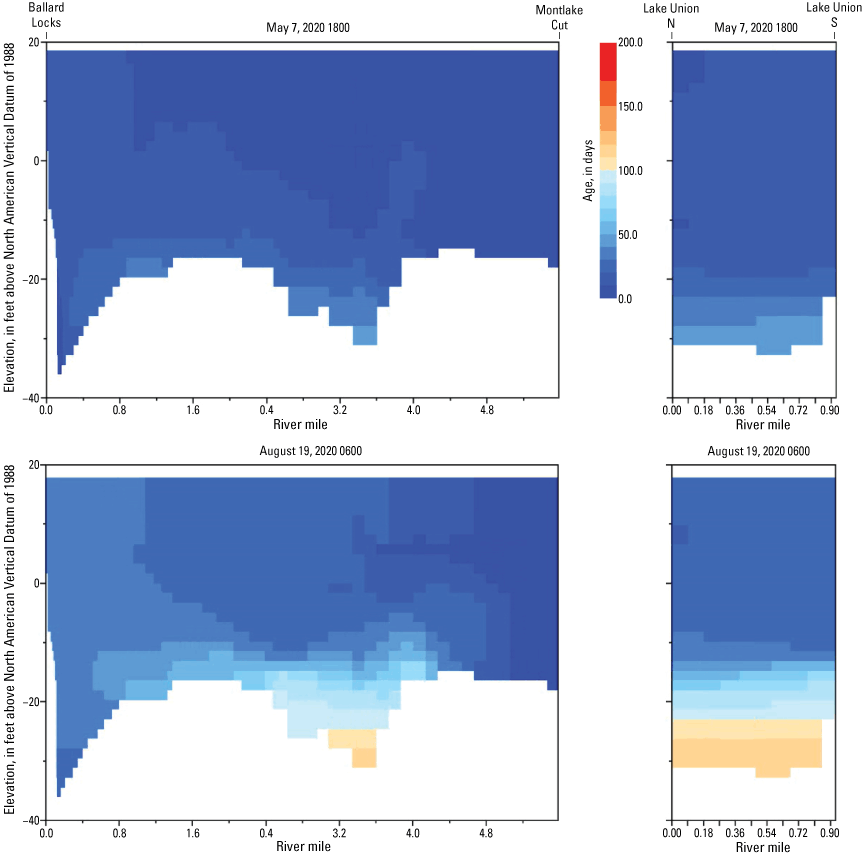
Longitudinal view showing modeled water age on May 7, 2020, at 1800 hours (top) and August 19, 2020, at 0600 hours (bottom) in Lake Washington Ship Canal, Seattle, Washington. Left graphs show results from main-stem Lake Washington Ship Canal from Montlake (right) to Ballard Locks (left). Right graphs show results from Lake Union from south (right) to north (left).
Modeled water velocity in the Lake Washington Ship Canal was mostly positive, in the downstream direction toward the Ballard Locks (fig. 7). There were times and locations in the model with negative velocity, indicating flow in the upstream direction. This could occur as saline water was brought into the Lake Washington Ship Canal from the Ballard Locks (fig. 7, top), or during periods when overall flows were low (fig. 7, bottom).
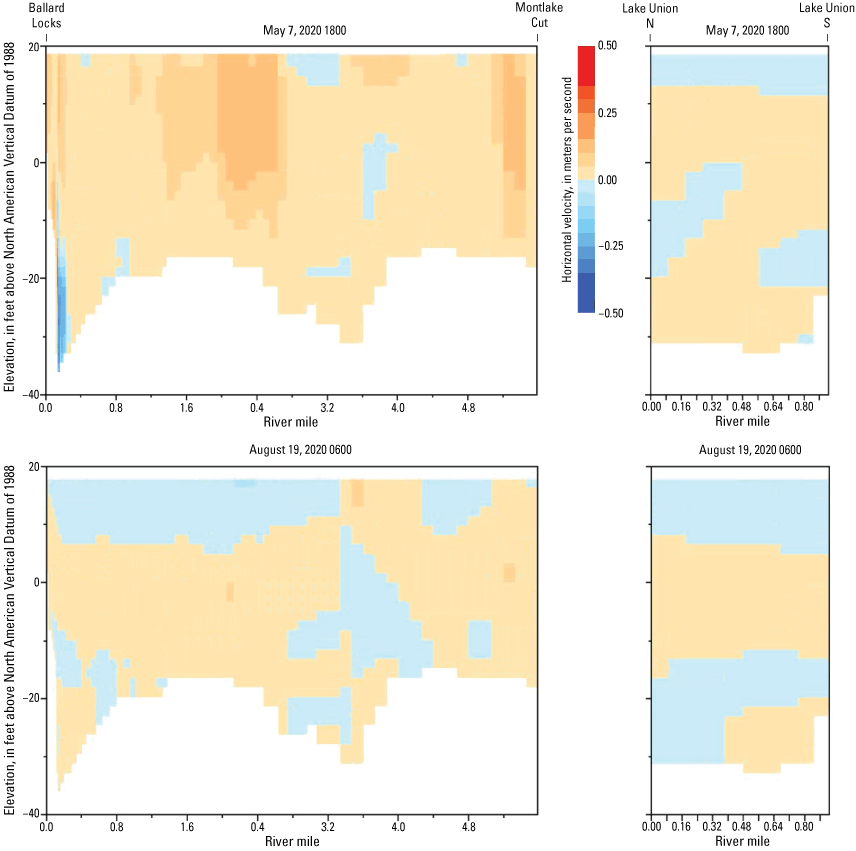
Longitudinal view showing modeled horizontal velocity on May 7, 2020, at 1800 hours (top) and August 19, 2020, at 0600 hours (bottom), in Lake Washington Ship Canal, Seattle, Washington. Left graphs show results from main-stem Lake Washington Ship Canal from Montlake Cut (right) to Ballard Locks (left). Right graphs show results from Lake Union from south (right) to north (left). Orange colors (associated with numbers greater than zero on the graphs) represent flow in the downstream direction: to the west for the main stem and to the north for Lake Union. Blue colors (associated with numbers less than zero on the graph) represent flow in the opposite (upstream) direction.
Easthouse (1993) studied circulation patterns in Lake Union and found no definitive pattern. Instead, four possible circulation patterns could occur, including (1) east-west flow in winter and spring, (2) north-south flow, (3) minimal circulation during summer low flow, and (4) southeast to northeast flow (rare). The two-dimensional CE-QUAL-W2 model simulated Lake Union water velocity in the south-north and north-south directions, varying between layers at different times (fig. 7). In the model, Lake Union connected to the east-west flow (and occasional instances of west-east flow) of the main-stem Lake Washington Ship Canal at the northernmost segment of the Lake Union branch.
Water Temperature
Modeled water temperature in the Lake Washington Ship Canal followed an annual cycle, with cool temperatures in late autumn through early spring and warm temperatures in summer (figs. 5; 8–13). Some vertical stratification in modeled water temperature could occur in spring through autumn (fig. 8).
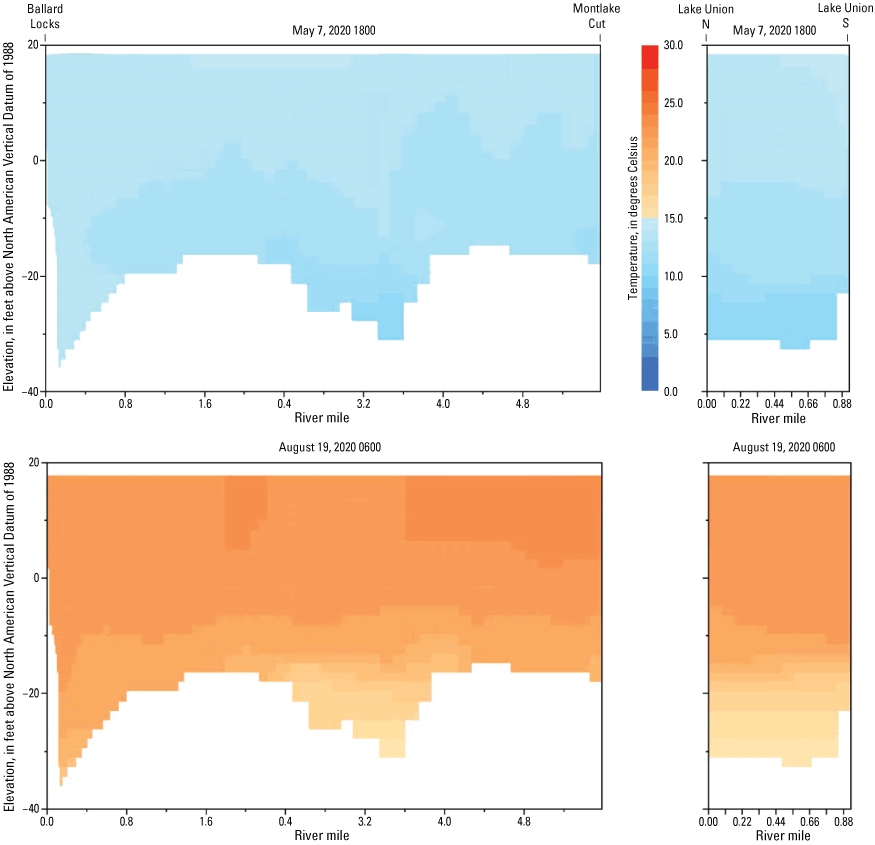
Longitudinal view showing modeled water temperature on May 7, 2020, at 1800 hours (top) and August 19, 2020, at 0600 hours (bottom), in Lake Washington Ship Canal, Seattle, Washington. Left graphs show results from main-stem Lake Washington Ship Canal from Montlake Cut (right) to Ballard Locks (left). Right graphs show results from Lake Union from south (right) to north (left).
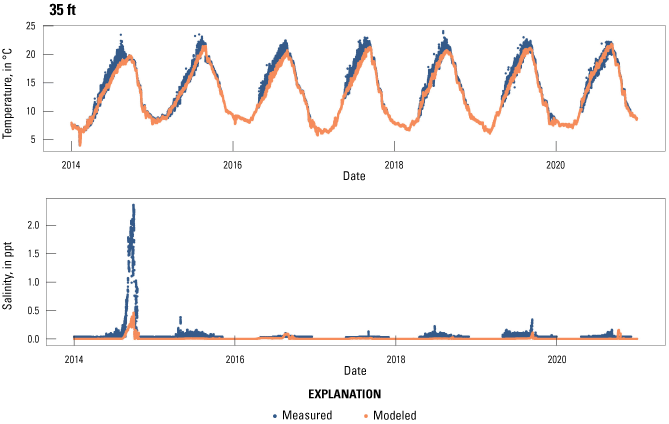
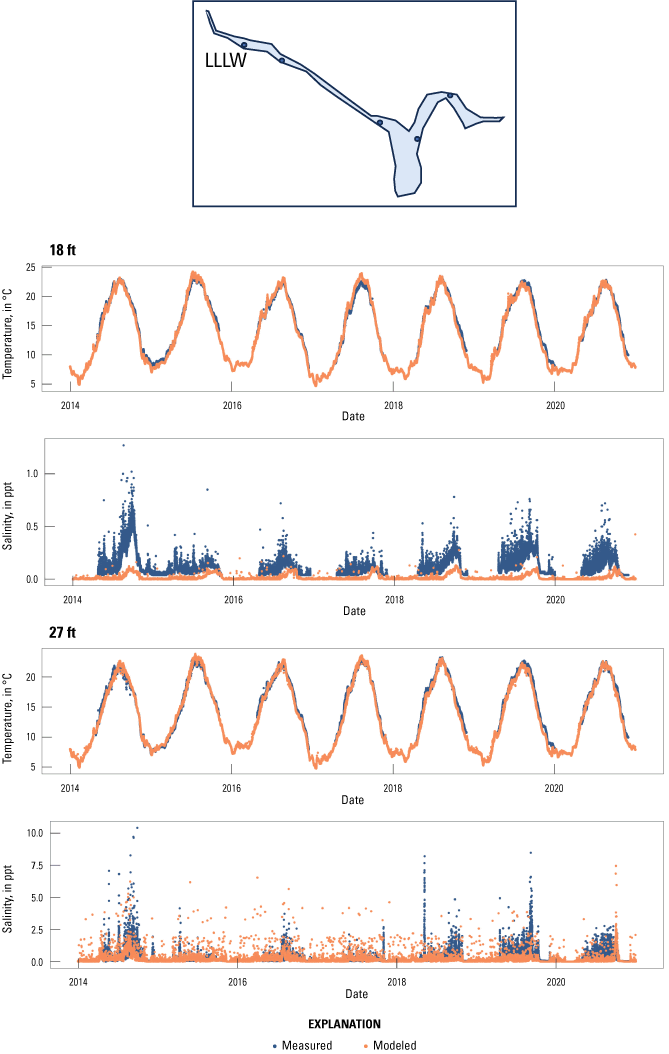
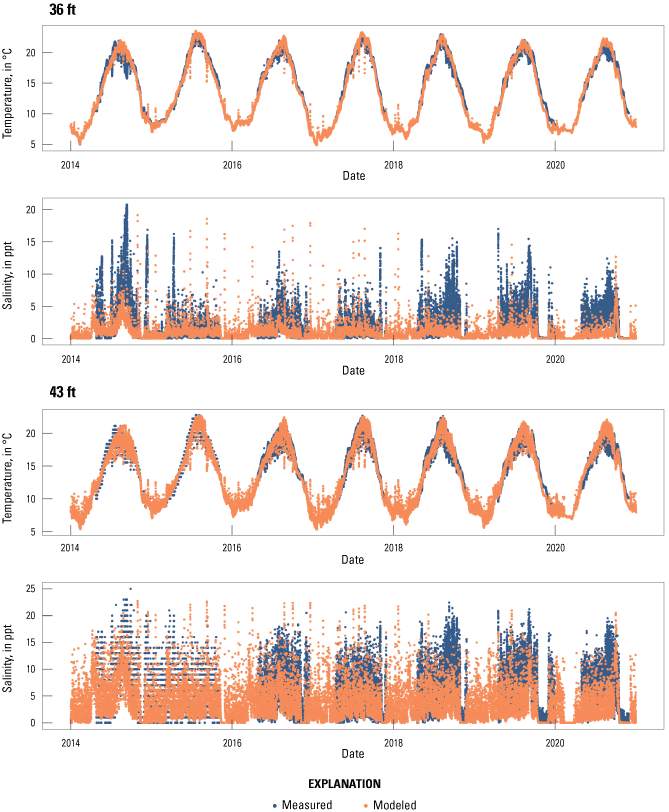
The model simulated water temperature well in the Lake Washington Ship Canal. Compared to measured water temperature at five locations along the Lake Washington Ship Canal, the model was able to simulate the seasonal and daily variation in water temperature well at different depths in the water column (figs. 9–13). At all sites, the model underpredicted water temperature, calculated as an average over the modeled period, as shown with negative bias metrics at each site and depth (table 1). However, calculation of goodness-of-fit statistics that compared model output to measured values at the same location and time produced MAE values that were mostly <1 °C (table 1); these values indicate that overall, the model simulated water temperature well. The only site and depth with MAE >1 °C was the Gas Works Park monitoring site (GWLW) at 44 ft.
Salinity
Modeled salinity varied between the freshwater input at Montlake Cut upstream to the saline waters from exchange at the downstream Ballard Locks location (figs. 5; 9–13; 14). The saline water had higher density than the fresh water and the model simulated it entering from the locks and then moving to the channel bottom because of that density difference (fig. 14).
In many periods, elevated salinity was not noted in the most upstream reach of the Lake Washington Ship Canal. However, during a period in late summer of 2014, elevated salinity (greater than 2 ppt at depth) was measured as far upstream as the University Bridge site (UBLW; figs. 9–13). The especially high concentration of salinity in the Lake Washington Ship Canal in that year was thought to be related to a false-locking study from July 28 to September 12, 2014 (Easthouse and Emry, 2015). False lockings were additional lock operations when boats were not present and were a possible strategy to benefit migrating salmon (U.S. Army Corps of Engineers, 2012). The model was able to simulate some part of the upstream movements of salinity under those conditions, but not the full extent.
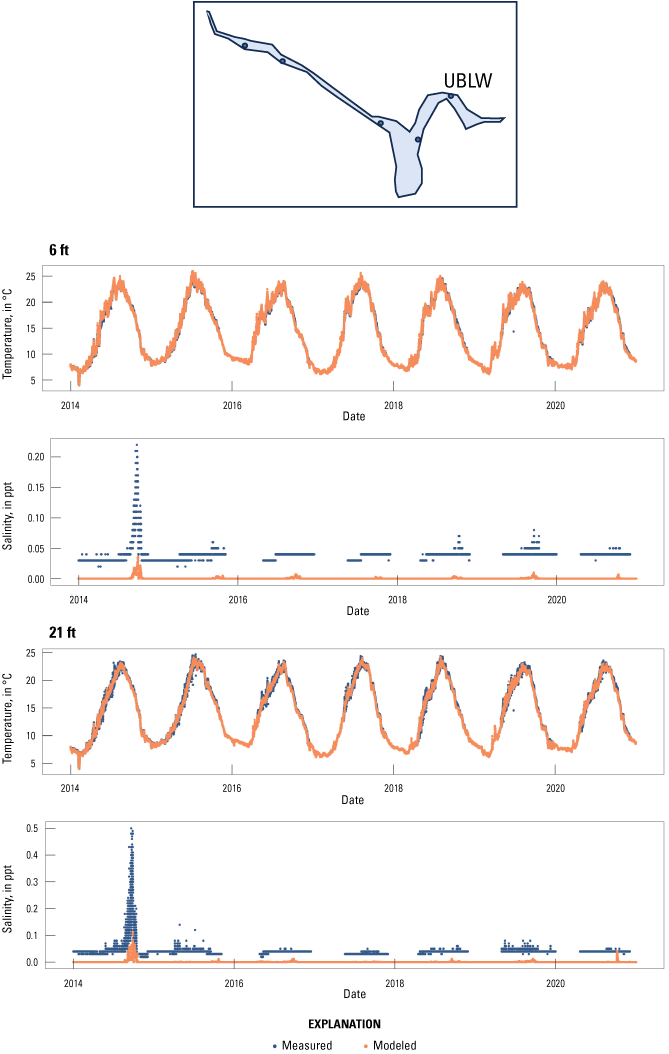
Measured and modeled water temperature and salinity at University Bridge site at three depths in Lake Washington Ship Canal, Seattle, Washington, 2014–20. °C, degrees Celsius; ppt, parts per thousand; ft, feet.
Measured and modeled water temperature and salinity at Gas Works Park site (GWLW) at four depths in Lake Washington Ship Canal, Seattle, Washington, 2014–20. °C, degrees Celsius; ppt, parts per thousand; ft, feet.
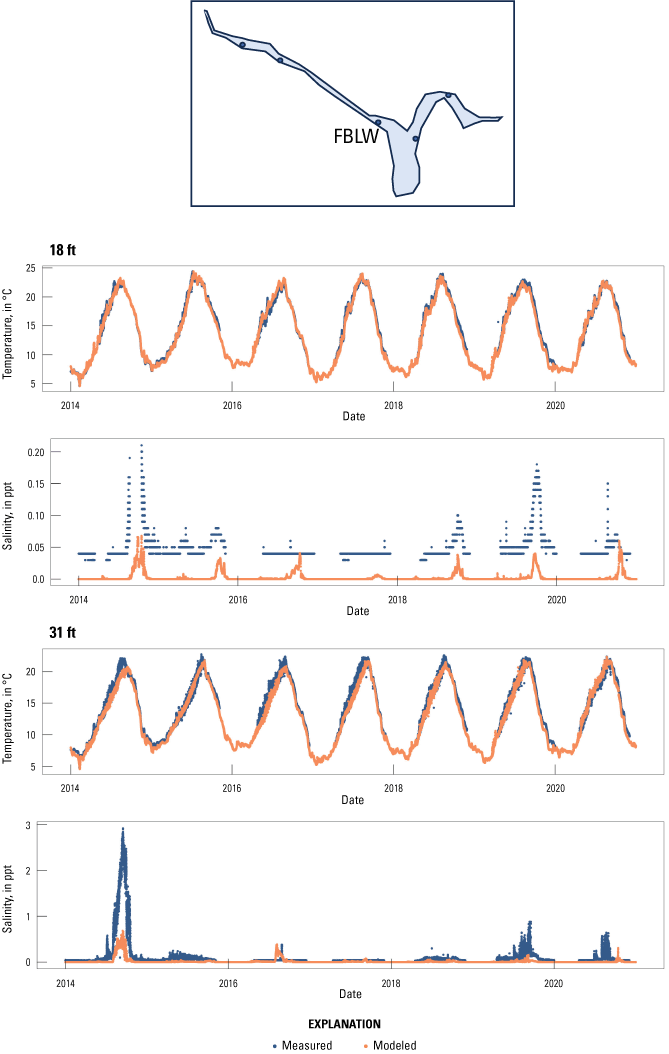
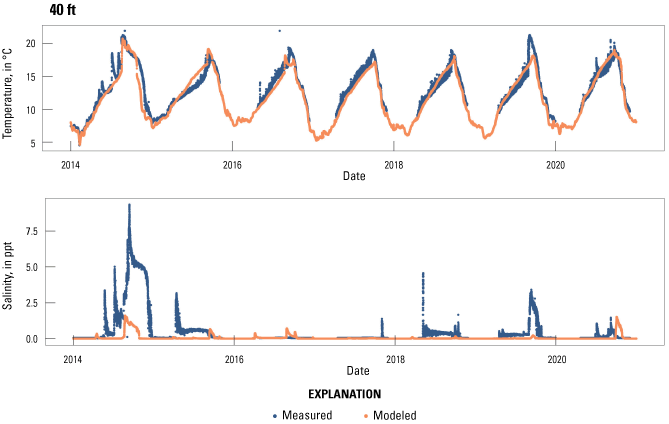
Measured and modeled water temperature and salinity at Fremont Bridge site (FBLW) at three depths in Lake Washington Ship Canal, Seattle, Washington, 2014–20. °C, degrees Celsius; ppt, parts per thousand; ft, feet.
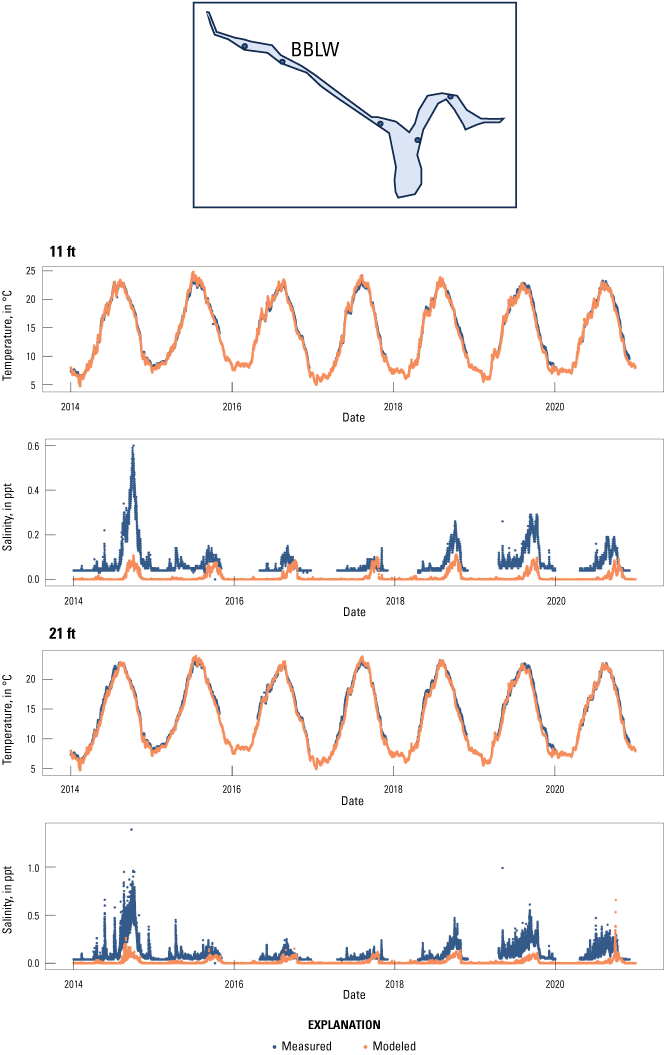
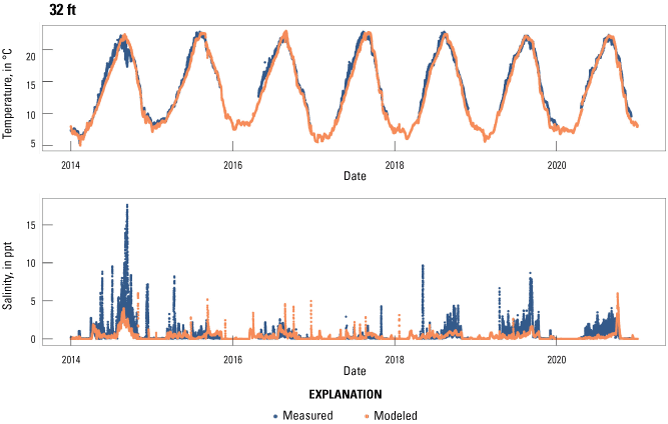
Measured and modeled water temperature and salinity at Ballard Bridge site (BBLW) at three depths in Lake Washington Ship Canal, Seattle, Washington, 2014–20. °C, degrees Celsius; ppt, parts per thousand; ft, feet.
Measured and modeled water temperature and salinity at Large Locks site (LLLW) at four depths in Lake Washington Ship Canal, Seattle, Washington, 2014–20. °C, degrees Celsius; ppt, parts per thousand; ft, feet.
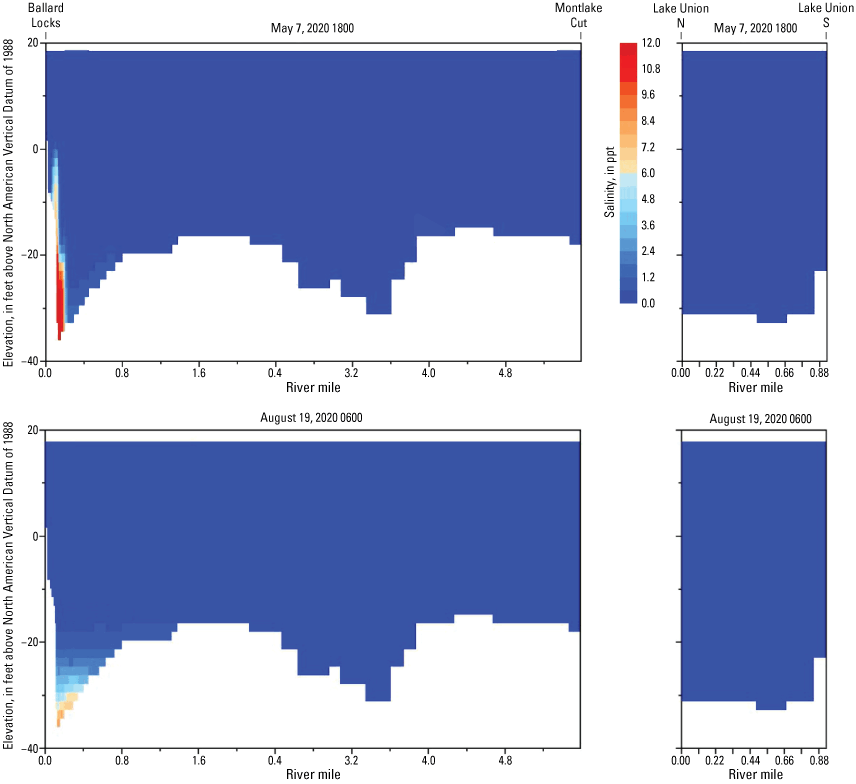
Longitudinal view showing modeled salinity on May 7, 2020, at 1800 hours (top) and August 19, 2020, 0600 hours (bottom), in Lake Washington Ship Canal, Seattle, Washington. Left graphs show results from main-stem Lake Washington Ship Canal from Montlake Cut (right) to Ballard Locks (left). Right graphs show results from Lake Union from south (right) to north (left).
The model’s baseline salinity was too low compared to measured salinity (figs. 9–13). The model baseline was at or near zero, whereas the measured data had a baseline salinity ranging from about 0.1 to 0.5 ppt (100–500 mg/L). This difference could be caused by the fact that the model’s upstream boundary salinity was set to 0 ppt along with the absence of any within-reach tributaries. Although freshwater sources of salinity were much lower in dissolved solids concentration, compared to the seawater inputs from the locks, the simulation of baseline salinity could be improved by updating the estimate of the upstream boundary salinity conditions and possibly adding within-reach tributaries to the model, if any data for such tributaries can be found.
Goodness-of-fit statistics were calculated from the comparison of modeled salinity to measured data at the same location (table 2). The model underpredicted salinity compared to measured values, as shown by the bias statistic. MAE values ranged from 0.04 to 3.62 ppt.
Acknowledgments
Discussions with Stewart Rounds (U.S. Geological Survey) on the CE-QUAL-W2 source code were helpful.
References Cited
Carr, M.K., Sadeghian, A., Lindenschmidt, K.-E., Rinke, K., and Morales-Marin, L., 2020, Impacts of varying dam outflow elevations on water temperature, dissolved oxygen, and nutrient distributions in a large prairie reservoir: Environmental Engineering Science, v. 37, p. 78–97, accessed June 27, 2024 at https://doi.org/10.1089/ees.2019.0146.
Casamitjana, X., Serra, T., Colomer, J., Baseraba, C., and Pérez-Losada, J., 2003, Effects of the water withdrawal in the stratification patterns of a reservoir: Hydrobiologia, v. 504, p. 21–28, accessed June 27, 2024, at https://doi.org/10.1023/B:HYDR.0000008504.61773.77.
Hamner, B., and Frasco, M., 2022, Metrics—Evaluation metrics for machine learning (R package version 0.1.4) The Comprehensive R Archive Network website, accessed May 20, 2024, at https://CRAN.R-project.org/package=Metrics.
R Core Team, 2023, R—A language and environment for statistical computing: Vienna, Austria, R Foundation for Statistical Computing website, accessed June 25, 2024, at https://www.R-project.org/.
Rounds, S.A., 2024, The W2 animator, version 1.1.0 software release: Software release available from GitHub website, accessed August 26, 2024, at https://github.com/sarounds/w2anim/.
Shared Strategy Development Committee, 2007, Puget Sound salmon recovery plan—Volume 1: Seattle, Washington, Shared Strategy for Puget Sound, 43 p., https://repository.library.noaa.gov/view/noaa/16005.
Sullivan, A.B., and Rounds, S.A., 2005, Modeling hydrodynamics, temperature, and water quality in Henry Hagg Lake, Oregon, 2000–03: U.S. Geological Survey Scientific Investigations Report 2004–5261, 38 p., accessed June 27, 2024, at https://doi.org/10.3133/sir20045261.
Urgenson, L., Kubo, J., and Degasperi, C., 2021, Synthesis of best available science—Temperature and dissolved oxygen conditions in the Lake Washington Ship Canal and impacts on salmon: Prepared for the Lake Washington, Cedar, Sammamish Watershed (WRIA 8) Salmon Recovery Council, 63 p, accessed April 4, 2024 at https://www.govlink.org/watersheds/8/reports/2021TempDOShipCanalScienceRpt.pdf.
U.S. Geological Survey, 2017, U.S. Geological Survey survey manual—502.9, Fundamental science practices—Preservation requirements for digital scientific data: U.S. Geological Survey website, accessed August 28, 2024, at https://www.usgs.gov/survey-manual/5029-fundamental-science-practices-preservation-requirements-digital-scientific-data.
Conversion Factors
International System of Units to U.S. customary units
Temperature in degrees Celsius (°C) may be converted to degrees Fahrenheit (°F) as follows:
°F = (1.8 × °C) + 32.
Datums
Vertical coordinate information is referenced to North American Vertical Datum of 1988 (NAVD 88)].
Elevation, as used in this report, refers to distance above the vertical datum.
Supplemental Information
Specific conductance is in microsiemens per centimeter at 25 degrees Celsius (µS/cm at 25 °C).
Concentrations of chemical constituents in water are in milligrams per liter (mg/L), grams per liter (g/L), or parts per thousand (ppt).
Abbreviations
ATG
Atmospheric Sciences-Geophysics
BBLW
Ballard Bridge site
CE-QUAL-W2
two-dimensional hydrodynamic and water-quality model
ESA
Endangered Species Act
FBLW
Fremont Bridge site
GWLW
Gas Works Park site
LLLW
Large Locks site
MAE
mean absolute error
ppt
parts per thousand, a unit of salinity
PST
Pacific Standard Time
RMSE
root mean square error
TDS
total dissolved solids
UBLW
University Bridge site
USACE
U.S. Army Corps of Engineers
USGS
U.S. Geological Survey
UTC
Coordinated Universal Time
WINDH parameter
height (in meters) of the wind speed measurement
WSC
Wind Sheltering Coefficient
For more information about the research in this report, contact
Director, Oregon Water Science Center
U.S. Geological Survey
601 SW Second Avenue, Suite 1950
Portland, Oregon 97204
https://www.usgs.gov/centers/oregon-water-science-center
Manuscript approved on December 5, 2024
Publishing support provided by the U.S. Geological Survey
Science Publishing Network, Tacoma Publishing Service Center
Disclaimers
Any use of trade, firm, or product names is for descriptive purposes only and does not imply endorsement by the U.S. Government.
Although this information product, for the most part, is in the public domain, it also may contain copyrighted materials as noted in the text. Permission to reproduce copyrighted items must be secured from the copyright owner.
Suggested Citation
Sullivan, A.B., and Leach, A.C., 2025, Review of the Lake Washington Ship Canal and Ballard Locks model, Seattle, Washington, 2014–20: U.S. Geological Survey Open-File Report 2024–1078, 26 p., https://doi.org/10.3133/ofr20241078.
ISSN: 2331-1258 (online)
Study Area
| Publication type | Report |
|---|---|
| Publication Subtype | USGS Numbered Series |
| Title | Review of the Lake Washington Ship Canal and Ballard Locks model, Seattle, Washington, 2014–20 |
| Series title | Open-File Report |
| Series number | 2024-1078 |
| DOI | 10.3133/ofr20241078 |
| Publication Date | January 13, 2025 |
| Year Published | 2025 |
| Language | English |
| Publisher | U.S. Geological Survey |
| Publisher location | Reston, VA |
| Contributing office(s) | Oregon Water Science Center |
| Description | vi, 26 p. |
| Country | United States |
| State | Washington |
| City | Seattle |
| Online Only (Y/N) | Y |