

Hydrogeologic Investigations and a Preliminary Conceptual Model of the Groundwater System at North Penn Area 1 Superfund Site, Souderton, Montgomery County, Pennsylvania
Links
- Document: Report (18.0 MB pdf) , HTML , XML
- NGMDB Index Page: National Geologic Map Database Index Page (html)
- Download citation as: RIS | Dublin Core
Acknowledgments
The support and guidance of project managers and technical personnel in the U.S. Environmental Protection Agency in conducting this study is gratefully acknowledged.
The role of U.S. Geological Survey (USGS) personnel in data collection and study design is appreciated Special thanks to Randall W. Conger and J. Alton Anderson for collecting geophysical logs, Matthew Conlon for collecting continuous water levels, and Ronald A. Sloto for initiating the study.
Abstract
The U.S. Geological Survey (USGS) conducted hydrogeologic investigations, reviewed existing data, and developed a preliminary conceptual model of the groundwater system as part of technical support of the U.S. Environmental Protection Agency (EPA) at the North Penn Area 1 Superfund Site (hereafter, the NP1 Site) located within the Borough of Souderton in Montgomery County, Pennsylvania. Field work and monitoring took place during 2012–18. The area is underlain by sedimentary formations that form a fractured-rock aquifer used for drinking water and industrial supply. The EPA placed the Site on the National Priorities List in 1989, identifying tetrachloroethylene (PCE) and trichloroethylene (TCE) as contaminants of concern.
During 2012–18, the USGS conducted field activities that included drilling an 82-foot (ft)-deep monitoring well (MG 2220) in 2016, reconstructing a 208-ft-deep former industrial production well (MG 668 [Granite Knitting Mill]), and collecting borehole geophysical and video logs and water levels from those and five additional wells, which ranged in depth from about 50 to 200 ft below land surface. Continuous water levels were collected during 2014–17, and a synoptic set of water levels were measured in April 2018 in the seven wells.
The borehole geophysical logs (caliper, acoustic televiewer, natural gamma, single-point resistance, vertical flow, and fluid temperature and resistivity) and borehole video logs in the seven wells were evaluated to assess potential for lithologic correlation and to identify and describe water-bearing features, which included both low- and high-angle fractures and other openings oriented along dipping bedding planes, joints, or possible faults. Borehole geophysical logs collected by USGS in 1992 in a 300-ft-deep former production well near the Site were also evaluated. Few to no distinctive features were identified on geophysical logs (natural gamma and single-point resistance) that could be used for correlation, thus limiting this approach to determining local geologic structure. Extensive fracturing in the upper 62 ft of monitoring well MG 2220 indicates that the well was likely drilled through a zone of faulting, and other evidence of faulting is present in the area near the Site. Assessment of continuous water levels showed hydraulic connections among some wells as indicated by rising or falling water levels in response to changes in pumping rates at nearby wells. A map of water levels measured in April 2018 indicates potential for groundwater flow generally toward the stream to the south and southwest of the Site, but the limited water-level data are insufficient to describe vertical groundwater gradients or lateral gradients in any detail.
Review of 1999–2022 volatile organic compound (VOC) monitoring data collected by the Pennsylvania Department of Environmental Protection for five monitoring wells indicates that the highest groundwater concentrations of PCE and TCE were found in samples from extraction well MG 2201 (S-1) downgradient from, and nearest to, the previously identified Site contaminant source area, and these concentrations fluctuated through time. PCE concentrations were higher than TCE concentrations in samples from all five monitoring wells and were much higher than TCE concentrations in samples from extraction well MG 2201 (S-1). Temporally variable recharge is a possible factor affecting observed fluctuations in PCE concentrations in groundwater samples from well extraction MG 2201 (S-1), as indicated by a general inverse relation between PCE concentrations and water levels in a nearby long-term observation well. The PCE concentration of 1,830 micrograms per liter (µg/L) in a May 2018 water sample from monitoring well MG 2220 was more than four times the PCE concentration of 444 µg/L in a December 2017 sample from the nearby extraction well MG 2201 (S-1), which is open to fewer fractures. Low concentrations of VOCs were measured in surface water at two stream sites downgradient from wells with the highest groundwater VOC concentrations at the Site, indicating that discharge of contaminated groundwater to the stream is likely.
Development of a conceptual model of the groundwater system was constrained by limited data. In areas with no pumping, groundwater-flow directions generally are thought to be controlled by topography and geologic structure (bedding orientation) and likely to the south and southwest of the Site, with local flow directions affected by orientations of fractures, joints, and local faults. Additional investigations that could help improve the conceptual model of the groundwater system and help delineate the extent of groundwater contamination and its transport are discussed.
Introduction
The North Penn Area 1 Superfund Site (hereafter, the NP1 Site) is located within the Borough of Souderton in Montgomery County, Pennsylvania (fig. 1). The area is underlain by sedimentary formations that form a fractured-rock aquifer used for drinking water and industrial supply. Groundwater contamination at the NP1 Site was first discovered by the North Penn Water Authority (NPWA) in 1979 when concentrations of tetrachloroethylene (PCE) above the U.S. Environmental Protection Agency (EPA) drinking-water maximum contaminant level (MCL) of 5 micrograms per liter (µg/L) were detected in water from a production well (MG 665 [S-9]1 ), which consequently was shut down (table 1). The EPA placed the Site on the National Priorities List on March 31, 1989, and identified three facilities (Gentle Cleaners, Parkside Apartments, and Granite Knitting Mill [GKM]) that used volatile organic compounds (VOCs) that could have led to the contamination of the soil and aquifer (U.S. Environmental Protection Agency, 2008a).
Wells are discussed in this report using local well names used by the U.S. Geological Survey (county code prefix followed by well number). The well names used by the U.S. Environmental Protection Agency are shown in parentheses after the U.S. Geological Survey well names. For more information about the well names used in this report, see the “Well-Identification System” section.
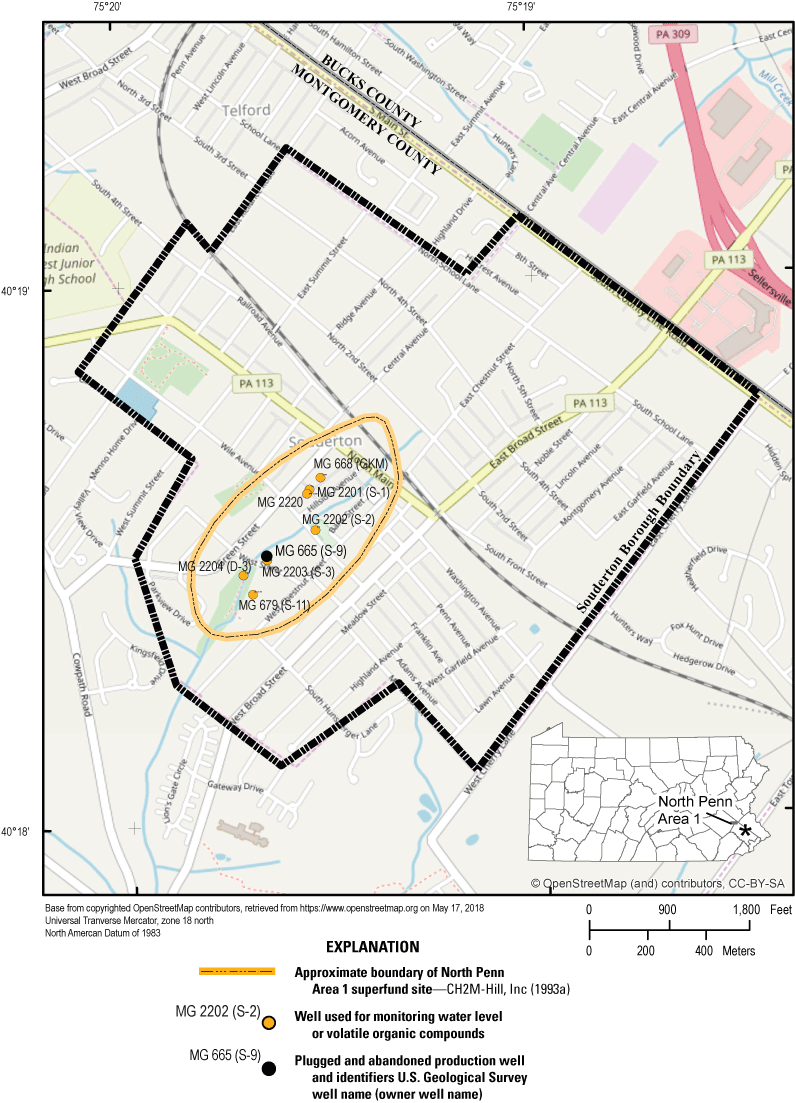
Location of North Penn Area 1 Superfund Site, Souderton, Montgomery County, Pennsylvania. Well information given in table 1.
Table 1.
Characteristics of selected wells, including well names assigned by the U.S. Geological Survey and the Environmental Protection Agency, in the North Penn Area 1 Superfund Site, Souderton, Montgomery County, Pennsylvania.[Data are from U.S. Geological Survey (2024b). USGS, U.S. Geological Survey; EPA, U.S. Environmental Protection Agency; NAVD 88, North American Vertical Datum of 1988; MP, measuring point; GKM, Granite Knitting Mill; NPWA, North Penn Water Authority; NP1, North Penn Area 1]
Estimated year of drilling based on a 5-year review by the U.S. Environmental Protection Agency (2003), which indicated three new monitoring wells drilled after remedial design approved September 1996 and before October 1997.
The EPA issued a Record of Decision (ROD) for the NP1 Site on September 30, 1994. The contaminants of concern are VOCs, primarily PCE and trichloroethylene (TCE). The selected remedy included soil removal and operation of a groundwater-extraction system with discharge to a publicly owned treatment plant. For the remediation, a former GKM production well (MG 668) (table 1) was used as an extraction well for contaminant recovery purposes (pumped) from 1998 to 2005 and the more recently installed monitoring well MG 2201 (S-1) has been pumped since 2008 (U.S. Environmental Protection Agency, 2013). In January 2009, the EPA transferred operation and maintenance of the groundwater extraction system to the Pennsylvania Department of Environmental Protection (PADEP) (U.S. Environmental Protection Agency, 2023).
In the third 5-year review of the Site (2013), the EPA identified the persistence of elevated PCE concentrations in groundwater from extraction well MG 2201 (S-1) and recommended an areal capture zone analysis and additional site characterization to determine the source of the elevated PCE (U.S. Environmental Protection Agency, 2013). Beginning in 2012, the U.S. Geological Survey (USGS) worked cooperatively with the EPA to complete additional site characterization that included development of a conceptual model of the groundwater system and evaluation of the extent of PCE- and TCE-contamination in the aquifer. As part of this technical assistance, the USGS approach was to evaluate existing data from the Site, drill additional monitoring wells, collect and analyze geophysical logs, and monitor water levels.
Purpose and Scope
This report provides results from USGS hydrogeologic investigations and activities conducted during 2012–18, summarizes the results of monitoring efforts by PADEP for VOCs during 1999–2022, and proposes a preliminary conceptual model of the groundwater system on the basis of available data. The USGS hydrogeologic investigations and activities included the drilling of one new well; the collection and analysis of borehole geophysical logs, video logs, and continuous water levels in seven wells; reconstruction of a former production well; and the preparation of a map showing water levels measured in those wells and possible potentiometric contours. The borehole geophysical and video logs for the seven wells are presented and interpreted to identify water-bearing fractures and possible lithologic correlations. Borehole geophysical logs for a former production well logged in 1992 by the USGS near the NP1 Site are also described. Water levels are presented to show fluctuations through time in response to recharge and to pumping. Water-bearing zones, well depths, and natural gamma logs are presented on a cross section. These data collected and analyzed for additional characterization as part of the USGS’s technical assistance to the EPA are used to develop a preliminary conceptual model of the groundwater system, including the hydrogeologic framework and its inferred relation to groundwater flow, and evaluate the extent of groundwater contaminated with PCE and TCE, which are presented in this report with discussion of data gaps and limitations.
Background and Previous Investigations
The EPA completed the phase 2 remedial investigation (RI) of the NP1 Site in 1993, documenting results of soil and groundwater investigations (CH2M-Hill, Inc., 1993a, b). To address the groundwater contamination (designated Operational Unit 2), the ROD prepared by the EPA in 1994 initially specified that the upper 28 feet (ft) of well MG 668 (GKM) and the 270-ft-deep former production well MG 665 (S-9) (fig. 2) were to be pumped as part of the groundwater extraction and treatment system. However, well MG 665 (S-9) was never pumped because of low concentrations of contaminants in samples from the well (U.S. Environmental Protection Agency, 2018a). When the RI was completed in 1993, PCE concentrations in water samples from well MG 665 (S-9) were measured in the range of 1–5 micrograms per liter (µg/L), less than or equal to the drinking-water MCL of 5 µg/L (CH2M-Hill, Inc., 1993a).
The EPA’s ROD addressed soil contamination (designated Operational Unit 1) through removal actions (U.S. Environmental Protection Agency, 2003). Additional monitoring wells (MG 2201 [S-1], MG 2202 [S-2], and MG 2204 [D-3]) were drilled as part of the remedial design for groundwater remediation approved by the EPA in 1996 (U.S. Environmental Protection Agency, 2013), and another monitoring well, MG 2203 (S-3), was drilled in 2000 to replace well MG 665 (S-9), which had been abandoned (destroyed) sometime between July 1998 and October 2000 (U.S. Environmental Protection Agency, 2003). Selected characteristics of the monitoring wells installed by the EPA and former production wells, including USGS well names and those used by the EPA, are presented in table 1.
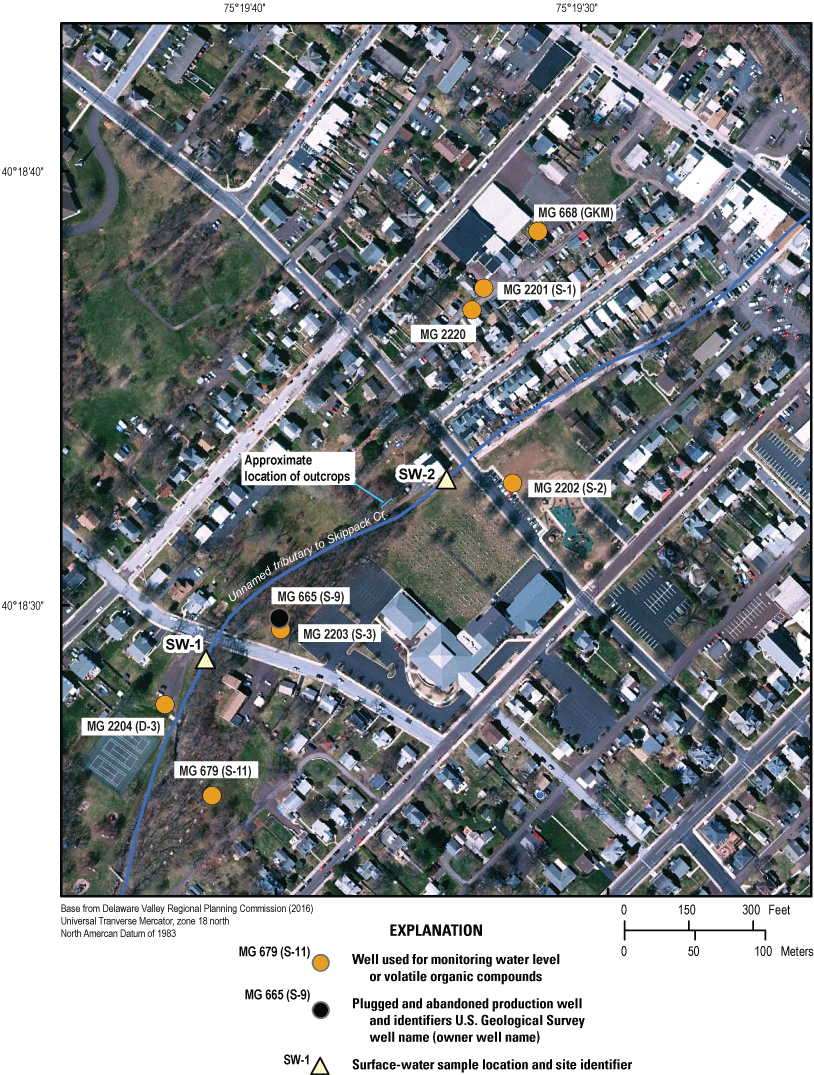
Map showing the location of selected wells and stream sites at the North Penn Area 1 Superfund Site, Souderton, Montgomery County, Pennsylvania. Wells are identified by U.S. Geological Survey well name, with U.S. Environmental Protection Agency well names in parentheses (table 1).
The former production well, MG 668 (GKM) (fig. 2), was used for groundwater extraction from 1998 until February 2005 as part of contaminant remediation. Well MG 668 (GKM) was shut down because concentrations of PCE were consistently below the EPA drinking-water MCL of 5 µg/L that was used as the cleanup standard (U.S. Environmental Protection Agency, 2008a). However, the concentration of PCE in groundwater samples from the nearby 59-ft-deep monitoring well MG 2201 (S-1), located 183 ft southwest of well MG 668 (GKM), was consistently higher than the MCL, with measurements as high as 8,300 µg/L. This led to a change in pumping strategy. The pump was removed from well MG 668 (GKM) and installed in well MG 2201 (S-1); pumping began at well MG 2201 (S-1) on September 22, 2008 (EA Engineering, Science, and Technology, Inc., 2008). Between 2004 and the start of pumping, concentrations of PCE in water samples from well MG 2201 (S-1) had decreased by as much as an order of magnitude (highest reported value was 8,300 µg/L in 2003). Concentrations fluctuated over a range from 28 to 1,180 µg/L since pumping began in September 2008 and remained above the 5 µg/L cleanup standard as of June 2022 (265 µg/L) (U.S. Environmental Protection Agency, 2008a, 2013, 2018a, 2023).
Hydrogeologic Setting
The study area lies within the Gettysburg-Newark Lowlands Section of the Piedmont Physiographic province (fig. 3A), which is characterized by rolling topography and shallow valleys (Sevon, 2000) commonly aligned with orientation of bedrock units as shown in the vicinity of Souderton, Pennsylvania in figure 3B. The Gettysburg-Newark Lowland Section is underlain by Triassic sedimentary rocks of the Mesozoic Newark Basin, which have been intruded in places by Jurassic diabase (Lyttle and Epstein, 1987).
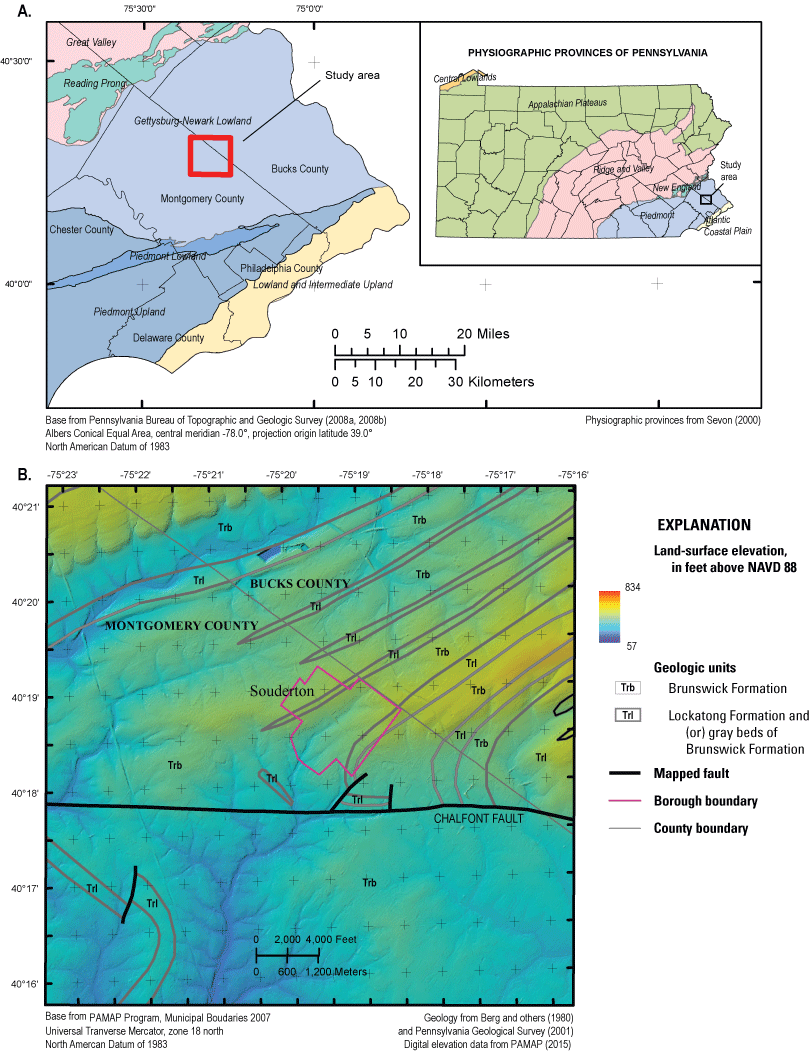
Maps showing the study area in relation to A, the physiographic provinces and sections of Pennsylvania, and B, the topography and mapped geologic units in the vicinity of Souderton, Pennsylvania. [NAVD 88, North American Vertical Datum of 1988]
Within the Newark Basin, the rocks of the Brunswick and Lockatong Formations underlie the NP1 Site and surrounding area (fig. 4). The geology and some aspects of groundwater hydrology of these formations in Montgomery County, Pennsylvania are described by Longwill and Wood (1965) and Newport (1971). The Brunswick Formation consists of red shale and siltstone with a few sandstone beds. Massive red argillite at the base of the Brunswick interfingers laterally with the underlying Lockatong Formation. The Lockatong Formation is massive, dark-gray argillite with subordinate dark-gray mudstone and black shale. Thin beds of gray shale near the study area (fig. 4) have been mapped as units of the Lockatong Formation interfingering with the Brunswick Formation (Longwill and Wood, 1965) or detrital-cycle gray-shale units within the Brunswick Formation (Lyttle and Epstein, 1987). Alternate unpublished mapping by Joseph Smoot of the U.S. Geological Survey (written commun., 2005) describes these units as lacustrine cyclical siltstone and shale containing significant gray and black beds (fig. 1.1). This report makes no distinction between the different interpretations as to the origin of these shale beds.
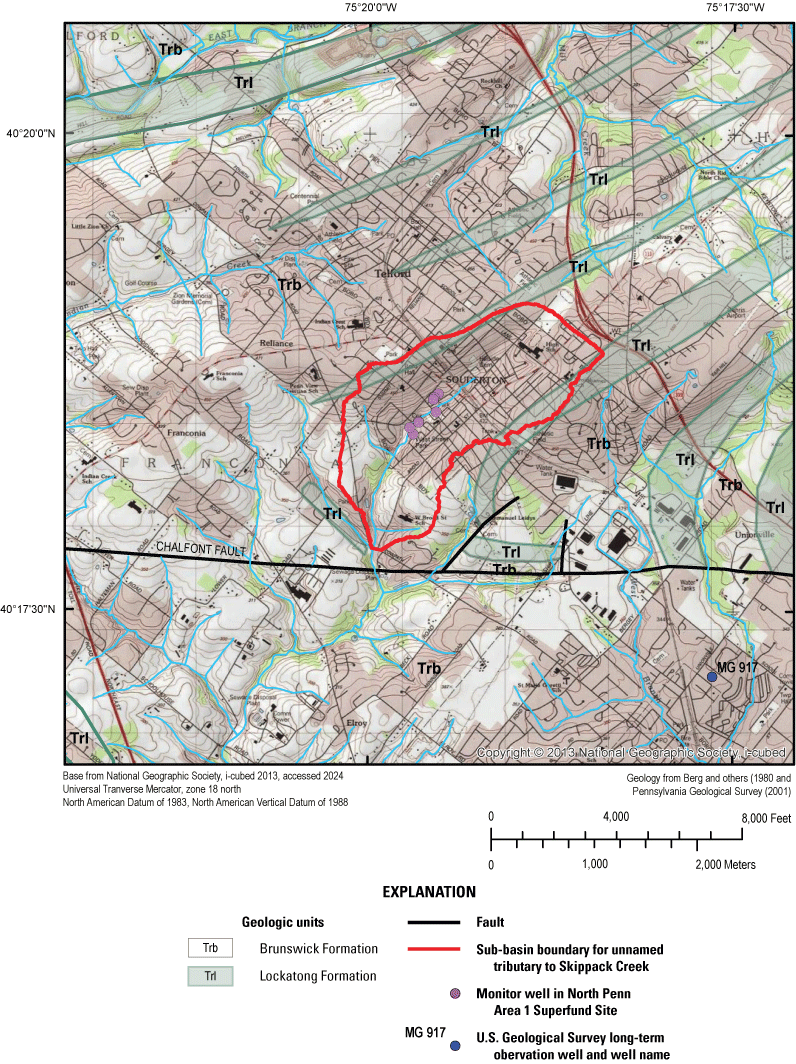
Map of Montgomery and Bucks Counties, Pennsylvania showing geologic units and faults, drainage area for unnamed tributary to Skippack Creek, and selected observation wells in the vicinity of North Penn Area 1 Superfund Site (table 1; U.S. Geological Survey, 2024b).
Regionally, the geologic formations within the Newark Basin form a homocline with bedding that generally strikes northeast (about N.60°E) and dips 9–15 degrees to the northwest. Local and regional faulting has occurred since deposition. The Chalfont Fault, a major regional fault trending east-west, and associated minor faults that disrupt bedding orientations are located about 4,000–5,000 ft south of the NP1 Site. The geologic map by Longwill and Wood (1965, pl. 1) shows that displacement along the Chalfont Fault altered the strike and dip of geologic units north of the fault and dragged these units eastward.
The sedimentary geologic units underlying the study area form a layered fractured-rock aquifer. The competent bedrock is overlain by weathered bedrock (saprolite) and soil formed in situ. Depth to competent bedrock in the Brunswick Formation, as estimated by reported casing lengths for wells, is generally about 40 ft below land surface or less but varies depending on lithology and topographic setting (Low and others, 2002). Recharge to the fractured-rock aquifers occurs by infiltration of precipitation through the overlying soil and weathered rock and typically varies seasonally, with lowest recharge rates occurring when evapotranspiration rates are highest in late summer to fall and highest recharge rates occurring in winter to spring, as indicated by annual fluctuations in water levels. Average annual recharge in the study area is estimated to range from about 8 to 12 inches per year (in/yr) (Risser and others, 2008; Reese and Risser, 2010), and long-term (1901–2022) average annual precipitation is about 45.55 in/yr in Montgomery County, Pennsylvania (National Oceanic and Atmospheric Administration, 2024a). Groundwater flows through a network of fractures both parallel and at high angles to bedding, commonly resulting in apparent preferential flow and permeability in the strike direction (parallel to bedding) and discharges locally to streams or to wells in the study area. Wells completed in the bedrock-rock aquifer in the vicinity of the NP1 Site (within about 1.5 miles from the Site) have been, or as of 2022 are, pumped for industrial, commercial, drinking-water supply, and irrigation uses (U.S. Geological Survey, 1998; Pennsylvania Department of Environmental Protection, 2023).
The NP1 Site and study area is in a small upland valley underlain by the Brunswick Formation but flanked by higher ground underlain by thin mapped beds of the Lockatong Formation or gray-shale units within the Brunswick Formation (fig. 4). The stream within this valley is in the headwaters area of unnamed tributaries to Skippack Creek that drain to the south and southwest. The orientation of local topography and streams commonly is approximately parallel to strike of bedding in the formations, which generally trends to the northeast or north-northeast, and (or) major structural features, such as faults (figs. 3B and 4).
Well-Identification System
The USGS identifies wells using local well names (or identifiers) and a 15-digit site identification number that are used to store and retrieve information about the wells in USGS databases. The USGS local well name consists of a two-character prefix indicating the county, such as MG for Montgomery County in which the study-area wells are located, followed by a four-digit number sequentially assigned as wells are inventoried by the USGS. Wells are discussed in this report using USGS local well names and those used by the EPA (table 1). Well names used by the EPA include those assigned by the EPA for monitoring wells drilled by the EPA as part of the RI investigation (S-1, S-2, S-3, and D-3) and names for former production wells (S-9 and S-11) (CH2M-Hill, Inc., 1993a).
Hydrogeologic Investigations
The hydrogeological investigations conducted by the USGS at the NP1 Site included field activities such as new well installation, characterization of new and existing wells through collection of borehole geophysical and video logs, well reconstruction, and collection of water levels. These data were used to better describe the hydrogeological setting and to develop a conceptual model of the groundwater system at and near the NP1 Site. Unless otherwise specified, all depths are referenced to land surface and are reported in feet below land surface (ft bls). Water levels are reported as depths in feet below land surface or as altitudes in feet above the National Vertical Datum of 1988 (NAVD 88), using measuring point and land-surface altitude data shown in table 2.
Table 2.
Land-surface altitude and water-level measuring points for selected wells, identified by well names assigned by the U.S. Geological Survey and the Environmental Protection Agency, in the North Penn Area 1 Superfund Site, Souderton, Montgomery County, Pennsylvania.[Data are from U.S. Geological Survey (2024b). USGS, U.S. Geological Survey; EPA, U.S. Environmental Protection Agency; NAD 83, North American Datum of 1983; NAVD 88, North American Vertical Datum of 1988; MP, measuring point; GKM, Granite Knitting Mill; —, no name assigned]
Latitude and longitude were determined for well locations using digital maps and (or) a global positioning system and are estimated to be accurate within 0.5 seconds. To protect the precise locations of these wells, the decimal degrees were rounded to the third decimal place in this report.
Land-surface altitude was determined using light detection and ranging (lidar) data at latitude and longitude of well locations based on 3.2-foot raster pixels, with 18.5 centimeter (7.2 inch) vertical resolution and is estimated to be accurate within 1 foot. Relative altitudes of measuring points surveyed in 2009 (AECOM, 2017) for five wells identified by the EPA as S-1, S-2, S-3, D-3, and GKM and the lidar altitude at S-1 were used to calculate land-surface altitudes of the four other wells relative to lidar altitude for S-1 for verification, and the calculated values were within 0.6 feet of lidar values at these four other wells.
Top of concrete pad (measuring point) is estimated to be at land surface. Before well reconstruction in October 2017, the top of casing was 5.9 feet below land surface and top of concrete pad; after the reconstruction and extension of casing in October 2017, the top of casing (measuring point) was 2.37 feet above land surface.
Top of inner casing, which is about 1.7 ft below land surface in well MG 2201 (S-1), is described as the measuring point for water-level data collected by AECOM in reports to PADEP (AECOM, 2017).
Well Installation and Reconstruction
To better define the extent of the downgradient contamination, the installation of as many as three monitoring wells in the area was initially proposed as part of the USGS’s technical assistance to the EPA in 2012. However, only one new monitoring well was drilled (MG 2220 in 2016) because of limited site access. Additionally, well MG 668 (GKM) was reconstructed to prevent surface water and contaminants from entering through the top of the well casing during storms and to isolate a relatively shallow water-bearing fracture in the borehole from deeper fractures.
Installation of Monitoring Well MG 2220
Well MG 2220 was drilled by the USGS during April 4–5, 2016, to monitor the shallow part of the aquifer near the extraction well MG 2201 (S-1) and along a possible route of contaminant migration between extraction well MG 2201 (S-1) and the abandoned NPWA production well MG 665 (S-9) (fig. 2). Well MG 2220 is 58 ft southwest of well MG 2201 (S-1) (fig. 2) and was drilled to a total depth of 82 ft bls. It was initially completed with 6.5-inch (in.) inside-diameter steel casing to 19 ft bls and with a 6-inch nominal open hole from 19 to 82 ft bls. A borehole video log was collected on April 11, 2016, and geophysical and flowmeter logs were collected on August 22, 2016. On October 2, 2017, a 2-in.-free-standing (ungrouted) polyvinyl chloride (PVC) casing was installed with a 10-ft screened interval from 72 to 82 ft bls. Permanent installation of the casing and screen with sand pack and grout was postponed until further investigations could determine the most contaminated depth interval in the borehole to place the screen. The borehole currently (2024) remains an open borehole with a temporary screen and no grout or sand pack.
Reconstruction of Well MG 668 (GKM)
Well MG 668 (GKM) is a former industrial production well that was initially drilled to a depth of 208 ft bls on an unknown date sometime before 1957 (Longwill and Wood, 1965) and was installed in a well pit. During the RI in 1992, packer testing of isolated intervals to a reported depth of 187 ft showed that the greatest concentration of PCE (330 µg/L) was in the shallowest isolated zone, from 0 to 28 ft (CH2M-Hill, Inc., 1993a). The reference datum for depths was not reported with these findings (CH2M-Hill, Inc., 1993a), so it is not known whether those depths are measured from land surface or from top of casing in the well pit (about 5.7 ft below land surface).
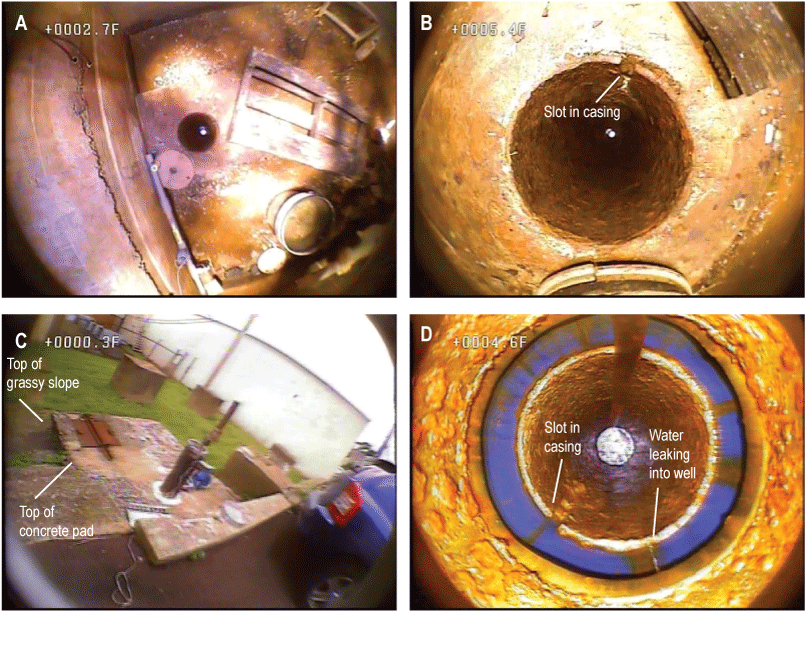
Still images from 2012 and 2018 borehole video logs for well MG 668 (Granite Knitting Mill) showing A, the well pit and top of casing in 2012; B, the slot in top of casing in well pit in 2012; C, the casing extension on top of concrete pad over pit in 2018 looking southwest, with nearest edge of pad flush with land surface next to the parking lot and grassy slope below farther edge of pad; and D, water leaking through a joint between the pre-reconstructed existing and post-reconstruction extended casing at 4.6 feet below grassy slope and filled slot in top of existing casing in 2018. Video logs were collected by U.S. Geological Survey near North Penn Area 1 Superfund Site, Souderton, Montgomery County, Pennsylvania, June 26, 2012, and July 26, 2018. Depths shown on images are measured in feet below land surface (ft bls) at top of concrete pad in the 2012 video log and feet below the grassy slope (ft bgs) in the 2018 video log; depths measured in ft bgs in the 2018 video log are about 1 foot less than depths measured in ft bls in the 2012 video log because of the difference in reference datums.
Well MG 668 (GKM) is in a pit (fig. 5A) that frequently collects water during storms, although how water enters the pit during storms is not specifically known. Before reconstruction of this well in October 2017, a channel in the concrete pit floor and slot in the steel well casing (fig. 5B) diverted water from the pit into the well. Inflow from surface water that collects in the pit was likely the cause of observed sharp spikes in rising water levels in well MG 668 (GKM) during storms, discussed later in the section “Water Levels.” The rising water-level spikes may temporarily increase the downward hydraulic gradient in the well from shallow to deep water-bearing fractures, thus increasing the potential for downward flow of the most contaminated water identified as present at shallow depths less than about 28 ft (CH2M-Hill, Inc., 1993a) into deeper fracture zones. Although no downward flow was measured in the well during geophysical logging by the USGS under ambient conditions in July 2012 (discussed in section “Borehole Geophysical Logging and Video Surveys”), the water-level spikes indicate potential for transient downward gradients.
To eliminate or reduce this possible connection for contaminant movement from shallow to deep water-bearing zones, well MG 668 (GKM) was filled with grout from its total depth of 208 ft bls to 35.4 ft bls, the slot in the casing was plugged, and the casing was extended to 2.37 ft above the concrete pit cover on October 2–3, 2017 (fig. 5C). Despite efforts to prevent pit water from entering the well, a video log collected when water was standing in the pit on July 28, 2018, documented that pit water leaked to some extent into the well at the joint between the old well casing and the casing extension added by the driller (fig. 5D). Although the target depth for well reconstruction was about 50 ft bls to include all water-bearing fractures to that depth, the water-bearing fracture at about 37–38 ft bls was inadvertently grouted during reconstruction.
Borehole Geophysical and Video Logging
In 2012, borehole geophysical and video logs were collected by the USGS in the following six wells: MG 679 (S-11), MG 668 (GKM), MG 2201 (S-1), MG 2202 (S-2), MG 2203 (S-3), and MG 2204 (D-3) (table 3). Well MG 2220 was logged by the USGS in 2016. Previously, borehole geophysical logs were collected by the USGS in 1992 during the RI in two wells, MG 665 (S-9) and MG 668 (GKM) (table 3). Borehole geophysical and video logging methods and types of logs are described in reports for other studies (Conger, 1999; Conger and Bird, 1999; Reynolds and others, 2015; Senior and others, 2021). The borehole geophysical logs collected in 2012 and 2016 were published by the USGS using the USGS well name and 15-digit site number. The geophysical data are available to view or download from the USGS GeoLog Locator (U.S. Geological Survey, 2024a). The borehole video logs were archived by the USGS Pennsylvania Water Science Center. Well logs are discussed in sequential order of USGS well names listed in table 3.
Logged well depths (table 3) for some wells were less than reported depths (table 1); differences in logged and reported well depths may be related to accumulation of sediment at bottom of well or well caving since well was drilled and (or) inaccuracies in reported well depths at time of drilling. The depth shown on video logs is for the upper edge of the image and is reported in ft bls unless otherwise specified.
Table 3.
Description of logs collected from eight wells in the North Penn Area 1 Superfund Site, Souderton, Pennsylvania, 1992–2016.[Data are from U.S. Geological Survey (2024a). USGS, U.S. Geological Survey; EPA, U.S. Environmental Protection Agency; ft bls, feet below land surface; NAVD 88, North American Vertical Datum of 1988; n.d., no data; ft, feet; bls, below land surface; <, less than; GKM, Granite Knitting Mill; C, caliper; G, natural gamma; R, single-point resistance; F, fluid resistivity; T, fluid temperature; V, borehole flow; A, acoustic televiewer; B, borehole video; H-P, heat-pulse flowmeter; I, conductivity by electromagnetic induction; EM, electromagnetic flowmeter]
MG 665 (S-9)
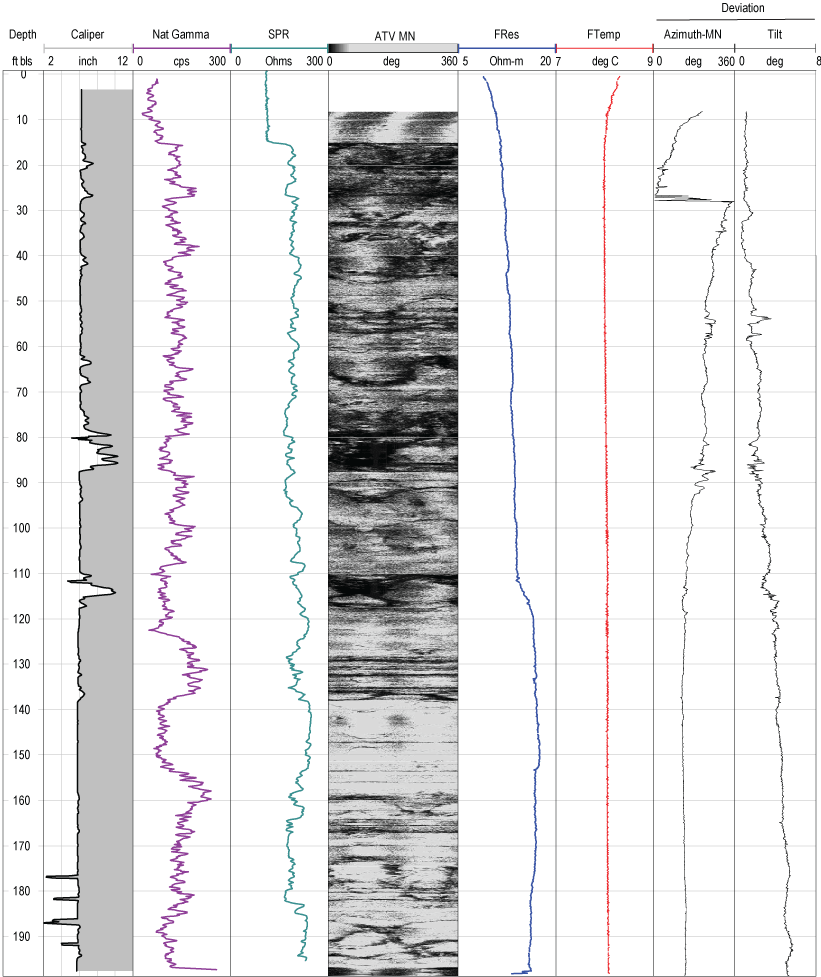
Well MG 665 (S-9) is a former production well that was initially drilled to a depth of 300 ft bls in 1954 (tables 1 and 3) (Longwill and Wood, 1965). The USGS collected borehole geophysical logs in well MG 665 (S-9) in 1992, and some results of that logging are described in the RI report (CH2M-Hill, Inc., 1993a). At the time of logging by the USGS in April 1992, the well had 46.5 ft of 8-in.-diameter casing and was an 8-in.-diameter open hole to a depth of 300 ft bls; however, the well was partly caved at 280 ft bls and partly blocked from 293 to 300 ft bls (Charles Wood, U.S. Geological Survey, written commun., May 1, 1992). The original digital log data were not available for the geophysical logs, but scans of the paper logs (fig. 1.2) were digitized resulting in the log suite shown in figure 6. Although originally selected to serve as an extraction well as part of the EPA 1996 remediation plans, in 1997 the EPA decided not to pump well MG 665 (S-9) because contaminant concentrations in water from the well were low, and the well was abandoned (plugged and sealed) sometime during the period 1998–2000 (U.S. Environmental Protection Agency, 2003).
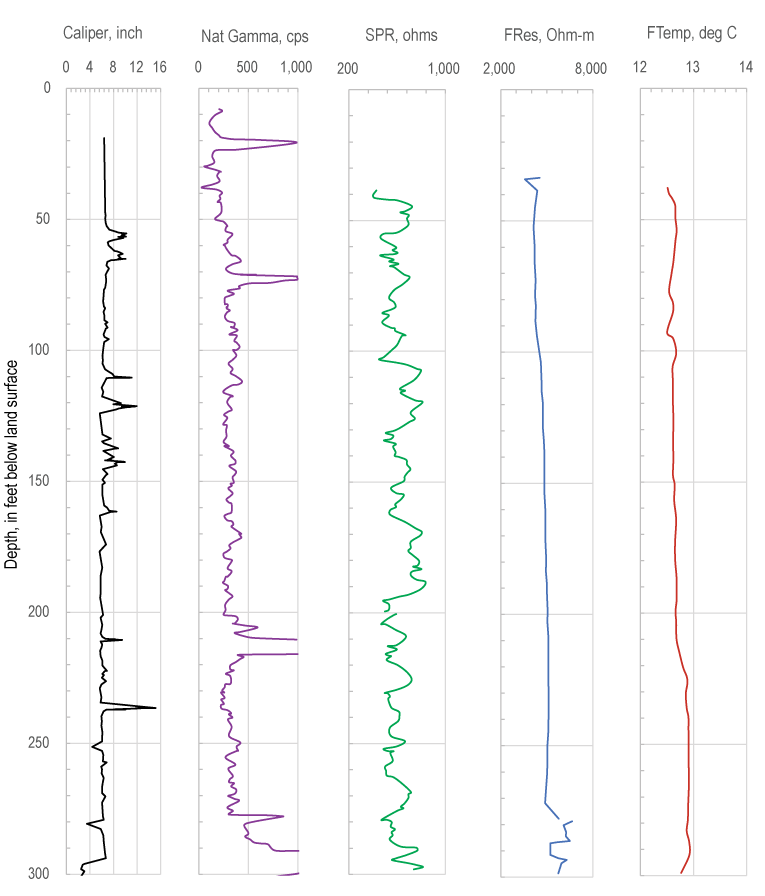
Borehole geophysical logs collected by U.S. Geological Survey in well MG 665 (S-9), Souderton, Montgomery County, Pennsylvania, April 21, 1992. Data derived from paper logs were digitized with an online tool by Rohatgi (2024). Natural gamma (Nat Gamma) measurements off scale at values greater than 1,000 counts per second (cps) on original paper log as shown in figure 1.2. [ft bls, feet below land surface; SPR, single-point resistance; FRes, fluid resistivity; Ohm-m, Ohm-meters; FTemp, fluid temperature; deg, degrees; deg C, degrees Celsius]
The caliper logs showed openings at about 55, 65, 110, 120, 130–140, and 160 ft bls that likely are high-angle fractures as openings appear to span more than 1 ft (fig. 6). Openings near 85–95, 173, 210, and 236 ft bls may be low-angle or bedding-plane fractures because these openings are thin, spanning less than 1 ft. Inflections on the fluid-log profiles that may indicate water-bearing fractures are apparent at about 210 ft bls on the water-temperature log and about 235 ft bls on the fluid resistivity log, corresponding to openings at similar depths on the caliper log (figs. 6 and 1.2). Smaller inflections on fluid logs are apparent near openings shown on caliper logs at or near depths of 55–65 ft bls and 85–95 ft bls. The natural gamma log shows about four relatively thin zones (2–5 ft in thickness) of elevated activity near about 18, 70, 210, and 280 ft bls and a thicker zone (10 ft in thickness) at 290–300 ft bls that are typical of marker beds and, if present in other wells, can be possibly used for lithologic-log correlation.
MG 679 (S-11)
Well MG 679 (S-11) is a former production well that was drilled in 1960 with an 8-in.-diameter casing to 41.5 ft bls and was reported to be completed as an open hole below the casing to a depth of about 308 ft bls (tables 1 and 3) (Longwill and Wood, 1965). Reported lithologies on drilling logs indicate predominantly red shale from about 0 to 180 ft bls, blue-gray argillite interbedded with red shale from 180 to 200 ft bls, sandstone from 200 to 210 ft bls, blue-gray argillite and siltstone from 210 to 285 ft bls, and reddish-brown shale interbedded with blue-gray argillite from 285 to 308 ft bls (Longwill and Wood, 1965, p. 56–57). Depth to static water level at the time of logging (July 17, 2012) was about 8.4 ft bls, and logs extended to a depth of about 286 ft bls indicating some collapse or filling of the borehole since initial drilling.
The caliper and acoustic-televiewer (ATV) logs show numerous fractures throughout the borehole that are generally more closely spaced in the intervals from about 40 to 140 ft bls and 195 to 235 ft bls than in other intervals of the borehole and a very large (borehole diameter greater than 16 in.) opening from about 268 to 275 ft bls (fig. 7). Many of the fractures on the caliper and ATV logs appear to be high angle. However, low-angle fractures, likely parallel to bedding planes, are also common. Natural gamma logs show slightly lower activity from about 195 to 230 ft bls, which overlaps and is consistent with the reported sandstone lithology from 200 to 210 ft bls. The fluid-temperature log shows relatively constantly increasing values with depth, but the observed water-temperature gradient is less than the natural geothermal gradient (reported by Paulachok [1986] to be about 1 degree Celsius per 100 ft in Philadelphia, 24 miles southeast of Souderton) and thus may indicate small amounts of vertical flow throughout the borehole. However, borehole flow was not measured so the presence of flow under ambient conditions at the time of logging can only be inferred from the temperature log. The fluid-resistivity log shows several inflections (the largest at about 60, 85, 140, 195, and 220 ft bls) that generally correspond to changes in lithologies, notable fractures, or both, and indicate possible water-bearing zones (fig. 7).
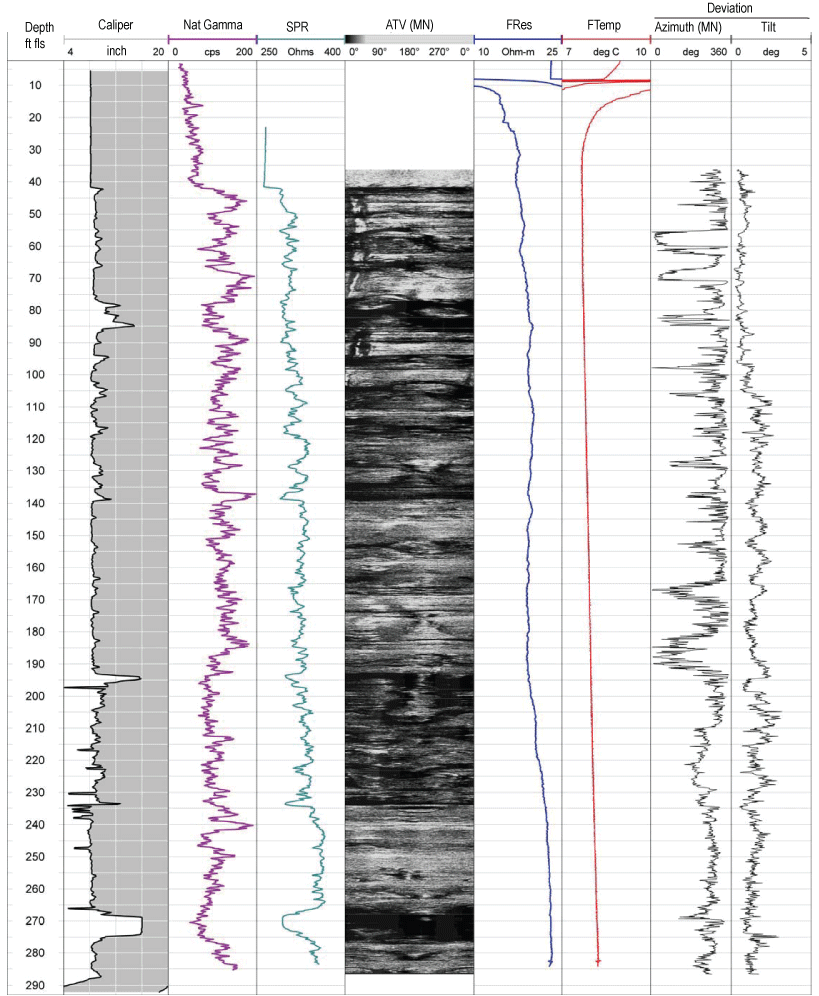
Borehole geophysical logs collected by the U.S. Geological Survey in well MG 679 (S-11) near the North Penn Area 1 Superfund Site, Souderton, Montgomery County, Pennsylvania, July 17, 2012. [ft bls, feet below land surface; Nat Gamma, natural gamma; cps, counts per second; SPR, single-point resistance; ATV, acoustic televiewer; MN, magnetic north; FRes, fluid resistivity; FTemp, fluid temperature; deg, degrees; deg C, degrees Celsius]
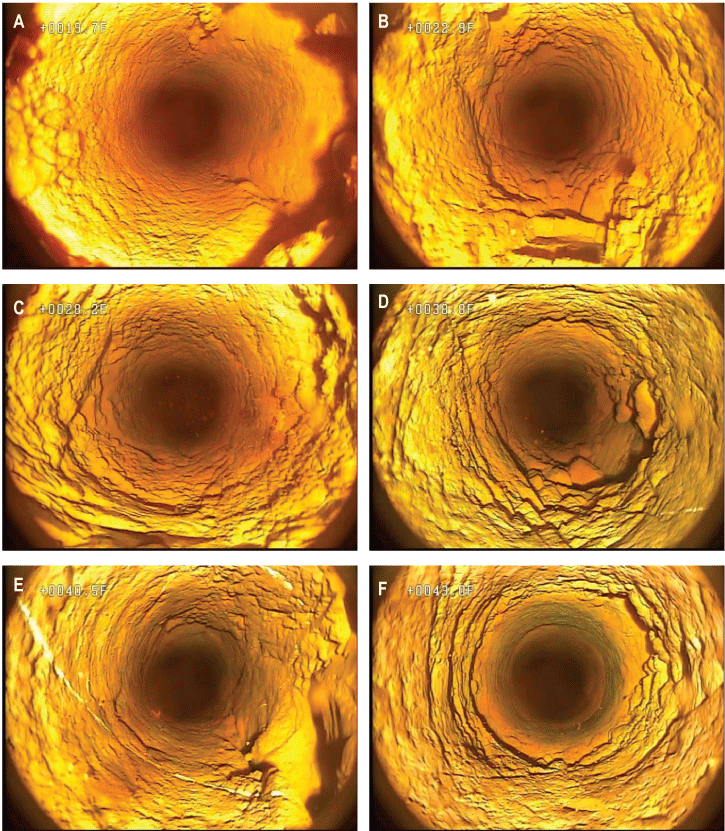
The borehole video log collected by the USGS on July 10, 2012, when the depth to water was 8.2 ft bls showed some low-angle and numerous high-angle fractures throughout the borehole (fig. 8). High-angle or mixed high- and low-angle probable water-bearing fractures were noted at depths of about 76–87, 101.9, 113–118.5, 165.8–168.8, 173–174, 192.5–209.4, 232.5–235, and 264.7–276.8 ft bls. Other high-angle or mixed high- and low-angle possible water-bearing fractures were noted at depths of about 130–134, 151–155, 162.5, 182, 188–190, 210–220, 221–229, 278.9–282.2, and 284.2 ft bls. Low-angle possible water-bearing openings were noted at depths of about 89.1, 93.5, 134.5, and 138 ft bls. Apparent turbulence in borehole water was noted at depths near 76–87, 101.9, 173–174, and 232.5–235 ft bls in association with high-angle fractures. Large amounts of particulates that appear to be bacterial matter are present along borehole walls and in the water column, especially in the upper 150 ft of the borehole. Images of selected fractures and features in well MG 679 (S-11) from the 2012 video log are shown in figure 8.
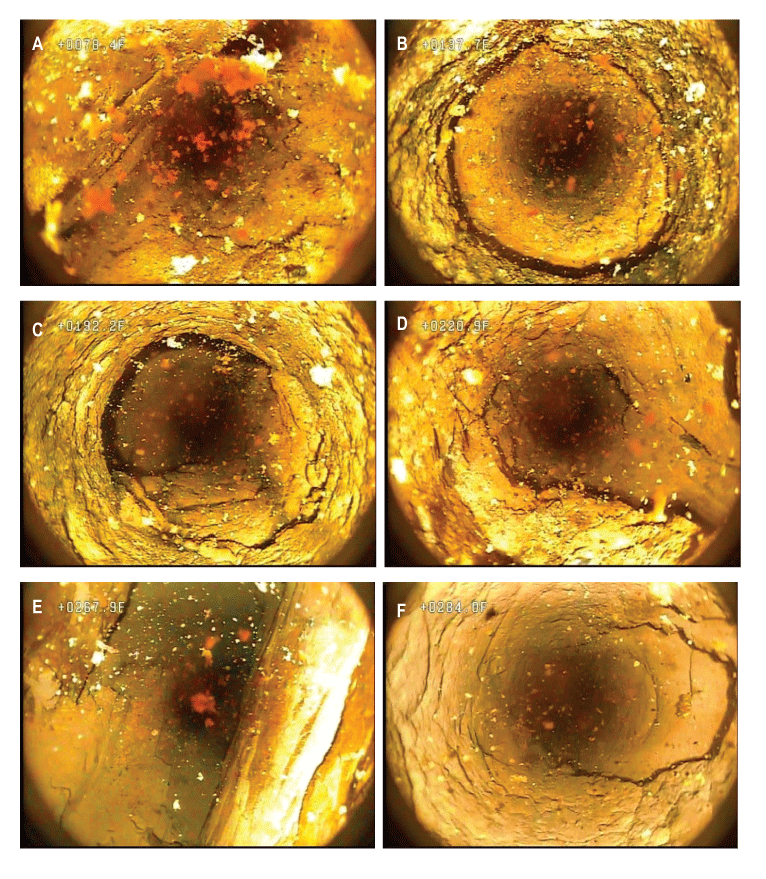
Still images from a 2012 borehole video log of well MG 679 (S-11) at A, 78.4 feet below land surface (ft bls) showing high-angle fractures, B, 137.7 ft bls showing low-angle fractures, C, 192.2 ft bls showing high-angle fractures, D, 220.9 ft bls showing high-angle fractures, E, 267.9 ft bls showing very large planar opening crossing borehole, and F, 284.0 ft bls showing high-angle fracture near bottom of borehole. Video log collected by U.S. Geological Survey near North Penn Area 1 Superfund Site, Souderton, Montgomery County, Pennsylvania, July 10, 2012.
MG 668 (GKM)
Well MG 668 (GKM) is a former production well that was drilled on an unknown date, but sometime before 1957, to a reported depth of 208 ft (Longwill and Wood, 1965) as discussed in the section “Reconstruction of Well MG 668 (GKM).” At the time of logging by the USGS on July 18, 2012, the well head was located in a well pit (fig. 5A) about 5.7 ft below the top of the concrete pad forming the top of the pit; the well had an 8-in.-diameter casing to 9.4 ft bls and was an 8-in.-diameter open hole below the casing to a depth of about 97 ft bls and a 6-in.-diameter hole from about 97 to 195 ft bls (tables 1and 3). Depth to static water level at the time of logging on July 18, 2012, was about 22.9 ft bls. The top of the concrete pad was approximately flush with land surface at the edge of the parking lot and was about 1 ft higher than land surface of the grassy slope to the southwest (fig. 5C). The top of the concrete pad was assumed to be at land surface for logs and water levels measured in the well unless otherwise specified.
The caliper and ATV logs show numerous fractures throughout the borehole that are generally more closely spaced in the intervals from about 10 to 97 ft bls and 120 to 130 ft bls than in other intervals of the borehole (fig. 9). Natural gamma log shows little variation with depth, with a single peak of slightly elevated activity at about 53 ft bls. The single-point resistance log shows values higher in magnitude at depths above about 96 ft bls that may result from lithology (sandstone more resistant than shale), but these values also may be affected by changes in borehole diameter and fluid-resistivity values at depths above 96 ft bls and so should be interpreted with caution. The fluid-resistivity log shows an inflection at about 30 ft bls, a slope change at about 80 ft bls, and a larger, sharp inflection at about 96 ft bls that had higher fluid-resistivity values above 96 ft bls than below 96 ft bls, indicating water that is relatively more dilute than deeper water enters the borehole through fractures at or near 96 ft bls. A small inflection at 96 ft bls is also indicated on the fluid-temperature log, which additionally shows small changes in slope at about 59, 39, and 32 ft bls. Little to no vertical borehole flow was measured under ambient conditions (fig. 9). Under pumping conditions when the pump was set at 35 ft bls, an increase in upward borehole flow was measured at depths just above the fractures near 96 ft bls, indicating along with the other logs, that the fractures near 96 ft bls produce water and are likely among the most productive water-bearing features in the borehole. The flow rate of about 0.10 gal/min measured at 55 ft bls under pumping conditions was much less than the pumping rate of about 0.8–1.25 gal/min, indicating possible undermeasurement of flow because of leaky seals on the flowmeter diverter in borehole with rough walls and (or) that the fractures above 55 ft bls produce a substantial amount of water being pumped.
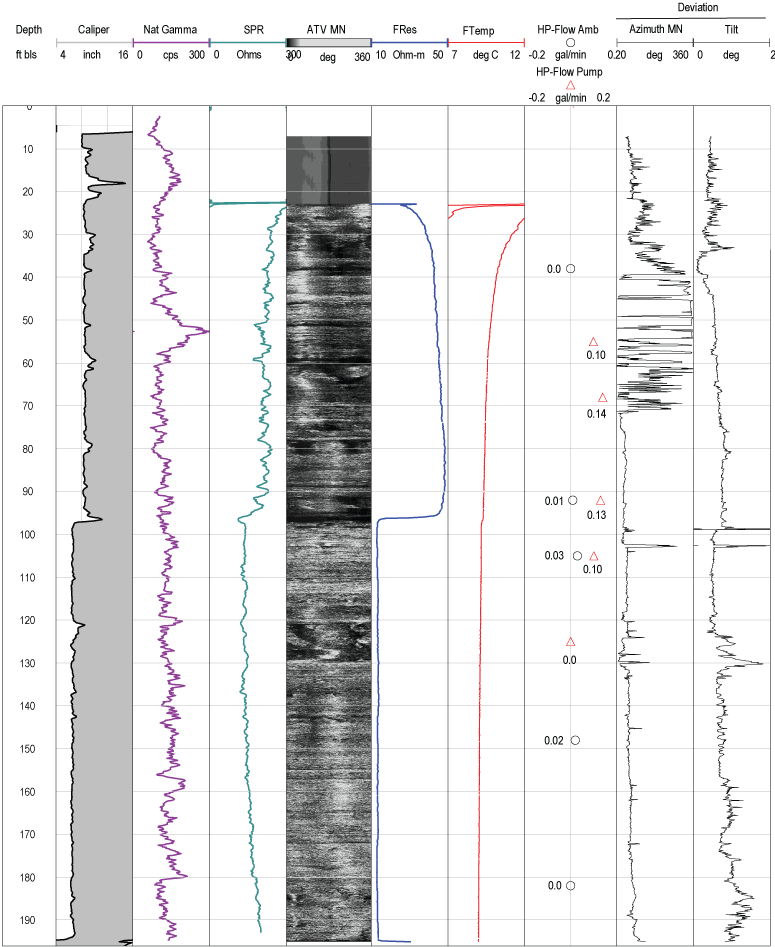
Borehole geophysical logs collected by the U.S. Geological Survey in well MG 668 (Granite Knitting Mill) near North Penn Area 1 Superfund Site, Souderton, Montgomery County, Pennsylvania, July 18, 2012. The well was pumped at a rate of about 0.8–1.25 gallons per minute during measurements of vertical borehole flow under pumping conditions. [ft bls, feet below land surface; Nat Gamma, natural gamma; cps, counts per second; SPR, single-point resistance; ATV, acoustic televiewer; MN, magnetic north; FRes, fluid resistivity; FTemp, fluid temperature; deg, degrees; deg C, degrees Celsius; H-P, heat-pulse; amb, ambient; pump, pumping; gal/min, gallons per minute]
The borehole video log collected by the USGS on June 26, 2012, was referenced to depths below the top of the concrete pad estimated to be at land surface. The June 2012 video log showed some low-angle and numerous high-angle fractures throughout the borehole. Possible water-bearing high-angle fractures and associated openings were noted at about 29–33, 60–64, 74.7–76, 78.2–81, 96–98.8, 121–126, 127.4–129.7, 142.8–145, and 184–188 ft bls. Possible water-bearing low-angle fractures and associated openings were noted at about 37, 51, 59, and 136.6 ft bls. Of these features, openings near 30, 37, 59, 80, and 96 ft bls are associated with inflections on fluid logs or increases in flow that can be inferred to indicate water-bearing zones. Images of selected fractures from the 2012 video log of well MG 668 (GKM) are shown in figures 10 and 11. Above the static water level of 23.2 ft bls, borehole walls were wet and low-angle fractures were noted at about 16.2–18.4 and 19.5 ft bls (figs. 11A, 11C, and 11E).
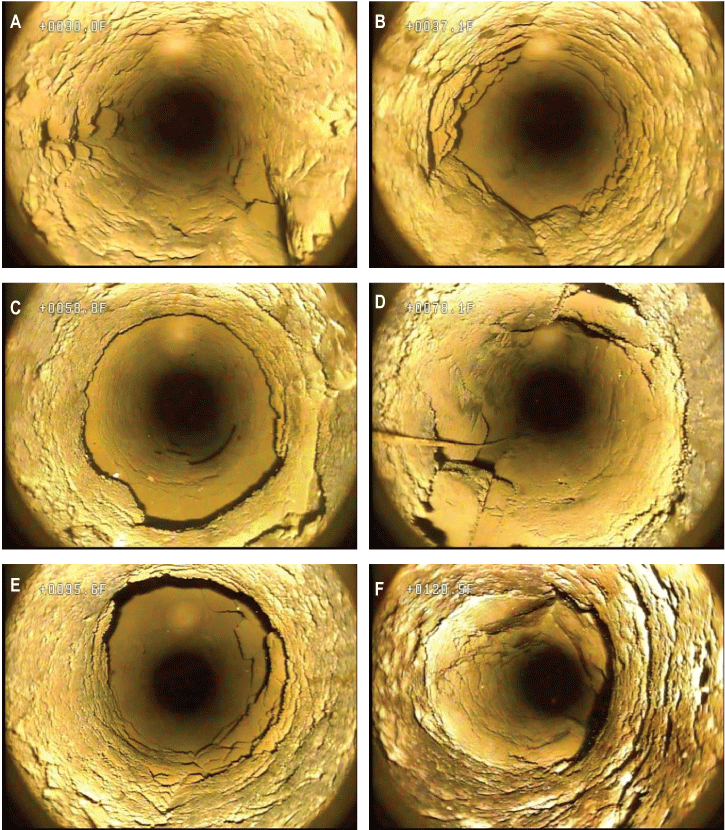
Still images from a 2012 borehole video log of well MG 668 (Granite Knitting Mill) at A, 30.0 feet below land surface (ft bls) at top of concrete pad showing high-angle fractures crossing borehole, B, 37.1 ft bls showing low-angle fractures, C, 58.8 ft bls showing low-angle opening, D, 78.1 ft bls showing high-angle fractures crossing borehole, E, 95.6 ft bls showing large opening, and F, 120.5 ft bls showing rough borehole texture just above vertical fracture. Video log collected by U.S. Geological Survey near North Penn Area 1 Superfund Site, Souderton, Montgomery County, Pennsylvania, June 26, 2012.
The borehole video log collected by the USGS on July 26, 2018, was referenced to depths below the grassy slope next to, and about 1 ft lower than, the top of the concrete pad of the well pit (fig. 5C). Therefore, all depths for the 2018 video log are about 1 ft less than if referenced to depths below the top of the concrete pad and are referred to in feet below grassy slope (ft bgs). For example, the depth to the casing’s bottom in the 2018 video log is about 8.3 ft bgs, which is about 9.3 ft bls (and below the top of the concrete pad). When the borehole video log was rerun in 2018 after the borehole had been backfilled to a depth of 34.4 ft bgs (or 35.4 ft bls) and reconstructed to extend casing above the well pit, the depth to water was 7.9 ft bgs, which was about 15 ft higher than in 2012 when the borehole was open to 208 ft bls. Possible water-bearing low-angle fractures and associated openings in the 2018 video log were noted at about 14.9 and 18.3–20.9 ft bgs, depths which were above static water when the well was logged in 2012. Possible water-bearing high-angle fractures and associated openings were noted at about 27.7–32.6 ft bgs, similar to logs collected in 2012. Images from the 2018 video log for selected fractures in well MG 668 (GKM) are shown paired with same features from the 2012 video log in figure 11. The extensive vertical fractures apparent on the 2012 video log from about 29–33 ft bls appear reduced in extent on the 2018 video log (figs. 11E and 11F), possibly because of grouting when well was backfilled to 34.4 ft bgs (about 35.4 ft bls). In the 2018 video log, which was collected after several days of moderate to heavy rain (as recoded at Doylestown Airport, about 10 miles east of NP1 Site [National Oceanic and Atmospheric Administration, 2024b]) and several feet of water had collected in the well pit, water was noted to enter the borehole at the joint between the existing and extended casing at about 4.7 ft bgs (fig. 5D), indicating some surface water can still enter the borehole despite reconstruction efforts.
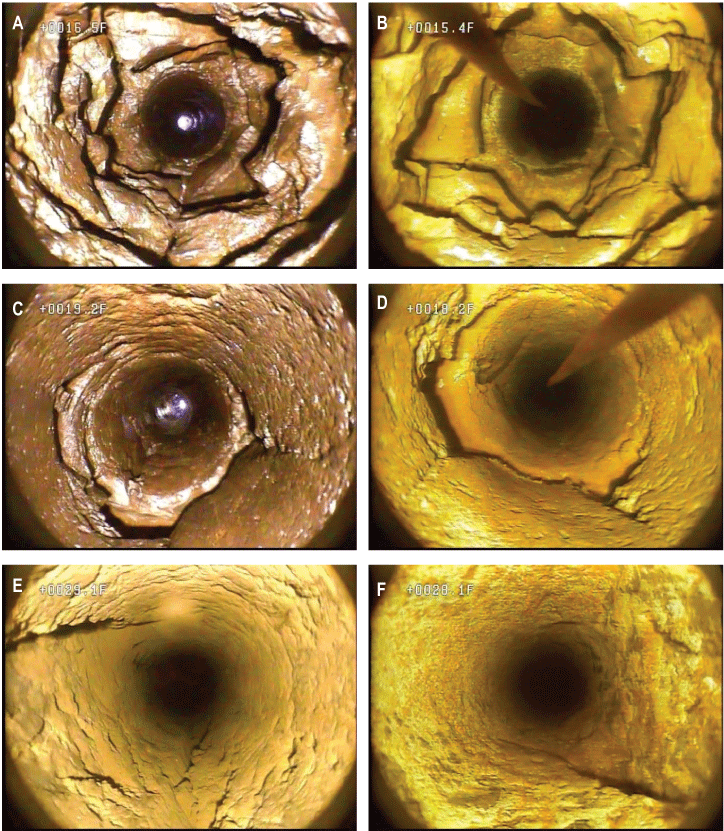
Still images for same features from 2012 and 2018 borehole video logs of well MG 668 (Granite Knitting Mill) at A, 16.5 feet below land surface (ft bls) at top of concrete pad showing wet borehole walls above static water level and fracture openings in 2012, B, 15.4 feet below grassy slope (ft bgs) showing same fracture opening below static water level in 2018, C, 19.2 ft bls showing wet borehole walls above static water level and fracture openings in 2012, D, 18.2 ft bgs showing same fracture opening below static water level in 2018, E, 29.1 ft bls showing high-angle fractures crossing borehole below static water level in 2012, and F, 28.1 ft bgs showing same high-angle fractures in 2012 but reduced in extent possibly because of grouting. Video logs collected by U.S. Geological Survey near North Penn Area 1 Superfund Site, Souderton, Montgomery County, Pennsylvania, June 26, 2012, and July 26, 2018. Depths measured in feet below the grassy slope (ft bgs) are about 1 foot less than if depths were referenced in feet below land surface (ft bls) at top of concrete pad.
MG 2201 (S-1)
Well MG 2201 (S-1) is a monitoring well installed by the EPA that, at the time of logging by the USGS on July 19, 2012, had a 6-in.-diameter casing to 16.3 ft bls and was a 6-in.-diameter open hole below the casing to a depth of about 59 ft bls (tables 1 and 3). Depth to static water level at the time of logging on July 19, 2012, was about 23.1 ft bls.
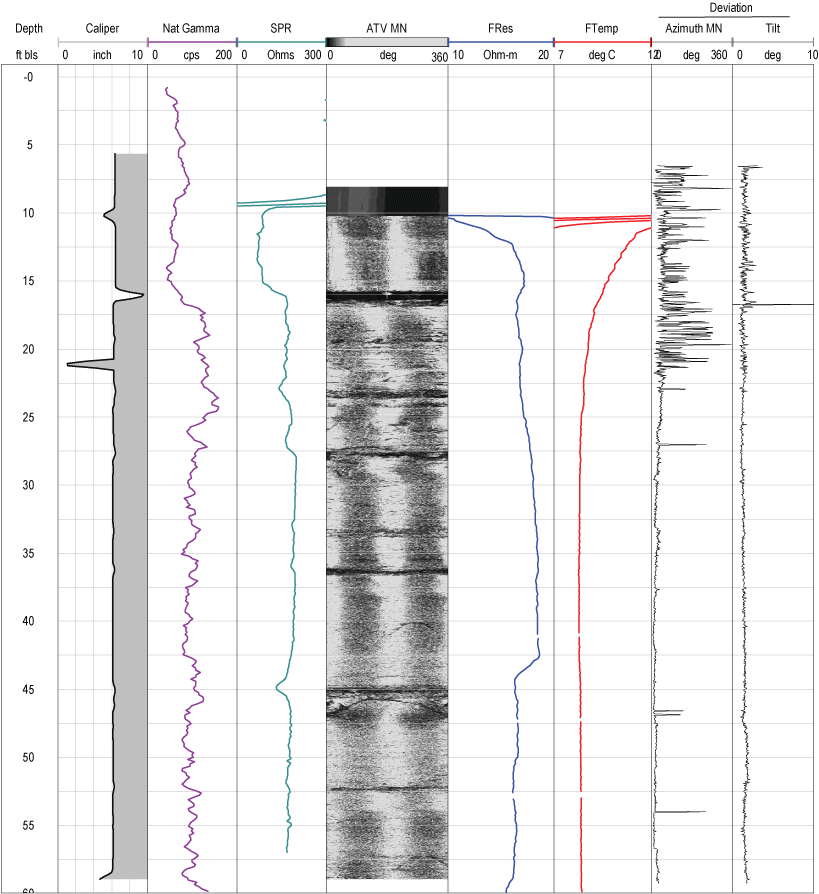
The caliper and ATV logs show numerous fractures throughout the borehole that are generally more closely spaced in the intervals from about 20 to 32 ft bls and 50 to 57 ft bls than in other intervals of the borehole (fig. 12). The natural gamma log shows relatively small variation with depth, with peaks of slightly elevated activity at about 32.5 and 48 ft bls. The single-point resistance log shows values slightly higher in magnitude at about 26–27 ft bls and 34–50 ft bls that may result from lithology (sandstone is more resistant than shale). The fluid-resistivity log shows small inflections at about 27, 40, and 53 ft bls. Small inflections at about 26 and 28 ft bls are indicated on the fluid-temperature log. A small amount of vertical borehole flow (about 0.03 gallon per minute [gal/min]) was measured at about 38 ft bls above fractures at about 51–55 ft bls under ambient conditions (fig. 12). Under pumping conditions (about 1 gal/min), an increase in upward borehole flow of about 0.43 gal/min was measured at about 48 ft bls above the fractures at about 51–55 ft bls, indicating along with the other logs, that the fractures at about 51–55 ft bls and above about 28 ft bls likely are the most productive water-bearing features in the borehole.
Borehole geophysical logs collected by the U.S. Geological Survey in well MG 2201 (S-1) near North Penn Area 1 Superfund Site, Souderton, Montgomery County, Pennsylvania, July 19, 2012. Well MG 2201 was pumped at a rate of about 1 gallon per minute during measurements of vertical borehole flow under pumping conditions. [ft bls, feet below land surface; Nat Gamma, natural gamma; cps, counts per second; SPR, single-point resistance; ATV, acoustic televiewer; MN, magnetic north; FRes, fluid resistivity; FTemp, fluid temperature; deg, degrees; deg C, degrees Celsius; H-P, heat-pulse; amb, ambient; pump, pumping; gal/min, gallons per minute]
The borehole video log collected by the USGS on July 19, 2012, showed a few low-angle and high-angle fractures throughout the borehole (fig. 13). Above the static water level of 21.6 ft bls, the borehole walls were wet and several high-angle fractures were noted at about 18.4 and 19.4–20.7 ft bls. Possible water-bearing low-angle fractures and associated openings were noted at about 25–28 ft bls. Possible water-bearing high-angle fractures were noted at about 51–55 ft bls. Of these features, openings near 25 and 51 ft bls are associated with inflections on fluid logs or increases in flow that can be inferred to indicate water-bearing zones. The water in the borehole was turbid (with apparent particulate matter) and had a reddish-brown haze shown in figure 13B, especially in the interval from static water level to about 40 ft bls, suggesting little borehole flow in that interval under conditions at the time of logging. The cause of turbidity is unknown but could be related to bacterial activity. Turbulence was noted at the fractures near 51 ft bls, indicating that inflow or outflow through those fractures is likely. Images of selected fractures and features from the 2012 video log of well MG 2201 (S-1) are shown in figure 13.
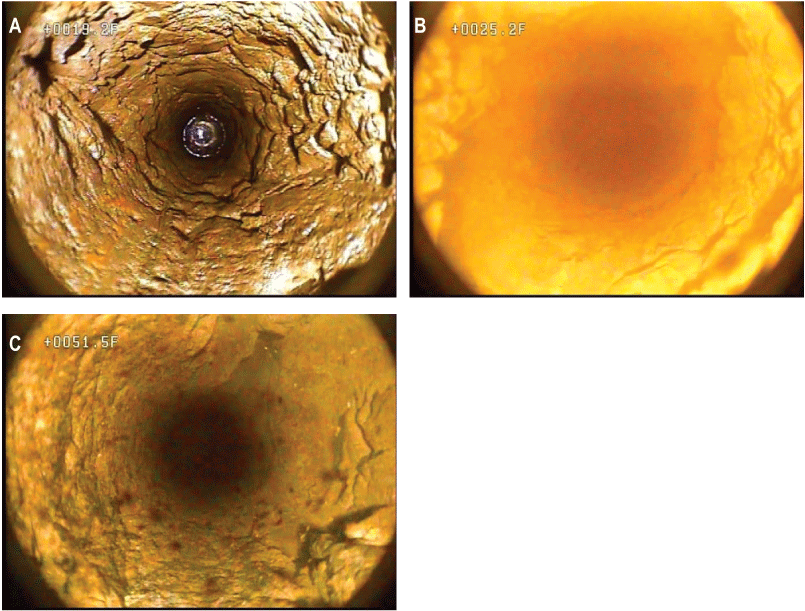
Still images from a 2012 borehole video log of well MG 2201 (S-1) at A, 19.2 feet below land surface (ft bls) showing high-angle fractures crossing borehole and wet borehole walls above static water level, B, 25.2 ft bls showing low-angle fractures, and C, 51.5 ft bls showing high-angle opening. Video log collected by U.S. Geological Survey near North Penn Area 1 Superfund Site, Souderton, Montgomery County, Pennsylvania, July 19, 2012.
MG 2202 (S-2)
Well MG 2202 (S-2) is a monitoring well installed by the EPA that, at the time of logging by the USGS on July 17, 2012, had a 6-in.-diameter casing to 15.5 ft bls and was a 6-in.-diameter open hole below the casing to a depth of about 60 ft bls (tables 1 and 3). Depth to static water level at the time of logging on July 17, 2012, was about 10.3 ft bls.
The caliper and ATV logs show several fractures throughout the borehole that are generally spaced about 5–10 ft apart (fig. 14). The natural gamma and single-point resistance logs show relatively small variation with depth, which likely indicate minimal variation in lithology in intervals spanned by the borehole. The fluid-resistivity log shows relatively small inflections at about 16 and 23–26 ft bls. The fluid-temperature log also shows relatively small inflections at about 16 and 23–26 ft bls, in addition to a larger inflection at about 44 ft bls and other small inflections at about 36 and 52 ft bls. No borehole flow logs were collected in well MG 2202 (S-2). The available geophysical logs indicate that the fractures near 16, 23–26, and 44 ft bls are likely the most productive water-bearing features in the borehole.
Borehole geophysical logs collected by the U.S. Geological Survey in well MG 2202 (S-2) near North Penn Area 1 Superfund Site, Souderton, Montgomery County, Pennsylvania, July 17, 2012. [ft bls, feet below land surface; Nat Gamma, natural gamma; cps, counts per second; SPR, single-point resistance; ATV, acoustic televiewer; MN, magnetic north; FRes, fluid resistivity; FTemp, fluid temperature; deg, degrees; deg C, degrees Celsius]
The borehole video log collected by the USGS on June 26, 2012, at a static water level of about 10.2 ft bls, showed mostly low-angle fractures throughout the borehole. Images of selected fractures and features from the 2012 video log of well MG 2202 (S-2) are shown in figure 15. There appears to be a large opening just below the casing’s bottom at 15.5 bls, where an unknown object (which could be a plastic bottle) rests (fig. 15A); this opening is shown as an increase in borehole diameter to about 10 in. on the caliper log (fig. 14). Possible water-bearing low-angle fractures and openings were noted at about 27.4, 36.1, and 44.8 ft bls. Of these features, openings near 23–27 and 44.8 ft bls are associated with inflections on fluid logs that can be inferred to indicate water-bearing zones.
Still images from a 2012 borehole video log of well MG 2202 (S-2) at A, 15.4 feet below land surface (ft bls) showing opening and unknown object below the casing’s bottom 15.5 ft bls, B, 23.1 ft bls showing low-angle fractures, C, 26.9 ft bls showing low-angle fractures, D, 35.8 ft bls showing low-angle fractures, E, 44.6 ft bls showing low-angle fractures, and F, 51.9 ft bls showing minor low-angle fractures. Video log collected by U.S. Geological Survey near North Penn Area 1 Superfund Site, Souderton, Montgomery County, Pennsylvania, June 26, 2012.
MG 2203 (S-3)
Well MG 2203 (S-3) is a monitoring well installed by the EPA that, at the time of logging by the USGS on July 16, 2012, had a 6-in.-diameter casing to 20 ft bls and was a 6-in.-diameter open hole below the casing to a depth of about 50 ft bls (tables 1 and 3). Depth to static water level at the time of logging on July 16, 2012, was about 13.9 ft bls.
The caliper and ATV logs show several fractures throughout the open borehole above about 43 ft bls (fig. 16). The natural gamma and single-point resistance logs show small variation with depth that likely indicate minimal variations in lithology in intervals spanned by the borehole. The fluid-resistivity log shows small inflections at about 20 and 41 ft bls. The fluid-temperature log also shows inflections at about 20 and 41 ft bls, in addition to inflections near about 25 and 27.5 ft bls. No borehole flow logs were collected in well MG 2203 (S-3). The available geophysical logs indicate that the fractures near 20 and 41 ft bls likely are the most productive water-bearing features in the borehole.
Borehole geophysical logs collected by the U.S. Geological Survey in well MG 2203 (S-3) near North Penn Area 1 Superfund Site, Souderton, Montgomery County, Pennsylvania, July 16, 2012. [ft bls, feet below land surface; Nat Gamma, natural gamma; cps, counts per second; SPR, single-point resistance; ATV, acoustic televiewer; MN, magnetic north; FRes, fluid resistivity; FTemp, fluid temperature; deg, degrees; deg C, degrees Celsius]
The borehole video log collected by the USGS on June 26, 2012, when the static water was about 13.1 ft bls showed several high-angle and some low-angle fractures throughout the borehole. Images of selected fractures and features from the 2012 video log of well MG 2203 (S-3) are shown in figure 17. There appears to be a high-angle fracture just below the casing’s bottom at about 19.7 to 23 ft bls. Other possible water-bearing high-angle fractures and openings were noted at about 39.1 to 41.2 ft bls. Possible water-bearing low-angle fractures and openings were apparent at about 28.5 and 43.5 ft bls. Of these features, openings near 20 and 41 ft bls are associated with inflections on fluid logs that can be inferred to indicate water-bearing zones.
Still images from a 2012 borehole video log of well MG 2203 (S-3) at A, 19.7 feet below land surface (ft bls) showing vertical fracture below the casing’s bottom, B, 22.9 ft bls showing low-angle fractures near bottom of vertical fracture beginning at 19.7 ft bls, C, 28.2 ft bls showing low-angle fractures or openings, D, 38.8 ft bls showing top of vertical fractures and openings, E, 40.5 ft bls showing bottom of high-angle fractures, and F, 43.0 ft bls showing low-angle fractures. Video log collected by U.S. Geological Survey near North Penn Area 1 Superfund Site, Souderton, Montgomery County, Pennsylvania, June 26, 2012.
MG 2204 (D-3)
Well MG 2204 (D-3) is a monitoring well installed by the EPA that, at the time of logging by the USGS on July 16, 2012, had a 6-in.-diameter casing to 15 ft bls and was a 6-in.-diameter open hole below the casing to a depth of about 198 ft bls (tables 1 and 3). The well was flowing at the time of logging on July 16, 2012.
The caliper and ATV logs show numerous fractures throughout the borehole, especially in the interval from the casing’s bottom at 15 ft bls to about 90 ft bls (fig. 18). The natural gamma log shows relatively small variation with depth, with some intervals with slightly elevated activity from about 122 to 137 ft bls and 155 to 160 ft bls separated by an interval of relatively lower activity. The single-point resistance logs are generally the inverse of the natural gamma logs, a relation which is common but more pronounced in logs of well MG 2204 (D-3) than in logs for other wells at the NP1 Site. Used in conjunction, the natural gamma and single-point resistance logs indicate the largest differences in lithology observed in the length of the borehole are in the shale-dominate intervals of 122–137 ft bls and 155–160 ft bls (relatively elevated gamma, lower single-point resistance), which are separated by a sandier interval (lower gamma, higher single-point resistance). The fluid-resistivity log shows relatively small inflections at about 27, 40, 50, 60, 70, 80, 98, 130, 154, 180, and 195 ft bls and a larger inflection at about 112 ft bls. The fluid-temperature log is nearly vertical, possibly indicating upward flow throughout the borehole in this flowing well. No borehole flow logs were collected in well MG 2204 (S-4). The available geophysical logs indicate that the fractures near 112 ft bls are likely among the most productive water-bearing features in the borehole but other fractures throughout the borehole also produce water.
Borehole geophysical logs collected by the U.S. Geological Survey in well MG 2204 (D-3) near North Penn Area 1 Superfund Site, Souderton, Montgomery County, Pennsylvania, July 16, 2012. [ft bls, feet below land surface; Nat Gamma, natural gamma; cps, counts per second; SPR, single-point resistance; ATV, acoustic televiewer; MN, magnetic north; FRes, fluid resistivity; FTemp, fluid temperature; deg, degrees; deg C, degrees Celsius]
The borehole video log collected by the USGS on July 10, 2012, when the well was flowing showed mostly high-angle and a few low-angle fractures throughout the borehole. Images of selected fractures and features from the 2012 video log of well MG 2204 (D-3) are shown in figure 19. Possible water-bearing high-angle fractures and openings were noted at about 24.9, 61.7, 77.3, 81–87, 181.5, 173.7, 187.4, 190.4, and 194 ft bls, with other probable water-bearing large vertical fractures at about 89 and 110–118 ft bls. Clumps of matter, likely related to bacterial activity, are present in the water column, especially at depths greater than about 74 ft bls. Turbulence as indicated by rapid nonlinear movement of these clumps was noted near the large fractures at about 86 and 110–118 ft bls. Possible water-bearing low-angle fractures were noted near 154 ft bls where there is a change in lithology indicated by the natural-gamma log and rock color. Of these features, openings near 62, 85, 110, 154, 180, and 194 ft bls are associated with inflections on fluid logs that can be inferred to indicate water-bearing zones. Intervals from 122 to 137 ft bls and 155 to 160 ft bls appear grayish green, as shown for selected depths in figure 20, in contrast the other intervals in the borehole, which are reddish brown (fig. 19). The grayish green intervals correspond to intervals of relatively elevated natural gamma activity (fig. 18).
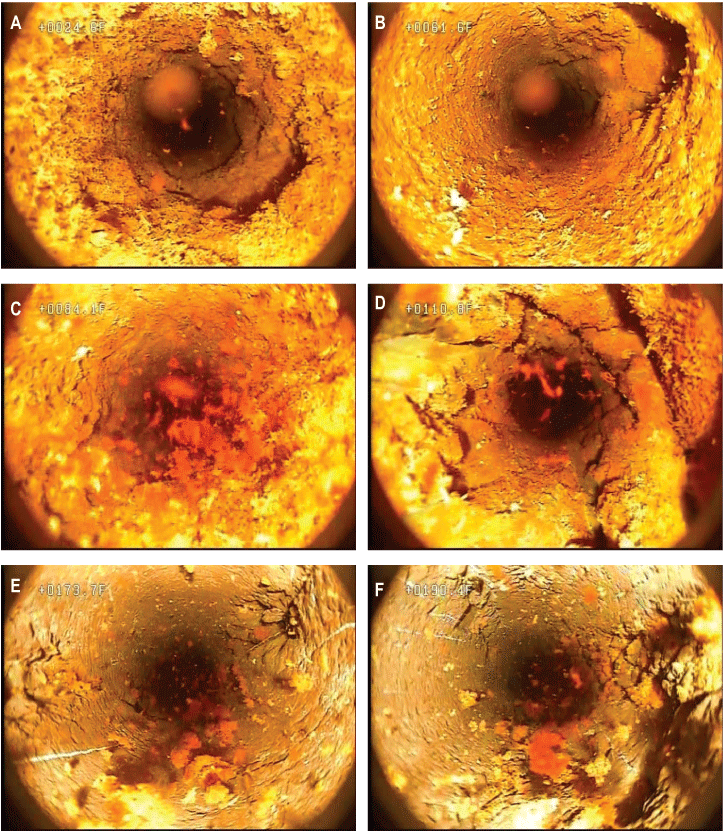
Still images from a 2012 borehole video log of well MG 2204 (D-3) at A, 24.6 feet below land surface (ft bls) showing high-angle opening, B, 61.6 ft bls showing high-angle opening, C, 84.1 ft bls showing high-angle fractures or openings and flocculent matter (bacteria), D, 110.8 ft bls showing high-angle fractures and openings, E, 173.5 ft bls showing high-angle fracture crossing borehole, and F, 190.4 ft bls showing high-angle fractures. Video log collected by U.S. Geological Survey near North Penn Area 1 Superfund Site, Souderton, Montgomery County, Pennsylvania, July 10, 2012.
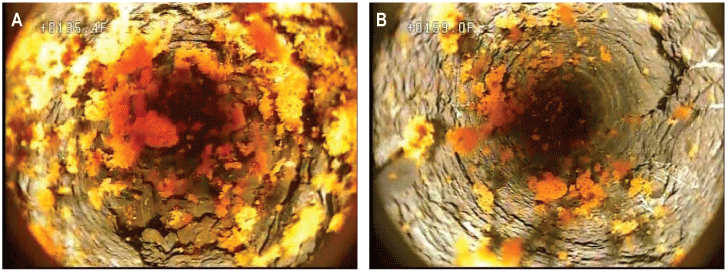
Still images from a 2012 borehole video log of well MG 2204 (D-3) showing grayish-green lithology and fractures and flocculent matter at A, 134.5 feet below land surface (ft bls) and B, 159.0 ft bls. Video log collected by U.S. Geological Survey near North Penn Area 1 Superfund Site, Souderton, Montgomery County, Pennsylvania, July 10, 2012.
MG 2220
Well MG 2220 is a monitoring well installed by the USGS and the EPA in 2016 that, at the time of logging by the USGS on August 22, 2016, had a 6-in.-diameter casing to 19 ft bls and was a 6-in.-diameter open hole below the casing to a depth of about 82 ft bls (tables 1 and 3). The depth to water at the time of logging August 22, 2016, as about 25.2 ft bls. Well MG 2220 was logged by the USGS with different equipment in 2016 than what was used for other logs collected in 2012. Some logs, such as natural gamma, electrical, and fluid logs collected using different equipment may have comparatively different specific values but similar relative values.
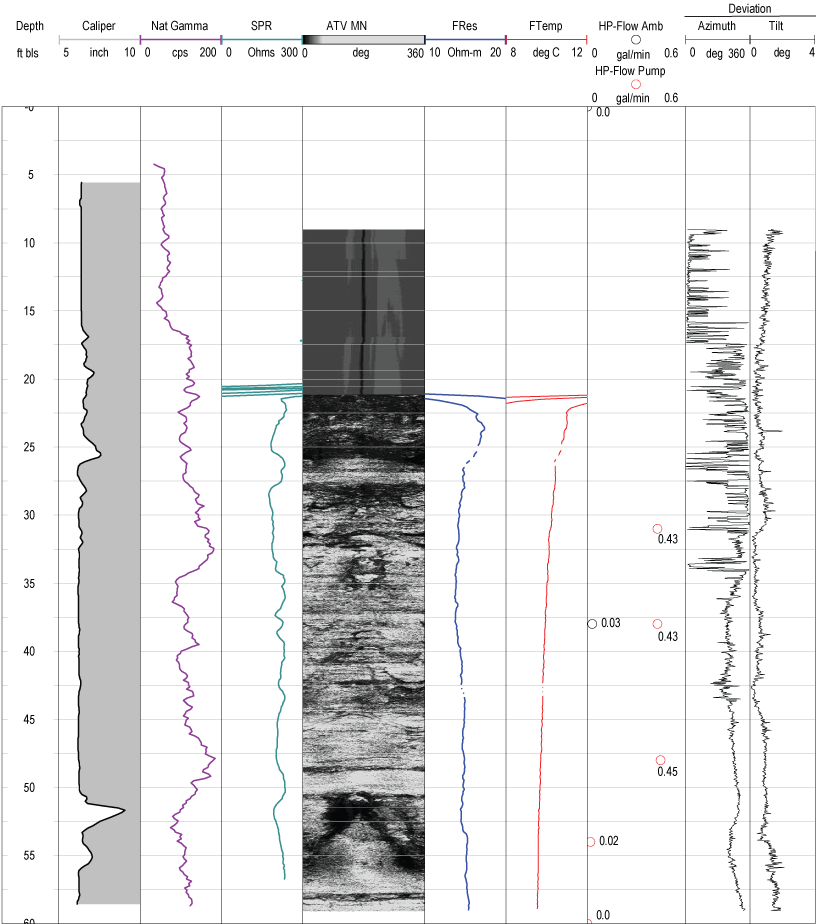
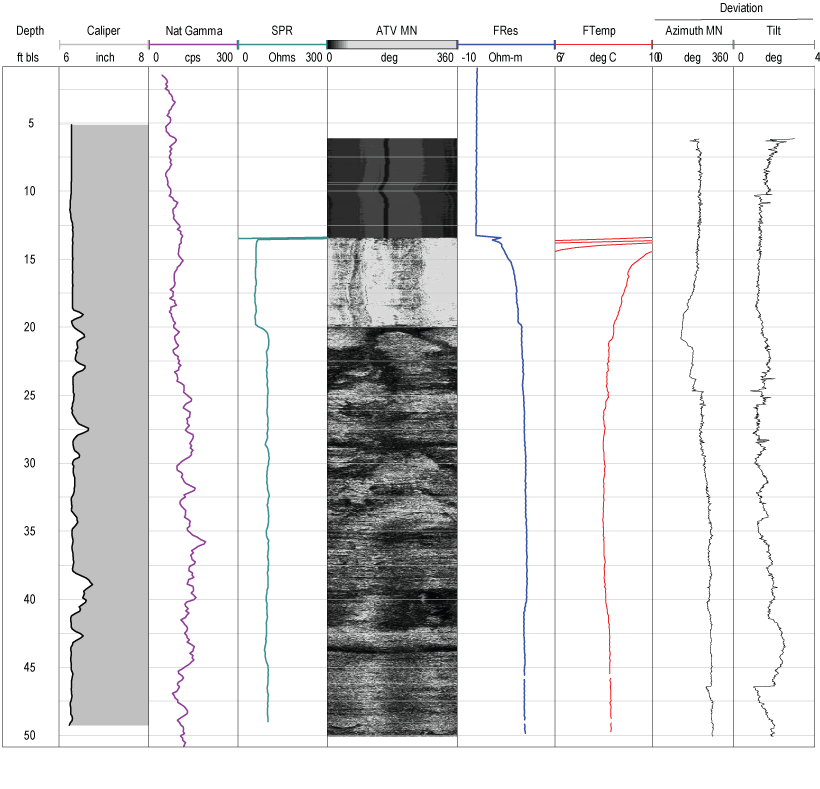
The caliper and ATV logs show numerous fractures throughout the borehole, especially in the interval from the casing’s bottom at 19 ft bls to about 62 ft bls (fig. 21). The natural gamma log shows relatively small variation with depth and a peak with slightly elevated activity at about 18 ft bls in the casing. The peak would likely be greater if it was not in the casing, which reduces the gamma signal. The electrical conductivity log (inverse of electrical-resistivity log) also shows relatively small variation with depth, except for an interval of relatively elevated conductivity from about 54 to 61 ft bls. The fluid logs were collected under ambient and pumping conditions. Under ambient conditions, the fluid-resistivity and temperature logs show small inflections at about 35 and 50 ft bls. When the well was pumped at a rate of about 5 gal/min, the fluid-resistivity and temperature logs show small to very small inflections at about 42 and 55 ft bls; the fluid-resistivity log also shows a small inflection at about 68 ft bls. The fluid-temperature log, other than very small inflections, is nearly vertical, which is consistent with upward flow throughout the borehole under pumping conditions. Little (about 0.12–0.055 gal/min) to no vertical borehole flow was measured under ambient conditions, but all measured flow was downward (fig. 21); downward flow increased below fractures near 42 ft bls, indicating possible inflow through those fractures, and then decreased below fractures near 49 ft bls, indicating possible outflow through the fractures near about 44–49 ft bls. These flow measurements should be interpreted with caution because rough borehole walls may have reduced effectiveness of diverter seals for the heat-pulse flowmeter in this well, which would result in reducing the accuracy and magnitude of measured flow values. Under pumping conditions, upward borehole flow was measured throughout the borehole; increases in upward flow were measured at depths above the fractures near 78, 70, and 42 ft bls, indicating possible inflow from or near those fractures, and a decrease in upward flow was measured above the fractures near 49 ft bls, indicating possible outflow through fractures near about 44–49 ft bls (fig. 21). Flow measurements in the highly fractured interval from 20 to about 62 ft bls should be qualified as more uncertain than typical because of possible issues in obtaining a borehole seal for the flowmeter diverter during this measurement. The fractures above 36 ft bls seem to be the most productive in the well because flow measurements indicate the balance of water being pumped from the well at 5 gal/min is derived from fractures in that interval. Transient pumping in nearby extraction well MG 2201 (S-1) was noted to affect water levels, and possibly borehole flow, in well MG 2220. The results of flow measurements, along with the other logs, show that the fractures in the interval above 62 ft bls, especially above 36 ft bls (about 25–35 ft bls) and at or near 38–42 and 62 ft bls, and near 70 and 78 ft bls produce water; additionally, the fractures near 50 ft bls appear to be hydraulically active because flow measurements indicate possible outflow at or near that depth, and fractures near 55 ft bls may also be hydraulically active as indicated by inflections of fluid logs.
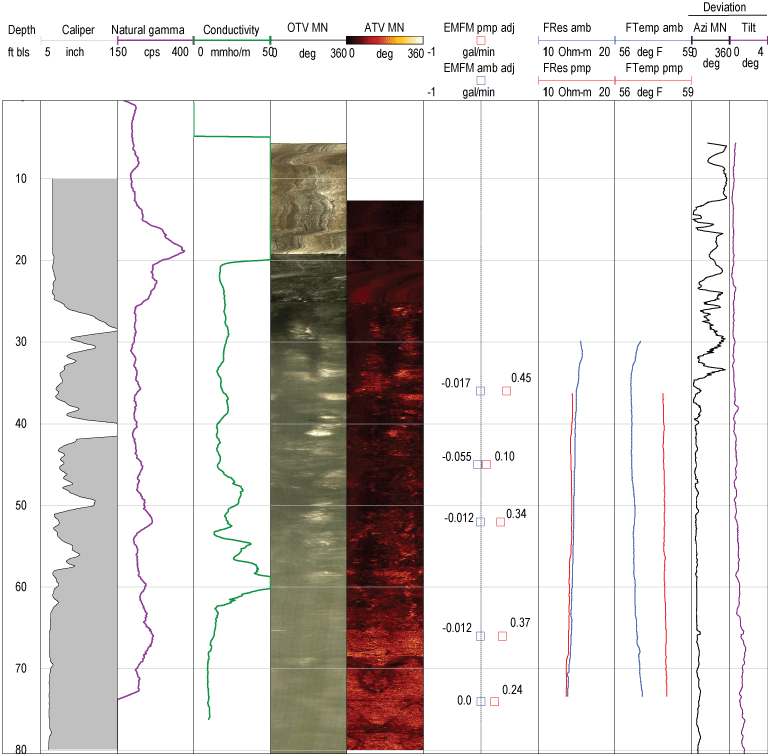
Borehole geophysical logs collected by the U.S. Geological Survey in well MG 2220 near North Penn Area 1 Superfund Site, Souderton, Montgomery County, Pennsylvania, August 22, 2016. Well MG 2220 was pumped at a rate of about 5.0 gallons per minute during measurements of vertical borehole flow under pumping conditions, although transient pumping nearby at extraction well MG 2201 (S-1) may have additionally affected water levels, and possibly borehole flow, in well MG 2220. [ft bls, feet below land surface; Nat Gamma, natural gamma; mmho/m, millimohs per meter; cps, counts per second; SPR, single-point resistance; ATV, acoustic televiewer; MN, magnetic north; FRes, fluid resistivity; FTemp, fluid temperature; deg, degrees; deg C, degrees Celsius; EMFM, electromagnetic flowmeter; amb, ambient; pmp, pumping; adj, adjusted; gal/min. gallons per minute; Azi, azimuth]
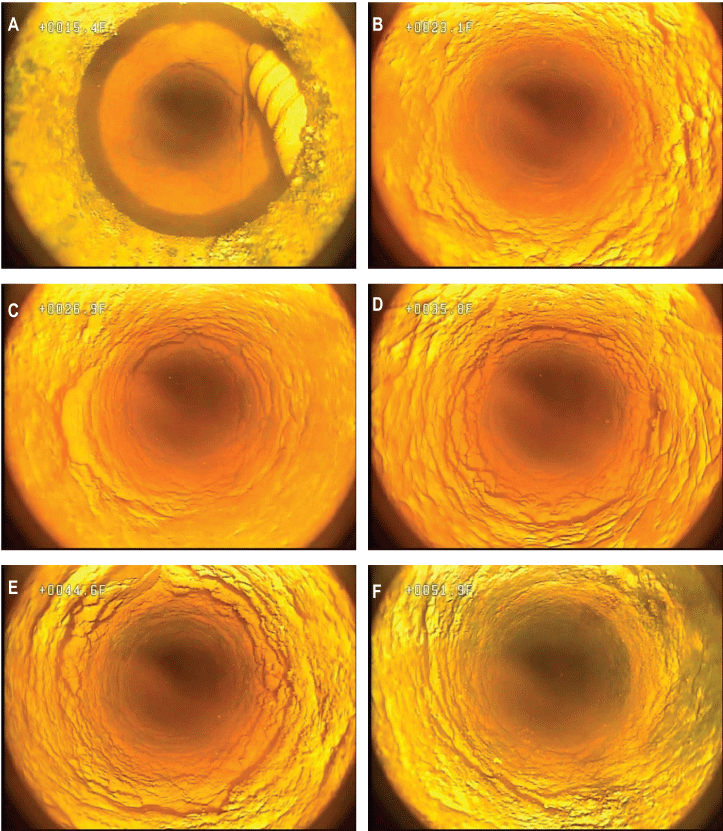
The borehole video log collected by the USGS on April 1, 2016, when depth to water was 22.8 ft bls, showed numerous and extensive fractures in the interval from the casing’s bottom at 19 ft bls to about 62 ft bls and a few fractures below 62 ft bls. Images of selected fractures and features from the 2016 video log of well MG 2220 are shown in figures 22 and 23. Probable water-bearing large high-angle fractures and openings appear with planar features from about 25 to 42 ft bls and with less planar features from about 42 to 58 ft bls. Other possible water-bearing fractures and openings are at about 68.5–70 ft bls and 76.8–78 ft bls. In the interval from about 31–35 ft bls, the texture and form of the borehole indicates possible faulting in the bedrock, with apparent crushed rock near 31.6 ft bls and twisted texture in the rock near 33.5 ft bls (fig. 22).
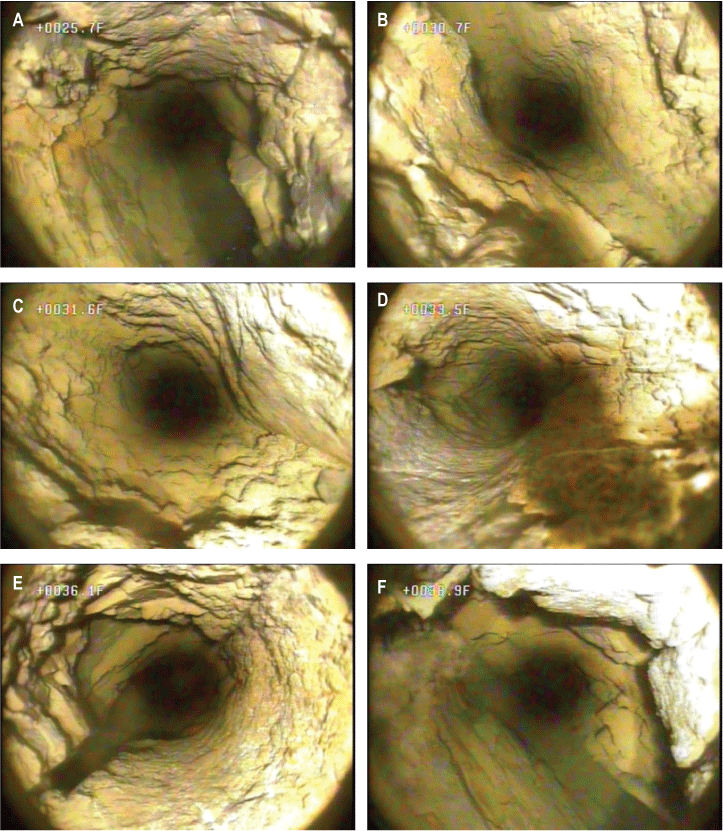
Still images from a 2012 borehole video log of well MG 2220 at A, 25.7 feet below land surface (ft bls) showing high-angle opening with planar features, B, 30.7 ft bls showing high-angle opening with planar features, C, 31.6 ft bls showing high-angle opening with planar features and apparent crushed rock, D, 33.5 ft bls showing high-angle openings with apparent twisted rock, E, 36.1 ft bls showing high-angle fracture crossing borehole, and F, 38.9 ft bls showing high-angle opening with planar features. Video log collected by U.S. Geological Survey near North Penn Area 1 Superfund Site, Souderton, Montgomery County, Pennsylvania, April 1, 2016.
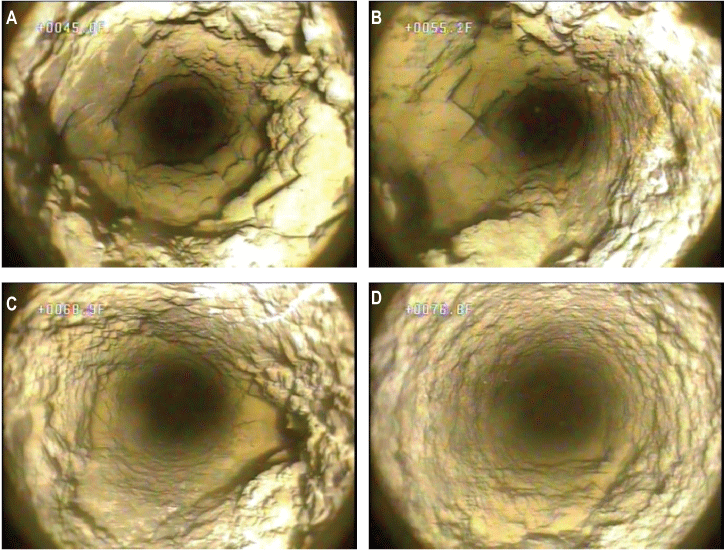
Still images from a 2012 borehole video log of well MG 2220 at A, 45.1 feet below land surface (ft bls) showing large opening with rough borehole walls, B, 55.3 ft bls showing large opening with rough borehole wall, C, 68.9 ft bls showing opening in rough borehole wall, and D, 76.8 ft bls showing relatively small high-angle opening in rough borehole wall. Video log collected by U.S. Geological Survey near North Penn Area 1 Superfund Site, Souderton, Montgomery County, Pennsylvania, April 1, 2016.
Field Observations and Geophysical-Log Data in Relation to Structure and Fracture Orientation
Although the mapped regional geology shows that beds generally strike northeast and dip to the northwest in the immediate vicinity of Souderton (Greenman, 1955; Longwill and Wood, 1965), field observations of bedding orientation in outcrops near the NP1 Site and review of geophysical log data were used to assess local geologic structure. The review of geophysical log data included evaluation of potential for lithologic correlation using natural gamma and electrical logs and evaluation of borehole deviation logs. The ATV logs were used to describe the general orientation of fractures.
Bedding Orientation of Outcrops
Field observations indicate that the local orientation of bedding at outcrops in the study area differs from the regional trend of N60°E and that the structure of rocks at and near the NP1 Site is more complex than a simple north-west dipping homocline. Measurements of strike and dip were made by the USGS in 2018 on rock outcrops (fig. 24) in the unnamed tributary of Skippack Creek between Wile Avenue and West Street at approximate locations shown on figure 2. The average strike of beds was approximately due north (measurements ranged from N6°W to N13°E) and the average dip was about 20 degrees west. Local differences in bedding orientation may be related to faulting. A zone of fractured rock indicating possible faulting that separates outcrop with apparent differences in bedding orientation can be seen in figure 24A. Typically, the beds are cut by numerous high-angle fractures oriented orthogonally such as those shown in figure 24B, with strikes of about N30°W and N60°E.
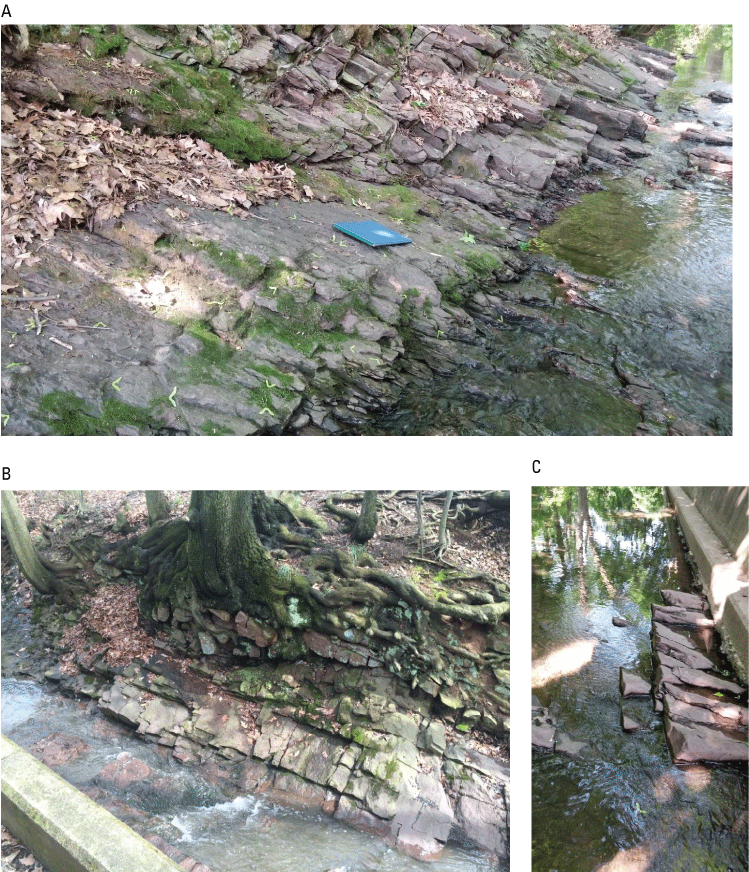
Photographs of bedrock outcrops along stream reach between Wile Avenue and West Street, Souderton, Pennsylvania, that show A, dipping beds striking obliquely to stream channel, with area of fractured rock separating beds that have apparent different bedding orientations, B, dipping beds striking obliquely to stream channel, with fractures parallel and orthogonal to beds and major joint set approximately parallel to stream channel, and C, beds dipping northwest with orientation of bedding and a joint set approximately parallel to stream channel. Photographs taken by U.S. Geological Survey on April 7, 2016, looking southeast (fig. 24B), and May 25, 2018, looking northeast and northwest, respectively (figs. 24A and 24C).
Additionally, one measurement shown on the geologic map of Longwill and Wood (1965, pl. 1) in the southern part of the NP1 Site gives a strike about N20°W and dip of 60 degrees to the southwest, much different than that of the regional homocline. Differences between local and regional structure may be attributed to nearby faulting, as indicated by mapped faults and changes in bedding orientation associated with the Chalfont Fault, a major regional fault trending east-west, and related minor faults located about 4,000–5,000 ft south of the NP1 Site. The geologic map of Longwill and Wood (1965, pl. 1) shows that displacement along the Chalfont Fault altered the strike and dip of geologic units north of the fault as well as an isolated northwest trending gray-shale unit about 5,000 ft southwest of the Site without mapped faulting but likely striking to the northwest because of faulting (fig. 1.1A). Alternate, unpublished mapping from Joseph Smoot (U.S. Geological Survey, written commun., 2005) shows this unit southwest of the NP1 Site is part of a continuous gray-shale unit with structure apparently deformed in the vicinity of the Chalfont Fault (fig. 1.1B)
Borehole Deviation
Borehole deviation logs may provide some information about orientation of geologic structure. Brown and others (1981) note that field observations frequently indicate that gradual borehole deviation in one direction is associated with anisotropy of the rock properties (such as bedding or schistosity) and abrupt changes in deviation direction are associated with sudden changes in rock properties (such as faults, unconformities, or large differences in lithology). In some cases where bedding dips less than 45 degrees, it has been reported that the direction of borehole deviation tends to migrate up dip (normal to bedding planes); however, where dips of bedding are steeper, the direction of borehole deviation tends to migrate down dip (McLamore, 1971; Wilson, 1976; Brown and others, 1981). Near the NP1 Site, the deviation logs for numerous wells completed in the Brunswick and Lockatong Formations about 6 miles to the southeast of Souderton had a linear trend normal to bedding (Senior and others, 2008). Plots showing borehole deviation logs collected by USGS for seven wells as part of NP1 Site investigations are shown in figures 1.3–1.9.
The borehole deviation logs for three wells nearest the center of the NP1 Site (MG 668 [GKM], MG 2202 [S-2], and MG 2220) generally are linear or curvilinear and mostly trend to the northeast (figs. 25, 1.3, 1.6, and 1.9). However, the deviation log for well MG 2220 initially trends north from land surface to about 30 ft bls before changing directions (fig. 1.9), which may indicate the presence of faulting. Broken and apparently twisted rock possibly indicative of faulting were apparent on the borehole video logs for well MG 2220 at depths from about 31 to 34 ft bls (fig. 22). The deviation log for well MG 2201 (S-1) also has a linear section that trends to the northeast, but the deviation abruptly changes direction at about 35 ft bls to trend to the west and northwest (fig. 1.5). These four wells are near and straddle a stream reach that trends northeast-southwest with a strike of about N50°E. In contrast to these four wells, the borehole deviation logs for three wells southwest and farther from the center of the NP1 Site (MG 2203 [S-3], MG 2204 [D-3], and MG 679 [S-11]) are also linear and curvilinear, with some abrupt changes, that trend in different directions ranging from the northwest to the southeast (figs. 25, 1.3, 1.7, and 1.8); these three wells are near, and straddle, the stream reach that trends north-northeast-south-southwest, with a strike of about N20°E.
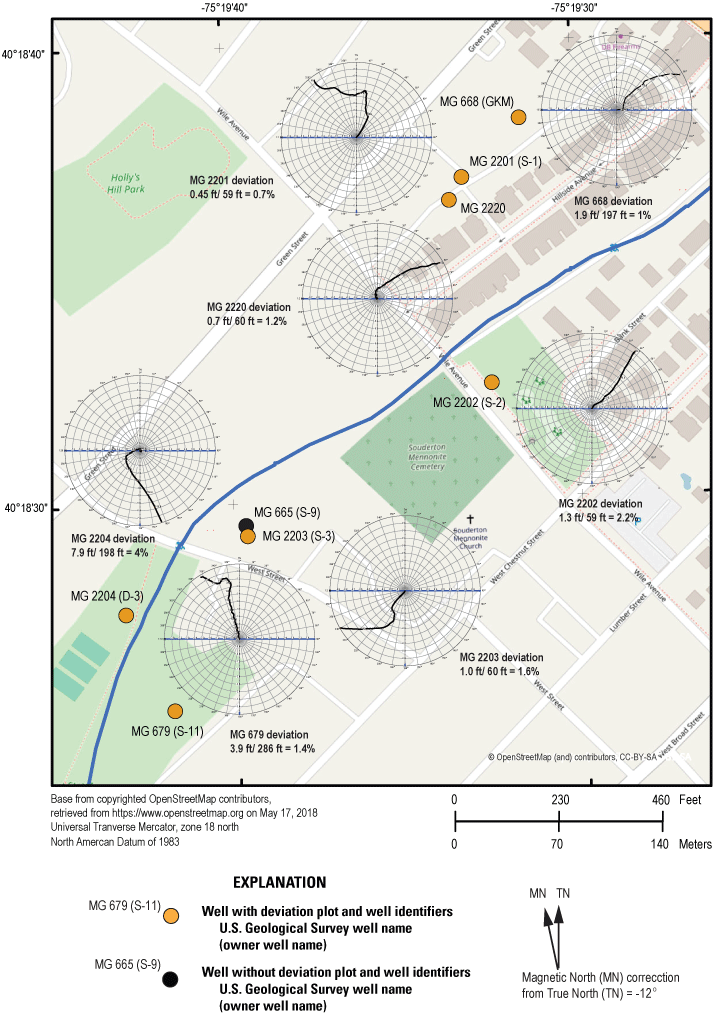
Map showing borehole deviation logs for seven wells and one well for which no deviation log was collected, North Penn Area 1 Superfund Site, Souderton, Montgomery County, Pennsylvania. Wells are identified by U.S. Geological Survey well name, with U.S. Environmental Protection Agency well names in parentheses (tables 1 and 3).
Possible interpretations of these deviation logs include probable presence of faulting, indicated by abrupt changes in direction of deviation, and general differences in deviation direction between wells nearest the center of the NP1 Site and wells to the southwest of the NP1 Site that likely are related to spatial differences in orientation of bedding or fractures.
Geophysical-Log Correlation
Gamma and single-point resistance logs were examined to determine differences in lithology that could be correlated among wells and possibly used to infer structure. The vertical and horizontal extents of lithologic data that can be used for correlation are limited because there are relatively few wells at the NP1 Site, and four of the eight wells with logs are relatively shallow (49–82 ft bls in depth). A few distinctive natural gamma features but no distinctive single-point resistance features were present on available logs for eight wells at the NP1 Site. The lack of distinctive single-point resistance features in the logs indicates small differences in lithology (sand or shale component) in intervals of rock intercepted by the wells. The natural gamma logs for all eight wells are shown on a section line discussed in the section “Conceptual Model of the Groundwater System.”
Elevated natural gamma marker beds were present on geophysical logs for the 300-ft-deep well MG 665 (S-9) collected in 1992 (figs. 6 and 1.2) but not in logs for any of the other seven nearby wells at the NP1 Site. Elevated natural gamma activity from radioactive minerals in relatively thin (commonly less than 5 ft in thickness) black shale beds in the Lockatong Formation and some sections of the Brunswick Formation have been used as markers for correlating geologic units at other sites in Montgomery and Bucks Counties (Barton and others, 2003; Senior and others, 2008). The lack of elevated natural gamma marker beds that could be used for correlation in most of the wells at the NP1 Site, other than well MG 665 (S-9), may be related to differences in well depth, disruptions in geologic structure, or lateral depositional discontinuities, such that these marker beds are not intercepted in these other wells.
Other distinctive lithologic features that could be potentially correlated include the 5- to 10-ft-thick intervals of slightly elevated natural gamma activity associated with grayish-green beds near depths of 135 and 155 ft bls in well MG 2204 (D-3) (figs. 18 and 20). However, like the thin zones of elevated natural gamma activity in well MG 665 (S-9), these features do not appear on logs for nearby wells (MG 2203 [S-3], MG 679 [S-11], and MG 2204 [D-4]) in the southwest part of the study area (fig. 2), thus providing additional evidence for lack of lateral continuity in bedding that may indicate local disruption in structure, such as faulting or indicate local-scale variability in depositional environment that results in some beds pinching out.
In the three closely spaced wells in the northeast part of the study area, one to two zones with slightly elevated natural gamma activity are present on logs at depths of about 18–52 ft bls in well MG 668 (GKM), 48 ft bls in well MG 2201 (S-1), and 18–52 ft bls well MG 2220 (figs. 9, 12, and 21). The elevated gamma units are not present in all logs, possibly because of lateral changes in bed thickness or structural displacement (faulting). If these zones can be correlated (fig. 26), the strike of the dipping beds would be consistent with the northeast trend of well distribution parallel to topography and the stream (fig. 2), and any displacement along a possible fault at about 33 ft bls in well MG 2220 as shown by images of crushed and twisted rock in the borehole-video log (fig. 22) would be minor.
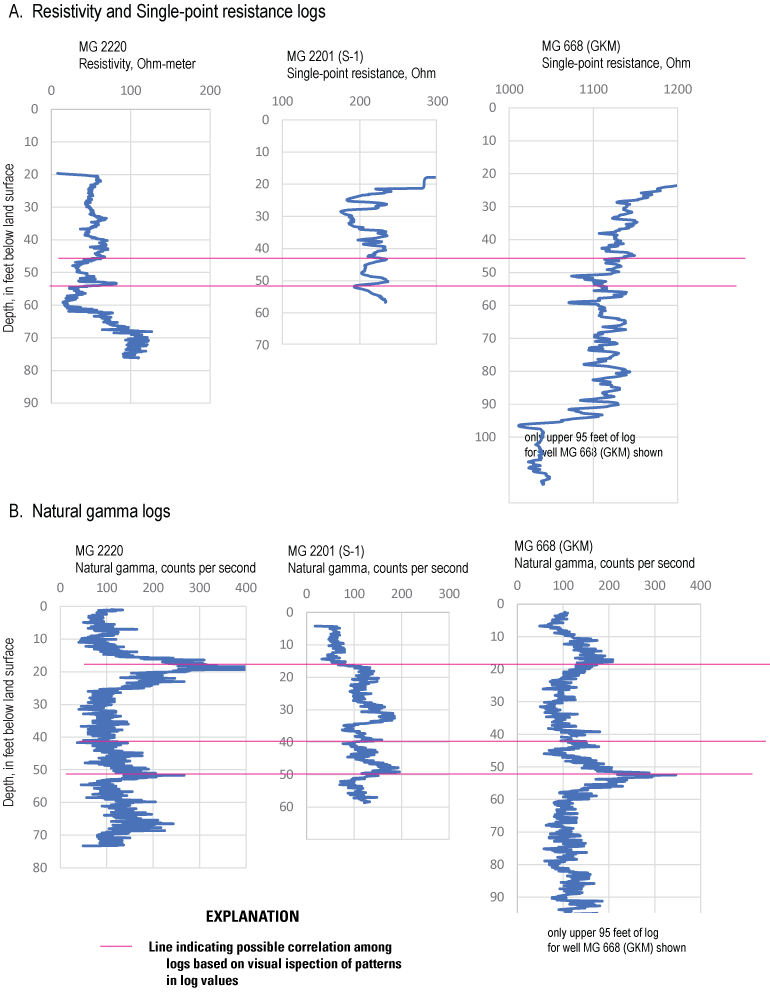
Possible correlations among A, electric logs and B, natural gamma logs from wells MG 2220 and MG 2201 (S-1), and from the upper 95 feet of well MG 668 (Granite Knitting Mill) at North Penn Area 1, Souderton, Montgomery County, Pennsylvania. Wells are identified by U.S. Geological Survey well name, with U.S. Environmental Protection Agency well names in parentheses (table 1).
Fracture Orientation
The optical-televiewer and ATV logs provided data on the depth and orientation of fractures in each monitoring well. All wells encountered numerous fractures. The most notable characteristic was the large frequency of high-angle fractures, because it is more likely for a vertical well to penetrate a low-angle bedding-plane fracture than a high-angle fracture. The frequent occurrence of high-angle fractures penetrated by wells is consistent with the observation of numerous high-angle fractures at outcrops in the unnamed tributary of Skippack Creek between Wile Avenue and West Street.
Fractures were most notable in well MG 2220, which was drilled through a zone that was extensively broken with high-angle fractures, possibly related to faulting. The 82-ft-deep well encountered the highly fractured zone from 25 to 60 ft bls, and still images from the borehole video of well MG 2220 show broken rock and high-angle planar fractures in that interval (fig. 22). The orientation of the fractures above 60 ft bls in well MG 2220 is difficult to discern from the ATV log because of the density of the fracture openings, but two high-angle fractures below 60 ft bls appear to dip to the southeast (figs. 21 and 23). Depending on its extent, this fracture zone or fault zone could provide an avenue for contaminant movement.
High-angle fractures also were predominant in logs of wells MG 2201 (S-1) and MG 2204 (D-3) and present, but not predominant, in logs of well MG 679 (S-11), MG 668 (GKM), MG 2202 (S-2), and MG 2203 (S-3). Where discernable from ATV logs, the high-angle fractures were oriented mostly about north-south in wells MG 2201 (S-1), MG 2202 (S-2), and MG 2203 (S-3). In contrast to those wells, the high-angle fractures appear to dip to the southwest in well MG 679 (S-11) and below 120 ft bls in well MG 2204 (D-3) and to southeast above 120 ft bls in well MG 2204 (D-3). The difference in fracture orientation above and below 120 ft bls in well MG 2204 (D-3) may be related to the presence of a small fault, as evidenced by an abrupt change in direction at about 95 ft bls in the borehole deviation log (fig. 1.8). Large, fractured openings were evident from about 110–113 ft bls as shown by the caliper, ATV, and borehole video logs (figs. 18 and 19). From review of video logs of well MG 668 (GKM), the high-angle fractures at same or similar depths are oriented in different directions, complicating interpretation of the ATV logs.
The low-angle fractures shown in ATV image logs, interpreted as bedding-plane partings, were predominant in logs of wells MG 668 (GKM), MG 2202 (S-2), and MG 2203 (S-3). The low-angle fractures do not show a consistent orientation.
Water Levels
Groundwater levels were monitored by the USGS beginning in 2014. Pressure transducers were installed and set to record levels every 15 minutes in wells MG 2201 (S-1), MG 2202 (S-2), MG 2203 (S-3), MG 2204 (D-3), MG 679 (S-11), and MG 668 (GKM). Levels were monitored in well MG 2220 after it was drilled in 2016. The periods of data collection during 2014–18 differed among the wells because of various factors including equipment malfunction and changes in scope of project (fig. 27A). Hydrologic conditions during much of 2014–18 were near long-term median values as indicated by water levels in a nearby USGS observation well MG 917, located about 2.2 miles southeast of Souderton (figs. 4 and 27B). Although water levels in observation well MG 917 were similar to the long-term (August 1997–September 2023) median daily mean or normal values for most of the period 2014–18, the measured water levels in well MG 917 indicate that the fall of 2016 was dryer than normal, and the latter half of 2018 was wetter than normal (fig. 27B).
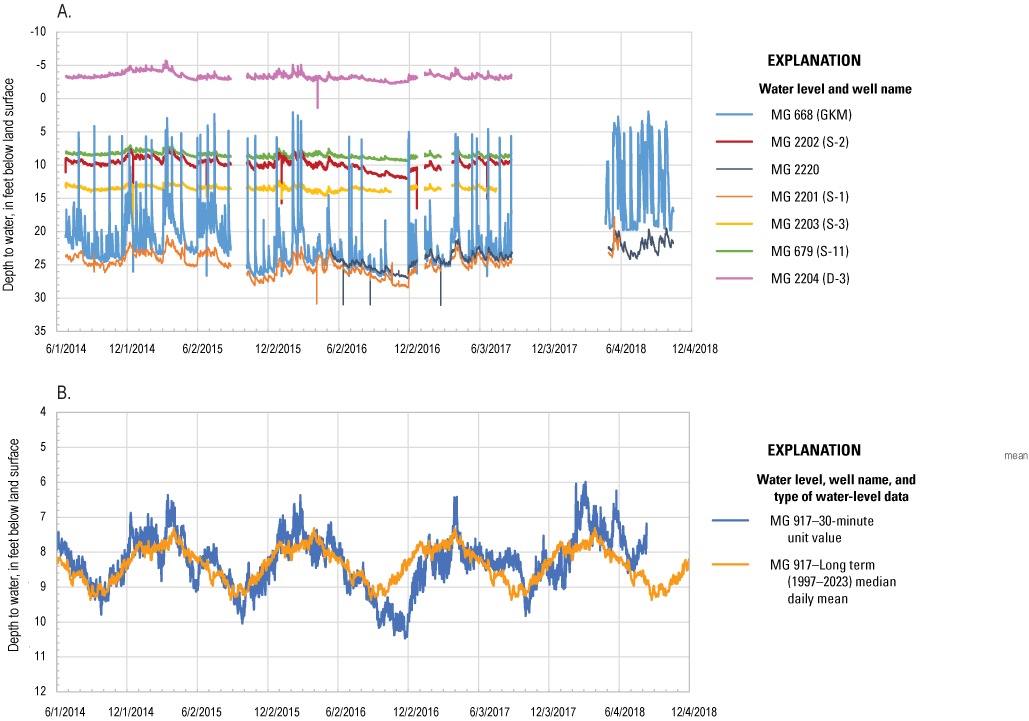
Plots showing the depth to water during 2014–18 in A, seven monitoring wells near the North Penn Area 1 Superfund Site (NP1 Site), Souderton, and B, U.S. Geological Survey observation well MG 917 with long-term (August 1997–September 2023) median daily mean values, Montgomery County, Pennsylvania. The depth to water in the seven monitoring wells was recorded at 15-minute intervals, and that of MG 917 was recorded at 30-minute intervals. Wells at NP1 Site are identified by U.S. Geological Survey well name, with U.S. Environmental Protection Agency well names in parentheses (table 1). Short-term transient increases in depth to water in wells MG 2201(S-1) and MG-2220 during 2016 may be related to transient increases in pumping in MG 2201 (S-1).
Water-Level Fluctuations
The timing and magnitude of water-level fluctuations were similar among monitoring wells, except at well MG 668 (GKM), which frequently exhibited large, rapid rises following storms (fig. 27A). Seasonal changes in water levels were observed in all wells. The levels for all wells except well MG 668 (GKM) fluctuated less than about 4 ft during the period of study. Annual fluctuations ranged from about 1 to 2 ft in wells MG 2203 (S-3), MG 2204 (D-3), and MG 679 (S-11), which are in the southwest part of the NP1 Site, and from about 3 to 4 ft in wells MG 2201 (S-1), MG 2202 (S-2), and MG 2220, which are in the northeast part of the NP1 Site (figs. 2 and 27A). Transient water-level fluctuations of up to about 20 ft in wells MG 668 (GKM) were superimposed on seasonal water-level fluctuations that were similar to those in well MG 2220.
Water levels are shown as depth below land surface (fig. 28A) and altitude referenced to the North American Vertical Datum of 1988 (NAVD 88) (fig. 28B) for the period March through September 2017. Water-level altitudes represent the composite value of hydraulic heads from discrete water-yielding fractures throughout each open hole. Among wells MG 2203 (S-3), MG 2204 (D-3), and MG 679 (S-11) in the southwest part of the study area, the water-level altitudes during the 2017 monitoring period were equal or very similar despite differences in depths to water below land surface (figs. 28A). The water-level altitudes in these wells were also about 15–20 ft lower than those of the source area in the northeast part of the NP1 Site. The water-level altitudes were highest Site-wide in wells MG 668 (GKM) and MG 2202 (S-2) in 2017 (fig. 28B). Both wells generally had similar water-level altitude despite differences in depths to water below land surface, except for transient storm-related rises in well MG 668 (GKM). The water-level altitudes were nearly equal in the closely spaced (about 56 ft apart) well MG 2220 and the extraction well MG 2201 (S-1), which was being pumped almost continuously during the monitoring period. The accuracies of the water-level altitudes were calculated using land-surface altitudes determined by lidar (table 1) and estimated to within 1 ft.
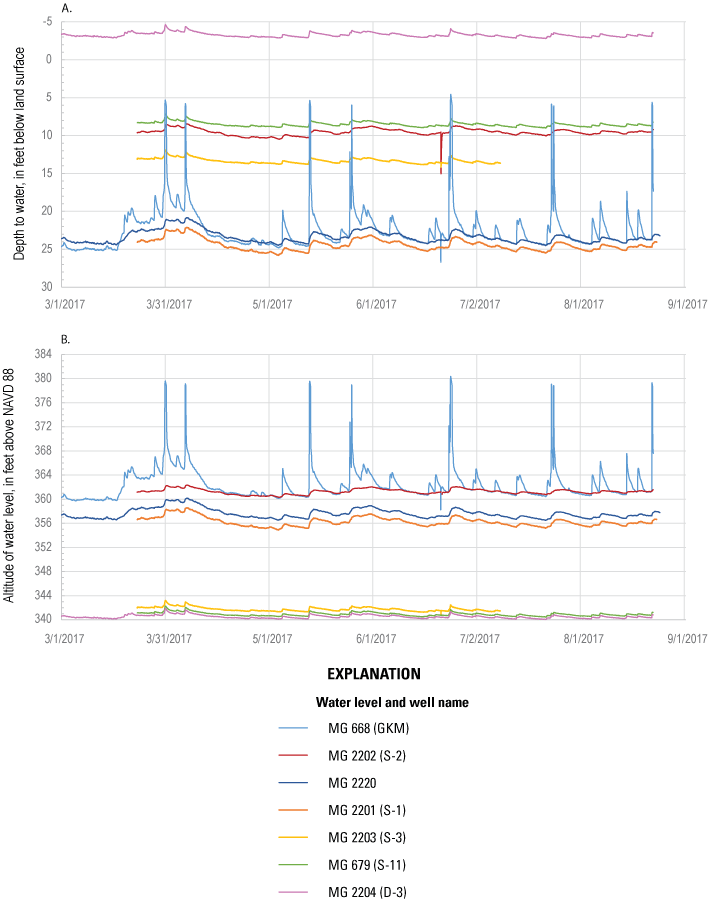
Water levels in seven monitoring wells at the North Penn Area 1 Superfund Site, Souderton, Montgomery County, Pennsylvania, from March to September 2017 shown as A, depth to water below land surface and B, altitude of water level referenced to the North American Vertical Datum of 1988 (NAVD 88). The water-level altitudes in well MG 679 (S-11) are nearly the same as those in well MG 2203 (S-3) and plot just above the pink line showing levels for well MG 2203 (S-3) on the graph. Water levels were recorded at 15-minute intervals (U.S. Geological Survey, 2024b). Wells are identified by U.S. Geological Survey well name, with well names used by U.S. Environmental Protection Agency in parentheses (table 1).
Water levels in well MG 2204 (D-3) remained above land surface for the entire 2017 monitoring period, ranging from 2.8 to 4.7 feet above land surface (figs. 27A and 28A). Well MG 2204 (D-3) is an artesian well and overflows the casing if unsealed, but it has a cap with an expandable seal that could be temporarily removed to allow installation of a transducer to measure water pressures for this study. Water pressures measured using a transducer inside the well casing are converted to equivalent hydraulic heads. The hydraulic head of this shut-in well does not represent the water-table altitude but is a composite value of hydraulic heads in numerous water-yielding fractures throughout the open hole from 15 to 198 ft bls. The well shows the overall upward vertical hydraulic gradient near the unnamed tributary to Skippack Creek at this location.
The rapid changes in water levels in well MG 668 (GKM) were apparently affected by water present in the well pit at the top of the surface casing. From March 23 through August 23, 2017, rapid water-level rises of 10–15 ft in a few hours were recorded at well MG 668 (GKM) followed by relatively rapid water-level declines (fig. 28A). Each rapid water-level rise in well MG 668 (GKM) peaked at about 5 ft bls during that period, which is similar to the approximate depth to the opening in the well casing below the concrete cover of the well pit that allows water in the pit to drain into the well. Thus, it is probable that the rapid water-level rises were mostly caused by surface water in the pit draining into well MG 668 (GKM). Some rapid water-level rises peaked at values as high as about 3 ft bls during the period from spring 2015 to spring 2016 (fig. 27A), indicating the presence of standing water in the pit above the top of the casing. Although well MG 668 (GKM) was reconstructed in October 2017 to prevent surface water in the pit from entering the well, water could still enter the pit itself after October 2017. A water-level measurement during a site visit on May 25, 2018, showed the depth of water in the well was 9.01 ft bls, and the water standing in the pit was 5.29 ft bls. This difference indicates that water in the pit no longer has direct entry to the well. However, a video log collected when water was standing in the pit on July 28, 2018, documented that pit water can slowly leak into the well after the pit fills up during storms (fig. 5D).
The large, rapid water-level rises recorded in well MG 668 (GKM) before reconstruction in October 2017 are not present in the hydrographs from the other wells that were monitored (fig. 27A and 28A). The lack of correlating sharp water-level increases in two wells (MG 2201 [S-1] and MG 2220) with good hydraulic connection to well MG 668 (GKM) is consistent with surface-water inflow as the cause of rapid water-level rises in well MG 668 (GKM) before reconstruction in October 2017. The hydraulic connections among these three wells are indicated by water-level response in well MG 668 (GKM) to pumping of MG 2201 (S-1) and MG 2220, as discussed in the section “Hydraulic Connections.” After reconstruction of well MG 668 (GKM) in October 2017, the water-level response to precipitation changed in magnitude and pattern (fig. 29) from the period prior to reconstruction (figs. 27 and 28). As discussed in section “Reconstruction of Well MG 668 (GKM),” water can leak into the reconstructed well MG 688 (GKM) through the joint between existing and extended casing. The observed water-level record for 2018 shows that water levels in well MG 688 (GKM) can rise to nearly land surface and seem to fall slowly (fig. 29A), indicating infiltration of surface-water into the well and low transmissivity of fractures in the open interval of the well below the casing’s bottom after grouting (9.4–35.4 ft bls); the difference in pre- and post-reconstruction water-level response to precipitation was caused by grouting up the deeper, more transmissive fractures in well MG 688 (GKM). Although the record is affected by several periods when water levels declined below the transducer at about 19.7 ft bls in 2018 (fig. 29A), water-level altitudes in well MG 668 (GKM) are generally higher in 2018 after reconstruction (fig 29B) than before reconstruction in October 2017 (fig. 28B).
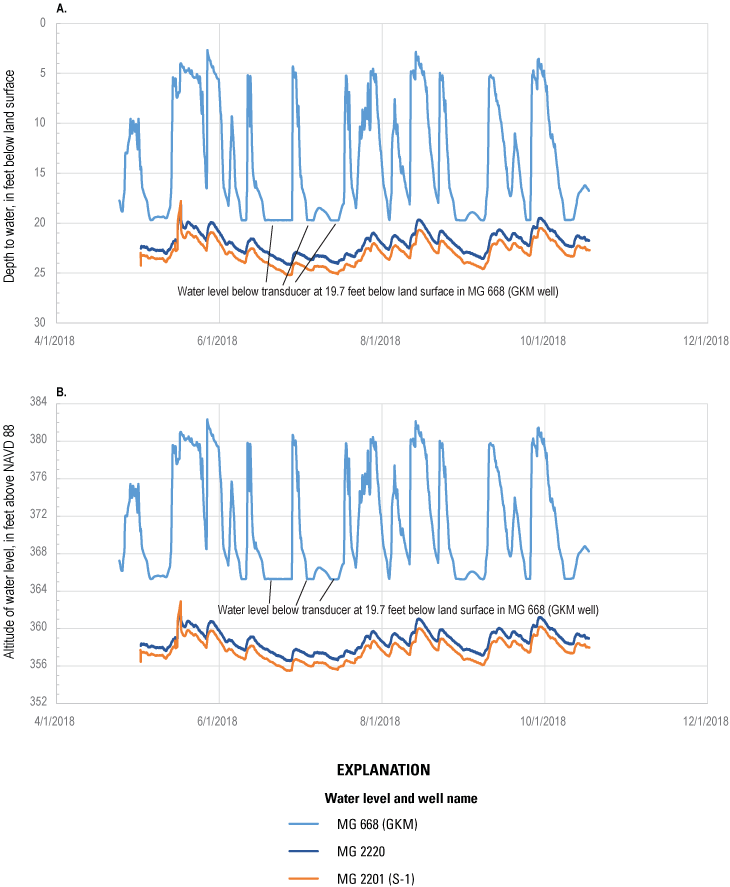
Water levels in well MG 668 (Granite Knitting Mill [GKM]) and two other monitoring wells (MG 2201 [S-1] and MG 2220) during 2018 shown as A, depth to water below land surface and B, water-level altitude referenced to the North American Vertical Datum of 1988 (NAVD 88), North Penn Area 1 Superfund Site, Souderton, Montgomery County, Pennsylvania. Water levels in well MG 668 (GKM) rise closer to land surface and remain elevated longer in response to precipitation and generally are higher in altitude in 2018 after its reconstruction than before its reconstruction in 2017 (figs. 27 and 28). Water levels were recorded at 15-minute intervals. Wells are identified by U.S. Geological Survey well name, with well names used by U.S. Environmental Protection Agency in parentheses (table 1). Short-term transient increases in depth to water in wells MG 2202 (S-2) during 2017 may be related to short-term pumping in the well.
Hydraulic Connections
Continuous monitoring of water levels was used to identify hydraulic connections among the wells. Hydraulic connections among wells near the source area were indicated by water-level responses (declines) to pumping from wells MG 2201 (S-1) and MG 2220. The increase of the pumping rate in well MG 2201 (S-1) on April 19, 2016, caused water levels to decline in wells MG 2201 (S-1) and MG 668 (GKM), which is 183 ft to the northeast of well MG 2201 (S-1) (figs. 2 and 30A). The water-level response in the well drilled on April 6, 2016 (MG 2220), to an increased pumping rate in well MG 2201 (S-1) on April 19, 2016, is not known because no water-level data were collected in well MG 2220 on that date. Pumping of well MG 2220 at a rate of about 1 gal/min during flow-meter logging on August 22, 2016, caused drawdown in wells MG 2201 (S-1) and MG 668 (GKM) (fig. 30B). No apparent response was observed in the other wells with water-level monitoring that were farther away from well MG 2220 and the source area. Pumping of well MG 2220 at a rate of about 4.4 gal/min as part of purging prior to sampling on May 2, 2018, caused a drawdown of 1.7 ft in well MG 2220 and 1.1 ft in well MG 2201 (S-1), but no water-level response was observed in reconstructed well MG 668 (GKM) as shown by discrete manual measurements of water levels in well MG 2220 and continuous water-level data for wells MG 2201 (S-1) and MG 668 (GKM) (fig. 30C). These data indicate that the reconstruction of well MG 668 (GKM) in 2017 likely closed off the hydraulic connection between wells MG 2220 and MG 668 (GKM).
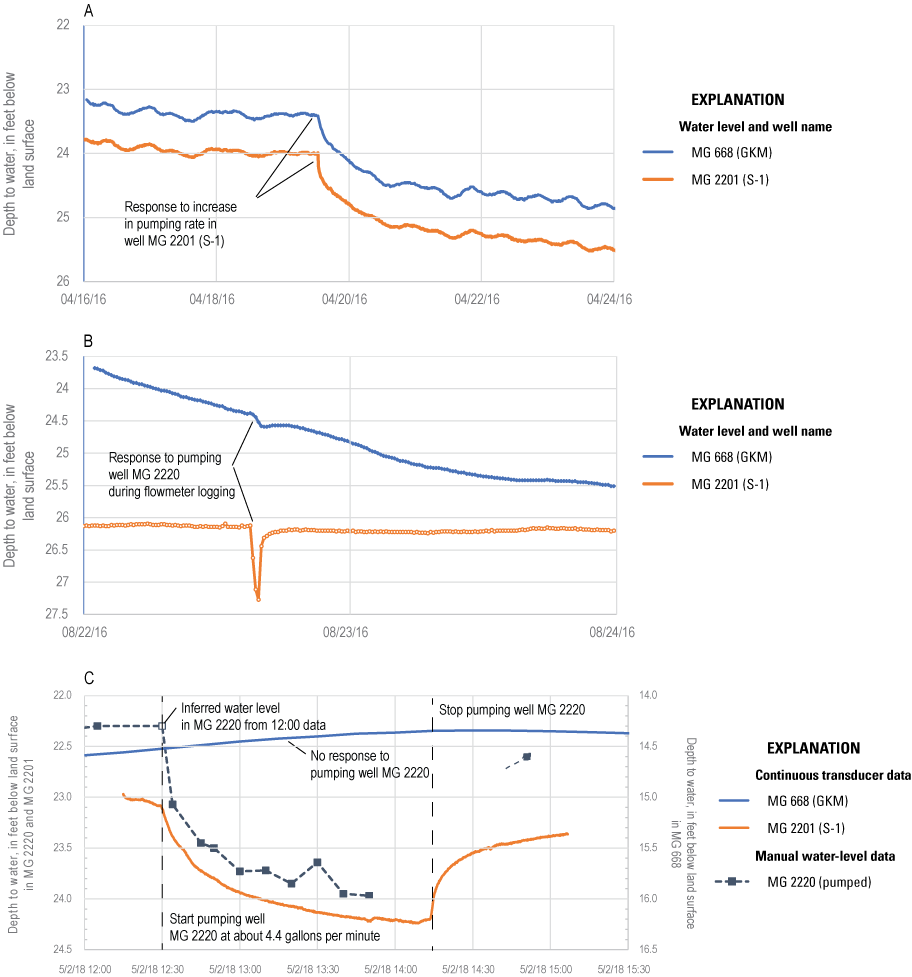
Plots showing water levels in wells MG 668 (Granite Knitting Mill) and MG 2201 (S-1) responding to A, pumping from well MG 2201 (S-1) in April 2016, B, pumping from well MG 2220 on August 22, 2016, and C, pumping from well MG 2220 on May 2, 2018, North Penn Area 1 Superfund Site, Souderton, Montgomery County, Pennsylvania. MG 2220 was pumped at a rate of 4.4 gallons per minute. Wells are identified by U.S. Geological Survey well name, with well names used by U.S. Environmental Protection Agency in parentheses (table 1).
Hydraulic connections were also indicated by water-level responses (rises) to pumping shutdowns. The temporary cessation of pumping in MG 2201 (S-1) on October 16 and 18, 2016, for 45 and 165 minutes, respectively, caused water levels to rise in wells MG 668 (GKM) and MG 2220 (fig. 31A). When extraction well MG 2201 (S-1) was shut down May 15–16, 2018, the water level quickly rose about 5 ft in well MG 2201 (S-1) and 4 ft in well MG 2220 (fig. 31B). The rapid response and similar magnitude of rise indicates a strong hydraulic connection between the two wells. However, in contrast to effects of pumping in 2016, the May 2018 shutdown of extraction well MG 2201 (S-1) did not affect water levels in the reconstructed well MG 668 (GKM), which had been backfilled to a depth of 34.4 ft bls in October 2017. Prior to reconstruction, when well MG 668 (GKM) was open to at least 189 ft, changes in pumping rate at the 59-ft-deep well MG 2201 (S-1) affected the water level of well MG 668 (GKM) (fig. 30A). Thus, it appears that the well MG 668 (GKM) reconstruction probably closed off the hydraulic connection between those wells; the hydraulic connections(s) between the two wells likely through fractures in the interval from 35 to 60 ft bls in well MG 668 (GKM) and through the fracture near 51–55 ft bls in well MG 2201 (S-1).
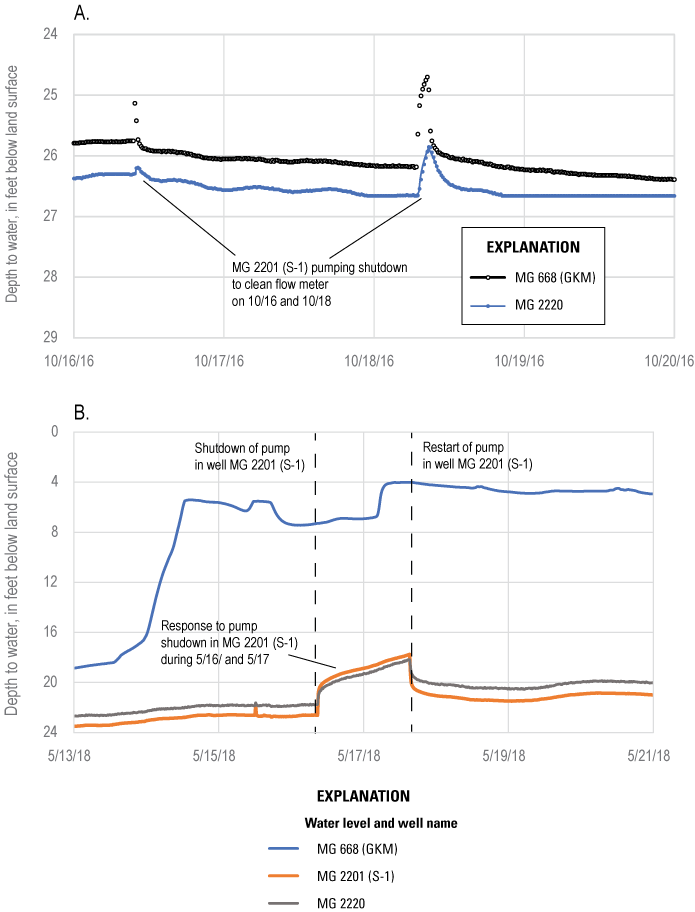
Plots showing water levels in wells MG 668 (Granite Knitting Mill [GKM]) and MG 2220 responding to a shutdown of pumping from well MG 2201 (S-1) in A, October 16 and 18, 2016, and B, May 16–17, 2018, North Penn Area 1 Superfund Site, Souderton, Montgomery County, Pennsylvania. Wells are identified by U.S. Geological Survey well name, with well names used by U.S. Environmental Protection Agency in parentheses (table 1).
Historical water-level data also have documented hydraulic connections among wells. Drawdown in wells during pumping tests or during operation of production wells at or near the NP1 Site has been noted in the past. Observations on these hydraulic connections are shown in figure 32 and summarized below:
-
• MG 665 (S-9) and MG 679 (S-11).—Pumping of well MG 665 (S-9) at 150 gal/min for 69 hours in June 1961 caused about 36 ft of drawdown in well MG 679 (S-11). The large drawdown and rapid response soon after pumping began indicates that the wells are probably open to the same water-bearing strata (Longwill and Wood, 1965).
-
• MG 668 (GKM) and MG 665 (S-9).—Pumping of well MG 668 (GKM) at rates ranging from 13 to 16 gal/min for 3 days caused about 82 ft of drawdown in well MG 668 (GKM) and 0.8 ft of drawdown in well MG 665 (S-9) (CH2M-Hill, Inc., 1993a, p. 2–14).
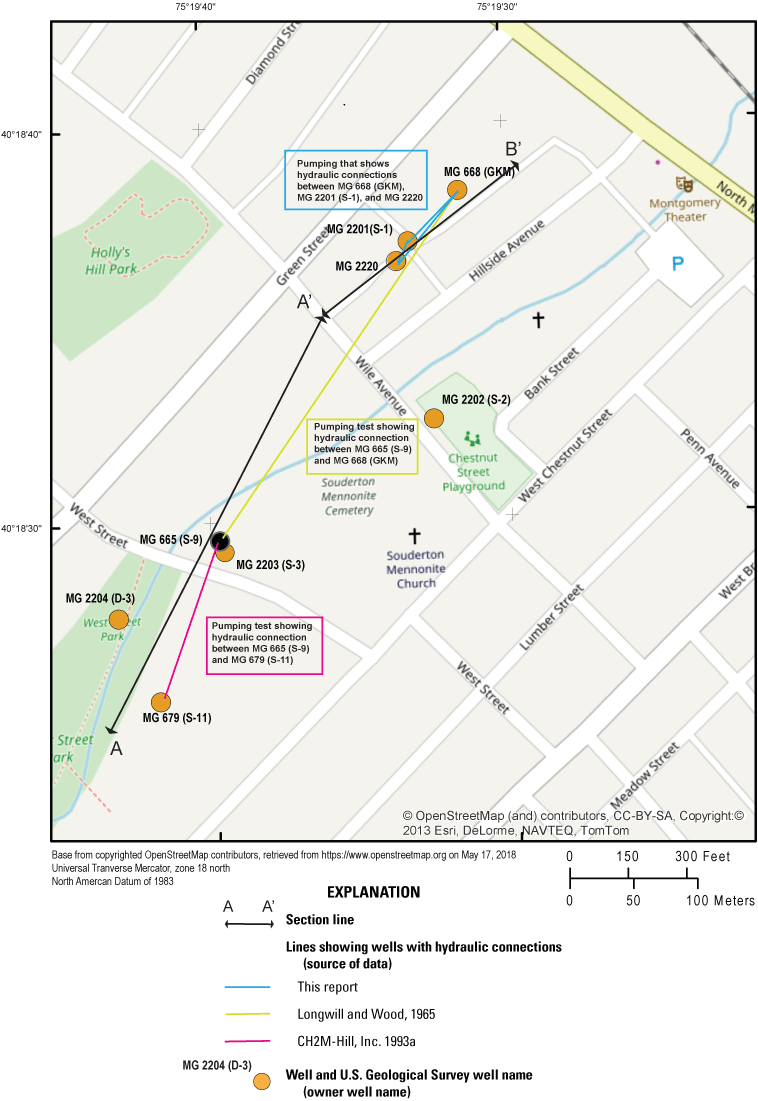
Map showing hydraulic connections among wells (table 1) indicated by observation well water-level responses to pumping from another well and section lines at and near North Penn Area 1 Superfund Site, Souderton, Montgomery County, Pennsylvania. Pumping response data are presented in this report for wells MG 668, MG 2201, and MG 2220, or are from Longwill and Wood (1965) for wells MG 668 (GKM) and MG 679 (S-11), and CH2M-Hill, Inc. (1993a) for wells MG 668 (GKM) and MG 665 (S-9).
Water-Level Contours and Gradients
Although there are not enough wells to provide water levels sufficient for reliable mapping of the water-table surface for the NP1 Site, preliminary potentiometric contours based on water-level altitudes in seven wells are presented on a map (fig. 32) to better represent recent (2018) conditions than the maps prepared during the RI (CH2M-Hill, Inc., 1993a, fig. 3-8) or as part of 2016–17 monitoring reports to PADEP (AECOM, 2016, fig. 3; 2017, fig. 2), which were also based on limited data. The available monitoring wells are aligned northeast-southwest along the stream, but additional well coverage would be needed to the southeast and northwest of existing wells. Additionally, water-levels in open holes with multiple water-bearing fractures represent composite hydraulic heads, such water-level data from the available wells, which range in depth as open holes from about 34 to 300 ft bls may be too limited to accurately define both horizonal and vertical groundwater gradients. Well depths range from about 34 to 60 ft bls for the five wells northeast of West Street and from about 208 to 300 ft bls for the two wells southwest of West Street (tables 1 and 2; figs. 2 and 33). Factors including topography, pumping, recharge, and permeability, and geologic structure can affect the distribution of horizontal and vertical gradients. Thus, additional monitoring wells at different depths and open to shorter sections of the aquifer may be needed for reliable potentiometric maps.
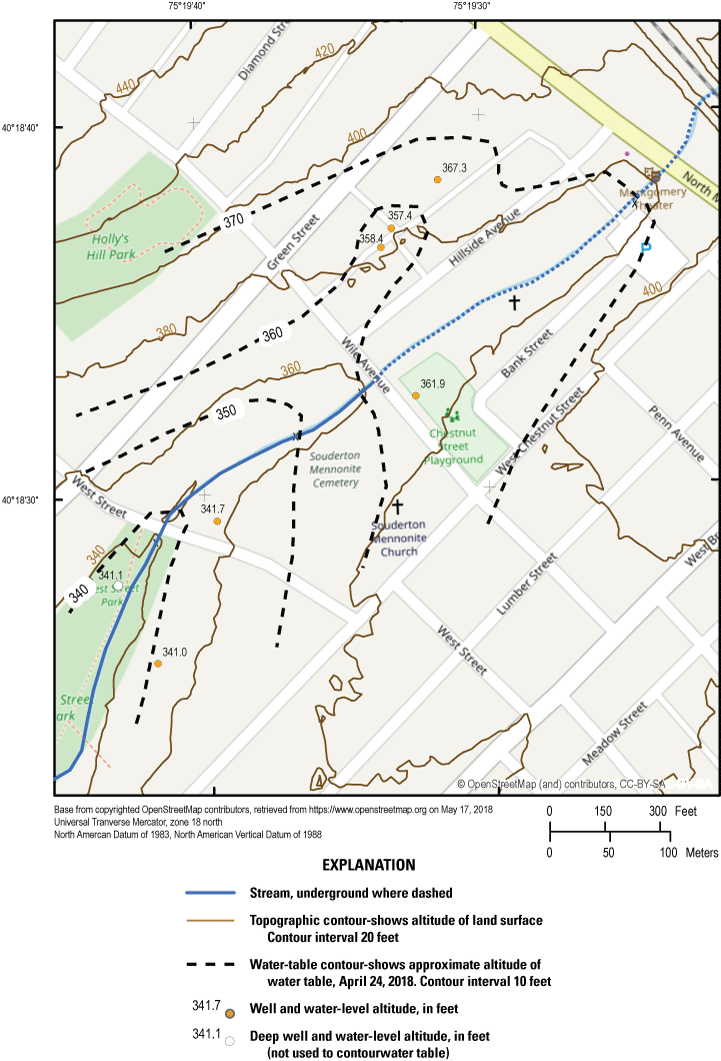
Approximate water-table altitude and water-level altitudes in seven wells, April 24, 2018, North Penn Area 1 Superfund Site, Souderton, Montgomery County, Pennsylvania. Discrete water-level data are from U.S. Geological Survey (2024b).
Assuming the stream is a sink (area of natural discharge) for shallow groundwater, an approximation of the water-table contours is configured for measurements made on April 24, 2018, as shown in figure 33. The map was drawn to show a horizontal hydraulic gradient toward the stream and the influence of pumping from extraction well MG 2201 (S-1) on the water-table configuration. Water-level altitudes in wells MG 2204 (D-3) and MG 679 (S-11) in the southwest part of the NP1 Site are composite head values for deep wells that probably are higher than the water table. The contours in figure 33 show one possible configuration of the water table. The configuration could be tested if additional data become available from new monitoring wells, especially if those are not aligned between the existing monitoring wells.
Vertical Head Gradients
Available data about the presence and extent of vertical gradients in the aquifer is provided through borehole flow measurements under ambient conditions, occurrence of flowing wells, and interpretation of geophysical logs. Measurements of vertical borehole flow under ambient conditions were made in only three wells: the 198-ft-deep well MG 668 (GKM); the 59-ft-deep well MG 2201 (S-1); and the 82-ft-deep well MG 2220. Small amounts (less than 0.05 gal/min) of upward flow, indicating upward vertical gradients, were measured at some depths in wells MG 668 (GKM) and MG 2201 (S-1) (figs. 9 and 12). Small amounts of downward flow (0.012–0.55 gal/min), indicating downward vertical gradients, were measured in well MG 2220 (fig. 21). Downward flow and gradients in well MG 2220 may be affected, and possibly induced or increased, by pumping in nearby well MG 2220 (S-1). Water levels were higher in well MG 668 (GKM) after it was reconstructed in October 2017 (figs. 27, 28, and 29), at which time the 198-ft-deep borehole was backfilled to 35 ft bls, indicating a potential downward vertical gradient from the shallowest to deeper water-bearing intervals. This apparent potential downward vertical gradient in well MG 668 (GKM) may be partly affected by pumping in nearby well MG 2201 (S-1), which results in lower heads in the local area near well MG 2201 (S-1); however, there seems to be little to no direct hydraulic connection between wells MG 2201 (S-1) and MG 668 (GKM) after reconstruction. To the southwest of these wells, the 308-ft-deep well MG 2204 (D-3) is a flowing well, with hydraulic head above the land surface. Well MG 2204 (D-3) has numerous water-bearing fractures throughout the borehole, but no data are available to determine hydraulic head for individual water-bearing zones. Nevertheless, the well’s nearly vertical temperature log, which indicates that almost no change in temperature with depth was observed, and the well’s status as a flowing well indicate upward vertical gradients are present between deep and shallow water-bearing zones.
Groundwater Withdrawals
Groundwater use for local water supply has changed through time, and changes in amounts and locations of withdrawals affect the rate and direction of groundwater flow, and hence the rate and direction of contaminant transport. Reported groundwater withdrawals near the NP1 Site were greater in the 1990s (U.S. Geological Survey, 1998) than in recent years (2020–22; figs. 34A and 34B; Pennsylvania Department of Environmental Protection, 2023). Most local groundwater use in the 1990s was nonconsumptive, and most withdrawn groundwater was collected in sewers, treated, and eventually discharged to streams. Decreased local groundwater withdrawals result in increased groundwater discharge to streams as base flow.
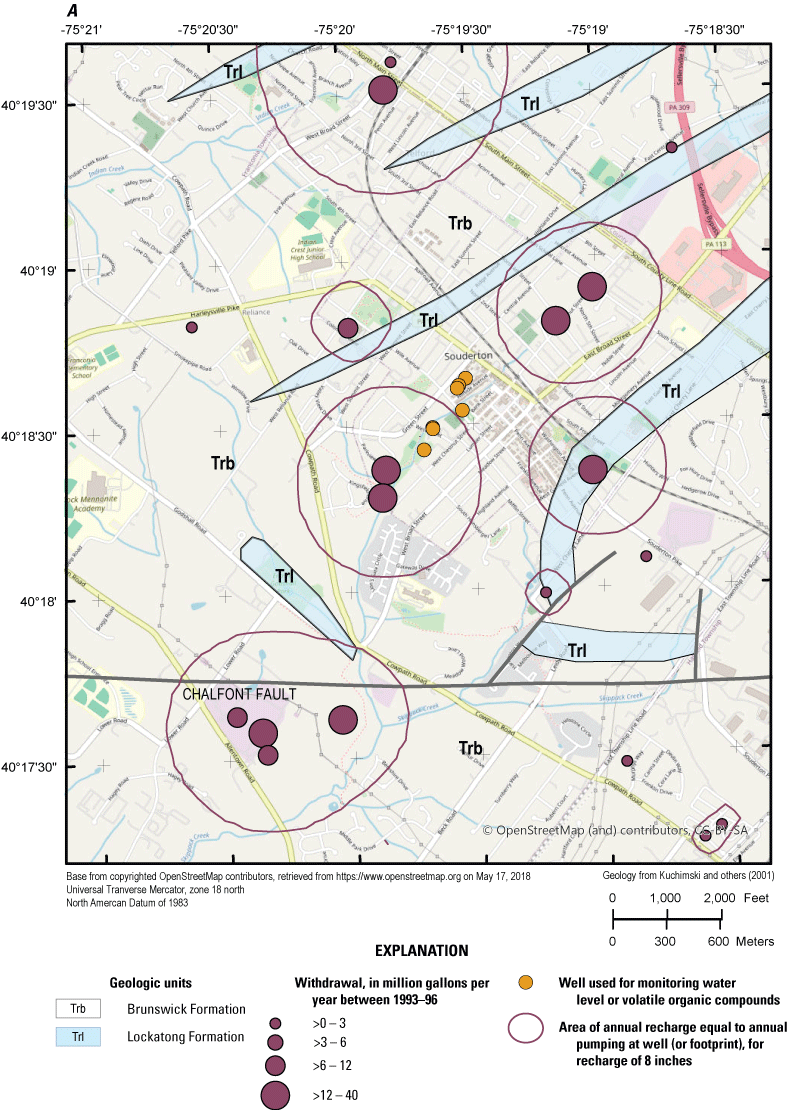
Maps showing reported groundwater withdrawals near the North Penn Area 1 Superfund Site, Souderton, Montgomery County, Pennsylvania, for conditions in A, 1993–96 and B, 2022 as well withdrawal footprints (Goode, 2016) calculated to show the area of recharge at a rate of 8 inches per year (footprint scale) needed to balance the rates of withdrawal. The well withdrawal footprints were calculated using software developed by Winston and Goode (2017). Withdrawal data from U.S. Geological Survey (1998), Delaware River Basin Commission (2023), and Pennsylvania Department of Environmental Protection (2023).
Large water-supply well withdrawals were reported in 1993 from four wells aligned along the unnamed tributary to Skippack Creek in the NP1 Site (U.S. Geological Survey, 1998), parallel to the strike of the regional geologic structure (fig. 34A). The locations and amounts of withdrawals are illustrated in figure 34 in two ways: as withdrawal magnitude categories, and as calculated well withdrawal footprints (Goode, 2016) for which the size of the footprint represents the area of groundwater recharge at a rate of 8 in/yr (footprint scale) needed to balance withdrawal rates from each well or group of wells. Observation wells in the NP1 Site, which had no substantial withdrawals, are shown as solid orange circles on the maps depicting water-use magnitude (figs. 34A and 34B). Footprints were computed using WellFootprint software (Winston and Goode, 2017). The footprints are not capture zones or contributing areas, which are the areas on the landscape from which recharge to groundwater flows to a well.
The footprint area depends on the footprint “scale,” in this case the recharge rate. The footprint for well MG 2201 (S-1) in 2022 (fig. 34B) was computed using a scale of 8 in/yr of recharge and is visualized as a circular outline centered on well. This footprint would be smaller for annual recharge greater than 8 in. and larger for annual recharge less than 8 in. Groundwater recharge is not known but estimates of average recharge for aquifers in the Newark Basin of Pennsylvania range from about 8 to 12 in/yr (Reese and Risser, 2010). Dividing the withdrawal rate from well MG 2201 (S-1) by 8 and 12 in/yr gives areas of recharge of 611,000 and 407,000 square feet, respectively.
The footprint outlines (fig. 34) do not define locations on the landscape contributing recharge to the wells (the capture zones) but instead show outlined areas around the wells calculated to provide the volumetric recharge rate matching the rate of withdrawal from the wells (Goode, 2016). The footprint for well MG 2201 (S-1) is spatially centered at the well location (fig. 34B). Other footprints for closely spaced wells are merged by WellFootprint (Winston and Goode, 2017) to show the combined area required to provide recharge balancing withdrawals from those wells.
In 2018, there were no groundwater withdrawals from public or industrial water supply wells reported within a 0.5-mile radius of the NP1 Site (Pennsylvania Department of Environmental Protection, 2018). In 2022, the nearest reported groundwater withdrawals from public or industrial water supply wells were about 0.6–1 mile from the NP1 Site (fig. 34B, Pennsylvania Department of Environmental Protection, 2023). Water-level hydrographs from monitoring wells at the NP1 Site in 2022 do not show short-term water-level fluctuations related to pumps in any nearby (within 0.6–1 mile) supply wells turning on and off.
During July 2016 through June 2017, well MG 2201 (S-1) extracted about 3.05 million gallons of water (an average rate of about 5.8 gal/min) from the shallow aquifer (AECOM, 2017). The purpose of the pumping was to limit the migration of the contaminated groundwater by “hydraulic containment.” The zone of hydraulic containment is the three-dimensional region contributing groundwater to a well (U.S. Environmental Protection Agency, 2008b). The ultimate source of water withdrawn from an extraction well is recharged at the water table (Franke and others, 1998, p. 2) or from groundwater storage, unless the well captures inflow from a nearby surface-water body. Delineation of the zone of hydraulic containment for extraction well MG 2201 (S-1) at the NP1 Site would require a model of groundwater flow and advective transport.
Contaminant Concentrations
Groundwater sampling by EPA and PADEP has been ongoing for about two decades to monitor VOC contaminant trends in wells MG 668 (GKM), MG 2201 (S-1), MG 2202 (S-2), MG 2203 (S-3), and MG 2204 (D-3) (fig. 2; U.S. Environmental Protection Agency, 2023). Additionally, well MG 2220 (table 1) was sampled once in 2018 by the USGS. Surface-water sampling has been ongoing since 2012 at two sites on the unnamed tributary of Skippack Creek. The long-term monitoring was designed to evaluate VOC concentration trends in the groundwater samples from the five wells and surface-water samples from the two stream sites. However, additional wells may be needed if a better delineation of the spatial extent of groundwater contamination is needed.
Groundwater Monitoring
The PADEP has conducted long-term monitoring of VOC concentrations in groundwater by sampling wells MG 668 (GKM), MG 2201 (S-1), MG 2202 (S-2), MG 2203 (S-3), and MG 2204 (D-3) semiannually to quarterly since 1999 (AECOM, 2012a, b; 2013; 2014; 2015; 2016; 2017; 2018; U.S. Environmental Protection Agency, 2023). The five wells range in depth from about 50 to 208 ft bls (tables 1 and 3). The USGS sampled the 82-ft-deep well MG 2220 once in 2018. All sampled wells are open boreholes below the casing’s bottom and have more than one water-bearing fracture, such that samples may represent a composite of water quality from the contributing water-bearing fractures. Factors that can affect results of sampling include differences in sampling methods and varying contributions from multiple water-bearing fractures, and, for low-flow sampling, depth of pump intake.
Long-Term Monitoring, 1999–2022
Analytical results of groundwater samples collected for the PADEP from monitoring wells are shown for PCE (fig. 32) and TCE (fig. 33) for the period 1999–2022. The data for 1999–2017 are from annual operation and monitoring reports (AECOM, 2012a, b; 2013; 2014; 2015; 2016; 2017; 2018) and were compiled in 5-year review reports by the U.S. Environmental Protection Agency (2008a, 2013, 2018a, 2023). The data for 2018–22 are from annual operation and monitoring reports as summarized in U.S. Environmental Protection Agency (2023); these reports use the names assigned by the EPA to identify wells at the NP1 Site (table 1). The sampling methodology as described in these reports varies among wells; the methodology described in AECOM (2017) states that samples were collected after low-flow purging for wells MG 2202 (S-2), MG 2203 (S-3), and MG 668 (GKM), or collected directly from sample ports for the flowing artesian well MG 2204 (D-3) and for the active extraction well MG 2201 (S-1). Samples have been collected quarterly (in March or April, June, September or October, and December) from well MG 2201 (S-1) since 2008 when pumping for remediation began in this well. For the monitoring wells, samples were collected semiannually (in June and December) (U.S. Environmental Protection Agency, 2023).
The highest concentrations of PCE and TCE were found in well MG 2201 (S-1) (fig. 2). Concentrations of PCE in well MG 2201 (S-1) were 450–650 µg/L from September 1999 to June 2002, then increased to 2,200–8,300 µg/L from December 2002 to December 2004 and declined abruptly after pumping from well MG 668 (GKM) ceased in February 2005 (fig. 35A). Concentrations gradually increased from February 2005 until June 2014, then began a general decreasing trend to December 2017, increasing again from 2018 through April 2020, followed by generally lower levels (less than 350 µg/L) through June 2022, apart from a value of 998 µg/L in December 2021. The reasons for the reported high concentrations in 2002–04 and a low concentration (28.4 µg/L) in December 2020 are not known. TCE concentrations in well MG 2201 (S-1) followed the same general pattern (fig. 36A).
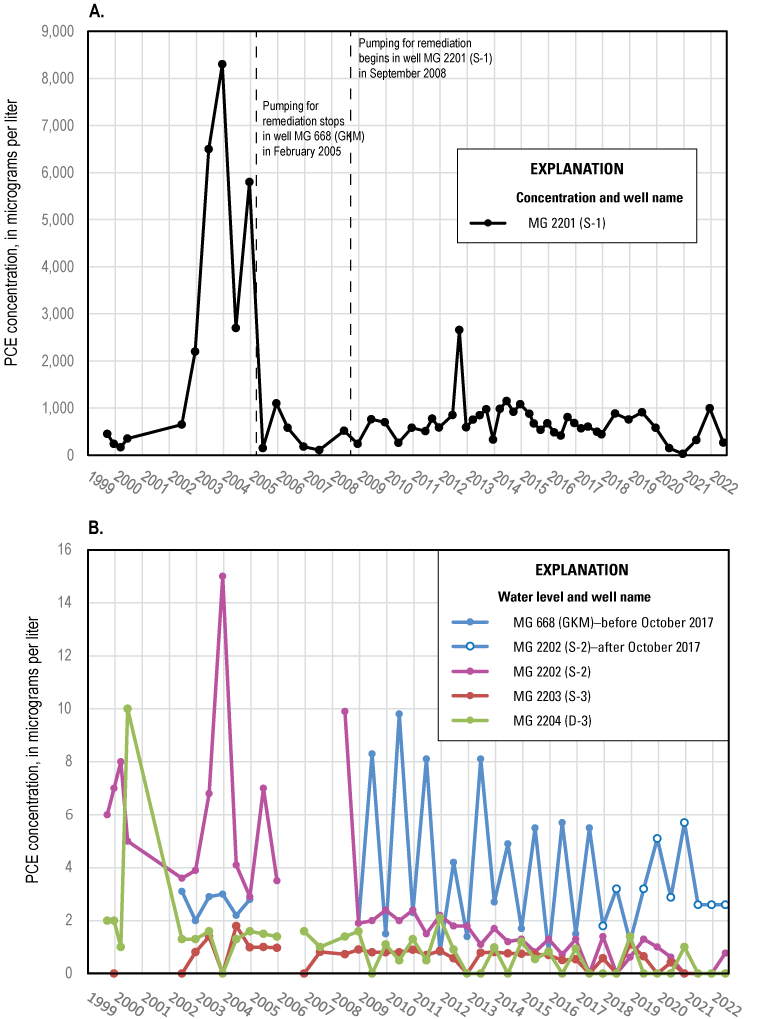
Plots showing the concentrations of tetrachloroethylene (PCE) in A, extraction well MG 2201 (S-1) and B, four other monitoring wells at the North Penn Area 1 Superfund Site Souderton, Montgomery County, Pennsylvania, 1999–2022. Data for 1999–2017 are from AECOM (2012a, b; 2013; 2014; 2015; 2016; 2017; 2018). Data for 2018–22 are from U.S. Environmental Protection Agency (2023). Wells are identified by U.S. Geological Survey well name, with well names used by U.S. Environmental Protection Agency in parentheses (table 1).
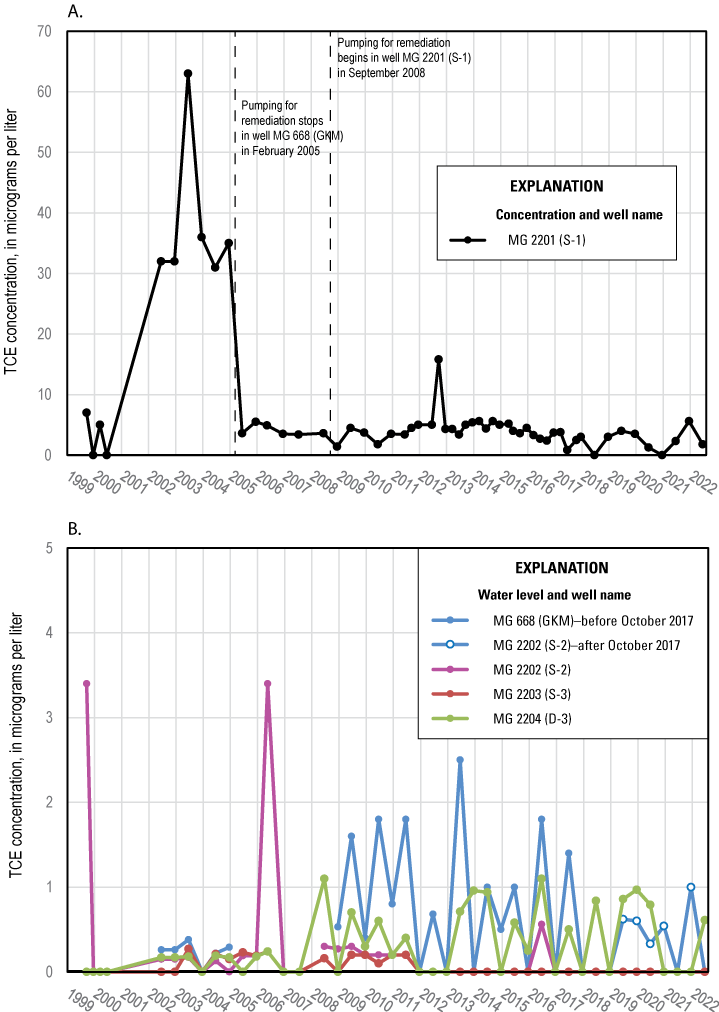
Plots showing the concentrations of trichloroethylene (TCE) in A, extraction well MG 2201 (S-1) and B, four other monitoring wells at the North Penn Area 1 Superfund Site, Souderton, Montgomery County, Pennsylvania, 1999–2022. Data for 1999–2017 are from AECOM (2012a, b; 2013; 2014; 2015; 2016; 2017; 2018). Data for 2018–22 are from U.S. Environmental Protection Agency (2023). Wells are identified by U.S. Geological Survey well name, with well names used by U.S. Environmental Protection Agency in parentheses (table 1).
The large decreases in PCE and TCE concentrations in water from extraction well MG 2201 (S-1) from December 2004 to June 2005 were probably related to the shutdown of extraction well MG 668 (GKM), but differences in precipitation during the period may also have had an effect. The drought of 2001–02 was followed by a wet period in 2003–04, as indicated by water levels in nearby long-term observation well MG 917 (figs. 2 and 37).The elevated PCE concentrations during the wet years, could have been caused by flushing from increased groundwater recharge, and there is generally an inverse relation between PCE concentrations in well MG 2201 (S-1) and depth to water in observation well MG 917 (fig. 37A). The gradual increase in PCE concentrations from 2007 to 2012 followed a period of slightly greater than normal precipitation (National Oceanic and Atmospheric Administration, 2024a) that resulted in higher recharge and groundwater levels (fig. 37). PCE concentrations generally decreased in 2015–17 during a period of lower groundwater levels in well MG 917 and below average precipitation; concentrations increased in 2018–20 during a period of higher groundwater levels in well MG 917 and above average precipitation (fig. 37). These patterns indicate precipitation and related recharge may have affected contaminant concentrations in groundwater. Other factors that may affect reported concentrations are changes in sampling methodology for well MG 2201 (S-1) before and after pumping began in this well in September 2008; samples from extraction well MG 2201 (S-1) have been collected under operational pumping conditions since September 2008, but low-flow methods used to sample other monitoring wells since 2009 (AECOM, 2017) may have been used to sample MG 2201 (S-1) before September 2008.
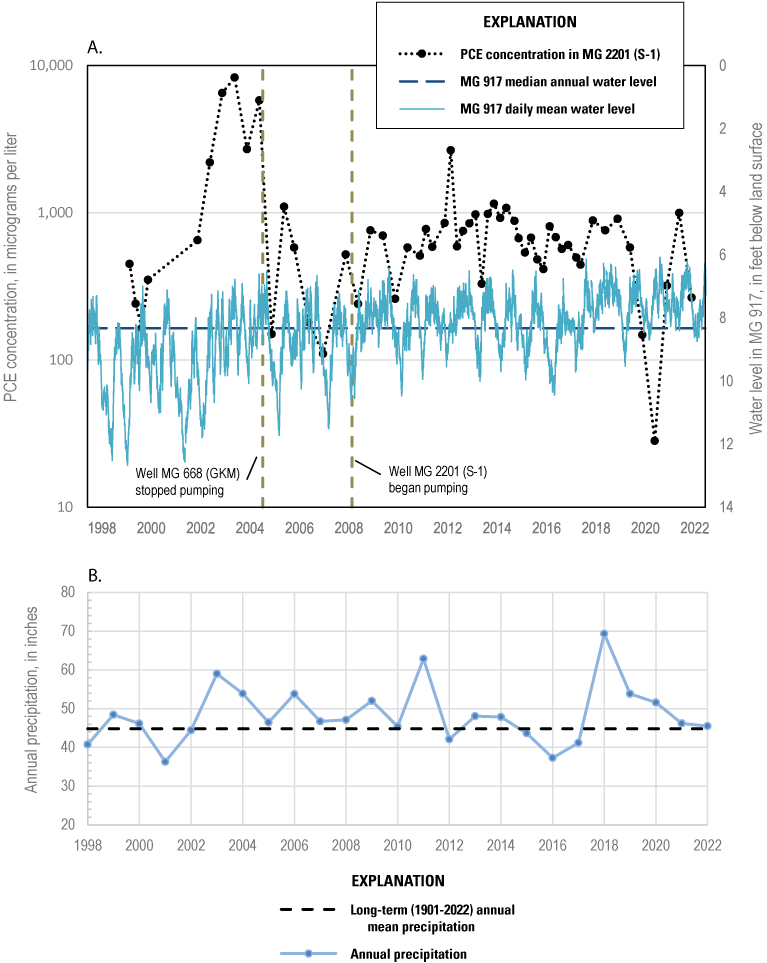
Plots showing A, concentrations of tetrachloroethylene (PCE) in extraction well MG 2201 (S-1) at the North Penn Area 1 Superfund Site, the daily mean and long-term annual median water levels in observation well MG 917, and periods of pumping from wells MG 669 (Granite Knitting Mill [GKM]) and MG 2201 (S-1), Montgomery Country, Pennsylvania, 1998–2022; and B, annual precipitation and long-term (1901–2022) annual mean precipitation in Montgomery County, Pennsylvania, 1998–2022. Concentration data are from AECOM (2017, 2018), water-level data are from U.S. Geological Survey (2024b), and precipitation data are from National Oceanic and Atmospheric Administration (2024a) Wells are identified by U.S. Geological Survey well name, with well names used by U.S. Environmental Protection Agency in parentheses (table 1).
Concentrations of PCE and TCE for the other monitoring wells are shown in figures 35B and 36B. Concentrations of PCE in all wells have generally decreased since extraction well MG 2201 (S-1) began operation in September 2008. PCE concentrations were below 5 µg/L in samples from well MG 668 (GKM) except for samples in June of most years before well reconstruction in October 2017; after October 2017, PCE concentrations in samples from well MG 668 (GKM) did not show a consistent pattern, being above 5 µg/L in December 2019 and December 2020 samples. Factors causing the apparent sawtooth pattern of concentrations in samples from well MG 668 (GKM) are not known, but PCE concentrations generally are higher in June samples than in December samples each year until 2017, indicating factors affecting PCE concentrations may be seasonal. A temporal change in pattern appears after reconstruction of well MG 668 (GKM) and indicates some effects related to reconstruction of this well. The sawtooth pattern does not seem to relate to differences in precipitation or groundwater level. The opposite pattern is found in samples from wells MG 2202 (S-2) and MG 2203 (D-3): PCE concentrations were lower in June and higher in December during 2009–18. However, the differences in concentration between June and December samples were much smaller for these wells than for well MG 668 (GKM). TCE concentrations were less than 5 µg/L in all samples and had a similar sawtooth pattern over time. Concentrations were higher in June than in December for samples from wells MG 668 (GKM; until reconstruction in October 2017), MG 2202 (S-2), and MG 2204 (D-3); after reconstruction of well MG 668 (GKM) in October 2017, the temporal pattern in TCE concentrations in samples from this well changed similar to that observed for PCE.
The VOC cis-1,2-dichloroethene at relatively low levels (less than 10 µg/L) was found in samples from wells MG 668 (GKM), MG 2201 (S-1), and MG 2204 (D-3), and was the predominant form of dichloroethene (DCE) in the samples. The cis-1,2-DCE is probably an indication of biodegradation of VOCs in the groundwater. Guidance for evaluation of natural attenuation of chlorinated solvents notes that if the concentration of cis-1,2-DCE is greater than 80 percent of total DCE, it was probably formed by dehalogenation of TCE or PCE (Minnesota Pollution Control Agency, 2006).
Sampling method may have affected the reported concentrations of VOCs, especially in open boreholes containing multiple water-bearing fractures. This may introduce some uncertainty in interpretation of results or comparison of results for samples collected using different methods. Potential issues associated with low-flow sampling from the 6-in.- and 8-in.-diameter open holes include
-
• groundwater samples could contain a substantial amount of water from borehole storage rather than water directly entering well from an active water-bearing fracture;
-
• contaminant concentrations of the water in borehole storage could be altered by chemical reactions or biological activity; and
-
• groundwater samples from the open holes may represent a mixture of concentrations in water from multiple water-bearing fractures and (or) from fractures nearest the sample collection depth within the well, such that sample depth is another variable that could affect results.
In the cases of wells MG 2201 (S-1) and MG 2204 (D-3), groundwater samples were collected from pumping or flowing wells, respectively, and thus explicitly represent a mixture of water from different water-bearing fractures. The PCE concentrations in groundwater samples from the 35-ft-deep MG 668 (GKM) after reconstruction in October 2017 (less than 10 µg/L) are much lower than the value of 330 µg/L reported for packer testing of the 0–28 ft interval during RI (CH2M-Hill, Inc., 1993a), despite apparently similar interval depths. Differences in PCE values after 2017 compared to the RI packer-test results could be partly related to (1) sampling methods because low-flow sampling was used after 2017 and the interval was pumped for three volumes before sampling for packer tests during the RI, (2) differences in interval depths and water-bearing zones in MG 668 (GKM) after reconstruction in October 2017 and the reported packer test interval of 0–28 ft in this well, and (or) (3) soil removals in 1998. The 2012 borehole video shows likely water-bearing fractures from about 29 to 33 ft bls, which would reduce the ability to obtain a packer seal at 28 ft bls. These fractures could be the same as those noted at about 22 ft in well MG 668 (GKM) in the RI report (CH2M-Hill, Inc., 1993a) but offset by the approximate depth from land surface to top of casing (about 5.9 ft bls), such that the interval from of 0–28 ft is below top of casing or about actually 0–34 ft bls. The 2018 borehole video shows that the water-bearing fractures from about 29 to 33 ft bls are less open than in the 2012 video and may have been partly obstructed by grouting during reconstruction.
MG 2220 Sampling, 2018
A groundwater sample was collected from well MG 2220 by the USGS on May 2, 2018, after purging more than three well volumes and was analyzed for 34 VOCs at the USGS National Water Quality Laboratory. Results of the analysis and equipment blank are shown in table 4. Two compounds, PCE and TCE, were detected at concentrations greater than their EPA MCLs of 5 µg/L for drinking water. The PCE and TCE concentrations in the sample collected from well MG 2220 on May 2, 2018, were 1,830 µg/L and 9.8 µg/L, respectively. The concentrations of PCE and TCE in the May 2018 sample from well MG 2220 were about four times and three times greater, respectively, than the PCE and TCE concentrations of 444 µg/L and 3 µg/L measured in a sample from extraction well MG 2201 (S-1) collected on December 15, 2017. Additional measurements of PCE and TCE concentrations in groundwater samples from well MG 2220 may be needed to determine if elevated concentrations are persistent, which would support consideration of use of this well for monitoring or as an extraction well as part of remediation.
Table 4.
Field parameters and 34 volatile organic compounds analyzed in an equipment blank collected on April 30, 2018, at 3:00 pm and a water sample collected from well MG 2220 on May 2, 2018, at 2:00 pm.[°C, degree Celsius; —, no data; µS/cm, microsiemens per centimeter; ft bls, feet below land surface; mg/L milligrams per liter; µg/L, micrograms per liter; <, less than]
Concentrations of detections exceeding a maximum contaminant level set by the U.S. Environmental Protection Agency (2018b).
The water sample from well MG 2220 was collected using a Grundfos RediFlo-2 pump after purging the well for 90 minutes at an average rate of 4.4 gal/min. The purging caused drawdown in well MG 2220 of about 1.7 ft after about 90 minutes (fig. 29C), from which a specific capacity of about 2.6 gallons per minute per foot of drawdown was calculated. Drawdown of about 1.1 ft was measured in nearby well MG 2201 (S-1) (figs. 2 and 29C), indicating interconnections between the wells. These data could potentially be used to estimate transmissivity of the aquifer, although the approach would need to account for fractured-rock properties.
Surface-Water Monitoring
Surface water has been sampled semiannually (in June and December) for VOCs since December 2011 at two sites (fig. 2) on the unnamed tributary to Skippack Creek as part of monitoring by PADEP. Of the three VOCs of concern, PCE, TCE, and cis-1,2-DCE, only PCE was measured above the reporting level of 0.5 µg/L (AECOM, 2012a, b; 2013; 2014; 2015; 2016; 2017; 2018; U.S. Environmental Protection Agency, 2023). PCE has been consistently found at the upstream site (SW-2) at concentrations ranging from 1.3 to 3.4 µg/L during December 2011 through December 2017 and then at generally lower and more variable concentrations since June 2018; however, the second highest reported value of 2.6 µg/L was for the December 2021 sample (fig. 38). Contamination in the shallow groundwater system could be discharging in the stream near SW-2 and upstream. At the downstream site (SW-1), PCE has only been detected three times: twice in estimated concentrations (less than the reporting limit of 0.5 µg/L) (December 2014, 0.44 µg/L; June 2020 0.12 µg/L), and once at 1.4 µg/L (December 2018) (AECOM, 2012a, b; 2013; 2014; 2015; 2016; 2017; 2018; U.S. Environmental Protection Agency, 2023).
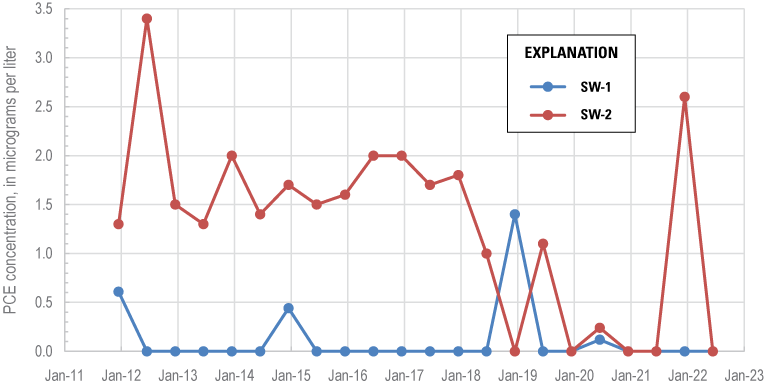
Concentrations of tetrachloroethylene (PCE) in June and December samples from the unnamed tributary of Skippack Creek, North Penn Area 1 Superfund Site, Souderton, Montgomery County, Pennsylvania, 2011–22. Concentrations shown as 0 values are reported by laboratory as not detected (less than 0.5 micrograms per liter). Locations of sampling sites are shown in figure 2, and additional site information is provided in table 1. Data are from AECOM (2012a, b; 2013; 2014; 2015; 2016; 2017; 2018) and U.S. Environmental Protection Agency (2023).
Conceptual Model of the Groundwater System
A preliminary, descriptive conceptual model of the groundwater system was developed for the NP1 Site using available and recently collected (2012–22) water-level, chemical, geologic, and geophysical data. The conceptual model is most useful for identifying data gaps and guiding additional study. Well depths and inferred depths of water-bearing fractures are shown in figure 39 with natural gamma logs on section lines to illustrate horizontal and vertical spatial relations among wells.
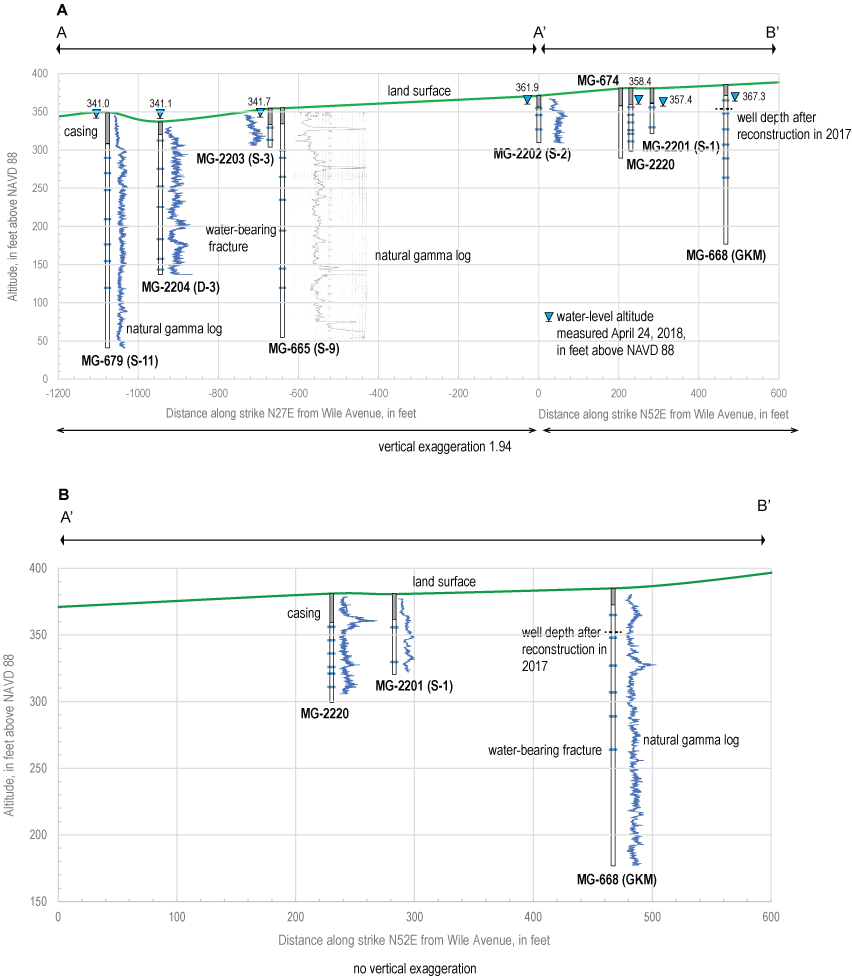
Sections showing depth of open intervals below the casing and estimated depths of water-bearing fractures with natural gamma logs for A, all wells on section line A-A’-B with water-level altitudes measured on April 24, 2018, and B, selected wells on section line A’-B’, North Penn Area 1 Superfund Site, Souderton, Montgomery County, Pennsylvania. Wells are identified by U.S. Geological Survey well name, with well names used by U.S. Environmental Protection Agency in parentheses (table 1). Wells were projected onto section lines, with well MG 2202 projected at intersection of lines A-A’ and A’-B’.
Local Hydrogeologic Framework
The hydrogeologic framework of the groundwater-flow system in the Brunswick and Lockatong Formations is typically described as consisting of dipping, fractured rock layers in which bedding partings (Senior and Goode, 1999) and bedding-constrained near-vertical fractures approximately orthogonal to bedding (Risser and Bird, 2003) are the primary water-yielding zones. High-angle or vertical fractures may be more important water-bearing features than bedding-plane openings at greater depths (Morin and others, 2000).
The multiple thin dipping water-yielding zones, separated by thick aquitards have been described as a multi-unit leaky aquifer system (Michalski and Britton, 1997). The dipping beds form an anisotropic aquifer in which groundwater preferentially moves along the strike of the beds (Vecchioli, 1967; Lewis, 1992). Hydraulic connections within the aquifer are strongest among wells completed within the same bed. As a result, drawdown from pumping is typically observed at much greater distance from the pumped well along strike, rather than across strike, of beds (Longwill and Wood, 1965). The shape of the recharge area that contributes water to a pumping well is affected by the dipping-bed structure of the aquifer, as shown in groundwater simulations for these hydrogeologic units in nearby studies (Goode and Senior, 2000; Barton and others, 2003; Risser and Bird, 2003; Senior and Goode, 2013; Senior and Goode, 2017).
Near the NP1 Site, the regional geologic framework is a homocline with beds striking about N60°E and beds dipping 9–15 degrees to the northwest. However, the geologic framework at the NP1 Site is different than the regional framework. In the unnamed tributary of Skippack Creek downstream from Wile Avenue, some beds strike approximately due north and dip 20 degrees west and a major joint set is approximately parallel to the stream course. Likely, small unmapped faults and folds associated with the regional Chalfont Fault to the south have complicated the structure at the NP1 Site. It is possible that well MG 2220 was drilled through rocks affected by local faulting; this well is 58 ft southwest of extraction well MG 2201 (S-1) and penetrated highly fractured rocks with nearly vertical fractures, some of which trend approximately due north-south.
The geologic framework controls how water-level change propagates between a pumping well and other wells. As previously noted, wells along the strike of beds in this hydrogeologic setting will commonly show a greater hydraulic connection (more “influence,” or water-level change during pumping) than wells located across the strike of beds (Longwill and Wood, 1965, p. 26). The lack of laterally extensive marker beds (such as those with elevated natural gamma activity; fig. 38) limits the ability to identify orientation of beds and thus estimate likely directions of greater hydraulic connections. Additionally, joints (high-angle fractures) that differ in orientation from bedding within the geologic units and faults may affect the geometry of local hydraulic connections in the aquifer. Hydraulic connections at the NP1 Site (determined by observations of water-level changes to pumping stress) are consistent with a north- to northeast-south to southwest hydraulic connection at a local scale (fig. 31). Because observation wells are not situated to the east, northeast, west, or southwest of the NP1 Site, hydraulic connectivity in those directions is not known. An anisotropic aquifer with preferential direction north-south to northeast-southwest would be consistent with observations of hydraulic connections between wells.
Groundwater Flow
Groundwater flow is controlled by the hydraulic gradient acting within the geologic framework. The hydraulic gradient is consistent with shallow groundwater flow toward the stream and, locally, toward the extraction well MG 2201 (S-1) (fig. 32). The detection of PCE in the stream at site SW-2 (figs. 2 and 37) also indicates possible groundwater flow from the area of elevated VOCs in groundwater to the stream. The hydraulic head is being lowered at extraction well MG 2201 (S-1) causing local capture of shallow contaminated groundwater. The hydraulic head in deep well MG 2204 (D-3) is always above stream level, showing the potential for deeper groundwater to also discharge to the stream. Zones of highly fractured rock, such as the upper part of the borehole in well MG 2220, indicate presence of highly conductive preferential pathways in the groundwater system that can affect flow directions locally, but the lateral extent of these pathways is not known. Inferred faulting may also result in discontinuities and reorientation of regional geologic structure that can affect groundwater-flow pathways. However, contaminants in the aquifer would be generally transported with the flowing groundwater toward the stream.
Contaminant Distribution
Some degradation of PCE and TCE contamination in groundwater seems to have occurred through natural attenuation, as evidenced by the concentration of cis-1,2-DCE measured in samples; however, the relatively low levels of cis-1,2-DCE measured in groundwater samples from only a few wells (MG 2201 [S-1], MG 668 [GKM], and rarely MG 2204 [D-3]) indicates that natural attenuation may have been only a minor process under conditions during sampling. The elevated level of PCE and TCE contamination found in well MG 2220 suggests that elevated concentrations of these VOCs might be found in shallow groundwater south and southwest of extraction well MG 2201 (S-1), down-valley toward the stream. The PCE concentration of 1,800 µg/L at well MG 2220 is nearly 1 percent of PCE solubility in water, which is a common guideline indicating the presence of dense nonaqueous phase liquid (DNAPL) PCE near the well (U.S. Environmental Protection Agency, 2004).
In deeper parts of the aquifer (greater than 80 ft bls), groundwater contamination was likely induced when well MG 665 (S-9) and other deep production wells, such as well MG 679 (S-11), were in operation, which increased downward groundwater flow. Contaminants in the shallow groundwater also could have been transported downward in well MG 668 (GKM), which was an open hole from about 9 to 195 ft bls until it was plugged to a depth of about 35 ft bls in October 2017. Results of a packer test of well MG 668 (GKM) during the RI showed that the highest PCE concentrations (330 µg/L) were in the shallowest interval tested (0–28 ft bls) (CH2M-Hill, Inc., 1993a). The pulses of surface water that entered the well MG 668 (GKM) during storms probably increased the potential for downward migration of contaminants within the well MG 668 (GKM), especially after storms. However, the PCE concentrations in recent (2018–22) groundwater samples collected using low-flow methods from the 35-ft-deep reconstructed well MG 668 (GKM) ranged from about 2 to 6 µg/L (U.S. Environmental Protection Agency, 2023) and were much lower than results of the packer test in a similar interval; reasons for differences in reported PCE concentrations from the shallow interval of well MG 668 (GKM) are not known but could include source removal, partial closure of fractures near 29 ft bls after reconstruction (figs. 11E and 11F), and differences in sampling methodology. Water-level data gathered after October 2017 indicates that MG 668 (GKM) responds differently to recharge and its hydrologic connections to MG 2201 (S-1) have declined after reconstruction (figs. 27 and 30). These hydraulic changes, which are likely a result of grouting up water-bearing fractures deeper than 35 ft bls in MG 668 (GKM) that were hydraulically connected to MG 2201 (S-1) and had different water-bearing properties than the shallow fractures, may potentially affect contaminant transport and distribution.
Data Gaps and Limitations
The available data are limited in spatial extent and provide only limited delineation of the extent of groundwater contamination, including potential discharge to streams. Considerations that may address data gaps, improve the conceptual model of the groundwater system, and better delineate the extent of groundwater contamination and its transport are listed below:
-
• Additional monitoring wells.—Additional shallow monitoring wells could be installed to help delineate the extent of contamination and define the water-table configuration at the NP1 Site. The one sample collected at well MG 2220 indicates that elevated levels of contamination in the shallow aquifer were present south-southwest of extraction well MG 2201 (S-1). Two or more downgradient, intermediate-depth monitoring wells (up to about 150-ft deep) located between wells MG 2201 (S-1) and MG 2204 (D-3) could help to determine the vertical extent of contamination and provide information about vertical gradients that could be used to evaluate potential for contamination migration and extent of capture by the extraction well(s). The intermediate-depth wells could be screened to be open over only short intervals (20–40 ft) and may be located near shallow wells.
-
• Synoptic water-level and streamflow measurements.—Groundwater-flow directions and groundwater–surface-water relations that affect contaminant transport could be determined with the help of synoptic water-level measurements in all monitoring wells and concurrent streamflow measurements. Water levels obtained from deep and shallow intervals could describe both vertical and horizonal gradients.
-
• Further characterization of well MG 2220.—Well MG 2220 could be further characterized to determine its feasibility for use as an extraction well for remediation or, at minimum, as an observation well. As an extraction well, MG 2220 could be used in addition to or as a replacement for extraction well MG 2201 (S-1). Additional characterization could include resampling the whole well under pumping conditions to determine the persistence of elevated PCE concentrations. It could also include sampling at various depths while pumping just below the water-level using the approach similar to that which is described by Izbicki and others (1999) to help describe the vertical distribution of contamination in the borehole, which is too extensively fractured in the 20–60-ft interval for packer testing. Well MG 2220 could also be added to the well network for quarterly sampling. If well MG 2220 is used as a monitoring well, some reconstruction could be considered but may be limited by the extensive fracturing in the upper 60 ft of the borehole.
-
• Further characterization of deep wells.—Well MG 2204 (D-3) is a 198-ft-deep flowing artesian well. The well penetrates numerous fractures that could be contributing water. Isolating zones with packers would provide information about contaminant distribution with depth. Alternately, collection of samples with concurrent flowmeter measurements using methods similar to those described by Izbicki and others (1999) could help define contaminated depth zones. In the previous work done by the USGS at the NP1 Site, a flowmeter survey was not done because it was assumed that the loose bacterial floc in the well would clog the flowmeter. Thus, the well would need to be cleaned by a well driller prior to attempting to use the flowmeter or else alternate methods of measuring vertical borehole flow could be used. Similarly, the deep well MG 679 (S-11) could be evaluated to for additional characterization to help determine the vertical distribution of any contamination.
-
• Evaluation of sampling methods used for long-term groundwater monitoring.—The approach used by PADEP since 1999 includes sample collection from wells under different conditions (deep flowing well, pumping extraction well, low-flow sampling in other observation wells) that may not provide comparable results. In a fractured-rock setting such as that of the NP1 Site, low-flow sampling in long open-boreholes may not provide a consistent or representative (accurate) measure of contaminants in the groundwater.
-
• Re-evaluation and (or) abandonment of well MG 668 (GKM).—Well MG 668 (GKM) was reconstructed as a shallow 35-foot-deep well in 2017. A slug test or short pumping test could be conducted to determine its connection to the aquifer. Additional efforts could be made to prevent stormwater in the pit from entering the well through the well casing or casing joint. If leakage around the joint between the casing extension and the existing casing cannot be eliminated, abandonment (fully sealing) of the well and replacement with a nearby shallow well could be considered. Reconstructing well MG 668 (GKM) with a screen and grouting past the leaky casing joint is another option that could be considered. To confirm the low PCE concentrations (less than 6 µg/L) that have been reported for the open interval (9–35 ft bls) of this well since 2017 but are much lower than the 0–28 ft packer test results from the RI (CH2M-Hill, Inc., 1993a), sampling methods could be compared by conducting low-flow sampling followed by sampling after a three-volume purge.
-
• Survey monitoring well altitudes to NAVD 88.—Surveying altitudes for all the monitoring wells to NAVD 88 datum and (or) or the updated 2022 datum could provide improved accuracy of vertical reference for determining groundwater gradients.
-
• Aquifer tests and water-level monitoring.—Aquifer tests and water-level monitoring in new and existing monitoring wells could be used to measure responses to pumping from the extraction wells, provide data to estimate the extent of groundwater capture zones for remediation wells, and refine the local hydrogeologic framework.
-
• Delineation of the zone of hydraulic containment.—The zone of hydraulic containment for extraction well MG 2201 (S-1) and (or) the other wells at the NP1 Site could be delineated using a model of groundwater flow and advective transport. A numeric groundwater model could synthesize all data and provide objective quantitative tool for three-dimensional delineation of the hydraulic-containment zone and contaminant transport in groundwater flow and allow testing of alternate scenarios for containment.
Summary and Conclusions
In 1979, concentrations of tetrachloroethylene (PCE) above the drinking-water maximum contaminant level (MCL) of 5 micrograms per liter (µg/L) set by the U.S. Environmental Protection Agency (EPA) were identified in water from a production well in the Borough of Souderton in Montgomery County, Pennsylvania, which led to the EPA placing the site on the National Priorities List in 1989 as North Penn Area 1 Superfund Site (hereafter, the NP1 Site). The area is underlain by sedimentary formations that form a fractured-rock aquifer used for drinking water and industrial supply. The EPA identified three facilities that used volatile organic compounds (VOCs) with potential to contaminate soil and the aquifer, primarily with PCE and trichloroethylene (TCE). The EPA selected a remedy in 1994 that included soil removal and operation of a groundwater-extraction system that involved pumping the former Granite Knitting Mill (GKM) production well (MG 668) from 1998 to 2005 and the more recently installed monitoring well MG 2201 (S-1) since 2008; the operation and monitoring of the system was transferred to the Pennsylvania Department of Environmental Protection (PADEP) in 2009. The EPA identified the persistence of elevated PCE concentrations in groundwater from extraction well MG 2201 (S-1) and recommended additional site characterization to determine the source of the elevated PCE, and capture zone analysis, in the third 5-year review of the NP1 Site in 2013.
During 2012–18, the U.S. Geological Survey (USGS) provided technical assistance to the EPA in the form of additional site characterization that included the development of a conceptual model of the groundwater system and evaluation of the extent of PCE and TCE contamination in groundwater. The USGS evaluated existing data from the NP1 Site, drilled an 82-foot (ft)-deep monitoring well in 2016, reconstructed the 195-ft-deep well MG 668 (GKM), and collected or compiled geophysical and borehole video logs in those two wells and six others. Continuous water levels were collected in seven of the eight wells in this study, including two former water-supply wells (MG 668 [GKM] and the 308-ft-deep MG 679 [S-11]) and five monitoring wells ranging in depth from 50 to 198 ft. More recent (2018–22) water-quality monitoring data were also reviewed.
The NP1 Site is underlain by shales and siltstones of the Triassic Brunswick Formation, which generally has been mapped as a northwest dipping homocline. However, the NP1 Site is within 4,000 ft of a major fault (Chalfont Fault) which has locally disrupted regional structure. Geophysical and borehole video logs were evaluated to identify and describe water-bearing fractures and to assess potential for lithologic correlation. Geophysical logs collected by the USGS in 1992 in the former production well MG 665 (S-9) were also compiled. Numerous high- and low-angle fractures were present in most wells. Extensive fracturing in the upper 62 ft of the monitoring well drilled in 2016 (MG 2220) indicates that the well likely was drilled through a zone of faulting. No distinctive features were identified on geophysical logs (natural gamma and single-point resistance) that could be used for correlation. Limited borehole flow data were available to assess vertical gradients in the aquifer.
Assessment of continuous water levels showed hydraulic connections among some wells as indicated by water-level changes in response to changes in pumping rates. Water levels were above land surface in the 198-ft-deep monitoring well MG 2204 (D-3) to the southwest of the main area of contamination, indicating potential for upward flow and groundwater discharge toward the stream. A map of water levels measured in April 2018 indicates that groundwater flow generally is toward the nearest stream (unnamed tributary to Skippack Creek) but the limited water-level data are insufficient to describe vertical groundwater gradients or lateral gradients in any detail. Compared to the 1990s when pumping for public supply and other uses was more extensive, recent (2022) pumping within 0.5 miles is lower and consists only of the NP1 Site’s groundwater-extraction system.
Review of VOC monitoring data from 1999–2022 collected by PADEP indicates that the highest concentrations of PCE and TCE were found in samples from well MG 2201 (S-1) and fluctuated through time; PCE concentrations were much higher than TCE concentrations during this period. Concentrations of PCE in samples from well MG 2201 (S-1) increased from 450 to 650 µg/L in 1999–2002 to 2,200–8,300 µg/L in 2002–04, and then declined abruptly after pumping from well MG 668 (GKM) ceased in February 2005. Thereafter, concentrations gradually increased from February 2005 until June 2014, at which point concentrations stabilized or slightly decreased until December 2017. Concentrations of PCE increased again from 2018 through April 2020, although generally lower levels (less than 350 µg/L) were measured through June 2022, with the exception of a value of 998 µg/L in December 2021. Factors possibly affecting observed fluctuations in PCE concentrations in samples from well MG 2201 (S-1) include variable recharge, as indicated by a general inverse relation between water levels in the long-term observation well MG 2220 and PCE concentrations. The PCE concentration of 1,830 µg/L in a May 2018 sample collected from well MG 2220 was about four times higher than the PCE concentrations of 444 µg/L in a December 2017 sample from the extraction well MG 2201 (S-1). Differences in sampling methods for the monitoring wells may affect data comparability. Additionally, low-flow sampling in open boreholes, especially in wells with multiple water-bearing fractures, may not be representative of contamination in the aquifer at various depths.
Low concentrations of VOCs were measured in samples at two stream sites downgradient from wells that had the highest groundwater concentrations at the NP1 Site, indicating the potential for discharge of contaminated groundwater to streams. The stream VOC concentrations were relatively low compared those of groundwater and varied over time. PCE concentrations generally were higher in samples at the upstream site, SW-2 than in samples at the downstream site SW-1; site SW-2 is nearer to the highest groundwater concentrations at well MG 2201 (S-1) than site SW-1. The highest PCE concentration measured in surface water since 2012 was for a recent sample at SW-2 (2.6 µg/L), in December 2021.
Commonly, in the hydrogeologic setting of these sedimentary rocks, which form layered fractured-rock aquifer, wells along the strike of beds will show a greater hydraulic connection (more “influence,” or water-level change during pumping) than wells located across the strike of beds. However, joints within the geologic units and faults may affect the geometry of hydraulic connections in the aquifer. Hydraulic connections at the NP1 Site (determined by observations of water-level changes to pumping changes) are consistent with a north to northeast and south to southwest hydraulic connection, at least locally. However, because wells are not situated to the east, northeast, west, or southwest of the NP1 Site, hydraulic connectivity in those directions is not known. An anisotropic aquifer with preferential direction north-south to northeast-southwest would be consistent with observations of hydraulic connections between existing wells.
To address data gaps and limitations, considerations that could help improve the conceptual model of the groundwater system and help delineate the extent of groundwater contamination and its transport include
-
• installation of additional shallow and intermediate-depth (up to about 150-ft deep) monitoring wells could help delineate the extent of contamination and define the water-table configuration;
-
• synoptic water-level measurements in all monitoring wells and concurrent stream-flow measurements could provide data to help determine potential groundwater-flow directions and groundwater–surface-water relations that affect contaminant transport;
-
• further characterization could be used to evaluate possible use of well MG 2220 as an extraction well for remediation if elevated PCE concentrations in this well are persistent or as a monitoring well pending additional vertical delineation of PCE concentrations;
-
• further characterization of existing deep wells, such as the 198-ft-deep well MG 2204 (D-3), could help identify vertical extent of contamination downgradient from source area;
-
• evaluation of sampling methods for long-term groundwater monitoring could help identify the approach most representative of actual contaminant concentrations in groundwater;
-
• abandonment, reconstruction, or replacement of well MG 668 (GKM) that has a leaky casing and is affected by surface water flowing into the well casing near land surface;
-
• surveys of altitudes for all wells to the North American Vertical Datum of 1988 to provide a common vertical reference for determining groundwater gradients;
-
• additional aquifer tests and water-level monitoring in new and existing monitoring wells could be used to measure responses to pumping from the extraction wells and thus provide data to estimate the extent of groundwater capture zones for remediation wells and refine the local hydrogeologic framework; and
-
• a groundwater-flow model could be developed to delineate the zone of hydraulic containment for extraction wells.
References Cited
AECOM, 2013, July 2012–June 2013 annual operations and maintenance report: PADEP IRRSC6–1–233—North Penn Area 1 Site, prepared by AECOM, Trevose, Pa., 9 p., 5 oversized figs., 6 oversized tables, 3 apps. [Also available at https://semspub.epa.gov/work/03/2257738.pdf.]
AECOM, 2014, July 2013–June 2014 annual operations and maintenance report: PADEP IRRSC6–1–233, North Penn Area 1 Site, Souderton, PA, 11 p., prepared by AECOM, Trevose, Pa., 9 p., 5 oversized figs., 6 oversized tables, 3 apps. [Also available at https://semspub.epa.gov/work/03/2257739.pdf.]
AECOM, 2015, July 2014–June 2015 annual operations and maintenance report: PADEP IRRSC7–1–305—North Penn Area 1 Site, prepared by AECOM, Princeton, N.J., 10 p., 5 oversized figs., 6 oversized tables, 3 apps. [Also available at https://semspub.epa.gov/work/03/2257740.pdf.]
AECOM, 2016, July 2015–June 2016 annual operations and maintenance report: PADEP IRRSC7–1–305, North Penn Area 1 Site, Souderton, PA, 11 p., prepared by AECOM, Trevose, Pa., 11 p., 5 oversized figs., 6 oversized tables, 3 apps. [Also available at https://semspub.epa.gov/work/03/2257741.pdf.]
AECOM, 2017, July 2016—June 2017 annual operations and maintenance report: PADEP IRRSC7–1–305, North Penn Area 1 Site, Souderton, PA, 11 p., prepared by AECOM, Trevose, Pa., 11 p., 5 oversized figs., 7 oversized tables, 3 apps. [Also available at https://semspub.epa.gov/work/03/2257742.pdf.]
Barton, G.J., Risser, D.W., Galeone, D.G., and Goode, D.J., 2003, Case study for delineating a contributing area to a well in a fractured siliciclastic-bedrock aquifer near Lansdale, Pennsylvania: U.S. Geological Survey Water-Resources Investigations Report 02–4271, 46 p. [Also available at https://doi.org/10.3133/wri024271.]
Berg, T. M., Edmunds, W. E., Geyer, A. R., Glover, A.D., Hoskins, D.M., MacLachlan, D.B., Root, S.I., Sevon, W.D., and Socolow, A.A., compilers, 1980, Geologic map of Pennsylvania: Pennsylvania Geological Survey, 4th ser., Map 1, scale 1:250,000, accessed April 20, 2023, at elibrary.dcnr.pa.gov/GetDocument?docId=1751215&DocName=Map1_Geo_Pa.
Brown, E.T., Green, S.J., and Sinha, K.P., 1981, The influence of rock anisotropy on hole deviation in rotary drilling—A review: International Journal of Rock Mechanics and Mining Sciences & Geomechanics Abstracts, v. 18, no. 5, p. 387–401, accessed February 7, 2024, at https://doi.org/10.1016/0148-9062(81)90003-6.
CH2M-Hill, Inc., 1993a, North Penn Area 1 phase II remedial investigation report: Philadelphia, Pa., U.S. Environmental Protection Agency, prepared by CH2M-Hill, Inc. under contract no. 68–W8–0090, v. 1, [variously paged; 169 p.], accessed May 2018, at https://semspub.epa.gov/work/03/28009.pdf.
CH2M-Hill, Inc., 1993b, North Penn Area 1 phase II remedial investigation report: Philadelphia, Pa., U.S. Environmental Protection Agency, prepared by CH2M-Hill, Inc. under contract no. 68–W8–0090, v. 2, [variously paged; 440 p.], accessed May 2018, at https://semspub.epa.gov/work/03/28029.pdf.
Conger, R.W., 1999, Analysis of geophysical logs, at North Penn Area 6 Superfund Site, Lansdale, Montgomery County, Pennsylvania: U.S. Geological Survey Open-File Report 99–271–A, 149 p., accessed August 8, 2023, at https://doi.org/10.3133/ofr99271A.
Conger, R.W., and Bird, P.H, 1999, Identification of water-bearing fractures by the use of geophysical logs, May to July 1998, former Naval Air Warfare Center, Bucks County, Pennsylvania: U.S. Geological Survey Open-File Report 99–215, 27 p., accessed August 8, 2023, at https://doi.org/10.3133/ofr99215.
Delaware River Basin Commission, 2023, Southeastern Pa. groundwater protected area (SEPA-GWPA): Delaware River Basin Commission web page, accessed September 12, 2023, at https://www.nj.gov/drbc/programs/project/gwpa-data.html.
Delaware Valley Regional Planning Commission, 2016, DVRPC 2015 digital orthoimagery for southeast Pennsylvania: Pennsylvania Spatial Data Access web page, Tile PA_X26_Y101, accessed May 25, 2018, at https://maps.psiee.psu.edu/ImageryNavigator/.
EA Engineering, Science, and Technology, Inc., 2008, Extraction well S-1 operation and maintenance manual, long-term remedial Actions (OU-2) North Penn Area 1 Superfund Site, Souderton, Pennsylvania: U.S Environmental Protection Agency, prepared by EA Engineering, Science, and Technology, Inc. under contract no. EP–S3–07–07.
Goode, D.J., 2016, Map visualization of groundwater withdrawals at the sub-basin scale: Hydrogeology Journal, v. 24, no. 4, p. 1057–1065, accessed May 1, 2018, at https://doi.org/10.1007/s10040-016-1379-x.
Goode, D.J. and Senior L.A., 2000, Simulation of aquifer tests and ground-water flowpaths at the local scale in fractured shales and sandstones of the Brunswick Group and Lockatong Formation, Lansdale, Montgomery County, Pennsylvania: U.S. Geological Survey Open-File Report 2000-97, 46 p., accessed June 3, 2024, at https://doi.org/10.3133/ofr0097.
Greenman, D.W., 1955, Ground water resources of Bucks County, Pennsylvania: Pennsylvania Topographic and Geologic Survey, 4th ser., Bulletin W11, 66 p., 1 pl. [Also available at https://maps.dcnr.pa.gov/publications/Default.aspx?id=128.]
Izbicki, J.A., Christensen, A.H., Hanson, R.T., Martin, P., Crawford, S.M., and Smith, G.A., 1999, U.S. Geological Survey combined well-bore flow and depth-dependent water sampler: U.S. Geological Survey Fact Sheet 196–99, 2 p., accessed June 3, 2024, at https://doi.org/10.3133/fs19699.
Lewis, J.C., 1992, Effect of anisotropy on ground-water dis charge to streams in fractured Mesozoic-basin rocks, in Hotchkiss, W.R., and Johnson, A.I., eds., Regional aquifer systems of the United States—Aquifers of the southern and eastern states—American Water Resources Association 27th annual conference and symposium, New Orleans, La., September 8–13, 1991: Bethesda, Md., American Water Resources Association Monograph Series, no. 17, p. 93–106.
Longwill, S.M., and Wood, C.R., 1965, Ground-water resources of the Brunswick Formation in Montgomery and Berks Counties, Pennsylvania: Pennsylvania Geological Survey, 4th ser., Water Resources Report W22, 59 p. [Also available at https://archive.org/details/groundwaterresou00long.]
Low, D.J., Hippe, D.J., and Yannacci, D., 2002, Geohydrology of southeastern Pennsylvania: U.S. Geological Survey Water-Resources Investigation Report 2002–4166, 347 p., accessed July 6, 2023, at https://doi.org/10.3133/wri004166.
Lyttle, P.T., and Epstein, J.B., 1987, Geologic map of the Newark 1 degree by 2 degrees Quadrangle, New Jersey, Pennsylvania, and New York: U.S. Geological Survey Miscellaneous Investigations Series Map I–1715, 1 sheet, scale 1:250,000, accessed July 5, 2023, at https://doi.org/10.3133/i1715.
Minnesota Pollution Control Agency, 2006, Natural attenuation of chlorinated solvents in ground water (revised June 2006): Minnesota Pollution Control Agency, 49 p., accessed February 16, 2024, at https://www.pca.state.mn.us/sites/default/files/c-s4-05.pdf.
National Oceanic and Atmospheric Administration, 2024a, Climate at a Glance County Time Series, Montgomery County, Pennsylvania: National Oceanic and Atmospheric Administration National Centers for Environmental Information, accessed April 3, 2024, at https://www.ncei.noaa.gov/access/monitoring/climate-at-a-glance/county/time-series/PA-091/pcp/ann/12/1895-2023?base_prd=true&begbaseyear=1901&endbasey ear=2022.
National Oceanic and Atmospheric Administration, 2024b, Daily summaries station details for Doylestown Airport, PA US: National Oceanic and Atmospheric Administration National Centers for Environmental Information, accessed December 10, 2024, at https://www.ncei.noaa.gov/cdo-web/datasets/GHCND/stations/GHCND:USW00054786/detail.
Newport, T.A., 1971, Ground-water resources of Montgomery County, Pennsylvania: Pennsylvania Geological Survey, 4th ser., Water Resource Report W29, 83 p., 2 pls. [Also available at https://archive.org/details/groundwaterresou00newp.]
PAMAP, 2015a, PAMAP_DEM_mosaic_Bucks_1m: Pennsylvania Spatial Data Access dataset, accessed May 9, 2024, at https://www.pasda.psu.edu/download/pamap/LidarMosaics/CountyMosaics/county_DEM_1M/.
PAMAP, 2015b, PAMAP_DEM_mosaic_Montgomery_1m: Pennsylvania Spatial Data Access dataset, accessed May 9, 2024, at https://www.pasda.psu.edu/download/pamap/LidarMosaics/CountyMosaics/county_DEM_1M/.
Paulachok, G.N., 1986, Temperature of ground water at Philadelphia, Pennsylvania, 1979–1981: U.S. Geological Survey Water-Resources Investigations Report 84–4189, 14 p., accessed February 29, 2024, at https://doi.org/10.3133/wri844189.
Pennsylvania Bureau of Topographic and Geologic Survey, 2001, Bedrock geology of Pennsylvania, vector digital data, accessed April 20, 2023, at https://www.pasda.psu.edu/uci/DataSummary.aspx?dataset=480.
Pennsylvania Bureau of Topographic and Geologic Survey, 2008a, Physiographic Provinces, vector digital data, accessed November 30, 2016, at https://www.pasda.psu.edu/uci/DataSummary.aspx?dataset=1153.
Pennsylvania Bureau of Topographic and Geologic Survey, 2008b, Physiographic Sections, vector digital data, accessed November 30, 2016, at https://www.pasda.psu.edu/uci/DataSummary.aspx?dataset=1154.
Pennsylvania Department of Environmental Protection, 2018, Water reports: Pennsylvania Department of Environmental Protection web page, accessed May 2, 2018, at https://www.dep.pa.gov/DataandTools/Reports/Pages/Water.aspx.
Pennsylvania Department of Environmental Protection, 2023, Water reports: Pennsylvania Department of Environmental Protection web page, accessed September 2023, at https://www.dep.pa.gov/DataandTools/Reports/Pages/Water.aspx.
Reese, S.O., and Risser, D.W., 2010, Summary of groundwater-recharge estimates for Pennsylvania: Pennsylvania Geological Survey, 4th ser., Water Resource Report 70, 18 p., 6 pls., scale 1:2,000,000. [Also available at maps.dcnr.pa.gov/publications/Default.aspx?id=528.]
Reynolds, R.J., Anderson, J.A., and Williams, J.H., 2015, Geophysical log analysis of selected test and residential wells at the Shenandoah Road National Superfund Site, East Fishkill, Dutchess County, New York: U.S. Geological Survey Scientific Investigations Report 2014–5228, 30 p., accessed August 7, 2023, at https://doi.org/10.3133/sir20145228.
Risser, D.W., and Bird, P.H., 2003, Aquifer tests and simulation of ground-water flow in Triassic sedimentary rocks near Colmar, Bucks and Montgomery Counties, Pennsylvania: U.S. Geological Survey Water-Resources Investigations Report 03–4159, 73 p. [Also available at https://pubs.er.usgs.gov/publication/wri034159.]
Risser, D.W., Thompson, R.E., and Stuckey, M.H., 2008, Regression method for estimating long-term mean annual ground-water recharge rates from base flow in Pennsylvania: U.S. Geological Survey Scientific Investigations Report 2008–5185, 23 p., accessed July 14, 2021, at https://pubs.usgs.gov/sir/2008/5185/pdf/sir2008-5185.pdf.
Rohatgi, A., 2024, WebPlotDigitizer (version 5): Automeris LLC software release, accessed May 13, 2024, at https://automeris.io/WebPlotDigitizer.html.
Senior, L.A., Anderson, J.A., and Bird, P.H., 2021, Geophysical and video logs of selected wells at and near the former Naval Air Warfare Center Warminster, Bucks County, Pennsylvania, 2017–19: U.S. Geological Survey Open-File Report 2021–1025, 92 p., accessed August 7, 2023, at https://doi.org/10.3133/ofr20211025.
Senior, L.A., Conger, R.W., and Bird, P.H., 2008, Geophysical logs, aquifer tests, and water levels in wells in and near the North Penn Area 7 Superfund Site, Upper Gwynedd Township, Montgomery County, Pennsylvania, 2002–06: U.S. Geological Survey Scientific Investigations Report 2008–5154, 277 p., accessed August 7, 2023, at https://doi.org/10.3133/sir20085154.
Senior, L.A., and Goode, D.J., 1999, Ground-water system, estimation of aquifer hydraulic properties, and effects of pumping on ground-water flow in Triassic sedimentary rocks in and near Lansdale, Pennsylvania: U.S. Geological Survey Water-Resources Investigations Report 99–4228, 112 p., accessed August 7, 2023, at https://doi.org/10.3133/wri994228.
Senior, L.A., and Goode, D.J., 2013, Investigations of groundwater system and simulation of regional groundwater flow for North Penn Area 7 Superfund site, Montgomery County, Pennsylvania: U.S. Geological Survey Scientific Investigations Report 2013–5045, 95 p., accessed April 5, 2024, at https://doi.org/10.3133/sir20135045.
Senior, L.A., and Goode, D.J., 2017, Effects of changes in pumping on regional groundwater-flow paths, 2005 and 2010, and areas contributing recharge to discharging wells, 1990–2010, in the vicinity of North Penn Area 7 Superfund site, Montgomery County, Pennsylvania: U.S. Geological Survey Scientific Investigations Report 2017–5014, 36 p., accessed April 5, 2024, at https://doi.org/10.3133/sir20175014.
Sevon, W.D., 2000, comp., Physiographic provinces of Pennsylvania: Pennsylvania Geological Survey, 4th ser., Map 13, scale 1:2,000,000, accessed January 31, 2019, at http://www.docs.dcnr.pa.gov/cs/groups/public/documents/document/dcnr_016202.pdf.
U.S. Environmental Protection Agency, 2003, First five-year review report for North Penn Area 1 Superfund Site, Souderton, Montgomery County, PA, 2003: U.S. Environmental Protection Agency, prepared by U.S. Environmental Protection Agency, Philadelphia, Pa., 18 p., accessed July 5, 2023, at https://semspub.epa.gov/work/03/468967.pdf.
U.S. Environmental Protection Agency, 2004, DNAPL Remediation—Selected projects approaching regulatory closure, EPA 542–R–04–016: U.S. Environmental Protection Agency, Office of Solid Waste and Emergency Response (5102G), [variously paged, 34 p.], accessed May 1, 2018, at https://www.epa.gov/remedytech/dnapl-remediation-selected-projects-approaching-regulatory-closure.
U.S. Environmental Protection Agency, 2008a, Second five-year review report for North Penn Area 1 Superfund Site, Souderton, Montgomery County, PA, September 2008: U.S. Environmental Protection Agency, prepared for U.S. Environmental Protection Agency, Philadelphia, Pa., 18 p., accessed July 5, 2023, at https://semspub.epa.gov/work/03/2091494.pdf.
U.S. Environmental Protection Agency, 2013, Third five-year review report for North Penn Area 1 Superfund Site, Souderton, Montgomery County, PA, September 2013: U.S. Environmental Protection Agency, prepared by U.S. Environmental Protection Agency, Region III, Philadelphia, Pa., 21 p., accessed April 25, 2023, at https://semspub.epa.gov/work/03/2180740.pdf.
U.S. Environmental Protection Agency, 2018a, Fourth five-year review report for North Penn Area 1 Superfund Site, Souderton, Montgomery County, Pennsylvania: U.S. Environmental Protection Agency, prepared by U.S. Environmental Protection Agency, Philadelphia, Pa., 18 p., accessed April 25, 2023, at https://semspub.epa.gov/work/03/2265146.pdf.
U.S. Environmental Protection Agency, 2018b, 2018 edition of the drinking water standards and health advisories tables: U.S. Environmental Protection Agency, Office of Water, Washington, D.C. Report EPA 822-F-18-001, March 2018, 12p., accessed April 25, 2023, at https://www.epa.gov/system/files/documents/2022-01/dwtable2018.pdf.
U.S. Environmental Protection Agency, 2023, Fifth five-year review report for North Penn Area 1 Superfund Site, Souderton, Montgomery County, Pennsylvania: U.S. Environmental Protection Agency, prepared by U.S. Environmental Protection Agency, Region 3, Philadelphia, Pa., 21 p., accessed August 8, 2023, at https://semspub.epa.gov/work/03/2348721.pdf.
U.S. Geological Survey, 1998, Southeastern Pennsylvania ground water protected area: U.S. Geological Survey Open-File Report 98–571, accessed August 12, 2019, at https://pubs.er.usgs.gov/publication/ofr98571.
U.S. Geological Survey, 2024a, USGS GeoLog Locator: U.S. Geological Survey website, December 4, 2024, https://doi.org/10.5066/F7X63KT0.
U.S. Geological Survey, 2024b, USGS water data for the Nation: U.S. Geological Survey database, accessed April 3, 2024, at https://doi.org/10.5066/F7P55KJN.
Vecchioli, J., 1967, Directional hydraulic behavior of a fractured-shale aquifer in New Jersey, in Karstic hydrology of regions, chap. 1.3 of Hydrology of Fractured Rocks—Proceedings of the Dubrovnik Symposium, Dubrovnik, Yugoslavia, October 1965: Paris, France, International Association of Scientific Hydrology, publication 73, v. 1, p. 318–326.
Winston, R.B., and Goode, D.J., 2017, Visualization of groundwater withdrawals: U.S. Geological Survey Open-File Report 2017–1137, 8 p., accessed May 2018, at https://doi.org/10.3133/ofr20171137.
Appendix 1. Supplementary geologic mapping, logs, and borehole deviation plots
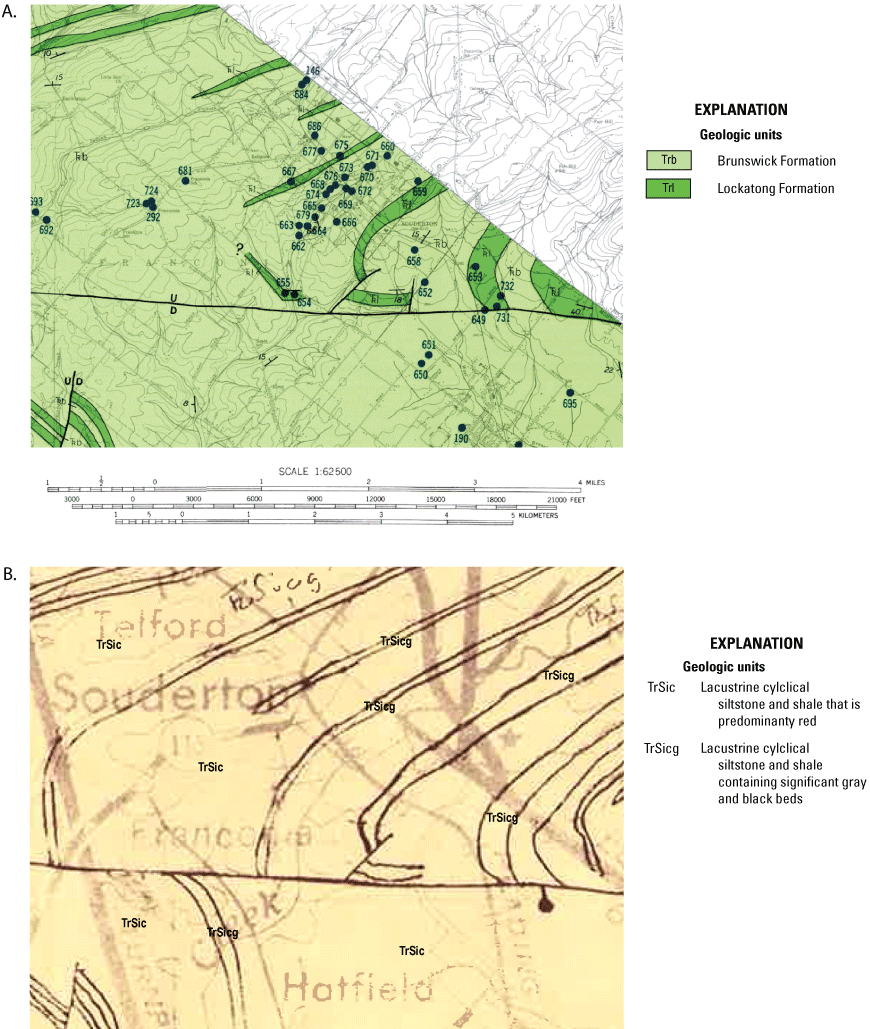
A, Existing (Longwill and Wood, 1965) and B, alternate unpublished (Joseph Smoot, U.S. Geological Survey, written commun., 2005) geologic mapping. Location of the map area shown in figure 3A.
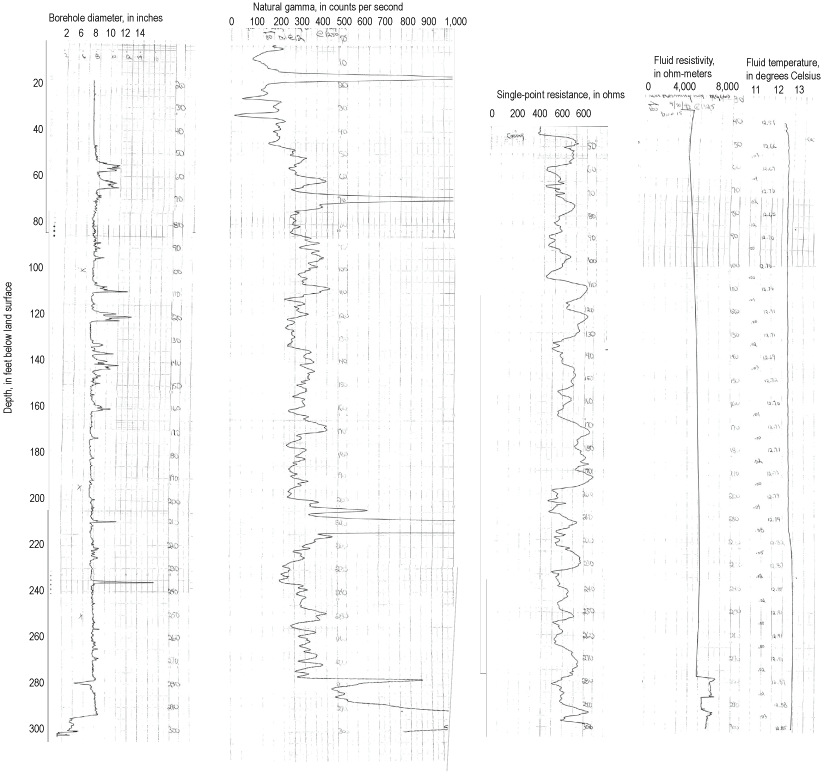
Scanned of geophysical logs collected by the U.S. Geological Survey in well MG 665 (S-9; table 1) in 1992.
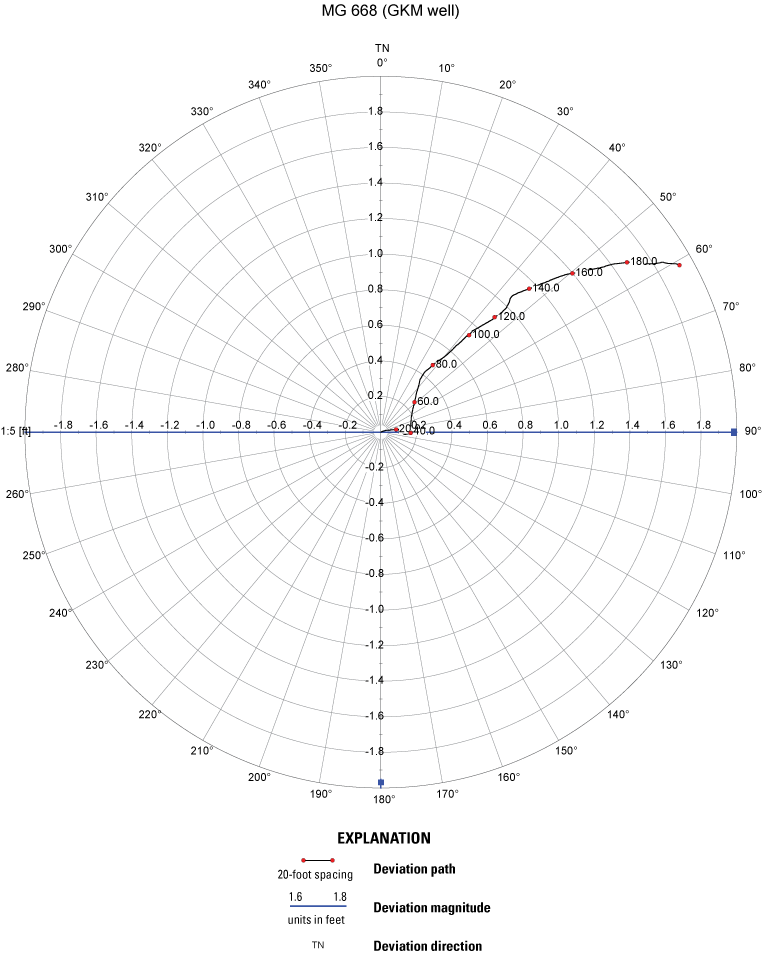
Borehole deviation plot for well MG 668 (Granite Knitting Mill; table 1).
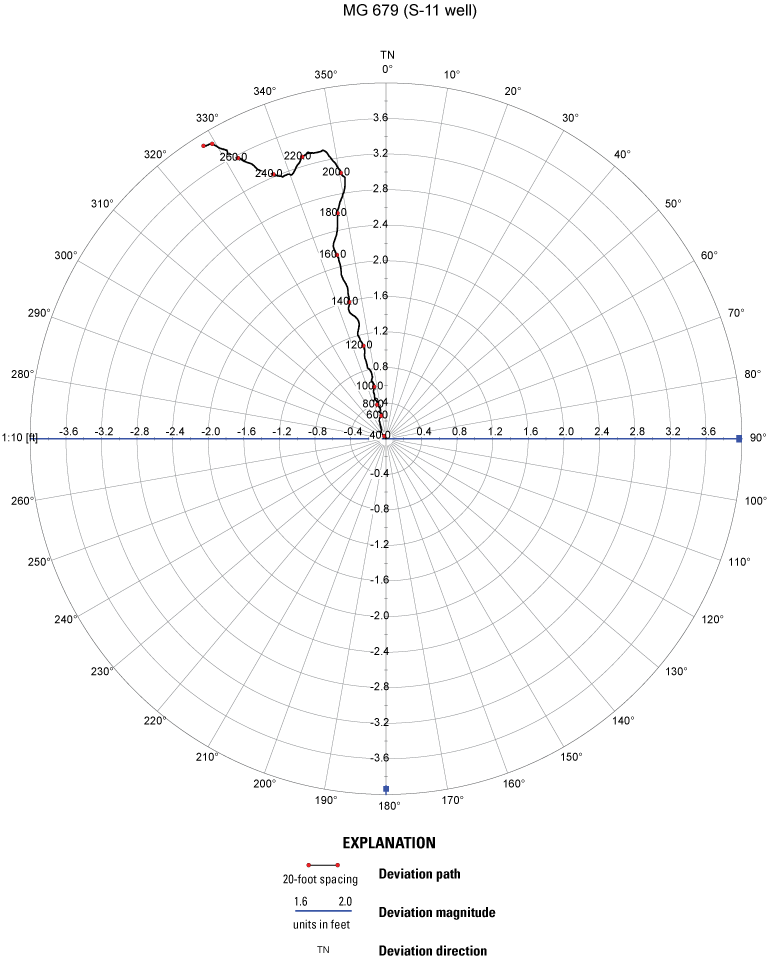
Borehole deviation plot for well MG 679 (S-11; table 1).
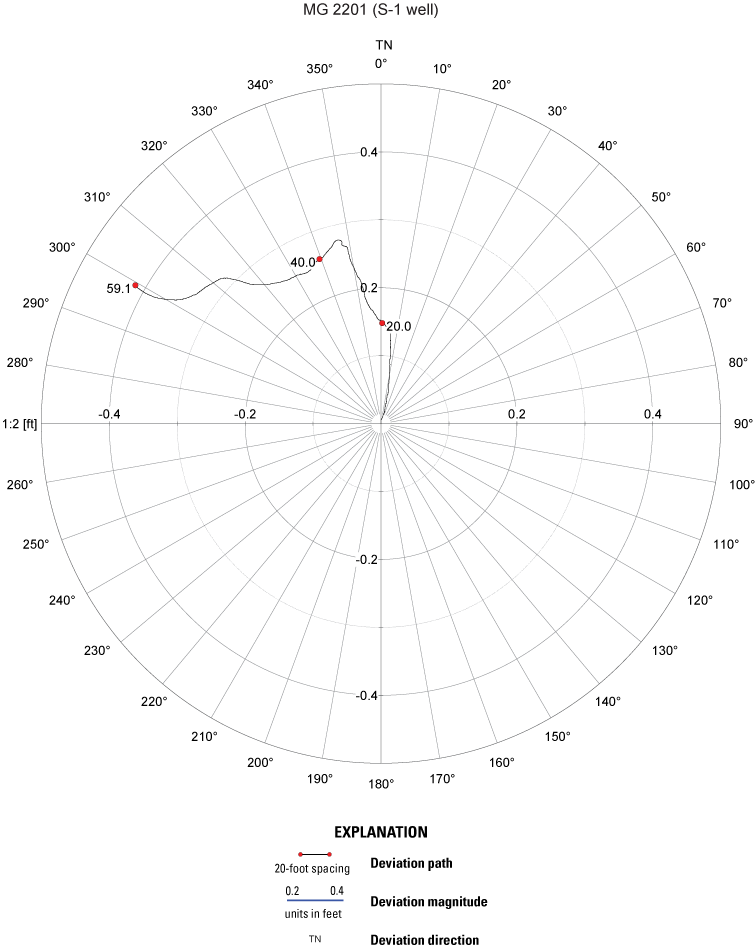
Borehole deviation plot for well MG 2201 (S-1; table 1).
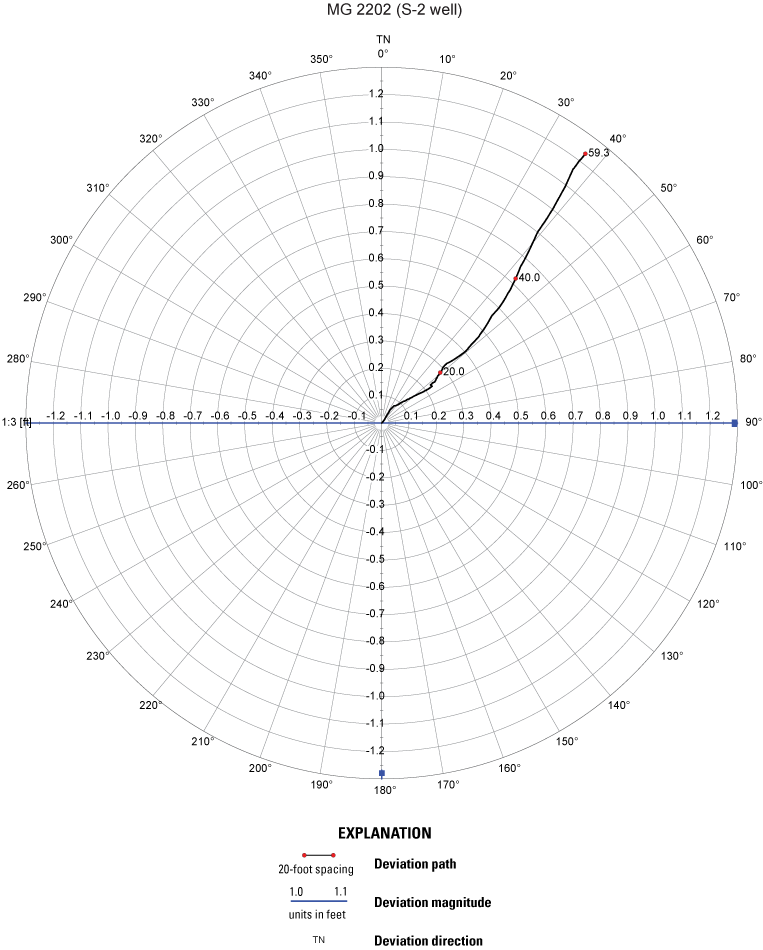
Borehole deviation plot for well MG 2202 (S-2; table 1).
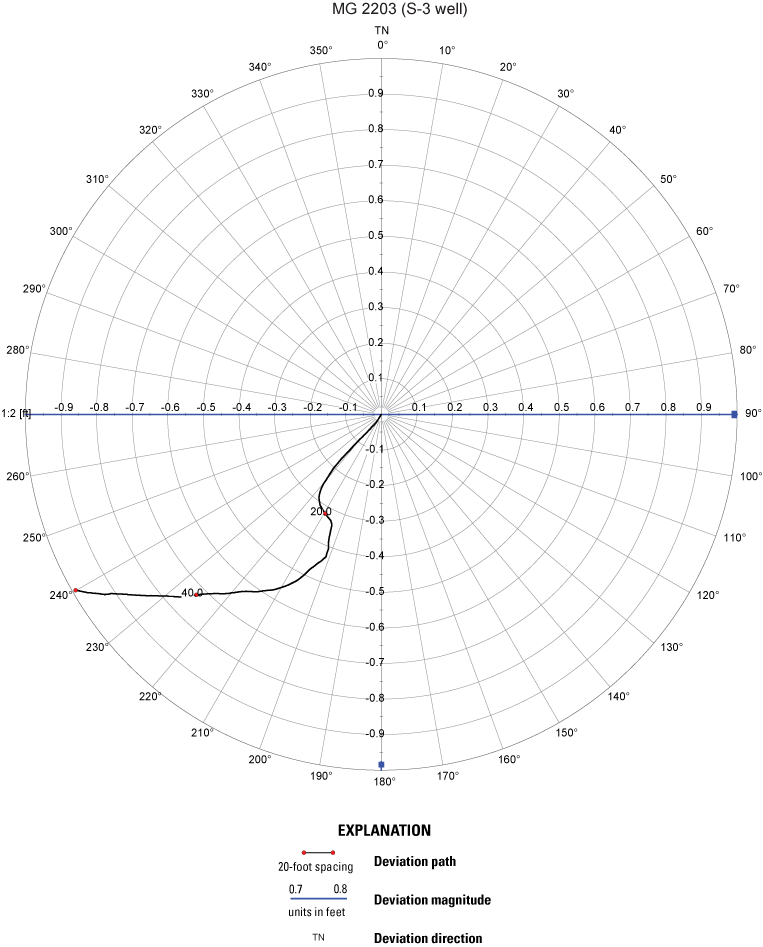
Borehole deviation plot for well MG 2203 (S-3; table 1).
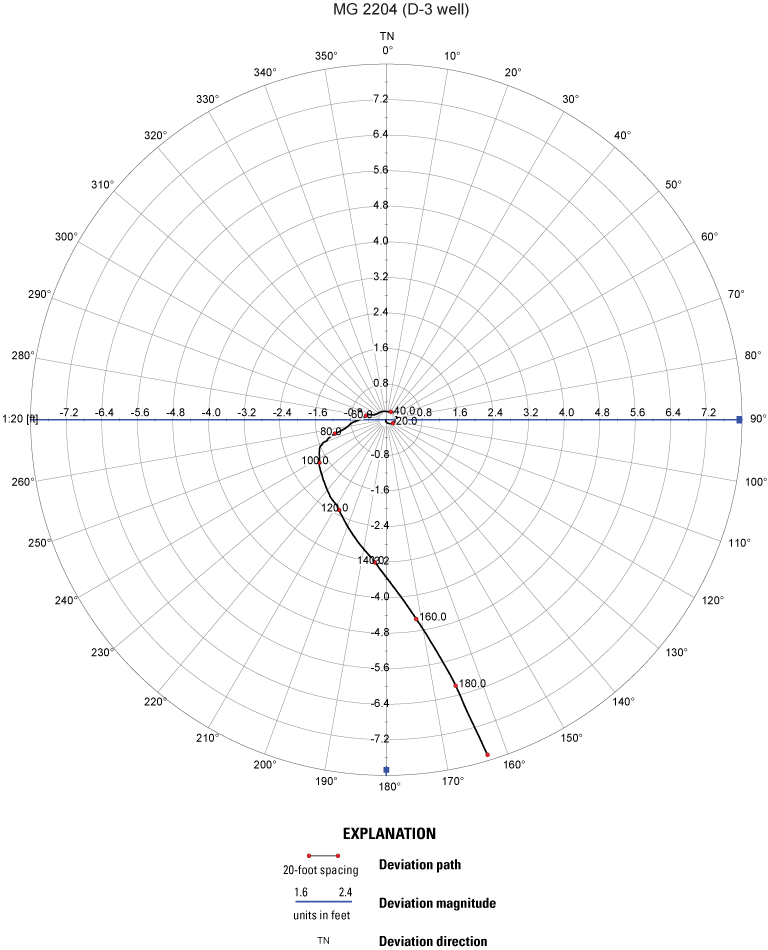
Borehole deviation plot for well MG 2204 (D-3; table 1).
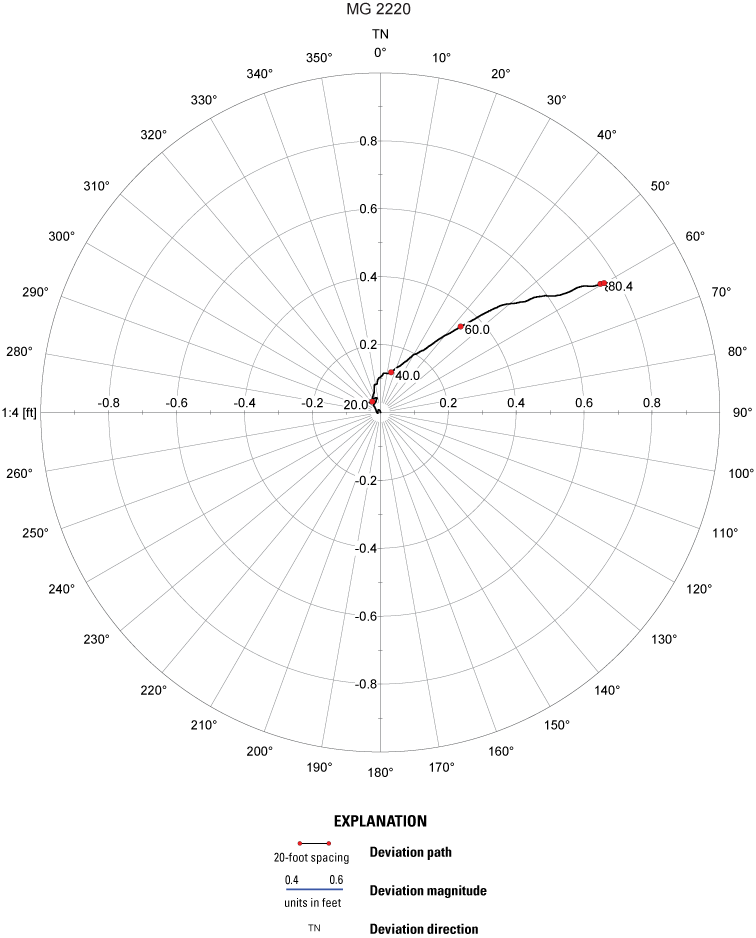
Borehole deviation plot for well MG 2220 (table 1).
Reference Cited
Longwill, S.M., and Wood, C.R., 1965, Ground-water resources of the Brunswick Formation in Montgomery and Berks Counties, Pennsylvania: Pennsylvania Geological Survey, 4th ser., Water Resources Report W22, 59 p. [Also available at https://archive.org/details/groundwaterresou00long.]
Conversion Factors
U.S. customary units to International System of Units
Temperature in degrees Celsius (°C) may be converted to degrees Fahrenheit (°F) as follows:
°F = (1.8 × °C) + 32.
Temperature in degrees Fahrenheit (°F) may be converted to degrees Celsius (°C) as follows:
°C = (°F – 32) / 1.8.
Datums
Vertical coordinate information is referenced to the North American Vertical Datum of 1988 (NAVD 88).
Horizontal coordinate information is referenced to the North American Datum of 1983 (NAD 83).
Altitude, as used in this report, refers to distance above the vertical datum.
Supplemental Information
Specific conductance is in microsiemens per centimeter at 25 degrees Celsius (µS/cm at 25 °C).
Concentrations of chemical constituents in water are in either milligrams per liter (mg/L) or micrograms per liter (µg/L).
One milligram per liter is equivalent to one part per million (ppm), and one microgram per liter in equivalent to one part per billion (ppb).
Depths of geophysical and video logs are referenced to feet below land surface (ft bls) or feet below grassy slope (ft bgs).
Types of, and units for, various geophysical logs are given in abbreviations on log figures and include the following: natural gamma (Nat Gamma) in counts per second (cps); single-point resistance (SPR), in Ohms; Fluid resistivity (FRes), in Ohm-meters (Ohm-m); fluid temperature (FTemp), in degrees Celsius (deg C); and acoustic televiewer (ATV), displayed horizontally in degrees relative to magnetic north (MN). Heat-pulse flowmeter (H-P) or electromagnetic (EM) measurements of vertical borehole flow are given in gallons per minute (gal/min), with flow measured under ambient (amb) or pumping (pmp) conditions.
Abbreviations
ATV
acoustic televiewer
DCE
dichloroethene
EPA
U.S. Environmental Protection Agency
GKM
Granite Knitting Mill
MCL
maximum contaminant level
NPWA
North Penn Water Authority
PADEP
Pennsylvania Department of Environmental Protection
PCE
tetrachloroethylene
RI
remedial investigation
ROD
Record of Decision
TCE
trichloroethylene
USGS
U.S. Geological Survey
VOC
volatile organic compounds
For more information about this report, contact:
Director, Pennsylvania Water Science Center
U.S. Geological Survey
215 Limekiln Road
New Cumberland, Pennsylvania 17070
Or visit our website at
https://www.usgs.gov/centers/pennsylvania-water-science-center.
Publishing support provided by the Baltimore Publishing Service Center
Disclaimers
Any use of trade, firm, or product names is for descriptive purposes only and does not imply endorsement by the U.S. Government.
Although this information product, for the most part, is in the public domain, it also may contain copyrighted materials as noted in the text. Permission to reproduce copyrighted items must be secured from the copyright owner.
Suggested Citation
Senior, L.A., Risser, D.W., Goode, D.J., and Bird, P.H., 2024, Hydrologic investigations and a preliminary conceptual model of the groundwater system at North Penn Area 1 Superfund Site, Souderton, Montgomery County, Pennsylvania: U.S. Geological Survey Open-File Report 2024–1080, 78 p., https://doi.org/10.3133/ofr20241080.
ISSN: 2331-1258 (online)
Study Area
| Publication type | Report |
|---|---|
| Publication Subtype | USGS Numbered Series |
| Title | Hydrologic investigations and a preliminary conceptual model of the groundwater system at North Penn Area 1 Superfund Site, Souderton, Montgomery County, Pennsylvania |
| Series title | Open-File Report |
| Series number | 2024-1080 |
| DOI | 10.3133/ofr20241080 |
| Publication Date | December 30, 2024 |
| Year Published | 2024 |
| Language | English |
| Publisher | U.S. Geological Survey |
| Publisher location | Reston, VA |
| Contributing office(s) | Pennsylvania Water Science Center |
| Description | xi, 78 p. |
| Country | United States |
| State | Pennsylvania |
| County | Montgomery County |
| City | Souderton |
| Other Geospatial | North Penn Area 1 Superfund Site |
| Online Only (Y/N) | Y |
| Additional Online Files (Y/N) | N |