

Black Abalone Surveys at Naval Base Ventura County, San Nicolas Island, California—2022 Annual Report
Links
- Document: Report (4 MB pdf) , HTML , XML
- Related Work: Open-File Report 2025-1015 - Black abalone (Haliotis cracherodii) population density, recruitment, size structure, and population growth at Naval Base Ventura County, San Nicolas Island, California, 2013–22
- Download citation as: RIS | Dublin Core
Acknowledgments
We would like to thank the U.S. Navy for funding and facilitating this research project. Additional funding was received from the National Marine Fisheries Service. We also would like to thank our 2022 U.S. Geological Survey volunteer field assistants: Kris VanBlaricom, Jacquie Kramm, and especially, Ken Collins. Finally, thanks to Melissa Miner (University of California, Santa Cruz) and Melissa Neuman (National Marine Fisheries Service) for their constructive comments on an earlier draft of this report.
Abstract
The U.S. Geological Survey monitors a suite of intertidal black abalone (Haliotis cracherodii) sites at San Nicolas Island, California, in cooperation with the U.S. Navy, which owns the island. The nine rocky intertidal sites were established in 1980 to study the potential effect of translocated southern sea otters (Enhydra lutris nereis) on the intertidal black abalone population at San Nicolas Island. The sites were monitored, typically annually or biennially, from 1981 to 1997. Monitoring resumed in 2001 and has been completed annually thereafter. Since 2018, the monitoring has been carried out by the U.S. Geological Survey Western Ecological Research Center. The study sites became particularly important from a management perspective after a virulent disease decimated black abalone populations throughout southern California beginning in the mid-1980s. The disease, withering syndrome, was first observed on San Nicolas Island in 1992, and during the next few years, withering syndrome reduced the black abalone population on San Nicolas Island by more than 99 percent. The black abalone was subsequently listed as endangered under the Endangered Species Act in 2009.
The subject of this report is the 2022 survey of the sites and the status of the measured population of black abalone in comparison to long-term patterns (based on data collected since 1981) at San Nicolas Island. Between the years 2000 and 2022, the total monitored black abalone population on the island has grown from roughly 200 to more than 2,000, approximately a ten-fold increase following the disease-related decline. Since it was first consistently measured in 2005, the distance between adjacent black abalone has decreased substantially from approximately 50 centimeters to less than 15 centimeters, indicating that black abalone are sufficiently close together at several of the sites to reproduce successfully. The total black abalone count in 2022 was 2,156, which was 7.9 percent lower than the total count in 2020 but 6.6 percent higher than in 2021. There were increases and decreases among the sites and transects within each site in 2022, but six of the nine sites had higher counts than in the previous year. The 2022 count is one of the highest since 1993, second only to the 2020 count. In 2022, the annual recruitment rate, defined as the percentage of measured black abalone with a shell length of 3 centimeters or less, was the second highest recorded, only slightly less than in 2017.
Introduction
This report focuses on the black abalone surveys performed in 2022 on monitoring sites at San Nicolas Island, a part of Naval Base Ventura County. The U.S. Geological Survey (USGS) conducted the surveys in cooperation with the U.S. Navy. The text, tables, and figures from Kenner and Yee (2022) are updated herein to include the 2022 data and examine the status of the measured population of black abalone in comparison to long-term patterns (based on data collected since 1981). In this section, we introduce the black abalone and discuss its reproduction and the devastating disease that has imperiled black abalone populations in California. A history of the San Nicolas Island black abalone monitoring project is also presented for context.
Haliotis
The black abalone (Haliotis cracherodii) is one of seven species of Haliotis endemic to the west coast of North America and present in California waters (California Department of Fish and Game, 2004). The other Haliotis species that are native to California are the green abalone (H. fulgens), the red abalone (H. rufescens), the pink abalone (H. corrugata), the white abalone (H. sorenseni), the pinto abalone (H. kamtschatkana), and the flat abalone (H. walallensis). There are 55 species and several subspecies of Haliotis recognized worldwide by the Integrated Taxonomic Information System (ITIS, www.ITIS.gov) and World Registry of Marine Species (WoRMS, www.marinespecies.org). The genus consists of prosobranch gastropods typified by ear-shaped shells that are perforated by several small spiracle holes. The shells are prized for their iridescent pearly appearance and have been used in jewelry, decorations, and even tools for millennia (Morris and others, 1980; Rick and others, 2002). Historically, abalone meat has commanded high prices because the large muscular foot of the invertebrate is considered a delicacy. Though varying considerably in size, several of the abalone species in California are large for gastropods, with maximum shell lengths ranging from 20 to almost 30 centimeters (cm) depending on species. Of the seven species, only the flat abalone was not extensively fished, and although black abalone are considered inferior because of their tougher flesh, ease of availability in the intertidal made them a favorite of indigenous tribes inhabiting the Channel Islands of California (Haas and others, 2019). Later, black abalone sustained a recreational and commercial fishery until the 1990s. The annual commercial take for black abalone peaked in 1973 at about 873,000 kilograms (kg) or a little under 2 million pounds (California Department of Fish and Game, 2004).
Black abalone inhabit rocky shores from the high intertidal to a depth of approximately 6 meters (m), which is shallower than the other local Haliotis species. The range of the black abalone extends from Point Arena, California, to Isla de Cedros, Baja California Sur, Mexico, but they are most abundant from central California southward (VanBlaricom and others, 2009). Smaller black abalone feed on algal and diatom films (National Marine Fisheries Service, 2020), whereas larger individuals are thought to feed mainly on drift kelp such as Macrocystis pyrifera, Egregia menziesii, and Eisenia arborea (VanBlaricom and Kenner, 2020). Black abalone can attain a shell length of up to 20 cm. In addition to humans, natural predators of the black abalone include octopuses (Octopus spp.), sea stars (especially Pisaster ochraceus), cabezon (Scorpaenichthys marmoratus), and sea otters (Enhydra lutris; Morris and others, 1980). Black abalone are relatively sedentary, and some large specimens can go years without apparent movement. However, VanBlaricom and others (2009) reported that smaller individuals are more mobile and capable of movement on the order of several centimeters to a few meters in a day.
Reproduction
Like many marine invertebrates, black abalone reproduce by broadcast spawning, a reproductive strategy in which mature male and female individuals release large numbers of gametes into the environment with no mutual physical contact necessary. Successful fertilization likely requires temporal synchrony and relatively close spatial proximity. Although several studies have concluded that black abalone populations spawn in late summer (Boolootian and others, 1962; Leighton and Boolootian, 1963; Webber and Giese, 1969), the actual trigger for spawning is unknown. In fact, unlike several other species of Haliotis, spawning of H. cracherodii in the laboratory has been met with limited success.
Black abalone, as noted in the previous section, are somewhat sedentary and do not aggregate to spawn, so the density and distribution of individuals in abalone populations are of interest in assessing population viability. Because gamete concentration diminishes precipitously with the distance from their source, the proximity of spawning individuals is central to successful fertilization; however, there are many confounding factors to consider when attempting to calculate critical reproductive distance in intertidal organisms such as turbulence, channeling of water through crevices, and residency time of gametes in pools (Blaud, 2013). Distances greater than a few meters between black abalone likely result in reduced reproductive success compared with shorter distances (VanBlaricom and others, 2009), and average adult densities below 0.34 per square meter (m2) led to recruitment failure in some populations (Neuman and others, 2010). A positive correlation between adult black abalone density and the presence of juveniles has been shown with no significant recruitment at densities less than one adult per m2 (Miner and others, 2006). Abalone produce non-feeding larvae with a relatively short larval planktonic period. For this reason, bolstered by genetic evidence, it is thought that black abalone likely disperse relatively short distances (Chambers and others, 2006).
Withering Syndrome
Withering syndrome (WS) is a disease that affects many species of Haliotis and results in atrophy of the foot and a diminished ability to cling to hard substrate. Animals showing signs of WS undergo body shrinkage as the disease progresses because of a combination of reduced food intake and changes in the structure of the digestive gland. The progressive degeneration eventually leads to death. The causative agent has been identified as a Rickettsiales-like prokaryotic organism (often referred to in the literature as “RLO”), specifically Candidatus Xenohaliotis californiensis (CaXc; Friedman and others, 2002). Withering syndrome (WS) was first observed in black abalone at the Channel Islands of California. Beginning at Santa Cruz Island in 1985, WS spread through the Channel Islands during the next few years, arriving at San Nicolas Island in 1992 (Lafferty and Kuris, 1993; VanBlaricom and others, 1993).
Black abalone populations in southern California declined by more than 95 percent after infection with WS, which has since moved into central California populations and has caused serious levels of mortality (Neuman and others, 2010). Although CaXc has been detected in black abalone throughout the species’ entire range, populations north of San Luis Obispo County have not experienced the high levels of mortality associated with WS in coastal areas to the south (National Marine Fisheries Service, 2020). Elevated water temperatures may accelerate disease transmission and mortality rates (Raimondi and others, 2002). Friedman and others (2014) indicated that there may now be genetic resistance to the WS infection in some black abalone populations on San Nicolas Island. More conclusively, they discovered a viral bacteriophage that infects CaXc and provides some protection from the disease. The effectiveness of genetic resistance and viral bacteriophages at protecting wild populations is still unknown.
The National Marine Fisheries Service (NMFS) listed H. cracherodii as an endangered species in January 2009. This action was taken to address concerns about the serial near-extirpation of populations in southern California and Mexico, the continued movement of WS northward, and potential recruitment failures (74 Federal Register [FR] 1937, January 14, 2009; National Oceanic and Atmospheric Administration, 2009).
In their critical habitat designation for the black abalone, the NMFS excluded San Nicolas Island because of revisions in the Navy’s Integrated Natural Resource Management Plan (INRMP) that provide conservation and recovery benefits to black abalone (76 FR 66806, October 27, 2011; National Oceanic and Atmospheric Administration, 2011). One of the management strategies for marine invertebrates set forth in the INRMP was to “Promote and discuss current long-term monitoring of black abalone populations established in the late 1970s (VanBlaricom and others, 1993) and ensure that survey information on existing populations and trends are made available to the general scientific community” (U.S. Navy, 2015).
Project History
Sites were established for monitoring black abalone on San Nicolas Island in 1980 (fig. 1) and first sampled in 1981 by Glenn VanBlaricom, then of the U.S. Fish and Wildlife Service. Throughout the rest of the report, unless otherwise specified, the term “abalone” will refer specifically to “black abalone.” From 1981 to 1997, with a few exceptions, all sites were sampled by counting abalone during 10 cycles that each took 1 to 2 years to complete. Transect 4 and one-third of transect 1 at site 7 were not sampled in cycle 1, and transect 6 at site 1 and sites 3 and 8 were not sampled in cycle 2. Sampling was suspended from 1998 to 2000 because of an interruption in funding, but resumed in 2001.
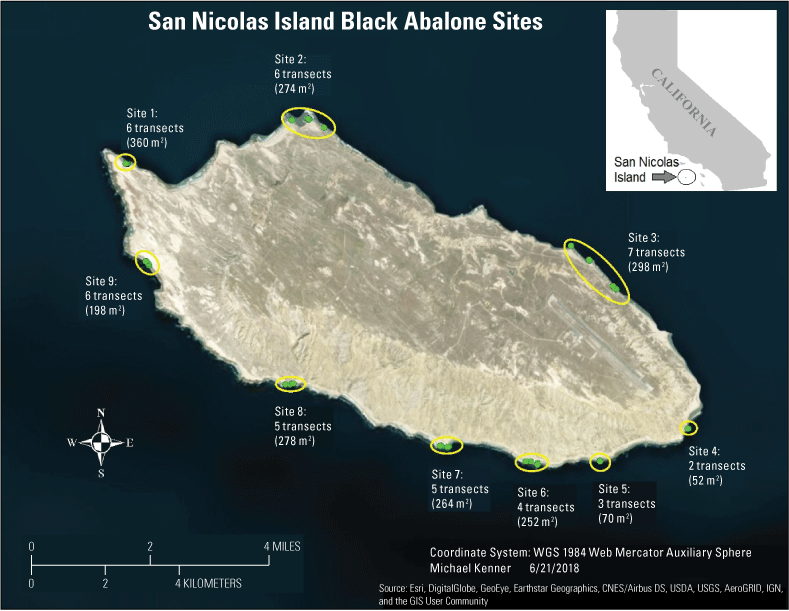
Monitoring sites for black abalone (Haliotis cracherodii) on San Nicolas Island, California, showing location, number of transects, and total sampling area at each site for surveys completed, 1981–2022. Abbreviations: CNES/Airbus DS, National Centre for Space Studies/Airbus Defense and Space; IGN, Institut Geographique National; m2, square meters; USDA, U.S. Department of Agriculture; USGS, U.S. Geological Survey; WGS 1984, World Geodetic System of 1984.
During the 1980s and 1990s, measurements of shell length were collected opportunistically. Samples of 100 or more abalone were measured during several cycles between 1983 and 1993, resulting in nearly 3,400 measurements made from 2 to 4 cycles at each site. On randomly selected transects at each site and beginning at a randomly chosen quadrat and direction, all accessible abalone were measured to the nearest millimeter (mm) until a sample size of at least 100 animals were measured on the site (VanBlaricom, 1993; Glenn VanBlaricom, retired U.S. Geological Survey employee, written commun., 2020).
Since the resumption of surveys in 2001, sampling of all sites has been completed every year, and all black abalone within reach have been measured (or at least 200 per site where numerous). The nearest neighbor distances for abalone (distance to the closest conspecific) were measured consistently beginning in 2005. All sampling trips through 2017 were led by Glenn VanBlaricom of the USGS. Monitoring cycles during 2018–22 were supported by the U.S. Navy and led by M.C. Kenner (USGS). Additional support was received from the National Marine Fisheries Service since 2021. The 2022 field season represented the 32nd cycle of sampling the sites since they were established. A timeline of significant events is shown in figure 2.
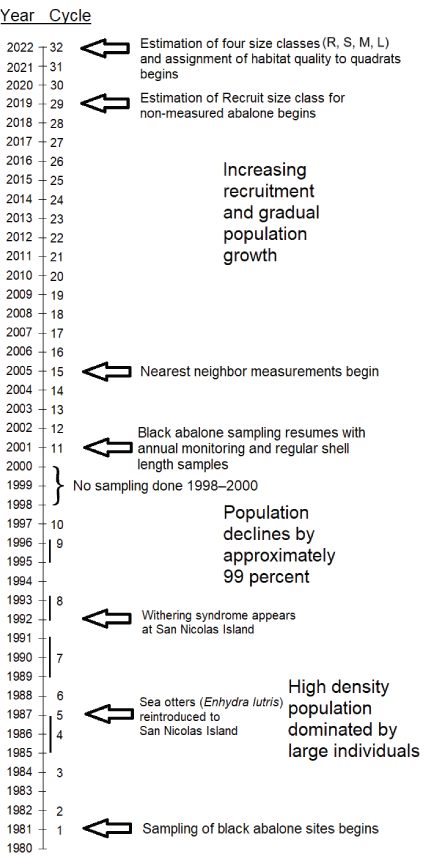
A timeline of sampling cycles with arrows indicating the timing of major changes in sampling or changes in black abalone (Haliotis cracherodii) populations at San Nicolas Island, California. Bars along the line indicate cycles that occurred during a period longer than 1 year. No sampling was done in 1998–2000. Size class abbreviations: R, recruits; S, small; M, medium; and L, large.
The original impetus for monitoring abalone at San Nicolas Island was the planned reintroduction of the southern sea otter (Enhydra lutris nereis), a top marine carnivore that feeds almost exclusively on shellfish (VanBlaricom, 1993). The southern sea otter historically lived at San Nicolas Island but had been absent from the island for nearly a century because of overhunting. Between 1987 and 1990, 139 sea otters were translocated to San Nicolas Island from the central California coast population (Rathbun and others, 2000). Sea otters (Enhydra lutris) in much of their reoccupied range have substantially decreased subtidal red abalone populations, driving them below commercially viable levels (Watson, 2000). However, the potential effect of sea otter predation on intertidal abalone populations was uncertain because sea otters do not regularly use the intertidal zone for foraging (VanBlaricom, 1993).
During the first 10 years of monitoring, abalone were densely aggregated at the sites, with mean site densities ranging from about 4 to 28 per m2 and with some 1-m2 quadrats having more than 100 abalone stacked several individuals deep (M.C. Kenner, U.S. Geological Survey, unpub. data, 2019).1 Whether these densities were a natural or normal baseline is debatable because of major changes at San Nicolas Island over the prior century. Pressure from sea otter foraging was removed because of the otter population’s extirpation by fur hunters in the 19th and early 20th centuries (VanBlaricom, 1993). Furthermore, human harvest that had been part of the system for millennia, was greatly reduced after the removal of indigenous people from San Nicolas Island in 1835. The establishment of active military control of the island in 1942 likely reduced access for most commercial and sport take (U.S. Navy, 2015).
At the time of publication, data were not available from the U.S. Navy.
Disease, not sea otter predation, caused the abalone populations at San Nicolas Island to dramatically decline. From the time WS appeared at San Nicolas Island in 1992 until 2001, when regular annual sampling resumed, the population among the nine monitoring sites was reduced by more than 99 percent (Kenner and Yee, 2022).
Methods
In this section, field methods used to track abalone density, population growth, recruitment, and distribution are explained. Statistical methods used to analyze changes in population growth rate are also explained.
Surveys
There are nine abalone monitoring sites distributed around the island, and each monitoring site consists of two to seven permanent transects (fig. 1) that range in length from 7 to 40 m (table 1) depending on the availability of suitable habitat. These transects were established in areas that supported high densities of abalone in 1980 (VanBlaricom, 1993) and are distributed around the island with a range of swell and current exposures. The transects are useful for tracking changes in density, spatial distribution, and size distribution, but because transects were specifically established in areas where abalone were most dense and were not randomly placed, they cannot be used to estimate an island-wide population size or density. The transects are marked by multiple stainless-steel eyebolts, typically 5–10 m apart, that are epoxied into holes drilled in the substrate. During surveys, a meter tape is attached to the eyebolts, and a 2-m-wide area centered on the transect is surveyed along the length of the transect. To provide better repeatability of effort and allow for finer-scale data assessments, the belt transects are further divided into 1-m2 quadrats on either side of the transect tape so that a 30-m transect has 60 quadrats and samples 60 m2 of area. The only exceptions are at site 2, where transects 3 and 4 are treated as 1-m wide because the transect tapes there each run along a single crevice for their entire length. The total sampled area for all nine sites is 2,054 m2. However, the actual surface area sampled is much greater because of the heterogeneity of the rocky shore, including numerous crevices, ridges, and boulders.
Sampling cycles began on January 1 and were typically completed during winter, if possible, to take advantage of daytime negative low tides. The order in which sites were sampled was determined largely by tidal height and surf conditions.
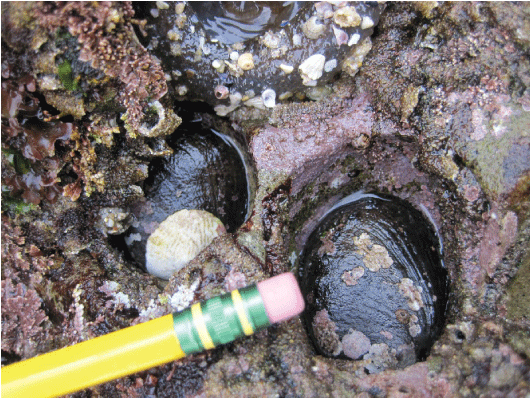
Each quadrat was carefully searched for abalone with the aid of handheld lights to assist in searching cracks and crevices. If possible, the abalone that were discovered were measured for maximum shell length with dividers to the nearest millimeter (fig. 3). Frequently, a measurement could not be obtained because abalone often live in crevices where they could not be reached or where measuring tools could not be used. The target sample size for shell measurements was at least 200 abalone per site at sites where that many could be found. At sites 7 and 8, where there were more than 200 abalone, the transects were sampled in the same order and from the same starting point each year to minimize temporal and observer sampling variation in the size data. Since 2013, the actual number of abalone measured usually exceeded the target number at both sites.
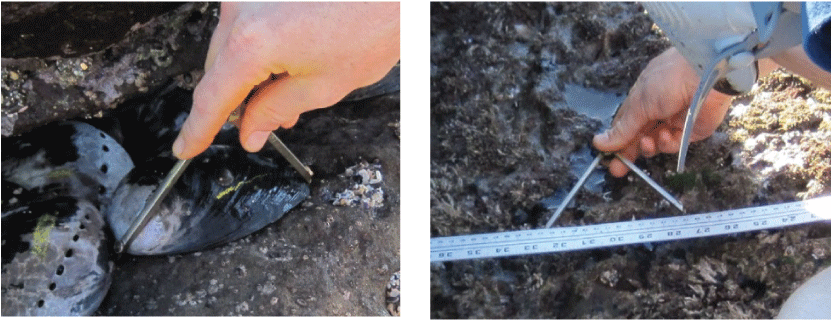
Shell length is measured to the nearest millimeter by using divider calipers and a ruler, San Nicolas Island, California. Photographs by M.C. Kenner, U.S. Geological Survey, January 22, 2019.
Beginning in sampling cycle 29 (2019), most abalone that were not measured either because they were inaccessible or were encountered after at least 200 measurements were made at a site were assigned by visual estimation to one of two size bins. These size bins were less than or equal to 3 cm (recruit) or greater than 3 cm (non-recruit). Beginning in cycle 32 (2022), abalone greater than 3 cm were further subdivided into three more size classes: small (less than or equal to 5 cm but greater than 3 cm), medium (less than or equal to 10 cm but greater than 5 cm), and large (greater than 10 cm). These size classes correspond to the juvenile, small adult, and large adult size classes prescribed by the recovery plan for abalone (National Marine Fisheries Service, 2020) for population analysis. Although 3 cm represents an abalone that likely settled as much as 2 years before, it is considered here as a threshold for recruits into the counted population because smaller abalone are cryptic and thus poorly represented in count data. Abalone in the small size class (along with recruits) are categorized as non-reproductive juveniles based on prior work (Leighton and Boolootian, 1963). The medium and large classes are categorized as reproductive sizes.
For every black abalone on a transect, including non-measured individuals, the distance to the closest conspecific (nearest neighbor) was measured (or estimated) to the nearest centimeter; nearest neighbors were recorded even if they were located outside of the transect. In addition, the microhabitat of each abalone was recorded as one of three classes: open horizontal, open vertical, or crevice. The first two categories are characterized by open, non-cryptic habitats that are either less than or greater than a 45-degree angle from a horizontal plane. Crevice habitat consists of cracks, crevices, or pockets of any orientation. Additionally, the cover of exposed sand was estimated to the nearest 10 percent for each quadrat. Finally, the presence and relative abundance of sea urchins in each quadrat and the radial length of all sea star species on the transects were recorded.
In cycle 32, each quadrat was also subjectively assigned to one of three habitat quality classes: good, moderate, or poor (National Marine Fisheries Service, 2020). Good habitat contains cracks, crevices, or overhangs that are deep and narrow enough to provide some protection from predation. Moderate habitat may contain a range of features from shallow or very wide cracks and crevices to small ridges and depressions that provide marginal protection. Poor habitat is relatively flat and bare or filled with sand, providing either no shelter or no appropriate substrate for abalone attachment. The number of quadrats in each habitat class for the individual sites is shown in table 1 and listed in the “Sites” section.
Table 1.
Transect lengths, areas, and the number of quadrats in the three habitat quality classes at each of the nine black abalone (Haliotis cracherodii) monitoring sites, San Nicolas Island, California.[Most transects are 2 meters (m) wide. Those marked with an asterisk (*) are 1 m wide (see the “Methods” section). Good habitat contains deep cracks or crevices, Moderate habitat contains wide or shallow crevices or ridges, Poor habitat is flat or sandy (see the “Methods” section). Abbreviation: m2, square meters]
Unavoidably, counts were subject to error because some abalone remained hidden in cryptic rock or biological refugia despite efforts to thoroughly search for them. In addition, surging water during moderately low tides or high surf sometimes complicated field efforts.
Statistical Analysis
For each of the nine study sites and for the sum of all sites combined, we characterized the recovery and percentage changes of abalone by first summing abalone counts across transects and analyzing the respective time series for the recovery period from 2001 (when the smallest number of abalone were counted) to 2022. These time series were subject to variations and nonlinear patterns over time; therefore, we used generalized additive models (GAMs) to model the summed counts within each time series as randomly distributed observations around a smooth nonlinear function of year. The variability of the counts around the smooth function were statistically modeled as an over-dispersed Poisson distribution (data dispersion beyond that expected from a Poisson model) or quasi-Poisson distribution. Each GAM function represents a process average; in other words, the mean number of abalone on the surveyed transects as a function of time around which the observed counts are distributed. The quasi-Poisson distribution was fitted by the GAM function with a log link function from the “mgcv” package in R statistical software (https://www.r-project.org/), representing trends using a smooth spline function based on year (Hastie and Pregibon, 1992; Wood, 2017; R Core Team, 2023).
Following visually apparent inflexions in the GAM curve based on the total combined count from all the sites, the subperiods 2001–07, 2007–14, 2014–22, and the entire 2001–22 period were examined. Period percentage changes (% Change) were calculated by contrasting the GAM-based estimates of mean abalone abundance between the first and the last years of each period, denoted N1 and N2, respectively. Specifically, % Change is defined as follows:
whereN1
is the GAM-based estimate of mean number of abalone at the first year of a period, and
N2
is the GAM-based estimate of mean abalone abundance at the last year of a period.
Percentage per annum changes (% Per Annum Change) also were calculated for each period from annualized rates of growth:
whereN1
is the GAM-based estimate of mean abalone abundance at the first year of a period,
N2
is the GAM-based estimate of mean abalone abundance at the last year of a period, and
y
is the number of years in the period of interest.
We calculated 95-percent confidence bands for the percentage changes by first noting that GAM models with a log link function, as used with Poisson distributions, are analyzed on the natural log-scale before estimates are transformed back to original scale. We next note that the percentage change in equation 1 can be expressed in terms of log(N1) and log(N2) as follows, dropping the percentage notation for simplicity:
whereN1
is the GAM-based estimate of mean abalone abundance at the first year of a period,
N2
is the GAM-based estimate of mean abalone abundance at the last year of a period,
log( )
is the natural logarithmic function, and
exp( )
is the natural exponential function, also known as the antilogarithmic function.
Because of the flexible properties of GAM functions, we treated the estimates for log(N1) and log(N2) as independent and applied the variance formula for the difference of two independent variables, log(N2) − log (N1); in other words, the sum Var(log(N2)) + Var(log(N1)). We then calculated the square root of this variance to derive the standard error and calculated 95-percent confidence bands by adding and subtracting two standard errors from the log difference. Finally, we exponentiated the interval limits and subtracted one in accordance with equation 3 to obtain the 95-percent confidence bands for the percentage change. We used similar methods to calculate the 95-percent confidence bands for percentage per annum change, except we used the following equation:
whereN2
is the GAM-based estimate of mean abalone abundance at the last year of a period,
N1
is the GAM-based estimate of mean abalone abundance at the first year of a period,
log( )
is the natural logarithmic function,
exp( )
is the natural exponential function, also known as the antilogarithmic function, and
y
is the number of years in the period of interest.
In the final transformation of the confidence bands for percentage per annum change, we divided the 95-percent confidence bands of the log difference by before exponentiating and subtracting one.
This approach results in symmetric confidence bands on the log-scale, but after transformation, the intervals are asymmetric on the original data scale. The asymmetry is to be expected because Poisson distributions, and count distributions, in general, are skewed with longer tails to the right (toward higher values) compared to the left, which is bounded by 0. Furthermore, our approach to calculating confidence bands for percentage change is conservative because we treated the estimates at N1 and N2 as independent; therefore, our variance estimates for percentage differences may be larger than true variability if the estimates are correlated.
Sites
This section includes a brief description of the nine sites around San Nicolas Island (fig. 1). Photographs of most of the transects, taken between 2016 and 2020, are in Kenner (2020). Subjective rating of black abalone habitat quality in 2022 resulted in 552 quadrats rated as good (26.9 percent), 1,038 rated as moderate (50.5 percent), and 464 rated as poor (22.6 percent), out of 2,054 total quadrats sampled (table 1).
Site 1 is in Bomber Cove on the north side of Vizcaino Point on San Nicolas Island (fig. 1). There are six parallel 30-m transects arranged perpendicular to the shore within a 50-m-wide cove. The total planar surveyed area is 360 m2. At this site, 93 quadrats (25.8 percent) were classified as good habitat, 199 (55.3 percent) as moderate habitat, and 68 (18.9 percent) as poor habitat (table 1). Transect 1 follows along the base of a rock outcropping measuring several meters high. Transects 2–6 are on low bedrock with scattered boulders, approximately 0.25–0.75 m high. Surfgrass (Phyllospadix spp.), sea anemones (Anthopleura spp.), and purple sea urchins (Strongylocentrotus purpuratus) are common in the lower areas. The site is fairly exposed to the prevailing northwest swell (U.S. Navy, 2015).
Site 2 is on the northernmost point of the island (fig. 1). The six transects are scattered into three general areas with approximately 900 m between the westernmost and easternmost transects. The total planar surveyed area is 274 m2. At this site, 132 quadrats (48.2 percent) were classified as good habitat, 139 (50.7 percent) as moderate habitat, and 3 (1.1 percent) as poor habitat (table 1). Transects 1 and 2 parallel each other along pools on the main point near the range marker poles. Transects 3–5 are several hundred meters to the east in a combination of crevice (transects 3 and 4) and red algal clad boulder (transect 5) habitat. Transect 6, several hundred meters further to the east, runs along a broad flat bench with parallel pools and rockweed (Silvetia compressa) cover.
Site 3 spans approximately 1,600 m across three areas along the northeast shore (fig. 1). The total planar surveyed area is 300 m2. At this site, 71 quadrats (23.7 percent) were classified as good habitat, 162 (54.0 percent) as moderate habitat, and 67 (22.3 percent) as poor habitat (table 1). Transects 1–3 parallel the shore along a narrow rocky bench at the base of a steep bank below the northwest end of the runway. Transects 1 and 3 are typically covered by the coralline alga (Corallina vancouveriensis) and the red alga (Mazzaella affinis). However, transect 2 has been mostly bare since 2016, likely because of a sand burial event that eliminated abalone on transects 1 and 2 (Glenn VanBlaricom, retired U.S. Geological Survey employee, written commun., 2020). Transects 4–6 are clustered together on a fairly bare rock bench approximately 975 m to the west. Transect 7, another 640 m westward, is on a narrow rock ridge covered by C. vancouveriensis between a channel-like pool and the ocean.
Site 4, south of the east end sand spit (fig. 1), is the smallest of the sites and consists of only two parallel transects, a few meters apart. The site is on a raised intertidal bench covered by California mussels (Mytilus californianus) and separated from the shore, sometimes making it challenging to access. The total planar surveyed area is 52 m2. At this site, 14 quadrats (26.9 percent) were classified as good habitat, 25 (48.1 percent) as moderate habitat, and 13 (25.0 percent) as poor habitat (table 1).
Site 5, on the southeast shore of the island (fig. 1), has three transects parallel to shore spaced about 10 m apart on slightly elevated, narrow reefs covered with M. californianus. The total planar surveyed area is 70 m2. At this site, 12 quadrats (17.1 percent) were classified as good habitat, 43 (61.4 percent) as moderate habitat, and 15 (21.4 percent) as poor habitat (table 1).
Site 6, on the southeast shore of the island (fig. 1), consists of four transects spread out over about 300 m of shoreline. The total planar surveyed area is 252 m2. At this site, 9 quadrats (3.6 percent) were classified as good habitat, 65 (25.8 percent) as moderate habitat, and 178 (70.6 percent) as poor habitat (table 1). All the transects are on broad, low-relief reefs with M. californianus beds and some large patches of Phyllospadix spp.
Site 7, near the southeast shore of the island (fig. 1), has five transects arranged upon one large rocky bench. The total planar surveyed area is 270 m2. At this site, 63 quadrats (23.3 percent) were classified as good habitat, 136 (50.4 percent) as moderate habitat, and 71 (26.3 percent) as poor habitat (table 1). Transect 1 is along the raised eastern edge of the reef. Transects 2 and 3 follow channels on top of the reef and intersect each other at about a 90-degree angle. Transects 4 and 5 are approximately 150 m west of transect 1 and traverse channels and crevices perpendicular to the shore in a jumbled, high-relief area of the reef susceptible to sand incursion.
Site 8, on the southwest shore (fig. 1), is made up of five transects spread out over about 230 m of shoreline. The total planar surveyed area is 278 m2. At this site, 121 quadrats (43.5 percent) were classified as good habitat, 131 (47.1 percent) as moderate habitat, and 26 (9.4 percent) as poor habitat (table 1). Transect 1 parallels the shoreline on a low, flat ridge between two pools where a few boulders provide some cryptic habitat. Transects 2 and 3 are parallel to each other and the shoreline and follow low ridges with abundant crevice space. To the east, transects 4 and 5 also parallel each other but are perpendicular to the shoreline, traversing channels that are dominated by boulders and are susceptible to sand influence.
Site 9 is to the south of site 1 on the west end of the island (fig. 1) in an area fully exposed to the predominant westerly swells. Six transects are spread over approximately 170 m across an extensive low rock reef. The total planar surveyed area is 198 m2. At this site, 37 quadrats (18.7 percent) were classified as good habitat, 138 (69.7 percent) as moderate habitat, and 23 (11.6 percent) as poor habitat (table 1). The transects follow low ledges in an area with numerous boulders. Corallina vancouverensis and Phyllospadix spp. provide most of the cover.
Results
The cycle 32 sampling of the sites took place between December 30, 2021, and March 2, 2022, and was conducted during three trips to San Nicolas Island. On most workdays, surf and weather conditions were moderate, with only a few days characterized by large surf.
Counts
A total of 2,156 black abalone were counted on all 9 sites in 2022. This total was 133 more than were counted in 2021 but 185 fewer than were counted in 2020, the year when the greatest number of abalone were counted since the WS decline. This total represents an increase of 6.6 percent after a decline in 2021 of 13.6 percent. Table 2 shows site- and island-wide total counts since the project’s inception in 1981. Six of the nine sites had higher counts in 2022 than in the previous year, but counts declined at sites 2, 5, and 6. The largest increases in counts were at site 8 (81 abalone) and site 7 (40 abalone), but the largest percentage increases were at site 9 (47.8 percent) and site 4 (39.6 percent). The increase at site 8 in 2022 was modest given that the count at site 8 in 2021 was 397 (36.0 percent) lower than the previous year. Sites 7 and 8 continued to have the highest counts, representing 1,599 (74.2 percent) of the total abalone counted, and year 2022 was the second consecutive year that counts at site 7 exceeded those at site 8, reversing the ranking that prevailed for most of the previous 25 years. Site densities ranged from 0.2 to 3.0 per m2, with sites 4, 7, and 8 having mean densities above 1.0 per m2 (table 3). The year 2022 marks the fifth consecutive year that the mean overall density remained at or above 1.0 per m2. Before the onset of WS in 1992, overall density ranged from 10.8 to 12.4 per m2 when all quadrats were sampled, and site means ranged from 3.8 to 31.6 per m2.
Table 2.
Total counts of black abalone (Haliotis cracherodii) by site for each sampling cycle, San Nicolas Island, California, 1981–2022.[The far-right column has the cycle total. The percentage change from 2021 to 2022 at each site and overall is shown at the bottom. Asterisk (*) indicates sites or totals with missing data in cycles 1 and 2 (see the “Project History” section for details of missed counts). Abbreviations: ND, no data; —, not applicable]
Table 3.
Average density of black abalone (Haliotis cracherodii) by site for each sampling cycle, San Nicolas Island, California, 1981–2022.[The far-right column has total average density for cycle as a mean of all sampled quadrats. Asterisk (*) indicates sites or totals with missing data in cycles 1 and 2 (see the “Project History” section for details of missed counts. Abbreviation: ND, no data]
Counts by transect at each site, the total count at each site, and the combined total for all sites for the last 5 years (2018–22) are shown in table 4. Transect 2 of site 8, which previously had the highest count every year since 2002 but declined by 341 abalone (62.3 percent) in 2021, increased by 35 abalone this year. Most of the increase observed at site 8 in 2022 was on transect 1 (66 abalone). Most of the increase observed at site 7 this year was on transect 3 (58 abalone). On the 44 transects, changes in 2022 ranged from a decrease of 31 abalone to an increase of 66, and the counts of 18 transects declined while those of 24 transects increased, and 2 transects remained the same. Zero abalone were counted on only 3 of the 44 transects in 2022. During the period from 2018 to 2021, between five and seven transects had zero abalone counted.
Table 4.
Number of black abalone (Haliotis cracherodii) counted on each site by transect, San Nicolas Island, California, 2018–22.[Total count for each year is in bottom row]
Population growth has varied among sites since 2001 (table 5). Negative and positive changes in population growth were significant if confidence bands did not overlap zero; confidence bands overlapping zero were considered not significant. During the 2001–22 period, all sites showed positive period and per annum growth as indicated by estimates and confidence bands exceeding zero. Site 5 had the lowest overall rate of growth, with an average per annum rate of 7 percent, whereas site 4 had the highest at 25 percent. Site 8, which accounts for nearly half the surveyed population (largely because of the higher number of black abalone surviving there in 2001), had a low overall average per annum rate of increase during the period (8 percent). Sites 2 and 9 sustained fairly consistent average per annum rates of growth across the three periods spanning 2001–22, of 14–17 percent and 11 percent, respectively.
Most of the sites had their highest population growth rate during the first and second periods (2001–07 and 2007–14). Counter to this, site 1 experienced no significant change during the first period (2001–07) and site 5 had no significant change during the second period (2007–14). During the 2014–22 period, site 3 experienced a negative change and site 8 had no significant change, as indicated by estimates and confidence bands falling below or overlapping with zero, respectively. These patterns are illustrated in figure 4, which shows the logarithmic count trajectories, the calculated GAM curve, and the 95-percent confidence band for each of the sites.
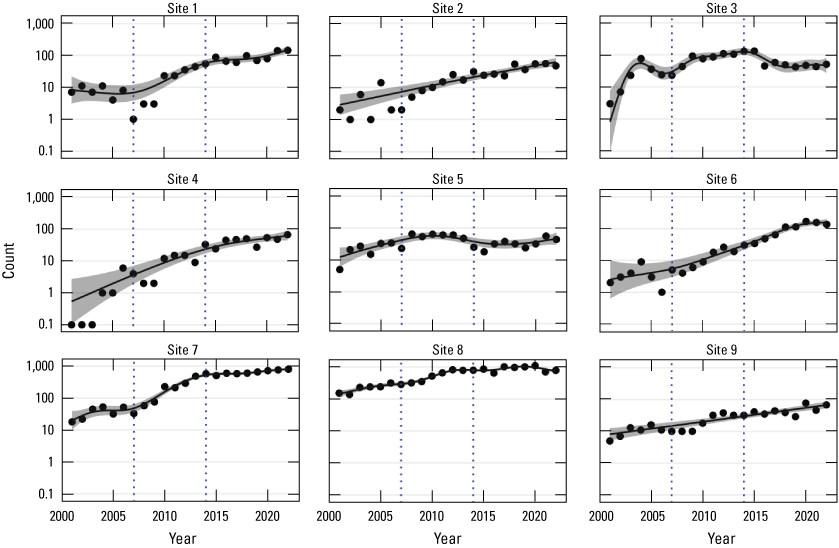
Black abalone (Haliotis cracherodii) counts at each site, plotted on a log scale, at San Nicolas Island, California, 2001–22. Curves and 95-percent confidence bands were generated by generalized additive model. Dotted vertical lines delineate three subperiods (2001–07, 2007–14, 2014–22). Zero values shown as 0.1 to allow plotting on the log-scaled axis.
Figure 5 shows the combined total raw count from all the sites for each survey from 2001 to 2022, the calculated GAM curve, and the 95-percent confidence band (adjusted R2=0.992). Three distinct periods of black abalone population growth can be observed during the 2001–22 study period (fig. 5; table 5). During the initial 7 years (2001–07), total black abalone counts showed a relatively modest increase of 130 percent (15 percent per annum average). This modest increase was followed by a higher growth period from 2007 to 2014, with an increase of 280 percent (21 percent per annum average). During the last 8 years (2014–22), growth declined at a slower rate, increasing only 28 percent (3 percent per annum average). Over the entire period (2001–22), the population exhibited average per annum growth of 12 percent.
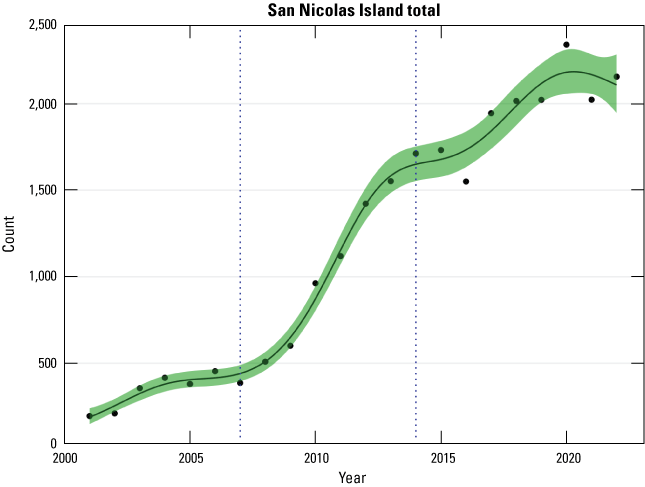
Total black abalone (Haliotis cracherodii) counts from all sites combined, generalized additive model nonlinear regression, and 95-percent confidence band, San Nicolas Island, California, 2001–22. Dotted vertical lines delineate three subperiods (2001–07, 2007–14, 2014–22).
Table 5.
Period (top) and per annum (bottom) percentage changes in mean black abalone (Haliotis cracherodii) counts during given periods calculated from general additive model (GAM) analysis, San Nicolas Island, California, 2001–22.[Values in parentheses indicate 95-percent confidence range for GAM estimate each year]
Counts at each of the sites during the project during 1981–2022 are shown in figure 6. An inset graph with an expanded y-axis gives a better view of the recovery trends at the sites during 2001–22.
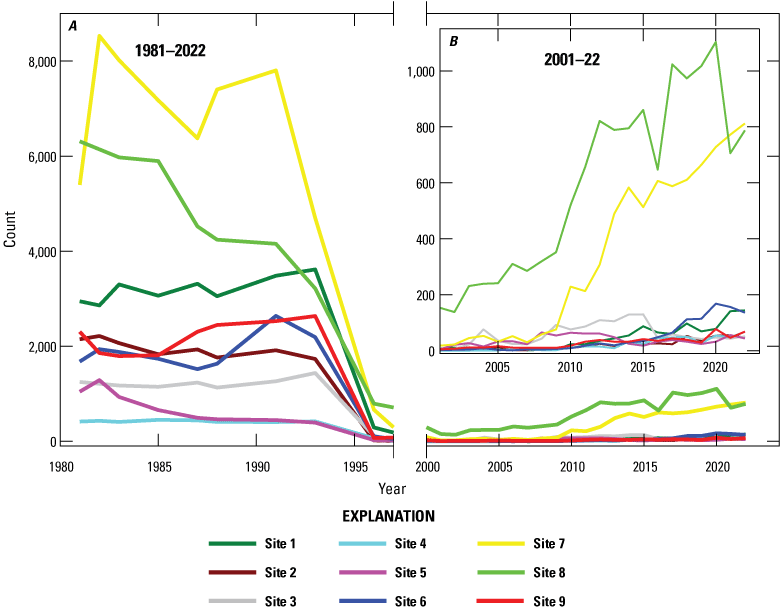
Total black abalone (Haliotis cracherodii) counts at each of the nine San Nicolas Island, California, sites A, during the study (1981–2022) and B, during the 2001–22 recovery phase (inset) after the withering syndrome outbreak. No counts were made between 1997 and 2001.
Figure 7 shows how the counts at the different sites contributed to the total count during 2001–22. Site 8 had the highest count every year until 2021, when the count declined by 36 percent. Site 7 became the site with the highest black abalone counts in 2021 and 2022.
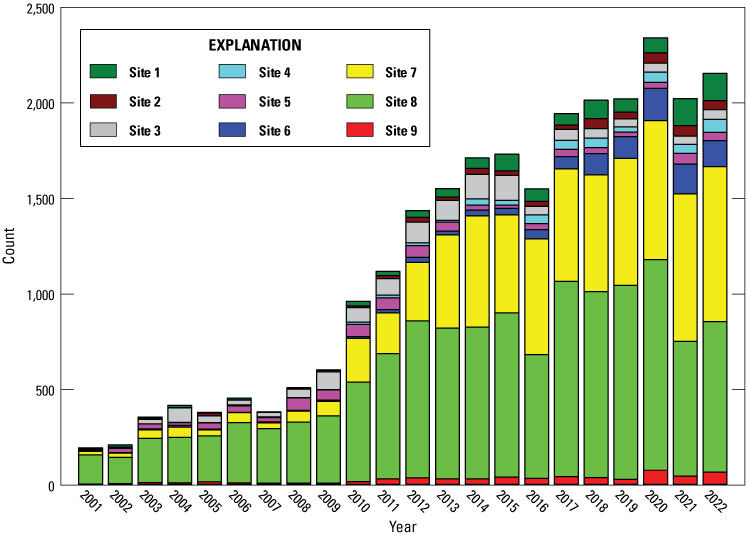
Contribution of each site to total black abalone (Haliotis cracherodii) counts for 2001–22, San Nicolas Island, California.
Figures 8 and 9 show how the counted abalone were distributed along each transect at sites 7 and 8, the two sites with the most abalone, during the 2018–22 sampling period. On these figures, the quadrat totals are for the left and right sides of the transect combined (2 m2). Generally, abalone on the transects had a clumped distribution, and although counts change over time, there is a persistence of high-density and low-density regions along the transects.
In 2022, the highest 1-m2 quadrat count was 57 abalone compared to 61 in 2021 and 69 in 2020. It was the lowest since cycle 21 in 2011. However, of the 2,054 total 1-m2 quadrats, the number of quadrats having zero abalone decreased to 1,626 in 2022. This was the lowest number of zero quadrats since cycle 9 in 1996. The decline in the number of zero count quadrats has been fairly steady over 2 decades, but the maximum quadrat count has declined from 2019 to 2022, indicating a recent trend toward more even distribution of abalone with more quadrats occupied but at slightly lower maximum density. There was no change in the abalone count in 1,583 quadrats, but 269 quadrats increased in abalone counts and 202 decreased. Of the 428 quadrats that had abalone in 2022, 68 had the same number as in 2021. Of the 360 quadrats that did have a change in abalone counts, 269 increased compared to 91 that decreased. More than 80 percent of those that changed in abalone counts did so by 5 abalone or less, but differences ranged from an increase of 23 abalone to a decrease of 25.
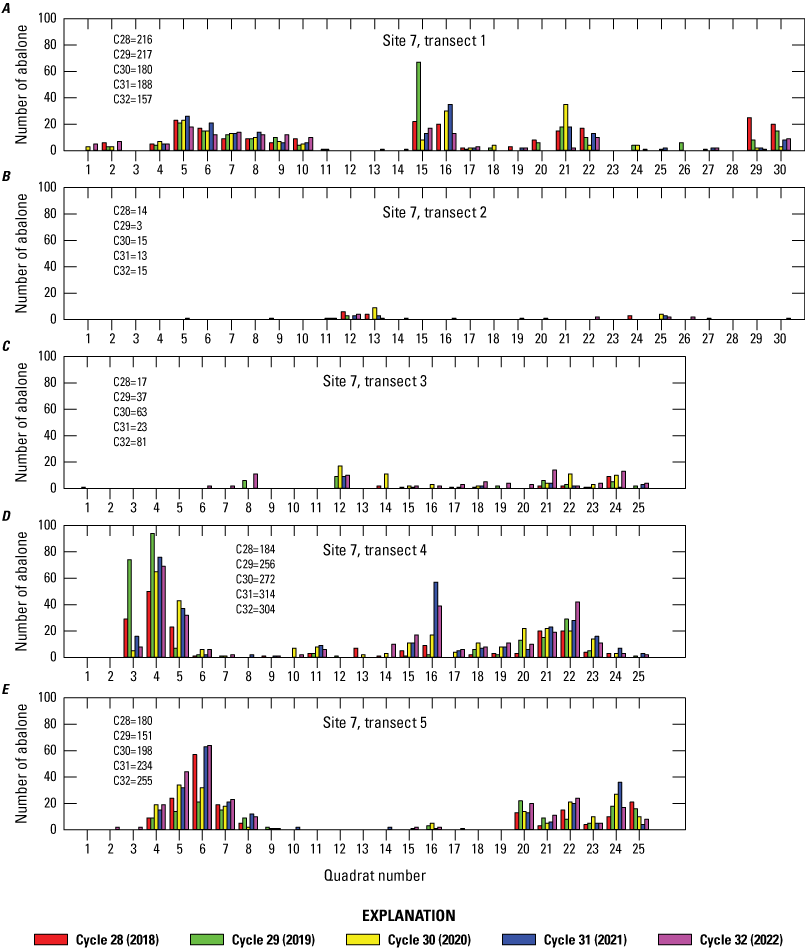
Distribution of black abalone (Haliotis cracherodii) along each transect at site 7: A, transect 1; B, transect 2; C, transect 3; D, transect 4; and E, transect 5, San Nicolas Island, California, 2018–22. Total transect count for each cycle is shown on the graph (for example, C28=17 indicates that 17 abalone were counted during cycle 28).
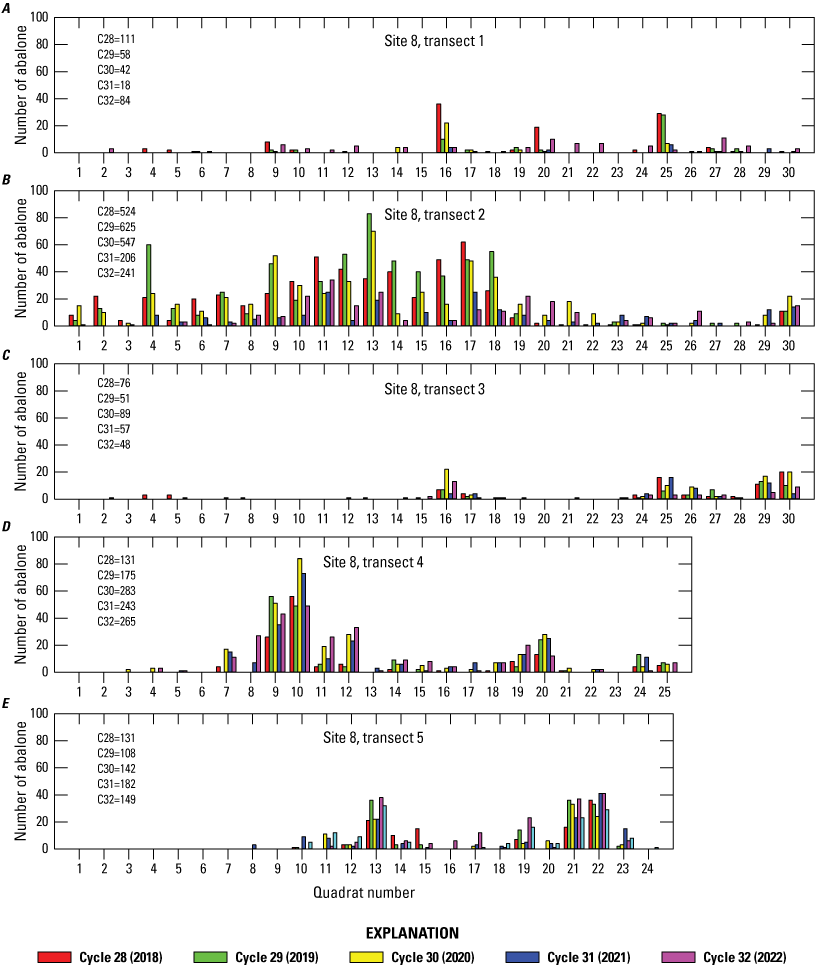
Distribution of black abalone (Haliotis cracherodii) along each transect at site 8: A, transect 1; B, transect 2; C, transect 3; D, transect 4; and E, transect 5; San Nicolas Island, California, 2018–22. Total transect count for each cycle is shown on graph (for example C28=76 indicates that 76 abalone were counted during cycle 28).
Abalone were most commonly observed in the crevice microhabitat. Between 1983, when the microhabitat was first recorded, and 1993, when WS mortalities were first recorded at San Nicolas Island, an average 65.9 percent of sampled abalone were in the crevice microhabitat category. In surveys completed between 2001 and 2022, after the WS-induced population decline, the average percentage found in crevice microhabitat rose above 95 percent. In 2022, 96.0 percent of abalone recorded were in the crevice microhabitat. Table 6 shows the number of abalone by microhabitat categories at the sites in 2022. Site 6, the site with the least amount of relief and complexity, had the highest percentage of non-crevice microhabitat use by abalone but less than in previous years.
Table 6.
Number of black abalone (Haliotis cracherodii) in each microhabitat by site and transect, San Nicolas Island, California, 2022.The habitat quality classifications assigned in the field showed that at each site, the density of abalone was greater in “good” than in “moderate” habitat, and density was greater in “moderate” than in “poor” habitat (table 7). Good-rated quadrats averaged 3.03 abalone, moderate-rated quadrats averaged 0.42 abalone, and poor-rated quadrats averaged 0.11 abalone, but there was considerable variation.
Size Distribution and Recruitment
Before WS reached San Nicolas Island in the early 1990s, the size distribution of black abalone at these sites was dominated by large adults (VanBlaricom, 1993). During 2001–22, the period after WS dramatically reduced the population, recruits (here defined as abalone less than or equal to 3 cm in shell length) started becoming more common (fig. 10). This phenomenon, in concert with the dramatic reduction of the existing population, led to a change in the overall shape of the size distribution. Of the 3,971 abalone measured before, only 18 were in the recruit size class (0.45 percent), and over 96 percent were larger than 5 cm (table 8). All the samples contained less than 5 percent recruits.
Table 8.
Size samples of black abalone (Haliotis cracherodii) from sites at San Nicolas Island, California, 1983–93. Sample size, number, and percentage of recruits (individuals less than 3 centimeters [cm]), and number and percentage of adults (individuals greater than 5 cm) at each site where measurements were made in a given cycle are shown.[—, not applicable]
Two black abalone (Haliotis cracherodii) recruits at site 5—Shell length approximately 2 centimeters in abandoned urchin cavities, San Nicolas Island, California. Photograph by M.C. Kenner, U.S. Geological Survey, January 2018.
Because densities were high and abalone were stacked upon each other, juveniles and small recruits were likely more difficult to see, resulting in some bias in the length data from the pre-WS years. This bias likely changed over time as black abalone became less abundant and less crowded. The potential for bias in the counts and measurements made at different sites and transects likely also varied because of local topography. The lack of recruits during these years contrasts with the size distributions from 2001 onward (fig. 11), when the percentage of the abalone recruits counted only fell below 4 percent a few times. In the samples after 2009, black abalone recruits often made up more than 10 percent of the total counted. Moreover, several of the recent years were dominated by smaller size classes. All the samples beginning in 2001 showed at least a few individuals in the recruitment size class.
In their first year, recently settled black abalone are thought to primarily inhabit cryptic habitat such as Mytilus beds or under boulders. As a result, individuals less than 2 or 3 cm likely are under-represented in size samples (VanBlaricom, 1993). The percentage of measured individuals that were less than or equal to 3 cm is noted on each of the annual size plots on figure 11 and was as high as 25.4 percent in 2017. In 2022, there was a recruitment pulse of similar magnitude (21.7 percent).
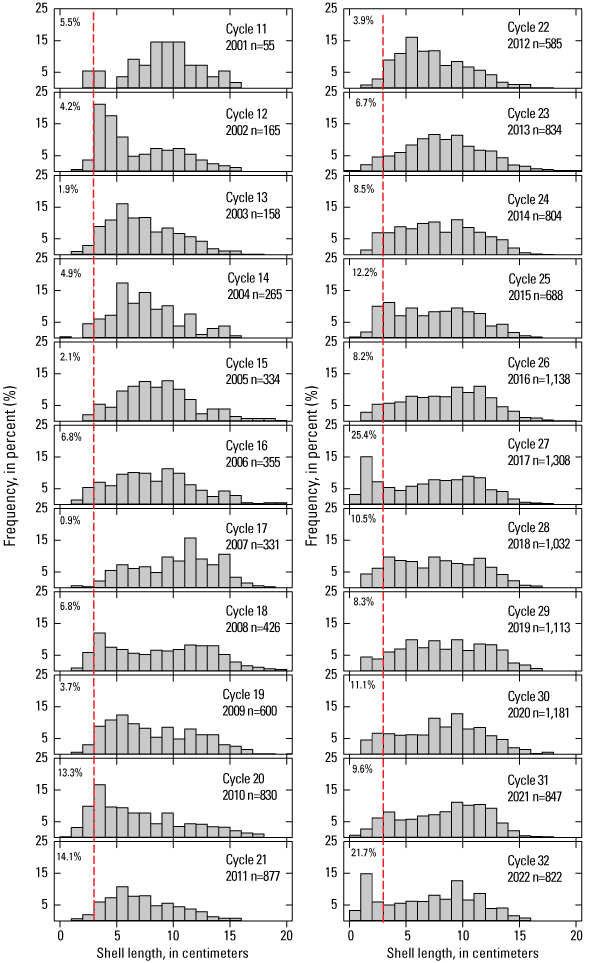
Whole-island size distributions (total shell length in centimeters) of black abalone (Haliotis cracherodii) in sample cycle 11 (2001) to cycle 32 (2022), San Nicolas Island, California. The total number of abalone measured in each cycle is indicated by “n.” Sizes to the left of the dashed red line are considered recruits, and the percentage of recruits in each sample is indicated.
The distribution of size classes at the nine sites (recruit, small, medium, and large as defined in the “Methods” section) is shown in table 9 as the percentage in each class, either measured or estimated. Sites 1 and 2 have similar distributions, with most abalone in the large class and relatively few in two smaller classes. Contrasting this pattern, site 5 had very few large individuals, and most were in the recruit class.
Table 9.
Percentage of black abalone (Haliotis cracherodii) at each site that were in each of the four size classes (either estimated or measured to the nearest millimeter) at San Nicolas Island, California, 2022.[Definitions: recruit, less than or equal to 3 centimeters (cm); small, less than or equal to 5 cm and greater than 3 cm; medium, less than or equal to 10 cm and greater than 5 cm; large, greater than 10 cm]
The size frequency for measured abalone at each of the nine sites in 2021 and 2022 is illustrated in figure 12. Sites 5 and 8 had a substantial recruitment pulse in 2022, with 3 cm and smaller abalone making up over 40 percent of the animals whose shell lengths were measured. Although only six of the nine sites had some recruits in 2021, all nine sites had recruits in 2022. Sites 5 and 8 had the highest percentage of recruits among measured animals, but sites 8 and 7 had the most recruits in both years (table 10). The same pattern holds if the estimated recruit size class is included from the non-measured abalone (table 11). Because of accessibility problems and numbers of abalone surpassing the 200 measurements threshold, the inclusion of estimated recruits makes a large difference at site 7 and particularly site 8 in terms of numbers of recruits. These two sites generally had the most recruits after 2009.
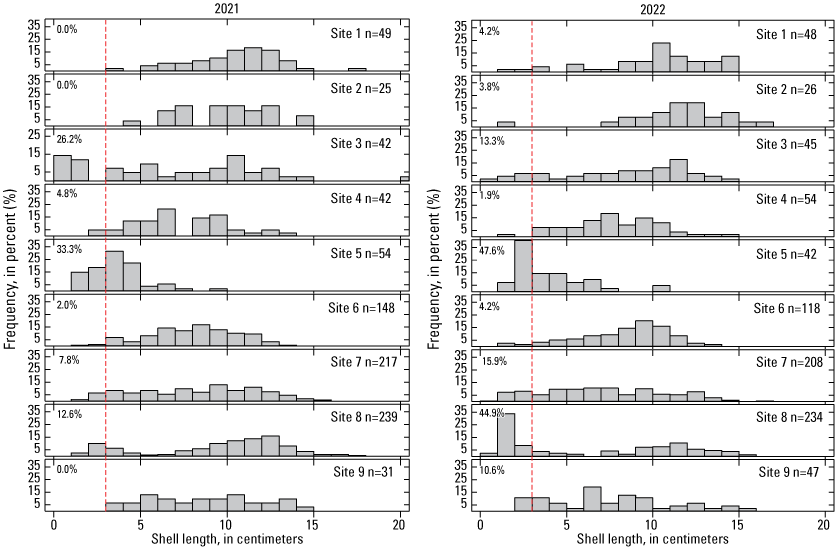
Size distribution (percentage frequency) of black abalone (Haliotis cracherodii) for each site in 2021 (left) and 2022 (right), San Nicolas Island, California. The total number of black abalone measured in each cycle is indicated by “n.” Sizes to the left of the dashed red line are considered recruits and the percentage of each sample in that category is indicated.
Table 10.
Number and percentage of measured black abalone (Haliotis cracherodii) at each site that were recruits (less than or equal to 3 centimeters [cm]) for cycles 11–32 (2001–22) and total recruits for each cycle, San Nicolas Island, California.[Values in parentheses indicate percentage]
Table 11.
Number of black abalone (Haliotis cracherodii) at each site that were classified as recruits (measured or estimated shell length less than or equal to 3 centimeters [cm]) at San Nicolas Island, California, 2019–22.[The column on the right shows the percentage of the total count for the cycle that was in the recruit size class. Before 2019, non-measured abalone were not estimated into size bins]
A strong recruitment event was detected at site 8, transects 1 and 2, in 2017. Figure 13 illustrates the sequence of size frequencies on these transects from 2016 to 2022. Note that the frequencies plotted are numbers of individuals rather than percentage of the sample and only represent the part of the population that was measured, but the total number counted is indicated on the figure. Although the recruitment observed on transect 1 in 2017 initially increased total counts from 14 to 252, there was a net gain of only 4 individuals (from 14 to 18) by 2021, despite observations of additional recruits in intervening years. The total number of recruits measured on transect 1 from 2017 to 2021 was 219. Another 67 recruits were observed on transect 1 in 2022, bringing the total population count to 84. On transect 2, total counts increased from 332 in 2016 to 625 in 2019. However, by 2022, despite the addition of 364 more measured or estimated recruits, the total count on transect 2 decreased to 241 (table 12). These examples illustrate that even relatively large recruitment pulses may only temporarily raise population counts. In the case of transect 1, successive size distributions on figure 13 show that few recruits from 2017 and subsequent years remained and survived to 2021, and the count and size distribution was almost the same as in 2016. A different pattern is seen on transect 2, where despite the addition of over 600 recruits between 2016 and 2022, there was a substantial decrease of the adult population, and the total count declined by over 25 percent. Transect 1 is composed primarily of quadrats with moderate habitat quality (47 percent) and a low proportion with good habitat quality (3 percent). Transect 2, however, was rated as 37 percent good and 21 percent moderate. Recruits and small abalone may have left the transect 1 area, but also may not have survived.
Table 12.
Black abalone (Haliotis cracherodii) counts by size class on site 8, transect 2 at San Nicolas Island, California, 2019–22.[Size classes for measured and non-measured individuals]
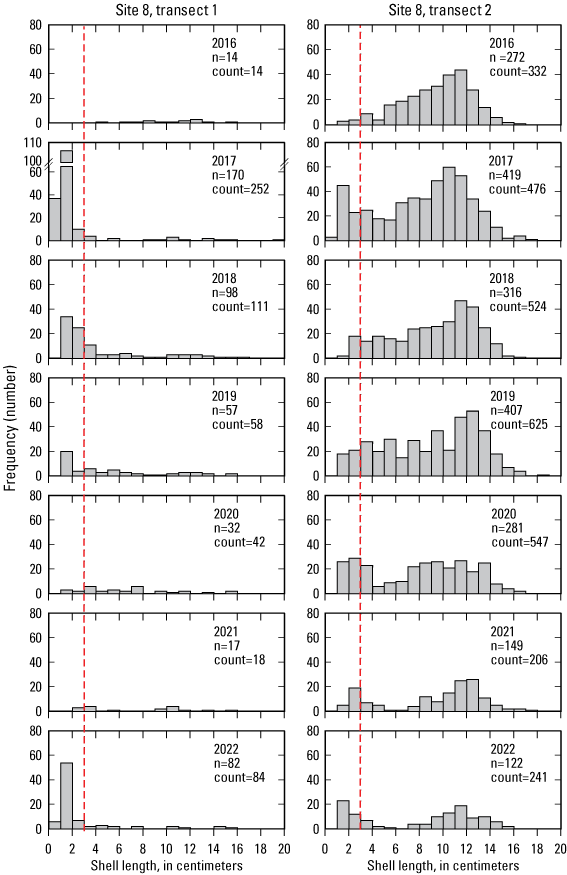
Recruitment pulse as observed in the size distribution of black abalone (Haliotis cracherodii) measured at site 8, transects 1 (left) and 2 (right), San Nicolas Island, California, 2016–22. Frequencies are presented here as numbers rather than percentage of sample size. Sizes to the left of the dashed red lines are considered recruits. Slashes indicate broken vertical axis on 2017 graph to accommodate the much greater number of recruits in that year's sample. Abbreviations: n, measured sample size; count, total count on transect.
Nearest Neighbors
The mean nearest neighbor distance at San Nicolas Island has declined over several years as the population size has increased. Figure 14 shows this pattern since 2005, when consistent efforts were first made to measure nearest neighbor distance. Also plotted are the percentages of each sample within 10 and 100 cm of the nearest conspecific. The pattern for all three metrics has been toward closer proximity, but there was an uptick in the mean distance in 2022, and the percentage within 10 cm dropped by nearly 5 percent. It is not clear what caused this change in trajectory, but there was almost a 20 percent increase in the number of occupied quadrats in 2022, so perhaps it was the result of some small-scale redistribution. Proximity should increase the probability of fertilized gametes from a given area (Blaud, 2013).
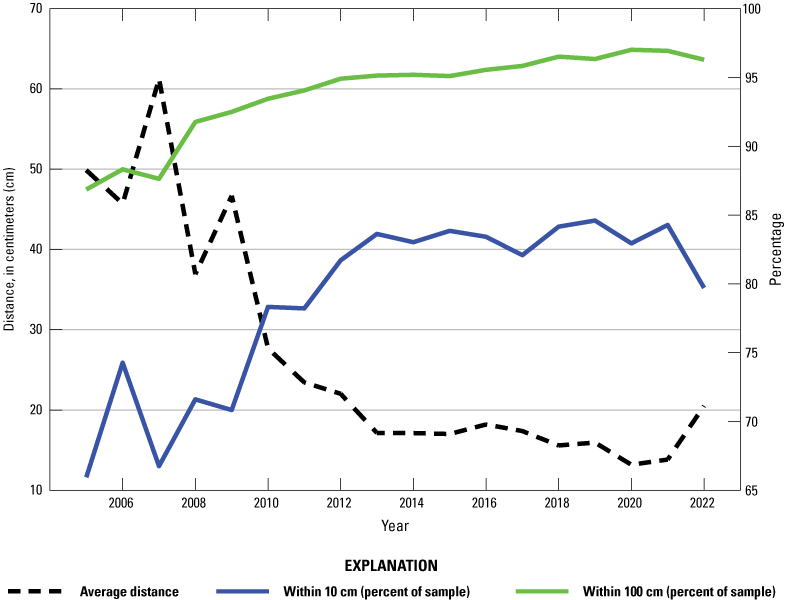
Mean nearest neighbor distance between black abalone (Haliotis cracherodii) and percentage of sample within 10 and 100 centimeters of neighbor, San Nicolas Island, California, 2005–22.
Figure 15 shows nearest neighbor distance bins plotted by site for 2022. Sites 7 and 8, which dominate in terms of total abalone count, also drive the high numbers of abalone in close proximity. These two sites contained 74.2 percent of the counted population, and 83.6 percent of these 1,599 abalone were within 10 cm of another abalone. In general, the other sites are more evenly spread among the bins, but the other sites still had 62.8 percent of the counted abalone within 10 cm of another black abalone.
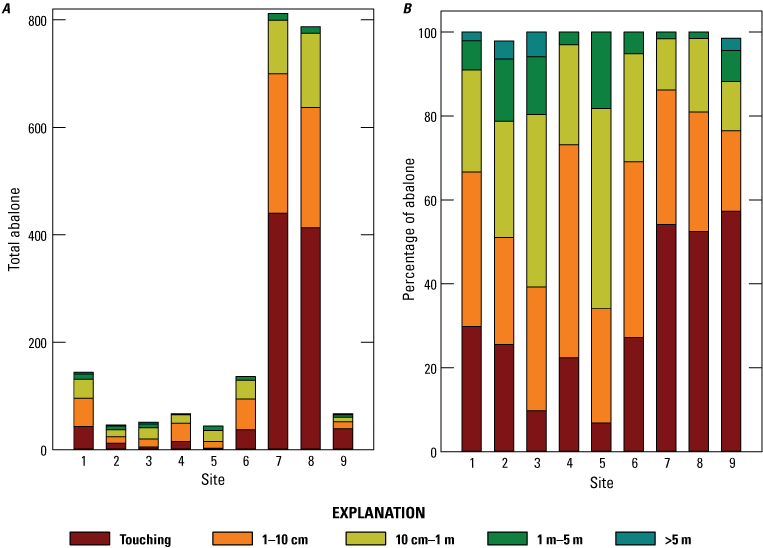
Nearest neighbor distance bins by site for A, frequency of bins showing total number of black abalone (Haliotis cracherodii) and B, by percentage of black abalone, San Nicolas Island, California, 2022. Abbreviations: cm, centimeter; m, meter; >, greater than.
Sedimentation
Sand cover in the quadrats did not follow any obvious temporal trends across sites or by transect. Figure 16 shows mean sand cover for selected transects at sites 1, 7, and 8 (those with generally higher sand cover) and total mean sand cover over time during 2001–22. Although sand cover varied interannually and between transects, there was no evidence of temporal trends. There seems to be only weak synchrony in the sand cover among the transects, although in 2016, sand cover appeared to peak on several of them. Ironically, for the one site where it is thought that sand burial caused mass mortality of black abalone (decline recorded in winter 2016, site 3, transects 1 and 2), the data indicated that sand cover was zero for these transects. The sand cover there was apparently brief and catastrophic and could have resulted from a temporary change, observed in October 2015, in the size and shape of the sand spit on the east end of the island (Brian Hatfield, U.S. Geological Survey, written commun., 2015). Contrary to trends observed in 2021, sand cover generally decreased on site 1 transects and increased at site 7 and 8 transects in 2022. Some abalone were observed on site 8, transect 4, on vertical rock faces at or just below the sand surface. For transects where sand in channels was observed, such as transects 4 and 5 at sites 7 and 8, the sand surface likely becomes a slurry at higher tides as waves wash in and out of the channel. In these cases, vertical rock may act as an escape from burial for abalone. How sand cover affects abalone is likely to be a result of several factors, including depth of burial, duration of the event, and the availability of protruding rock refugia.
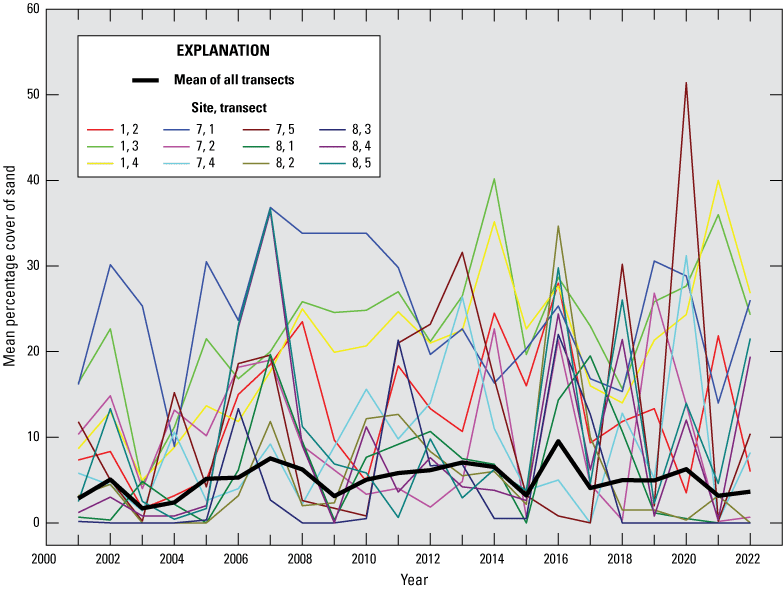
Mean percentage cover of sand on selected transects (those with generally higher sand cover), San Nicolas Island, California, 2001–22. Heavy black line shows total mean cover over time.
Conclusion
The total 2022 San Nicolas Island black abalone count of 2,156 for all sites combined was greater than the 2021 count but still lower than the 2020 count (table 2). Counts at the site and transect level typically rise or fall a little from year to year, but the decline from the 2020 count can be explained by the decrease in count on site 8, transect 2. If this transect is excluded from these three surveys, then the counts of the latter 2 years are progressively higher than that of 2020 (table 4). There was a sizeable recruitment on that transect in 2022 (59 percent), but the number of abalone greater than 3 centimeters (cm) continued to decrease (refer to “Non-recruits” in table 12). Although declines of transect counts are not uncommon, the number of abalone lost on a single transect is noteworthy for having exceeded previous declines since withering syndrome (WS) decimated the population over 20 years ago. It is still unclear what cause or causes are responsible, but remaining animals appear healthy, suggesting that WS was not a likely cause.
The island-wide recruitment rate of 21.7 percent for measured abalone in 2022 was second only to the 2017 rate of 26.5 percent. The rate calculated including abalone with estimated size classes is lower (table 11) and cannot be compared with data from before 2019, but further indicates a consistent influx of recruits with at least a few at every site and a high number at site 8. However, the lack of eventual population growth at two transects of site 8 discussed earlier (fig. 13) indicates that large recruitment events may not always result in population growth at an individual site.
Data from 2001 to 2022 indicate that a higher percentage of abalone inhabit crevice habitat than was the case before WS. The greater utilization of exposed microhabitats that was observed before WS was likely a result of crowding of the more preferred crevice habitats when the population size was at unnaturally high levels (National Marine Fisheries Service, 2020) because of the absence of sea otters and most human predation. Abalone in crevice habitat likely experience fewer extreme temperatures at low tide (Adams, 2007). Crevice habitat also may help protect abalone from dislodgement by wave born rocks and boulders (Shanks and Wright, 1986). Finally, crevices can provide a refuge from some predators, like sea otters (Lowry and Pearse, 1973). It is unclear if predation by sea otters is helping to shape the apparent microhabitat choice, but sites 6 and 4, the sites showing the lowest proportion of crevice utilization in recent years, are both relatively flat sites, indicating that availability is an important factor in the microhabitat distribution.
The habitat quality classifications subjectively assigned in the field supported the expected trend of higher abalone density with better habitat quality. At each site, the density of abalone was greatest in good habitat, less in moderate habitat, and much less in poor habitat, but there was considerable variation in relative densities among sites and within habitat quality classes (table 7).
Measurement of nearest neighbor distance showed that more than 90 percent of the monitored black abalone were within 1 meter (m) of another abalone and almost 80 percent were within 10 cm (fig. 14). In 2022, there was a slight decline in the proportion of abalone within 10 cm of another, and consequently, the average distance between abalone increased, but most abalone at all sites remained closer than 1 m.
Although burial by sedimentation has occurred at San Nicolas Island sites in the past and can have devastating consequences for local populations (Glenn VanBlaricom, retired U.S. Geological Survey employee, written commun., 2020), there is no evidence that typical seasonal sand movement influences black abalone density. However, more intense storms or changes in swell angle might cause future mortality from sand burial.
San Nicolas Island is one of the few places within the species’ range where black abalone populations are showing signs of recovery (Black Abalone Recovery Team, written commun., 2024). Increasing numbers and densities of abalone, as well as several successful recruitment events, have been identified in the recovery plan for black abalone (National Marine Fisheries Service, 2020) as important metrics for assessing the recovery of black abalone populations. Continued monitoring of populations at San Nicolas Island could provide recovery dynamics data to the Black Abalone Recovery Team and resource managers.
References Cited
Blaud, B.M., 2013, Spatial and temporal patterns of fertilization in black abalone (Haliotis cracherodii Leach, 1814)—Analysis of surrogate gamete spawning experiments with application towards populations on San Nicolas Island: Seattle, Wash., University of Washington, Master’s thesis, 94 p. [Available at https://digital.lib.washington.edu/server/api/core/bitstreams/07aa837e-ea0e-4080-9bfe-d99c9396a49b/content.]
Boolootian, R.A., Farmanfarmaian, A., and Giese, A.C., 1962, On the reproductive cycle and breeding habits of two western species of Haliotis: The Biological Bulletin, v. 122, no. 2, p. 183–193. [Available at https://doi.org/10.2307/1539587.]
California Department of Fish and Game, 2004, Annual status of the fisheries report through 2003—Report to the Fish and Game Commission as directed by the Marine Life Management Act of 1998: California Department of Fish and Game Marine Region, 182 p. [Available at https://wildlife.ca.gov/Conservation/Marine/Status.]
Chambers, M.D., VanBlaricom, G.R., Hauser, L., Utter, F., and Friedman, C.S., 2006, Genetic structure of black abalone (Haliotis cracherodii) populations in the California islands and central California coast—Impacts of larval dispersal and decimation from withering syndrome: Journal of Experimental Marine Biology and Ecology, v. 331, no. 2, p. 173–185. [Available at https://doi.org/10.1016/j.jembe.2005.10.016.]
Friedman, C.S., Wight, N., Crosson, L.M., VanBlaricom, G.R., and Lafferty, K.D., 2014, Reduced disease in black abalone following mass mortality—Phage therapy and natural selection: Frontiers in Microbiology, v. 5, no. 78, 10 p. [Available at https://doi.org/10.3389/fmicb.2014.00078.]
Haas, H., Braje, T.J., Edwards, M.S., Erlandson, J.M., and Whitaker, S.G., 2019, Black abalone (Haliotis cracherodii) population structure shifts through deep time—Management implications for southern California’s northern Channel Islands: Ecology and Evolution, v. 9, no. 8, p. 4720–4732. [Available at https://doi.org/10.1002/ece3.5075.]
Hastie, T.J., and Pregibon, D., 1992, Generalized linear models, chap. 6 of Chambers, J.M., and Hastie, T.J., eds., Statistical models in S: Pacific Grove, Calif., Wadsworth & Brooks/Cole, p. 195–248. [Available at https://doi.org/10.1201/9780203738535.]
Kenner, M.C., 2020, Black abalone surveys at Naval Base Ventura County, San Nicolas Island, California—2019, annual report: U.S. Geological Survey Open-File Report 2020–1047, 41 p., accessed December 20, 2023, at https://doi.org/10.3133/ofr20201047.
Kenner, M.C., and Yee, J.L., 2022, Black abalone surveys at Naval Base Ventura County, San Nicolas Island, California—2021, annual report: U.S. Geological Survey Open-File Report 2022–1107, 34 p., accessed January 15, 2025, at https://doi.org/10.3133/ofr20221107.
Lafferty, K.D., and Kuris, A.M., 1993, Mass mortality of abalone Haliotis cracherodii on the California Channel Islands—Tests of epidemiological hypotheses: Marine Ecology Progress Series, v. 96, p. 239–248. [Available at https://doi.org/10.3354/meps096239.]
Leighton, D., and Boolootian, R.A., 1963, Diet and growth in the black abalone, Haliotis cracherodii: Ecology, v. 44, no. 2, p. 227–238. [Available at https://doi.org/10.2307/1932170.]
Lowry, L., and Pearse, J.S., 1973, Abalones and sea urchins in an area inhabited by sea otters: Marine Biology, v. 23, p. 213–219. [Available at https://doi.org/10.1007/BF00389487.]
Miner, C.M., Altstatt, J.M., Raimondi, P.T., and Minchinton, T.E., 2006, Recruitment failure and shifts in community structure following mass mortality limit recovery prospects of black abalone: Marine Ecology Progress Series, v. 327, p. 107–117. [Available at https://doi.org/10.3354/meps327107.]
National Marine Fisheries Service, 2020, Final Endangered Species Act recovery plan for black abalone (Haliotis cracherodii): Long Beach, Calif., National Oceanic and Atmospheric Administration, National Marine Fisheries Service, West Coast Region, 112 p. [Available at https://repository.library.noaa.gov/view/noaa/27415.]
National Oceanic and Atmospheric Administration, 2009, Endangered and threatened wildlife and plants—Endangered status for black abalone: Federal Register, v. 74, no. 9, p. 1937–1946. [Available at https://www.federalregister.gov/documents/2009/01/14/E9-635/endangered-and-threatened-wildlife-and-plants-endangered-status-for-black-abalone.]
National Oceanic and Atmospheric Administration, 2011, Endangered and threatened wildlife and plants—Final rulemaking to designate critical habitat for black abalone: Federal Register, v. 76, no. 208, p. 66806–66844. [Available at https://www.govinfo.gov/content/pkg/FR-2011-10-27/pdf/2011-27376.pdf.]
Neuman, M., Tissot, B., and Vanblaricom, G., 2010, Overall status and threats assessment of Black Abalone (Haliotis cracherodii Leach, 1814) populations in California: Journal of Shellfish Research, v. 29, no. 3, p. 577–586. [Available at https://doi.org/10.2983/035.029.0305.
R Core Team, 2023, R—A language and environment for statistical computing: Vienna, Austria, R Foundation for Statistical Computing, accessed December 20, 2023, at https://www.R-project.org/.
Raimondi, P.T., Wilson, C.M., Ambrose, R.F., Engle, J.M., and Minchinton, T.E., 2002, Continued declines of black abalone along the coast of California—Are mass mortalities related to El Niño events?: Marine Ecology Progress Series, v. 242, p. 143–152. [Available at https://doi.org/10.3354/meps242143.]
Rathbun, G.B., Hatfield, B.B., and Murphey, T.G., 2000, Status of translocated sea otters at San Nicolas Island, California: The Southwestern Naturalist, v. 45, no. 3, p. 322–328. [Available at https://doi.org/10.2307/3672835.]
Rick, T.C., Vellanoweth, R.L., Erlandson, J.M., and Kennett, D.J., 2002, On the antiquity of the single-piece shell fishhook—AMS radiocarbon evidence from the Southern California Coast: Journal of Archaeological Science, v. 29, no. 9, p. 933–942. [Available at https://doi.org/10.1006/jasc.2001.0788.]
Shanks, A.L., and Wright, W.G., 1986, Adding teeth to wave action—The destructive effects of wave-borne rocks on intertidal organisms: Oecologia, v. 69, no. 3, p. 420–428. [Available at https://doi.org/10.1007/BF00377065.]
U.S. Navy, 2015, Integrated natural resources management plan for Naval Base Ventura County, San Nicolas Island, California—December 2010 [updated December 2015]: San Diego, Calif., Naval Base Ventura County, San Nicolas Island, Environmental Division and Naval Facilities Engineering Command, Southwest, 1760 p.
VanBlaricom, G.R., and Kenner, M.C., 2020, Dietary patterns in black abalone Haliotis cracherodii Leach, 1814 as indicated by observation of drift algal and seagrass capture at San Nicolas Island, California, USA, 1982 to 2019: Journal of Shellfish Research, v. 39, no. 1, p. 113–124. [Available at https://doi.org/10.2983/035.039.0111.]
VanBlaricom, G.R., Neuman, M., Butler, J., DeVogelaere, A., Gustafson, R.R., Mobley, C., Richards, D., Rumsey, S., and Taylor, B.L., 2009, Status review report for black abalone: Long Beach, Calif., National Marine Fisheries Service, 135 p. [Available at https://repository.library.noaa.gov/view/noaa/16216.]
Webber, H.H., and Giese, A.C., 1969, Reproductive cycle and gametogenesis in the black abalone Haliotis cracheroidii (Gastropoda—Prosobranchiata): Marine Biology, v. 4, no. 2, p. 152–159. [Available at https://doi.org/10.1007/BF00347041.]
Wood, S.N., 2017, General additive models—An introduction with R (2d ed.): New York, N.Y., Chapman and Hall/CRC, 496 p. [Available at https://doi.org/10.1201/9781315370279.]
For more information concerning the research in this report, contact the
Director, Western Ecological Research Center
U.S. Geological Survey
3020 State University Drive East
Sacramento, California 95819
https://www.usgs.gov/centers/werc
Publishing support provided by the Science Publishing Network,
Sacramento Publishing Service Center
Disclaimers
Any use of trade, firm, or product names is for descriptive purposes only and does not imply endorsement by the U.S. Government.
Although this information product, for the most part, is in the public domain, it also may contain copyrighted materials as noted in the text. Permission to reproduce copyrighted items must be secured from the copyright owner.
Suggested Citation
Kenner, M.C., and Yee, J.L., 2025, Black abalone surveys at Naval Base Ventura County, San Nicolas Island, California—2022 annual report: U.S. Geological Survey Open-File Report 2025–1014, 34 p., https://doi.org/10.3133/ofr20251014.
ISSN: 2331-1258 (online)
Study Area
| Publication type | Report |
|---|---|
| Publication Subtype | USGS Numbered Series |
| Title | Black abalone surveys at Naval Base Ventura County, San Nicolas Island, California—2022 annual report |
| Series title | Open-File Report |
| Series number | 2025-1014 |
| DOI | 10.3133/ofr20251014 |
| Publication Date | June 13, 2025 |
| Year Published | 2025 |
| Language | English |
| Publisher | U.S. Geological Survey |
| Publisher location | Reston, VA |
| Contributing office(s) | Western Ecological Research Center |
| Description | viii, 34 p. |
| Country | United States |
| State | California |
| Other Geospatial | Naval Base, Ventura County, San Nicolas Island |
| Online Only (Y/N) | Y |