

Black Abalone (Haliotis cracherodii) Population Density, Recruitment, Size Structure, and Population Growth at Naval Base Ventura County, San Nicolas Island, California, 2013–22
Links
- Document: Report (1.5 MB pdf) , HTML , XML
- Related Work: Open-File Report 2025-1014 - Black abalone surveys at Naval Base Ventura County, San Nicolas Island, California—2022 annual report
- Download citation as: RIS | Dublin Core
Acknowledgments
We would like to thank the U.S. Navy for funding and facilitating this research project. The analytical methods in this report were developed from constructive discussions with the Black Abalone Recovery Team established by the National Marine Fisheries Service under the Black Abalone Recovery Plan. Thanks also to Melissa Miner and Melissa Neuman for their constructive comments on an earlier draft of this report.
Abstract
The range of the endangered black abalone (Haliotis cracherodii) is divided into the North Central California region, the Central California region, the Southern California Mainland region, the Channel Islands region, and the Baja California region by the National Marine Fisheries Service for management purposes. San Nicolas Island is one of eight subregions of the Channel Islands region. The black abalone recovery plan establishes five demographic criteria for the possible delisting or downlisting of the species. The U.S. Geological Survey monitors nine long-term intertidal black abalone sites at San Nicolas Island, California, in cooperation with the U.S. Navy, which owns the island. This report uses data collected between 2013 and 2022 and the delisting criteria to analyze and describe the density, recruitment, size structure, and population trends at the nine U.S. Geological Survey monitoring sites at San Nicolas Island.
Introduction
For management purposes, the Final Endangered Species Act Recovery Plan for Black Abalone (Haliotis cracherodii; National Marine Fisheries Service [2020] at https://repository.library.noaa.gov/view/noaa/27415; hereinafter referred to as the Recovery Plan) considers the range of the black abalone to be distributed among five regions. These regions are the North Central California region, the Central California region, the Southern California Mainland region, the Channel Islands region, and the Baja California region. San Nicolas Island is one of eight subregions of the Channel Islands region. The Recovery Plan establishes five demographic criteria for the possible delisting or downlisting of the species. The criteria are similar for downlisting and delisting and differ only in the number of subregions within each region that should meet the conditions for each criterion. At the time that the Recovery Plan was developed, a test run analysis was done on data collected up to 2015 or 2016, depending on the subregion, to help determine and refine the thresholds for the criteria.
This report updates the analysis and describes the density, recruitment, size structure, and population trends in the data collected through 2022 at the nine long-term monitoring sites at San Nicolas Island (fig. 1). As stated in the “Criterion 1: Geographic range occupied” section of the Recovery Plan, this criterion is met at the subregion level if the species is present in each of the last 5 years. At San Nicolas Island, black abalone were detected and counted annually at all the sites from 2001 to 2022 (Kenner and Yee, 2025). Data that can be used by managers to evaluate the remaining four population-based criteria are presented below. As context, we reiterate the Recovery Plan criteria for the subregion level here. We provide data related to these criteria but do not evaluate whether the criteria have been met because that evaluation is the purview of those managing the taxon and is beyond the scope of U.S. Geological Survey.
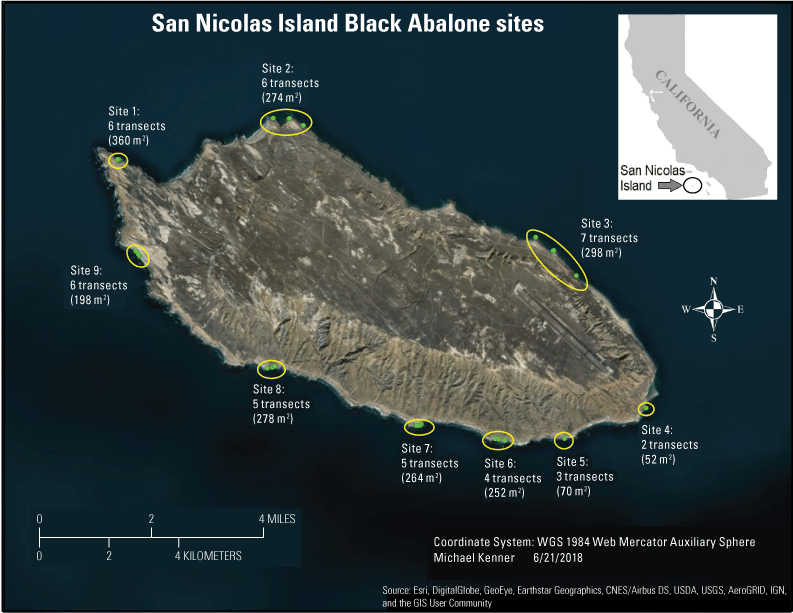
Black abalone (Haliotis cracherodii) monitoring sites on San Nicolas Island, California, showing location, number of transects, and total sampling area at each site. Abbreviations: CNES/Airbus DS, National Centre for Space Studies/Airbus Defense and Space; IGN, Institut Geographique National; m2, square meters; USDA, U.S. Department of Agriculture; USGS, U.S. Geological Survey; WGS 1984, World Geodetic System of 1984.
The “Criterion 2: Habitat-based density” section of the Recovery Plan states that the criterion is met if the measured density of black abalone is at least the expected density, based on the quality of habitat, at 50 percent or more of study sites, for at least each of the past 5 years. The expected density for the different habitat quality categories has not yet been developed for the many geographic subregions of the black abalone population. Developing these expected densities is a recovery action task laid out in the Recovery Plan.
The “Criterion 3: Recruitment” section of the Recovery Plan states that the criterion is met if black abalone recruit successfully, at 50 percent or more of study sites, determined by evidence of recruitment events observed in at least 2 non-consecutive years over the past 10 years. The “Criterion 4: Size structure” section of the Recovery Plan states that the criterion is met if black abalone populations are characterized by a broad distribution of size classes representing multiple cohorts that are stable at 50 percent or more of study sites over at least the past 5 years. The size distribution should consist of at least 40 percent small adults (from 50 to 100 millimeters [mm] shell length [SL]) and at least 10 percent large adults (greater than 100 mm SL).
Finally, the “Criterion 5: Population trend” section of the Recovery Plan states that the criterion is met if population growth for reproductively mature individuals (greater than 50 mm SL) is stable or increasing when averaged across all study sites and at 50 percent or more of the individual study sites over at least the past 10 years, indicating that juveniles are surviving to adulthood to reproduce and maintain or increase populations over time. Each of the study sites also must meet or exceed a minimum population growth rate. The minimum population rate proposed in the Recovery Plan is based on black abalone populations from Monterey County that have not suffered withering syndrome declines and exist in the presence of southern sea otters (Enhydra lutris nereis). This is a preliminary report with tables that provide data for San Nicolas Island black abalone populations with respect to these population criteria.
Methods and Results
Information on the location of the nine San Nicolas Island sites and monitoring field methods is in Kenner and Yee (2025). Other methods used for this analysis are described in the following sections.
Habitat-Based Density
For Criterion 2: Habitat-based density, the population density for at least half the monitored sites within a subregion must meet the expected density for the habitat quality in each of the last 5 years (National Marine Fisheries Service, 2020). Therefore, the rating of the habitat quality of the nine San Nicolas Island sites needed to be determined, and the expected habitat-based density needed to be agreed upon. It is not clear how habitat quality at the San Nicolas Island sites was assessed for the test run analysis (appendix B of National Marine Fisheries Service [2020]), nor what quantitative mix of habitat quality each site was ultimately assigned. Three categories of habitat quality have been designated in habitat surveys completed along the California coast: (1) good, (2) moderate, and (3) poor (National Marine Fisheries Service, 2020). Good habitat is characterized by deep cracks or crevices greater than 10–15 centimeters (cm), or boulders. Moderate habitat is characterized by shallow or wide cracks, crevices, or depressions. Poor habitat is defined by flat, open, bare substrate, with no or minimal protection. In the 2022 field season, each of the 2,054 annually monitored permanent 1-square meter (m2) quadrats at San Nicolas Island was rated into one of the three habitat categories. Photographs of most of the transects are in Kenner (2020).
Although the Recovery Plan states that regional expected densities will eventually be developed, central California habitat-based densities were used as the expected densities for the test run analysis reported in the Recovery Plan because the central California populations were non-depleted but exposed to natural predators, including sea otters, and anthropogenic pressures (National Marine Fisheries Service, 2020). The values used in the test run and in this report are defined for each habitat quality category: Good habitat expected density is 1.58 abalone per m2; Moderate habitat expected density is 0.278 abalone per m2; and Poor habitat expected density is 0.0049 abalone per m2.
To evaluate habitat-based density for each of the San Nicolas Island sites for this report, the proportion of each of the three habitat quality categories at a site was multiplied by the expected density for each category, and the products were summed, yielding an expected density for each site (table 1). The total number of abalone counted at each site in each of the last 5 years, 2018–22, was used to calculate a measured density for each site and year. The annual observed density for each site can be compared to the calculated expected density provided for each site. The measured density exceeded the calculated expected density at three of the sites (6, 7, and 8) during each of the last 5 years (2018–22). These values are presented in table 2.
Table 1.
Total number of 1-square meter (m2) quadrats, number of quadrats in each habitat quality category (good, moderate, poor), and expected density (abalone per m2) for each of the nine black abalone (Haliotis cracherodii) monitoring sites at San Nicolas Island, California.[Good habitat is characterized by deep cracks or crevices greater than 10–15 centimeters (cm), or boulders. Moderate habitat is characterized by shallow or wide cracks, crevices, or depressions. Poor habitat is defined by flat, open, bare substrate, with no or minimal protection. The proportion of each of the three habitat quality categories at a site was multiplied by the expected density for each, and the products were summed. The expected densities used were Good, 1.58 abalone per m2; Moderate, 0.278 abalone per m2; Poor, 0.0049 abalone per m2]
Table 2.
Black abalone (Haliotis cracherodii) densities from 2018 to 2022 at the nine monitoring sites at San Nicolas Island, California.[To calculate the expected density of a site, the proportion of each of the three habitat quality categories observed at a site was multiplied by the expected density for each, and the products were summed. The expected densities used were Good, 1.58 abalone per square meter (m2); Moderate, 0.278 abalone per m2; Poor, 0.0049 abalone per m2]
Recruitment
For Criterion 3: Recruitment, it must be evident in at least 2 non-sequential years in a 10-year period at 50 percent or more of the sites in a subregion. Evidence of recruitment is defined in the Recovery Plan as the presence at a site of at least 10 individuals less than or equal to 30 mm in length (National Marine Fisheries Service, 2020). In the San Nicolas Island black abalone sampling protocols, we measure all accessible abalone on a site until at least 200 have been measured, if that many are counted. Beginning in 2019, for individuals that were not measured because of accessibility problems or excess sample size, classifications of abalone as recruits (30 mm or less in length) or non-recruits (greater than 30 mm) were estimated visually. For the recruitment data presented here, estimated recruits are included as part of the measure of recruitment, but they are noted separately because they represent a change in methods starting in 2019 (table 3). Sites 3, 5, 7, 8, and 9 had two or more non-sequential recruitment events in the last 10 years.
Table 3.
Number of recruits (R), defined as black abalone (Haliotis cracherodii) counted with a shell length less than or equal to 30 millimeters (mm), calculated annually from 2013 to 2022 at the nine monitoring sites at San Nicolas Island, California.[R measured are those measured in the field. R estimated are those that appeared to be recruitment size but were not measured. R total is the sum of measured recruits and estimated recruits. Years with no recruits at a site are not listed. Abbreviation: —, recruits were not estimated]
Size Structure
Criterion 4 states that the size structure of the populations at 50 percent or more of the sites in a subregion must favor young adults such that at least 40 percent of the population at these sites must be 50–100 mm SL (small adults) and at least 10 percent must be more mature individuals that are greater than 100 mm SL (large adults). This analysis is to be based on a sample size of at least 50 measured individuals and is to be calculated as the most recent value of a running cumulative proportion over a 5-year period (National Marine Fisheries Service, 2020). Sites 7 and 8 have several hundred abalone, and at these sites, the measuring of SLs was curtailed after at least 200 measurements were made. Because most or all the reachable abalone on the first three transects were measured, this analysis uses only these transects at these two sites. The population structure conditions are presented in table 4. Only sites 6, 7, and 8 had more than 50 individuals every year over the past 5 years, and they had 64.5, 41.0, and 25.4 percent, respectively, in the small adult size category. All three sites had more than 10 percent in the large adult category.
Table 4.
Size structure of black abalone (Haliotis cracherodii) from 2018 to 2022 at the nine monitoring sites at San Nicolas Island, California. Counts and percentages of small (50–100 millimeter [mm] shell length [SL]) and large (greater than 100 mm SL) abalone for each site are displayed.[Counts and percentages of small (50–100 millimeter [mm] shell length [SL]) and large (greater than 100 mm SL) abalone for each site are displayed. At sites 7 and 8, only the counts from the first three transects are listed and used to calculate percentages. Abbreviation: >, greater than]
Population Trend
Criterion 5 focuses on the population growth rate of reproductively mature individuals, defined in the Recovery Plan as having greater than 50 mm SL. The population growth rate for this size class measured over a 10-year period must be (1) stable or increasing when averaged over all sites in the subregion; (2) stable or increasing at 50 percent or more of the sites; and (3) greater than or equal to a minimum expected growth rate at all sites (National Marine Fisheries Service, 2020). The minimum expected growth rate suggested by the Recovery Plan is currently under review by the Black Abalone Recovery Team but is expected to be the smallest growth rate calculated from apparently healthy populations in central California during 2009–16 (Susan Wang, National Marine Fisheries Service, oral commun., 2023).
The protocol for collecting size data at the San Nicolas Island sites that have high numbers of abalone can yield misleading results when calculating population growth of a specified size class. The protocol at these sites is to measure at least 200 abalone, which captures a reasonable size distribution sample without using too much valuable field time during the low tide sampling window. The actual number measured can vary considerably between field seasons depending on the accessibility of abalone, tidal heights, time of day, sea state, and other limiting weather conditions and is not related to changes in the population size. Because the analysis for this criterion requires that population growth be based on numbers of abalone of a certain size class (greater than 50 mm SL), the number being used to calculate population growth is affected by the size of the sample of measured individuals, not the counted number of total individuals. Sites 7 and 8 are the only sites where measurements are limited by sample size rather than just accessibility. At these sites, transects 1–3 were counted first to prioritize consistency, and most abalone counted on transects 4–5 were rarely measured after reaching the sample size limit for measurements. To reduce sampling variations when evaluating changes across time, only data from transects 1 to 3 were used in this analysis for sites 7 and 8. The numbers reported for these sites represent extrapolated estimates for counts of abalone in the greater than 50 mm SL size class on transects 1–3. To account for sampling error, we calculated 95-percent confidence intervals (CI) for the true proportion of abalone in that size class among all abalone counted on these transects by using the “svyciprop” function in the “survey” package of R statistical software (Korn and Graubard, 1998; Lumley, 2004; R Core Team, 2023) and then multiplied the CI limits of the proportion with the total abalone counted to derive 95-percent CI for the number of abalone in this size class.
To address (1) of Criterion 5, the average population growth rate at the nine San Nicolas Island black abalone monitoring sites from 2013 to 2022 was calculated from the slope over those 10 years of the Log10[Mean(Total count)+1], where Mean(Total count) is the total number of measured abalone in the adult size class (greater than 50 mm SL) for all the sites divided by the number of sites. The resulting average population growth rate for San Nicolas Island was −0.003 (table 5). Growth rates at the individual sites were calculated to address (2) and (3), of Criterion 5, described earlier, using the slope over the last 10 years of the Log10[(Total count)+1], where (Total count) is the total number of measured abalone in the adult size class at each site. Five sites (1, 2, 4, 6, and 9) had positive growth rates, and four sites (3, 5, 7, and 8) had negative growth rates (table 5). Site 6 had the highest calculated growth rate (0.097), and site 3 had the lowest calculated growth rate (−0.037).
Table 5.
Annual and average population growth trend for black abalone (Haliotis cracherodii) greater than 50 millimeters (mm) shell length (SL) over a 10-year period at the nine monitoring sites at San Nicolas Island, California.[At sites 7 and 8, only size data from the first three transects were used. We calculated 95-percent confidence intervals (CI) for the true proportion of abalone greater than 50 mm among all abalone counted on these transects and then multiplied the CI limits of the proportion with the total abalone counted to derive 95-percent CI (shown in parentheses) for the number of abalone in this size class. Abbreviation: >, greater than]
Discussion
Habitat-Based Density
Rating the habitat quality of each quadrat was subjective but not time-consuming. Because expected densities are different for the three habitat quality categories, varying interpretations of the categories may result in different site-specific expected densities. For example, preferentially rating habitat with low-quality ledges as moderate rather than poor will yield expectations of higher densities than warranted and could result in a lower or misleading rate of meeting the population density criterion. Some training between monitoring groups working in different regions and using different protocols could reduce this variability.
Recruitment
Classifying non-measured abalone as recruits or not has only been done since 2019. Only once in this analysis did the change in classification make a difference in raising the number of recruits above 10 in a year (site 9 in 2020). This change in protocol results in more abalone being classified as recruits, which eventually could result in more sites exceeding the 10-recruit threshold as the analysis is repeated in future years.
Size Structure
Out of the 9 sites at San Nicolas Island, 6 had less than 50 measured individuals in each of the last 5 years. Of these, only site 1 consistently had counts exceeding 50, but abalone were often inaccessible and could not be measured. Beginning in 2022, all abalone that were not measured were estimated into size bins. In a few years, these bins could be used to increase the number of sites with meaningful size-structure data. Several of the other sites are close to having 50 abalone counted and, if counts continue to increase, could contribute to this analysis in future years.
Population Trend
This analysis is based on changes in the numbers of reproductive-size abalone and is affected by the proportions of counted populations that are sized. Therefore, size samples that are incomplete because of inaccessible or numerous abalone can affect interpretations of the data. The size binning of non-measured abalone that began in 2022 could eventually alleviate this problem, but because the growth rate trend examines a 10-year period, data collected using the new protocol cannot be used to examine population trends for several years.
References Cited
Kenner, M.C., 2020, Black abalone surveys at Naval Base Ventura County, San Nicolas Island, California—2019, annual report: U.S. Geological Survey Open-File Report 2020–1047, 41 p., accessed December 20, 2023, at https://doi.org/10.3133/ofr20201047.
Kenner, M.C., and Yee, J.L., 2025, Black abalone surveys at Naval Base Ventura County, San Nicolas Island, California—2022 annual report: U.S. Geological Survey Open-File Report 2025–1014, 34 p. [Available at https://doi.org/10.3133/ofr20251014.]
Lumley, T., 2004, Analysis of complex survey samples: Journal of Statistical Software, v. 9, no. 8, p. 1–19. [Available at https://doi.org/10.18637/jss.v009.i08.]
National Marine Fisheries Service, 2020, Final Endangered Species Act (ESA) recovery plan for black abalone (Haliotis cracherodii): Long Beach, Calif., National Oceanic and Atmospheric Administration, National Marine Fisheries Service, West Coast Region, Protected Resources Division, 112 p., accessed January 9, 2025, at https://repository.library.noaa.gov/view/noaa/27415.
R Core Team, 2023, R—A language and environment for statistical computing: Vienna, Austria, R Foundation for Statistical Computing, accessed December 20, 2023, at https://www.R-project.org/.
For more information concerning the research in this report, contact the
Director, Western Ecological Research Center
U.S. Geological Survey
3020 State University Drive East
Sacramento, California 95819
https://www.usgs.gov/centers/werc
Publishing support provided by the Science Publishing Network,
Sacramento Publishing Service Center
Disclaimers
Any use of trade, firm, or product names is for descriptive purposes only and does not imply endorsement by the U.S. Government.
Although this information product, for the most part, is in the public domain, it also may contain copyrighted materials as noted in the text. Permission to reproduce copyrighted items must be secured from the copyright owner.
Suggested Citation
Kenner, M.C., and Yee, J.L., 2025, Black abalone (Haliotis cracherodii) population density, recruitment, size structure, and population growth at Naval Base Ventura County, San Nicolas Island, California, 2013–22: U.S. Geological Survey Open-File Report 2025–1015, 10 p., https://doi.org/10.3133/ofr20251015.
ISSN: 2331-1258 (online)
Study Area
| Publication type | Report |
|---|---|
| Publication Subtype | USGS Numbered Series |
| Title | Black abalone (Haliotis cracherodii) population density, recruitment, size structure, and population growth at Naval Base Ventura County, San Nicolas Island, California, 2013–22 |
| Series title | Open-File Report |
| Series number | 2025-1015 |
| DOI | 10.3133/ofr20251015 |
| Publication Date | June 13, 2025 |
| Year Published | 2025 |
| Language | English |
| Publisher | U.S. Geological Survey |
| Publisher location | Reston, VA |
| Contributing office(s) | Western Ecological Research Center |
| Description | vi, 10 p. |
| Country | United States |
| State | California |
| Other Geospatial | Naval Base Ventura County, San Nicolas Island |
| Online Only (Y/N) | Y |