

The Feasibility of Using Lidar-Derived Digital Elevation Models for Gravity Data Reduction
Links
- Document: Report (12.3 MB pdf) , HTML , XML
- Version History: Version History (654 B txt)
- NGMDB Index Page: National Geologic Map Database Index Page
- Download citation as: RIS | Dublin Core
Acknowledgments
The authors would like to thank Dr. Snehamoy Chatterjee of the Michigan Technological University for his helpful discussion of statistical data analysis; Joshua Nimetz of the U.S. Geological Survey (USGS) for his helpful discussion on lidar data acquisition, processing, and formats; and Anji Shah and Phil Brown of the USGS for their thorough reviews of our manuscript. Val Chandler of the Minnesota Geological Survey was an early proponent of using lidar-derived digital elevation models for gravity work and challenged us to undertake this study.
Abstract
Gravity data require submeter elevation accuracy for data processing, and differential global navigation satellite system (dGNSS) equipment is commonly used to acquire three-dimensional positional data to achieve such accuracy. However, lidar (light detection and ranging) data are commonly used to develop digital elevation models (DEMs) of Earth’s surface. Therefore, using elevations from lidar-derived DEMs for gravity-data acquisition and reduction may improve field efficiency and reduce cost. This study examines the feasibility of using DEMs for gravity-data reduction by comparing dGNSS elevation data from 435 gravity stations in Michigan, Wyoming, and Colorado with their respective DEM elevations. The results show that the average difference between DEM and dGNSS elevations is 13 centimeters (cm) and that 93 percent of those differences are less than 50 cm, even in areas with steep terrain. Because an elevation discrepancy of 50 cm corresponds to an error of roughly 0.1 milligals (mGal) in the simple Bouguer gravity anomaly, the results suggest that lidar-derived DEMs are a viable source for acquiring the elevation data needed to process gravity data, thus improving both the cost and efficiency of data collection for regional surveys where an accuracy of less than 1.0 mGal is desired.
Introduction
The gravity geophysical method is a useful, often essential, tool for mapping subsurface geology. Gravity data reduction (processing) relies heavily on accurate and precise elevation measurements, which are often achieved using high-precision (submeter) differential global navigation satellite system (dGNSS) equipment that can determine gravity-station elevations within less than 1 meter. This sort of “surveying grade” dGNSS equipment typically costs tens of thousands of dollars and requires the daily setup of a local base station that must be secured. If the requirement for expensive dGNSS equipment and the corresponding need for a local base station can be eliminated, gravity data acquisition would become less expensive and more efficient. This report examines the feasibility of using elevations taken from lidar-derived DEMs for use in the reduction of gravity data as a possible replacement for measurements that require the use of expensive dGNSS equipment. The assessment involves comparing gravity-station elevations acquired using high-precision dGNSS equipment with elevations sampled from lidar-derived DEMs at the same locations. Nondifferentially corrected horizontal coordinates provided by the dGNSS measurements were used to simulate the effect of data acquisition without using a GNSS base station.
Gravity Data Acquisition and Reduction
Gravity data are acquired using gravimeters, usually spring-type balances that measure relative gravity by the change of strain (length) on an internal spring (for example, Hinze and others [2012]). A change in gravity causes the displacement of a test mass within these devices that can be nullified by adjusting the spring length to compensate for the test mass displacement. The spring length needed to nullify the balance is then used to calculate the gravity at a specific location. Gravity measurements are taken relative to a base station, where the absolute value of the gravity field intensity is typically known to within 0.1 milligal (mGal). Measurements of variations in the Earth’s gravity field (anomalies) are produced by lateral variations of density within the subsurface (as in Hinze and others [2012]). The measured gravity field is affected by multiple factors, including time-varying factors (such as tides and instrument drift), latitude, elevation, the terrain surrounding the measurement locations (stations), and the density of the Earth. To isolate anomalies produced by local density variations relatable to geology, a series of corresponding corrections must be applied to the observed gravity (for example, Longman [1959] and Blakely [1995]). Accurate elevation measurements are crucial for calculating the free-air and Bouguer gravity anomalies. So, the quality of a gravity survey is heavily dependent on precise elevation control, as an elevation error of 50 centimeters (cm) results in a 0.1 mGal error in the simple Bouguer anomaly.
Lidar Acquisition and Processing
Lidar is a remote-sensing method that uses light as a pulsed laser to measure distances to the Earth from an airborne platform (for example, National Oceanic and Atmospheric Administration [NOAA], [2023]). Data are collected from an aircraft with three main components: a laser scanner unit, a global navigation satellite system (GNSS) unit, and an inertial measurement unit (IMU) (Habib and others, 2005; Hollaus and others, 2005; Reutebuch and others, 2005; Webster and Dias, 2006; Pfeifer and Briese, 2007; Liu, 2008). The laser scanner emits pulses around 1,000 nanometers at a near-infrared wavelength (for example, Elaksher [2016]) and contains a receiver that detects the time it takes for the pulsed laser to reach the Earth and return (fig. 1). These reflections are recorded as individual points that define a point cloud, which can be processed to represent locations on the surface of the Earth (Sugarbaker and others, 2014). The recorded reflections occur from vegetation, the ground surface, and even human-made objects (see Barber and Shortrudge [2004] and Stoker and others [2006]). Therefore, a critical step in lidar processing is ensuring that unwanted artifacts (nonground) are extracted from the data before DEM construction (Liu, 2008).
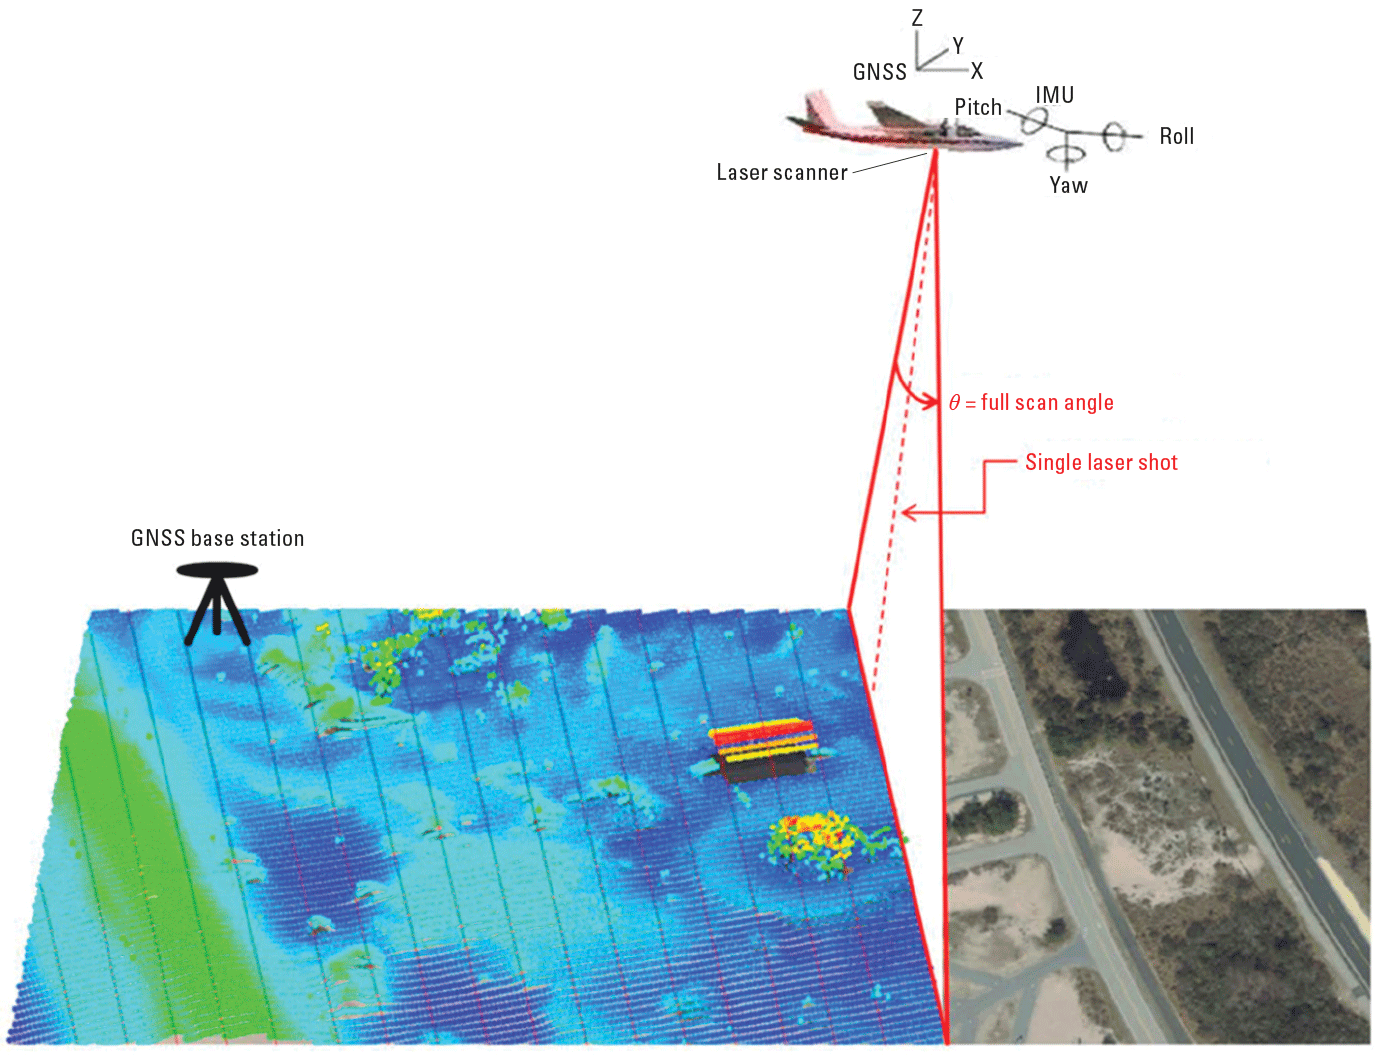
A schematic of light detection and ranging (lidar) data acquisition, modified from National Oceanic and Atmospheric Administration (2012), showing an aircraft scanning the Earth’s surface with lidar and revealing lidar topography information while simultaneously receiving global navigation satellite system (GNSS) and inertial measurement unit data. The full scan angle (θ) from the aircraft and a single laser shot within that scan are shown. A GNSS base station is shown on Earth’s surface.
The GNSS unit records the aircraft’s trajectory, and the IMU measures the aircraft’s altitude; both directly influence the accuracy of the lidar points (Webster and Dias, 2006). Analysts supplement and validate the lidar data with ground-control checkpoints having known horizontal and vertical positions to ensure horizontal and vertical accuracy. Table 1 gives the minimum number of checkpoints recommended by the American Society for Photogrammetry and Remote Sensing (ASPRS) based on the area of the DEM being constructed; however, these checkpoints may be altered based on the desired quality level (QL) of the DEM (ASPRS, 2023).
Table 1.
The minimum number of checkpoints recommended per square kilometer (km2) of a light detection and ranging survey from the American Society for Photogrammetry and Remote Sensing (2023).[≤, less than or equal to]
The quality level (QL) of a lidar survey is determined by the nominal pulse spacing (NPS) and the vertical positional accuracy, as specified in table 2 (U. S. Geological Survey [USGS], undated.). QL2 lidar-derived DEMs were used for this analysis.
Table 2.
The requirements for different quality level (QL) light detection and ranging (lidar) data; quality level 2 (QL2) are used in this report.[This table is modified from the U.S. Geological Survey (USGS) 3D Elevation Program (3DEP) (USGS, undated). cm, centimeter; DEM, digital elevation model; m, meter; NPD, nominal pulse density; NPS, nominal pulse spacing; pts per m2, points per square meter; RMSEz, root mean square error in the vertical (z) direction; QL, quality level; ≤, less than or equal to; ≥, greater than or equal to]
Several methods can be used for extracting nonground points from the raw lidar point-cloud, such as triangulated irregular network (TIN) filtering, slope-based filtering, mathematical morphological filtering, interpolation-based filtering, and machine-learning-based filtering (Cai and others, 2020). The USGS 3D Elevation Program (3DEP) typically requires TIN filtering to assess both the vegetated and nonvegetated vertical accuracy of lidar data (USGS, 2024). TIN filtering uses a triangulation algorithm to create a surface model from the point-cloud data. The height of each point is compared with its neighbor within the triangle, and points having a significantly higher height than their neighbors are removed (Peucker and others, 1976). After extracting nonground points from the lidar data, a DEM is interpolated based on the remaining ground points. Interpolation is predicting values at an unsampled location using the measured values nearby (for example, Burrough and McDonnell [1998]). DEM interpolation typically uses inverse distance weighted (IDW), spline-based, or geostatistical methods (such as kriging) (Liu, 2008). Once the interpolation method is chosen, a DEM grid is constructed based on the QL of the data.
Study Design
To study the feasibility of using lidar-derived elevations for gravity-data reduction, we acquired dGNSS elevation data for 435 gravity stations in the Upper Peninsula of Michigan (237 stations, fig. 2A–C), the Wet Mountains of Colorado (59 stations, fig. 3A), and the Medicine Bow Mountains of Wyoming (139 stations, fig. 3B). For each station, Leica Viva GS16 GNSS equipment or a Trimble Geo7x handheld GNSS receiver was used to determine differentially corrected locations (latitude and longitude) and elevations, typically accurate to within 10 cm. To compute differential corrections for the Leica Viva GS16, a GNSS base station located within 25 kilometers (km) of the stations was used. For the Trimble Geo7x, the NOAA Continuously Operating Reference Stations located within 65 km of the gravity stations were used to correct the data differentially. Additionally, GNSS-derived locations were recorded without applying differential corrections to simulate data acquisition conditions without using a GNSS base station.
For the lidar comparisons, 1-meter DEM tiles (QL2) were obtained using the USGS LidarExplorer (USGS, 2022; USGS, 2023), the Michigan Technological University Geospatial Research Facility DEM downloader (Sanborn Map Company, Inc., 2020), or the Colorado Hazard Mapping & Risk MAP Portal (Merrick & Company, 2016; Quantum Spatial, Inc., 2020) and were “mosaiced” together in the ArcGIS Pro software package to encompass the entirety of each gravity survey.3 The nondifferentially corrected gravity station coordinates (North American Datum of 1983) were added to ArcGIS Pro, and the DEM was sampled at each station for comparison with the differentially corrected elevation provided by the dGNSS equipment. The flowchart shown in figure 4 describes each data acquisition, processing, and interpretation step. However, it should be noted that the lidar data were acquired and processed before this study.
Datasets are “mosaiced” or merged using the “Mosaic” tool in the ArcGIS Pro software package.
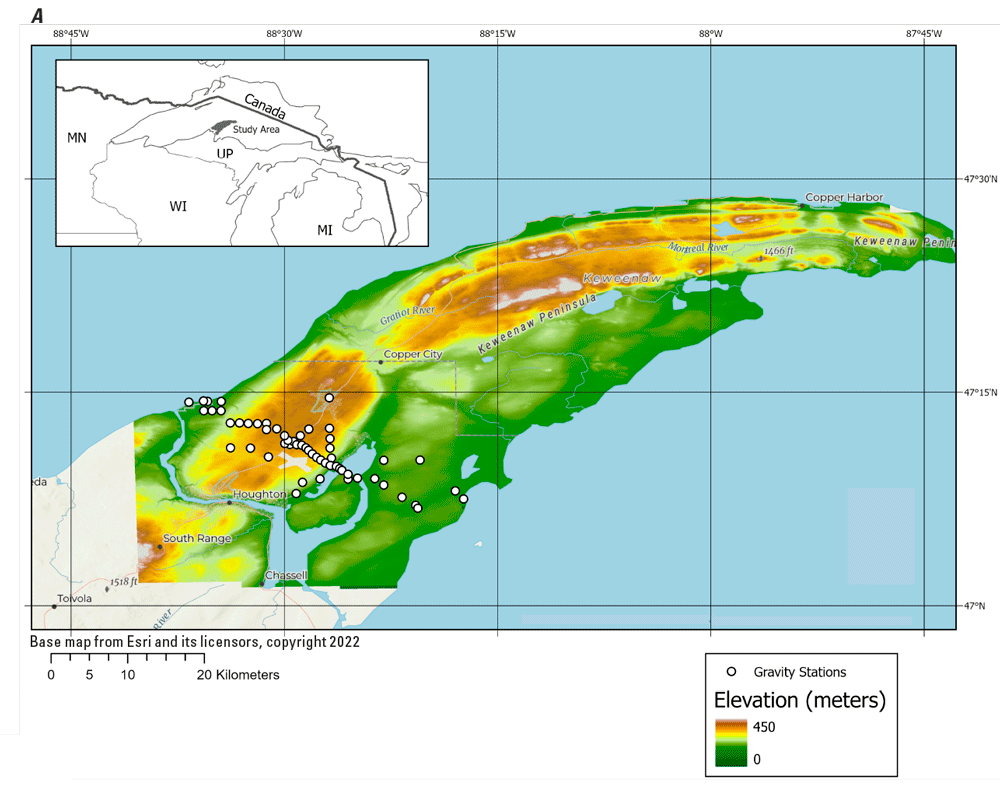
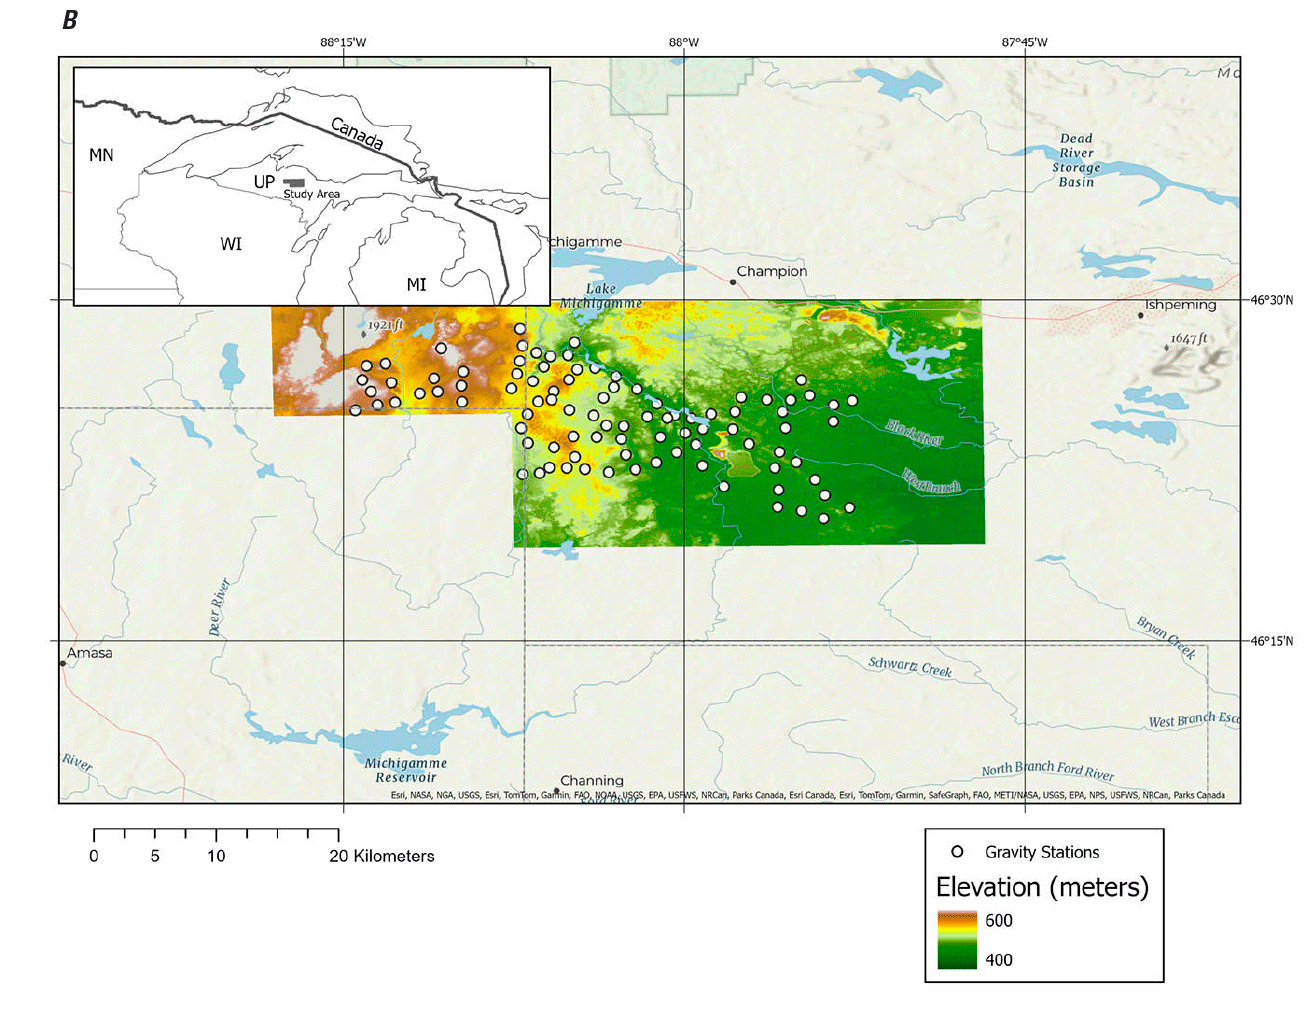
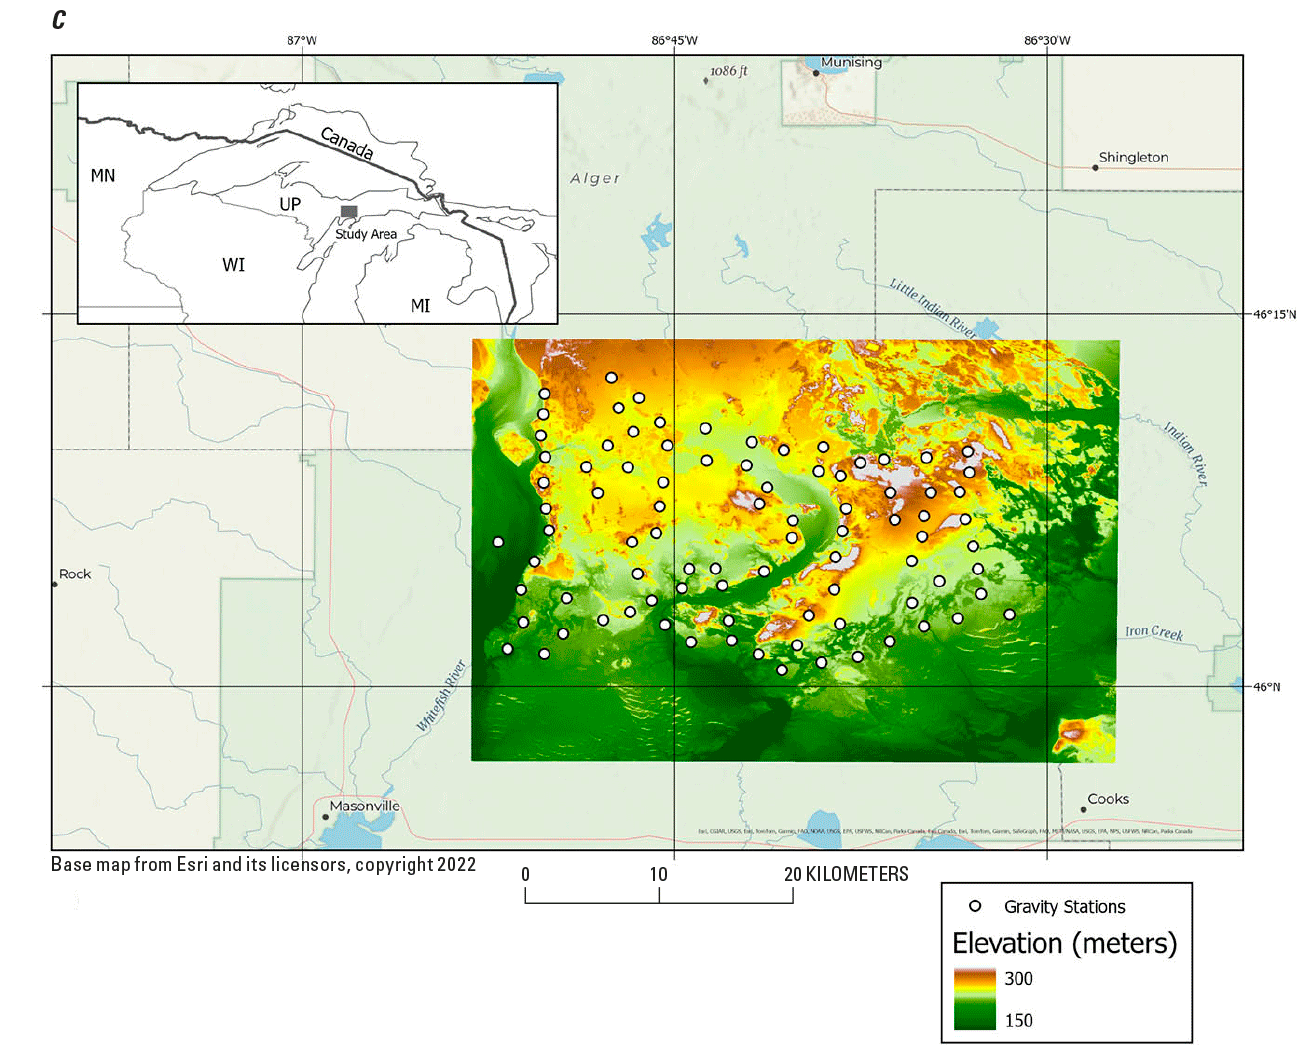
Three maps (A–C) showing the 237 gravity stations in the Upper Peninsula of Michigan for which location information was collected as part of regional gravity surveys. The stations overlay the mosaiced 1-meter (m) digital elevation model (DEM) rasters obtained from the U.S. Geological Survey (USGS) 3D Elevation Program (3DEP) light detection and ranging (lidar) data in the National Map Downloader (USGS, 2022) or the Michigan Technological University Geospatial Research Facility DEM tool (Sanborn Map Company, Inc., 2020). (A) Map showing the 56 gravity stations in the Keweenaw Peninsula of Michigan (MI–KP0) where location data were collected with a Global Navigational Satellite System (GNSS) receiver. Elevation data are from 0 to 450 m. (B) Map showing the 94 gravity stations in the west-central Upper Peninsula of Michigan (MI–HR) where location information was collected with GNSS equipment. Elevation data are from 400 to 600 m. (C) Map showing the 87 gravity stations in the central Upper Peninsula of Michigan (MI–TM) where location information was collected with GNSS equipment. Elevation data are from 150 to 300 m. The prefixes discussed here—MI–KP0, MI–HR, and MI–TM—represent the location aspect of the gravity station numbers in tables 3, 4, and 7 (at the end of this report). ft, foot.
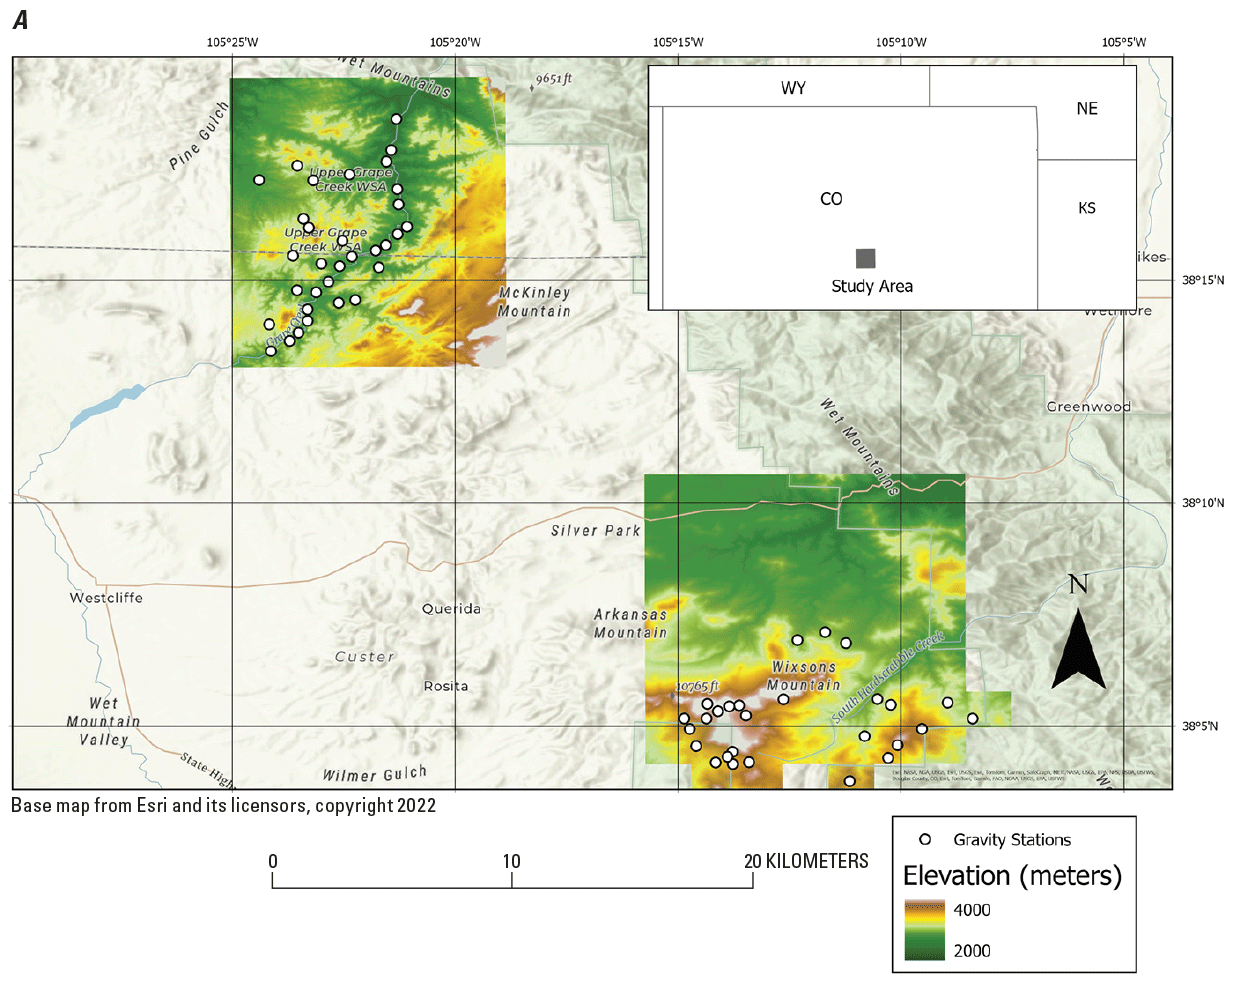
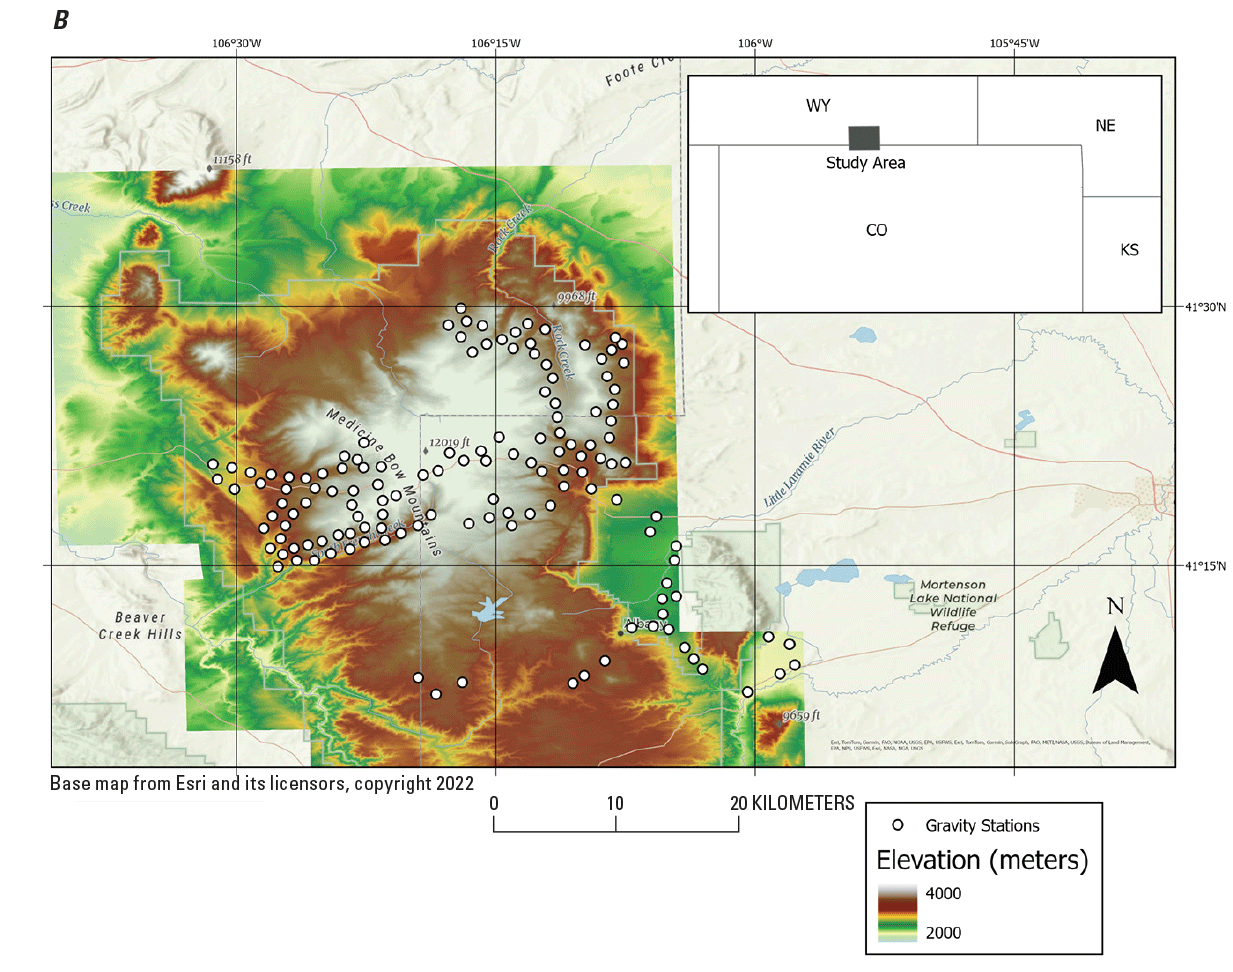
Two maps (A, B) showing the 198 gravity stations in the western United States (Wyoming and Colorado) for which location information was collected as part of regional gravity surveys. The stations overlay the mosaiced 1-meter (m) digital elevation model (DEM) rasters. Light detection and ranging (lidar) data were obtained from two sources. U.S. Geological Survey (USGS) 3D Elevation Program lidar data were retrieved from the USGS National Map Downloader (USGS, 2024). Lidar data from Merrick & Company (2016) and Quantum Spatial, Inc. (2020) were retrieved from the Colorado Hazard Mapping & Risk MAP Portal (Merrick & Company, 2016). (A) Map showing the 59 gravity stations in the Wet Mountains of Colorado (CO–WM) where location information was collected with Global Navigational Satellite System (GNSS) equipment. Elevation data are from 2,000 to 4,000 m. (B) Map showing the 139 gravity stations in the Medicine Bow Mountains of Wyoming (WY–MB) where location information was collected with GNSS equipment. Elevation data are from 2,000 to 4,000 m. The prefixes discussed here—CO–WM and WY–MB—represent the location aspect of the gravity station numbers in tables 5 and 6 (at the end of this report). ft, foot.
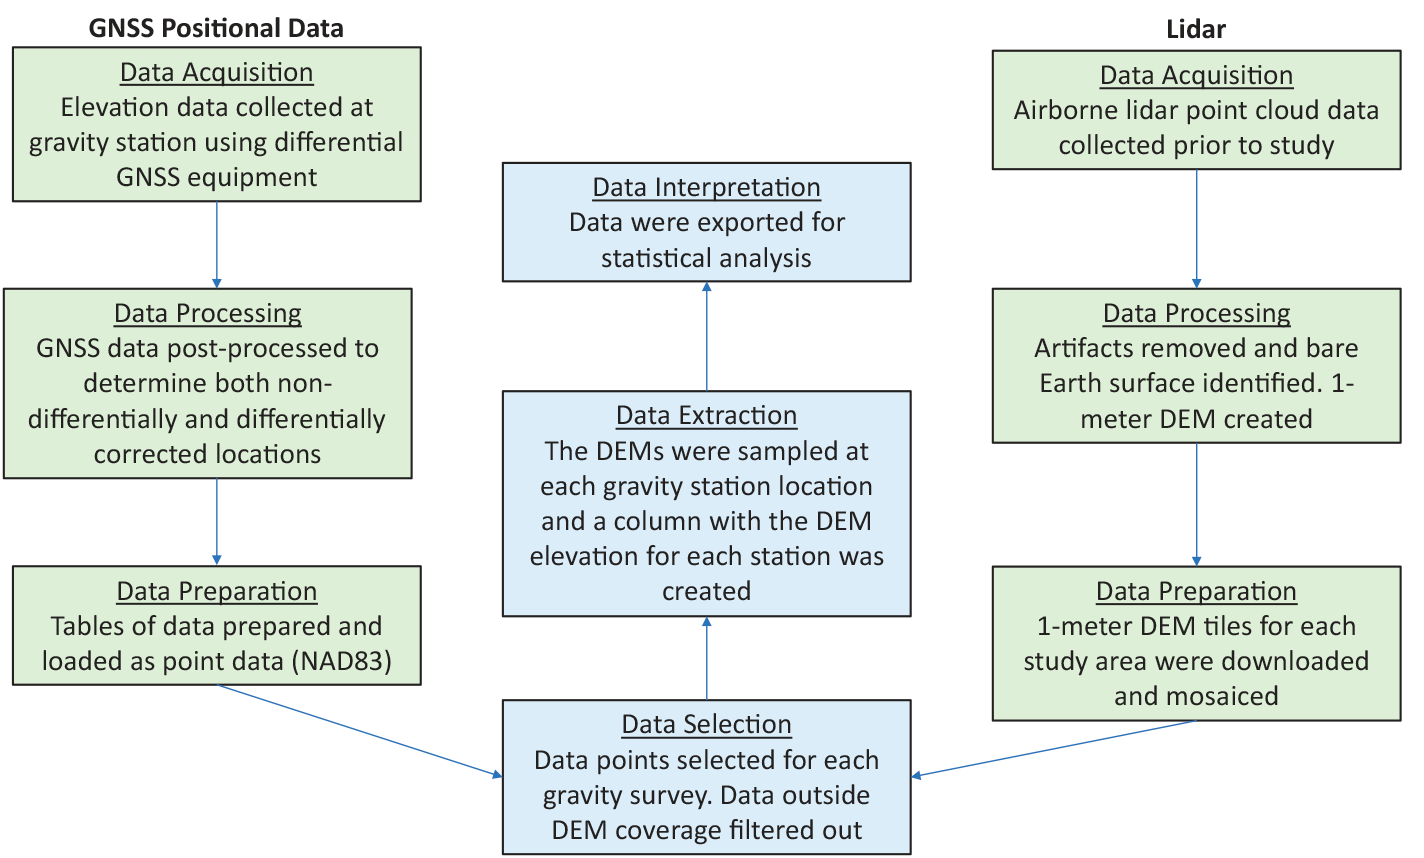
A flowchart showing how global navigational satellite system (GNSS) positional data and light detection and ranging (lidar) data were acquired, processed, and prepared and then how the resulting data for both sets were selected, extracted, and interpreted. DEM, digital elevation model; NAD 83, North American Datum of 1983.
Results
The elevation differences between the dGNSS measurements and DEMs were consistently (93 percent) less than 50 cm, corresponding to a 0.1 mGal error in the simple Bouguer gravity anomaly. Horizontal and vertical positions for all 435 gravity stations are shown in tables 3–7 (at the end of the report) with their respective lidar-derived elevation and the differences between the GNSS and lidar-derived elevations. The distribution of differences between DEM and GNSS elevations is shown in figure 5A, and the distribution of their absolute differences is shown in figure 5B.
The mean difference between the GNSS and DEM-derived elevations is 13 cm with a standard deviation of 46 cm. Approximately 93 percent (N = 406) of the data points fall within 1 standard deviation of the mean (minimum –33 cm; maximum 59 cm). The lower limit for the 95 percent confidence interval is 9 cm, and the upper limit is 17 cm. A maximum positive difference of 3.9 meters (m) and a maximum negative difference of –2.1 m occur in the central Upper Peninsula. However, the mean elevation difference in the Upper Peninsula is 8 cm, a measure less than the average in Colorado and Wyoming (20 cm), which contain steep terrain. Overall, 97 percent (N = 423) of the 435 stations exhibit an elevation difference of less than 1 m. The statistical breakdown for each study area is shown in table 8.
Table 8.
A statistical breakdown of each study area in this project that shows the average elevation difference observed and the number of points with a difference greater than 1 meter (m).[UP, upper peninsula]
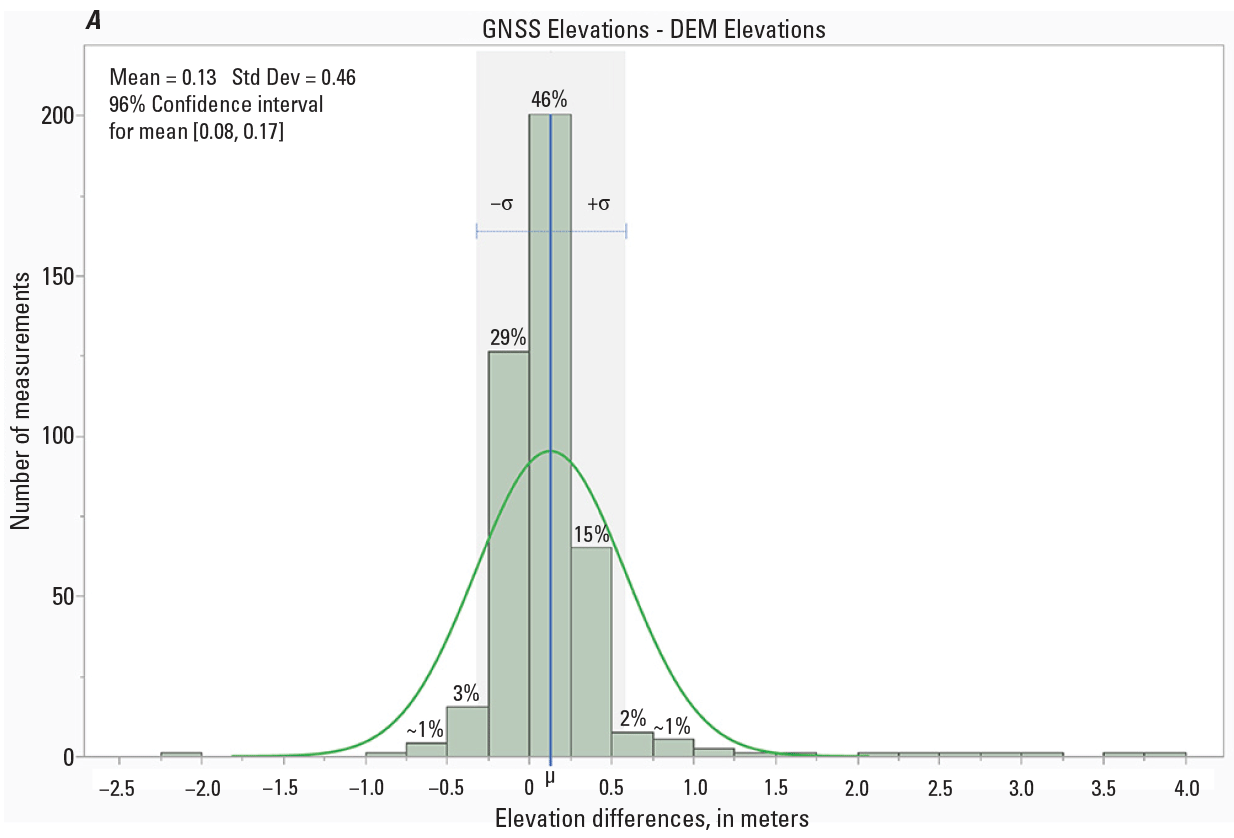
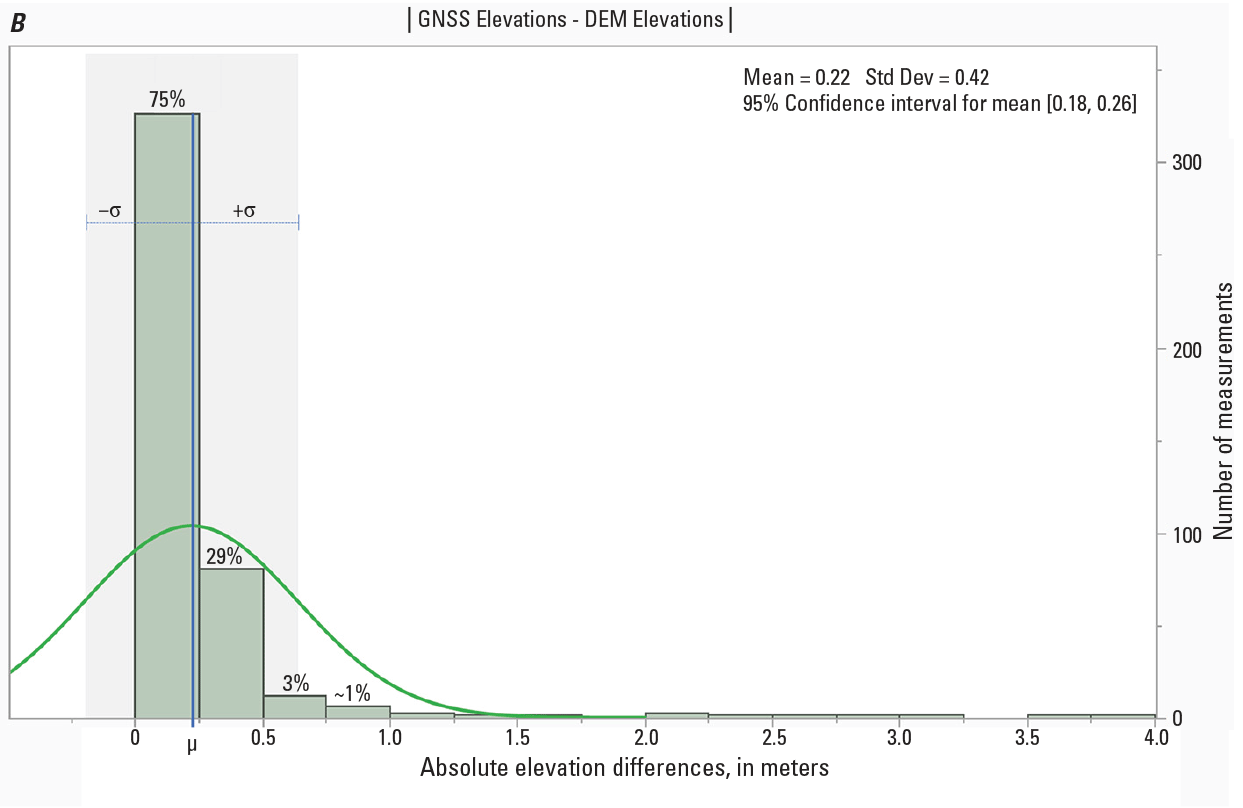
Two bar graphs (A, B) showing elevation distributions. (A) Bar graph that shows the distribution (mean = 0.13, standard deviation = 0.46) of elevation differences (global navigational satellite system–light detection and ranging [GNSS – lidar]) and indicates that 93 percent of the data fall within 1 standard deviation (σ) of the mean (μ) (13 centimeters [cm]). (B) Bar graph that shows the distribution (mean = 0.22, standard deviation = 0.42) of the absolute value of the elevation differences (|GNSS – lidar|) and a mean difference of 22 cm in the absolute differences observed within the data. %, percent; m, meter.
Discussion
Of the 435 gravity stations, 406 (approximately 93 percent) lidar-derived elevations fall within ±50 cm of the dGNSS elevations, meaning that their use would produce an error of less than 0.1 mGal in the simple Bouguer anomaly. Regional gravity surveys commonly focus on mapping anomalies greater than 1 mGal, so an error of 0.1 mGal is not a cause for concern in most cases. Moreover, most absolute base (reference) stations used for gravity-data reduction have an uncertainty of ±0.1 mGal (for example, Morelli and others [1972]). Therefore, this study shows that lidar-derived elevations are sufficiently accurate for regional gravity-data reduction, and, in most cases, their use produces errors comparable to the inherent absolute accuracy of standard regional gravity surveys. For detailed gravity surveys focused on smaller anomalies—those with an accuracy of less than 0.1 mGal—dGNSS equipment may be necessary.
Only 12 gravity stations (less than 3 percent) had elevation differences greater than 1 m between dGNSS and lidar-derived elevations. Seven were in the Upper Peninsula of Michigan, four were in the Medicine Bow Mountains of Wyoming, and one was in the Wet Mountains of Colorado. To identify the sources of these discrepancies, we examined the elevation differences between the lidar-derived elevations and dGNSS elevations using the differentially corrected horizontal coordinates in the Medicine Bow Mountains. The average elevation difference between the measurements was roughly 1-cm less than when the nondifferentially corrected coordinates were used, and the same four stations showed an elevation difference of greater than 1 m. This observation indicates that the four largest elevation discrepancies are not likely related to the lack of differential processing of the horizontal coordinates. Instead, these discrepancies may result from dense vegetation causing a multipath in the GNSS signal, a locally steep elevation gradient, or an unknown error in the dGNSS-derived elevations.
Recommended Field Practices
The use of several recommendations may optimize positional data acquisition for gravity data processing and yield acceptable uncertainty in simple Bouguer gravity values. GNSS equipment (for example, a handheld, non-dGNSS unit) with the ability to detect both Global Positioning System (GPS) and Globalnaya Navigatsionnaya Sputnikovaya Sistema (GLONASS)4 satellites is recommended for obtaining the best possible horizontal position data, especially at higher latitudes where GPS readings are less accurate. Horizontal positional errors may result in the gravity station being mislocated by more than several meters, thus producing elevation inaccuracies. For this reason, placing gravity stations in areas more than 5 m away from steep topographic slopes (such as a locally flat surface) is recommended.
The “Global Navigation Satellite System” is a Russian satellite-based navigation system that provides position information.
The reduction or elimination of multipaths is also necessary for optimizing positional accuracy during data acquisition. A multipath can result from the primary GNSS signal reflecting off buildings, vegetation, or mountains, or from atmospheric scattering. A reduction of this effect can be achieved by placing the GNSS antenna in an elevated position, such as on the roof of a vehicle or a range pole and away from areas with dense vegetation. Placing stations on small platforms above the ground’s surface can also cause inaccuracies in the lidar-derived elevation and should be avoided.
Conclusion
This study evaluated whether lidar-derived DEMs could serve as elevation control for gravity surveys to reduce cost and improve field efficiency. Elevation data from 435 gravity stations in the Upper Peninsula of Michigan, the Medicine Bow Mountains of Wyoming, and the Wet Mountains of Colorado were compared with elevations from a 1-m horizontal-resolution DEM for each station. An average difference of 13 cm between dGNSS and DEM elevations was observed, with a standard deviation of 46 cm. Over 93 percent of the DEM data were within 50 cm of GNSS data, corresponding to a simple Bouguer gravity error of approximately 0.1 mGal.
These results indicate that lidar-derived DEMs provide acceptable elevation control for gravity data reduction, particularly for regional gravity surveys where anomalies of interest are usually greater than 1 mGal in amplitude. In detailed surveys requiring greater accuracy and precision, other means of determining elevations may be required. Twelve stations exhibited elevation differences between dGNSS and DEM data greater than 1 m. The source of this relatively rare discrepancy is unknown but may be related to dense vegetation cover, locally steep elevation gradients, or an unknown error in the dGNSS elevations. This study suggests that using QL2 lidar-derived DEMs for gravity-data reduction is acceptable for most regional surveys.
Tables 3–7
Table 3.
Location information for the 94 gravity stations located at west-central Upper Peninsula of Michigan (MI–HR) from Drenth and Others (2024).[“Gravity station” refers to a unique identifier that is based on the station number used in the data source for this table. “UC LAT” and “UC LON” refer to the horizontal coordinates before differential correction. “DC LAT” and “DC LON” refer to the differentially corrected horizontal coordinates. “DGNSS ELEV” refers to the elevation data from the differential global navigation satellite system (dGNSS) equipment from the differentially corrected coordinates. “LIDAR ELEV” refers to the light detection and ranging (lidar) derived elevation from the 1-meter (m) digital elevation model (DEM). “ELEV DIFF” refers to the elevation difference (dGNSS – lidar), and “ABS ELEV DIFF” refers to the absolute value of this difference. NAD 83, North American Datum of 1983; NAVD 88, North American Vertical Datum of 1988]
Table 4.
Location information for the 87 gravity stations located on the central Upper Peninsula of Michigan (MI–TM) from Drenth and others (2024).[“Gravity station” refers to a unique identifier that is based on the station number used in the data source for this table. “UC LAT” and “UC LON” refer to the horizontal coordinates before differential correction. “DC LAT” and “DC LON” refer to the differentially corrected horizontal coordinates. “DGNSS ELEV” refers to the elevation data from the differential global navigation satellite system (dGNSS) equipment from the differentially corrected coordinates. “LIDAR ELEV” refers to the light detection and ranging (lidar) derived elevation from the 1-meter (m) digital elevation model (DEM). “ELEV DIFF” refers to the elevation difference (dGNSS – lidar), and “ABS ELEV DIFF” refers to the absolute value of this difference. NAD 83, North American Datum of 1983; NAVD 88, North American Vertical Datum of 1988]
Table 5.
Location information for the 139 gravity stations located on the Medicine Bow Mountains of Wyoming (WY–MB) from Brown and others (2025).[“Gravity station” refers to a unique identifier that is based on the station number used in the data source for this table. “UC LAT” and “UC LON” refer to the horizontal coordinates before differential correction. “DC LAT” and “DC LON” refer to the differentially corrected horizontal coordinates. “DGNSS ELEV” refers to the elevation data from the differential global navigation satellite system (dGNSS) equipment from the differentially corrected coordinates. “LIDAR ELEV” refers to the light detection and ranging (lidar) derived elevation from the 1-meter (m) digital elevation model (DEM). “ELEV DIFF” refers to the elevation difference (dGNSS – lidar), and “ABS ELEV DIFF” refers to the absolute value of this difference. NAD 83, North American Datum of 1983; NAVD 88, North American Vertical Datum of 1988]
Table 6.
Location information for the 59 gravity stations located on the Wet Mountains of Colorado (CO–WM) from Magnin and Anderson (2024).[“Gravity station” refers to a unique identifier that is based on the station number used in the data source for this table. “UC LAT” and “UC LON” refer to the horizontal coordinates before differential correction. “DC LAT” and “DC LON” refer to the differentially corrected horizontal coordinates. “DGNSS ELEV” refers to the elevation data from the differential global navigation satellite system (dGNSS) equipment from the differentially corrected coordinates. “LIDAR ELEV” refers to the light detection and ranging (lidar) derived elevation from the 1-meter (m) digital elevation model (DEM). “ELEV DIFF” refers to the elevation difference (dGNSS – lidar), and “ABS ELEV DIFF” refers to the absolute value of this difference. NAD 83, North American Datum of 1983; NAVD 88, North American Vertical Datum of 1988]
Table 7.
Location information for the 56 gravity stations located on the Keweenaw Peninsula of Michigan (MI–KP0) from Murchek and others (2025).[“Gravity station” refers to a unique identifier that is based on the station number used in the data source for this table. “UC LAT” and “UC LON” refer to the horizontal coordinates before differential correction. “DC LAT” and “DC LON” refer to the differentially corrected horizontal coordinates. “DGNSS ELEV” refers to the elevation data from the differential global navigation satellite system (dGNSS) equipment from the differentially corrected coordinates. “LIDAR ELEV” refers to the light detection and ranging (lidar) derived elevation from the 1-meter (m) digital elevation model (DEM). “ELEV DIFF” refers to the elevation difference (dGNSS – lidar), and “ABS ELEV DIFF” refers to the absolute value of this difference. NAD 83, North American Datum of 1983; NAVD 88, North American Vertical Datum of 1988]
The data for this National Geodetic Survey (NGS) station are from NGS (2025). This gravity station identifier was created for use in this report.
References Cited
American Society for Photogrammetry and Remote Sensing [ASPRS], 2023, ASPRS positional accuracy standards for digital geospatial data (2d ed., ver. 1): ASPRS web page, accessed August 20, 2023, at https://publicdocuments.asprs.org/PositionalAccuracyStd-Ed2-V1.
Brown, P.J., Reitman, J.J., Drenth, B.J., and Lynds, R.M., 2025, Principal facts of regional gravity data in the Medicine Bow Mountains, Wyoming, 2022–2024: U.S. Geological Survey data release, accessed April 15, 2025, at https://doi.org/10.5066/P1XAVOXP.
Cai, Z., Ma, H., and Zhang, L., 2020, Feature selection for airborne LiDAR data filtering—A mutual information method with Parzon window optimization: GIScience & Remote Sensing, v. 57, no. 3, p. 323–337, accessed August 20, 2023, at https://doi.org/10.1080/15481603.2019.1695406.
Drenth, B.J., Reitman, J.J., and Brown, P.J., 2024, Principal facts of regional gravity in the central Upper Peninsula, Michigan, 2022–2023: U.S. Geological Survey data release, accessed November 20, 2024, at https://doi.org/10.5066/P9L6KML9.
Elaksher, A.F., 2016, Co-registering satellite images and LIDAR DEMs through straight lines: International Journal of Image and Data Fusion, v. 7, no. 2, p. 103–118, accessed August 20, 2023, at https://doi.org/10.1080/19479832.2015.1075607.
Habib, A., Ghanma, M., Morgan, M., and Al-Ruzouq, R., 2005, Photogrammetric and lidar data registration using linear features: Photogrammetric Engineering and Remote Sensing v. 71, no. 6, p. 699–707, accessed August 20, 2023, at https://doi.org/10.14358/PERS.71.6.699.
Hollaus, M., Wagner, W., and Kraus, K., 2005, Airborne laser scanning and usefulness for hydrologic models: Advances in Geosciences, v. 5, p. 57–63, accessed August 20, 2023, at https://doi.org/10.5194/adgeo-5-57-2005.
Liu, X., 2008, Airborne lidar for DEM generation—Some critical issues: Progress in Physical Geography—Earth and Environment, v. 32, no. 1, p. 31–49, accessed August 20, 2023, at https://doi.org/10.1177/0309133308089496.
Longman, I.M., 1959, Formulas for computing the tidal accelerations due to the moon and the sun: Journal of Geophysical Research, v. 64, no. 12, p. 2351–2355, accessed August 20, 2023, at https://doi.org/10.1029/JZ064i012p02351.
Magnin, B.P., and Anderson, E.D., 2024, Gravity data in the Wet Mountains area, southcentral Colorado, 2023: U.S. Geological Survey data release, accessed January 16, 2024, at https://doi.org/10.5066/P9KNDYU3.
Merrick & Company, 2016, Arkansas River (partial Fremont) in LiDAR download portal: Colorado Hazard Mapping & Risk MAP Portal website, accessed January 24, 2024, at https://coloradohazardmapping.com/lidarDownload.
Morelli, C., Gantar, C., Honkasalo, T., McConnell, R.K., Tanner, J.G., Szabo, B., Uotila, U., and Whalen, C.T., 1972, The International Gravity Standardization Net 1971 (I.G.S.N. 71): Air Force Cambridge Research Laboratories and European Office of Aerospace Research and Development, Special Publication 4, prepared by International Association of Geodesy, Osservatorio Geofisico Sperimentale [Experimental Geophysical Observatory] under contract AF61 (052) 656, 194 p. [Also available at https://apps.dtic.mil/sti/pdfs/ADA006203.pdf.]
Murchek, J.T., DeGraff, J.M., and Drenth, B.J., 2025, Gravity data in the Upper Peninsula, Michigan for geophysical profile modeling of the Midcontinent Rift System and associated structures: U.S. Geological Survey data release, accessed March 6, 2025, at https://doi.org/10.5066/P14BGVCT.
National Geodetic Survey [NGS], 2025, Designation M 65, PID SG0019, State/county MI/Houghton, Country US, USGS quad Laurium: NGS data sheet (datasheet95, ver. 8.12.5.19), accessed May 4, 2025, at https://www.ngs.noaa.gov/cgi-bin/ds_mark.prl?PidBox=SG0019.
National Oceanic and Atmospheric Administration [NOAA], 2012, Lidar 101—An introduction to lidar technology, data, and applications (revised): NOAA Coastal Services Center, Coastal Geospatial Services Division, Coastal Remote Sensing Program report, 72 p., accessed August 20, 2023, at https://coast.noaa.gov/data/digitalcoast/pdf/lidar-101.pdf.
National Oceanic and Atmospheric Administration [NOAA], 2023, What is lidar?: NOAA web page, accessed April 13, 2023, at https://oceanservice.noaa.gov/facts/lidar.html#:~:text=Lidar%2C%20which%20stands%2 0for%20Light,variable%20distances)%20to%20the%20Earth.
Peucker, T.K., Fowler, R.J., Little, J.J., and Mark, D.M., 1976, Digital representation of three-dimensional surfaces by triangulated irregular networks (TIN) (revised): Office of Naval Research, Geography Programs, Technical Report 10, prepared by authors under contract N00014–75–C–0886 {NR 389–171}, 63 p. [Also available at https://apps.dtic.mil/sti/pdfs/ADA094241.pdf.]
Pfeifer, N., and Briese, C., 2007, Geometrical aspects of airborne laser scanning and terrestrial laser scanning in Rönnholm, P., Hyyppä, H., and Hyyppä, J., eds., Proceedings of the ISPRS Workshop on Laser Scanning 2007 and SilviLaser 2007, September 12–14, 2007, Espoo, Finland: International Society of Photogrammetry, Remote Sensing Archives, v. XXXVI, part 3/W52, p. 311–319, accessed August 20, 2023, at https://www.isprs.org/proceedings/XXXVI/3-W52/final_papers/Pfeifer_2007_keynote.pdf.
Quantum Spatial, Inc., 2020, 2018 Park, Custer, & Fremont Counties in LiDAR download portal: Colorado Hazard Mapping & Risk MAP Portal website, accessed January 24, 2024, at https://coloradohazardmapping.com/lidarDownload.
Reutebuch, S.E., Andersen, H.-E., and McGaughey, R.J., 2005, Light detection and ranging (LIDAR): an emerging tool for multiple resource inventory: Journal of Forestry, v. 103, no. 6, p. 286–292, accessed August 20, 2023, at https://doi.org/10.1093/jof/103.6.286.
Sanborn Map Company, Inc., 2020, Lidar_Houghton_Keweenaw_Ontonagon Hydro-Flattened Bare-Earth DEM in MTU GRF DEM Download Tool: Michigan Tech Great Lakes Research Center, Geospatial Research Facility website, accessed January 24, 2024, at https://geospatialresearch.mtu.edu/demindex/.
Sugarbaker, L.J., Constance, E.W., Heidemann, H.K., Jason, A.L., Lukas, V., Saghy, D.L., and Stoker, J.M., 2014, The 3D Elevation Program initiative—A call for action: U.S. Geological Survey Circular 1399, 35 p., accessed August 20, 2023, at https://doi.org/10.3133/cir1399.
U.S. Geological Survey [USGS], 2022, 3D Elevation Program 1-meter resolution digital elevation model, MI 13 County C16 in TNM Download [The National Map Downloader] version 2.0: U.S. Geological Survey website, accessed June 25, 2023, at https://apps.nationalmap.gov/downloader.
U.S. Geological Survey [USGS], 2023, 3D Elevation Program 1-meter resolution digital elevation model, WY South Central D20 in TNM Download [The National Map Downloader] version 2.0: U.S. Geological Survey website, accessed June 25, 2023, at https://apps.nationalmap.gov/downloader.
U.S. Geological Survey [USGS], 2024, Lidar base specification online [LBS 2024 rev. A.]: U.S. Geological Survey website, accessed January 31, 2024, at https://www.usgs.gov/3DEP/lidarspec.
U.S. Geological Survey [USGS], [undated], Topographic data quality levels (QLs): U.S. Geological Survey website, accessed April 13, 2023, at https://www.usgs.gov/3d-elevation-program/topographic-data-quality-levels-qls.
Webster, T.L., and Dias, G., 2006, An automated GIS procedure for comparing GPS and proximal LIDAR elevations: Computers & Geosciences, v. 32, no. 6, p. 713–726, accessed August 20, 2023, at https://doi.org/10.1016/j.cageo.2005.08.009.
Datums
Vertical coordinate information is referenced to the North American Vertical Datum of 1988 (NAVD 88).
Horizontal coordinate information is referenced to the North American Datum of 1983 (NAD 83).
Elevation, as used in this report, refers to distance above the vertical datum.
Abbreviations
3DEP
3D Elevation Program
ASPRS
American Society for Photogrammetry and Remote Sensing
cm
centimeter
CO–WM
Wet Mountains of Colorado
DEM
digital elevation model
dGNSS
differential global navigational satellite system
GLONASS
Globalnaya Navigazionnaya Sputnikovaya Sistema [Global Navigation Satellite System]
GNSS
global navigation satellite system
GPS
Global Positioning System
IDW
inverse distance weighted
IMU
inertial measurement unit
km
kilometer
km2
square kilometer
lidar
light detection and ranging
m
meter
mGal
milligal
MI–HR
west-central Upper Peninsula of Michigan
MI–KP0
Keweenaw Peninsula of Michigan
MI–TM
central Upper Peninsula of Michigan
NAD 83
North American Datum of 1983
NAVD 88
North American Vertical Datum of 1988
NGS
National Geodetic Survey
NOAA
National Oceanic and Atmospheric Administration
NPD
nominal pulse density
NPS
nominal pulse spacing
QL
quality level
RMSEz
root mean square error in the vertical (z) direction
TIN
triangulated irregular network
UP
upper peninsula
USGS
U.S. Geological Survey
WY–MB
Medicine Bow Mountains of Wyoming
For more information about this publication, contact
Director
Energy and Minerals Mission Area
U.S. Geological Survey
12201 Sunrise Valley Drive
Reston, VA 20192-0002
For additional information, visit
https://www.usgs.gov/mission-areas/energy-and-minerals
Publishing support provided by the Science Publishing Network,
Reston Publishing Service Center
Disclaimers
Any use of trade, firm, or product names is for descriptive purposes only and does not imply endorsement by the U.S. Government.
Although this information product, for the most part, is in the public domain, it also may contain copyrighted materials as noted in the text. Permission to reproduce copyrighted items must be secured from the copyright owner.
Suggested Citation
Murchek, J.T., Drenth, B.J., Reitman, J.J., Anderson, E.D., Magnin, B.P., and DeGraff, J.M., 2025, The feasibility of using lidar-derived digital elevation models for gravity data reduction (ver. 1.1, July 2025): U.S. Geological Survey Open-File Report 2025–1019, 33 p., https://doi.org/10.3133/ofr20251019.
ISSN: 2331-1258 (online)
| Publication type | Report |
|---|---|
| Publication Subtype | USGS Numbered Series |
| Title | The feasibility of using lidar-derived digital elevation models for gravity data reduction |
| Series title | Open-File Report |
| Series number | 2025-1019 |
| DOI | 10.3133/ofr20251019 |
| Edition | Version 1.0: May 12, 2025; Version 1.1: July 1, 2025 |
| Publication Date | May 12, 2025 |
| Year Published | 2025 |
| Language | English |
| Publisher | U.S. Geological Survey |
| Publisher location | Reston, VA |
| Contributing office(s) | Geology, Minerals, Energy, and Geophysics Science Center, Geology, Geophysics, and Geochemistry Science Center |
| Description | vii, 33 p. |
| Online Only (Y/N) | Y |
| Additional Online Files (Y/N) | N |