

Contributions of Erosion, Deposition, and Human Activities to a Change in Sand Storage in the Bed of San Francisco Bay, California, 1980s to 2010s
Links
- Document: Report (15 MB pdf) , HTML , XML
- Data Releases:
- USGS data release - Estimates of percent sand in cores collected in San Francisco Bay, California from 1990-2016
- USGS data release - Bathymetric change analysis in San Francisco Bay, California, from 1971 to 2020
- USGS data release - Geophysical properties, geochronologic, and geochemical data of sediment cores collected from San Pablo Bay, California, October 17–20, 2016
- USGS data release - Gravity cores from San Pablo Bay and Carquinez Strait, San Francisco Bay, California
- NGMDB Index Page: National Geologic Map Database Index Page (html)
- Download citation as: RIS | Dublin Core
Acknowledgments
This research was funded by the U.S. Geological Survey Coastal and Marine Hazards and Resources Program with additional support through sand mining mitigation funds provided by the San Francisco Bay Sand Mining Industry to support improving sand transport and sand budget knowledge in compliance with a 2015 San Francisco Bay Conservation and Development Commission (BCDC) permit requirement. The work was facilitated through contract number 20-068 issued to the San Francisco Estuary Institute-Aquatic Science Center (SFEI-ASC) and managed by the California State Coastal Conservancy (SCC). This report was improved by reviews of Dave Schoellhamer (USGS Emeritus) and Craig Jones (Integral Consulting Inc.).
Abstract
This study by the U.S. Geological Survey (USGS) provides estimates of the change in sand storage in bed sediments from the 1980s to 2010s in the San Francisco Bay area, California. The study is part of a larger project called “Research to Understand Impacts of Bay Sand Mining on Sand Transport in San Francisco Bay and the Outer Coast” that has the goal of providing information for the California Coastal Conservancy to inform decision making regarding sand mining activities. Information from this study will contribute to the sand budget for the San Francisco Bay system by accounting for sand made available by erosion of bay sediment and sequestered by deposition in the bay.
Sediment budgets for estuaries typically account for change in sediment storage in the bed without discriminating for sediment size. However, the physics of mud and sand erosion, deposition, and transport differ. Sediment budgets that treat mud and sand separately give a more complete understanding of the system, including how human activities related to sediment size, such as sand mining, affect the system. We used bathymetric change analysis in combination with a three-dimensional model to generate estimates of net change in sand storage within the San Francisco Bay floor. We document sediment volume change from a 1980s bathymetric surface to a 2010s bathymetric surface, in combination with information on the sand content of the bed sediment derived from sediment cores and surface samples from six different sediment studies, to estimate the net change in sand volume in the bed of San Francisco Bay. This analysis includes areas heavily affected by human activities (such as sand mining, dredging, and sediment disposal) as well as regions more representative of natural transport processes.
Overall, the sediment bed of San Francisco Bay is losing sand. Across the total area surveyed in San Francisco Bay, including areas affected by natural processes, oyster shell beds, and human activities, a net loss of about 17 million cubic meters (Mm3) of sand from the sediment bed occurred from the 1980s to 2010s, at a rate of about 0.8 Mm3 per year. For the period of this study, sand loss from bed level changes in permitted sand-lease mining areas (about 11 Mm3) accounts for about two-thirds of the total sand loss throughout the study area. It is important to consider potential uncertainty bounds when interpreting these findings. A key part of the report is an assessment of the uncertainties in our estimates of sand volumes. We estimate that variability in modeled sand content values of Bay floor sediments could result in an uncertainty of approximately 25 percent of the net sand volume change. Even larger uncertainty amounts may be associated with uncertainty in the systematic errors in the bathymetric surveys. Further refining estimates of uncertainty in bathymetric change is important in guiding the use of this study. The results presented here can fill a critical gap that may enable the creation of the first comprehensive sand budget of San Francisco Bay.
Introduction
Sediment budgets are commonly used in coastal science to understand sediment delivery and movement within a system through a process of accounting. A sediment budget is the balance between the volume of sediment entering and leaving the system compared to the change in sediment storage within the system (Schoellhamer and others, 2005; Wright and Schoellhamer, 2005; Alonso and others, 2021; Chant and others, 2021; Dam and others, 2022; McKee and others, 2023). Sediment budgets for estuaries can constrain sediment pathways and are a common tool used to inform management decisions. Existing sediment budgets for San Francisco Bay (herein referred to as the Bay) (Ogden Beeman and Associates, Inc., 1992; Schoellhamer and others, 2005) have supported many management and policy decisions associated with contaminant transport, sand mining, navigational dredging, and wetland restoration. Equally as important, they have identified key weaknesses and uncertainties in information that have been used to guide prioritization and funding for additional research, such as in-bay fluxes between subembayments, trends in sediment supply (Schoellhamer and others, 2018), and the need for additional measurements of bulk density to improve conversions between sediment volume and sediment mass (Schoellhamer and others, 2005).
Sediment budgets typically account for total sediment volumes without regard to sediment size. Within estuaries predominantly comprised of mud and sand, a total sediment budget cannot account for different behaviors (erodibility, sediment transport pathways, and so forth) related to sediment size. Additionally, because the sediment size of inputs and outputs may vary, the sediment budget for mud in a system can be quite different than one for sand (Alonso and others, 2021; Dam and others, 2022). Sediment budgets for estuaries in the Netherlands (Alonso and others, 2021; Dam and others, 2022) have evolved beyond total sediment budgets that do not differentiate between sediment size classes to budgets that treat mud and sand separately. Whereas most sediment budgets for the Bay are total sediment budgets (for example, Ogden Beeman and Associates, Inc., 1992; Schoellhamer and others, 2005), Perry and others (2015) constructed a partial sand budget for the Bay. Although they were able to estimate sand inputs and outputs to the Bay, there were no data on the change in sand storage in the sediment bed, herein referred to as the bed, of the Bay to complete the budget.
This study provides estimates of the change in sand storage in the bed sediments of San Francisco Bay area, California, for use in a larger San Francisco Bay project to understand the impacts of sand mining on sand supply and sand transport in the Bay and the outer coast, carried out for the California Coastal Conservancy (2020) to inform decision making regarding sand mining activities. We used the volumetric analyses of bathymetric change throughout San Francisco Bay by Fregoso and others (2023) in combination with a three-dimensional (3D) model we developed for determining sand content in the bed sediments to generate estimates of net change in sand storage under the Bay floor. Fregoso and others (2023) analyzed bathymetric change using surveys collected from 1971 to 1990 (herein referred to as 1980s because most of the surveys were collected in the 1980s) and surveys collected from 1999 to 2020 (herein referred to as the 2010s because most of the surveys were collected in the 2010s). We estimate the volumes of sand made available to the system by erosion of the Bay floor and sand sequestered by deposition. Because the system is heavily affected by human activities, we parse out calculations for areas affected by sand mining, dredging and sediment disposal, as well as areas with known oyster shell deposits in the southern part of the San Francisco Bay. A key part of the report is an assessment of the uncertainties in our estimates of sand volumes.
Definition of Sand in this Report
We define sand as particles ranging in size from 64 micrometers (μm) to 2 millimeters (mm). Because traditional grain size analyses may not distinguish between the actual composition of the sand-sized materials, organic particles such as shell hash can also be included. Since a primary purpose of this study is to provide information to inform management decisions about sand mining in San Francisco Bay, our focus is quantifying non-organic, sand-sized mineral grains. To this aim, we have separated results for a large known area of oyster shell beds in south San Francisco Bay. Although there is oyster shell hash distributed throughout the Bay, we are unaware of any studies identifying extensive beds outside of south San Francisco Bay and therefore have not included areas in other subembayments based upon shell content. In the context of this report, the term sediment is used to describe total sediment, including all size classes, whereas sand is used when referring specifically to sand-sized particles, primarily of terrigenous origin.
Study Area
San Francisco Bay (fig. 1) covers a total area of about 1,200 square kilometers (km2) and is composed of smaller subembayments within its boundaries. For this study, the Bay has been broken into five subembayments: (1) Suisun Bay and Carquinez Strait, (2) San Pablo Bay, (3) central San Francisco Bay (part of the Bay from north of a line between Hunters Point and the Oakland Airport and south of San Pablo Bay; herein called central Bay), (4) upper south San Francisco Bay (part of the Bay south of central Bay and north of Dumbarton Bridge; herein called upper south Bay), and (5) lower south San Francisco Bay (part of the Bay south of the Dumbarton Bridge; herein called lower south Bay). The Bay is sculpted by water flows and sediment from the northeast where the Sacramento and San Joaquin Rivers converge to flow into Suisun Bay, from the west where tidal currents flowing through the Golden Gate bring sediment from the ebb-tidal delta and the open coast, and from numerous smaller tributaries and rivers that enter along the boundaries of the Bay. Sand is found throughout the system but is most prevalent in the deeper portions of central Bay, and the main channels of San Pablo Bay and Suisun Bay. Mud dominates in the upper and lower south Bay embayments (herein referred to as the south Bay) and the shallower areas of central, San Pablo, and Suisun Bays (Conomos and Peterson, 1977).
From the first settlements, the Bay has been altered to the needs and whims of its inhabitants, starting a long history of alterations to the Bay by human activities. Projects extracting sediment for use as Bay fill for the creation and expansion of areas such as Treasure Island and the Oakland Airport in the early to late 1900s are just two examples (Fregoso and others, 2008). Bay-wide dredging to aid in navigation, the removal of sediment for fill projects within and outside of the Bay proper, sediment disposal in central and San Pablo Bays, sand mining in central and Suisun Bays, and oyster shell mining in the south Bay are all ongoing activities.
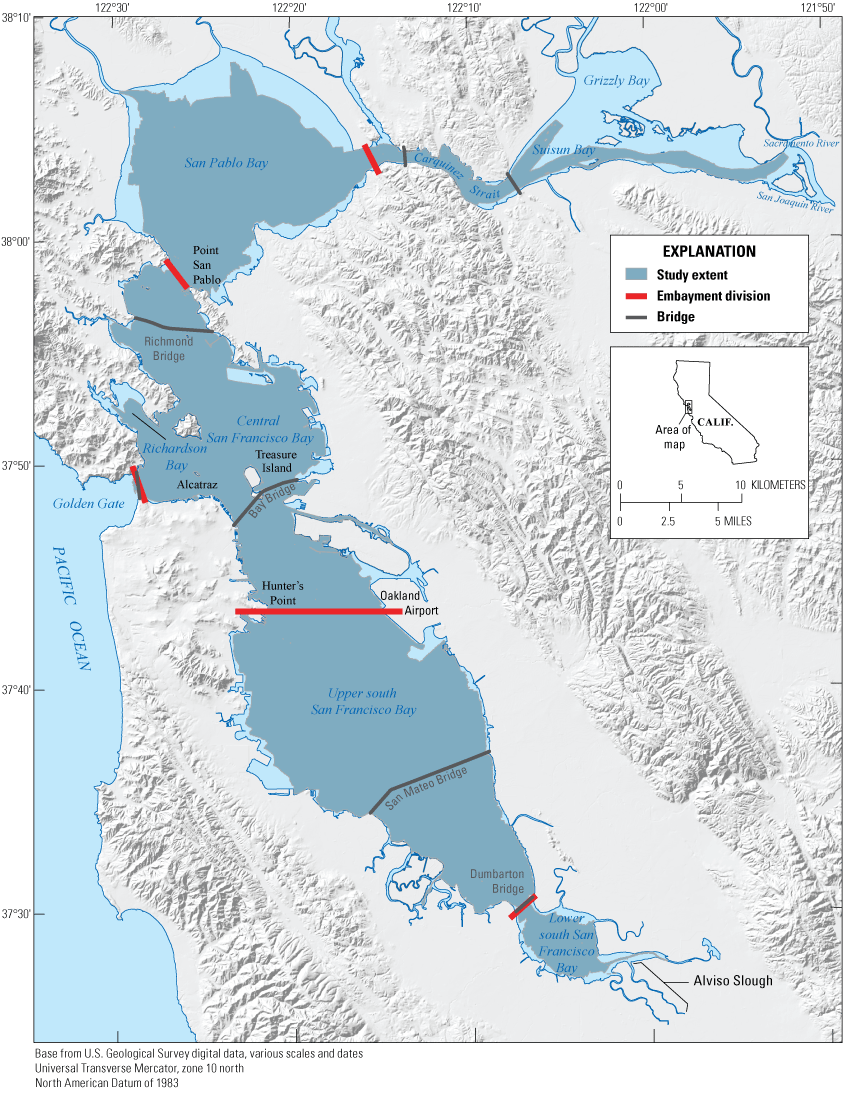
Study location map depicting the extents of the San Francisco Bay system, California, as defined for this report.
Data Sources
Bathymetric Change Model of San Francisco Bay
Fregoso and others (2023) took bathymetric survey data collected from 1971 to 1990 (herein referred to as the 1980s bathymetric surface) and compared it to bathymetric survey data collected from 1999 to 2020 (herein referred to as the 2010s bathymetric surface). This comparison resulted in the bathymetric change surface (Fregoso and others, 2024) that allows for volume calculations of total sediment eroded from or deposited on the Bay floor during this period and serve as the foundation for our net sand volume change analyses. Our sand volume calculations are thus limited to within the spatial extent of the bathymetric change area shown in figure 2.
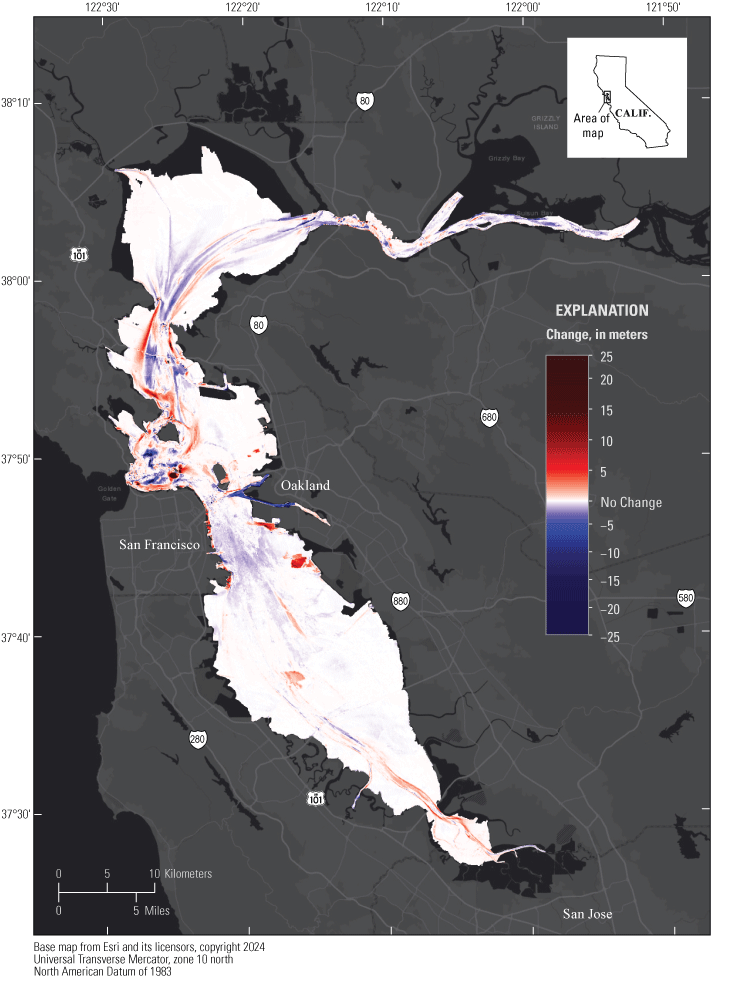
Map of the bathymetric change surface used to calculate sediment deposition and erosion volumes from the 1980s to the 2010s and define the extents of sand models, San Francisco Bay area, California (Fregoso and others, 2023, 2024).
Sediment Cores
To quantify the volume of sand made available to the system (through bed erosion) and sediment sequestered (by deposition), we first determined how much sand is contained within the Bay floor and subsurface sediments. To do so, we created a 3D sand model to capture the variability in percent sand content both throughout the Bay and with depth beneath the Bay floor. The primary data for the creation of the sand model were sediment cores, predominantly gravity cores, but also box cores and vibracores, that were collected throughout the Bay in 1990 to 1991 (Anima and others, 2005), 2000 (Allison and others, 2003), 2006 (Yee and others, 2011), and 2016 (Takesue and others, 2021). Of the cores collected, 186 cores (ranging in length from 14 to 360 centimeters [cm]) were located within the 1980s to 2010s bathymetric change area in Fregoso and others (2024) which provided the volumes of sediment deposition and erosion used for this study (table 1, fig. 3). Few cores were collected in shallow, intertidal waters because of limitations in getting the boat into these areas and the necessity of having enough water for core collection to be successful.
Table 1.
Breakdown of sediment core origins and locations, San Francisco Bay area, California, 1980s to 2010s.[Predominantly gravity cores, but also box cores and vibracores were collected throughout San Francisco Bay in 1990 to 2016 by Anima and others (2005), Allison and others (2003), Yee and others (2011), and Takesue and others (2021). Of the cores collected, 186 cores were located within the 1980s to 2010s study area in Fregoso and others (2024) which provided the volumes of sediment deposition and erosion used for this study. na, not applicable]
| Origin | Year | Cores | Suisun Bay and Carquinez Strait | San Pablo Bay | Central Bay | Upper south Bay | Lower south Bay |
|---|---|---|---|---|---|---|---|
| Anima and others, 2005 | 1990/1991 | 142 | 12 | 30 | 26 | 62 | 12 |
| Allison and others, 2003 | 2000 | 18 | 2 | 16 | 0 | 0 | 0 |
| Yee and others, 2011 | 2006 | 9 | 0 | 2 | 1 | 4 | 2 |
| Takesue and others, 2021 | 2016 | 17 | 0 | 17 | 0 | 0 | 0 |
| Total | na | 186 | 14 | 65 | 27 | 66 | 14 |
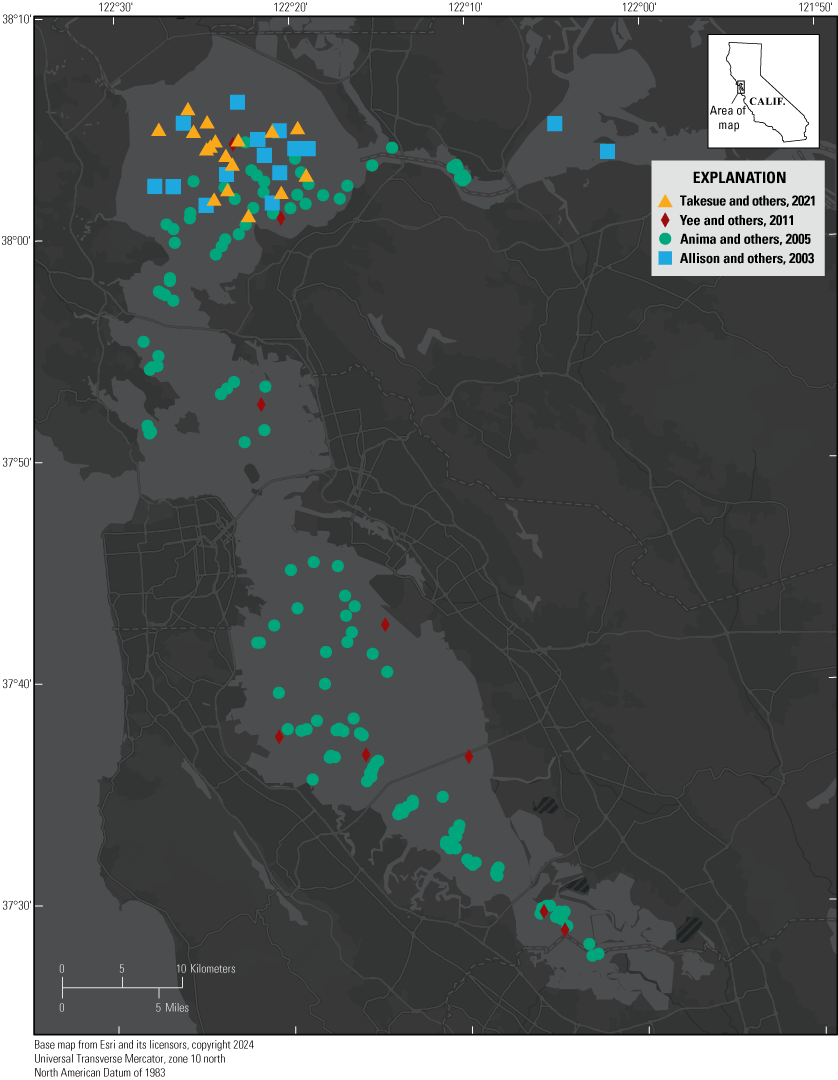
Map of sediment cores within the San Francisco Bay area, California. The primary data for the creation of the sand model were sediment cores, predominantly gravity cores, but also box cores and vibracores, that were collected throughout San Francisco Bay in 1990 to 1991 (Allison and others, 2003; Anima and others, 2005; Yee and others, 2011; and Takesue and others, 2021). Of the cores collected, 186 cores (ranging in length from 40 to 360 centimeters) were located within the 1980s to 2010s study area in Fregoso and others (2024) which provides the volumes of sediment deposition and erosion used for this study.
Surface Sediment Samples
Examining the spatial distribution of the sediment cores revealed there were still large sections of the Bay without grain size information (fig. 3). To better constrain our 3D sand model, we decided to incorporate readily available bay-floor samples that have been analyzed for grain size. Bay floor samples are not ideal for creating a 3D sand model because subsurface grain size may differ from grain size at the surface of the bay floor. In fact, the cores used in this study proved that there are definite variations in sediment size within the length of a core, but given the lack of available core data, and following suit with a study by Alonso and others (2021), we applied the assumption that subsurface grain size is the same as the surface size in locations where that was the only available data.
Two readily available sources of quality floor-surface grain-size data were used in this study. An extensive sediment provenance study by Barnard and others (2013) examined surface sediments (top 10 cm) from a total of 339 grab samples collected in 2010 to 2012, 209 of which were within our study area. These samples reported grain size as percentages by size class, calculated by weight. All 209 of the samples from the sediment provenance study contained some percentage of sand. Using these samples alone would have biased the models towards sand, as mud-only areas were not adequately defined to aid in the interpolation between cores and shallow waters near the shoreline.
For creating a sand budget, modeling areas with an absence of sand are just as important as areas with sand. The Bay Regional Monitoring Program (RMP) for Water Quality database of long-term sampling efforts in the Bay (San Francisco Estuary Institute, 2023) was used to obtain samples denoting areas without sand. Through the RMP website (https://www.sfei.org/programs/bay-regional-monitoring-program) it is possible to download sample data, by analyte and (or) fraction size, for sediment samples collected during a specified time-period. Sampling for this study ranged from 1993 to 2018, with many of the same locations repeatedly sampled throughout the years. The RMP sample database does not give a definitive weight percent of each grain size class (for example, sand, mud, and so forth) for every sample, so it cannot be used like the Barnard and others (2013) samples to constrain the exact sand content without more extensive, time-consuming work combing through the dataset to organize the data. However, the RMP database does provide a descriptive designator like the ones that Folk (1974) used (for example, fine silty mud, muddy sand, and so forth) that allows a range of sand contents for the same descriptor for every sample. The initial download of RMP sediment sample data, of size classes for sediment less than 2.0 mm (sand, clay, silt, fines [silt+clay]), returned more than 7,000 samples. Of those, 498 samples were ultimately used in this study (refer to the “Methods” section). Figure 4 shows the distribution of the surface samples that were used in relation to the core locations.
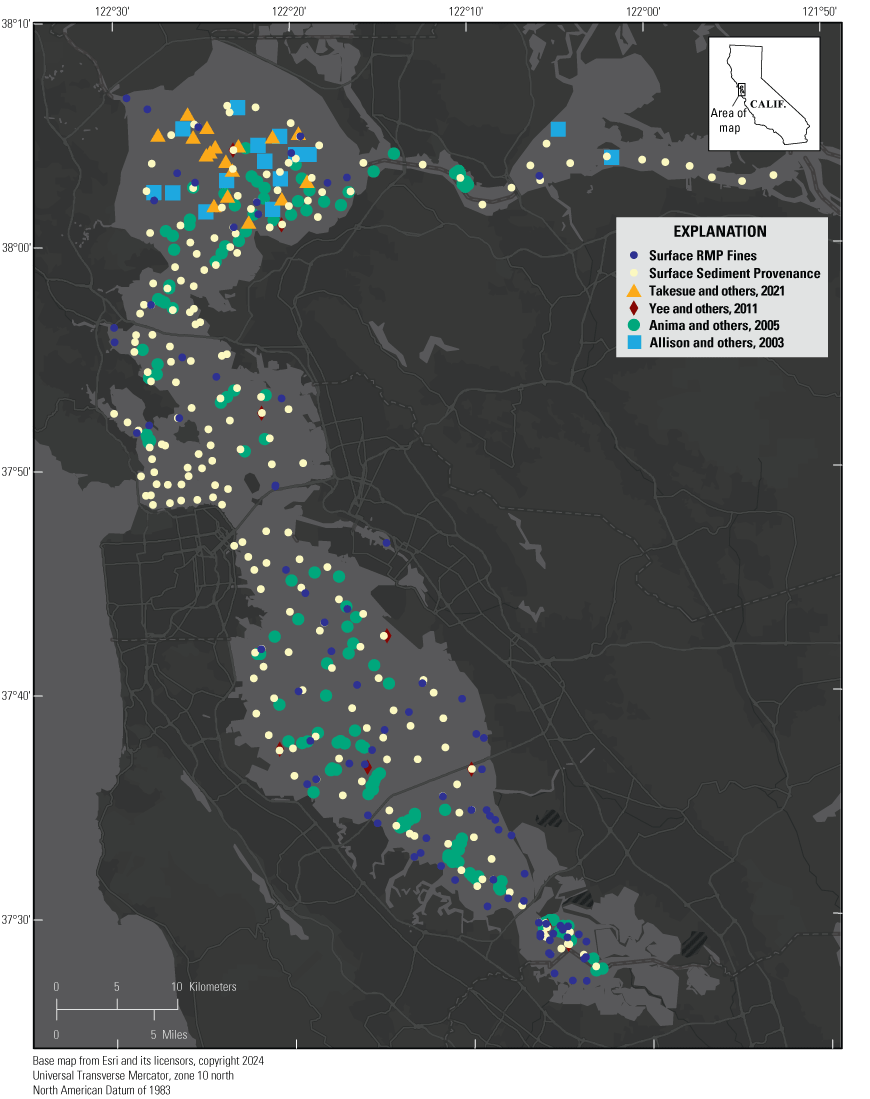
Map of bay floor-surface sediment samples in relation to cores within the San Francisco Bay area, California. Sediment cores were collected throughout San Francisco Bay in 1990 to 1991 (Allison and others, 2003; Anima and others, 2005; Yee and others, 2011; and Takesue and others, 2021). Surface sediment provenance study samples from Barnard and others (2013). The Bay Regional Monitoring Program (RMP) surface fines (silt+clay) were used to obtain samples denoting areas without sand (San Francisco Estuary Institute, 2023).
Areas of Human Disturbance
Within each of San Francisco Bay’s subembayments, there are regular activities that alter or maintain the depth of the Bay floor. These projects include dredging of channels for navigation, disposal sites for dredged and other sources of sediment, and shell and sand mining. Figure 5 shows areas of such activities within the Bay. These areas are delineated by a combination of information on current activities: U.S. Army Corps of Engineers (USACE, 2023) hydrographic surveys of the Federal navigation channels and dredge material placement sites, current sand mine leases (California State Lands Commission, 2012), and unnatural patterns of bathymetric change from the 1980s to 2010s (Fregoso and others, 2023). These areas, due to their heavily managed states, are not indicative of natural influences. Because of this, any grain size data within these areas have been excluded from sand content interpolation with the only anthropogenic exception being the sand mining areas. These areas are being mined because they contain naturally occurring sand beds. Therefore, the presence of sand in these areas are included in the interpolation process through the addition of simulated cores within the sand mine areas with a sand percent value of 100 assigned for the entire length of the core.
Areas of Oyster Shell
South San Francisco Bay is a historical source of native Ostrea lurida (Carpenter, 1864) (Olympia oysters) that have been collected, first by the local indigenous people, and then mined for more modern uses beginning as early as the 1890s, with more industrial efforts starting in the 1920s and still occurring today (Hart, 1966). Oyster and shell hash have a known presence in many areas of the Bay and can be inadvertently classified as sand through simple grain size measurements that do not distinguish between organic and non-organic particles. To prevent conflating sand-sized shell hash with mineral sand grains, the large shell beds in south Bay, identified with an acoustic seabed classification survey in 2005 (acoustic class 10 in sub-appendix B in Foxgrover and others, 2007) were excluded from sand content interpolation (fig. 5) and volume estimates provided as separate results.
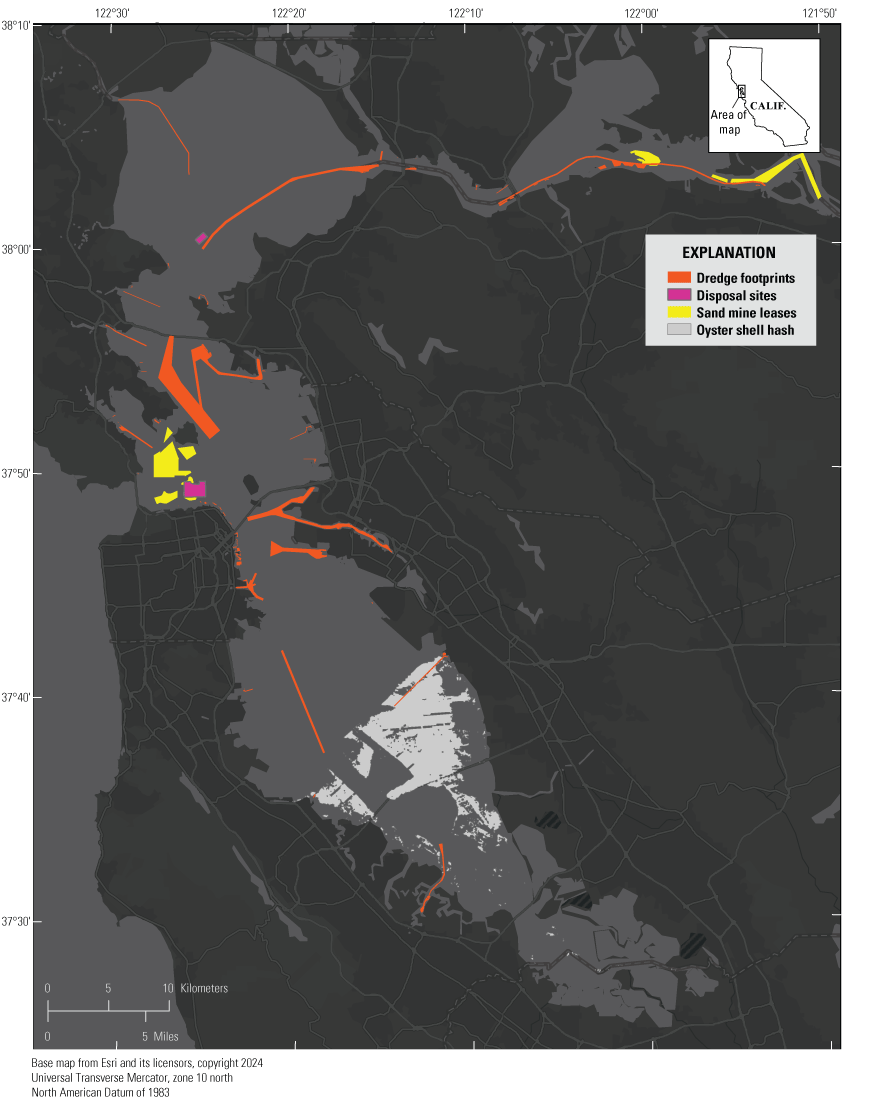
Map showing areas of sand mining, dredging, sediment disposal sites, and oyster shell beds that were treated separately in the sand content modeling in the San Francisco Bay area, California. Data from U.S. Army Corps of Engineers (2023) hydrographic surveys of the Federal navigation channels and dredge material placement sites, current sand mine leases (California State Lands Commission, 2012), and unnatural patterns of bathymetric change from the 1980s to 2010s (Fregoso and others, 2023).
Methods
Interpreting and Preparing Core Data
The production of the 3D sand models was a multipart effort that began with the analysis of core data in the form of core logs. Core logs are detailed handwritten descriptions of cores recorded by researchers noting physical changes in the cores including measured changes and thicknesses of the sediment layers within the core, organics such as roots and wood, presence and type of shells, and color changes. The core logs are hand drawn representations of the core using standardized geologic symbols with written descriptions detailing, for example, more complicated areas, marking the specific depths of changes in the core, and the start of a new layer of sediment denoting a distinct sedimentary unit within the core. These logs were provided in the form of scanned paper logs, or in cases of published cores as graphicly illustrated logs which have been produced for a report. Some of the cores also had X-radiographs done, and measurements from sediment grain-size analyses at specified locations within the core. Examples of core logs are provided in figures 1.1 and 1.2 of appendix 1.
To determine the percent sand content throughout the length of each core, the available data were examined, including a small number of grain size analyses and graphical logs contained in reports (Woodrow and others, 2010, 2014, 2017a, b). All cores were measured in centimeters. Where sand was described in the written portion of the logs and (or) drawn in the visual depiction of the core, percent sand was estimated based upon the information provided. The illustration of the core helped contextualize the distribution and thickness of sand in the intervals defined by the core log. Several logs included a written percent sand estimate for intervals, which were then directly transferred to a spreadsheet for this effort (Fregoso and others, 2025). Where there was no percent sand estimate, various methods were used to estimate sand presence in the interval. If an interval contained sand laminae, then they were counted and estimated for thickness from the visual depiction of the core and associated descriptions to determine the amount of sand in the interval. If an interval contained sand interbeds or lenticular bedding, a similar process was used depending on the thickness of each bed. Where there were sand-filled burrows, an estimation was made based on the frequency and distribution of the burrows and their apparent thickness drawn on the log. If an interval was described as “muddy sand,” “sandy mud,” or any other description in which sand was either a matrix or a secondary grain size in any interval and not clearly distinguished visually on the log (that is, sand was noted in the description but not visually marked in any identifiable way on the drawn core), a best estimation was made based on the description. Percent sand content for core intervals was calculated by dividing the total amount of sand in centimeters from the length of the interval in centimeters and multiplying by 100.
The core data analysis was divided into separate Excel files for each subembayment. Each core had its own sheet that reported these sand percent estimations as well as minimums and maximums for each estimation. When estimates for sand were based on visual representations and were given less precise numbers, such as 40 percent, minimum and maximums were assigned as plus or minus 10 percent. When estimates were determined by counting and measuring specific intervals and to calculate a specific percent, such as 5 cm out of 20 cm for 25 percent sand, the minimum and max values were plus or minus 5 percent. The reports also include general observations of sand. For example, details are given on grain size, laminae, bedding, burrows, and difficulty of making such estimations depending on available detail on the paper logs (table 2).
Table 2.
Sediment analysis of core 90–134.[Note that sand content is grouped by similar sedimentary units for intervals relative to the top of the core (sediment surface) for the length of the core. Percent sand is the best estimate for sand content within each interval. Min and Max refer to the estimate of the minimum and maximum sand content, respectively. Core from Anima and others, 2005, located in central San Francisco Bay, California. cm, centimeter; %, percent; —, no data]
To create the 3D sand models, data from the core data spreadsheets were reformatted for use in geographic information systems (GIS). The sand model depicts percent sand content in 10-cm-thick sections throughout the length of the cores. To do this, the data shown in table 2 were adjusted to be displayed in regularly spaced, 10-cm intervals referenced to the top of the core. If the top of the cores had gaps between the top of the core liner and the beginning of the actual sediment core, the distance of the gap was subtracted from the raw depth intervals. In the case of the core in table 2, for the first section interval, 2 cm was moved to zero (0) cm, and 41 cm became 39 cm. All intervals had to be adjusted by 2 cm as shown in table 3.
Table 3.
An example of how initial core intervals were adjusted to align the top of the sediment core with zero (0) for core 90–134 in central San Francisco Bay, California.[If the top of the cores had gaps between the top of the core liner and the beginning of the actual sediment core, the distance of the gap was subtracted from the initial core intervals. In the case of this core (refer to table 2), for the first section interval, 2 centimeters (cm) was moved to 0 cm, and 41 cm became 39 cm. All intervals had to be adjusted by 2 cm as shown here. Core from Anima and others, 2005, located in central San Francisco Bay, California. Min and Max refer to the estimate of the minimum and maximum sand content, respectively. %, percent]
Once the core was vertically adjusted, a weighted average was used to determine the sand percentage for each 10-cm interval of the core. For the section 30–40, 30–39 has a value of 5.13 percent, where 39–40 has value of 0 percent. So, the value for 30–40 is
Using this method, the sand content for every 10-cm interval was determined (table 4).Table 4.
Adjusted 10-centimeter (cm) core intervals using a weighted average of all data falling with in each 10-cm interval for core 90–134 in central San Francisco Bay, California.[Min and Max refer to the estimate of the minimum and maximum sand content, respectively. Core from Anima and others (2005) located in central San Francisco Bay, California. %, percent]
There were some instances where cores had two different logs from examinations in different years, which meant two separate core analyses. When there was a conflict between the two analyses, the midpoint was taken, and the “min” of the minimums, and “max” of the maximums were used. If one log showed sand, and the other did not, the one with sand was used. Where there were grain-size measurements, which never represented more than 3 cm in an interval, those values and locations within an interval were used in the weighted average calculation. Grain-size measurements were considered absolute, with no difference in min or max values. Although percent sand amount in grain-size measurements was calculated by weight and the estimates from core logs is percent sand by volume, this affected less than 1 percent of the data, the 0.86 meter (m; 3 feet [ft]) that were analyzed for grain size in a total of more than 265 m (869 ft) of core length that had sand present. The lack of a conversion from sand percent by weight to sand percent by volume does not create a significant error compared to the other uncertainties in the analysis (refer to the “Uncertainty in Sand Volumes” section). The sand content values for all 186 cores were compiled into a single spreadsheet (Fregoso and others, 2025); each core has a row in the table with its associated x-y location data and a column containing sand percentages for each 10-cm interval.
Core collections occurred in 1990 to 1991, 2000, 2006, and 2016. The core collection dates were not coincident with the bathymetric survey dates that constrain the volume change calculations. To accommodate this, the cores were vertically shifted to account for changes in bed levels that occurred between the time the cores were collected, and when the elevation of the Bay floor was surveyed in the 1980s by using the yearly rate of change in the seafloor from the 1980s to the 2010s. To account for these differences, the vertical reference of the top of a core was shifted to coincide with an interpolated floor-surface for the year of its collection. This was calculated using the following variables:where
b
is earlier bathymetric survey date at core location,
s
is time span between bathymetric surveys,
c
is the date the core was collected,
chg
is the amount of bathymetric change from earlier to later year at the core location (- is erosion, + is deposition), and
shift
is the distance to shift the top of the core relative to its location at the 1980s surface.
For core 90–134 (located in central Bay, Anima and others, 2005), b=1979, s=41, c=1990, and chg=1.07 m.
Therefore shift=0.3This example is for a core where there was deposition that occurred after the core was collected. The equation results in 0.3 m, which indicates that the entire core needs to be shifted upward 30 cm to level the core to the 1979 bathymetric surface reference plane for central Bay (fig. 1). This means core 90–134 with an original length of 238 cm now has 30 cm above the 1980s baseline, and 210 cm below (table 5). Had the above equation calculated negative 0.3, indicating erosion of sediment occurring after the date the core was collected, all the values for the entire core would have been shifted downwards 30 cm. The values from 0 to 30 cm would be assigned the same value as the top of the core. In this case, the values for the first row in table 4, would be repeated up to and including the 30–40 cm interval; the bottom of the core would now end at 270 cm below the surface.
Table 5.
Sand content data from core 90–134 leveled for location in three-dimensional (3D) sand model in central San Francisco Bay, California (Anima and others, 2005, Fregoso and others, 2024, 2025).[Cores were vertically shifted to account for changes in bed levels that occurred between the time the cores were collected and when the elevation of the bay floor was surveyed (Fregoso and others, 2020). In this example there was deposition totaling 30 centimeters (cm) that occurred after the core was collected. The original length of 238 cm has been adjusted to 30 cm above the 1980s baseline, and 210 cm below. Min and Max refer to the estimate of the minimum and maximum sand content, respectively. % percent]
The final adjustment for the core data prior to generating the 3D sand model was to convert the interval data located from separate worksheets to one table that could be easily imported to ArcGIS Pro 3.3 (Esri, Redlands, California) for geospatial analyses. This required the information for each interval to be converted from rows to columns for each core. Each core has a row in the table with its associated x-y location data, and a column for each 10-cm interval containing percent sand content (Fregoso and others 2024, 2025). These new tables can then be used to plot the core locations on a map with all its core interval data (table 6) and generate raster surfaces of percent sand content for each 10-cm-thick horizon.
Table 6.
Select examples from core table used to interpolate three-dimensional sand models for San Francisco Bay, California (Fregoso and others, 2025).[Table consists of a select subset of cores from San Pablo Bay, California formatted to generate the three-dimensional sand model within ArcGIS Pro 3.3 (Esri, Redlands, California). Each row contains a separate sediment core with its associated x-y location data and percent sand content for each 10-centimeter (cm) interval, vertically leveled to the 1980s baseline and used to generate raster surfaces of percent sand content for each adjusted 10-centimeter-thick horizon. These data extend to −380 cm, the full range of core intervals is not shown here]
Preparing Surface Sediment Samples
Including the Bay floor sediment samples in the grid interpolations required checking for conflicts at locations with the cores, filtering the RMP samples to select mud only samples, and converting sand percent by weight to sand percent by volume to match the core data. To minimize conflicts between two different data types while ensuring the priority of the sediment core data during the grid interpolation process, all surface samples located within 300 m of a core were removed.
The RMP database of 7,000 samples was analyzed to identify mud-only cores. First, all samples were plotted on a map of the study area, and samples collected outside of the 1980s to 2010s bathymetric change area were removed. Next, samples that were within 100 m of a mud-only sample were selected and examined to see if any samples contained sand. If a location revealed a sample containing any sand, all samples within that 100-m radius were removed, including mud-only samples. Finally, any remaining samples with sand content were removed. This selection criteria resulted in 498 data points with a high confidence of representing areas of mud, or zero (0) percent sand.
The sand samples from the sediment providence study (Barnard and others, 2013) reported percent sand content calculated by weight. For these samples to be directly comparable with the percentages from the core analyses, these percentages needed to be converted to percent by volume. Following Alonso and others (2021, their equations 3, 5–7), the sand percentages in the surface samples were converted from a weight-derived metric to a volumetric one using a dry bulk density value of 1,530 kilograms per cubic meter for 100 percent sand (Mulder, 1995, from Alonso and others, 2021).
Creating a 3D Sand Bed Model
To calculate the amount of sand stored or released into the system, including potential uncertainty in results stemming from variability in how the sand content layers were modeled, a total of four 3D sand models were generated for each subembayment, each with 100×100-m cells representing a thickness of 10 cm. First, an all-inclusive 3D model was generated from the best estimate of sand content from cores, sand mine simulated cores, and surface samples. Then, for use in assessing variability in uncertainty, three sand models were generated from only the cores and sand mine simulated cores, varying only the range in values reported in the core logs (1) using values for best estimate, (2) using minimum, and (3) maximum sand percentage values.
To convert between point measurements and grids of percent volume of sand content, different methods of interpolation were explored: Inverse Distance Weighted (IDW), natural neighbor, spline, and topo to raster. For this study, the tool that easily allowed multiple input files for interpolation without the need to combine all data into one file was selected, the topo to raster tool (Esri, 2023). The topo to raster tool allows us to add or subtract inputs, cores and later surface sample data, generate different versions, adjust the controls on interpolation, input minimum and maximum values, set allowable tolerances, and vary the degree of smoothing to create a model that best fit the data.
The 3D sand model’s size is strictly defined as the boundaries, both in the horizontal and vertical, of the bathymetric change grids (Fregoso and others, 2024). For instance, in the central Bay sand model, the maximum deposition is 1,320 cm and the maximum erosion is 1,660 cm. The vertically referenced cores range from 60 cm above the 1980s reference plane for deposition, to 240 cm below the reference plane for erosion. Because the cores do not extend into the full extent of the depositional or erosional layer, the sand percentages at the top and bottom of the cores are extended to the maximum bathymetric change values. By extending the values, this allows for all core locations to contribute data for interpolation purposes for each layer in the 3D sand model. Layers generated for the minimum and maximum range of the cores within each subembayment are applied to all sediment volumes either shallower than or deeper than the extent of the core data.
To help assess variability due to the relatively sparse core data and its effect upon sand volume estimates, we carried out additional analysis limiting calculations to areas of the Bay well constrained by sediment core data. To delineate such areas, we compared the surface layers of the best estimate of the cores-only models with the surface layer of the surface sediment sample layers. We did this by taking the top 10 cm layer from the adjusted and (or) leveled cores from the best estimate model (fig. 6) and compared it to the top 10 cm layer of the all-inclusive model (fig. 7). By using just this surface, the comparison was between the actual data produced from the core, no extrapolation, to data produced from the cores combined with the surface samples. The two models were differenced, subtracting one from the other for each embayment. This differenced surface reveals where the core-only interpolations were similar to the interpolations supported by greater data density, core and surface sample data. Areas of differences less than 10 percent (fig. 8) define an area of higher confidence, where the interpolation in the core-only layers of the 3D sand model are best constrained by actual core data. Calculations limited to these high confidence areas (fig. 8) are presented within our uncertainty analyses (refer to the “Uncertainty” section).
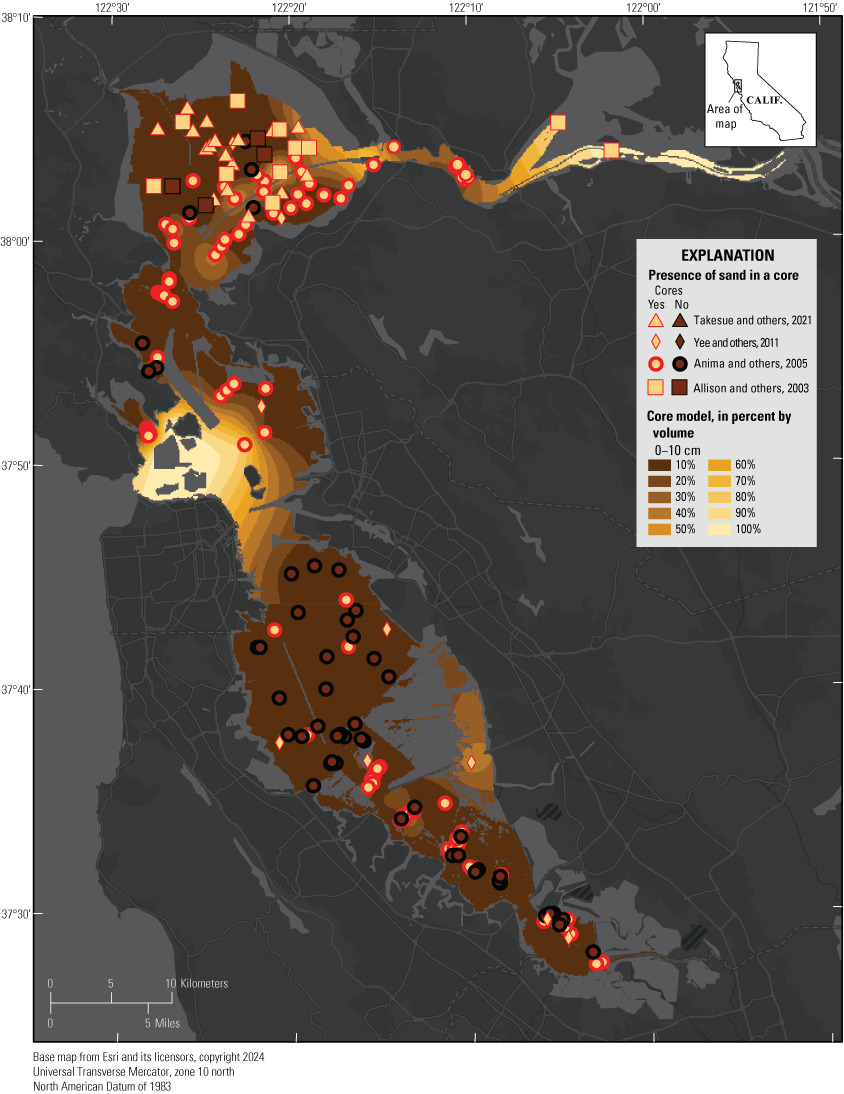
Map of the sand percentage by volume content of the upper (0–10 centimeter [cm]) layer of the three-dimensional model generated using only sediment core data for the San Francisco Bay area, California. Sediment cores were collected throughout San Francisco Bay in 1990 to 1991 (Allison and others, 2003; Anima and others, 2005; Yee and others, 2011; and Takesue and others, 2021). %, percent.
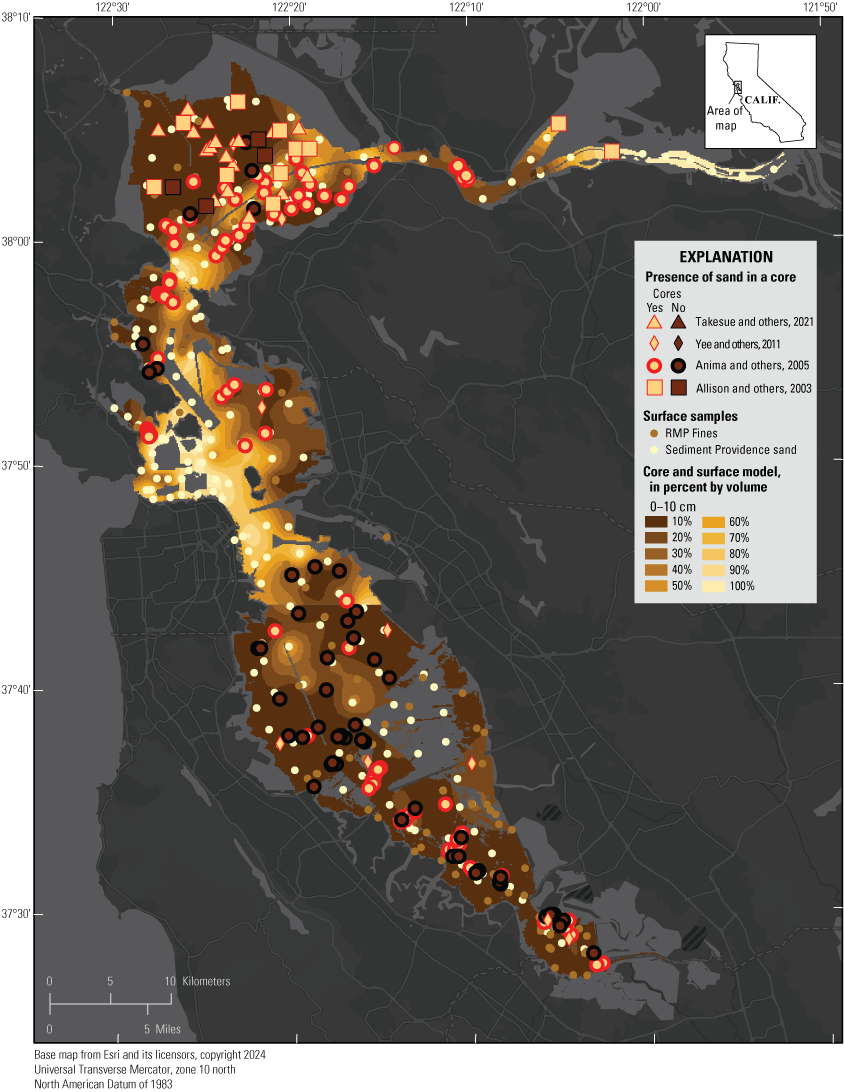
Map of the sand content of the upper (0–10 centimeter [cm]) layer of the three-dimensional model generated using both core and surface sediment sample data for the San Francisco Bay area, California. Sediment cores were collected throughout San Francisco Bay in 1990 to 1991 (Allison and others, 2003; Anima and others, 2005; Yee and others, 2011; and Takesue and others, 2021). Surface sediment provenance study samples from Barnard and others (2013). The Bay Regional Monitoring Program (RMP) surface fines (silt+clay) were used to obtain samples denoting areas without sand (San Francisco Estuary Institute, 2023). %, percent.
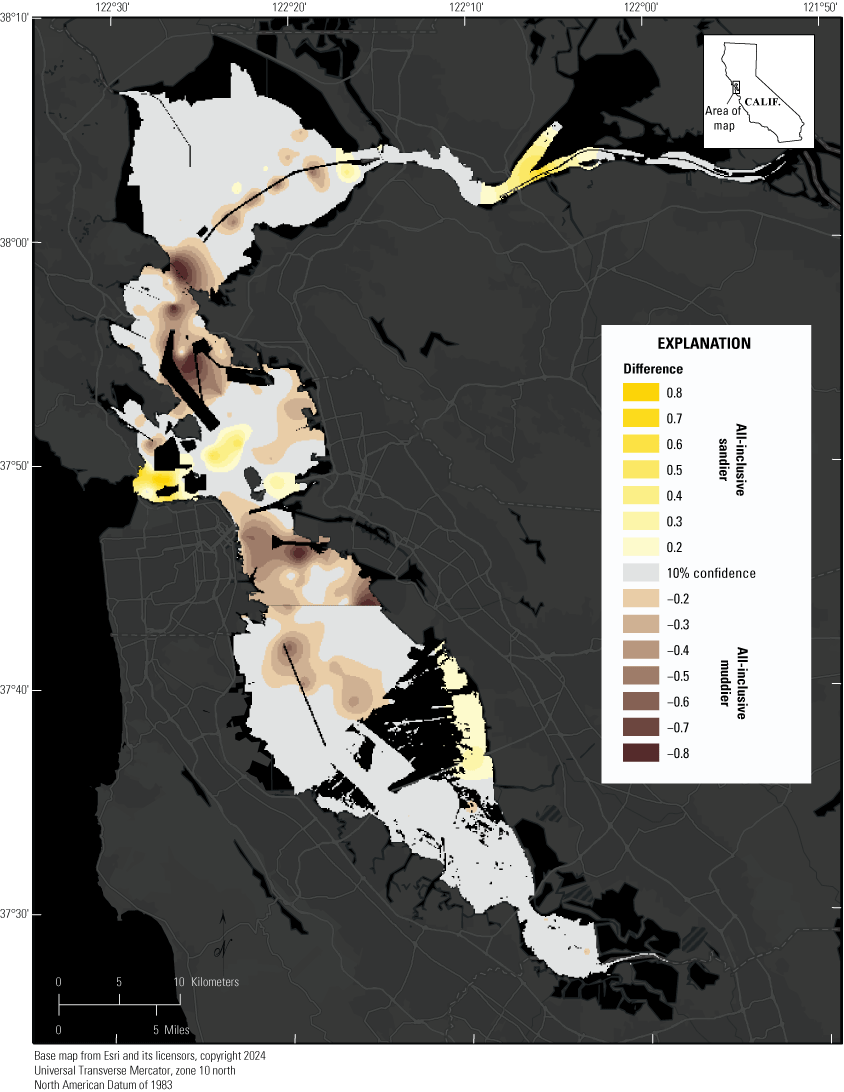
Map of the extent of the 10 percent high confidence area (shown in light gray) showing where the sand content in the three-dimensional models using core data only, and core and surface sample data are within 10 percent of each other, San Francisco Bay area, California.
Calculating Sand Volumes
The technique for calculating the volume of sand in areas of sediment deposition or erosion during the 1980s to 2010s is based on the methodology used by Foxgrover and others (2019) to estimate legacy mercury remobilization in Alviso Slough in the lower south San Francisco Bay. For each subembayment, the bathymetric change grids from Fregoso and others (2024) were parsed out into separate grids for areas of sediment deposition versus areas of erosion to calculate the volume of sand stored (deposited) or released (eroded) during the 1980s to 2010s. The deposition and erosion grids were then sliced into 10-cm-thick horizons, and the volume of sediment calculated on a cell-by-cell basis by multiplying the horizon thickness by the raster cell size (25 m×25 m for Suisun, San Pablo, and central San Francisco Bays, and 50 m×50 m for south Bay). The percent sand content grids from the 3D sand model were resampled to match the cell size of the deposition and erosion grids, 25 m or 50 m. Then, for each 10-cm-thick horizon, the sediment volume layers were multiplied by the corresponding percent sand content grids from the 3D sand model to calculate volume of sand. The individual cells were summed for each horizon and the total sediment volumes and sand volumes exported to a text file. Values were calculated for the all-inclusive 3D model, and the 10 percent clipped versions of the best estimate, minimum and maximum models.
For areas designated as affected by human disturbance, including sand mining, dredging and disposal areas (fig. 5) sand volumes were calculated using average sand content values, provided by subembayment in McKee and others (2023) and bathymetric change from Fregoso and others (2024). Sand mining areas were assumed to contain 100 percent sand, disposal in central Bay was assigned 16 percent, and disposal in San Pablo Bay assigned 45 percent. Sand percent for dredging areas differed by subembayment: Suisun Bay and Carquinez Strait were assigned 7 percent, San Pablo Bay 58 percent, central Bay 30 percent, and upper south Bay 7 percent. The oyster shell hash areas in south Bay used the same methods as above to determine sand content, but with an assumed sand content of 10 percent.
Results
Using a combination of sediment cores, surface samples, and bathymetric change, we calculated the change in the volume of sand stored in the bed of San Francisco Bay between the 1980s and 2010s (refer to the “Methods” section). All analyses were confined to areas where bathymetric change from the 1980s to 2010s were reported by Fregoso and others (2023, 2024). To better interpret the results, we separated the volume calculations for each subembayment into areas directly affected by human activities during the 1980s to 2010s versus areas more representative of the natural system. We partitioned sand volumes into three regions: (1) areas where there were obvious human activities during the period of the bathymetric change study by Fregoso and others (2023, 2024), (2) oyster shell deposits in south San Francisco Bay, and (3) the study area excluding the human affected areas and south Bay oyster shell deposits delineated above (fig. 5).
Sand Volume Change in the Bed Excluding Areas Affected by Human Activities and South Bay Oyster Beds
The 767 km2 of study area that was not obviously affected by anthropogenic activities underwent a greater amount of deposition than erosion of bed sediments. However, there was a net loss in the amount of sand stored in the bed equating to −2.64 Mm3 (table 7). This area excluded mining, dredging, disposal areas, and the south Bay area containing oyster shell deposits. A negative change in net sand volume in bed sediments indicates that the bed is a source of sand—more sand was eroded from the bed than deposited. The largest volume of sand, approximately 4.36 Mm3, lost from the bed through erosion in the study area was in San Pablo Bay. Erosion in Suisun Bay, Carquinez Strait, and upper south Bay resulted in a net decrease in the amount of sand stored in the bed by about 5.42 Mm3. In contrast, about 6.40 Mm3 of sand was added to the bed in central Bay through deposition, in the areas not mined for sediment. In lower south Bay outside the area of the oyster shell deposits, 0.74 of Mm3 of sand was added to the bed by deposition (table 7).
Both the total sediment volumes and the sand content of sediment eroded and deposited affected the net change in sand storage in bed sediments. For Suisun Bay and Carquinez Strait, both the greater volume of erosion (23.55 Mm3) than deposition (8.96 Mm3) and the higher sand content in eroded sediment (91.8 percent) than in deposited sediment (44.2 percent) resulted in a net loss of sand from the bed (table 7). In contrast, for San Pablo Bay, the net loss of sand from the bed was driven by the greater volume of erosion (41.97 Mm3) than deposition (32.2 Mm3) and not the sand content.
The rates of net change in sand volume (in millions of cubic meters per year [Mm3/yr]) also were calculated to account for the variation in subembayment-averaged time spans (20–35 years) between the 1980s and 2010s bathymetric survey collection dates. San Pablo Bay had the highest net rate of sand erosion (−0.14 Mm3/yr) for a span of 31 years. Upper south Bay (29–year span) and Suisun Bay and Carquinez Strait (20-year span) both had erosion rates of −0.11 Mm3/yr of sand from their beds. Central Bay, with the longest time span between surveys of 35 years, had the highest rate of deposition, 0.18 Mm3/yr, and lower south Bay with a span of 28 years, rate of sand deposition was, 0.03 Mm3/yr.
Table 7.
Change in sand volume from the 1980s to the 2010s in the bed of San Francisco Bay, California, excluding areas affected by human activities (mining, dredging, disposal) and South Bay oyster shell deposit areas (Fregoso and others, 2024, 2025).[km2, square kilometer; Mm3, million cubic meters; %, percent; Mm3/yr, million cubic meters per year; na, not applicable]
Sand Volume Change in the Bed in Areas Directly Affected by Human Activities
The net sand volume loss from the bed in areas directly affected by human activities (mining, dredging, disposal) (fig. 5), encompassing 45 km2, was about −14.06 Mm3 (table 8). Both the volume of sand loss and the rate at which it was lost, −0.46 Mm3/yr, are about twice that of the area not directly affected by human activities, while only being 13 percent of the total study area. About three-quarters of the loss was in sand mining areas, with most (about 70 percent) occurring in Central Bay. The sand volume loss in sand mining areas reported here is based upon how much the elevation of the bed lowered between two discrete points in time. Although related to the volume of sand removed from the bed by sand mining, which varied during our study period and was estimated by Perry and others (2015) to average −1.1 Mm3/yr removed from 2005 to 2014, bathymetric change within mining areas also includes sediment deposition and erosion from natural processes. From the 1980s to 2010s, the average lowering of the bed in the mining areas of central and Suisun Bays were −1.0 m and −0.8 m, with rates of sand loss from the bed of −0.25 Mm3/yr and −0.11 Mm3/yr, respectively (table 8). Roelvink and Elias (2023), studied bathymetric change in San Francisco Bay from 2008 to 2019 and found a net decrease in sand storage in the bed from bed lowering in sand mining areas in both central and Suisun Bays, except for one lease area in central Bay during specific time periods.
Net sand loss from the bed in dredging areas was about 4.1 Mm3 and occurred at rates ranging from less than −0.01 to −0.06 Mm3/yr (table 8). Net sand gain to the bed in disposal areas is small, about 1.06 Mm3 in total, compared to a net loss of about 15.1 Mm3 from sand mining and dredging areas.
Table 8.
Change in sand volume in the bed of San Francisco Bay from the 1980s to the 2010s in areas affected by human activities (mining, dredging, and disposal) from Fregoso and others (2024, 2025).[Sand loss volume calculated as sediment loss volume × % sand; sand gain volume calculated as sediment gain volume × % sand; km2, square kilometer; Mm3, million cubic meters; %, percent; Mm3/yr, million cubic meters per year; na, not applicable]
Sand Volume Change in the Bed in South Bay Oyster Shell Deposit Areas
The bed of much of the upper south Bay (65.3 km2) and parts of lower south Bay (0.3 km2) are composed of a mixture of mud and native oyster shells (Foxgrover and others, 2004). Visual observation reveals that the sand-sized particles in these oyster shell deposits are overwhelmingly broken shells, but mineral grains that are sand sized are also present. If grain size analyses were carried out on samples after dissolving the shell material with acid, the mineral grain sand content would be measured. Unfortunately, analytical steps did not include acid dissolution to remove shell material, so the resulting sand content values are for a mixture of shell and mineral grains. If we assume that 10 percent of the sediment eroded and deposited is sand-sized mineral grains, 0.55 Mm3 of sand (defined as mineral and not biogenic material) was eroded from the bed from the 1980s to 2010s at a rate of 0.02 Mm3/yr (table 9). The contribution of oyster shell deposit areas to the total loss of sand from the bed in the Bay is small compared to other areas and because the assumption of 10 percent sand content is not supported by data, we do not include the hypothetical 0.55 Mm3 sand loss in our total estimate.
Table 9.
Change in sand volume in the bed of south San Francisco Bay, California, oyster shell areas from the 1980s to the 2010s, assuming 10 percent sand content (Fregoso and others, 2024).[Sand loss volume calculated as sediment loss volume × % sand; sand gain volume calculated as sediment gain volume × % sand; km2, square kilometer; Mm3, million cubic meters; %, percent; Mm3/yr, million cubic meters per year]
Uncertainty
Because the net sand volume is the result of the difference between volumes of sand erosion and sand deposition, which are large quantities, assessing the uncertainty in our volume estimates is important for the use of these data. In the next section, we address uncertainty in our sand volume estimates.
Uncertainty in Sand Volume Change
Uncertainty in our estimates of the change in sand storage in the bed of San Francisco Bay derives from both inexact knowledge of sand content in the bed and uncertainty in bathymetric surveys, which affects the volume estimates of sediment deposition and erosion between surveys. The uncertainty in estimates in sand content has three primary sources: (1) interpretation of core logs, (2) differences in sand content in the upper 10 cm of cores and surface samples collected in the same areas at different times, and (3) the assumption of constant sand content with depth below the surface at surface sample locations. Analysis of the effect of uncertainty in bathymetric surveys used in this study on sediment volume change is detailed in Fregoso and others (2023). Here we present a modification of that analysis for estimating uncertainty in sand volume change.
Uncertainty from Interpretation of Core Logs
Estimating the sand content in cores from graphical logs is fundamentally subjective. To help quantify the effect of this subjectivity, we developed sand models using the full range of sand content values provided by the researchers that initially analyzed the cores and created the logs. Table 10 contains volumes of sand content derived from reported best estimates of sand content, as well as estimates of the minimum and maximum sand content of core-only 3D models. These estimates were made for the portions of the Bay within the defined 10 percent high confidence clip (fig. 8) where the density of cores is high enough to constrain spatial interpolations between core locations without the additional use of surface sediment samples. In total, the high confidence area covers about 527 km2 or about 69 percent of the study area and excludes the south Bay oyster shell beds and areas directly affected by human activities.
Table 10.
Comparison of sand volumes released and (or) stored in San Francisco Bay, California, bed sediment from the 1980s to 2010s for best, minimum, and maximum sand percentage estimates for cores within the 10 percent high confidence areas of the core-only three-dimensional model (Fregoso and others, 2024, 2025).[Mm3, million cubic meters]
The effect of sand content estimates on the volumes of sand deposition, erosion, and the change in net sand volume in the bed for areas with a high density of cores in San Francisco Bay is presented in table 10. The range of net sand volumes stored in bed sediments using the minimum and maximum estimates of sand content in cores, made for each depth interval identified in the core, is −4.17 to −2.68 Mm3. The minimum estimate resulted in a net sand volume loss of 0.92 Mm3 less than the best estimate. The maximum estimate resulted in a net sand volume loss of 0.57 Mm3 more than the best estimate.
Uncertainty from Augmenting Core Data with Surface Sediment Sample Data
Because the density of cores was less than optimal, we augmented core data with floor-surface sample data. There are two potential sources of uncertainty associated with augmenting core data with surface sediment sample data: (1) differing sand content in surface sediment samples and the upper 10-cm layer of cores, and (2) variation of sand content with depth below the Bay floor. Both sources of uncertainty are difficult to assess.
We evaluated the effect of using surface sample data on net sand volume change in the bed by creating 3D models with (fig. 7) and without (fig. 6) augmenting the core sand contents with surface-sample sand contents in the less than 10 percent difference areas as defined in the “Methods” section. The 3D model including surface samples followed Alonso and others (2021) approach of extrapolating the surface sand content to all intervals below the surface—a constant sand content with depth.
The effect of augmenting core data with surface sample data is shown in table 11. The area of comparison is the same 527 km2 as for the evaluation of uncertainty associated with interpretation of sand content from core logs. Adding surface sample sand contents decreased the net loss of sand from the bed by 0.39 Mm3 from 3.60 to 3.21 Mm3, which is an 11 percent reduction. The reduction in loss was caused by a higher sand content of surface samples in depositional areas than in erosional areas resulting in a greater increase in average sand content in depositional areas (1.2 percent increase vs. 1.1 percent increase in erosional areas).
Table 11.
Effects of including surface sediment samples on sand volumes released and (or) stored in San Francisco Bay, California, bed sediment from the 1980s to 2010s (Fregoso and others, 2024, 2025).[km2, square kilometer; Mm3, million cubic meters; %, percent]
The second uncertainty in using surface samples in addition to cores in the 3D model of sand content is that we assumed uniform sand content with depth following Alonso and others (2021). This assumption is incorrect for most individual cores used in this study but may be acceptable on average; sand content variations with depth below the bay floor may be sometimes less and sometimes more than at the surface. The average difference between the sand content for all 10-cm intervals below the 0–10 cm top interval in the 186 cores used in this study was 1.5 percent, indicating that, on average, the sediment below the surface interval is sandier. Table 12 gives the average sand content as about 29.8 percent for the areas of the 3D model with core data. Therefore, a 1.5 percent increase in sand content below the upper 10 cm of the cores equates to a 5 percent relative increase. The assumption of uniform sand content, on average, does not result in a large uncertainty.
Uncertainty Associated with Bathymetric Change
Fregoso and others (2023) analyzed volume uncertainty from bathymetric change, which is for all sediment sizes (sand, mud, and so forth). The effect of uncertainty in bathymetric change on our estimates of net sand volume change in the bed of San Francisco Bay is similar to, but not the same as, uncertainty in volume change for all sediment. The difference is that the volume of net sand change is a fraction of the volume of net total sediment change. This fraction is the ratio of the sand content of the bed sediment. For example, if the sand content of the bed is 30 percent, the uncertainty in the volume of net sand change is 30 percent of the uncertainty in volume of net total sediment change. Refer to Fregoso and others (2023) for uncertainty in bathymetric change. Here, we present key concepts and extend the analysis to uncertainty in sand volume change in the bed.
Two types of uncertainty are associated with bathymetric change: random error and systematic biases (USACE, 2013; Anderson, 2019). Random error is associated with sounding inaccuracy or noise and is generally randomly distributed in space (Adams, 1942; Shalowitz, 1964; Sallenger and others, 1975). Sounding errors are primarily low magnitude, lie both above and below the true value, and with enough data points cancel to negligible levels when averaged or summed as is the case in calculation of volume change (Anderson, 2019). Systematic biases, however, can enter surveys through various sources, including differences in horizontal or vertical datums (reference points), measurement inconsistencies, or during the creation of bathymetric grids. In comparing bathymetry from two periods for an area with many soundings, random errors cancel out and therefore do not significantly affect our estimates of deposition or erosion. However, systematic biases introduce false offsets between surveys and must be accounted for in bathymetric change estimates.
To minimize systematic error, Fregoso and others (2023) made efforts to understand and account for any differences in horizontal and vertical datums to not influence bathymetric change estimates. However, other sources of systematic errors are still present in our analysis, some of which are known and can be removed and others which are either unknown or difficult to remove; refer to Byrnes and others (2002) for a discussion of sources of systematic survey errors.
Esposito (2016) carried out an error assessment for the U.S. Department of Energy’s Office of Coastal Management (OCM) surveys, which are the majority of the 2010s surveys used to calculate the net change in sand volume in the bed of the Bay. Esposito compared independent depth values collected by different sonars and survey vessels in areas of overlap between adjacent survey blocks. The mean difference of the 1-m grid cells in areas of overlap was 0.019 m and the standard deviation, a representation of random error, was 0.144 m (Esposito, 2016). The mean difference in overlapping grid cells was interpreted by Fregoso and others (2023) to be caused by a systematic bias in one or both surveys mapping the overlap area.
Because the assessment of systematic error is not perfect and does not include all possible sources, and because systematic error likely varied for different parts of the Bay, a single value that we are confident characterizes the uncertainty from systematic error does not exist. However, based on the 0.019 m error found by Esposito (2016) in his error assessment of the OCM surfaces and our own similar finding of 2 cm or less of vertical uncertainty in USGS bathymetric surveys (Foxgrover and others, 2011), Fregoso and others (2023) found it reasonable that the minimum uncertainty of this change surface would be ±4 cm, the sum of 2 cm of uncertainty for the 2010s surveys and an estimated “best case” 2 cm uncertainty for the 1980s surveys. They presented volume change associated with two different possible levels of uncertainty: a minimal value of 4 cm, and a more conservative value of 8 cm that assumes uncertainty in the 1980s surveys is 6 cm. Depending on the application, they left consideration of uncertainty level to the user. Fregoso and others (2023) specify that systematic biases of multiple surveys could be random and could cancel out just as random sounding errors do when there are enough points. If this occurred, then uncertainty would be less than ±4 cm.
Table 12 shows the net sand volume change associated with 4- and 8-cm uncertainties in bathymetric change. The uncertainty in change in net sand volume in the bed associated with uncertainty in bathymetric change is calculated as either 0.04 or 0.08 m times the area of interest (in square kilometers) multiplied by the average sand content for that area. Table 12 reports uncertainties for areas without obvious human activities (table 7), areas with human activities (table 8), and oyster shell areas (table 9). Overall, for 4- and 8-cm uncertainties in bathymetric change, the uncertainties in net sand volume change in the bed in the entire study area are about 9.1 and 18.2 Mm3, respectively. The large area results in a large uncertainty. For reference, the Bay, excluding areas affected by human activities and oyster shell deposits, had a net loss of about 2.64 Mm3 of sand from the bed from the 1980s to 2010s (table 7), which is a smaller volume of sand than the 9.1 Mm3 associated with 4 cm of uncertainty in bathymetric change. The areas affected by human activities had a net loss of about 14.06 Mm3 (table 8) of sand from the bed from the 1980s to 2010s, which is more than 20 times the approximate 0.6 Mm3 associated with uncertainty in bathymetric change at the 4-cm level. The small area results in a small uncertainty.
Table 12.
Net sand volume change associated with uncertainties of 4 centimeters (cm) and 8 cm in bathymetric change, San Francisco Bay area, from the 1980s to 2010s (Fregoso and others, 2024, 2025).[km2, square kilometers; %, percent; Mm3, million cubic meters; na, not applicable]
Summary of Uncertainties in Sand Volume Change
We explored four sources of uncertainty in estimates of the net change in sand volume in the bed of San Francisco Bay: (1) uncertainty associated with estimates in sand contents of cores, (2) uncertainty from augmenting core sand content data with surface sample sand content data, (3) the assumption of uniform sand content with depth we made to use surface samples in a 3D model, and (4) the uncertainty associated with potential systematic errors in the bathymetric change analysis.
The three uncertainties associated with how sand contents were treated in the 3D model are all relatively small compared to the net change in sand volume in the Bay bed, which lost about 17.3 Mm3 combined (including areas of human activities and oyster shell beds) from the 1980s to 2010s. The uncertainty in net volume change associated with interpretation of sand contents from core logs, half of the range between minimum and maximum sand content estimate (table 10), is about 0.8 Mm3 for the areas with cores, which if scaled up to the entire study area is about 1.4 Mm3. The uncertainty in volume change associated with the addition of surface-sample sand contents (table 11) is about 0.4 Mm3 for the areas with cores, which if scaled up to the entire study area is about 0.7 Mm3.
Calculations were not made to determine the effects of potentially underestimating or overestimating sand content. However, on average, if sand content is 1.5 percent higher below the upper 10 cm of the core for a change in net sand volume in the bed, a comparison to the average sand content of about 30 percent indicates that the assumption of uniform sand content with depth would not have a large effect on net sand volume change in the bed. Together, the treatment of sand content introduced an uncertainty of about 3 Mm3 into the estimate of net change in sand volume in the bed.
In contrast, potential uncertainty associated with a systematic error of 4 cm in bathymetric surveys may result in 10.0 Mm3 of uncertainty in estimates of the net change in sand volume in the bed of the study area (table 12). This is about 13 times the uncertainty associated with sand content uncertainties (table 10). There is a 10.0 Mm3 uncertainty for 4 cm of bathymetric change uncertainty and if the uncertainty in bathymetric change is 8 cm the uncertainty in net change in sand volume in the bed doubles to 20.0 Mm3. However, if systematic errors in the surveys are not correlated, then the uncertainty could be less than 10 Mm3.
Limitations of This Study
This is the first study to our knowledge to attempt to estimate the change in net sand volume in the bed of San Francisco Bay. During our research, we discovered limitations in the study, including a lack of sufficient data. First, there were no bathymetric change data for parts of the Bay, most notably within Suisun Bay, which did not allow calculation of an entire Bay net-change in sand in the bed. In addition, surveys were conducted at different times for different parts of the Bay, so the picture is not synoptic for a changing system, which the Bay is. Although we assume that rates of bathymetry change are for the same period across the entire Bay, in reality they are not. Another data limitation was the paucity of cores in the Bay. In total, there were 186 cores available in the Bay, which is an average density of about one core every 5 km2. For comparison, Dam and others (2022) based their study of the Western Scheldt in the Netherlands on 23,000 boreholes, which is an average density of about one core for every 0.7 km2 that supports a 3D model with 100 m×100 m grid cells. The Alonso and others (2021) study of the western Dutch Wadden Sea used 4,800 surface samples to characterize sand content for an area smaller than the Bay. In this study, 209 surface samples from a sediment provenance study (Barnard and others, 2013) had grain size data detailed enough for our use, with another 498 RMP samples (San Francisco Estuary Institute, 2023) that we used to constrain the 3D sand model in areas where sand is absent.
The biggest limitation, however, was not data. The inability to unequivocally quantify the amount of uncertainty associated with the bathymetric change component of the change in net sand volume in the bed of San Francisco Bay calculation, limits interpretation of the results. For areas not affected by human activities, if a conservative estimate of bathymetric uncertainty is used, the uncertainty is similar to our estimates of net change in sand volume in the bed of the Bay. The conservative estimate is a worst-case scenario; the likely systematic error is probably much smaller (Fregoso and others, 2023).
Future Considerations
There are several next steps in this research that could make it more useful in developing sand budgets and improving the understanding of how sand is eroded, deposited, and moves in San Francisco Bay. A first possible step is to carry out bathymetric surveys in areas that were not surveyed in the 2010s, especially Suisun Bay. Analysis of such a survey would allow a more complete picture of the change in sand storage in the bed of the Bay. An analysis of gradients in sand content in the bed could inform where additional cores are needed to improve the 3D model of sand content in the bed developed for this study. An analysis exploring the effects of removing cores used in development of the 3D sand model could shed light on errors introduced by interpolation between cores.
The data developed in this study can also be used to calibrate and validate numerical hydrodynamic/sediment transport/geomorphic change models to both improve a sand budget and to better understand sand transport in the Bay. Such models can explore how sea level rise, climate change, and change in human activities could alter the sand system. Recent research that uses coupled hydrodynamic/sediment transport/geomorphic change numerical models to forecast the effects of sea level rise on geomorphic change has already started (for example, Elmilady and others, 2019; van der Wegen and others, 2019).
The application of the updated version of the SedTrails tool (Elias and Pearson, 2020) to the data developed in this study is a potential future step. SedTrails post-processes numerical sediment transport model outputs and can determine sand transport pathways and connections between different parts of a San Francisco estuary system by tracking the paths and number of sand particles travelling between a start and end point and how long the sand particles remain at the end point. To date, SedTrails has only been applied to two-dimensional model outputs. In the future, it could be possible to apply SedTrails to outputs from a 3D numerical model to account for 3D circulation (and sediment transport) that are present in parts of the Bay.
As mentioned in the “Limitations of This Study” section, an important future addition to this research would be to improve the estimates of uncertainty. Although not an easy task, more precise uncertainty estimates will increase the utility of this research. A component of this research would be to determine if the uncertainty is aleatory or epistemic, both of which are present in our study. Aleatory uncertainty, which is also referred to as stochastic uncertainty, variability, or irreducible uncertainty, derives from the natural randomness in processes and is typically characterized by probability distributions. Epistemic uncertainty, which Roy and Oberkampf (2011) refer to as reducible uncertainty or ignorance uncertainty, can be reduced or theoretically eliminated by increased understanding of the system. Research increasing the understanding of the aleatory and epistemic contributions to bathymetric uncertainty for surveys of the Bay, the largest source of uncertainty in our study, could improve the usefulness of the results. Because aleatory uncertainty in bathymetric surveys—random error in soundings—tends to cancel out, it does not have a large impact on volumetric change uncertainty, thus additional research on aleatory uncertainty is not a high priority. Increased understanding and better quantification of epistemic uncertainty, primarily from biases in depth soundings, could decrease the uncertainty in our estimates of change in sand storage in the bed of the Bay.
Conclusion
For the first time, the net change in sand volume in the bed of San Francisco Bay was estimated using a combination of sand content information derived from sediment cores and surface samples in combination with bathymetric change analyses. This involved generating a three-dimensional model of variation of sand content in bed sediments and using bathymetric change from the 1980s to 2010s to track volumes of sand erosion, deposition, and bed level changes from human activities such as sand mining, dredging, and disposal. The following are observations made through sand volume change analyses in the Bay:
-
1. The bed of San Francisco Bay is losing sand. Over the entire area surveyed, net sand loss from bed level change was about 17 million cubic meters (Mm3) from the 1980s to 2010s at a rate of about 0.8 million cubic meters per year (Mm3/yr). Rates of net sand loss in the subareas used in this study range from less than 0.1 Mm3/yr in areas with little sand to 0.25 Mm3/yr (lowering of the bed in the sand rich central Bay sand mining areas). Some subareas had net sand volume gain. The rate of sand gain was highest, 0.18 Mm3/yr, in central Bay outside of areas affected by human activities.
-
2. Net sand loss from lowering of the bed in permitted lease mining areas is about two-thirds of the total sand loss for the entire study area from the 1980s to 2010s. The average lowering of the bed in the mining areas of central and Suisun Bays were −1.0 meters (m) and −0.8 m, respectively.
-
3. Uncertainty in the change in sand volume in the bed of San Francisco Bay associated with uncertainty in sand content of the bed may be as great as 25 percent of the net volume of sand loss.
-
4. Uncertainty in the change in sand volume in the bed of San Francisco Bay associated with uncertainty in bathymetric change may be large, about the same magnitude as the change in sand volume if the uncertainty in bathymetric change is 8 cm. However, the more reasonable bounds on uncertainty from 4 cm attributed to bathymetric change could be justified. Further refining estimates of uncertainty in bathymetric change is key to guiding the use of the results of this study.
The information developed in this study could improve a sand budget for the Bay. Additional work on improving uncertainty estimates could increase the utility of the results. Incorporating data developed in this study in coupled hydrodynamic/sediment transport/geomorphic change models could help improve understanding of how sand moves and is eroded/deposited in the Bay. Additional research could be carried out to explore how sea level rise, climate change, and change in human activities alter the sand system.
References Cited
Adams, K.T., 1942, Hydrographic manual (2nd ed.): Washington, D.C., U.S. Department of Commerce, U.S. Coast and Geodetic Survey, U.S. Government Printing Office, 940 p. [Available at https://www.biodiversitylibrary.org/item/55319#page/996/mode/1up.]
Allison, D., Hampton, M., and Jaffe, B.E., 2003, Preliminary analysis of cores from North San Francisco Bay, California: U.S. Geological Survey Open-File Report 2003–111, 10 p., accessed September 1, 2023, at https://doi.org/10.3133/ofr03111.
Alonso, A.C, van Maren, D.S, Elias, E.P.L., Holthuijsen, S.J., and Wang, Z.B., 2021, The contribution of sand and mud to infilling of tidal basins in response to a closure dam: Marine Geology, v. 439, article 106544, accessed September 1, 2023, at https://doi.org/10.1016/j.margeo.2021.106544.
Anderson, S.W., 2019, Uncertainty in quantitative analyses of topographic change—Error propagation and the role of thresholding: Earth Surface Processes and Landforms, v. 44, no. 5, p. 1015–1033, accessed September 1, 2023, at https://doi.org/10.1002/esp.4551.
Anima, R.J., Clifton, H.E., Reiss, C., and Wong, F.L., 2005, Locations and descriptions of gravity, box, and push cores collected in San Francisco Bay between January and February 1990 and 1991: U.S. Geological Survey Open-File Report 2005–1453, 24 p., accessed September 1, 2023, at https://doi.org/10.3133/ofr20051453.
Barnard, P.L., Foxgrover, A.C., Elias, E., Erikson, L.H, Hein, J.R, McGann, M.L., Mizell, K., Rosenbauer, R.J., Swarzenski, P.W., Takesue, R.K., Wong, F.L., and Woodrow, D.L., 2013, San Francisco coastal system grain size and geochemical data for sand provenance study: Marine Geology, v. 336, supplement, accessed September 1, 2023, at https://doi.org/10.1016/j.margeo.2012.11.008. [This supplement is also available at https://doi.org/10.1594/PANGAEA.803904.]
Byrnes, M.R., Baker, J.L., and Li, F., 2002, Quantifying potential measurement errors and uncertainties associated with bathymetric change analysis: U.S. Army Corps of Engineers, Engineer Research and Development Center (ERDC), Coastal and Hydraulics Engineering Technical Note (CHETN), ERDC/CHLCHETN-IV-50, 17 p., accessed September 1, 2023, at https://apps.dtic.mil/sti/tr/pdf/ADA588888.pdf.
California Coastal Conservancy, 2020, RFPQ—Fall 2020 research to understand impacts of bay sand mining on sand supply and transport in SF Bay and outer coast: State of California website, accessed March 5, 2024 at https://scc.ca.gov/2020/07/09/rfpq-fall-2020-research-to-understand-impacts-of-bay-sand-mining-on-sand-supply-and-transport-in-sf-bay-and-outer-coast/.
Chant, R.J., Ralston, D.K., Ganju, N.K., Pianca, C., Simonson, A.E., and Cartwright, R.A., 2021, Sediment budget estimates for a highly impacted embayment with extensive wetland loss: Estuaries and Coasts, v. 44, p. 608–626, accessed September 1, 2023, at https://doi.org/10.1007/s12237-020-00784-3.
Conomos, T.J., and Peterson, D.H., 1977, Suspended-particle transport and circulation in San Francisco Bay—An overview: Estuarine Processes v. 2, p. 82–97, accessed September 1, 2023, at https://doi.org/10.1016/B978-0-12-751802-2.50014-X.
Dam, G., van der Wegen, M., Taal, M., and van der Spek, A., 2022, Contrasting behavior of sand and mud in a long-term sediment budget of the Western Scheldt estuary: Sedimentology, v. 69, no. 5, p. 2267–2283, accessed September 1, 2023, at https://doi.org/10.1111/sed.12992.
Elias, E.P.L., and Pearson, S., 2020, SedTRAILS—Sediment TRAnsport visualization & Lagrangian Simulator—A novel method to visualize and analyses sediment transport pathways: Delft, the Netherlands, Deltares, report 11205236-003-ZKS-0002, 37 p., accessed September 1, 2023, at https://publicwiki.deltares.nl/display/BOK/III.+Producten+-+Zeegaten?preview=%2F131138846%2F203883142%2F11205236-003-ZKS-0002_v0.1-SedTRAILS+-+Sedimen t+TRAnsport+visualization+%26+Lagrangian+Simulator+20200512.pdf.
Elmilady, H., van der Wegen, M., Roelvink, D., and Jaffe, B.E., 2019, Intertidal area disappears under sea level rise—250 years of morphodynamic modelling in San Pablo Bay, California: Journal of Geophysical Research Earth Surface, v. 124, no. 1, p. 38–59, accessed September 1, 2023, at https://doi.org/10.1029/2018JF004857.
Esposito, C., 2016, Descriptive report NCNP0000-14-01192, report to accompany survey—San Francisco Bay habitat mapping: National Oceanic and Atmospheric Administration, prepared by Fugro Pelagos, Inc., San Diego, Calif., 30 p., accessed June 12, 2021, at https://coast.noaa.gov/htdata/raster2/elevation/SF_mbs_areaA_2014_8500/NCNP0000-14-01192_DR.pdf.
Esri, 2023, How Topo to Raster Works—ArcPro documentation: Esri, accessed June 12, 2023 at https://pro.arcgis.com/en/pro-app/latest/tool-reference/spatial-analyst/how-topo-to-raster-works.htm.
Foxgrover, A.C., Jaffe, B.E., Hovis, G.T., Martin, C.A., Hubbard, J.R., Samant, M.R., and Sullivan, S.M., 2007, 2005 Hydrographic survey of South San Francisco Bay, California: U.S. Geological Survey Open-File Report 2007–1169, 99 p., accessed June 12, 2021, at https://doi.org/10.3133/ofr20071169.
Foxgrover, A.C., Higgins, S.A., Ingraca, M.K., Jaffe, B.E., and Smith, R.E., 2004, Deposition, erosion, and bathymetric change in South San Francisco Bay—1858–1983: U.S. Geological Survey Open-File Report 2004–1192, 25 p., accessed June 12, 2021, at https://doi.org/10.3133/ofr20041192.
Foxgrover, A.C., Finlayson, D.P., Jaffe, B.E., and Fregoso, T.A., 2011, Bathymetry and digital elevation models of Coyote Creek and Alviso Slough, South San Francisco Bay, California (ver. 5.0, June 2020): U.S. Geological Survey Open-File Report 2011–1315, 21 p., accessed May 31, 2023, at https://doi.org/10.3133/ofr20111315.
Foxgrover, A.C., Marvin-DiPasquale, M., Jaffe, B.E., and Fregoso, T.A., 2019, Slough evolution and legacy mercury remobilization induced by wetland restoration in South San Francisco Bay: Estuarine, Coastal and Shelf Science, v. 220, p. 1–12., accessed May 31, 2023, at https://doi.org/10.1016/j.ecss.2019.02.033.
Fregoso, T.A., Foxgrover, A.C., and Jaffe, B.E., 2008, Sediment deposition, erosion, and bathymetric change in Central San Francisco Bay—1855–1979: U.S. Geological Survey Open-file Report 2008–1312, 46 p., accessed May 31, 2023, at https://doi.org/10.3133/ofr20081312.
Fregoso, T.A., Foxgrover, A.C., Kharrazi, B., and Jaffe, B.E., 2025, Estimates of percent sand in cores collected in San Francisco Bay, California: U.S. Geological Survey data release, https://doi.org/10.5066/P9Y7W1ZM.
Fregoso, T.A., Jaffe, B.E., and Foxgrover, A.C., 2024, Bathymetric change analysis in San Francisco Bay, California, from 1971 to 2020: U.S. Geological Survey data release, https://doi.org/10.5066/P1332UUW.
Fregoso, T.A., Jaffe, B.E., and Foxgrover, A.C., 2023, Sediment deposition, erosion, and bathymetric change in San Francisco Bay, California, 1971–1990 and 1999–2020 (ver. 1.1, June 2024): U.S. Geological Survey Open-File Report 2023–1031, 19 p., accessed May 12, 2023, at https://doi.org/10.3133/ofr20231031.
Fregoso, T.A., Jaffe, B.E., and Foxgrover, A.C., 2020, High-resolution (1 m) digital elevation model (DEM) of San Francisco Bay, California, created using bathymetry data collected between 1999 and 2020 (ver. 2.0, July 2021): U.S. Geological Survey data release, https://doi.org/10.5066/P9TJTS8M.
Folk, R.L., 1974, Petrology of sedimentary rocks: Austin, Tex., Hemphill Publishing Co., 170 p., accessed May 12, 2023, at http://hdl.handle.net/2152/22930.
McKee, L.J., Zi, T., Pearce, S.A., Grosso, C., Wong, A., Weaver, M., Dusterhoff, S., Lowe, J., Elias, E., and Roelvink, F., 2023, Sand budget and sand transport in San Francisco Bay: California State Coastal Conservancy and the San Francisco Bay Conservation and Development Commission, prepared by San Francisco Estuary Institute (SFEI)-Aquatic Science Center, Richmond, Calif., SFEI Contribution #1125.
Roelvink, F., and Elias, E., 2023, Understanding impacts of bay sand mining on sand supply and transport in San Francisco Bay and Outer Coast Part 2—Mining volume area analysis: Delft, the Netherlands, Deltares, Report 11206299-000-ZKS-0003, 58 p, accessed January 29, 2025, at https://www.sfei.org/sites/default/files/biblio_files/Task%202.2%2011206299-000-ZKS-0003_v1.0-Understanding%20Impacts%20of%20Bay%20Sand%20Mining%20on% 20Sand%20Supply%20and%20Transport%20Task%202-2.pdf.
Roy, C.J., and Oberkampf, W.L., 2011, A comprehensive framework for verification, validation, and uncertainty quantification in scientific computing, Computer Methods in Applied Mechanics and Engineering, v. 200, no. 25–28, p. 2131–2144, accessed September 1, 2023, at https://doi.org/10.1016/j.cma.2011.03.016.
Sallenger, A.H., Goldsmith, V., and Sutton, C.H., 1975, Bathymetric chart comparisons—A manual of methodology, error criteria, and applications: Williamsburg, Va., College of William and Mary, Virginia Institute of Marine Science, Special Report in Applied Marine Science and Ocean Engineering (SRAMSOE), no. 66, accessed September 1, 2023, at https://doi.org/10.21220/V5MX6J.
San Francisco Estuary Institute, 2023, CD3—Contaminant data display and download: Oakland, Calif., San Francisco Estuary Institute, Data Services webpage, accessed April 31, 2023, at https://cd3.sfei.org/.
Schoellhamer, D.H., Lionberger, M.A., Jaffe, B.E., Ganju, N.K., Scott, S.A., and Shellenbarger, G.G, 2005, Bay sediment budgets—Sediment accounting 101, in Davis, J., and Connor M., eds., Pulse of the estuary—Monitoring and managing water quality in the San Francisco estuary: Oakland, Calif., San Francisco Estuary Institute, Contribution 78 p. 58–63, accessed September 1, 2023, at https://www.sfei.org/sites/default/files/biblio_files/RMP05_PulseoftheEstuary.pdf.
Schoellhamer, D.H, McKee, L., Pearce, S., Kauhanen, P., Salomon, M., Dusterhoff, S., Grenier, L., Marineau, M., and Trowbridge, P., 2018, Sediment Supply to San Francisco Bay, water years 1995 through 2016—Data, trends, and monitoring recommendations to support decisions about water quality, tidal wetlands, and resilience to sea level rise: Oakland, Calif. San Francisco Estuary Institute, Contribution Number 842.
Shalowitz, A.L., 1964, Shore and sea boundaries—With special reference to the interpretation and use of coast and geodetic survey data: U.S. Department of Commerce, U.S. Coast and Geodetic Survey Publication 10–1, v. 2, 749 p., accessed September 1, 2023, at https://msa.maryland.gov/megafile/msa/speccol/sc5700/sc5796/000009/000000/000103/unrestricted/html/index.html. [Also available at https://babel.hathitrust.org/cgi/pt?id=ufl.31262000337427&seq=9.]
Takesue, R.K., McGann, M.L., Lorenson, T.D., and Watt, J.T., 2021, Geophysical properties, geochronologic, and geochemical data of sediment cores collected from San Pablo Bay, California, October 17–20, 2016: U.S. Geological Survey data release, accessed September 1, 2023, at https://doi.org/10.5066/P9BDEB3K.
U.S. Army Corps of Engineers [USACE], 2013, Hydrographic Surveying: U. S. Army Corps of Engineers, Washington, D.C., Engineer Manual 1110-2-1003, 506 p., accessed June 12, 2021, at https://www.publications.usace.army.mil/Portals/76/Publications/EngineerManuals/EM_1110-2-1003.pdf
U.S. Army Corps of Engineers [USACE], 2023 USACE Hydrographic surveys: U.S. Army Corps of Engineers, Spatial Data Branch webpage, accessed May 27, 2023, at https://www.arcgis.com/apps/dashboards/4b8f2ba307684cf597617bf1b6d2f85d.
van der Wegen, M., Roelvink, J.A., and Jaffe, B.E., 2019, Morphodynamic resilience of intertidal mudflats on a seasonal timescale: Journal of Geophysical Research Oceans, v. 124, no. 11, p. 8290–8308, accessed September 1, 2023, at https://doi.org/10.1029/2019JC015492.
Woodrow, D.L., Chin, J., Wong, F., Fregoso, T.A., and Jaffe, B.E., 2010, Gravity cores, radiocarbon dates, and grain-size of surficial sediments, Central San Francisco Bay, California, chap. 2 of Chin, J.L., Woodrow, D.L., McGann, M., Wong, F.L., Fregoso, T.A., and Jaffe, B.E., 2010, Estuarine sedimentation, sediment character, and foraminiferal distribution in central San Francisco Bay, California: U.S. Geological Survey Open-File Report 2010–1130, p. 14–34, accessed September 1, 2023, at https://doi.org/10.3133/ofr20101130.
Woodrow, D.L., Chin, J.L., Wong, F.L., Fregoso, T.A., and Jaffe, B.E., 2017a, Description of gravity cores from San Pablo Bay and Carquinez Strait, San Francisco Bay, California: U.S. Geological Survey Open-File Report 2017–1078, 14 p., accessed September 1, 2023, at https://doi.org/10.3133/ofr20171078.
Woodrow, D.L., Chin, J.L., Wong, F.L., Fregoso, T.A., and Jaffe, B.E., 2017b, Gravity cores from San Pablo Bay and Carquinez Strait, San Francisco Bay, California: U.S. Geological Survey data release, accessed September 1, 2023, at https://doi.org/10.5066/F7XG9PB0.
Woodrow, D.L., Fregoso, T.A., Wong. F.L., and Jaffe, B.E., 2014, Late Holocene sedimentary environments of South San Francisco Bay illustrated in gravity cores, U.S. Geological Survey Open-File Report 2014–1198, 91 p., accessed September 1, 2023, at https://doi.org/10.3133/ofr20141198.
Wright, S.A., and Schoellhamer, D.H., 2005, Estimating sediment budgets at the interface between rivers and estuaries with application to the Sacramento–San Joaquin River Delta: Water Resources Research, v. 41, no. 9, article W09428, 17 p., accessed September 1, 2023, at https://doi.org/10.1029/2004WR003753.
Yee, D., Bemis, B., Hammond, D., Heim, W., Jaffe, B.E., Rattonetti, A., and van Bergen, S., 2011, Age estimates and pollutant concentrations of sediment cores from San Francisco Bay and wetlands: Oakland, Calif., San Francisco Estuary Institute, Technical report of the Regional Monitoring Program, Contribution no. 652, 65 p., accessed September 1, 2023, at https://www.sfei.org/sites/default/files/biblio_files/652-Coring-2006-Yee-report-Final-web.pdf.
Appendix 1. Example of the Core Log for Core 90–134 Used in This Study
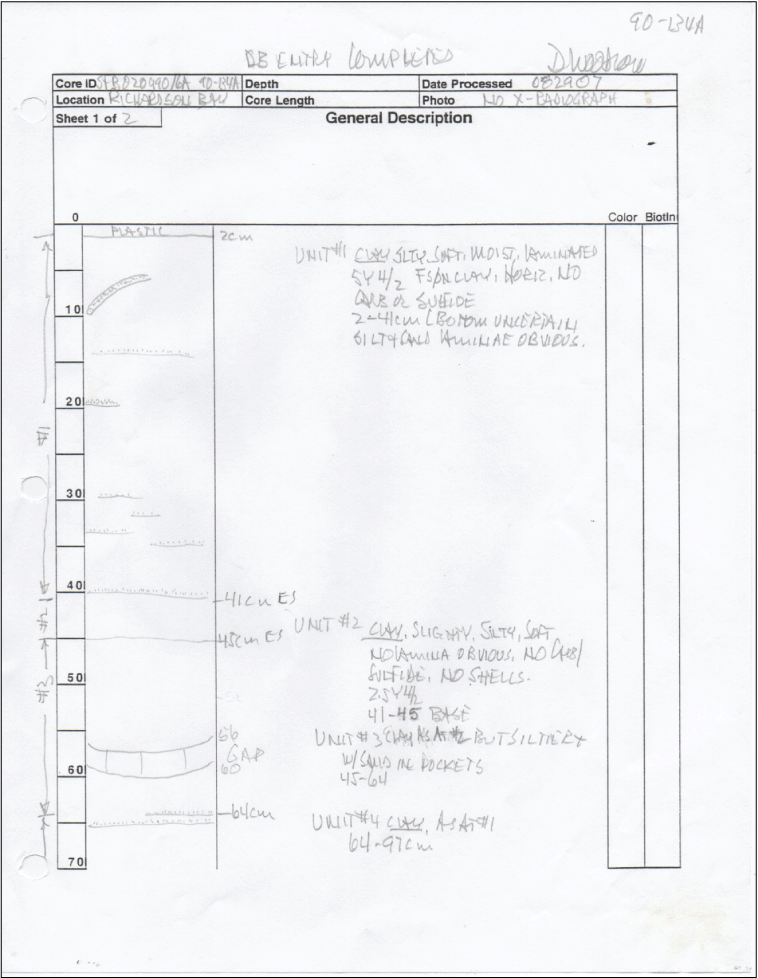
Page 1 of 2 of the handwritten core log for the top section (A) of core 90-134 in central San Francisco Bay, California. Core collected by Anima and others (2005). cm, centimeter.
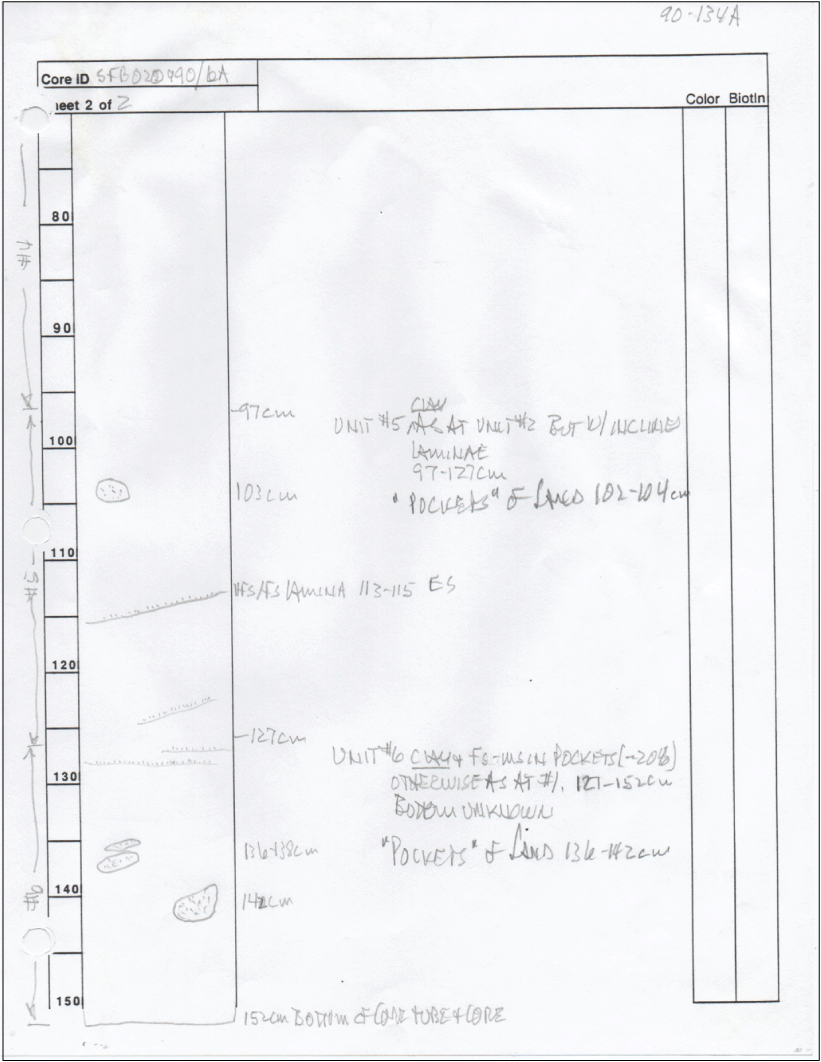
Page 2 of 2 of the handwritten core log for the top section (A) of core 90-134 in in central San Francisco Bay, California Core collected by Anima and others (2005). cm, centimeter.
Reference Cited
Anima, R.J., Clifton, H.E., Reiss, C., and Wong, F.L., 2005, Locations and descriptions of gravity, box, and push cores collected in San Francisco Bay between January and February 1990 and 1991: U.S. Geological Survey Open-File Report 2005–1453, 24 p., accessed September 1, 2023, at https://doi.org/10.3133/ofr20051453.
Conversion Factors
International System of Units to U.S. customary units
Moffett Field Publishing Service Center, California
Manuscript approved for publication April 14, 2025
Edited by Phil Frederick
Layout by Cory Hurd
Disclaimers
Any use of trade, firm, or product names is for descriptive purposes only and does not imply endorsement by the U.S. Government.
Although this information product, for the most part, is in the public domain, it also may contain copyrighted materials as noted in the text. Permission to reproduce copyrighted items must be secured from the copyright owner.
Suggested Citation
Fregoso, T.A., Jaffe, B.E., Foxgrover, A.C., Woodrow, D.L., Kharrazi, B., and Orzech, K., 2025, Contributions of erosion, deposition, and human activities to a change in sand storage in the bed of San Francisco Bay, California, 1980s to 2010s: U.S. Geological Survey Open-File Report 2025–1022, 30 p., https://doi.org/10.3133/ofr20251022.
ISSN: 2331-1258 (online)
Study Area
| Publication type | Report |
|---|---|
| Publication Subtype | USGS Numbered Series |
| Title | Contributions of erosion, deposition, and human activities to a change in sand storage in the bed of San Francisco Bay, California, 1980s to 2010s |
| Series title | Open-File Report |
| Series number | 2025-1022 |
| DOI | 10.3133/ofr20251022 |
| Publication Date | July 28, 2025 |
| Year Published | 2025 |
| Language | English |
| Publisher | U.S. Geological Survey |
| Publisher location | Reston, VA |
| Contributing office(s) | Pacific Coastal and Marine Science Center |
| Description | Report: vii, 30 p.; 4 Data Releases |
| Country | United States |
| State | California |
| Other Geospatial | San Francisco Bay |
| Online Only (Y/N) | Y |