

Analysis of the Potential Effects of Uzbekistan’s Mineral Endowment on the Critical Mineral Supply of Tungsten
Links
- Document: Report (840 KB pdf) , HTML , XML
- Download citation as: RIS | Dublin Core
Abstract
Tungsten appears on the 2018 and 2022 U.S. Geological Survey critical mineral lists in part because of a very high global production concentration in China, which produces almost 83 percent of the world’s mined tungsten. Using known parameters and values from other tungsten mining operations, we created hypothetical scenarios in which three tungsten deposits in Uzbekistan are considered for development. Our results show that all three deposits are likely to be economically viable to develop under 2024 market conditions. If the three studied tungsten deposits were put into production, Uzbekistan could become the third-leading tungsten-producing country in the world and increase world output of tungsten by 2.7 percent. Putting these tungsten deposits in Uzbekistan into production could slightly reduce the tungsten global market concentration, therefore reducing the supply disruption potential for tungsten.
Plain Language Summary
Tungsten is a critical mineral used in many everyday products, from light bulbs to electronics and medical equipment. In 2024, China was the leading tungsten mining country, producing about 83 percent of all tungsten in the world. Uzbekistan has known tungsten deposits, so we investigated potential effects on the world supply of tungsten if three of those tungsten deposits were developed and produced tungsten and other minerals. Using market conditions from 2024 in our models, we determined that these tungsten deposits could be mined profitably. Our results suggest that if these deposits are developed, Uzbekistan could become the third-leading tungsten producer in the world, increasing global tungsten supply by 2.7 percent. Development of these tungsten deposits could help prevent possible shortages of tungsten.
Introduction
Modern economies increasingly rely on a variety of nonrenewable resources that may have supply constraints or restrictions. The nature of supply restrictions and how these supply restrictions may be alleviated can be identified to help understand and to compensate for supply constraints. Critical minerals are minerals that have been identified as being more likely to have supply constraints. McCullough and Nassar (2017) developed a methodology and studied the early warning screening of minerals for potential criticality. Specifically, they selected a list of potential indicators that could contribute to criticality, developed computational methods, and calculated criticality for a wide variety of minerals. Consequently, they identified supply risk, production growth, and market dynamics as indicators that a particular mineral is potentially critical. An updated methodology was developed and described by Nassar and Fortier (2021). In February 2022, the U.S. Geological Survey (USGS) published a revised list of critical minerals for the United States that replaced the 2018 list (Department of the Interior, 2018) and increased the number of critical minerals from 35 to 50 (U.S. Geological Survey, 2022).
Tungsten is on both the 2018 and 2022 critical minerals lists. According to Shedd (2024), 82.7 percent of all mined tungsten in the world was produced by mines in China, followed by production by mines in Vietnam (5.0 percent) and Russia (2.5 percent) (table 1).
Table 1.
World production of tungsten in 2022.[Data from Shedd, 2024]
The concentration of production in a single source country is the main reason for a high supply risk, so to reduce the level of criticality for tungsten, the concentration of production could be changed either by increasing existing production in other countries or by developing new production in other countries (Nassar and others, 2020). Alleviating the criticality of tungsten by increasing production in other countries or developing new production in other countries depends on the availability of high-quality tungsten resources that may be profitably produced elsewhere in the world.
Uzbekistan has significant resources of critical minerals, including tungsten. Eight mineral deposits—Gussay, Ingichke, Kara-Tyube, Koytash-Ugat, Lyangar, Sarykul, Sautbay, and Yakhton—are known to have significant tungsten resources (Gosudarstvennyi Komitet Respubliki Uzbekistan po geologii i mineral’nym resursam, undated a, b, c; Safirova, 2023). Some of these deposits, such as Ingichke and Koytash-Ugat, produced ore between the 1940s and 1990s. In the mid-1990s, production at these operations was stopped because low tungsten prices rendered production unprofitable. Several other tungsten deposits were considered for development in the past two decades, but as of 2023, Uzbekistan had no operating tungsten mines (Gosudarstvennyi Komitet Respubliki Uzbekistan po geologii i mineral’nym resursam, undated a, b, c; Safirova, 2023).
We analyzed three tungsten deposits in Uzbekistan (Koytash-Ugat, Yakhton, and Sautbay; fig. 1) that were identified as suitable for development (soon after discovery, preliminary feasibility studies concluded that production is likely to be profitable; Gosudarstvennyi Komitet Respubliki Uzbekistan po geologii i mineral’nym resursam, undated a, b, c) but have not yet been developed. Using a methodology that combines the geologic data from the deposits with published summary financial data from tungsten mines in other countries, we simulate potential financial outcomes and conduct sensitivity analyses with respect to uncertain price and cost parameters. We also analyzed the potential effect that development of the three mineral deposits in Uzbekistan could have on world tungsten production, and whether development of these deposits could affect tungsten criticality.
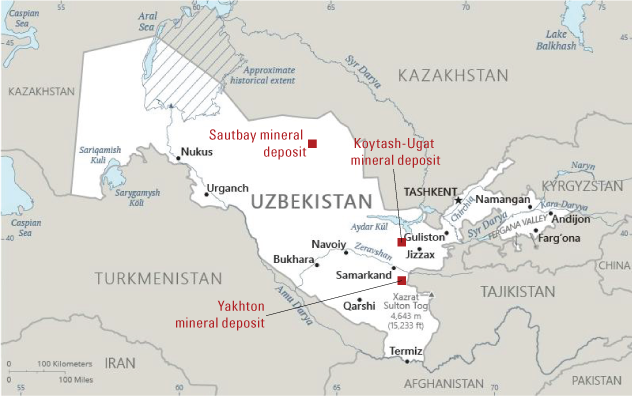
Map of Uzbekistan and surrounding countries showing major cities in Uzbekistan and locations of the Koytash-Ugat, Yakhton, and Sautbay mineral deposits.
Tungsten Feasibility Studies
Feasibility studies contain well-researched production plans and assumptions that are presented to funders and investors, yet the projected results from these studies may differ from the actual figures realized during project implementation. Suárez Sánchez and others (2015) analyzed five new tungsten mining projects based on their published feasibility studies. The projects were Barruecopardo (Spain), Kilba (Australia), Hemerdon (United Kingdom), Sangdong (South Korea), and King Island Scheelite (Australia). Suárez Sánchez and others (2015) collected information on the projects’ capital and operating costs, planned mining and processing capacities, resources and reserves, and planned financial outcomes, such as net present values, internal rates of return, and capital payback periods (table 2). The unit of measurement for tungsten concentrates in international markets is the metric ton unit (mtu). An mtu is 1% of a metric ton, which is equivalent to 10 kg or, equivalently, 1 metric ton unit of tungsten trioxide contains 7.93 kilograms [kg] of tungsten.
Table 2.
Summary of data for five tungsten projects from Australia, South Korea, Spain, and the United Kingdom.[Data from Suárez Sánchez and others (2015); 1 metric ton unit (mtu) of tungsten trioxide (WO3) contains 7.93 kilograms of tungsten. NA, not applicable; APT, ammonium paratungstate; kt/yr, kiloton/year; NPV, net present value; IRR, internal rate of return]
For this report, we compared geologic parameters of Uzbekistan’s tungsten deposits, such as resources, reserves, and grades, with similar parameters for the deposits described in Suárez Sánchez and others (2015) and were able to estimate capital and operating costs for three hypothetical tungsten mine projects in Uzbekistan. The Hemerdon project was notable because the operating company was planning to produce tungsten and tin simultaneously, and the revenue for the tin concentrate served as a credit that reduced the operating costs of tungsten production (Suárez Sánchez and others, 2015). In the case of the tungsten deposits considered in this report, gold is a coproduct that serves a role similar to that of the role of tin in the Hemerdon project.
Methodology
A synthetic modeling approach was used to obtain the data needed to produce basic results of simulated feasibility studies for three selected tungsten deposits in Uzbekistan. Geologic data for the three tungsten deposits were obtained from the Ministry of Mining Industry and Geology of Uzbekistan, and are based on information from geologic exploration studies undertaken between the 1980s and the 2000s (Gosudarstvennyi Komitet Respubliki Uzbekistan po geologii i mineral’nym resursam, undated a, b, c). Mining production parameters were obtained from published feasibility studies for more current but unrelated projects (Suárez Sánchez and others, 2015). As in actual feasibility studies, the two major results are the net present value of the project (NPV), and the number of years needed to recoup the capital investment (payback). NVP was calculated using the equation
whereNPV and the number of years needed to recoup the capital investment were calculated for a central scenario of the simulated feasibility study. For each production year t, CFt is calculated as the difference between the revenue (computed as the product of the expected output price and projected production quantity) and operating costs incurred in that year. Capital costs are assumed to be incurred before the start of production, in year 0.
For the simulations, key parameters were derived from data for the five tungsten projects outlined in table 2 (Suárez Sánchez and others, 2015) and 2024 market conditions. The discount rate for all simulations is assumed to be 8 percent, as in the majority of the five tungsten feasibility studies in table 2. The central estimate price of tungsten trioxide (WO3) per mtu of WO3 content is assumed to be $300 per mtu, which describes the market price as of January 2024 (Almonty Industries Inc., 2024). Prices used in the feasibility studies that Suárez Sánchez and others (2015) analyzed are somewhat higher, likely because of different price expectations in the middle of the 2010s. The history of tungsten trioxide prices shows high volatility, which makes investment in tungsten projects risky. For example, from 2001 to 2023, tungsten prices have ranged from a low of $49 per mtu to a high of $358 per mtu (fig. 2; Shedd, 2002, 2006, 2010, 2014, 2018, 2023, 2024).
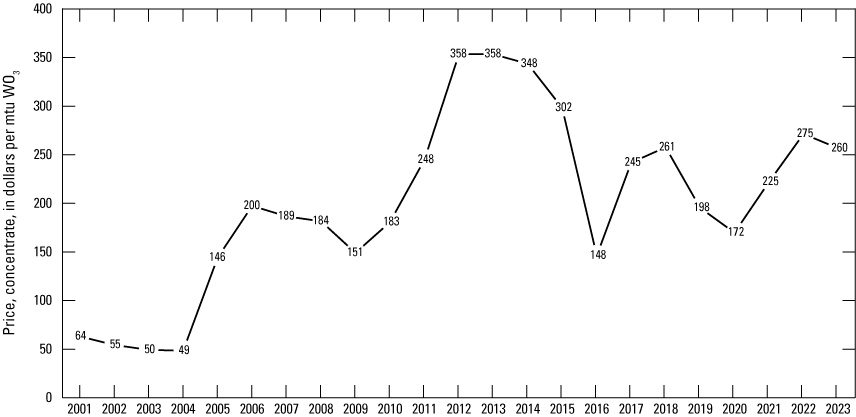
Graph showing the price of one metric ton unit (mtu) of tungsten trioxide (WO3) concentrate in U.S. dollars per year from 2001 to 2023. Sources: Shedd, 2002, 2006, 2010, 2014, 2018, 2023, 2024.
Geological data from the deposits were provided by the Ministry of Mining Industry and Geology of Uzbekistan (Gosudarstvennyi Komitet Respubliki Uzbekistan po geologii i mineral’nym resursam, undated a, b, c). The unpublished documents were provided by Yelena Golovko on August 24, 2022. We combined these geological data for the Koytash-Ugat, Sautbay, and Yakhton deposits and the synthetic economic assumptions based on the feasibility studies described in Suárez Sánchez and others, 2015, to create potential development scenarios for these deposits. In our simulations, gold prices appear to be a significant driver for the viability of the three tungsten projects in Uzbekistan. Uzbekistan ranks among the world leaders in gold production and has significant expertise in mining and processing gold ores (Safirova, 2023). In 2023, the price of gold was $1,900 per troy ounce (Sheaffer, 2024), but for all three projects, we used a conservative assumption for the price of gold ($50,000 per kg or $1,555 per troy ounce), and assumed that only 50 percent of gold content is recovered. We did not include other coproduct minerals mentioned in deposit descriptions, such as bismuth, copper, and silver, in our simplified simulations because they would not make a difference to the broad feasibility considerations.
Sensitivity analyses explored key uncertain parameters, such as the price of the main output (WO3 content), the unit operating cost of production, and the total capital cost investment required to implement the project. The results of the sensitivity analysis for each hypothetical project show the variability of the simulated outcomes of the mining projects as a function of assumptions about price and cost parameters. For each sensitivity analysis, two potential changes were considered. The first was an increase (or decrease) of the total capital costs of the project by 20 percent from the central estimate and the other was an increase (or decrease) of the tungsten output price by 20 percent. In this simple model, changes in unit operating costs are mirror images of changes in output prices and are not considered separately.
Analysis of Production Potential of Selected Tungsten Mineral Deposits in Uzbekistan
The Koytash-Ugat Mineral Deposit
The Koytash-Ugat mineral deposit is located in Jizzax Region, Uzbekistan. The larger Koytash mineral deposit is divided into sections, including the Central, Eastern, Koytash-Ugat, Shurkundy, and Ugat sections. The Koytash-Ugat mineral deposit is the western continuation of the Koytash mineral deposit, which was discovered in 1936 and further explored between 1982 and 1990. From 1941 to 1993, the Koytash tungsten mine and a processing plant were in operation. In 1994, production completely stopped due to losses both from new production and from sales of tungsten inventory. The larger Koytash mineral deposit is located in Northern Nuratau mountains on the southern slopes of the Koytash [Qo’ytosh] mountains (fig. 1; Gosudarstvennyi Komitet Respubliki Uzbekistan po geologii i mineral’nym resursam, undated a).
In terms of material composition, the ores in the Koytash-Ugat deposit are hosted in pyroxene and pyroxene-garnet skarns. The industrially valuable tungsten component of the ores is medium- and coarse-grained crystalline scheelite. The scheelite in this deposit is found in pyroxene interstices and in vein walls composed of quartz veinlets. Sheelite less often forms intergrowths with sulfides and feldspars, with crystals ranging in size from fractions of a millimeter (mm) to 2–3 mm, and sometimes up to 1–2 centimeters. The main ore minerals in the Koytash-Ugat deposit are arsenopyrite, bornite, chalcopyrite, galena, molybdenite, pyrrhotite, scheelite, and sphalerite. Nonmetallic minerals include amphiboles, calcite, chlorite, garnet, muscovite, potassium feldspars, pyroxene, quartz, sericite, and wollastonite (Gosudarstvennyi Komitet Respubliki Uzbekistan po geologii i mineral’nym resursam, undated a).
The tungsten resources of the Koytash-Ugat mineral deposit were estimated at 10,619 metric tons (t) of WO3 with an average ore content of 0.33 percent, and the section was considered to be ready for development. In addition to tungsten, reserves of gold grading 1.6 grams per metric ton (g/t), and also silver grading 7.2 g/t, and copper ore grading 0.44 percent were included. At 2024 world prices, however, the silver and copper reserves do not alter the development decision. The production plan was to produce 350 kt/yr of ore and to use flotation processing technology with a WO3 recovery rate of 74.4 percent. The construction projects would include an underground mine, a processing plant, and engineering infrastructure that together would require a capital cost investment of $75 million (table 3; Gosudarstvennyi Komitet Respubliki Uzbekistan po geologii i mineral’nym resursam, undated a).
Table 3.
Summary of data for the Koytash-Ugat mineral deposit, Jizzax Region, Uzbekistan.[Data from Gosudarstvennyi Komitet Respubliki Uzbekistan po geologii i mineral’nym resursam (undated a). Resources of WO3 in metric tons are as of Jan. 1, 2021. WO3, tungsten trioxide; kt, kiloton, g/t, grams per metric ton]
The simulation for developing the Koytash-Ugat mineral deposit assumes that, under central parameter assumptions, total operating costs consist of mining operating costs of $75 per mtu of WO3 and processing operating costs of $55 per mtu of WO3. The projected revenue from gold recovery at the mine exceeds the total unit operating cost, greatly helping the mine’s financial viability. The NPV of the project for the central parameter assumptions is $109.1 million, and the capital investment payback is 3 years, which is a relatively fast payback rate for a projected 9-year mine life (table 4).
Table 4.
Main financial assumptions and results for the Koytash-Ugat mineral deposit, Uzbekistan.[mtu, metric ton unit; 1 metric ton unit [mtu] of tungsten trioxide contains 7.93 kilograms [kg] of tungsten; WO3, tungsten trioxide; NPV, net present value]
Under sensitivity analysis modifications, with capital investment varying from $60 million to $90 million and the price per mtu of WO3 kept constant at $300, the payback period for the Koytash-Ugat deposit varies between 2.3 and 3.6 years, and when the tungsten product price varies between $240 per mtu and $360 per mtu and the cost of capital investment is kept constant at $75 million, the payback period varies between 2.5 and 3.7 years. Overall, when both the price per mtu of WO3 and the cost of capital investment are allowed to vary, the lowest NPV obtained under high capital cost and low product prices is $61.9 million, which corresponds to a payback period of 4.6 years (table 5).
Table 5.
Sensitivity analysis results for the Koytash-Ugat mineral deposit, Uzbekistan.[mtu, metric ton unit; 1 metric ton unit [mtu] of tungsten trioxide contains 7.93 kilograms [kg] of tungsten; WO3, tungsten trioxide; NPV, net present value in millions of U.S. dollars; payback; capital payback in years]
The Yakhton Mineral Deposit
The Yakhton mineral deposit is located in the Urgut district of the Samarqand [Samarkand] Region, 8 kilometers (km) south of the city of Urgut, and 50 km southeast of the Samarkand railway station. The connection of the Yakhton mineral deposit to the Samarkand railway station would run along dirt (10 km) and asphalt (40 km) roads in the axial part of the Chakyl-Kalyan ridge. The physical profile of the Yakhton mineral deposit area is mountainous and highly dissected, with absolute elevations from 1,300 to 2,400 meters. The deposit consists of two explored areas—northern and western. Tungsten mineralization is localized in skarn deposits that developed in the contact zone between the Yakhton granite massif and Silurian and Devonian carbonates. Tungsten is also found in other skarn deposits composed of metamorphosed limestones and intrusive rocks (Gosudarstvennyi Komitet Respubliki Uzbekistan po geologii i mineral’nym resursam, undated b).
In terms of material composition in the Yakhton deposit, ore bodies are hosted in garnet-pyroxene and pyroxene skarns (60 percent), limestone skarns (30 percent), and granodiorite skarns (10 percent). The main ore minerals in the Yakhton deposit are arsenopyrite, bornite, chalcocite, chalcopyrite, covellite, marcasite, molybdenite, pyrite, pyrrhotite, scheelite, and sphalerite, with scheelite being the primary tungsten-bearing ore mineral. Nonmetallic minerals in the ore consist of amphiboles, calcite, chlorite, epidote, feldspars, garnet, micas, and pyroxenes (Gosudarstvennyi Komitet Respubliki Uzbekistan po geologii i mineral’nym resursam, undated b).
The tungsten resources of the Yakhton deposit were estimated at 22,147 t of WO3 with an average ore content of 0.44 percent of WO3 per ton. In addition to tungsten, the reserves of gold grading 0.84 g/t were included in the annual costflow analysis. The production plan was to produce 250 kt/yr of ore with an average WO3 content in production of 0.41 percent. The project would use a combined production method—first open-pit and then underground mining—and a combined gravity-flotation processing technology with a WO3 recovery rate of 81.4 percent. The construction projects would include a mine, a processing plant, and engineering infrastructure that together would require a capital cost investment of $75 million (table 6; Gosudarstvennyi Komitet Respubliki Uzbekistan po geologii i mineral’nym resursam, undated b).
Table 6.
Summary of data for the Yakhton mineral deposit, Samarqand [Samarkand] Region, Uzbekistan.[Data from Gosudarstvennyi Komitet Respubliki Uzbekistan po geologii i mineral’nym resursam (undated b). WO3, tungsten trioxide; kt, kiloton, g/t, grams per metric ton]
The simulation of developing the Yakhton deposit assumed that, under central parameter assumptions, total operating costs consist of mining costs of $45 per mtu of WO3 and processing costs of $55 per mtu of WO3. The revenue from gold recovery at the mine amounts to $63 per mtu of WO3, which contributes significantly to the mine’s financial viability. The NPV of the project for the central parameter assumptions is $119.2 million and the capital investment payback is 4.2 years (table 7).
Table 7.
Main financial assumptions and results for the Yakhton mineral deposit, Uzbekistan.[mtu, metric ton unit; 1 metric ton unit [mtu] of tungsten trioxide contains 7.93 kilograms [kg] of tungsten; WO3, tungsten trioxide; NPV, net present value]
Under the sensitivity analysis modifications, with capital investment varying from $60 million to $90 million and keeping the price of tungsten at $300 per mtu of WO3, the payback period varies between 3.2 and 5.2 years. When the tungsten product price varies between $240 per mtu and $360 per mtu with the capital costs kept at $75 million, the payback period varies between 3.1 and 5.7 years. Overall, when both the cost of the capital investment and the price of tungsten are allowed to vary, the lowest NPV obtained under high capital cost and low product prices is $59.9 million, which corresponds to a payback period of 7.2 years (table 8).
Table 8.
Sensitivity analysis results for the Yakhton mineral deposit, Uzbekistan.[mtu, metric ton unit; 1 metric ton unit [mtu] of tungsten trioxide contains 7.93 kilograms [kg] of tungsten; WO3, tungsten trioxide; NPV, net present value in millions of U.S. dollars; payback; capital payback in years]
The Sautbay Mineral Deposit
In the Sautbay ore field, four closely located mineral deposits have been explored: the Sautbay, Burgut, Sagynkan and Promezhutochny deposits. These mineral deposits are located on the southwestern slopes of the Bukantau Mountains [Bo‘kantov Tog‘lari] in the Uchquduq district of the Navoiy Region, 17 km southeast of the village of Kokpatas [Qoqpatos]and 35 km northeast of the Uchkuduk [Uchquduq] railway station, which are connected by dirt roads. The terrain is hilly, with absolute elevations from 189 to 250 m. Tungsten mineralization is confined to skarns, skarnoids, amphibolites, and to a lesser extent, dolomites, hornfels, and quartzites that have been metamorphosed as skarns. A total of six ore bodies have been identified, and are hosted in sheetlike and lens-shaped deposits (Gosudarstvennyi Komitet Respubliki Uzbekistan po geologii i mineral’nym resursam, undated c).
The main industrially valuable mineral in the Sautbay mineral deposit is scheelite. The size of the scheelite grains in this deposit range from 0.002 to 1.5 mm, and the grains are found as xenomorphic phenocrysts, forming complex intergrowths with all ore minerals. The main ore minerals are arsenopyrite, chalcopyrite, hematite, magnetite, marcasite, pyrite, and pyrrhotite. Nonmetallic minerals are actinolite, carbonates, chlorite, feldspars, muscovite, pyroxene, quartz, and tremolite. There are three types of industrial ores—carbonate (marbles created by skarn metamorphism), carbonate-aluminosilicate, and ores in granitoids, volcanics, and dikes that have been metamorphosed by skarn processes (Gosudarstvennyi Komitet Respubliki Uzbekistan po geologii i mineral’nym resursam, undated c).
The resources of the Sautbay mineral deposit were estimated at 24,923 t of WO3 with an average WO3 content of 0.49 percent. In addition to tungsten, the reserves of gold grading 1.3 g/t were included, other coproduct components were copper, bismuth, and silver. The production plan was to produce 300 kt/yr of ore with average WO3 content in production of 0.431 percent. The project would use an open-pit production method and a combined gravity-flotation processing technology with a WO3 recovery rate of 80 percent. The construction projects would include a processing plant and engineering infrastructure that together would require a capital cost investment of $145 million (table 9; Gosudarstvennyi Komitet Respubliki Uzbekistan po geologii i mineral’nym resursam, undated c).
Table 9.
Summary of data for the Sautbay mineral deposit, Navoiy Region, Uzbekistan.[Data from Gosudarstvennyi Komitet Respubliki Uzbekistan po geologii i mineral’nym resursam (undated c). WO3, tungsten trioxide; kt, kiloton, g/t, grams per metric ton]
The simulation of developing the Sautbay mineral deposit has a significantly larger capital cost ($145 million) than the other two mineral deposits examined in this report and would constitute a greater financial burden for a mining company. We also assumed that, under central parameter assumptions, operating costs were mining costs of $40 per mtu of WO3 and processing costs of $80 per mtu of WO3. The revenue from gold recovery at the mine amounts to $94 per mtu of WO3, which contributes significantly to the financial viability of the mine. The NPV of the project for the central parameter assumptions is $97.6 million, and the capital investment payback is 6.8 years (table 10).
Table 10.
Main financial assumptions and results for the Sautbay mineral deposit, Uzbekistan.[mtu, metric ton unit; 1 metric ton unit [mtu] of tungsten trioxide contains 7.93 kilograms [kg] of tungsten; WO3, tungsten trioxide; --, zero; NPV, net present value]
Under the sensitivity analysis modifications, with capital investment varying from $116 million to $174 million and the price per mtu of WO3 kept constant at $300, the payback period varies between 5.2 and 8.8 years, and when the tungsten product price varies between $240 per mtu and $360 per mtu and the cost of capital investment is kept constant at $145 million,, the payback period varies between 5.3 and 9.7 years. Overall, the lowest NPV obtained under high capital cost and low product prices is $15.5 million, which corresponds to the payback period of 12.9 years. The payback results may be low for the scale of the project, and may indicate a lack of financial strength (table 11).
Table 11.
Sensitivity analysis results for the Sautbay mineral deposit, Uzbekistan.[mtu, metric ton unit; 1 metric ton unit [mtu] of tungsten trioxide contains 7.93 kilograms [kg] of tungsten; WO3, tungsten trioxide; NPV, net present value in millions of U.S. dollars; payback; capital payback in years]
The Price of Gold
Because the price of gold appears to be an important driver of the profitability for these hypothetical projects, we conducted a sensitivity analysis with respect to the price of gold. The methodology of the sensitivity analysis is the same as the methodology employed with respect to other costs and prices. Specifically, the price of gold was assumed to be $40,000 per kg for a low-price scenario and $60,000 per kg for a high-price scenario. Under the low-price scenario, NPV is reduced by 16.2 percent for the Koytash-Ugat deposit, by 8.1 percent for the Yakhton deposit, and by 17.2 percent for the Sautbay deposit. Under the high-price scenario, increases in NPV were 16.2 percent for the Koytash-Ugat deposit, 7.5 percent for the Yakhton deposit, and 17.2 percent for the Sautbay deposit (table 12).
Tungsten Production Implications
The hypothetical scenarios considered in this study suggest that, if developed, the Koytash-Ugat, the Yakhton, and the Sautbay mineral deposits in Uzbekistan could produce a total of about 36,600 t of tungsten trioxide over the lifetime of the respective mines. If in operation simultaneously, the three mines could produce about 2,163 t per year of tungsten, which would constitute about 2.6 percent of the annual world production making Uzbekistan the third-ranked producer of tungsten in the world (table 13). In addition, new tungsten production in Uzbekistan could contribute to the reduction of tungsten criticality by decreasing the production concentration of tungsten.
Potential Implications of Tungsten Deposit Development in Uzbekistan for Critical Mineral Supply
The methodology developed for determining whether a specific mineral should be considered as critical evaluates three essential components of risk—disruption potential, trade exposure, and economic vulnerability (Nassar and others, 2020; Nassar and Fortier, 2021). In the USGS critical mineral model, which was used to produce the critical mineral list of 2022 (U.S. Geological Survey, 2022), trade exposure and economic vulnerability reflect U.S. import reliance and U.S. manufacturers’ ability to withstand hardship related to supply disruption, and are outside of the scope of this study.
Disruption potential is computed as a linear combination of the elements of the Herfindahl-Hirschman Index (HHI), and it is weighted to indicate country-specific willingness and ability to supply specific commodities. An unweighted HHI is used to assess industry concentration—in particular, it is commonly used by the U.S. Department of Justice to evaluate the effect of horizontal mergers and acquisitions (U.S. Department of Justice and the Federal Trade Commission, 2023). The unweighted HHI is calculated as the sum of squared market shares (measured as a percentage) of market participants. Low concentration of an industry is associated with an unweighted HHI below 1,500; moderate concentration of an industry is associated with an HHI between 1,500 and 2,500; and an HHI above 2,500 is considered to be a sign of a highly concentrated industry. In the case of a complete monopoly, a single supplier capturing 100 percent of the market results in an HHI of 10,000 (U.S. Department of Justice and the Federal Trade Commission, 2023, p. 5–6).
Based on the 2022 world tungsten production data (table 1), the unweighted HHI is 6,890 and reflects China’s dominance in tungsten production. Under the hypothetical scenario described in this paper, where three tungsten deposits in Uzbekistan are developed and produce 2,163 tons per year of tungsten, the unweighted HHI would decrease to 6,539, or by 351 points. Although world tungsten mining would still remain highly concentrated, development of the three deposits in Uzbekistan could reduce the degree of tungsten industry concentration and reduce its disruption potential.
Discussion
One way to decrease the level of criticality for a critical mineral is to diversify where that mineral is mined. An obstacle to decreasing the level of criticality for a critical mineral is the availability of quality mineral resources that are economical to produce. In this report, we examined data from three tungsten deposits in Uzbekistan and considered whether these deposits could be developed in the near future (in the next 3 to 5 years). Using synthetic simulation analyses, we have shown that under certain assumptions, these tungsten deposits may be successfully developed and could increase world production of tungsten by 2.7 percent.
There are several important caveats with this study. Because of the nature of these analyses, the rate of uncertainty of the parameters is relatively high. In addition, the results appear to depend on the price of tungsten, which can be volatile, and on the coproduction of other high-value mineral resources, such as gold, that may make marginally economic projects more robust. More publicly accessible feasibility studies could make the modeling of the development of mineral resources, including critical minerals, more transparent for researchers, investors, and the public. The current study focuses on the mining stage only and assumes that the product at this stage is the tungsten trioxide concentrate. Complete evaluation of tungsten production would entail considerations such as whether the mined tungsten product is sent to another country for further processing and how the cost and logistics of the metallurgical processing would affect the profitability of the complete production process.
References Cited
Almonty Industries Inc, 2024, Demand and pricing: Almonty Industries Inc. web page, accessed February 16, 2024, at https://almonty.com/tungsten/demand-pricing/.
Department of the Interior, 2018, Final list of critical minerals 2018: Federal Register, May 18, accessed January 24, 2025, at https://www.federalregister.gov/documents/2018/05/18/2018-10667/final-list-of-critical-minerals-2018
McCullough, E., and Nassar, N.T., 2017, Assessment of critical minerals—Updated application of an early-warning screening methodology: Mineral Economics, v. 30, no. 3, p. 257–272. [Also available at https://doi.org/10.1007/s13563-017-0119-6.]
Nassar, N.T., Brainard, J., Gulley, A., Manley, R., Matos, G., Lederer, G., Bird, L.R., Pineault, D., Alonso, E., Gambogi, J., and Fortier, S.M., 2020, Evaluating the mineral commodity supply risk of the U.S. manufacturing sector: Science Advances, v. 6, no. 8, eaay8647, accessed August 9, 2024, at https://doi.org/10.1126/sciadv.aay8647.
Nassar, N.T., and Fortier, S.M., 2021, Methodology and technical input for the 2021 review and revision of the U.S. Critical Minerals List: U.S. Geological Survey Open-File Report 2021-1045, 31 p., accessed August 9, 2024, at https://doi.org/10.3133/ofr20211045.
Safirova, E., 2023, The mineral industry of Uzbekistan [advance release], in Area reports—International—Europe and Central Eurasia: U.S. Geological Survey Minerals Yearbook 2020–21, v. III, p. 50.1–50.10, accessed June 12, 2025, at https://pubs.usgs.gov/myb/vol3/2022/myb3-2022-uzbekistan.pdf.
Suárez Sánchez, A., Krzemień, A., Riesgo Fernández, P., Iglesias Rodríguez, F.J., Sánchez Lasheras, F., and de Cos Juez, F.J., 2015, Investment in new tungsten mining projects: Resources Policy, v. 46, no. 3, p. 177–190. [Also available at https://doi.org/10.1016/j.resourpol.2015.10.003.]
Sheaffer, K.N., 2024, Gold: U.S. Geological Survey Mineral Commodity Summaries 2024, p. 82–83. [Also available at https://doi.org/10.3133/mcs2024.]
Shedd, K.B., 2002, Tungsten: U.S. Geological Survey Mineral Commodity Summaries, 2002, p. 180–181. [Also available at https://doi.org/10.3133/mineral2002.]
Shedd, K.B., 2006, Tungsten: U.S. Geological Survey Mineral Commodity Summaries, 2006, p. 182–183. [Also available at https://doi.org/10.3133/mineral2006.]
Shedd, K.B., 2010, Tungsten: U.S. Geological Survey Mineral Commodity Summaries, 2010, p. 176–177. [Also available at https://doi.org/10.3133/mineral2010.]
Shedd, K.B., 2014, Tungsten: U.S. Geological Survey Mineral Commodity Summaries, 2014, p. 174–175. [Also available at https://apps.usgs.gov/minerals-information-archives/mcs/mcs2014.pdf.]
Shedd, K.B., 2018, Tungsten: U.S. Geological Survey Mineral Commodity Summaries, 2018, p. 178–179. [Also available at https://apps.usgs.gov/minerals-information-archives/mcs/mcs2018.pdf.]
Shedd, K.B., 2023, Tungsten: U.S. Geological Survey Mineral Commodity Summaries, 2023, p. 180–181. [Also available at https://doi.org/10.3133/mcs2023.]
Shedd, K.B., 2024, Tungsten: U.S. Geological Survey Mineral Commodity Summaries, 2024, p. 180–181. [Also available at https://doi.org/10.3133/mcs2024.]
U.S. Department of Justice and the Federal Trade Commission, 2023, Merger guidelines: U.S. Department of Justice, 50 p., accessed June 4, 2025, at https://www.justice.gov/d9/2023-12/2023%20Merger%20Guidelines.pdf.
U.S. Geological Survey, 2022, 2022 Final list of critical minerals: Federal Register, v. 87, no. 37, p. 10381–10382, accessed December 13, 2023, at https://www.federalregister.gov/documents/2022/02/24/2022-04027/2022-final-list-of-critical-minerals.
Conversion Factors
International System of Units to U.S. customary units
Disclaimers
Any use of trade, firm, or product names is for descriptive purposes only and does not imply endorsement by the U.S. Government.
Although this information product, for the most part, is in the public domain, it also may contain copyrighted materials as noted in the text. Permission to reproduce copyrighted items must be secured from the copyright owner.
Suggested Citation
Safirova, E., Golovko, Y., and Dulabova, N., 2025, Analysis of the potential effects of Uzbekistan’s mineral endowment on the critical mineral supply of tungsten: U.S. Geological Survey Open-File Report 1032, 14 p., https://doi.org/10.3133/ofr20251032.
ISSN: 2331-1258 (online)
Study Area
| Publication type | Report |
|---|---|
| Publication Subtype | USGS Numbered Series |
| Title | Analysis of the potential effects of Uzbekistan’s mineral endowment on the critical mineral supply of tungsten |
| Series title | Open-File Report |
| Series number | 2025-1032 |
| DOI | 10.3133/ofr20251032 |
| Publication Date | June 30, 2025 |
| Year Published | 2025 |
| Language | English |
| Publisher | U.S. Geological Survey |
| Publisher location | Reston, VA |
| Contributing office(s) | National Minerals Information Center |
| Description | v, 14 p. |
| Country | Uzbekistan |
| Online Only (Y/N) | Y |
| Additional Online Files (Y/N) | N |