

Decision-Support Modeling and Research Priorities for Establishing Baseline Conditions for Outstandingly Remarkable Values, Obed Wild and Scenic River, Tennessee
Links
- Document: Report (1.35 MB pdf) , HTML , XML
- Download citation as: RIS | Dublin Core
Acknowledgments
Thank you to National Park Service Wild and Scenic River staff for their input and support. Thank you to Jeff Hughes and Emma Buckley of the National Park Service for their assistance and input to the report.
Abstract
The Obed River is the last undammed river in Tennessee. The Obed Wild and Scenic River is managed by the National Park Service and covers a protected area of the Obed River headwaters (including four contributing tributaries). The Obed Wild and Scenic River supports a unique ecosystem with eight federally listed species. The National Park Service is responsible for preserving the baseline free-flowing condition of the river and associated outstandingly remarkable values (ORVs). Previous studies have been mostly project-based with differing methods, thus complicating efforts to quantify long-term changes in environmental conditions. This report presents a science plan summarizing (1) ORV conditions, (2) recent results of a decision-support hydrologic model for OBRI, and (3) possible future research priorities. The decision-support model was created to model streamflow conditions and changes in the ORVs since park establishment in 1976 and during three additional time periods. Established baseline conditions could help with management of ORVs not dependent on streamflow.
Introduction
The Obed Wild and Scenic River (OBRI) is in the upper Tennessee River Basin and is the only federally designated Wild and Scenic River in Tennessee. As part of an effort to establish baseline conditions in the OBRI, the U.S. Geological Survey (USGS) and the National Park Service (NPS) worked together to summarize previous work done in the OBRI, update and evaluate hydrologic model results, and identify gaps in knowledge. NPS staff provided minimum flow requirements for recreational activities and the report outlining the results of a decision-support model (Hazen and Sawyer, 2021). The USGS provided literature review of previous work in the OBRI, evaluation of decision-support model outputs, and the gap analysis.
The OBRI is located within the Appalachian Plateaus Physiographic Province and encompasses 5,056 acres (Fenneman and Johnson, 1946; Thornberry-Ehrlich, 2009). This region is known for biological diversity, hydrologic importance, and climate resiliency (Open Space Institute, 2018). In the Wild and Scenic Rivers Act of 1968 (16 U.S.C. § 1271–1287; U.S. Congress, 1968), the geographic extent (fig. 1) of the OBRI is defined as the
[river] segment from the western edge of the Catoosa Wildlife Management Area to the confluence with the Emory River; Clear Creek from the Morgan County line to the confluence with the Obed River, Daddys Creek from the Morgan County line to the confluence with the Obed River; and the Emory River from the confluence with the Obed River to the Nemo bridge.
it is […] the policy of the United States that certain selected rivers of the Nation which, with their immediate environments, possess outstandingly remarkable scenic, recreational, geologic, fish and wildlife, historic, cultural or other similar values, shall be preserved in free-flowing condition, and that they and their immediate environments shall be protected for the benefit and enjoyment of present and future generations.
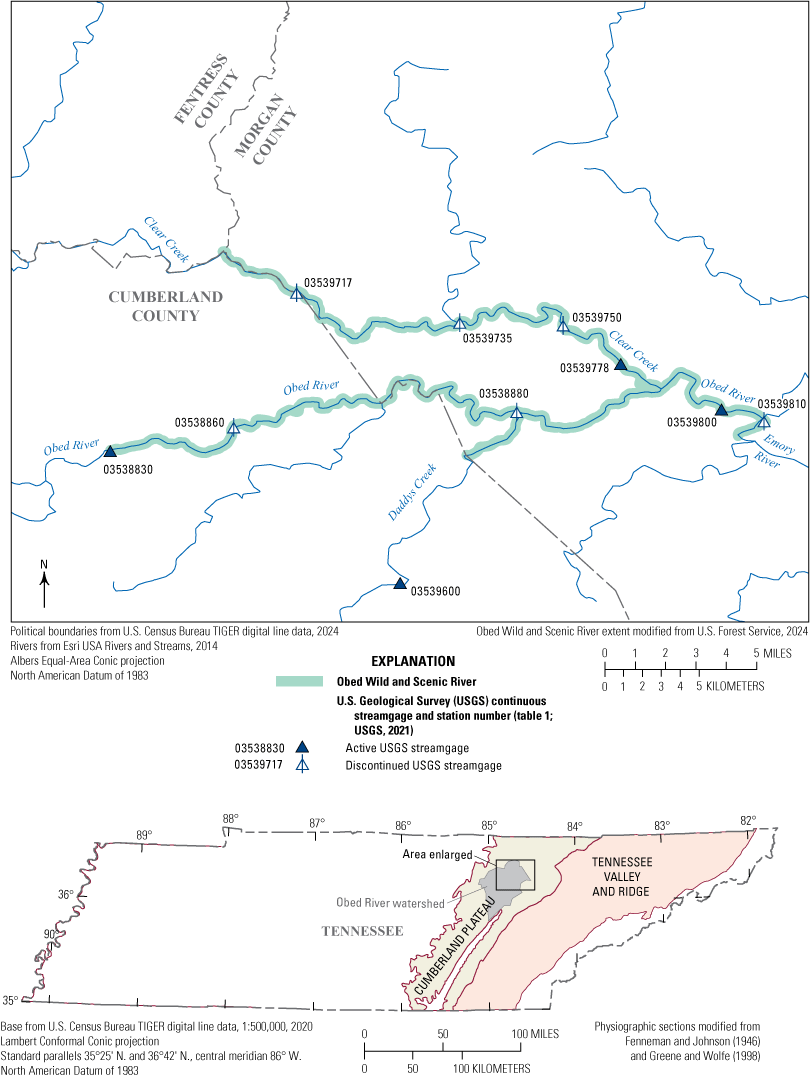
Active and discontinued U.S. Geological Survey streamgages near or within the Obed Wild and Scenic River, Tennessee.
The OBRI supports nationally significant biota, including two federally threatened fish (spotfin chub [Erimonax monachus] and sickle darter [Percina williamsi]), two federally endangered freshwater mussels (purple bean [Villosa perpurpurea] and Alabama lampmussel [Lampsilis virescens]), three federally endangered bats (gray bat [Myotis grisescens], Indiana bat [Myotis sodalis], and northern long-eared bat [Myotis septentrionalis]), and three federally threatened plants (Virginia spiraea [Spiraea virginiana], Cumberland rosemary [Conradina verticillata], and white fringeless orchid [Platanthera integrilabia]) (U.S. Fish and Wildlife Service, 2025). Within the OBRI, 1.1 river miles of the Emory River is critical habitat for the sickle darter (U.S. Fish and Wildlife Service, 2023), 25 miles of the Obed River is critical habitat for the purple bean mussel (U.S. Fish and Wildlife Service, 2004), and the entire park is critical habitat for the spotfin chub (U.S. Fish and Wildlife Service, 2005). Steep gorges and frequent flashy floods create unique hydrologic and geomorphic conditions with distinctly evolved ecology. The seasonally flooded alluvial bars of the OBRI are the basis of a unique ecosystem with a disproportionately large number of rare, threatened, and endangered plants (Wolfe and others, 2007). Also referred to as cobble or gravel bars, these distinct communities support rare plants such as the Cumberland sandreed (Calamovilfa arcuata), shortleaf sneezeweed (Helenium brevifolium), pineywoods dropseed (Sporobolus junceus), and the previously mentioned Cumberland rosemary (Conradina verticillata). Specific hydrologic conditions, such as short scouring floods, are needed to maintain the alluvial bar geomorphology.
To be eligible for inclusion into the National Wild and Scenic Rivers System, a river must be a free-flowing stream with related adjacent land area possessing one or more outstandingly remarkable scenic, recreational, geologic, fish and wildlife, historic, cultural, or other similar values (16 U.S.C. § 1271–1287; U.S. Congress, 1968). To date, the following ORVs have been identified for the OBRI: aesthetic, recreational, cultural, ecological/vegetation, geologic, and fish and wildlife (NPS, 2015). Maintaining free-flowing conditions and pristine water quality are necessary foundations for all ORVs.
Problem
The NPS mission is to preserve the unimpaired natural and cultural resources and values of the OBRI for the enjoyment, education, and inspiration of this and future generations (NPS, 2015). Consistent data collection across space and time in the OBRI is critical to this mission. Previous studies in the OBRI are mostly project-based and conducted at intermittent time intervals, with project-specific objectives and differing methods. Management of the ORVs is difficult without long-term data collected at regular intervals using the same method to monitor changes over time in environmental conditions. Defined baseline ORV conditions in the OBRI are also critical to the mission. NPS is responsible for managing the OBRI to maintain or improve ORV conditions from OBRI establishment (Thornberry-Ehrlich, 2009). According to the Interagency Guidelines from the Technical Report of the Interagency Wild and Scenic Rivers Coordinating Council (2002, p. 22), “to achieve a nondegradation standard, the river-administering agency must document baseline resource conditions and monitor changes to these conditions.” As part of the Wild and Scenic Rivers Act, managing the OBRI includes conducting impact analyses to ensure proposed projects would not have a, “direct and adverse effect on the values for which [the] river was established” or, “invade the area or unreasonably diminish the scenic, recreational, and fish and wildlife values present in the area on the date of designation of river as part of the National Wild and Scenic Rivers System.” Completion of an impact analysis, as directed by Section 7 of the Wild and Scenic Rivers Act, must be done in a timely fashion to address permitting requirements. Without established ORV baselines, there is no method for quantifying the potential effects of proposed projects.
Purpose and Scope
The purpose of this report is to present a science plan summarizing (1) ORV conditions, (2) recent results of a decision-support hydrologic model for OBRI, and (3) possible future research priorities. Research priorities were identified by evaluating historical studies, current and continuous studies, and the most recent results of the park-specific decision-support OASIS model (Hazen and Sawyer, 2021). This science plan contains three parts: (1) background summary of previous work related to the OBRI ORVs and current conditions, (2) analysis and interpretation of recent hydrologic modeling results estimating baseline hydrologic conditions, and (3) presentation of potential research to accomplish future NPS goals to protect the OBRI ORVs. The OASIS model is a flow-accounting model; therefore, detailed discussion is focused on ORVs that can be quantified using streamflow thresholds. The principal focuses of this report, as directed by the NPS, are the recreation and fish and wildlife ORVs. The free-flowing condition and water quality, which support the OBRI ORVs, are also examined.
Part I: Background—Summary of Previous Conditions and ORV-Relevant Data Collected Since OBRI Establishment
Research in and around the OBRI started in the 1890s and continues today. The NPS Integrated Resource Management Applications (IRMA) database (https://irma.nps.gov/DataStore/) has more than 200 products with study areas in the OBRI area. Baseline inventories of 12 core areas are administered by the NPS National Inventory and Monitoring Division: geologic resources, vegetation mapping, natural resources bibliography, water body location and classification, baseline water quality information, species lists, species occurrence and distribution, climate, base cartography, air quality data, air quality related values, and soil resources (NPS, 2021b). Additionally, the USGS is studying Integrated Water Science basins to address critical challenges to the Nation’s water supply, infrastructure, and aquatic ecosystems (Miller and others, 2021). As part of this project, the USGS plans to intensively study at least 10 Integrated Water Science basins across the United States. Selected basins will be representative of broad geographic areas as well as an array of currently known threats to the Nation’s water supply. The upper Tennessee River Basin has been selected by Van Metre and others (2020) as one of the top 36 basins for inclusion into the national Integrated Water Science basins project. According to Van Metre and others (2020), the “data collected in the priority basins, combined with enhancements of existing USGS monitoring networks across the country and external (to USGS) data, should facilitate the knowledge transfer needed to inform modeling and decision making at multiple scales across the USA,” based on long-term USGS objectives. Previous and current streamflow monitoring includes four active and six discontinued USGS streamgages (table 1). NPS staff regularly perform vegetative, ecological, and hydrologic monitoring. NPS staff also monitor freshwater mussels and rare plant communities annually (i.e., cobble bar monitoring).
Table 1.
Active and discontinued U.S. Geological Survey streamgages near or within the Obed Wild and Scenic River, Tennessee.[Site information is from U.S. Geological Survey (2021). mi2, square mile]
| Station number (fig. 1) |
Station name | Latitude (decimal degrees) | Longitude (decimal degrees) | Drainage area (mi2) | Period of record |
|---|---|---|---|---|---|
| 035388301 | Obed River at Adams Bridge near Crossville, TN | 36.06166667 | −84.96138889 | 92 | 2010–present |
| 035396001 | Daddys Creek near Hebbertsburg, TN | 35.99766528 | −84.82249460 | 139 | 1957–present |
| 03539778 | Clear Creek at Lilly Bridge near Lancing, TN | 36.10312930 | −84.71827710 | 170 | 1997–present |
| 035398001 | Obed River near Lancing, TN | 36.08149370 | −84.67031130 | 518 | 1957–present |
| 03538860 | Obed River at Potter Ford near Crossville, TN | 36.07284768 | −84.90272940 | 107 | 1996–2017 |
| 03538880 | Obed River above Daddy's Creek near Hebbertsburg, TN | 36.08035040 | −84.76772320 | 156 | 1943–55 |
| 03539717 | Clear Creek at Norris Ford near Jones Knob | 36.13701539 | −84.87272820 | 81 | 1996–99 |
| 03539735 | Clear Creek at Barnett Bridge near Deer Lodge, TN | 36.12285027 | −84.79494700 | 146 | 1996–99 |
| 03539750 | Clear Creek near Lancing, TN | 36.12168739 | −84.74572270 | 153 | 1966–68 |
| 03539810 | Obed River near Wartburg, TN | 36.07590790 | −84.64994110 | 520 | 1939, 2015–17 |
The foundation document for the OBRI (NPS, 2015) is an extensive resource that provides direction for subsequent OBRI planning documents. It includes a brief description of the OBRI and its purpose, significance, fundamental resources and values, interpretive themes, and special mandates. The document also has a planning-focused component: assessment of planning and data needs to identify related issues, list of planning products, the associated studies and data required for OBRI planning, description of focus for OBRI planning activities, and establishment of a baseline from which planning documents are developed.
As part of the Natural Resource Report Series, the NPS published an extensive 352-page Natural Resource Condition Assessment for the OBRI in 2017, “characterizing the current conditions of important park natural resources through a spatially explicit, multi-disciplinary synthesis of existing scientific data and knowledge” (Benck and others, 2017, p. xxv) with the purpose of evaluating and reporting important OBRI resources (not limited to ORVs), evaluating critical data gaps, and presenting existing and future threats to the OBRI resources.
ORV Background
In 1976, a study was completed to determine if the OBRI was eligible for inclusion in the National Wild and Scenic Rivers System. The findings of that study were presented by a joint Federal-State task force. Specifically, “[t]he Obed River Task Force found that 34 miles of the Obed River, 29.5 miles of Clear Creek, and 34.5 miles of Daddys Creek—a total of 100 miles—possess outstandingly remarkable scenic, recreational, geological, and fish and wildlife values and qualify for inclusion in the National Wild and Scenic Rivers System” (Bureau of Outdoor Recreation, 1976, p. 58). NPS (2015) references an earlier study in which the OBRI ORVs were expanded to include aesthetic, cultural, and ecological/vegetation values. NPS (2015, p. 36) also states,
Because free-flowing condition and water quality support the integrity of the river’s outstandingly remarkable values and are key components of future planning and management, they are included as part of [the OBRI Foundation Document].
Section 1(b) of the Wild and Scenic Rivers Act also discusses the relations among the OBRI ORVs, free-flowing condition, and water quality. The Interagency Wild and Scenic Rivers Coordinating Council (2004) also refers to this section when defining the values that enable a river to be designated as a wild and scenic river or congressionally authorized for study.
Free-Flowing Condition of the OBRI
Under the Wild and Scenic Rivers Act, the NPS is tasked with protecting the free-flowing condition, the water quality conditions, and the ORVs for the ORBI. The free-flowing condition of the OBRI is integral for maintaining acceptable water quality conditions, as well as four ORVs: recreation, fish and wildlife, scenic, and geologic. The first intensive hydrologic analyses of the Obed River were conducted by the U.S. Army Corps of Engineers in the 1930s (U.S. Army Corps of Engineers, 1930), followed by general waterway surveys by the Tennessee Valley Authority 1954 and 1970 (Knight and others, 2014b). Knight and others (2014b) assembled historical datasets and collected hydrologic data for the Obed River and its tributaries to support an assessment of the hydrologic effects of human activities in the basin. The report presents the historical and contemporary (at the time) characteristics of streamflow and precipitation, as well as findings of hydrologic studies conducted in the OBRI from 1999 through 2005. The unaltered magnitude, frequency, duration, and timing of streamflows are governing factors for the ORVs, as well as for water quality conditions.
Water Quality Conditions of the OBRI
As established in Sections 1(b), 10(a), and 12(c) of the Wild and Scenic Rivers Act, the NPS is tasked with protecting and improving OBRI water quality conditions, a core principle of the National Wild and Scenic Rivers System. Daddys Creek, Clear Creek, and the Emory River are listed as Exceptional Tennessee Waters by the Tennessee Department of Environment and Conservation (TDEC), and all segments of these streams within the OBRI boundary are classified as such (TDEC, 2024). The Antidegradation Statement (section 6) in TDEC (2019, p. 36) designates the part of the Obed River within NPS boundaries as an Outstanding National Resource Water
provided however, that if the current search for a regional water supply by the Cumberland Plateau Regional Water Authority results in a determination that it is necessary to utilize the Obed River as its source of drinking water, for that purpose the Obed shall be designated as an Exceptional Tennessee Water and any permit issued for that project, whether state, federal, or otherwise, shall be considered under the requirements for Exceptional Tennessee Waters.
Threats to the OBRI water quality conditions include effects of previous drilling and mining activities, recreational activities, and nearby suburban development (NPS, 2015; Hughes and others, 2018b). Abandoned coal mines continue to severely affect surface-water and groundwater quality by leaching heavy metals into the water (NPS, 2012b). As of 2012, seven oil and gas wells (two of which are plugged and abandoned) were located within the OBRI boundary (NPS, 2012b). Oil and gas wells within the watershed increase the risk for water quality contamination, exemplified by a well blowout on July 19, 2002, that leaked hydrocarbons into the river (NPS, 2012b). Human activity, including logging of adjacent forests, agricultural activity, overuse of OBRI facilities, and illegal ATV use, contributes to soil erosion, sedimentation, and degradation of river water quality. Population growth in the area is associated with increases in water use, wastewater discharge, and impoundments related to recreation and water supply; these issues are “key management concerns” (NPS, 2012a, p. 13). Urban development in the watershed contributes to factors potentially detrimental to water quality: deforestation, effects of seepage from septic tanks and drain fields, and increased runoff from impermeable surfaces (such as roads, driveways, house roofs, and parking lots) (Benck and others, 2017; Hughes and others, 2018b). Furthermore, additional development and increased population could contribute to added pressure on wastewater treatment plants, where treated effluent currently constitutes an estimated 10 to 40 percent of observed streamflow of the Obed River near Lancing, TN (USGS station 03539800; USGS, 2021) during periods of low flow (Knight and others, 2014b). Most of the Obed River from near Crossville, Tenn., to the confluence of Daddys Creek within OBRI boundaries is listed as 303(d) impaired waters for exceeding State standards of total nitrogen, total phosphorus, and E. coli (TDEC, 2022).
A baseline water quality data inventory and analysis was conducted in 1999, during which surface-water-quality data retrievals from multiple U.S. Environmental Protection Agency (EPA) databases collected from 1964 through 1998 were examined for data associated with the OBRI (National Park Service, Water Resource Division [NPSWRD], 1999). The results indicated that 13 parameter groups (NPSWRD, 1999) exceeded criteria at least once within the study area. This included exceedances of the EPA criteria for freshwater aquatic life for dissolved oxygen, fecal-indicator bacteria, turbidity, pH, cadmium, copper, silver, and zinc. The EPA drinking water criteria was exceeded at least once for sulfate, cadmium, chromium, and lead (NPSWRD, 1999).
Beginning around 2013, the NPS Appalachian Highlands Inventory and Monitoring Network implemented two comprehensive water quality monitoring protocols for continuous and discrete water quality monitoring at key locations. Continuous water quality monitoring, co-located with three USGS streamgages (Obed River at Adams Bridge near Crossville, TN [03538830], Daddys Creek near Hebbertsburg, TN [03539600], and Clear Creek at Lilly Bridge near Lancing, TN [03539778]; table 1) provides high-frequency data at half-hour intervals for water temperature, pH, conductance, dissolved oxygen, and turbidity (Hughes and others, 2018a). Discrete water quality monitoring is conducted at more than 15 sites, where water is sampled 3 times a year and analyzed for more than 25 parameters, including bacteria, nutrients, and metals (Hughes and others, 2018b). The data are obtained to identify changes and long-term trends in conditions, with the overall objective of aiding OBRI managers in making informed decisions to protect and improve water quality conditions. Concurrent with free-flowing conditions, water quality has implications for many of the OBRI ORVs.
Recreational Value of the OBRI
Composed of steep geologic formations shaped by the free-flowing creeks and rivers, the natural landscape and water conditions of the OBRI make it popular for recreational uses (NPS, 2012a). Gorges up to 500 feet deep are attractive to rock climbers, whitewater boaters, swimmers, fishers, and hikers (Sims and Hodges, 2004). In 2003, the Emory-Obed Forum was established to discuss resource-based recreation as a means of economic development in Morgan County (Sims and others, 2004). The forum consists of, “a diverse group of residents, business owners, local politicians, and elected officials as well as representatives from the … NPS and the National Parks and Conservation Association” (Sims and others, 2004, p. 94). The Emory-Obed Forum identified four components foundational to bringing more tourism to the area. One of the four, “healthy natural resources” is within OBRI purview and was identified as the most important component (Sims and others, 2004, p. 94). In 2017, the OBRI was designated an International Dark Sky Park allowing visitors to experience one of a few places left in the country with little to no nighttime light pollution (DarkSky International, 2017).
Ecological/Vegetation and Fish and Wildlife ORVs of the OBRI
The upper Tennessee River Basin is one of the most biodiverse watersheds in the United States. The first descriptions of the unique fish and wildlife in the OBRI were presented in the OBRI study report in 1976 (Bureau of Outdoor Recreation, 1976). The midstream cobble bars and outwash areas are unique habitats that support threatened and endangered species. According to Thornberry-Ehrlich (2009), only 500 acres of this habitat remains in Kentucky and Tennessee. Cobble bar communities require regular floods to maintain the unique ecological communities (Wolfe and others, 2007). The scouring floods typical of the OBRI natural flow regime remove woody plant species which are not adapted to disturbance and could outcompete rare plants like Cumberland rosemary and Virginia spiraea (NPS, 2018). Schmalzer and others (1980) and Schmalzer (1982) provided a detailed analysis of vegetation patterns and vegetation-environmental relations of the Obed River gorge system. In the IRMA database (https://irma.nps.gov/DataStore/), 14 research priorities are focused on researching and analyzing ecology of the OBRI.
Geologic, Cultural, and Scenic/Aesthetic Values of the OBRI
The geology of the OBRI was the first ORV to be extensively studied. The geology of the OBRI is dominated by siliclastic strata, consisting of thick sandstone units interbedded with shales and siltstones. The earliest reference to the geology is in the Geology of Tennessee report (Safford, 1869). In 1894, Hayes published the Kingston Folio which included the first map of the area south of the OBRI that includes the headwaters of Daddys Creek (Hayes, 1894). The Wartburg Folio (Keith, 1897) mapped the topographic, geographic, geologic, and mineral resources of the area. In the 1950s, Stearns (1954) described the geology of the Cumberland Plateau and Crab Orchard Mountains. Further geologic studies include reports and maps by Luther (1959), Johnson and Luther (1972), Wilson (1965), and Wilson and others (1956). The Geologic Resources Inventory Program (GRIP) for the OBRI (NPS, GRIP, 2015) has a full accounting of the geologic resources. As of 2024, an unpublished digital bedrock geologic map of the OBRI and GIS layers and tables of the vicinity are available to the public at https://catalog.data.gov/dataset/unpublished-digital-bedrock-geologic-map-of-obed-wild-and-scenic-river-and-vicinity-tennes.
The OBRI also has significant cultural and archeological resources. More than 10,000 years of human occupation, including flint chips and arrowheads, have been documented (Thornberry-Ehrlich, 2009). Rock shelters in the OBRI were used as prehistoric big game hunting camps, and the archeological record preserves changes in subsistence practices. Saltpetre or “nitre” was mined during the War of 1812 and the Civil War, and artifacts of this mining remain in the OBRI today. The area surrounding the OBRI is sparsely populated, and extensive mining or other human alterations have not diminished the scenic value of the OBRI. The previously mentioned deep gorges and sandstone bluffs with relief as much as 500 feet provide a beautiful backdrop to other recreational activities in the OBRI. The Obed River is unique because it is an extensive gorge system and does not have limestone bedrock exposed on lower slopes like the gorges on the western escarpment of the Cumberland Plateau (Schmalzer, 1982). Although they are the most difficult ORVs to quantify, the scenic and aesthetic values are the most easily recognizable. The direct relation between changes in streamflow and the geologic, cultural, and scenic/aesthetic ORVs has not been quantified and is outside the scope of this science plan.
Part II: Analysis and Interpretation of OASIS Model Results Used to Estimate Select ORV Baselines
Updated OASIS Decision-Support Model Inputs
The use of statistically based decision-support tools is a quantifiable method of evaluating management decisions. An OASIS decision-support model was created for the OBRI in 2016 by HydroLogics (now called Hazen and Sawyer) by using publicly available streamflow data, flow-ecology relations, and basin characteristics (Cartwright and others, 2017). The OASIS decision-support model evaluates streamflow alteration by using municipal water supply withdrawals, effluent discharge, interbasin water transfers, dams, and other basin characteristics that affect streamflow (Cartwright and others, 2017). In 2021, Hazen and Sawyer completed an OASIS model update, adding two new model nodes at the edges of the OBRI, four new hypothetical management scenarios, and performance benchmarks for fishing, paddling, and swimming. Geospatial representation of updated model framework from Hazen and Sawyer (2021) is shown in figure 2.
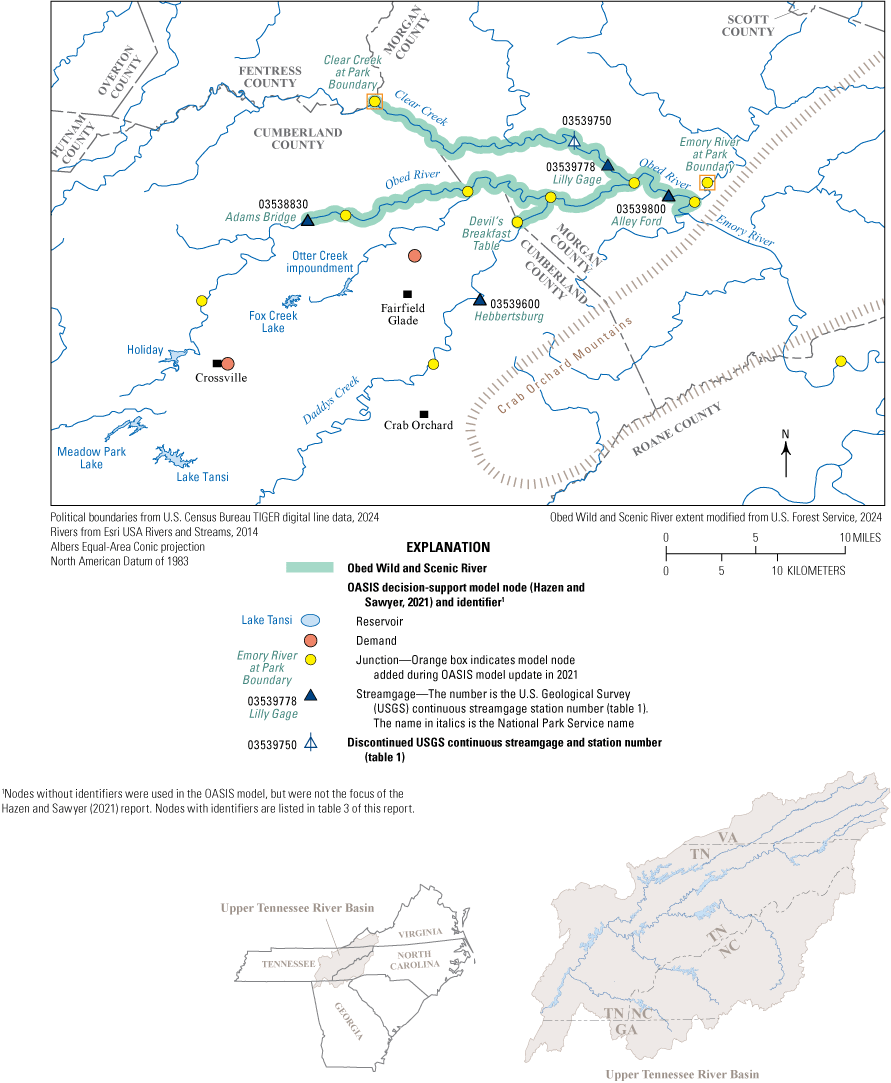
OASIS decision-support model framework with reservoirs (reservoir nodes), water withdrawal locations (demand nodes), modeled streamflow sites (junction nodes), and U.S. Geological Survey streamgage locations (streamgage nodes) for the Obed Wild and Scenic River, Tennessee. Modified from Hazen and Sawyer (2021).
The two new model inflow nodes are on Clear Creek and the Emory River at the OBRI boundary (fig. 2). The flow values modeled at the new nodes are based on streamgage data (USGS, 2021). The updated OASIS model was run on scenarios for four periods: 1976, 1976–94, 1995–2010, and 2010–21. The 1976 scenario represents conditions at OBRI establishment, 1976–94 represents early OBRI management, 1995–2010 represents later OBRI management, and 2010–21 represents current conditions. An additional “unregulated” scenario was run that represents a scenario with no withdrawals, discharges, or impoundments. The model framework, flow-ecology relations, and input hydrology data were unchanged from the original OASIS model completed in 2016. Daily streamflow data came from streamgages and were accessed through the USGS National Water Information System (USGS, 2021). Withdrawal data used in the OASIS model update (Hazen and Sawyer, 2021) came from the Crab Orchard Utility Water Treatment Plant located on Otter Creek impoundment and the Crossville Water Treatment Plant at Meadow Park Lake. Wastewater discharge data used in the OASIS model update (Hazen and Sawyer, 2021) came from the City of Crossville and the Fairfield Glade sewage treatment plants. The previous model outputs in Cartwright and others (2017) include a hypothetical management scenario (additional withdrawal), but the scenarios in the updated model application are based on existing data and show how baseline conditions in the OBRI have changed over time.
Ecological health is measured in the OASIS model by species richness. Species richness is modeled by using ecological-limit functions created by Knight and others (2014a) relating species richness to departure of streamflow characteristics from reference conditions. The streamflow characteristics used in the ecological-limit functions are mean annual runoff (MA41), maximum October streamflow (MH10), log of average annual 30-day maximum (DH13), base flow (ML20), constancy (TA1), log transform of variability of annual minimum daily average streamflow (DL6), and timing of annual minimum flow (TL1) (Knight and others, 2014a). Species richness is predicted for 11 fish-related categories: headwater intolerants, intolerants, invertivores, lithophilic spawners, natives, omnivores, pool dwellers, riffle dwellers, rares, specialized insectivores, top predators, and all species combined (Knight and others, 2014a).
New performance benchmarks for fishing, paddling, and swimming were added to the updated OASIS model. The performance benchmarks for fishing, paddling, and swimming are number of days the flow thresholds provided by OBRI staff (table 2) are met or exceeded. The swimming and fishing thresholds (maximum flows, in cubic feet per second) are twice the minimum paddling flow threshold.
Table 2.
Stream, stream reach, associated U.S. Geological Survey streamgage, and paddling, swimming, and fishing streamflow thresholds for the Obed Wild and Scenic River, Tennessee. Paddling, swimming, and fishing thresholds were heuristically determined by NPS staff.[Streamflow paddling minimums provided by Obed Wild and Scenic River staff. ft3/s, cubic foot per second]
| Stream (fig. 1) | Stream reach | Associated streamgage (fig. 1) | Paddling minimum streamflow (ft3/s) | Swimming and fishing maximum streamflow (ft3/s) |
|---|---|---|---|---|
| Clear Creek | Barnett Bridge to Jett Bridge | 03539778 | 500 | 1,000 |
| Clear Creek | Jett Bridge to Lilly Bridge | 03539778 | 500 | 1,000 |
| Clear Creek | Lilly Bridge to Obed River | 03539778 | 1,000 | 2,000 |
| Clear Creek | Highway 127 to Barnett Bridge | 03539778 | 500 | 1,000 |
| Daddys Creek | Antioch Bridge to Obed Junction | 03539600 | 400 | 800 |
| Obed River | Adams Bridge to Obed Junction | 03538830 | 400 | 800 |
| Obed River | Obed Junction to Nemo | 03538830 | 500 | 1,000 |
Modeled ORVs for New Scenarios
Streamflow varied between scenarios for six of the eight streamgages modeled. Modeled streamflow values for each scenario at each model node are listed in table 3. The 1976 scenario represents conditions at OBRI establishment and provides the streamflow baseline for the OBRI free-flowing condition. Streamflow statistics at Lilly Gage and Clear Creek at Park Boundary showed no change among any of the scenarios. The largest differences in streamflow were for the simulated maximum streamflows at Alley Ford (−751 cubic feet per second [ft3/s]), Hebbertsburg (−609 ft3/s), and Devil’s Breakfast Table (−610 ft3/s) between the 1976 scenario and the 2010–21 scenario. Overall, streamflow remained relatively stable across the scenarios. Mean streamflow was modeled at quantiles but did not indicate changes to the entire flow regime, year-over-year changes, or trends. Causes or variable importance of streamflow stability could not be determined from the OASIS model.
Table 3.
Simulated minimum and maximum daily streamflows and 25th, 50th, and 75th quantile streamflows for the four scenario periods at eight OASIS model nodes, Obed Wild and Scenic River, Tennessee.[ft3/s, cubic foot per second; OBRI, Obed Wild and Scenic River]
| Node location (fig. 2) |
Streamflow statistic | Scenario period | |||
|---|---|---|---|---|---|
| 1976 | 1976–94 | 1995–2010 | 2010–21 | ||
| Simulated streamflow (ft3/s) | |||||
| Adams Bridge | Minimum flow1 | 1 | 2 | 2 | 2 |
| 25th Quantile1 | 16 | 16 | 17 | 17 | |
| 50th Quantile | 101 | 101 | 101 | 101 | |
| 75th Quantile | 315 | 315 | 315 | 315 | |
| Maximum flow1 | 21,091 | 21,091 | 21,091 | 21,092 | |
| Alley Ford | Minimum flow1 | 2 | 2 | 3 | 3 |
| 25th Quantile1 | 61 | 62 | 62 | 62 | |
| 50th Quantile1 | 374 | 375 | 372 | 371 | |
| 75th Quantile1 | 1,114 | 1,114 | 1,104 | 1,103 | |
| Maximum flow1 | 71,128 | 70,518 | 70,495 | 70,377 | |
| Lilly Gage | Minimum flow | 0 | 0 | 0 | 0 |
| 25th Quantile | 15 | 15 | 15 | 15 | |
| 50th Quantile | 105 | 105 | 105 | 105 | |
| 75th Quantile | 314 | 314 | 314 | 314 | |
| Maximum flow | 22,178 | 22,178 | 22,178 | 22,178 | |
| Hebbertsburg | Minimum flow1 | 0 | 1 | 1 | 1 |
| 25th Quantile | 18 | 18 | 18 | 18 | |
| 50th Quantile1 | 102 | 101 | 100 | 100 | |
| 75th Quantile1 | 294 | 294 | 287 | 287 | |
| Maximum flow1 | 17,008 | 16,398 | 16,398 | 16,399 | |
| Clear Creek at OBRI Boundary | Minimum flow | 0 | 0 | 0 | 0 |
| 25th Quantile | 7 | 7 | 7 | 7 | |
| 50th Quantile | 46 | 46 | 46 | 46 | |
| 75th Quantile | 138 | 138 | 138 | 138 | |
| Maximum flow | 9,726 | 9,726 | 9,726 | 9,726 | |
| Devil's Breakfast Table | Minimum flow1 | 0 | 1 | 1 | 1 |
| 25th Quantile1 | 21 | 21 | 21 | 22 | |
| 50th Quantile1 | 123 | 123 | 121 | 121 | |
| 75th Quantile1 | 355 | 354 | 347 | 347 | |
| Maximum flow1 | 20,473 | 19,863 | 19,863 | 19,863 | |
| Emory River at OBRI Boundary | Minimum flow | 0 | 0 | 0 | 0 |
| 25th Quantile | 12 | 12 | 12 | 12 | |
| 50th Quantile | 66 | 66 | 66 | 66 | |
| 75th Quantile | 184 | 184 | 184 | 184 | |
| Maximum flow | 11,929 | 11,929 | 11,929 | 11,929 | |
| Holiday | Minimum flow1 | 1 | 2 | 2 | 2 |
| 25th Quantile1 | 2 | 2 | 2 | 3 | |
| 50th Quantile1 | 6 | 6 | 6 | 5 | |
| 75th Quantile | 19 | 19 | 19 | 19 | |
| Maximum flow1 | 1,077 | 1,077 | 1,078 | 1,078 | |
Minimal differences in modeled flow resulted in minimal differences in ecological response among the scenarios. However, Hazen and Sawyer (2021) noted the following:
-
1. In this version of the OASIS model, changes in withdrawals across the scenarios were offset by changes in discharges to the system; and
-
2. Limit regressions developed by USGS for some fish species are dependent on the constancy streamflow characteristic.
Similar to changes in species richness, minimal changes in streamflow conditions resulted in minimal changes in the fishing, paddling, and swimming thresholds. Table 4 lists the median number of days that modeled streamflow meets or exceeds the determined flow standards. Of all the recreation node locations, only two had changes across scenarios: Hebbertsburg and Alley Ford. The number of days the flow was below the maximum flow threshold for fishing at Hebbertsburg varied by 1 day, from 348 days during the 1976 (baseline) and 1976–94 scenarios to 349 days during the 1995–2010, 2010–21, and unregulated scenarios. The number of days streamflow was above the paddling minimum flows varied by 3 days at Hebbertsburg, from 47 days during the 1976 and 1976–94 scenarios, to 45 days during the 1995–2010 and 2010–21 scenarios, to 48 days for the unregulated scenario. Alley Ford had variation in number of days for paddling only. The number of days streamflow was above the minimum paddling threshold was 98 days for the 1976, 1995–2010, and 2010–21 scenarios, 99 days for the unregulated scenario, and 100 days for the 1976–94 scenario.
Table 4.
Median number of days flow conditions meet thresholds for fishing, paddling, and swimming for five scenarios at five OASIS model nodes, Obed Wild and Scenic River, Tennessee.| Recreation node (fig. 2) |
Recreation category | Number of days the modeled streamflow meets or exceeds flow standards, by model scenario | ||||
|---|---|---|---|---|---|---|
| Unregulated | 1976 | 1976–94 | 1995–2010 | 2010–21 | ||
| Hebbertsburg | Fishing1 | 349 | 348 | 348 | 349 | 349 |
| Paddling1 | 48 | 47 | 47 | 45 | 45 | |
| Swimming | 124 | 124 | 124 | 124 | 124 | |
| Adams Bridge | Fishing | 346 | 346 | 346 | 346 | 346 |
| Paddling | 52 | 52 | 52 | 52 | 52 | |
| Swimming | 124 | 124 | 124 | 124 | 124 | |
| Alley Ford | Fishing | 323 | 323 | 323 | 323 | 323 |
| Paddling1 | 99 | 98 | 100 | 98 | 98 | |
| Swimming | 122 | 122 | 122 | 122 | 122 | |
| Lilly Gage (low flow) |
Fishing | 338 | 338 | 338 | 338 | 338 |
| Paddling | 69 | 69 | 69 | 69 | 69 | |
| Swimming | 123 | 123 | 123 | 123 | 123 | |
| Lilly Gage (high flow) |
Fishing | 347 | 347 | 347 | 347 | 347 |
| Paddling | 53 | 53 | 53 | 53 | 53 | |
| Swimming | 124 | 124 | 124 | 124 | 124 | |
Overall, the differences in the results of the OASIS model scenarios were minimal. Possible reasons for the minimal changes in streamflow between scenarios could be related to the type of streamflow characteristics being analyzed. For example, the 16 streamflow characteristics identified by Knight and others (2008) with statistically significant correlations to changes in fish communities were not included in the OASIS modeling scenarios. The ecological-limit functions used in the OASIS model to model ecological response are from Cartwright and others (2017). The ecological-limit functions from Cartwright and others (2017) used the following streamflow characteristics as predictor variables: maximum October flow, variability of annual minimum daily average flow, date of annual minimum flow, base flow, flow constancy, and annual runoff. Modeled values of the above-mentioned streamflow characteristics were not reported. Additionally, baseline conditions were established for recreation, fish, and free-flowing condition (water quantity) ORVs by using the 1976 modeling scenario, not available streamflow data. Without detailed methods documentation or uncertainty analysis, we could not fully account for the possible limitations or error associated with the modeling.
Part III: Potential Research to Accomplish OBRI Goals
Park-Wide Concerns for the OBRI
The primary mission of NPS management of the OBRI is to protect and maintain ORVs to prevent outside water resource projects from unreasonably diminishing the values present in the OBRI as of the date of its 1976 designation under the Wild and Scenic Rivers Act (U.S. Congress, 1968). National parks are crucial to conservation of intact ecosystems and protection of endangered species because they form the core of global protected areas (United Nations Environment Programme World Conservation Monitoring Centre and International Union for Conservation of Nature, 2016). Climate change, increasing population, invasive plants and animals, nearby natural resource extraction, increased pressure on aging infrastructure, and other factors can negatively affect national parks (NPS, 2012b, 2015, 2021a; Knight and others, 2014b; Gonzalez and others, 2018).
A particular concern for many national parks is the potential effects of climate change. The magnitude and area of historical temperature increase is greater for national parks than for the United States as a whole (NPS, 2021a). The OBRI is predicted to be particularly resilient to climate change (Gonzalez and others, 2018) but is, nonetheless, affected. Gonzalez and others (2018) predict that temperature in the OBRI will rise between 1.5 and 4.7 degrees Celsius per century and precipitation will increase 5 to 9 percent by 2100 (range is dependent on different predicted emission scenarios). To address the potential effects of climate change, many national parks in the western United States are switching to Climate Smart Conservation (CSC) that uses an adaptive-management approach. CSC includes six steps: (1) inform the planning process, (2) assess climate vulnerabilities and risks, (3) evaluate climate implications for management goals, (4) identify potential adaptation strategies, (5) evaluate and select priority adaptation strategies, and (6) implement strategies and track effectiveness and changing conditions (NPS, 2021a). The first step of implementing CSC in the OBRI is to identify goals or baseline conditions for ecologically important species. The second step is to use long-term monitoring data to determine which species or ecosystems within the OBRI are the most sensitive and vulnerable to differing magnitudes and rates of environmental changes. In addition to the already available national climate change models, supplemental research into the more localized temperature and precipitation forecasting could provide more accurate predictions of future OBRI conditions. Human activity such as paving roads can also cause local increases in temperature (Cetin and others, 2024). Local climate research goals include studying the potential effect of increased impermeable surfaces lowering albedo and locally increasing temperatures. It is important to understand the direct influence of overall increasing temperatures and increasing frequency of extreme air temperatures on water temperature, fish tolerance, plant tolerance, and recreation in the OBRI.
Another potentially substantial threat to OBRI health is increasing population in the area (Bureau of Outdoor Recreation, 1976; Benck and others, 2017; Hughes and others, 2018a). Growth in nearby Crossville, Crab Orchard, and Fairfield Glade could increase demand for water extraction, wastewater discharge, logging of adjacent areas, runoff, and use of the OBRI for recreation (Hughes and others, 2018a; Hazen and Sawyer, 2021). All these potential stressors have the potential to affect the free-flowing condition, water quality, recreation, fish and wildlife, cultural, and scenic ORVs in the OBRI. As of 2024, OBRI staff have established thresholds (baselines) for the free-flowing condition of the streamflow, recreational activities, and fish species richness at the time of OBRI establishment (1976), but baseline conditions for the scenic, geologic, cultural, and water quality ORVs have not been established.
ORV-Specific Research Priorities
Monitoring ORVs protected under the Wild and Scenic Rivers Act is critical to the management of the OBRI. Possible next steps to accomplish future research goals specific to each ORV are listed in table 5. The OASIS model by Hazen and Sawyer (2021) is a flow-accounting model that uses streamflow inputs and outputs but does not address ORVs that are not directly dependent on streamflow conditions. Streamflow minimum, maximum, 25th quantile, 50th quantile, 75th quantile, and maximum baseline values have been established by using the 1976 model outputs from the OASIS model (Hazen and Sawyer, 2021), but other streamflow characteristics could be informative as part of a decision-support tool (Black and others, 2005). Olden and Poff (2003) classified ecologically important streamflow characteristics into five categories representing the natural flow regime: (1) magnitude, (2) frequency, (3) duration, (4) timing, and (5) rate of change of streamflow (Nature Conservancy, 2007). As of 2025, the OASIS model only includes magnitude, while baseline conditions for frequency, duration, timing, and rate of change have not been established. Also, a determination has not been made about which of the streamflow characteristics are most influential in maintaining baseline conditions. With the current OASIS model, hydrologic conditions beyond the quantiles presented in the Hazen and Sawyer (2021) report have not been considered. Understanding characteristics of the entire flow regime is critical to maintaining the natural balance of the ecosystem and the fish communities and could benefit the management of free-flowing condition, ecology and wildlife, and scenic ORVs.
Table 5.
Proposed next steps for evaluating and protecting outstandingly remarkable values for the Obed Wild and Scenic River, Tennessee.[ORVs, outstandingly remarkable values; OBRI; Obed Wild and Scenic River; USGS, U.S. Geological Survey; SPARROW, SPAtially Referenced Regressions on Watershed attributes]
Aquatic, riparian, and wetland ecosystems are dependent on intra-annual variation in hydrologic conditions (Richter and others, 2003; Wolfe and others, 2007). The OBRI sustains populations of eight threatened or endangered species and lacks a quantitative analysis of the conditions in the OBRI necessary to maintain or increase populations. The hydrologic metrics and thresholds for these threatened and endangered species are not included in the OASIS model. The effects of changes in streamflow on fish communities is demonstrated in the Hazen and Sawyer (2021) OASIS report, but baselines are also needed for other ecosystems in the OBRI. For example, gravel bar ecosystems in the OBRI are particularly sensitive to changes in sedimentation and are reliant on regular large flooding events with high enough energy to scour existing gravel bars and deposit large boulders (Wolfe and others, 2007). Additionally, gravel bar plants have adapted to extreme conditions but can be outcompeted by invasive species if the same flow regime is not maintained (NPS, 2018). Conducting a flood frequency analysis and connecting flood flows to gravel bar ecosystem needs could provide a more holistic look at the quantity and timing of streamflow needed to protect the OBRI fish and wildlife. Including more metrics of ecological health could also be informative. Although the OASIS model results indicated minimal effects on species richness because change in flow was minimal, the water quality needs of the ecology or the possible changes in species composition were not taken into consideration.
Water quality can be a determining factor when considering ecosystem response. To improve water quality characterization and management, increasing the number of water quality sampling sites and parameters, including sampling for fecal coliforms, nitrogen, phosphorous, sediment, and other water quality parameters, could help OBRI managers create water quality baselines. USGS streamgages 03538830, 03539600, and 03539800 (USGS, 2021) monitor daily water quality constituents. Increasing the number of water quality sites and water quality parameters could provide additional data to OBRI managers for the creation of baseline regulatory thresholds. In addition to the previously mentioned expansion of water quality monitoring, annual benthic macroinvertebrate surveys could provide the necessary data to examine how changes in water quality are affecting the whole food chain. Once the baselines have been established, water quality modeling in conjunction with the OASIS model possibly could be used to create a more robust decision-support tool. The SPAtially Referenced Regressions on Watershed attributes (SPARROW) surface-water-quality model, “predicts contaminant flux, concentration, and yield in streams” (Schwarz and others, 2006, p. 1) and is available for nitrogen and phosphorus modeling in Tennessee. The SPARROW model can be incorporated into other decision-support tools, and inclusion could improve the OASIS model by adding dynamic water quality estimates. Including the extensive water quality datasets available within the OBRI in the OASIS model could expand the potential inferences that could be made about ORVs.
In addition to paddling, swimming, and fishing, the OBRI is also popular for rock climbing. There are approximately 350 permanently bolted routes with difficulty between 5.7 and 5.14 (NPS, 2015). Sims and Hodges (2004) published the results of a climbing survey conducted in response to management actions presented in the OBRI final climbing management plan (NPS, 2002). Developing recreation baselines for rock climbing, such as number of climbers per day, and delineating routes that avoid sensitive or endangered plants and animals or important cultural or geologic sites are baselines that can be monitored to maintain the climbing aspect of the recreation ORV while still protecting the other ORVs of the OBRI.
An underutilized resource in the research in and around the OBRI is remote sensing data. Although scenic ORV is difficult to quantify, remote sensing data could be used to monitor large-scale changes to gravel bar distribution, sediment wasting, and forest canopy density to create baseline scenic conditions (Benck and others, 2017). Sheer rock cliffs in the OBRI are an aspect of the scenic, geologic, and wildlife ORVs. Geologic mapping in and around the OBRI has been extensive (NPS, GRIP, 2015) but the OBRI lacks a formal field-intensive paleontological comprehensive inventory. Identifying and preserving important fossil-bearing geologic units could be part of the geology ORV baseline. In addition, the 2009 Geologic Resources Inventory (Thornberry-Ehrlich, 2009) identified interest in groundwater flow maps, cave and karst mapping, landscape evolution maps, and landslide area maps. A formal cave inventory could improve monitoring of threatened and endangered bat species in the OBRI. Locating, mapping, and protecting archeological sites in the OBRI could be the basis of the cultural ORV.
Conclusions
The Obed Wild and Scenic River (OBRI) is the only Wild and Scenic River in the State of Tennessee and protects the headwaters of the Obed River, one of the last undammed rivers east of the Mississippi River. For these reasons, it has particular importance to the area. The OBRI was preserved for the baseline free-flowing condition of the rivers and for its outstanding water quality, fish and wildlife, geology, recreation, cultural, and scenic values. Throughout the history of the OBRI, multiple research efforts have monitored and studied aspects of these outstandingly remarkable values (ORVs), but these studies have often occurred in isolation or only for a discrete time interval. Natural Resource Inventories for OBRI extensively detail current conditions but do not necessarily indicate changes since OBRI designation. Baseline conditions of ORVs are necessary for environmental impact analyses and rely on long-term monitoring datasets. Baseline conditions for the ORVs related to flow were estimated by using the OASIS decision-support tool to model conditions at the time of OBRI establishment (1976). OASIS model outputs indicate minimal differences between ORV conditions at the time of OBRI establishment and recent (2021) ORV conditions. Future monitoring and modeling efforts could focus on creating baselines for water quality; magnitude, timing, and duration of high flows; metrics related to other threatened or endangered species in the OBRI; and geology, cultural, and scenic ORVs.
References Cited
Benck, K.M., Allen, K., Nadeau, A.J., Hutchins, H., Davis, A.M., and Robertson, A., 2017, Natural Resource Condition Assessment, Obed Wild and Scenic River: Fort Collins, Colo., National Park Service Natural Resource Report NPS/OBED/NRR—2017/1554, 352 p., accessed December 11, 2024, at https://npshistory.com/publications/obed/nrr-2017-1554.pdf.
Black, A.R., Rowan, J.S., Duck, R.W., Bragg, O.M., and Clelland, B.E., 2005, DHRAM—A method for classifying river flow regime alterations for the EC Water Framework Directive: Aquatic Conservation: Marine and Freshwater Ecosystems, v. 15, no. 5, p. 427–446, accessed November 3, 2023, at https://onlinelibrary.wiley.com/doi/epdf/10.1002/aqc.707.
Bureau of Outdoor Recreation, 1976, Obed River, Tennessee, Wild and Scenic River study: U.S. Department of Interior, [variously paged], accessed August 14, 2019, at https://www.rivers.gov/sites/rivers/files/2023-02/obed-study.pdf.
Cartwright, J.M., Caldwell, C., Nebiker, S., and Knight, R.R., 2017, Putting flow-ecology relationships into practice—A decision-support system to assess fish community response to water-management scenarios: Water, v. 9, no. 3, 18 p., accessed July 15, 2019, at https://doi.org/10.3390/w9030196.
Cetin, M., Kavlak, M.O., Kurkcuoglu, M.A.S., Ozturk, G.B., Cabuk, S.N., and Cabuk, A., 2024, Determination of land surface temperature and urban heat island effects with remote sensing capabilities—The case of Kayseri, Türkiye: Natural Hazards, v. 120, p. 5509–5536, accessed June 16, 2025, at https://doi.org/10.1007/s11069-024-06431-5.
DarkSky International, 2017, Obed Wild and Scenic River: DarkSky International, International Dark Sky Places web page, accessed May 10, 2023, at https://darksky.org/places/obed-wild-and-scenic-river-dark-sky-park/.
Gonzalez, P., Wang, F., Notaro, M., Vimont, D.J., and Williams, J.W., 2018, Disproportionate magnitude of climate change in United States national parks: Environmental Research Letters, v. 13, no. 10, article 104001, accessed November 28, 2023, https://iopscience.iop.org/article/10.1088/1748-9326/aade09.
Greene, D.J., and Wolfe, W.J., 1998, Superfund GIS—Physiographic provinces, aquifer outcrops and recharge rates in Tennessee: U.S. Geological Survey dataset, accessed April 13, 2023, at https://doi.org/10.3133/70046038.
Hayes, C.W., 1894, Kingston folio, Tennessee: U.S. Geological Survey Folios of the Geologic Atlas 4, accessed July 12, 2023, at https://doi.org/10.3133/gf4.
Hughes, J., Emmot, R., Murdock, N., Flaherty, P., and Raskin, E., 2018a, Protocol narrative—Long-term continuous water-quality monitoring at Big South Fork National River and Recreation Area and Obed Wild and Scenic River: Fort Collins, Colo., National Park Service, Natural Resource Report NPS/APHN/NRR—2018/1722, accessed March 8, 2024, at https://irma.nps.gov/DataStore/Reference/Profile/2255929.
Hughes, J., Emmott, R., Raskin, E., and Witcher, B., 2018b, Protocol narrative—Long-term discrete water quality monitoring at Big South Fork National River and Recreation Area, Blue Ridge Parkway, and Obed Wild and Scenic River: Fort Collins, Colo., National Park Service, Natural Resource Report NPS/APHN/NRR—2018/1840, accessed March 8, 2024, at https://irma.nps.gov/DataStore/Reference/Profile/2258269.
Interagency Wild and Scenic Rivers Coordinating Council, 2002, Wild & Scenic River management responsibilities: Technical Report, 44 p., accessed November 1, 2021, at https://www.rivers.gov/carp/sites/rivers/files/2023-07/management.pdf.
Interagency Wild and Scenic Rivers Coordinating Council, 2004, Wild & Scenic Rivers Act—Section 7: Technical Report, accessed February 26, 2024, at https://www.rivers.gov/sites/rivers/files/2023-07/section-7.pdf.
Keith, A., 1897, Wartburg folio, Tennessee: U.S. Geological Survey Folios of the Geologic Atlas 40, accessed July 12, 2023, at https://doi.org/10.3133/gf40.
Knight, R.R., Gregory, M.B., and Wales, A.K., 2008, Relating streamflow characteristics to specialized insectivores in the Tennessee River Valley—A regional approach: Ecohydrology, v. 1, no. 4, 14 p., accessed November 28, 2023, at https://doi.org/10.1002/eco.32.
Knight, R.R., Murphy, J.C., Wolfe, W.J., Saylor, C.F., and Wales, A.K., 2014a, Ecological limit functions relating fish community response to hydrologic departures of the ecological flow regime in the Tennessee River basin, United States: Ecohydrology, v. 7, no. 5, p. 1262–1280, accessed November 28, 2023, at https://doi.org/10.1002/eco.1460.
Knight, R.R., Wolfe, W.J., and Law, G.S., 2014b, Hydrologic data for the Obed River watershed, Tennessee: U.S. Geological Survey Open-File Report 2014–1102, 24 p., accessed May 29, 2020, at https://doi.org/10.3133/ofr20141102.
Luther, E.T., 1959, The coal reserves of Tennessee: Tennessee Division of Geology Bulletin 63, p. 294, accessed July 12, 2023, at https://www.tn.gov/content/dam/tn/environment/geology/documents/geology_pennsylvanian-geology-cp.pdf.
Miller, M.P., Eberts, S.M., and Sprague, L.A., 2021, Water priorities for the Nation—USGS Integrated Water Science basins: U.S. Geological Survey Fact Sheet 2021–3041, 2 p., accessed November 23, 2023, at https://doi.org/10.3133/fs20213041.
National Park Service [NPS], 2002, Obed Wild and Scenic River final climbing management plan: Wartburg, Tenn., National Park Service, accessed May 5, 2023, at https://npshistory.com/publications/obed/cmp-2002.pdf.
National Park Service [NPS], 2012a, Outstandingly remarkable values, Obed Wild and Scenic River, Tennessee: National Park Service, 14 p., accessed December 6, 2023, at http://npshistory.com/publications/obed/values.pdf.
National Park Service [NPS], 2012b, Big South Fork National River and Recreation Area and Obed Wild and Scenic River, Final non-federal oil and gas management plan / environmental impact statement: National Park Service, [variously paged], accessed July 12, 2023, at https://parkplanning.nps.gov/showFile.cfm?sfid=138137&projectID=10911.
National Park Service [NPS], 2015, Foundation document, Obed Wild and Scenic River, Tennessee: National Park Service, 44 p., accessed July 12, 2023, at https://npshistory.com/publications/foundation-documents/obed-fd-2015.pdf.
National Park Service [NPS], 2018, Cobble bar monitoring: National Park Service, accessed February 28, 2024, at https://www.nps.gov/im/aphn/cobble-bars.htm.
National Park Service [NPS], 2021a, Planning for a changing climate—Climate-smart planning and management in the National Park Service: Fort Collins, Colo., National Park Service, accessed November 28, 2023, at https://irma.nps.gov/DataStore/DownloadFile/662814.
National Park Service [NPS], 2021b, Twelve basic inventories: National Park Service website, accessed October 25, 2024, at https://www.nps.gov/im/12-basic-inventories.htm.
National Park Service, Geologic Resources Inventory Program [NPS, GRIP], 2015, Digital bedrock geologic map of Obed Wild and Scenic River and vicinity, Tennessee (NPS, GRD, GRI, OBED, OBED digital map) adapted from University of Tennessee 7.5-minute series maps by Scruggs, Stearns, Hansen, Wunderlich and Hatcher (2015), Scruggs, Levader, Stearns, Hansen, Wunderlich and Hatcher (2015), and Scruggs, Moore, Gilmore, Hansen, Wunderlich, Rehrer and Hatcher (2015), and Tennessee Division of Geology Geologic Maps by Coker (1965), Coker (1965), and Finlayson, Powell, Kronman and Moore (1985), accessed May 7, 2023, at https://irma.nps.gov/DataStore/Reference/Profile/2302500.
National Park Service, Water Resources Division [NPSWRD], 1999, Baseline water quality data inventory and analysis, Obed Wild and Scenic River: Fort Collins, Colo., National Park Service Technical Report NPS/NRWRD/NRTR-98/200, 727 p., accessed March 8, 2024, at https://irma.nps.gov/DataStore/DownloadFile/431315.
Nature Conservancy, 2007, Indicators of Hydrologic Alteration—Version 7 User’s Manual: Arlington, Va., The Nature Conservancy, 31 p., accessed May 29, 2020, at https://www.conservationgateway.org/Documents/IHAV7.pdf.
Olden, J.D., and Poff, N.L., 2003, Redundancy and the choice of hydrologic indices for characterizing streamflow regimes: River Research and Applications, v. 19, no. 2, p. 101–121, accessed November 3, 2023, at https://doi.org/10.1002/rra.700.
Open Space Institute, 2018, Cumberland Plateau—Protecting the plateau before it’s too late: Open Space Institute web page, accessed May 20, 2019, at https://www.openspaceinstitute.org/places/cumberland-plateau.
Richter, B.D., Mathews, R., Harrison, D.L., and Wigington, R., 2003, Ecologically sustainable water management—Managing river flows for ecological integrity: Ecological Applications, v. 13, no. 1, p. 206–224, accessed November 3, 2023, at https://doi.org/10.1890/1051-0761(2003)013[0206:ESWMMR]2.0.CO;2.
Safford, J.M., 1869, Geology of Tennessee: Nashville, Tenn., Tennessee State Printing Office, accessed July 12, 2023, at https://babel.hathitrust.org/cgi/pt?id=mdp.39015067339062&seq=7.
Schmalzer, P.A., 1982, Vegetation of the Obed Wild and Scenic River, Tennessee and a comparison of reciprocal averaging ordination and binary discriminant analysis: Knoxville, Tenn., University of Tennessee, Ph.D. dissertation, 236 p., accessed December 12, 2023, at https://www.researchgate.net/publication/36337499_Vegetation_of_the_Obed_Wild_and_Scenic_River_Tennessee_and_a_comparison_of_reciprocal_averaging_ordi nation_and_binary_discriminant_analysis.
Schmalzer, P.A., Hinkle, C.R., and DeSelm, H.R., 1980, Vegetation patterns in a section of the Obed Wild and Scenic River, Cumberland County, Tennessee, in Garrett, H.E., and Cox, G.S., eds., Central Hardwood Forest Conference III, September 16–17, 1980, [Proceedings]: Columbia, Mo., University of Missouri, p. 257–272, accessed December 12, 2023, at https://www.researchgate.net/publication/315842110_Vegetation_patterns_in_a_section_of_the_Obed_Wild_and_Scenic_River_Cumberland_County_Tennessee.
Schwarz, G.E., Hoos, A.B., Alexander, R.B., and Smith, R.A., 2006, Section 3. The SPARROW surface water-quality model—Theory, application, and user documentation: U.S. Geological Survey Techniques and Methods, book 6, chap. B3, accessed November 23, 2023, at https://doi.org/10.3133/tm6B3.
Sims, C.B., and Hodges, D.G., 2004, Obed Wild and Scenic River rock climbing survey results: Final Report submitted to National Park Service, accessed December 7, 2023, at https://npshistory.com/publications/obed/rock-climbing-rpt-2004.pdf.
Sims, C.B., Hodges, D.G., and Scruggs, D., 2004, Linking outdoor recreation and economic development—A feasibility assessment of the Obed Wild and Scenic River, Tennessee, in Tierney, P.T., and Chavez, D.J., eds., Proceedings of the fourth Social Aspects and Recreation Research Symposium, February 4–6, 2004: San Francisco, Calif., San Francisco State University, p. 89–95, accessed December 8, 2023, at https://www.fs.usda.gov/psw/publications/4902/psw_2004_4902_089_sims.pdf.
Stearns, R.G., 1954, The Cumberland Plateau overthrust and geology of the Crab Orchard Mountains area, Tennessee: Tennessee Division of Geology Bulletin 60, 47 p., accessed July 12, 2023, at https://www.tn.gov/content/dam/tn/environment/geology/documents/geology_bulletin-60txt.pdf.
Tennessee Department of Environment and Conservation [TDEC], 2019, Rules of the Tennessee Department of Environment and Conservation (revised): Nashville, Tenn., Tennessee Department of Environment and Conservation, 46 p., accessed November 3, 2023, at https://publications.tnsosfiles.com/rules/0400/0400-40/0400-40-03.20190911.pdf.
Tennessee Department of Environment and Conservation [TDEC], 2022, 2022 List of impaired and threatened waters in Tennessee, accessed February 15, 2024, at https://www.tn.gov/content/dam/tn/environment/water/watershed-planning/wr_wq_303d-2022-final.xlsx.
Tennessee Department of Environment and Conservation [TDEC], 2024, DataViewer—The known exceptional Tennessee waters and outstanding national resource waters, accessed February 24, 2024, at https://dataviewers.tdec.tn.gov/dataviewers/f?p=2005:34304:11974924567275:.
Thornberry-Ehrlich, T., 2009, Geologic resources inventory scoping summary, Big South Fork National River and Recreation Area & Obed Wild and Scenic River: Geologic Resources Division, National Park Service, 44 p., accessed December 11, 2023, at https://irma.nps.gov/DataStore/DownloadFile/596404.
United Nations Environment Programme World Conservation Monitoring Centre and International Union for Conservation of Nature, 2016, Protected Planet Report 2016—How protected areas contribute to achieving global targets for biodiversity: Cambridge, United Kingdom, United Nations Environment Programme, 73 p., accessed November 23, 2023, at https://wdpa.s3.amazonaws.com/Protected_Planet_Reports/2445%20Global%20Protected%20Planet%202016_WEB.pdf.
U.S. Army Corps of Engineers, 1930, House Document 328, 71st Congress, 2nd Session, 734 p., accessed December 4, 2023, at https://history.house.gov/Institution/House-Calendars/House_Calendar_71st_Congress/.
U.S. Congress, 1968, Wild and Scenic Rivers Act, 16 U.S.C. § 1271–1287, accessed October 29, 2024, at https://uscode.house.gov/view.xhtml?path=/prelim@title16/chapter28&edition=prelim.
U.S. Fish and Wildlife Service, 2004, Endangered and threatened wildlife and plants—Designation of critical habitat for five endangered mussels in the Tennessee and Cumberland River Basins: 50 CFR, pt. 17, RIN 1018-A176, accessed December 6, 2023, at https://www.federalregister.gov/documents/2004/08/31/04-19340/endangered-and-threatened-wildlife-and-plants-designation-of-critical-habitat-for-five-e ndangered.
U.S. Fish and Wildlife Service, 2005, Endangered and threatened wildlife and plants—Establishment of a nonessential experimental population for two fishes (boulder darter and spotfin chub) in Shoal Creek, Tennessee and Alabama: 50 CFR, pt. 17, RIN 1018-AH44, accessed December 7, 2023, at https://www.federalregister.gov/documents/2005/04/08/05-7086/endangered-and-threatened-wildlife-and-plants-establishment-of-a-nonessential-experimenta l.
U.S. Fish and Wildlife Service, 2023, Endangered and threatened wildlife and plants—Designation of critical habitat for the sickle darter: 50 CFR, pt. 17, RIN 1018-BG85, accessed December 6, 2023, at https://www.federalregister.gov/documents/2023/01/24/2023-00977/endangered-and-threatened-wildlife-and-plants-designation-of-critical-habitat-for-the- sickle-darter.
U.S. Fish and Wildlife Service, 2025, IPaC—Information for Planning and Consultation: U.S. Fish and Wildlife database, accessed June 17, 2025, at https://ecos.fws.gov/ipac/.
U.S. Geological Survey [USGS], 2021, USGS water data for the Nation: U.S. Geological Survey National Water Information System database, accessed February 1, 2021, at https://doi.org/10.5066/F7P55KJN.
Van Metre, P.C., Qi, S., Deacon, J., Dieter, C., Driscoll, J.M., Fienen, M., Kenney, T., Lambert, P., Lesmes, D., Mason, C.A., Mueller-Solger, A., Musgrove, M., Painter, J., Rosenberry, D., Sprague, L., Tesoriero, A.J., Windham-Myers, L., and Wolock, D., 2020, Prioritizing river basins for intensive monitoring and assessment by the U.S. Geological Survey: Environmental Monitoring and Assessment, v. 192, article 458, 17 p., accessed November 28, 2023, at https://doi.org/10.1007/s10661-020-08403-1.
Wilson, C.W., Jr., Jewell, J.W., and Luther, E.T., 1956, Pennsylvanian geology of the Cumberland Plateau: Tennessee Division of Geology Folio, 21 p., accessed July 14, 2023, at https://www.tn.gov/content/dam/tn/environment/geology/documents/geology_pennsylvanian-geology-cp.pdf.
Wilson, J.M., 1965, Ground water resources and geology of Cumberland County, Tennessee: Tennessee Division of Water Resources, 56 p., accessed July 14, 2023, at https://www.nps.gov/obed/learn/nature/upload/ofr2014-1102.pdf.
Wolfe, W.J., Fitch, K.C., and Ladd, D.E., 2007, Alluvial bars of the Obed Wild and Scenic River, Tennessee: U.S. Geological Survey Scientific Investigations Map 2972, 6 p., accessed November 28, 2024, at https://doi.org/10.3133/sim2972.
Glossary
- OASIS
Hydrologic mass-balance model produced by Hazen and Sawyer (2021). OASIS is a decision-support tool for water resource managers.
- OBRI
Obed Wild and Scenic River. Obed River headwaters and tributaries protected under the Wild and Scenic Rivers Act.
- ORV
Outstandingly remarkable values an area must have to be considered for inclusion in the Wild and Scenic Rivers System. The values can be outstandingly remarkable scenic, recreational, geologic, ecological (fish and wildlife), historic, or cultural values.
- SPARROW
SPAtially Referenced Regressions on Watershed attributes model to estimate long-term average water quality characteristics. Calculates contaminant flux, concentration, and yield.
Conversion Factors
U.S. customary units to International System of Units
Temperature in degrees Celsius (°C) may be converted to degrees Fahrenheit (°F) as follows:
°F = (1.8 × °C) + 32.
Temperature in degrees Fahrenheit (°F) may be converted to degrees Celsius (°C) as follows:
°C = (°F – 32) / 1.8.
Abbreviations
CSC
Climate Smart Conservation
EPA
U.S. Environmental Protection Agency
GRIP
Geologic Resources Inventory Program
IRMA
Integrated Resource Management Applications
NPS
National Park Service
NPSWRD
National Park Service, Water Resources Division
OBRI
Obed Wild and Scenic River
ORV
outstandingly remarkable values
SPARROW
SPAtially Referenced Regressions on Watershed attributes
TDEC
Tennessee Department of Environment and Conservation
USGS
U.S. Geological Survey
For more information about this publication, contact
Director, Lower Mississippi-Gulf Water Science Center
U.S. Geological Survey
640 Grassmere Park, Suite 100
Nashville, TN 37211
For additional information, visit
https://www.usgs.gov/centers/lmg-water/
Publishing support provided by
Lafayette Publishing Service Center
Disclaimers
Any use of trade, firm, or product names is for descriptive purposes only and does not imply endorsement by the U.S. Government.
Although this information product, for the most part, is in the public domain, it also may contain copyrighted materials as noted in the text. Permission to reproduce copyrighted items must be secured from the copyright owner.
Suggested Citation
Crowley-Ornelas, E.R., Schapansky, R., Blount, T., and Nicholas, N.S., 2025, Decision-support modeling and research priorities for establishing baseline conditions for outstandingly remarkable values, Obed Wild and Scenic River, Tennessee: U.S. Geological Survey Open-File Report 2025–1035, 18 p., https://doi.org/10.3133/ofr20251035.
ISSN: 2331-1258 (online)
Study Area
| Publication type | Report |
|---|---|
| Publication Subtype | USGS Numbered Series |
| Title | Decision-support modeling and research priorities for establishing baseline conditions for outstandingly remarkable values, Obed Wild and Scenic River, Tennessee |
| Series title | Open-File Report |
| Series number | 2025-1035 |
| DOI | 10.3133/ofr20251035 |
| Publication Date | August 01, 2025 |
| Year Published | 2025 |
| Language | English |
| Publisher | U.S. Geological Survey |
| Publisher location | Reston, VA |
| Contributing office(s) | Lower Mississippi-Gulf Water Science Center |
| Description | viii, 18 p. |
| Country | United States |
| State | Tennessee |
| Other Geospatial | Obed Wild and Scenic River |
| Online Only (Y/N) | Y |