

Reconnaissance of Potential Alternate Water Supply Sources for the City of Gary, West Virginia
Links
- Document: Report (5.71 MB pdf) , HTML , XML
- Appendix: Appendix 2 (222 KB csv) - Water-Quality Data Collected During the Study
- NGMDB Index Page: National Geologic Map Database Index Page
- Download citation as: RIS | Dublin Core
Acknowledgments
The U.S. Geological Survey would like to acknowledge Stacy A. Fowler, Senior Project Manager for Thompson & Litton in Princeton, West Virginia, and Larry Barber, Treasurer for the City of Gary, West Virginia. This study would not have been possible without their long-term support.
Abstract
Seven potential sources of water, consisting of free-flowing discharge from abandoned coal mines at six locations and one abandoned flooded underground coal mine air shaft, were sampled for chemical analysis to assess the quality of the groundwater emanating from the seven mine sources. The six free-flowing mine discharge sources were also assessed for discharge by current-meter measurements on two separate occasions. The U.S. Geological Survey assessed these seven sources to provide information to the City of Gary, West Virginia (W. Va.), and the City of Gary’s consulting engineer with groundwater-quality and flow data to allow them to assess the seven sites as potential alternate sources of water for the City of Gary to augment its existing supply.
For the six sites where discharge could be measured, discharge ranged from a minimum of 0.082 cubic feet per second (ft3/s) to a maximum of 3.685 ft3/s. Of the six sites measured, only two, Harmon Branch at Thorpe, W. Va. (USGS site 372201081303501) and the abandoned public-supply water wells near Havaco, W. Va. (USGS site 372358081344601), had discharge in excess of 1.00 ft3/s. Discharge from the abandoned public supply wells was 3.685 ft3/s on September 20, 2023, and 2.888 ft3/s on October 16, 2023, and discharge from Harmon Branch at Thorpe, W. Va., was 1.049 ft3/s on September 22, 2023, and 1.038 ft3/s on October 17, 2023. Discharge in the abandoned underground mine air shaft (USGS site 372224081340901) could not be assessed, but the air shaft drains an abandoned mine that likely contains water stored in approximately 1.7 square miles (mi2) of abandoned underground coal mines in the Pocahontas No. 3 coal seam, and possibly an additional 0.9 mi2 of leakage from the overlying Pocahontas No. 4 coal seam. Discharge for the six sites measured for the study was measured during a period between September 20 and October 18, 2023, and corresponded to the 12th to the 15th percentile of flow-duration statistics for the Tug Fork downstream of Elkhorn Creek at Welch, W. Va. streamgage (USGS site 03212750).
Water-quality data for the seven sites sampled overall were acceptable with respect to drinking water standards. Of the 203 constituents analyzed, only a few failed to meet applicable U.S. Environmental Protection Agency (EPA) drinking water standards. Iron exceeded the 300 micrograms per liter (µg/L) secondary maximum contaminant level (SMCL) at only 1 of the 7 sites (14.3 percent) sampled. Iron concentrations ranged from a minimum of less than (<) 5.00 µg/L to a maximum of 724 µg/L with a median concentration of 7.62 µg/L. Manganese exceeded the 50.0 µg/L SMCL at 2 of the 7 sites (28.6 percent) sampled. Manganese concentrations ranged from a minimum of 1.93 µg/L to a maximum of 271 µg/L with a median concentration of 4.03 µg/L. No sites sampled exceeded the arsenic maximum contaminant level (MCL) of 10 µg/L. Arsenic concentrations ranged from a minimum of <0.100 µg/L to a maximum of 2.35 µg/L with a median arsenic concentration of 0.200 µg/L. None of the seven sites sampled for selenium for this study exceeded the EPA MCL of 50.0 µg/L. Selenium concentrations ranged from a minimum of <0.050 µg/L to a maximum of 5.26 µg/L with a median concentration of 3.21 µg/L.
All seven sites were sampled for volatile organic compounds (VOCs), semivolatile organic compounds (SVOCs), and polychlorinated biphenyls (PCBs), but most had concentrations below the detection limit. Of the 10 PCB compounds analyzed for the seven sites sampled, none contained detectable concentrations of PCBs or Aroclor compounds. Of the 44 SVOCs analyzed at each of the seven sites sampled, only 1 SVOC, acenaphthene, was detected, at a concentration of 0.02 µg/L. Of the 96 VOCs analyzed, from each of the seven sites sampled, only two were found at detectable concentrations. Trichloromethane was detected only at 1 of the 7 (14.3 percent) sites sampled at a concentration of 0.027 µg/L, and benzene was detected at the same site and 3 additional sites (4 of the 7 sites or 57.1 percent of the sites sampled) at concentrations of 0.028, 0.029, 0.021, and 0.035 µg/L, but none exceeded the EPA MCL for benzene of 5.00 µg/L.
Total coliform bacteria are ubiquitous in the environment, and their presence only suggests the potential for contamination by near-surface processes. Escherichia coli (E. coli) bacteria are derived from either human or animal fecal material and can be an indicator of potential contamination by pathogenic bacteria or viruses. Total coliform bacteria were detected at all 7 sites sampled at concentrations ranging from 17.5 to greater than (>) 2,420 most probable number per 100 mL (MPN/100 mL) of sample, with a median total coliform concentration of 1,553 MPN/100 mL. Escherichia coli bacteria were detected at 4 of the 7 sites sampled at concentrations ranging from <1 to 11.9 MPN/100 mL, with a median E. coli concentration of 5.1 MPN/100 mL.
Introduction
The City of Gary, in the southernmost part of McDowell County, West Virginia (W. Va.; fig. 1) obtains groundwater for public supply from a 130-foot (ft) deep well (Grapevine Well, Mcd-0109, USGS site 372259081334101, fig. 2; U.S. Geological Survey, 2025a) completed in a tunnel connecting upgradient abandoned coal mines within the Pocahontas No. 3 coal seam (West Virginia Geological and Economic Survey, 2018a) to the northeast with similar downgradient abandoned underground coal mines to the southeast (fig. 2). The tunnel passes below the Tug Fork (river), and in recent years (date unspecified), a second well within 15 ft of the City of Gary’s public-supply well was brought into production for source water for a nearby mining operation. The city’s production well and the well operated by the mining company are completed in the same narrow tunnel. There have been significant mountaintop removal coal-mining operations in the overburden strata and coal seams overlying the abandoned mines in the Pocahontas No. 3 and No. 4 (West Virginia Geological and Economic Survey, 2018b) coal seams, which provide groundwater storage and recharge to the City’s public-supply well. In recent years, the quality of the water available from the City’s public supply well has been degraded by increased turbidity and concentrations of total dissolved solids, iron, and manganese. These increased concentrations have increased treatment costs for the city (L. Barber, Treasurer for the City of Gary, oral commun., 2023) to meet established U.S. Environmental Protection Agency (EPA) drinking water standards (U.S. Environmental Protection Agency, 2025). Turbidity measured at the city’s public-supply well (U.S. Geological Survey [USGS] site 372259081334101—well name Mcd-0109) was 0.68 on May 19, 1999, and had increased to 22 nephelometric turbidity units (NTU) on October 22, 2020. The cause of the degradation in the city’s water supply source is at present undetermined, but the city has indicated the need to find an alternate source of water to replace or augment the city’s current sole-source supply (L. Barber, Treasurer for the City of Gary, oral commun., 2023).
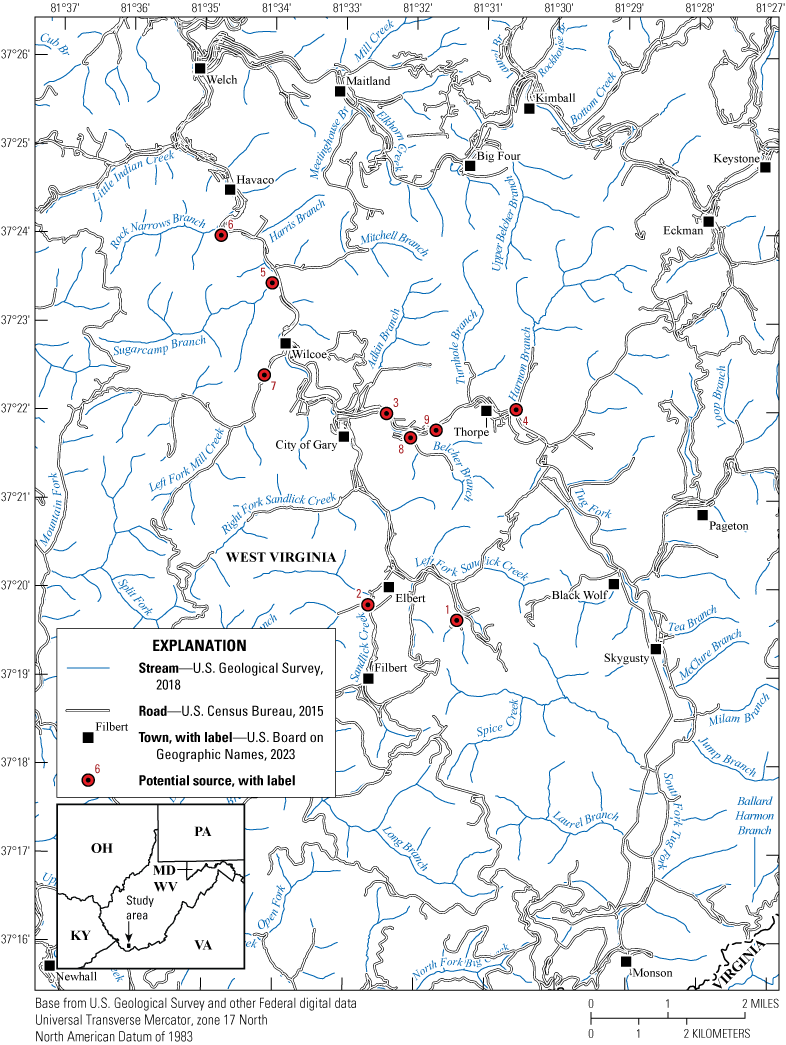
Map showing the location of the Gary area, McDowell County, West Virginia, including major streams and tributaries.
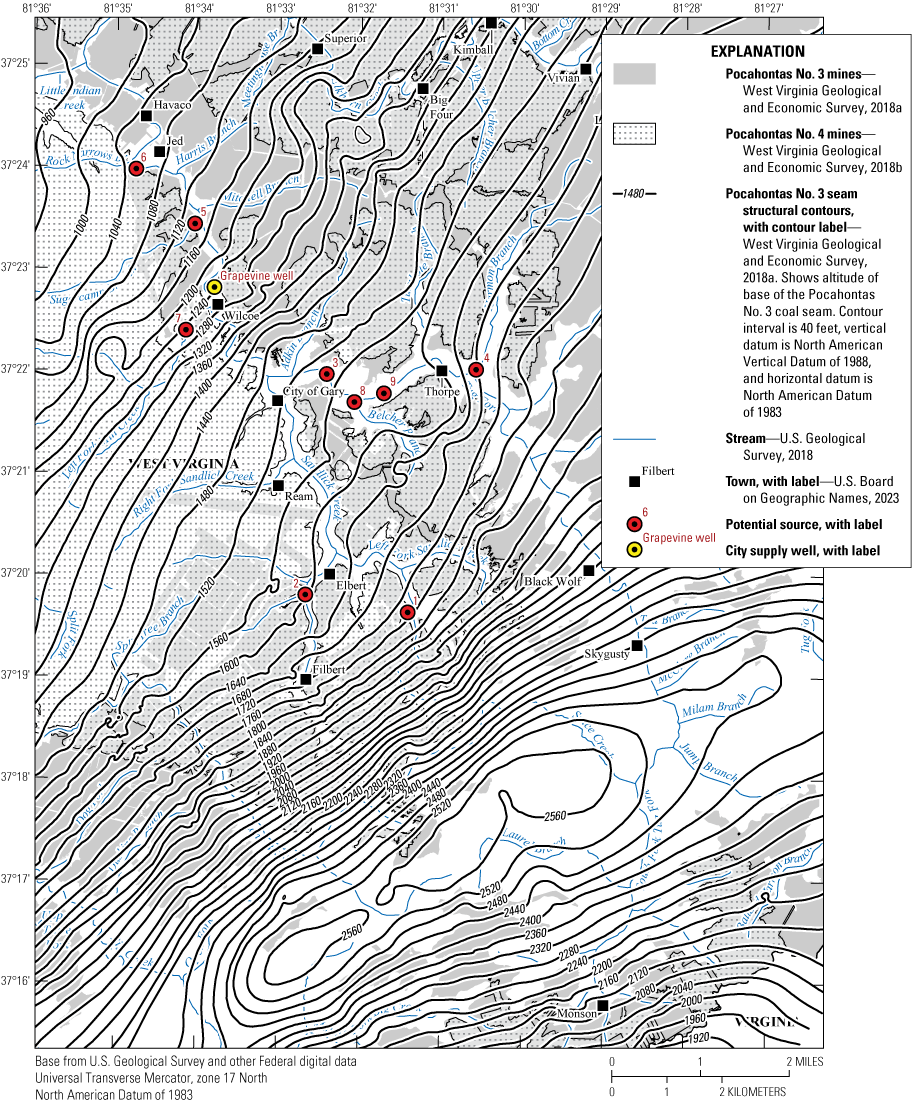
Map showing the extent of underground coal mining in the Pocahontas No. 3 and No. 4 coal seams and sites sampled or measured in the Gary area, McDowell County, West Virginia.
Purpose and Scope
The purpose of this report is to summarize findings of a reconnaissance study with the goal of locating and assessing potential sources of groundwater to augment the existing public-supply well for the City of Gary (L. Barber, Treasurer for the City of Gary, oral commun., 2023). Nine potential sources of groundwater were identified from abandoned underground mines (table 1) that may serve as a source of water to augment the existing public-supply well for the City of Gary, as the existing public-supply well has experienced increasing turbidity in recent years. This increased turbidity has resulted in additional water-treatment costs for the City of Gary (L. Barber, Treasurer for the City of Gary, oral commun., 2023) to ensure the public water meets EPA drinking water standards (U.S. Environmental Protection Agency, 2025). The alternate groundwater sources were evaluated for water-quantity yield and water-quality suitability with respect to the EPA drinking water standards. Water-quality and flow data collected for the study are available from the USGS NWIS database (U.S. Geological Survey, 2025a) and are also presented in appendix 2 of this report. An alternate source of water with better water quality could be blended with or replace the existing source to reduce treatment costs.
Table 1.
U.S. Geological Survey site numbers, station names, site type, dates when discharge was measured, mine discharge (flow), Tug Fork downstream of Elkhorn Creek at Welch, WV (USGS site 03212750; U.S. Geological Survey, 2025a) discharge corresponding to measurement date, Tug Fork downstream of Elkhorn Creek at Welch, WV flow-duration percentile corresponding to date flow was measured for sites measured or sampled in Gary, McDowell County, West Virginia.[The principal aquifer for all sites is Pocahontas No. 3 and 4 coal seams. Date shown in month/day/year format. ID, identification; USGS, U.S. Geological Survey; ft3/s, cubic feet per second; WV, West Virginia; mi, mile; trib., tributary; No., number; n/a, not applicable for mine shaft]
Description of Study Area
The City of Gary is in McDowell County in the southernmost part of the State of West Virginia. The Gary area is in the heart of the historically important Pocahontas coalfields, which provided low-sulfur coal for steel production to companies such as U.S. Steel Mining Corporation (U.S. Steel), which was the dominant employer in the City of Gary from the early 1900s until 1985, when U.S. Steel ceased all coal mining operations in its Gary district (Schust, 2005). Coal mined in U.S. Steel’s Gary mines provided coal for coking and subsequent steel production at their facilities in the Pittsburgh, Pennsylvania area and other states (Schust, 2005). Widespread underground mining of coal in the Pocahontas No. 3 and No. 4 coal seams has created a vast network of interconnected, abandoned mine shafts and tunnels, which has created a prolific groundwater aquifer that is the source of multiple public groundwater supplies in southern West Virginia (Kozar and others, 2020).
The groundwater flow processes within Pocahontas No. 3 and No. 4 coal mines were studied extensively in the Elkhorn area (Kozar and others, 2012), only 7.8 miles from the City of Gary, and are indicative of groundwater flow processes in the Gary area. Kozar and others (2012) found that groundwater flow within the abandoned underground coal mines happens within abandoned mine entries that are often filled with collapsed overburden strata and collapsed coal pillars, forming an aquifer comprised of extensive interconnected abandoned underground coal mine workings. Groundwater flows downdip in these abandoned mine workings and can flow beneath surface-water drainage divides, resulting in inter-basin transfer of groundwater from one surface-watershed to another.
Geology
The geology of the Gary area are sedimentary rocks composed of sandstone, shale, siltstone, mudstone, and prominent coal seams such as the Pocahontas No. 3 and No. 4. Bedrock in the Gary area dips slightly to the northwest (fig. 2) and is composed of interlayered sedimentary rocks of the late Mississippian Princeton Sandstone and Bluestone Formations and younger rocks of the early Pennsylvanian New River and Pocahontas Formations (fig. 3; West Virginia Geological and Economic Survey, 1968; 2025a).
The West Virginia Geological and Economic Survey hosts an online interactive geologic map that presents geologic information of the area (West Virginia Geological and Economic Survey, 2025a). Additionally, the West Virginia Geological and Economic Survey hosts a detailed interactive web service that presents the stratigraphy of the Princeton Sandstone, Bluestone, New River, and Pocahontas Formations and other coal-bearing strata within West Virginia in detail (West Virginia Geological and Economic Survey, 2025b).
The New River Formation is predominantly sandstone, having some shale, siltstone, and coal, but transitions to nearly all sandstone in the subsurface. The formation extends from the base of the Pocahontas No. 8 coal seam to the top of the upper Nuttall Sandstone Member and includes the Iaeger, Sewell, Welch, Raleigh, Beckley, Fire Creek, and Pocahontas Nos. 8 and 9 coal seams (West Virginia Geological and Economic Survey, 1968; 2025a).
The Pocahontas Formation consists of about 50-percent sandstone, and the rest is a mix of shale, siltstone, and coal. This formation extends from the base of the Pennsylvanian System (top of the Mississippian rocks of the Princeton Sandstone and Bluestone Formation) to the base of No. 8 Pocahontas coal seam or unconformity at the base of Pineville Sandstone Member of the New River Formation and includes from bottom upward the Pocahontas coal seams Nos. 1 through 7 (West Virginia Geological and Economic Survey, 1968; 2025a).
The Bluestone Formation comprises mostly red, green, and medium-gray shale and sandstone, and the Princeton Sandstone is underneath. There are no minable coal seams within the Bluestone Formation.
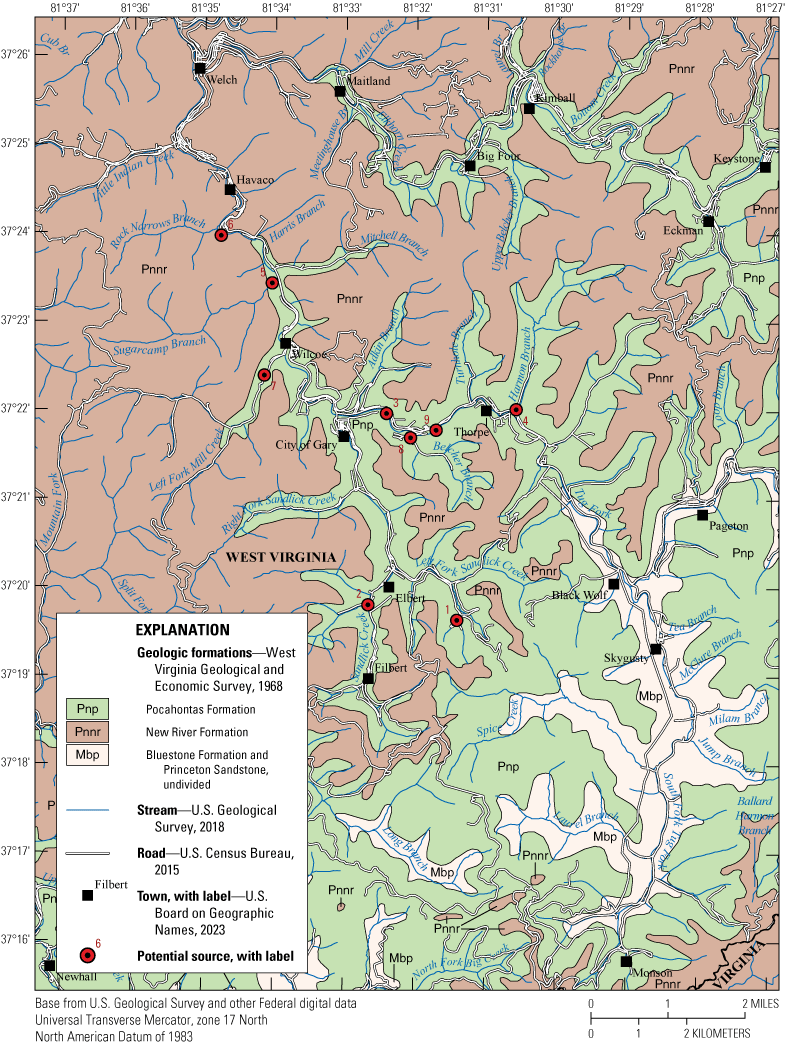
Map showing the geology of the Gary area, McDowell County, West Virginia (Modified from Cardwell and others, 1968).
Coal Mining in the Gary Area
The first known written documented reference of the occurrence of coal in what is now southern West Virginia was made in 1750 by Dr. Thomas Walker, Chief Land Surveyor of the Loyal Company, as part of land surveys of 800,000 acres west of the Allegheny Mountains and north of the North Carolina border in Virginia (Schust, 2005). The first official geological survey of the region was conducted between 1836 and 1842 by Professor William B. Rogers, who was the State Geologist for Virginia at the time (Schust, 2005). The second geological survey covering what are present-day portions of McDowell, Mercer, Wyoming, and Raleigh Counties, W. Va., was overseen by Captain Isaiah Welch in 1873 and included the first geological survey of what would become the Pocahontas coalfields of southern West Virginia (Schust, 2005).
The Pocahontas coalfields of southern West Virginia and southwest Virginia started production when coal was first shipped from Pocahontas, Virginia (Schust, 2005). On December 31, 1901, United States Coal & Coke acquired a lease to 50,000 acres, and the company was incorporated on June 14, 1902 (Schust, 2005). The company would later merge with two other companies to become United States Steel Corporation (U.S. Steel) in 1950. The development of Gary as a coal mining hub began in 1902 when the first annual report for U.S. Steel Corporation, dated December 31, 1902, noted the construction of 3,000 beehive-shaped coking ovens (Schust, 2005) that converted the coal into high-carbon coke for use in steel making. U.S. Steel continued mining operations in the Gary area until 1985, when it closed all active mines or transferred the property to other companies. During the approximately 83-year span of operations, the U.S. Steel operations in the Gary area became the largest coal mining operation in the world, supplying high-grade, low-sulfur coal for U.S. Steel’s plants in the Pittsburgh area and elsewhere (Schust, 2005). The extensive and now abandoned underground coal mines in the Pocahontas No. 3 and No. 4 coal mines of U.S. Steel’s Gary works filled with water over time, creating a vast aquifer containing billions of gallons of high-quality groundwater for public supply in the area (Kozar and others, 2020).
Previous Investigations
Numerous hydrogeologic investigations have taken place in the Gary, W. Va., and the surrounding area. These previous hydrogeologic studies provide information on groundwater-flow processes and the quality of mine-derived groundwater sources in the region.
A study of a similar underground mine system was done for the nearby City of Welch, W. Va. (Ferrell, 1992). Ferrell (1992) found that rates of groundwater withdrawal from the City of Welch’s public supply wells, which are completed in the abandoned underground coal mines in the Pocahontas Nos. 3 and 4 coal seams (fig. 2) of the Exeter mine, ranged from about 1.6 to 1.8 million gallons per day (Mgal/d). The original pumping needed to keep the mines dry during mining was only 1.0 Mgal/d; thus, recharge to the mine had increased since the cessation of mining. Ferrell (1992) estimated that the abandoned mines could contain as much as 3.1 billion gallons of water (3.1×10⁹ gallons) stored in abandoned mines or associated fractures caused by the collapse of mine pillars or overburden strata. Ferrell (1992) noted that the quality of groundwater changed as groundwater levels rose in the abandoned coal mine complex. One notable change attributed to the rise in water level was the reduction in sulfate concentrations. Ferrell (1992) analyzed groundwater obtained from the City of Welch’s well number 3 on four separate occasions. Ferrell (1992) found that iron concentrations ranged from 330 to 1,660 micrograms per liter (µg/L) and had a median concentration of 365 µg/L; all four samples exceeded the 300 µg/L EPA secondary maximum contaminant levels (SMCL) for iron. Ferrell (1992) also found that manganese, another common contaminant in coal-mine waters, ranged from 10 to 110 µg/L and had a median concentration of 18 µg/L; only 1 of the 4 samples collected exceeded the 50 µg/L EPA SMCL. Ferrell (1992) analyzed sulfate in groundwater on three occasions and found concentrations of 122, 91, and 85 milligrams per liter (mg/L), far less than the EPA SMCL of 250 mg/L. Sodium concentrations measured by Ferrell (1992), however, were elevated, and all four sodium samples exceeded the 20 mg/L EPA health-based value (HBV) for individuals on a sodium-restricted diet. All four samples exceeded the EPA SMCL for total dissolved solids (TDS) of 500 mg/L, with maximum and minimum concentrations of 1,390 and 3,040 mg/L, with a median concentration of TDS of 2,480 mg/L.
The USGS completed numerous studies of surface and groundwater hydrology and water quality within coal-mining areas of the Appalachian region of the Eastern United States. The hydrology of Area 13, the eastern coal province of Kentucky, Virginia, and West Virginia, encompasses the drainage area of the Big Sandy River and its tributaries in eastern Kentucky, southwestern Virginia, and southern West Virginia. Kiesler and others (1983) investigated groundwater, surface-water, and coal resources of portions of the Tug Fork, Levisa Fork, Blaine Creek, and Big Sandy River watersheds in West Virginia, Virginia, and Kentucky; Kiesler and others (1983) is the primary publication for the USGS series of coal-hydrology reports for the Gary area and encompasses the Gary area and McDowell County, W. Va. Total dissolved solids concentrations ranged from less than (<)100 mg/L in streams draining undisturbed watersheds to 13,600 mg/L in mined watersheds (Kiesler and others, 1983). Most streams in the region had near-neutral pH, ranging from 7 to 8 standard units. They also found that streams draining areas of extensive mining had sulfate concentrations 18 times greater than streams draining unmined areas. In addition, Kiesler and others (1983) found that annual suspended-sediment yield in streams is related to the type of mining and to the percentage of the basin area disturbed by mining. For example, suspended-sediment yields, where surface-mining predominates within the basin, were found to be as much as 10 times greater than those where underground-mining methods were dominant and as much as 100 times greater than those of an unmined basin.
An assessment of hydrogeologic terrains, well-construction characteristics, groundwater hydraulics, and water-quality and microbial data for the determination of surface-water-influenced groundwater supplies in West Virginia was conducted to assess potential aquifer vulnerability and susceptibility to contamination from the surface (Kozar and Paybins, 2016). Kozar and Paybins (2016) identified abandoned underground coal-mine aquifers, such as the aquifer used by the City of Gary, to be only moderately susceptible and potentially less vulnerable to contamination than other West Virginia aquifers. However, Kozar and Paybins (2016) also found that abandoned underground coal mine aquifers that are derived from mine sources below the elevation of local tributary streams (below drainage) are more susceptible to contamination than abandoned underground coal mine aquifers with mine sources above the elevation of local tributary streams (above drainage) due to the potential for contaminated stream water to recharge underlying abandoned coal mines. The recharge area for the abandoned coal mine aquifer for the City of Gary is largely above local drainage elevation and therefore less susceptible to contamination from surface water than below drainage mine sources such as for the City of Welch, W. Va., which taps the same complex of abandoned underground coal mines but at a location where the coal seams dip below the elevation of tributary streams in the area.
Groundwater quality and geochemistry of West Virginia’s southern coal fields were recently investigated to assess the quality of groundwater upon which many residents of southern West Virginia rely as a source of water (Kozar and others, 2020). Kozar and others (2020) found that water-quality data from 60 different groundwater sites indicated that most waters sampled did not exceed thresholds for most EPA drinking-water standards and USGS health-based screening levels. However, they noted several exceptions, including samples where turbidity exceeded the 5-NTU EPA treatment technique (TT) drinking-water standard in 14 of 60 (23 percent) sites sampled and exceeded the 1-NTU TT standard in 51 of 60 (85 percent) sites sampled. Fourteen of the 60 (23 percent) sites sampled had detections of Escherichia coli (E. coli). Manganese and iron were prevalent contaminants in the groundwater samples collected for the study. Thirty of 60 (50 percent) sites analyzed for manganese and 25 of 60 (42 percent) sites analyzed for iron exceeded the proposed 50- and 300- μg/L SMCL drinking-water standards. Sodium concentrations exceeded the 20-mg/L EPA health-based value (HBV) for individuals on a sodium-restricted diet for blood pressure or other health reasons in 27 of 60 (45 percent) sites sampled.
A borehole geophysical assessment was performed on a well (USGS well Mcd-0226; USGS site 372259081334201; U.S. Geological Survey, 2025a), which is immediately adjacent to the Grapevine Well (Mcd-0109; fig. 2), completed in abandoned mines in the Pocahontas No. 3 coal seam in the Grapevine Hollow of Gary. The well is immediately adjacent (<10 ft) to the city’s current public supply well that provides the source water to the nearby water treatment plant. This well is now being used by a coal mining company, and the well and the City of Gary’s public supply tap the same supply source: a tunnel beneath the Tug Fork River connecting upgradient and downgradient coal mines in the Pocahontas No. 3 and No. 4 coal seams.
Methods of Investigation
Various methods were used to assess potential additional sources of groundwater to augment the existing source-water supply for the City of Gary, including (1) field inventories of potential water-supply sources, (2) measurement of discharge emanating from the potential water-supply sources, (3) water-quality sampling of these potential supply sources, and (4) a borehole geophysical survey of a groundwater well adjacent to the city’s current public supply well and tapping the same source of water as the city’s public supply well.
Field Inventories of Potential Supply Sources
Field inventories were done to locate potential water-supply sources to augment the City of Gary’s existing water supply, which is obtained from a well tapping abandoned underground coal mines in the Pocahontas No. 3 and No. 4 coal seams (fig. 2). Six potential water-supply sources were identified by field reconnaissance mapping of groundwater emanating from abandoned coal mine portals or emanating downstream from multiple such resurgences (sites 1–6, fig. 2). A seventh potential water-supply source, an abandoned air shaft tapping an abandoned underground coal mine about a quarter of a mile south of the City of Gary’s water plant, was also identified as a potential alternate source of water (site 7, fig. 2).
Measurement of Discharge
Discharge measurements were made for mine-outflow streams (sites 1–6, 8, and 9; fig. 2) by making wading measurements using a top-setting wading rod and a USGS-calibrated pygmy flow meter. Streamflow data were collected according to established USGS policies and procedures (Turnipseed and Sauer, 2010) to assess the amount of water that would be available during low-flow periods because that is a limiting factor in whether the site is viable as a potential water source to augment or replace the existing source for the City of Gary. Each of the eight stream channels was divided into segments, and the depth and velocity of each segment were measured; total discharge in each stream channel was a summation of the discharge in the various segments measured. Discharge for the eight sites where flow could be assessed (discharge could not be measured in the abandoned mine air shaft, site 7 on fig. 2) was measured on two separate occasions, from September 20–22, 2023, and again when sites were sampled for water quality, from October 16–October 18, 2023.
Water-Quality Sampling
Water samples were collected from the seven potential water-supply sources over the course of three days, from October 16–18, 2023. These samples were collected (U.S. Geological Survey, 2006) and processed (Wilde, 2002) according to USGS standard protocols. Bacteria were resampled at the abandoned mine air shaft (Mcd-0231) in the Sawmill Hollow area of Gary near Wilcoe, W. Va., on September 18, 2024, because the original bacteria sample collected on October 18, 2023, was over-incubated, and the results were deemed unusable. Water samples were packed in ice-chilled coolers and sent overnight to the USGS National Water Quality Laboratory for analysis of concentrations of common ions, trace metals, nutrients, volatile organic compounds (VOCs), semivolatile organic compounds (SVOCs), and then sent to a USGS contract laboratory for analysis of polychlorinated biphenyls (PCB) concentrations. A list of the constituents analyzed for this study and the constituent’s method reporting limit is shown in table 2 and appendix 1, table 1.1.
All samples were analyzed by the USGS National Water Quality Lab except for PCBs, which were analyzed by RTI Laboratories. Method detection limits and analytical methods for each constituent analyzed are available from the StarLIMS database and appendix 1, table 1.1. StarLIMS is the USGS laboratory information system database and can be queried to access specific information with respect to analytical methods and method detection limits. For query purposes, USGS schedules 4440, 2755, 2750, 2703, lab code 2707, and RTI Laboratories CIN schedule 50666 were analyzed for all samples collected for this study. This database is only accessible to USGS employees, so please contact the USGS Virginia and West Virginia Water Science Center should you require access to this resource.
Mine discharge sources were sampled by placing pre-cleaned sample bottles in the centroid of flow from the mine discharge source and by filling a previously cleansed and decontaminated churn in the centroid of flow for samples requiring filtration. Samples requiring filtration were processed inside a mobile field laboratory to prevent environmental contamination. Water temperature, dissolved oxygen, pH, and specific conductance were measured in the field by placing a calibrated multiparameter sonde in the centroid of flow and waiting for field parameters to stabilize prior to recording measurements. Turbidity was measured on site by collecting a sample of water from the centroid of flow and analyzing the sample on a Hach 2100P field portable turbidimeter.
Water in the abandoned coal mine air shaft (site 7, fig. 2) was sampled using a submersible pump with a Teflon line that was lowered into the air shaft to pump water from the air shaft. Field parameters were measured in a flow-through apparatus connected to the pump discharge line with an in-line multiparameter sonde to prevent contamination by aeration of the sample. Sample collection and processing for bacterial analysis were performed by lowering a pre-cleaned sterile poly-vinyl chloride (PVC) bailer into the air shaft and submerging the bailer several ft below the surface of the water within the air shaft. The bailer was then brought to the surface, and an aliquot of the sample was transferred to a pre-sterilized 100 mL sample bottle.
Table 2.
Constituents and detection limits for major ions, metals, trace elements, nutrients, fecal indicator bacteria, volatile organic compounds (VOCs), semivolatile organic compounds (SVOCs), and polychlorinated biphenyls (PCBs) analyzed in water samples collected from sites in the Gary area, McDowell County, West Virginia.[mg/L, milligrams per liter; μg/L, micrograms per liter; %, percent; μS/cm, microsiemens per centimeter at 25 degrees Celsius; n/a, not applicable; °C, degrees Celsius; MPN/100 mL, most probable number per 100 milliliters of sample]
Bacteria samples were also collected on site, processed within 2 hours of collection, and incubated overnight, according to USGS standard protocols designed for assessment using the Colilert system. Collected water samples were also analyzed for bacteria following standard USGS methods (Myers and others, 2014) and processed using the Colilert system (IDEXX, 2019) according to established methods (American Public Health Association, American Water Works Association, and Water Environment Foundation, 2017). The Colilert system uses a defined substrate liquid-broth medium method for the determination of total coliform bacteria and E. coli. Water samples were collected by filling a pre-sterilized 100-milliliter (mL) sample bottle by immersion in the center of the flow from the potential water-supply source. Bacteria media was then added to the sample bottle and gently swirled to dissolve the media into the sample. Samples for bacterial analysis were then transferred into an IDEXX tray, sealed, and incubated at 35 °C for a period varying from 22 to 26 hours. Bacterial concentrations for E. coli and total coliform bacteria were then determined by examination of the IDEXX trays. Sample cells that were yellow indicated the presence of total coliform bacteria, and cells that glowed blue when examined with an ultraviolet light source were identified as positive for E. Coli bacteria.
Hydrogen sulfide gas odor was detected when site Mcd-0232 (table 1), discharge from two abandoned public supply wells at Havaco, W. Va., (fig. 2) was originally inventoried. Because site Mcd-0232 was the only site of the seven sites sampled for water-quality constituents that had a detectable odor of hydrogen sulfide gas, the site was sampled for hydrogen sulfide using a Hach hydrogen sulfide test kit in addition to being sampled for the full suite of chemical constituents listed in appendix 1. The sample to be analyzed for hydrogen sulfide was collected immediately as it discharged from one of the two abandoned free-flowing artesian public supply wells at that location. This sample was not collected at the same time as the original samples because of sampling errors, but was resampled on October 4, 2024, at flow conditions similar to those when previously sampled on October 16, 2023. Hydrogen sulfide was only measured at Mcd-0232 because the remaining six sites were open to the atmosphere and likely would not have been expected to contain hydrogen sulfide gas because of rapid degassing into the atmosphere. The only site with a noticeable odor of hydrogen sulfide gas was for site Mcd-0232, the discharge from the two abandoned public supply wells at Havaco, W. Va.
Quality Assurance and Quality Control
Two types of quality-assurance and quality-control (QA/QC) samples were collected during the study: a replicate and a field blank. A replicate sample was collected in conjunction with an environmental sample to assess the reproducibility of analytical methods and assess bias that may result from laboratory analysis. The field blank was run to assess any contamination that may result from field sampling methods, to evaluate decontamination procedures between sites, and to detect contamination on sampling equipment during transit to and from the sampling site.
Variability for a replicate sample pair was quantified by calculating the relative percent difference (RPD) of the samples. The RPD was calculated using the following formula (eq.1):
where Concentrations of replicate sample pairs differed by small amounts, typically less than 15 percent of the RPD.Borehole Geophysical Survey
A borehole geophysical survey was completed on a 6-inch diameter unused well (Mcd-0226; fig. 4) that taps the exact same source of water as the Grapevine Hollow well (Mcd-0109) that the City of Gary currently uses as the sole source of water for the city’s water plant. The well (Mcd-0226) is approximately 10 ft from the city’s production well (Mcd-0109) and was logged in July 2018 as part of a previous investigation. Both the city’s production well and the unused smaller diameter well tap a tunnel that connects upgradient abandoned mines with similar downgradient abandoned mines in the Pocahontas No. 3 coal seam on the southeast side of the Tug Fork (river; fig. 2). The tunnel connects the abandoned mines and crosses beneath the Tug Fork (river).
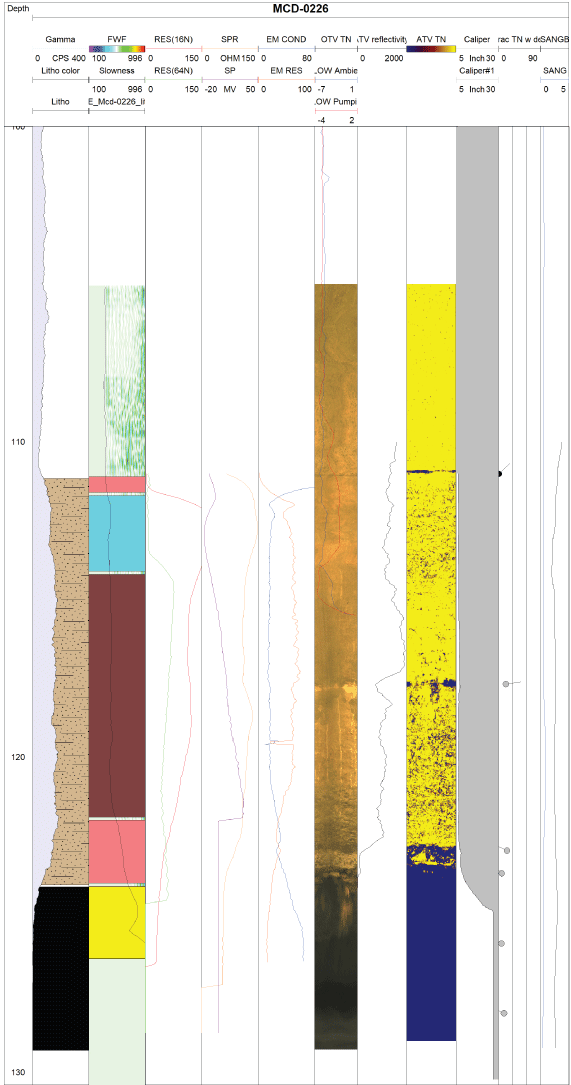
Borehole logs showing the results of a borehole geophysical survey for well Mcd-0226 adjacent to the City of Gary’s current production well in Grapevine Hollow (Mcd-0109), Wilcoe area of Gary, McDowell County, West Virginia.
Various borehole-geophysical tools and methods were used during the borehole geophysical survey (table 3). Century Geophysical tools were used to collect most of the borehole logs for this study. Century Geophysical tools included a mechanical 3-arm caliper, an electromagnetic (EM) induction tool, a multi-parameter E-logging tool, an acoustic televiewer (ATV) tool, an EM flow-meter tool, and a full wave sonic waveform tool. The only exception to the use of Century Geophysical tools was an optical televiewer (OTV) obtained from Mount Sopris Instruments. All borehole geophysical tools were lowered into selected wells using a Century Geophysical 700M draw works winch and cable system. Data from the Century Geophysical logging tools were collected and processed into a computer via a Century Geophysical System VI borehole processing module and the associated Century Geophysical Log VI version 3.60Q software (Century Geophysical, LLC, 2025). The Mount Sopris optical televiewer utilized the same Century 700 M draw works, but data were collected using a Mount Sopris Matrix Geophysical Logging System with associated ALT Logger Suite software (Advanced Logics Technology, 2025).
Table 3.
Descriptions of the various borehole logging tools used for the statewide assessment of fractured-rock aquifers in West Virginia and their primary function.[Modified from Keys (1990). ATV, acoustic televiewer; OTV, optical televiewer; EM, electromagnetic]
| Type of borehole-geophysical log | Description and application |
|---|---|
| Caliper log | Mechanical calipers with spring-loaded arms record the borehole diameter and with change in depth. Acoustic calipers calculate the distance to the borehole wall for the travel time of an acoustic signal from an ATV (Keys, 1990). These caliper logs are then used in conjunction with ATV, OTV, fluid resistivity, fluid temperature, and heat-pulse flowmeter logs to identify fractures or flow zones in the borehole. |
| Natural gamma log | The natural gamma log records the total gamma radiation emitted by rocks surrounding the borehole (Keys, 1990). Clay minerals within rocks may be indicated by elevated gamma responses. Gamma logs are commonly used for lithologic correlations. A primary use of gamma logs for this study was in identifying shale bedrock units. |
| Fluid-resistivity log | The fluid-resistivity log records the electrical resistivity of water in a borehole and is related to its dissolved solids concentration (Williams and Conger, 1990). Logs are collected under pumping and ambient conditions to identify zones where water moves into and out of the borehole. |
| Fluid-temperature log | The fluid-temperature log records the water temperature in the borehole as a function of depth. Temperature contrasts, if present, provide information to support water movement into or out of the borehole at discrete fracture zones (Keys, 1990). |
| Electromagnetic flowmeter log | The EM-flowmeter log is used in the environmental and hydrology industries to measure fluid movement in a borehole. The instrument measures flow rates using the principle of Faraday's law of induction. The downhole probe consists of an electromagnet and two electrodes located 180 degrees apart and 90 degrees to the magnetic field inside of a hollow cylinder. The voltage induced by a conductor moving at right angles through the magnetic field is directly proportional to the velocity of the conductor (water) through the field. The tool can measure low-velocity flow rates down to less than 50 ml/min and higher velocity flow rates to 40 liters/min through the tool's 1-inch inside diameter sensor used to determine which fractures are accepting or contributing water to the borehole under pumping and non-pumping conditions (Century Geophysical, LLC, 2025). |
| Spontaneous-potential log | The spontaneous-potential log records the naturally occurring electrical potential differences along the borehole wall and is used to identify changes in lithology and bed thickness (Keys, 1990). |
| EM induction log | The electromagnetic induction log records the electrical conductivity of the rocks and water surrounding the borehole. Induction logs are used for lithologic interpretations and in delineations of porosity and dissolved-solid concentrations of water in the rock matrix (Williams and others, 1993). |
| Acoustic televiewer log | The acoustic televiewer log provides high resolution, magnetically oriented, 360° image of acoustic energy reflection and travel time. Fractures of greater than 0.1 in. can be detected and their orientation determined on ATV images (Keys, 1990). |
| Optical televiewer log | The optical televiewer provides high-resolution 360° optical image of the borehole (Williams and Lane, 1998). The OTV log can be used to produce a virtual core to permit visualization of fractures as they are found in the borehole. Fracture apertures and orientation can be determined from OTV logs. |
| Full-wave sonic porosity log | Sonic-logging methods can either measure (1) seismic-wave transmission (that is, sonic, acoustic, acoustic waveform, and full-waveform sonic), (2) cement bonding, or (3) acoustic reflections via acoustic televiewer logging. Sonic-logging tools mainly consider how seismic waves propagate through formations to estimate porosity, saturation, and (or) identify fluid-filled or potentially transmissive fractures. |
Statistical and Graphical Analysis
Statistical analyses were computed using SAS-JMP (JMP Statistical Discovery LLC, 2022), a statistical software package. Statistical analyses include preparing data tables, summary tables, and summary statistics that include evaluations of mean, median, maximum, minimum, quantile, and standard deviations of available data.
The nature of data collected for this study cannot be effectively analyzed with bivariate statistical methods, such as linear regression, or multivariate statistical analysis, such as principal components analysis, due to the small sample size (n=7). Graphical analyses including boxplots and trilinear diagrams (Piper plots) were therefore the primary statistical analyses utilized to summarize the water-quality data collected for the seven sites sampled for the project and were created using SAS-JMP (JMP Statistical Discovery LLC, 2022).
Results
Borehole Geophysics
Results of the borehole geophysical survey on well Mcd-0226 (immediately adjacent to the city’s Grapevine Well [Mcd-0109]), fig. 2) indicate the well is cased to a depth of approximately 111 ft below land surface and has an open interval of approximately 5 ft within the tunnel at the bottom of the well. Also, four low-angle fractures are present in the well at depths of approximately 111, 117, 123, and 124 ft. The lithology of the overburden strata is argillaceous sandstone. The open void in the tunnel is clearly visible in the optical televiewer image. Since the well was logged on July 9, 2018, a pump has been installed in the well, and as of January 7, 2024, two wells are withdrawing water from the tunnel: the City of Gary’s production well and the well currently being pumped as a source of water for a nearby mining operation. Whether the two wells pumping near one another are affecting turbidity levels in the City of Gary’s water supply is undetermined at the time of this writing.
Measured Discharge
Discharge for mine-discharge sites 1–6 (fig. 2) was measured on two separate occasions during the period of initial site reconnaissance between September 20 and 22 and then again during the period when the sites were sampled for water quality between October 16 and 18. Sites 8 and 9 were measured only once during initial site reconnaissance. All discharge data are summarized in table 1, and sites measured are shown in figure 2. Measured discharges ranged between 0.082 for site 5, the tributary below the mine discharge sites at Havaco, W. Va., to a maximum value of 3.685 ft3/s for site 6, Mcd-0232—the discharge from two abandoned public supply water wells near Havaco, W. Va. Of the six sites measured, only two, site 4, Harmon Branch at Thorpe, W. Va., and site 6, Mcd-0232 the discharge from two abandoned public supply water wells near Havaco, W. Va., had flow in excess of 1.0 ft3/s. Discharge in the abandoned underground mine air shaft (site 7, fig. 2) could not be assessed, but the air shaft drains an abandoned mine that likely contains water stored in approximately 1.7 square miles (mi2) of abandoned underground coal mines in the Pocahontas No. 3 coal seam, and possibly an additional 0.9 mi2 of leakage from the overlying Pocahontas No. 4 coal seam.
Flow-duration statistics were calculated for the Tug Fork downstream of Elkhorn Creek at Welch, W. Va., streamgage (USGS site 03212750; U.S. Geological Survey, 2025a) using the percentiles function in Microsoft Excel and daily mean discharges for the period of record dating from January 29, 1985, through October 18, 2023, and were used to assess the flow duration respective of when the sites were measured. Discharges for the six study sites were measured between September 20, 2023, and October 18, 2023, and corresponded to the 12th to the 15th percentiles of flow duration for the Tug Fork downstream of Elkhorn Creek at Welch, W. Va., streamgage (USGS site 03212750) for these periods. Thus, the discharge measurements are respective of low to very-low streamflow and corresponding groundwater storage from which streamflow is based during baseflow conditions similar to during the study.
Water-Quality Results
Water-quality data for the seven sites sampled for this study are discussed with respect to several criteria. Information about the seven sites sampled, including the 15-digit USGS site identification number, local site number, station name, and other site data are presented in table 1, and the sites sampled are shown on figure 2. First, gathering quality-assurance (QA) data is a best practice for assessing the quality of the data on which data summaries and analyses are based. Second, the water-quality data are discussed in relation to drinking water standards (U.S. Environmental Protection Agency, 2025), because in addition to discharge from the potential sites, the other primary consideration for selecting a potential alternate source of water is the overall quality of water from the source. Finally, the water-quality data are discussed with respect to the geochemical controls on the quality of the water. Results of the water-quality analyses for the 7 sites sampled are presented in appendix 2.
Quality Assurance Results
Analyte concentrations of replicate sample pairs typically differed by small amounts for the 35 inorganic contaminants analyzed (common ions, trace metals, nutrients, and pH). Only 4 of the 35 constituents analyzed had an RPD exceeding 2.8 percent. The few constituents that exceeded the 2.8-percent RPD threshold were for concentrations just above the method detection limit (refer to table 2). There was some variability between replicate pairs for manganese (RPD of 9.4 percent), nickel (RPD of 8.2 percent), fluoride (RPD of 8.8 percent), and pH (RPD of 6.4 percent). The RPD for pH was anticipated because pH of a sample will vary between the time the sample was collected and the time the sample was processed in the laboratory. The RPD for nickel and fluoride (8.2 and 8.8 percent, respectively) was likely due to the extremely low concentrations of nickel and fluoride in the environmental and replicate samples. The environmental and replicate concentrations for fluoride were 0.184 and 0.201 mg/L, respectively; the environmental and replicate concentrations for nickel were 0.881 and 0.812 µg/L, respectively. Therefore, QA/QC analyses did not indicate any bias in laboratory sampling methods for any constituent other than manganese. Even for manganese, the RPD of 9.4 percent was acceptable. The environmental and replicate concentrations for manganese were 271 and 297 mg/L, respectively. Relative percent differences were not calculated for any of the PCBs, VOCs, or SVOCs analyzed because constituent concentrations were all less than the method detection limit. Overall, the replicate and blank data did not indicate any significant bias with either field methods or laboratory analytical methods.
Field-blank values for one sample were less than the method detection limit for all 187 constituents analyzed, and there were no detections of any common ions, trace metals, PCBs, VOCs, or SVOCs (Data available on request from the USGS Virginia and West Virginia Water Science Center). These results indicate that field collection and processing procedures for samples and decontaminating equipment between sites were adequate to prevent cross-contamination of the environmental samples collected for the study.
Groundwater Quality in Relation to Drinking Water Standards
Although the mine discharge sources sampled for this study are unregulated, water-quality data collected for this study are related to EPA drinking-water standards and USGS health-based screening levels (HBSLs; tables 4 and 5; U.S. Geological Survey, 2025b) to document the quality of groundwater that may serve as an alternate supply source for the City of Gary. These criteria provide the city, county, and State water-resources managers with valuable information on constituents that may be problematic for use as a supply source because of elevated concentrations of certain constituents that may require additional treatment in addition to the treatment costs already incurred by the City of Gary. A central premise of this study was the goal of locating an alternate supply of water that could augment the City of Gary’s current water supply source and, by blending water from the two supply sources, could reduce treatment costs incurred by the treatment facility.
Of the 203 constituents analyzed, only a few exceeded applicable EPA drinking water standards (table 4; U.S. Environmental Protection Agency, 2025). Table 6 summarizes the maximum, minimum, mean, and median concentrations and the standard deviation for all the significant constituents analyzed in the water samples collected for the seven mine sources. Iron exceeded the 300 µg/L secondary maximum contaminant level (SMCL) at only one of the seven sites (14.3 percent) sampled. Iron concentrations ranged from a minimum of <5 µg/L to a maximum of 724 µg/L with a median concentration of 7.62 µg/L. Manganese exceeded the 50 µg/L SMCL at two of the seven sites (28.6 percent) sampled. Manganese concentrations ranged from a minimum of 1.93 µg/L to a maximum of 271 µg/L with a median concentration of 4.03 µg/L. For arsenic, none of the sites sampled (0 percent) exceeded the maximum contaminant level (MCL) of 10 µg/L. Arsenic concentrations ranged from a minimum of <0.100 µg/L to a maximum of 2.35 µg/L with a median arsenic concentration of 0.20 µg/L. None of the seven sites sampled (0 percent) for selenium exceeded the EPA MCL of 50 µg/L. Selenium concentrations ranged from a minimum of <0.05 µg/L to a maximum of 5.26 µg/L with a median concentration of 3.21 µg/L. All seven sites were sampled for volatile organic compounds (VOCs), SVOCs, and polychlorinated biphenyls (PCBs), but most were not detected. Of the 10 PCB compounds analyzed for the seven sites sampled, none (0 percent) contained detectable concentrations of PCBs or Aroclor compounds. Of the 44 SVOCs analyzed from the seven sites sampled, only 1 SVOC, acenaphthene, was detected at a concentration of 0.020 µg/L. Of the 96 volatile organic compounds analyzed from the seven sites sampled, only two were found at detectable concentrations. Trichloromethane was detected at a concentration of 0.027 µg/L but did not exceed the 0.08 µg/L MCL for total trihalomethanes. Benzene was detected at four of the seven sites (57.1 percent) sampled, at concentrations of 0.021, 0.028, 0.029, and 0.035 µg/L, but none exceeded the EPA MCL for benzene of 5 µg/L.
Table 4.
Constituents with detectable concentrations and their respective U.S. Environmental Protection Agency drinking water standards or U.S. Geological Survey health-based screening levels for the seven sites sampled within the Gary area, McDowell County, West Virginia.[Data are from the U.S. Environmental Protection Agency (2025) and the U.S. Geological Survey (2025b). EPA, U.S. Environmental Protection Agency; SMCL, Secondary maximum contaminant level; MCLG, maximum contaminant level goal; MCL, maximum contaminant level; TT, treatment technique; HBV, health-based value; DWEL, drinking-water equivalent level; kg, kilogram; HAL, health advisory level; USGS, U.S. Geological Survey; HBSL, health-based screening levels; std, standard; —, no applicable standards for that constituent from the respective agency; NTU, nephelometric turbidity units; mg/L, milligrams per liter; N, nitrogen; E. coli, Escherichia coli; MPN, most probable number; mL, milliliters; μg/L, micrograms per liter]
For systems that use conventional or direct filtration, at no time can turbidity (cloudiness of water) go higher than 1 NTU, and samples for turbidity must be less than or equal to 0.3 NTUs in at least 95 percent of the samples in any month. Systems that use filtration other than the conventional or direct filtration must follow State limits, which must include turbidity at no time exceeding 5 NTUs.
There are no drinking water standards for hydrogen sulfide gas, but the odor threshold that the human nose can detect is 0.05 mg/L.
For public water systems, no more than 5.0 percent of samples can be total coliform-positive (TC-positive) in a month. (For water systems that collect fewer than 40 routine samples per month, no more than one sample can be TC-positive per month.) Every sample that has total coliform must be analyzed for either fecal coliforms or E. coli. If a water system has two consecutive TC-positive samples, and one is also positive for E.coli fecal coliforms, the system has an acute MCL violation.
Lead and copper are regulated by a treatment technique that requires systems to control the corrosiveness of their water. If more than 10 percent of tap water samples exceed the action level, water systems must take additional steps. For copper, the action level is 1,300 μg/L, and for lead it is 15 μg/L.
Table 5.
Constituents with detectable concentrations that exceeded their respective U.S. Environmental Protection Agency drinking water standards or U.S. Geological Survey health-based screening levels for the seven sites sampled within the Gary area, McDowell County, West Virginia.[Data are from the U.S. Environmental Protection Agency (2025) and the U.S. Geological Survey (2025b). EPA, U.S. Environmental Protection Agency; SMCL, Secondary maximum contaminant level; MCLG, maximum contaminant level goal; MCL, maximum contaminant level; TT, treatment technique; HBV, health-based value; DWEL, drinking-water equivalent level; kg, kilogram; HAL, health advisory level ; HBSL, health-based screening level; %, percent; ; std, standard; —, no applicable standards for that constituent from the respective agency; NTU, nephelometric turbidity units; TDS, total dissolved solids; mg/L, milligrams per liter; N, nitrogen; E. coli, Escherichia coli; MPN, most probable number; mL, milliliters; μg/L, micrograms per liter]
For systems that use conventional or direct filtration, at no time can turbidity (cloudiness of water) go higher than 1 Nephelometric Turbidity Unit (NTU), and samples for turbidity must be less than or equal to 0.3 NTUs in at least 95 percent of the samples in any month. Systems that use filtration other than the conventional or direct filtration must follow State limits, which must include turbidity at no time exceeding 5 NTUs.
There are no drinking water standards for hydrogen sulfide gas, but the odor threshold that the human nose can detect is 0.05 mg/L.
For public water systems, no more than 5.0 percent of samples can be total coliform-positive (TC-positive) in a month. (For water systems that collect fewer than 40 routine samples per month, no more than one sample can be total coliform-positive per month.) Every sample that has total coliform must be analyzed for either fecal coliforms or E. coli if two consecutive TC-positive samples, and one is also positive for E.coli fecal coliforms, system has an acute MCL violation.
Lead and copper are regulated by a treatment technique that requires systems to control the corrosiveness of their water. If more than 10 percent of tap water samples exceed the action level, water systems must take additional steps. For copper, the action level is 1,300 μg/L, and for lead is 15 μg/L.
Table 6.
Statistical summary of field parameter, nutrient, common ion, and trace metal data for the seven coal-mine sources sampled within the Gary area, McDowell County, West Virginia.[Data are from appendix 2. deg C, degree Celsius; uncorr., uncorrected; mmHg, millimeters of mercury; unfltd, unfiltered; °C, degree Celsius; µS/cm, microsiemens per centimeter; mg/L; milligram per liter; %, percent; std, standard; CaCO3, calcium carbonate; fltd, filtered; titr, titration; CO3, carbon trioxide; HCO3, bicarbonate; MPN, most probable number; DSTM, defined substrate test method; mL, milliliters; det, detector; mult, multiple; ang, angle; incl, included; NTRU, nephelometric turbidity ratio unit; N, nitrogen; P, phosphorus; µg/L, microgram per liter]
Total coliform bacteria are ubiquitous in the environment, and their presence only suggests the potential for contamination by near-surface processes. Escherichia coli (E. Coli) bacteria, however, are derived from either human or animal fecal material and can be an indicator of potential contamination by pathogenic bacteria or viruses. Total coliform bacteria were detected at all 7 (100 percent) sites sampled with concentrations ranging from 17.5 to greater than (>) 2,420 most probable number per 100 mL of sample (MPN/100 mL), and a median total coliform concentration of 1,553 MPN/100 mL. Escherichia coli (E. Coli) bacteria were detected at 4 of the 7 (57.1 percent) sites sampled at concentrations ranging from <1 to 11.9 MPN/100 mL of sample, and a median E. coli concentration of 5.1 MPN/100 mL.
Geochemical Controls on Groundwater Quality
Overall, the water from five of the seven coal mine sources was of a calcium sulfate type (fig. 5), and the water from the two remaining sites was of a sodium and potassium sulfate type. Sulfate was by far the dominant anion for all seven sites sampled; calcium, magnesium, and sodium were dominant cations for the seven sites sampled. For one site, site Mcd-0232, the discharge from two older abandoned public supply wells at Havaco, W. Va., the dominant anion in the sample was sodium, not calcium and magnesium as was typical for the remaining six sites sampled (fig. 5). Boxplots showing the distribution of overall constituent concentrations for the more common ions are shown in figure 6. The boxplots also show that nitrate plus nitrite is found in very low concentrations within the study area, which is typical for above drainage underground coal mine aquifers of the southern West Virginia coalfields, corresponding to a lack of agriculture or other sources of nitrate within the region (Kozar and others, 2012; 2020).
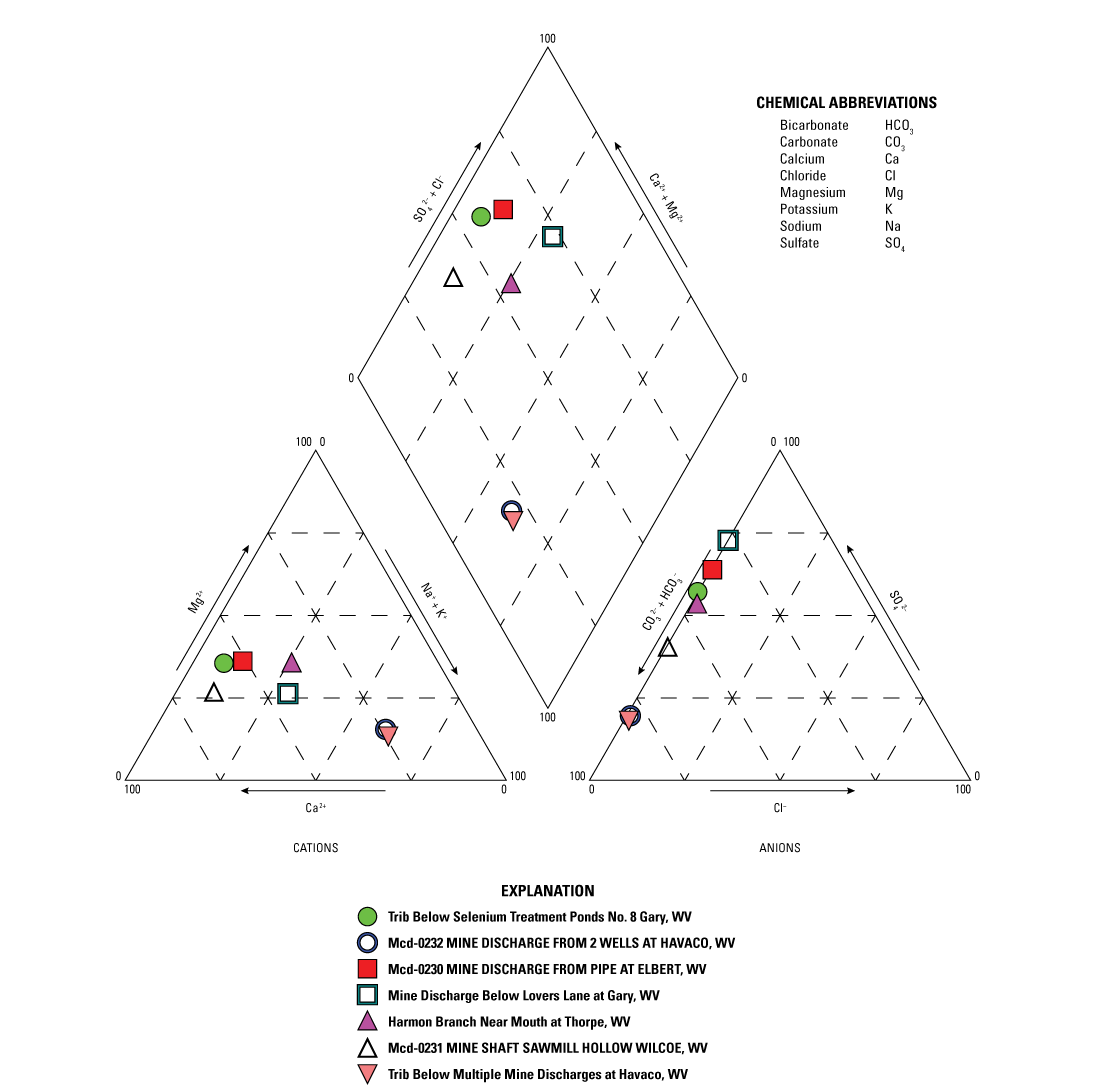
Piper diagram showing major water composition of the various mine groundwater sources sampled in the Gary area, McDowell County, West Virginia. Please refer to table 1 for additional site information. Trib, tributary; No., number; WV, West Virginia.
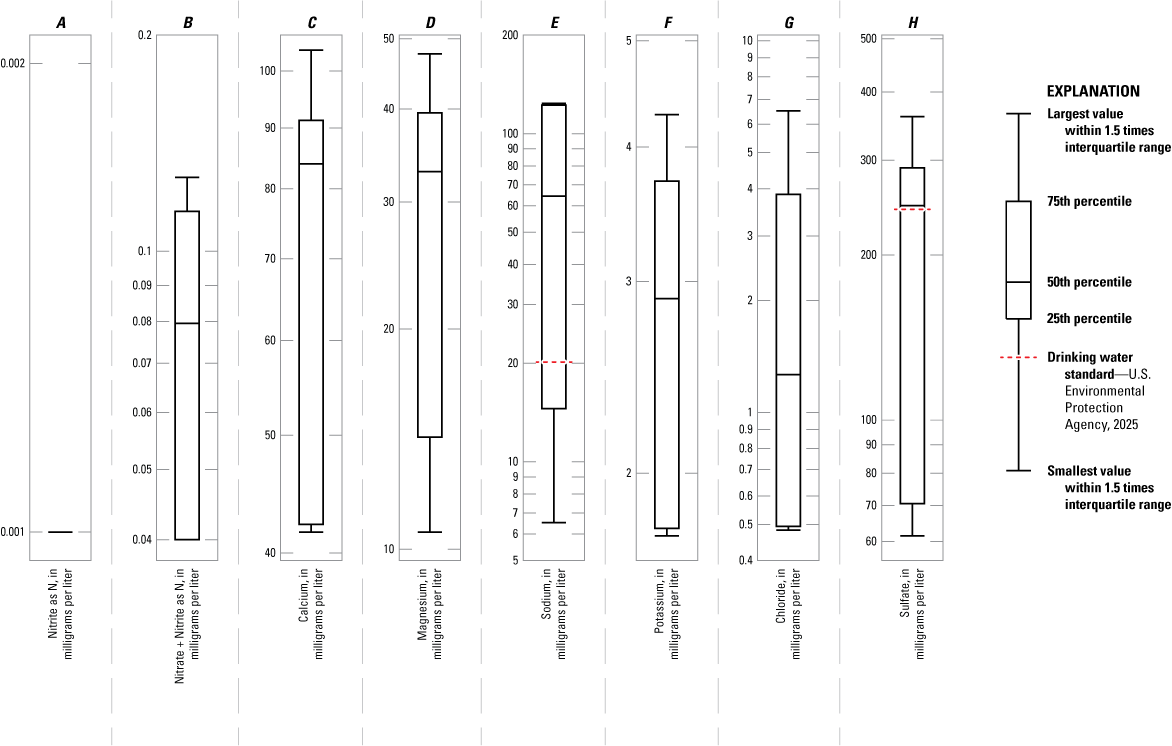
Boxplots showing the distribution of common ions for seven sites sampled in the Gary area, McDowell County, West Virginia. A, Nitrate as N (nitrogen), B, Nitrate + nitrite as N , C, Calcium, D, Magnesium, E, Sodium, F, Potassium, G, Chloride, and H, Sulfate.
Abandoned underground coal-mine aquifers in the coalfields of southern West Virginia typically have low concentrations of iron, and this is shown in a boxplot of trace metal concentrations for the seven sites sampled (fig. 7). The EPA SMCL for iron is 300 µg/L, and only site Mcd-0232, the discharge from two public supply wells at Havaco, W. Va., had a concentration (724 µg/L) exceeding the SMCL. Site Mcd-0232 emanates from within the abandoned underground mines in the Pocahontas No. 3 and No. 4 coal seams. The water emanating from this source is typified by low-oxygen-reducing conditions. Thus, high concentrations of iron are to be expected because the water emanating from the source lacks sufficient oxygen to precipitate metals, resulting in elevated concentrations of iron and manganese. Water samples from this site were collected downstream from the discharge site, so the dissolved oxygen value for the sample locations is not indicative of the low-oxygen environment present within the abandoned underground coal mines from which the source emanates. Aeration of the water discharging from the wells causes iron to precipitate in the water discharging to the Tug Fork. The aerated water exceeds the 300 µg/L SMCL and causes iron staining of the stream bed and the well pad adjacent to the Norfolk Southern railroad tracks, which are immediately adjacent to the wells.
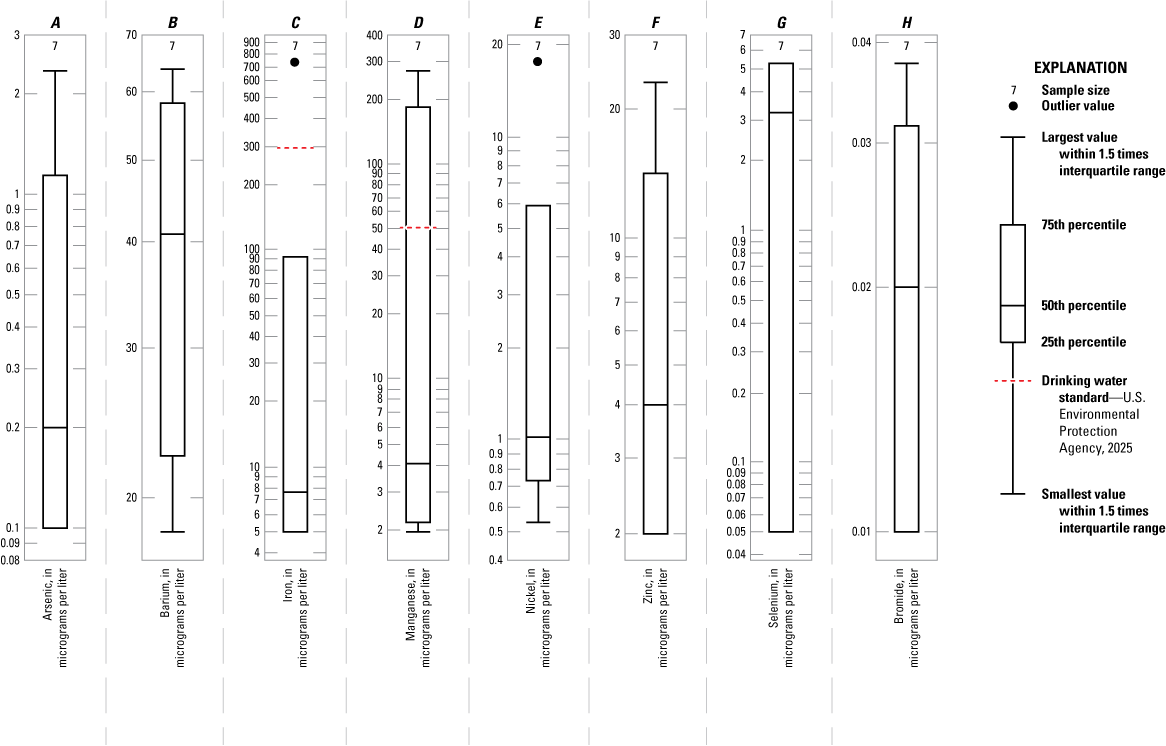
Boxplots showing the distribution of metals for sites one through seven sampled in the Gary area, McDowell County, West Virginia. A, Arsenic, B, Barium, C, Iron, D, Manganese, E, Nickel, F, Zinc, G, Selenium, and H, Bromide.
The same redox processes controlling iron concentrations in the water from the seven sites sampled also control concentrations of manganese (fig. 7). Two of the seven sites sampled contained concentrations of manganese that exceeded the 50 µg/L SMCL. As was the case for iron, site Mcd-0232, discharge from the two public supply wells at Havaco, also contained the highest concentration of manganese of the seven sites sampled (271 µg/L). The tributary below multiple mine discharges at Havaco, W. Va., also contained a manganese concentration (185 µg/L) that exceeded the 50 µg/L EPA secondary maximum contaminant level (SMCL) drinking water standard (U.S. Environmental Protection Agency, 2025). Both site Mcd-0232, the discharge from two public supply wells at Havaco, W. Va., and the tributary below multiple mine discharges at Havaco, W. Va., are in areas where the Pocahontas No. 3 and No. 4 coal seams are at or below the base level of tributary streams in the area, thus representing below drainage mine sites, whereas the other five sites sampled are representative of above drainage mine discharge sources. The difference between above and below drainage underground coal mine sources is a controlling factor with regard to dissolved oxygen and associated redox processes for the abandoned underground coal mine aquifers in the Gary area, McDowell County, W. Va.
Another controlling factor is carbonate buffering capacity. Bedrock in the Pocahontas and New River Formations tends to have high carbonate content, which may buffer the water to some extent (Kozar and others, 2012, 2020). Median alkalinity for the mine sources sampled was 194 mg/L. Even though iron and sulfate concentrations can be elevated (mean concentrations of 123 µg/L and 197 mg/L, respectively), mean pH for the seven mine sources sampled was 7.32 standard units, indicating a water that is not all acidic but somewhat alkaline (fig. 8). As a result, acid mine drainage in the coalfields of southern West Virginia is not common, and water emanating from the Pocahontas No. 3 and No. 4 coal seams is commonly used as a source of water for public and residential supply in southern West Virginia.
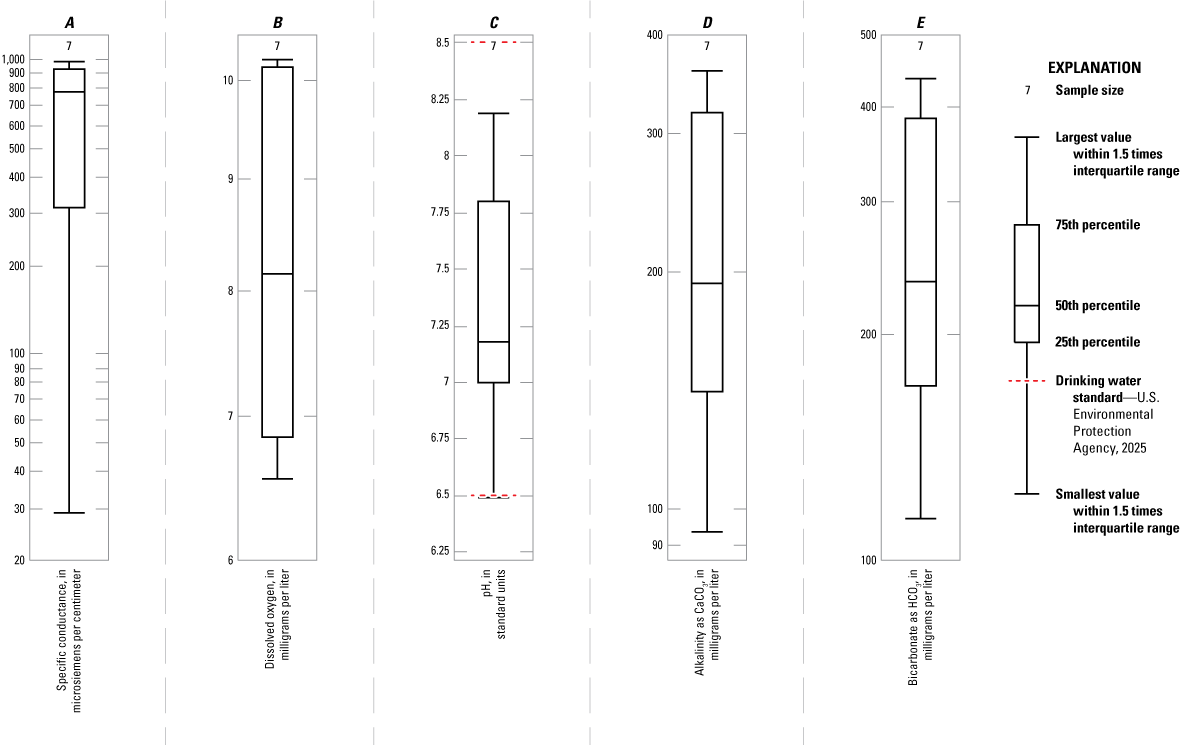
Boxplots showing the distribution of field-determined constituents for seven sites sampled in the Gary area, McDowell County, West Virginia. A, Specific conductance, B, Dissolved oxygen, C, pH, D, Alkalinity as CaCO3 (calcium carbonate), and E, Bicarbonate as HCO3 (bicarbonate).
Total dissolved solids concentrations for six of the seven mine sources sampled were moderate, median TDS concentration of 515 mg/L, and site (Mcd-0232), the site emanating from the two abandoned public supply wells at Havaco, had a moderate TDS concentration of 494 mg/L. Site Mcd-0232 differs from the other six sites sampled in one important aspect: geochemistry. Site Mcd-0232 emanates from deep abandoned underground coal mines where oxygen content is typically low, thus resulting in reducing conditions that can liberate minerals from source rock or coal seams, resulting in high concentrations of dissolved constituents (Kozar and others, 2012; 2020). Concentrations of iron, manganese, arsenic, silica, fluoride, chloride, and sodium were all much higher for site Mcd-0232 than the other six mine sources sampled. Sulfate concentrations were correspondingly the lowest at site Mcd-0232 of the seven mine sources sampled, also likely due to reducing conditions in the abandoned underground coal mine from which site Mcd-0232 is derived.
Nutrients such as nitrate, nitrite, total ammonia, total nitrogen, and orthophosphate were low in all seven mine sources sampled, generally less than the laboratory method detection limit (app. 1, table 1.1). The median nitrate + nitrite concentration was 0.080 mg/L because there is no agricultural activity in the study area, and the seven coal-mine sources were not in proximity or in connection with potentially sewage-affected discharge present in the Tug Fork (river).
The remaining factor to consider is the distance from the existing plant to the various potential supply sources. While the discharge and quality of water for each of the potential supply sources are important factors to consider, distance to the supply sources is also an important factor to consider, given the increased cost for installing pipelines from potential supply sources to the existing water plant. The mine shaft at Sawmill Hollow at Wilcoe, W. Va. (Mcd-0231) is closest to the water treatment plant, which is approximately 0.50 mi from the plant. For the remaining six potential supply sources, distances vary from 1.11 to 5.28 miles from the existing water plant for the City of Gary, W. Va. A long-term aquifer test would be needed to assess the viability of the mine shaft site (Mcd-0231) as an alternate source of water to augment or replace the existing Grapevine well the City of Gary currently uses as its sole supply source.
Summary
U.S. Geological Survey (USGS) personnel completed an extensive inventory of potential water sources that may serve as an alternate source or be used to augment the existing supply source from the public supply well that the City of Gary, West Virginia (W. Va.), relies on as a sole source water supply for its water treatment plant. The USGS identified seven potential sources of water, consisting of free-flowing discharge of water from abandoned mines at six locations and one abandoned underground mine air shaft, which were sampled for chemical analysis to assess the quality of groundwater emanating from the seven coal-mine sources. The six free-flowing mine discharge sources were also assessed for discharge by current meter measurements on two separate occasions. These seven sources were assessed to provide information to the City of Gary and the city’s consulting engineer about groundwater-quality and discharge data to help them assess the seven sites as potential alternate sources of water for the City of Gary to augment or replace its existing supply.
With respect to discharge or the flow rate of water emanating from the potential water sources, discharge ranged from a minimum of 0.082 cubic feet per second (ft3/s) to a maximum of 3.685 ft3/s for the six sites where discharge could be measured. However, only two of the potential supply sources, Harmon Branch at Thorpe, W. Va. and the two abandoned public-supply water wells near Havaco, W. Va., had discharge in excess of 1.00 ft3/s. The discharge for the remaining four potential supply sources that could be measured was minimal, with the maximum measured discharge being only 0.366 ft3/s. Discharge from the two abandoned public supply wells was 3.685 ft3/s on September 20, 2023, and 2.888 ft3/s on October 16, 2023, and discharge from Harmon Branch at Thorpe, W. Va. was 1.049 ft3/s on September 22, 2023, and 1.038 ft3/s on October 17, 2023. Discharge in the abandoned underground mine air shaft could not be assessed, but the abandoned mine likely contains water stored in approximately 1.7 square miles (mi2) of abandoned underground coal mines in the Pocahontas Number (No.) 3 coal seam, and possibly an additional 0.9 mi2 of leakage from the overlying Pocahontas No. 4 coal seam. Discharge measurements for the six study sites were made during low flow conditions as inferred from flow-duration statistics calculated at the USGS Tug Fork downstream of Elkhorn Creek at Welch, W. Va., streamgage (USGS site 03212750) and corresponded to the 12th to 15th percentile of measured flow at the streamgage.
With respect to the quality of water for the seven potential water sources, four of the potential sources had total dissolved solids (TDS) concentrations that exceeded the U.S. Environmental Protection Agency (EPA) secondary maximum contaminant level (SMCL) of 500 milligrams per liter (mg/L). Of the remaining three sites, two had concentrations less than but close to the 500 mg/L TDS SMCL. The mine discharge from the two wells at Havaco, W. Va. (Mcd-0232) and the tributary below multiple mine discharges at Havaco, W. Va. had TDS concentrations of 494 and 471 mg/L, respectively. However, the mine shaft at Sawmill Hollow in Wilcoe, W. Va. (Mcd-0231) had a much lower TDS concentration at 180 mg/L. Sulfate concentrations exceeded the 250 mg/L EPA SMCL at three of the seven potential sources sampled and were near the SMCL at a fourth site, with a minimum concentration of 247 mg/L. Only three of the seven potential sources had acceptable concentrations of sulfate: the mine discharge from the two wells at Havaco, W. Va. (Mcd-0232), the mine shaft at Sawmill Hollow at Wilcoe, W. Va. (Mcd-0231), and the tributary below multiple mine discharges at Havaco, W. Va., with concentrations of 83.6, 61.7, and 70.3 mg/L, respectively. Sodium concentrations exceeded the 20 mg/L EPA health-based value (HBV) at all but two of the seven sources sampled. Sodium concentrations were 14.5 mg/L at the tributary below the selenium treatment ponds at site 8, Gary, W. Va. and 6.49 mg/L at the mine shaft at Sawmill Hollow in Wilcoe, W. Va. Iron concentrations were all within acceptable EPA SMCL limits for all sites sampled except the mine discharge from the two wells at Havaco, W. Va. (Mcd-0232), which had an iron concentration of 724 micrograms per liter (µg/L), far exceeding the 300 µg/L EPA SMCL for iron. Two sites exceeded the 50 µg/L SMCL for manganese. The mine discharge from the two wells at Havaco, W. Va. (Mcd-0232) had a manganese concentration of 271 µg/L, and the tributary below multiple mine discharges at Havaco, W. Va. had a manganese concentration of 185 µg/L. The remaining five sites all had concentrations of manganese less than 4.65 µg/L. The only site that did not have any constituent concentrations exceeding an EPA maximum contaminant level (MCL), SMCL, HBV, or drinking-water equivalent level (DWEL) was the mine shaft at Sawmill Hollow at Wilcoe, W. Va. (Mcd-0231), but the site had a low level of turbidity of 2.89 nephelometric turbidity units (NTU).
While the discharge and quality of water for each of the potential supply sources are important factors to consider, distance to the supply sources is also an important factor to consider, given the increased cost for installing pipelines from potential supply sources to the existing water plant. The mine shaft at Sawmill Hollow at Wilcoe, W. Va. (Mcd-0231) is closest to the water treatment plant, which is approximately 0.50 mi from the plant. For the remaining six potential supply sources, distances vary from 1.11 to 5.28 miles from the existing water plant for the City of Gary, W. Va. A long-term aquifer test would be needed to assess the viability of the mine shaft site (Mcd-0231) as an alternate source of water to augment or replace the existing Grapevine well the City of Gary currently uses as its sole supply source.
References Cited
Advanced Logics Technology, 2025, Home: Advanced Logic Technology (ALT) website, accessed January 7, 2025, at https://www.alt.lu.
American Public Health Association, American Water Works Association, Water Environment Foundation, 2017, 9223 enzyme substrate coliform test in Lipps, W.C., Baxter, T.E., and Braun-Howland, E., eds., Standard methods for the examination of water and wastewater: Washington, D.C., American Public Health Association Press, accessed February 5, 2018, at https://www.standardmethods.org/doi/10.2105/SMWW.2882.194.
Cardwell, D.H., Erwin, R.B., and Woodward, H.P., 1968, Geologic map of West Virginia: West Virginia Geological and Economic Survey, 2 sheets, scale 1:2,500,000. [Also available at https://wvgis.wvu.edu/data/dataset.php?ID=43.]
Century Geophysical, LLC, 2025, Home: Century Geophysical, LLC website, accessed January 7, 2025, at https://www.century-geo.com.
IDEXX, 2019, Colilert Test: IDEXX Laboratories, Inc. webpage, accessed May 15, 2018, at https://www.idexx.com/en/water/water-products-services/colilert/.
JMP Statistical Discovery LLC, 2022, Predictive and specialized modeling—Version 17: Cary, NC, JMP Statistical Discovery LLC, 586 p. accessed March 25, 2024, https://www.jmp.com/content/dam/jmp/documents/en/support/jmp17/predictive-and-specialized-modeling.pdf.
Keys, W.S., 1990, Borehole geophysics applied to ground-water investigations: U.S. Geological Survey Techniques of Water-Resources Investigations, book 2, chap. E2, 150 p. [Also available at https://pubs.usgs.gov/twri/twri2-e2/html/pdf.html.]
Kozar, M.D., McAdoo, M.A., and Haase, K.B., 2020, Groundwater quality and geochemistry of West Virginia’s southern coal fields: U.S. Geological Survey Scientific Investigations Report 2019−5059, 78 p., accessed March 25, 2024, at https://doi.org/10.3133/sir20195059.
Kozar, M.D., McCoy, K.J., Britton, J.Q., and Blake, B.M.B., Jr., 2012, Hydrogeology, groundwater flow, and groundwater quality of an abandoned underground coal-mine aquifer, Elkhorn Area, West Virginia: West Virginia Geological and Economic Survey Bulletin B-46, 103 p., accessed February 11, 2019, at http://downloads.wvgs.wvnet.edu/pubcat/docs/Bulletin_46_Hydrogeology,%20Groundwater%20Abandoned%20Coal%20Mine%20Aquifer,%20Elkhorn,%20WV_(2012).pdf.
Kozar, M.D., and Paybins, K.S., 2016, Assessment of hydrogeologic terrains, well-construction characteristics, groundwater hydraulics, and water-quality and microbial data for determination of surface-water-influenced groundwater supplies in West Virginia: U.S. Geological Survey Scientific Investigations Report 2016–5048, 55 p., accessed January 7, 2025, at https://doi.org/10.3133/sir20165048.
Myers, D.N., Stoeckel, D.M., Bushon, R.N., Francy, D.S., and Brady, A.M.G., 2014, Fecal indicator bacteria (ver. 2.1): U.S. Geological Survey Techniques of Water Resources Investigations, Book 9, Chap. A7, section 7.1, May 2014, accessed January 7, 2025, at https://pubs.usgs.gov/publication/twri09A7.1.
Turnipseed, D.P., and Sauer, V.B., 2010, Discharge measurements at gaging stations: U.S. Geological Survey Techniques and Methods, book 3, chap. A8, 87 p. [Accessed January 7, 2025, at https://doi.org/10.3133/tm3A8.]
U.S. Board on Geographic Names, 2023, Geographic Names Information System (GNIS) domestic names search application: U.S. Geological Survey database, accessed August 2, 2023, at https://www.usgs.gov/us-board-on-geographic-names/download-gnis-data.
U.S. Census Bureau, 2015, TIGER/Line shapefiles: U.S. Census Bureau database, accessed April 28, 2015, at https://www.census.gov/cgi-bin/geo/shapefiles/index.php.
U.S. Geological Survey, 2006, Collection of water samples (ver. 2.0, September 2006): U.S. Geological Survey Techniques of Water-Resources Investigations, book 9, chap. A4, accessed January 7, 2025, at https://pubs.usgs.gov/publication/twri09A4.
U.S. Geological Survey, 2018, National map, National hydrography dataset, West Virginia: U.S. Geological Survey database, accessed March 30, 2018, at https://prd-tnm.s3.amazonaws.com/index.html?prefix=StagedProducts/Hydrography/NHD/State/GDB/.
U.S. Geological Survey, 2025a, USGS water data for the Nation: U.S. Geological Survey National Water Information System database, accessed May 12, 2025, at https://doi.org/10.5066/F7P55KJN.
U.S. Geological Survey, 2025b, Health-based screening levels for evaluating water-quality data: U.S. Geological Survey database, accessed August 30, 2025, at https://www.usgs.gov/tools/health-based-screening-levels-evaluating-water-quality-data.
U.S. Environmental Protection Agency, 2025, Drinking water regulations and contaminants: U.S. Environmental Protection Agency webpage, accessed May 23, 2025, at https://www.epa.gov/sdwa/drinking-water-regulations-and-contaminants.
West Virginia Geological and Economic Survey, 1968, West Virginia geologic explorer and download access: West Virginia Geological and Economic Survey database, accessed January 8, 2025, at https://experience.arcgis.com/experience/9cbdcc9d316d462cbc6c8c6714c8570d/page/Data-by-Publication.
West Virginia Geological and Economic Survey, 2018a, Coal web Mercator—Pocahontas 3 WM (MapServer): West Virginia Geological and Economic Survey database, accessed March 30, 2018, at https://atlas.wvgs.wvnet.edu/arcgis/rest/services/Coal_Web_Mercator/Pocahontas_3_WM/MapServer.
West Virginia Geological and Economic Survey, 2018b, Coal web Mercator—Pocahontas 4 WM (MapServer): West Virginia Geological and Economic Survey database, accessed March 30, 2018, at https://atlas.wvgs.wvnet.edu/arcgis/rest/services/Coal_Web_Mercator/Pocahontas_4_WM/MapServer.
West Virginia Geological and Economic Survey, 2025a, West Virginia Geological and Economic Survey digital 1968 Geologic Map of West Virginia (web version), accessed January 8, 2025, at https://atlas2.wvgs.wvnet.edu/portal/apps/webappviewer/index.html?id=ab47a1fc20e4417aa47af96b4c83be28.
West Virginia Geological and Economic Survey, 2025b, West Virginia Geological and Economic Survey Coal Bed Mapping Program digital data available for download, accessed January 8, 2025, at https://survey123.arcgis.com/share/f9bf01129bb04f349e6f207cf7039e53.
Wilde, F.D., ed., 2002, Processing of water samples (ver. 2.0, April 2002): U.S. Geological Survey Techniques of Water-Resources Investigations, book 9, chap A5, 129 p., accessed February 12, 2018, at https://doi.org/10.3133/twri09A5.
Williams, J.H., and Conger, R.W., 1990, Preliminary delineation of contaminated water-bearing fractures intersected by open-hole bedrock wells: Groundwater Monitoring & Remediation, v. 10, p. 118–126, accessed March 17, 2025, at https://doi.org/10.1111/j.1745-6592.1990.tb00028.x.
Williams, J.H., and Lane, J.W., 1998, Advances in borehole geophysics for ground-water investigations: U.S. Geological Survey Fact Sheet 002–98, 4 p., accessed March 17, 2025, at https://doi.org/10.3133/fs00298.
Williams, J.H., Lapham, W.W., and Barringer, T.H., 1993, Application of electromagnetic logging to contamination investigations in glacial sand-and-gravel aquifers: Groundwater Monitoring & Remediation, v. 13, no. 3, p. 129–138, accessed March 25, 2024, at https://doi.org/10.1111/j.1745-6592.1993.tb00082.x.
Appendix 1. Constituents Analyzed for the Study With Method Detection Limits
Table 1.1.
Constituents and reporting limits for major ions, metals, trace elements, nutrients, fecal indicator bacteria, volatile organic compounds, semivolatile organic compounds, and polychlorinated biphenyls analyzed in water samples collected from sites in the Gary area, McDowell County, West Virginia.[Method detection limits and analytical methods for each constituent analyzed are from the StarLIMS database. StarLIMS is the U.S. Geological Survey (USGS) laboratory information system database and can be queried to access specific information with respect to analytical methods and method detection limits. For query purposes, USGS schedules 4440, 2755, 2750, 2703, lab code 2707, and RTI Laboratories CIN schedule 50666 were analyzed for all samples collected for this study. This database is only accessible to USGS employees, so please contact the USGS Virginia and West Virginia Water Science Center should you require access to this resource. mg/L, milligrams per liter; μg/L, micrograms per liter; mmHg, millimeters of mercury; CFC, chlorofluorocarbon; n/a, not applicable; unfltd, unfiltered; recov, recoverable; HCFC, hydrofluorocarbon; m, meta; p, para; PCBs, polychlorinated biphenyls]
Sulfide is reported as total sulfide, but the method primarily detects hydrogen sulfide gas. Only one of the seven sites sampled, site Mcd-0232, was sampled for hydrogen sulfide gas. The remaining six sites did not have a detectable odor of hydrogen sulfide gas which is detectable by odor at low concentrations.
Appendix 2. Water-Quality Data Collected During the Study
Conversion Factors
U.S. customary units to International System of Units
Temperature in degrees Celsius (°C) may be converted to degrees Fahrenheit (°F) as follows:
°F = (1.8 × °C) + 32.
Temperature in degrees Fahrenheit (°F) may be converted to degrees Celsius (°C) as follows:
°C = (°F – 32) / 1.8.
Datum
Vertical coordinate information is referenced to the North American Vertical Datum of 1988 (NAVD 88).
Horizontal coordinate information is referenced to the North American Datum of 1983 (NAD 83).
Altitude, as used in this report, refers to distance above the vertical datum.
Supplemental Information
Specific conductance is in microsiemens per centimeter at 25 degrees Celsius (µS/cm at 25 °C).
Concentrations of chemical constituents in water are in either milligrams per liter (mg/L) or micrograms per liter (µg/L).
Turbidity is reported in Nephelometric Turbidity Units (NTU) or nephelometric turbidity ratio units (NRTU).
Abbreviations
ATV
acoustic televiewer
EM
electromagnetic
EPA
U.S. Environmental Protection Agency
HBSL
health-based screening level
HBV
health-based value
MCL
maximum contaminant level
MPN
most probable number
OTV
optical televiewer
PCB
poly-chlorinated biphenyl
PVC
polyvinyl chloride
QA
quality assurance
QA/QC
quality-assurance and quality-control
RPD
relative percent difference
SMCL
secondary maximum contaminant level
SVOC
semivolatile organic compounds
TDS
total dissolved solids
TT
treatment technique
USGS
U.S. Geological Survey
VOC
volatile organic compound
W. Va.
West Virginia
For additional information contact:
Director, Virginia and West Virginia Water Science Center
U.S. Geological Survey
1730 East Parham Road
Richmond, Virginia 23228
or visit our website at
https://www.usgs.gov/centers/virginia-and-west-virginia-water-science-center
Publishing support provided by the Baltimore Publishing Service Center.
Disclaimers
Any use of trade, firm, or product names is for descriptive purposes only and does not imply endorsement by the U.S. Government.
Although this information product, for the most part, is in the public domain, it also may contain copyrighted materials as noted in the text. Permission to reproduce copyrighted items must be secured from the copyright owner.
Suggested Citation
Kozar, M.D., and Austin, S.H., 2025, Reconnaissance of potential alternate water supply sources for the City of Gary, West Virginia: U.S. Geological Survey Open-File Report 2025–1037, 27 p., https://doi.org/10.3133/ofr20251037.
ISSN: 2331-1258 (online)
Study Area
| Publication type | Report |
|---|---|
| Publication Subtype | USGS Numbered Series |
| Title | Reconnaissance of potential alternate water supply sources for the City of Gary, West Virginia |
| Series title | Open-File Report |
| Series number | 2025-1037 |
| DOI | 10.3133/ofr20251037 |
| Publication Date | November 14, 2025 |
| Year Published | 2025 |
| Language | English |
| Publisher | U.S. Geological Survey |
| Publisher location | Reston, VA |
| Contributing office(s) | Virginia and West Virginia Water Science Center |
| Description | Report: viii, 27 p.; Appendix |
| Country | United States |
| State | West Virginia |
| City | Gary |
| Online Only (Y/N) | Y |
| Additional Online Files (Y/N) | Y |