

Evaluating Deterrent Locations and Sequence in the Tennessee and Cumberland Rivers and the Tennessee–Tombigbee Waterway to Minimize Invasive Carp Occupancy and Abundance
Links
- Document: Report (4.1 MB pdf) , HTML , XML
- Download citation as: RIS | Dublin Core
Acknowledgments
We thank the participants in this process for their time and effort in meeting virtually and face-to-face, providing input, and reviewing documents. In particular, we thank State agency partners Josh Tompkins (Kentucky), Cole Harty (Tennessee), Dennis Riecke (Mississippi), and Dave Armstrong (Alabama). We also thank Federal partners Clint Jones (Tennessee Valley Authority); Valerie McCormack, Velma Diaz, Mike Malsom, Scott Fanning, and Travis Wiley (U.S. Army Corps of Engineers); and lastly Angela Erves and Angie Rogers (U.S. Fish and Wildlife Service). We thank the Tennessee and Cumberland River Invasive Carp subbasin partnership for supporting the funding for this work through U.S. Fish and Wildlife Service funds.
We thank Andrea Fritts, MaryBeth Brey, Kyle Mosel, and Aaron Cupp from the U.S. Geological Survey for input during this process. Lastly, we thank Corey G. Dunn and Brian Healy with the U.S. Geological Survey for providing constructive peer reviews of this report.
Abstract
Invasive carps, specifically silver carp (Hypophthalmichthys molitrix), bighead carp (H. nobilis), grass carp (Ctenopharyngodon idella), and black carp (Mylopharyngodon piceus), have proliferated in the Mississippi River Basin owing to escapes from aquaculture facilities and intentional releases. In the Water Resources and Development Act (WRDA) of 2020 Sec. 509, Congress directed the U.S. Army Corps of Engineers to work with the Tennessee Valley Authority and other relevant agencies with deterrent projects to implement as many as 10 deterrent projects intended to manage and prevent the spread of invasive carp in the Tennessee and Cumberland River subbasins. The WRDA was amended in 2022 to include that at least one location must be situated on the Tennessee–Tombigbee Waterway. This report documents a structured decision-making process that engaged State and Federal agencies to evaluate alternative deterrent site sequences at specified lock and dam complexes on the Tennessee River, Cumberland River, and the Tennessee–Tombigbee Waterway. State and Federal agencies participated in a series of virtual and face-to-face meetings to structure the problem, expand the models used in previous decision analyses for the Tennessee River, and define management objectives. Potential deterrent sites were restricted to the downstream locations on the Tennessee River (n=3), Cumberland River (n=2), and the Tennessee–Tombigbee Waterway (n=10). Only considering 15 sites allowed all feasible deterrent site combinations and sequences to be evaluated. Invasive carp relative abundance was projected for the Tennessee River, Cumberland River, and Tennessee–Tombigbee Waterway management units for 20 years using a simulation model. The deterrent site sequences were ranked based on the system-level invasive carp relative abundance and distribution in year 20. The unique downstream expansion of invasive carp through the Tennessee–Tombigbee Waterway was important to the interest group, but downstream movement rates were unknown; therefore, several downstream movement rates were evaluated, and the outcomes were used to rank deterrent site sequences. Additionally, the analysis incorporated two scenarios involving the retention and removal of an experimental deterrent at Barkley Lock on the Cumberland River. The results of the deterrent site sequences varied among downstream movement rates, with Tennessee–Tombigbee Waterway deterrent locations installed earlier in highly ranked sequences with increasing downstream movement rates. This analysis was time-limited owing to agency needs and represents Phase 1 of this project. Phase 2 expands Phase 1 to address additional uncertainties and more holistic management objectives and strategies.
Plain Language Summary
Invasive silver carp are spreading upstream in the Tennessee and Cumberland Rivers. This report details a collaborative effort among State and Federal agencies to evaluate potential sites for invasive carp deterrent projects along the Tennessee River, Cumberland River, and the Tennessee–Tombigbee Waterway. The findings highlight that project implementation timing could significantly impact their success, especially with increasing downstream movement rates of invasive carp.
Introduction
Invasive carps, specifically silver carp (Hypophthalmichthys molitrix), bighead carp (H. nobilis), grass carp (Ctenopharyngodon idella), and black carp (Mylopharyngodon piceus), have proliferated in the Mississippi River Basin owing to escapes from aquaculture facilities and intentional releases. Previous research indicates that these carp species adversely affect ecosystems by causing habitat disturbances and reducing native species biomass, affecting recreational and commercial fisheries (Kramer and others, 2019; Chick and others, 2020). For instance, planktivorous bighead and silver carp degrade plankton communities, competing with native fish species like American paddlefish (Polyodon spathula). Additionally, grass carp and black carp degrade water quality and affect energy pathways by consuming aquatic plants and benthic macroinvertebrates, respectively. These adverse effects present ecological and economic challenges for natural resource agencies. To counter the threats posed by invasive carps, natural resource agencies have initiated management strategies to control populations and prevent their spread to uncolonized water bodies. Invasive carp management strategies often include carp removal through contract and incentivized fishing programs, and agency efforts and the use of deterrents at pinch-point locations at lock and dam (L&D) complexes to impede carp migration (Cupp and others, 2021).
In the Water Resources and Development Act (WRDA) of 2020 Sec. 509 (U.S. House of Representatives, 2020, p. 350), Congress directed the U.S. Army Corps of Engineers (USACE) to work “in conjunction with the Tennessee Valley Authority (TVA) and other relevant Federal agencies, to carry out … projects to manage and prevent the spread of [invasive] carp using innovative technologies, methods, and measures.” Specifically, as many as 10 invasive carp deterrent projects are to be located in the Tennessee River and Cumberland River subbasins where invasive carp populations are expanding or have been documented (Post van der Burg and others, 2021). The WRDA 2022 (U.S. Senate Environment and Public Works Committee, 2022, p. 350) amended WRDA 2020 so that “not less than 1 project shall be carried out on the Tennessee–Tombigbee Waterway,” a navigation waterway managed by USACE that connects the Tennessee and the Mobile River basins. Consulting with “Federal, State, and local agencies; institutions of higher education; and relevant private organizations, including nonprofit organizations,” these pieces of legislation mandate that USACE identify locations for deterrent projects under the [Invasive] Carp Prevention and Control Pilot Program (U.S. Senate Environment and Public Works Committee, 2022, p. 350).
The comparison of alternative combinations of deterrent locations and deterrent project completion timing often relies on qualitative or semi quantitative techniques that use existing literature, available monitoring data, and expert insights; however, identifying a recommended alternative is beset by uncertainties, constraints, and competing objectives. Decision-analytic methods offer an approach to navigate these complexities, enabling stakeholders to collaboratively develop robust invasive carp management strategies (hereafter referred to as “strategies”) under uncertain conditions, legal and logistical constraints, and potentially conflicting objectives. Additionally, the decision-analysis principles, often called “structured decision making,” align well with USACE's iterative six-step planning process (U.S. Army Corps of Engineers, undated).
The USACE was tasked with recommending the locations and sequencing of as many as 10 deterrent projects in the Tennessee River, Cumberland River, and Tennessee–Tombigbee Waterway. The emphasis on deterrent control measures by the USACE was chosen given the ongoing contract invasive carp removal implemented by State agencies through Federal appropriations administered by the U.S. Fish and Wildlife Service, as per the authorizations in WRDA 2020 (U.S. House of Representatives, 2020). The scope of authority for implementing, maintaining, and managing deterrents lies with USACE (responsible for the Cumberland River and Tennessee–Tombigbee Waterway) and TVA (responsible for the Tennessee River). Through a series of online workshops and face-to-face meetings, we worked with USACE to develop aspects of a decision-analysis process, which consisted of properly framing the decision problem and developing quantitative management objectives. USACE sought to satisfy two fundamental objectives within its directive and the constraints imposed to evaluate deterrent effectiveness: (1) minimize occupancy of invasive carp in the Tennessee River, Cumberland River, and Tennessee–Tombigbee Waterway and (2) minimize system-level (Tennessee River, Cumberland River, and Tennessee–Tombigbee Waterway) relative abundance.
Purpose and Scope
The alternative actions that USACE is considering to meet these objectives involves siting and building deterrents at lock and dam (L&D) complexes in the Tennessee River, Cumberland River, and the Tennessee–Tombigbee Waterway. In this report, we document a numerical simulation model used to identify the optimal sequence of deterrents in these river systems given the problem constraints and management objectives. The interest group used the analysis results to draft a recommendation letter for review by the Mississippi Interstate Cooperative Resource Association (MICRA). MICRA then finalized, approved, and provided the draft recommendation letter to USACE for inclusion in the programmatic environmental assessment (PrEA).
Methods
The spatial extent considered in this study included four major river systems: the Ohio River, Cumberland River, Tennessee River, and the Tennessee–Tombigbee Waterway, as described below.
-
1. Olmsted Pool (Ohio River, river kilometer 1,552 to river kilometer 1,478.2) on the Ohio River receives flows from the Tennessee and Cumberland Rivers (fig. 1). The flows received are regulated by Kentucky Dam and Barkley Dam on the Tennessee and Cumberland Rivers, respectively). This analysis considers Olmsted Pool a source of invasive carp to the Tennessee and Cumberland River systems.
-
2. The Cumberland River originates in the Appalachian Mountains and flows west through Kentucky and northern Tennessee to its confluence with the Ohio River. It spans approximately 1,107 kilometers (km) across southern Kentucky and north-central Tennessee. The river system is extensively modified for flood control and navigation, with L&D complexes on the main stem of the Cumberland River. This analysis considered five management units (table 1) delineated by the confluence with the Ohio River and four L&D complexes operated by USACE (table 2).
-
3. The Tennessee River flows approximately 1,049 km across Tennessee, Mississippi, Alabama, and Kentucky and joins the Ohio River in Kentucky. The Tennessee River has been dammed multiple times since the 1930s, primarily by the TVA, leading to the creation of several reservoirs (Tennessee Valley Authority, 2025). Barkley Canal connects Kentucky Lake (Tennessee River) and Lake Barkley (Cumberland River), offering a shorter navigational route for river traffic (fig. 1).
-
4. The Tennessee–Tombigbee Waterway is a 377-km artificial waterway that connects the Tennessee River to the Tombigbee River, allowing commercial navigation between the Tennessee River and Mobile River. This connection opens an aquatic connection between the Tennessee River and the Mobile River drainage in Alabama. The connection between the Tennessee River and the Tombigbee River was established with a 53-meter deep cut called the Divide Cut that connects Yellow Creek Bay of Pickwick Lake to Bay Springs Lake Reservoir created by Jamie Witten L&D on the Tombigbee River (fig. 1). Ten L&D complexes are located on the Tennessee–Tombigbee Waterway (table 2).

Potential deterrent sites associated with the Tennessee River and Cumberland River locks and dams. Tombigbee-Mobile Drainage potential deterrent sites were associated with Tennessee–Tombigbee Waterway and Tombigbee River locks and dams.
Table 1.
Management unit number, name, and summary metrics for the Ohio River, Tennessee River, Cumberland River, and Tennessee–Tombigbee Waterway.[km2, square kilometer; NA, not applicable]
Table 2.
Summary metrics and locations of potential deterrents associated with the Tennessee River, Cumberland River, and Tennessee–Tombigbee Waterway locks and dams.[Tennessee River locks and dams are operated by the Tennessee Valley Authority. Cumberland River and Tennessee–Tombigbee Waterway locks and dams are operated by the U.S. Army Corps of Engineers. L&D, lock and dam]
Decision Analysis Overview
We used a structured decision making (SDM) approach with a multi-agency interest group to co-produce a shared understanding of the problem, management objectives, and management actions (Gregory and others, 2012; Conroy and Peterson, 2013). The interest group included representation from State (Kentucky, Tennessee, Mississippi, Alabama) and Federal (USACE, U.S. Fish and Wildlife Service, U.S. Geological Survey, TVA) agencies with interest in implementing invasive carp control actions and deterrents in a two-phase SDM process. Phase 1 of the SDM process sought to inform the USACE's selection of pilot deterrent locations at L&D complexes; therefore, a compressed timeline was allotted to the Phase 1 process to coincide with releasing the USACE draft PrEA. Simplifying assumptions and constraints were placed on the analysis in Phase 1.
Clarifying the Decision Frame
We facilitated the interest group by developing a problem statement during virtual engagements (appendix 1). The problem statement reflected two analysis phases: a Phase 1 analysis to support the need of the USACE PrEA, and a more holistic Phase 2 analysis that reduces constraints, expands the management objectives, and accounts for additional uncertainties. The interest group specified a 20-year temporal extent for Phases 1 and 2 of analyses. This document reports the methods and results of the Phase 1 analysis needed for MICRA to draft its recommendation letter. The problem scope of the Phase 1 analysis was limited to evaluating deterrent locations and sequencing in the Tennessee River, Cumberland River, and Tennessee–Tombigbee Waterway because USACE interpretation of legislative language constraints imposed the compressed timeline required to meet USACE needs.
Management Units
The four river systems were delineated into 28 management units for this analysis that, with four exceptions, were river segments delineated by an upstream and downstream L&D complex as a reservoir but are commonly called pools, lakes, or reservoirs (tables 1 and 2). Four exceptions were the Cumberland River tailwater below Barkley Dam and its confluence with Olmstead Pool, the Tennessee River tailwater below Kentucky Dam and its confluence with Olmstead Pool, and Pickwick Lake and Bay Springs Lake Reservoir, which the Divide Cut separated. The confluence with Olmstead Pool for the Tennessee and Cumberland Rivers delineated these management units because of alignment with telemetry arrays, where passive telemetry receivers are placed to detect telemetry-tagged invasive carps migrating within the systems. Pickwick Lake on the Tennessee River is connected to Bay Springs Lake Reservoir on the Tombigbee River by way of the Divide Cut. The Divide Cut was used to delineate the two management units for analysis (fig. 1, table 1). Barkley Canal connects Kentucky Lake and Lake Barkley and allows navigation and fish passage between management units. Barkley Canal was not used to delineate the Kentucky Lake and Lake Barkley management units, which was a unique situation; however, the connection allowing for invasive carp migration between the management units was accounted for in this analysis.
Management Objectives
We engaged the interest group in virtual and in-person meetings to formulate Phase 1 invasive carp management objectives given legislative language and subsequent interpretation by USACE. The interest group specified that minimizing system-level invasive carp abundance and distribution were the fundamental management objectives to be achieved by implementing invasive carp deterrents. With input and review from the interest group, we developed performance metrics to quantify the management objectives. The management objectives and associated performance metrics are described in table 3.
Table 3.
Management objectives, subobjectives, associated performance metrics, and weights used to evaluate the performance of alternative deterrent site sequences.Invasive Carp Deterrent Actions
The Phase 1 analysis limits the management actions evaluated to invasive carp deterrent location and sequence given USACE constraints imposed for deterrent evaluation and placement of at least one on the Tennessee–Tombigbee Waterway. Deterrents in this analysis did not reflect a specific deterrent type but rather the assumed effect of a deterrent on invasive carp upstream movement. The USACE interpretation of WRDA 2022 section 509 (U.S. Senate Environment and Public Works Committee, 2022) constrained the potential deterrent locations (table 2). Specifically, the legislation stated that the effectiveness of pilot deterrent projects must be evaluated; therefore, potential deterrent sites were constrained to locations between management units where the interest group and subject matter experts believed sufficient invasive carp attempts to pass a deterrent would occur to evaluate deterrent efficacy in the near term (less than 10 years needed to evaluate effectiveness). Three downstream L&D complexes on the Tennessee River and two on the Cumberland River were selected as potential deterrent sites (table 2). Additional river system constraints were imposed to ensure that at least one deterrent was on the Cumberland River and Tennessee River and one deterrent was on Tennessee–Tombigbee Waterway. Specifically, in the Phase 1 process, potential deterrent locations and construction sequences were limited to the following to meet WRDA 2022 (U.S. Senate Environment and Public Works Committee, 2022) legislative requirements interpreted by USACE:
-
● Tennessee River: Kentucky L&D, Pickwick L&D, Wilson L&D;
-
● Cumberland River: Barkley L&D, Cheatham L&D; and
-
● Tennessee–Tombigbee Waterway: all locations.
Additionally, management objectives determined by USACE were strictly to minimize invasive carp distribution and abundance, with distribution defined as the proportion of occupied units and the number of units never occupied that were evaluated over 20 years, and abundance defined as the projected relative abundance at the end of 20 years.
We engaged the interest group in virtual 2-hour meetings and a 6-hour in-person workshop during the Phase 1 process. We developed the scope of the problem, management objectives, potential deterrent locations, assessment of analysis assumptions, sensitivity analyses, and evaluation of possible deterrent sites and sequences. We expanded the operating model of invasive carp population dynamics developed by Post van der Burg and others (2021) to capture the additional Cumberland River and Tennessee–Tombigbee Waterway management units, the outcomes of alternative deterrent site locations and sequencing, and tradeoffs among the management objectives. We describe the methods used below.
The interest group believed a reasonable time for completing a deterrent was one every 4 years; that time interval was used in the analysis. Deterrent construction assumed sequential deterrent completion, with a deterrent construction beginning in the same year at the following location after completing the previous deterrent. Although five deterrents could be completed over 20 years, we evaluated four because the fifth deterrent would be completed in the final year and, therefore, would not affect simulated relative abundance dynamics. The analysis allowed deterrent construction in upstream or downstream directions; that is, deterrents could be constructed at any open location within the location constraints specified irrespective of flow direction.
Consequences—Predictive Modeling of Invasive Carp Dynamics
Projecting Invasive Carp Dynamics
Annual invasive carp population dynamics were projected for 20 years for each management unit using an annual timestep. We used several models to simulate annual recruitment and movement processes affecting invasive carp stocks (that is, relative abundance) and their distribution among management units in the Cumberland River, Tennessee River, and Tennessee–Tombigbee Waterway. We used two models to project relative abundance dynamics in this analysis, a stock-recruit model and a surplus production model, similar to the models used in Post van der Burg and others (2021). The difference between the two model structures is how the model accounts for density dependence. In the stock-recruit model, we defined invasive carp stock as age-1 and older fish; therefore, recruits represent new age-1 invasive carp recruited to the stock. Additionally, in the stock-recruit model structure, the number of recruits depends on the spawning stock, and natural morality is density independent. The surplus production model accounts for density dependence in the population growth rate, which represents the balance of recruitment and natural mortality rates. This population growth rate is density dependent, which means the population growth rate approaches zero as the population nears carrying capacity. To further clarify, the models differ in the treatment of recruitment and natural morality, with both processes included in stock-recruit model structure and the balance of the two processes included in the surplus production model.
The stock-recruit model used to project invasive carp relative abundance dynamics was specified as
whereN
is the invasive carp relative abundance for management unit,
i
indexes management unit,
t
indexes the year,
m
indexes the recruitment model used to project relative abundance dynamics,
R
is the number of age-1 invasive carp recruiting to management unit,
Dtotal
is the number of invasive carp that die due to natural and fishing mortality,
I
is the number of invasive carp immigrating to the management unit, and
E
is the number invasive carp emigrating from management unit.
The surplus production model used to project invasive carp abundance dynamics was specified as
whereN
is the invasive carp relative abundance for management unit,
i
indexes management unit,
t
indexes the year,
m
indexes the recruitment model used to project relative abundance dynamics,
is the intrinsic growth rate,
is the carrying capacity for management unit,
Dfishing
is the number of invasive carp removed by fishing from the management unit
I
is the number of invasive carp immigrating to the management unit, and
E
is the number invasive carp emigrating from management unit.
We used management unit specific r and K values elicited for Tennessee River management units and reported in Post van der Burg and others (2021). The variable r was set to 0.3 for all management units. A linear model relating carrying capacity to management unit area was developed for Tennessee River management units and used to predict K for Cumberland River and Tennessee–Tombigbee Waterway management units because K values reported in Post van der Burg and others (2021) were for Tennessee River management units (appendix 2). The variables R, Dtotal, Dnatural, Dfishing, I, and E are further described in the following sections. The relative abundance values used to initialize the projection models are reported in table 2.1.
Recruitment Process—Alternative Recruitment Models
The number of age-1 carp recruiting to each management unit was specified as a function of the number of invasive carp (stock-recruit relation ), discounted by the management unit's reproductive potential, and specified as
whereR
is the number of age-1 invasive carp recruiting to management unit,
i
indexes management unit,
t
indexes the year,
m
indexes the recruitment model used to project relative abundance dynamics,
is a stock-recruit function, detailed in this section; and
RP
is the reproductive potential assigned to the management unit.
Age-1 invasive carp recruited to the stock on January 1 of the year after spawning were directly added to the invasive carp stock and subject to annual natural and fishing mortality. The number of invasive carp recruited to a management unit were discounted by the management-unit-specific recruitment potential (RP) value that can vary from 0 to 1. Refer to Post van der Burg and others (2021) for a discussion of the methods used to elicit RP values for Tennessee River management units. When possible, we used the values of RP reported in Post van der Burg and others (2021), and the interest group and subject matter experts provided what they determined were reasonable values for other management units needing RP values owing to time limitations. Management-unit-specific RP values used to project relative abundance dynamics are shown in table 2.1.
We used three stock-recruit relations () to account for structural uncertainty in the recruitment process. Specifically, we used the Ricker (Ricker, 1975), Beverton-Holt (Beverton and Holt, 1957), and a hockey stick (Barrowman and Myers, 2000) stock-recruit function specified in Post van der Burg and others (2021) to model the number of age-1 invasive carp recruited to the stock. The management-unit-specific number of age-1 recruits given the Ricker stock-recruit function was calculated as
whereR
is the number of age-1 invasive carp recruiting to management unit,
i
indexes management unit,
t
indexes the year,
m
indexes the recruitment model used to project relative abundance dynamics,
α1
represents a density-independent recruitment rate (Ricker, 1975; Quinn and Deriso, 1999),
N
is the invasive carp relative abundance for management unit,
b1
is the strength of density-dependent compensation, and
e
is Eulers number.
Values for α1 and b1 used in this analysis were 5.32 and 0.00065, respectively (Post van der Burg and others, 2021). The management-unit-specific number of age-1 recruits given a Beverton Holt stock-recruit function was calculated as
whereR
is the number of age-1 invasive carp recruiting to management unit,
i
indexes management unit,
t
indexes the year,
m
indexes the recruitment model used to project relative abundance dynamics,
α2
represents a density-independent recruitment rate,
N
is the invasive carp relative abundance for management unit, and
b2
is a density-dependent parameter proportional to fecundity and density-dependent mortality (Beverton and Holt, 1957; Quinn and Deriso, 1999).
Values for α2 and b2 used in this analysis were 3.77 and 0.0021, respectively (Post van der Burg and others, 2021). The management-unit-specific number of age-1 recruits given a hockey-stock stock-recruit function was calculated as
whereR
is the number of age-1 invasive carp recruiting to management unit,
i
indexes management unit,
t
indexes the year,
m
indexes the recruitment model used to project relative abundance dynamics,
Rp
is the peak number of age-1 recruits,
Np
is relative abundance at peak recruitment,
Nd
is the depensation threshold, and
N
is the invasive carp relative abundance for management unit.
Recruitment model values used to project relative abundance for Rp, Np, and Nd were 1,775; 2,000; and 50, respectively (Post van der Burg and others, 2021).
Mortality Processes—Natural and Fishing
We combined natural and fishing mortality rates into an overall mortality to account for mortality in the stock-recruit models. Because natural and fishing mortality rates were specified as instantaneous rates for this analysis and in Post van der Burg and others (2021), the two rates were summed and then converted to a finite mortality rate as
whereDtotal
is the total deaths in a management unit due to natural and fishing mortality,
i
indexes management unit,
t
indexes the year,
m
indexes the recruitment model used to project relative abundance dynamics,
N
is the invasive carp relative abundance for management unit,
M
is the instantaneous natural annual mortality rate, and
F
is the instantaneous annual fishing mortality rate.
Because natural morality is accounted for in the surplus production model, the number of invasive carp removed by commercial harvest in each management unit was calculated as . We calculated Mi, assuming the maximum age (tmax,i) an invasive carp achieves in any of the management units was 13 years (Ridgway and Bettoli, 2017), as (Hewitt and Hoenig, 2005; Post van der Burg and others, 2021). Equation 7 assumes annual instantaneous fishing and natural mortality rates are additive and density independent in projection models 1, 2, and 3. Model projections assumed that F was equal to M, and F and M did not differ among management units.
Movement Processes—Management Unit Immigration and Emigration
Interest group and subject matter experts identified the main movement pathway of invasive carp movements between connected management units was through locks, but the exact pathway and relative importance was uncertain, especially for uninvaded management units. We specified upstream and downstream movement rates based on values reported in Post van der Burg and others (2021) and input from the interest group and subject matter experts. Several movement probabilities were needed to capture the possible direction-specific movement pathways between management units. Most of the upstream or downstream movement between Tennessee River, Cumberland River, and Tennessee–Tombigbee Waterway management units occurs at L&D complexes (table 2). Subbasin partnership invasive carp experts specified that upstream and downstream movement by invasive carp can occur through lock chambers. The additionally specified that invasive carp can move to a downstream management unit over a dam spillway. The risk of downstream movement over a spillway is limited by (1) the presence of a spillway and (2) the management unit water elevations exceeding the spillway elevation, which is generally low given management unit operations follow a guide curve that minimizes the risks of water spilling over the spillway. Guide curves provide reservoir specific target elevation targets for each day of the year (Patterson and Doyle, 2018). The analysis limits invasive carp movement to a single connected unit per year.
Movement Rates
The immigration and emigration processes are linked because emigration from one management unit to another represents immigration to that management unit. The number of invasive carp emigrating or immigrating from one management unit to another was calculated from pathway-specific movement probabilities specified as a square matrix (MV) where the rows represent the management unit (i) from which invasive carp were moving, and the columns represent the management unit (k) to which invasive carp moved. Off diagonal values of MV contain the overall movement probability (Pr(move)i,k), representing the probability of moving from one management unit to another given the possible direction-specific movement pathway probabilities. The overall movement probability depends on whether movement from one management unit to another is through an open channel (that is, canal, river confluence) or a L&D complex. The overall movement probability from management unit i to management unit k was calculated as
wherePr(move)
is the probability of moving from one management unit to another,
i
indexes the management unit an invasive carp moves from,
k
indexes the management unit an invasive carp moves to,
D
is a matrix of 0s and 1s signifying whether a deterrent is operating (further in this section),
E
is the deterrent efficiency,
l
indexes the deterrent location,
t
indexes the year,
US
denotes upstream,
DS
denotes upstream,
Pr(lock)US
is the probability of an invasive carp successfully moving to the upstream management unit through a lock,
Pr(lock)DS
is probability of an invasive carp successfully moving to the downstream management unit through a lock,
Ispill
is a connection specific indicator with a value of 1 if a spillway is present at the L&D or 0 if no spillway was present,
PR(spill)
is probability of an invasive carp successfully moving to the downstream management unit over the dam spillway, and
PR(open)
is probability of an invasive carp successfully moving to a connected management unit through an open pathway (that is, river, channel).
The term D in equation 8 is a rectangular matrix with rows representing a management unit connection (l), columns representing each year simulated (t), and cell entries indicating the implementation status of a deterrent. To further clarify, if a deterrent is completed in year 4 then the first three columns for the corresponding row will be 0 (that is, deterrent not operating) and the remaining columns will be filled with 1 to denote the operation of the deterrent. The value of E was assumed to be 0.75 for all deterrent sequences evaluated because deterrent efficiency was unknown and was expected to be a conservative value. We did not evaluate other values for E because the ranking of deterrent site sequences is relative and therefore the deterrent site sequence was not expected to change with varying values of E. The proportion of invasive carp moving upstream through a lock annually was modeled as a function of the number of annual lockage (table 2) as
wherePr(lock)US
is the probability of an invasive carp successfully moving to the upstream management unit through a lock,
e
is Eulers number,
β0
is the intercept,
β1
is the effect of the number of annual lockage, and
Lockages
is the number of annual lockages.
The constants included in the denominator of equation 9 were the mean and standard deviation of annual lockage and used to normalize lockage. The values of β0 and β1 used in analysis were −3.52 and 0.41, respectively, and set such that at average annual lockage the proportion of invasive carp moving through a lock was between 0.01 and 0.06, which were comparable to the upstream movement rates reported in Post van der Burg and others (2021) for Tennessee River locks but allowed expansion to Cumberland River and Tennessee–Tombigbee Waterway locks through annual lockage rates rather than attempting to elicit values from the interest group and subject matter experts.
The analysis of Post van der Burg and others (2021) did not include downstream movements of invasive carp; however, this analysis included an emphasis on downstream movement because of the unique potential for downstream expansion of invasive carp through Tennessee–Tombigbee Waterway managements units by the connection of Pickwick Lake (Tennessee River) to Bay Springs Lake Reservoir (Tennessee–Tombigbee Waterway). The probability of downstream movement through locks was uncertain, especially for locations like Tennessee–Tombigbee Waterway L&Ds where invasive carp have yet to expand and exert propagule pressure. Additionally, despite hundreds of fish with acoustic tags, a single downstream movement through a lock was reported by the interest group and subject matter experts; therefore, we used a range of values Pr(lock)DS to project invasive carp relative abundance dynamics, which are detailed in the “Sensitivity Analysis” section. The probability of an invasive carp moving downstream over a dam spillway was identified by the interest group as a possible additional downstream movement pathway as Pr(spill)=0.13, where the value of 0.13 was assumed for all spillways based on interest group and subject matter expert inputs. The movement rate through open water connections was uncertain and was arbitrarily set to Pr(open)=0.25, assuming a high level of movement. The movement rates associated with spillway and open water connections reflect what we determined were conservative values (that is, likely higher than expected in this analysis) that result in a higher downstream expansion risk in the Tennessee–Tombigbee Waterway.
Modeling Movement Among Management Units
We used a square matrix (MV) to model the number of invasive carp immigrating to and emigrating from a management unit. Each matrix cell was filled with a 0 if no movement could occur between the management units or the appropriate Pr(move)l value that captured the probability of moving from management unit i (rows) to management unit k (columns). The diagonal of MV represents the probability of an invasive carp remaining in the management unit and is calculated as
wherePr(stay)
is the probability of staying in the management unit,
i
indexes the management unit an invasive carp moves from,
k
indexes the management unit an invasive carp moves to,
K
is the number of management units, and
Pr(move)
is the probability of moving from management i to management unit k.
The rows of MV sum to 1 because movement was mutually exclusive; that is, we assumed invasive carp can only occupy a single management unit per annual time step, and the same assumption was used by Post van der Burg and others (2021). To calculate the number of invasive carp moving from one management unit to another, we set the diagonal of MV to 0. The diagonal of MV was set to 0 such that the multiplication of management unit specific relative abundance did not include the number of invasive carp remaining in the management unit. The number of invasive carp moving from a management unit to another (Nmovei,t,m) was calculated as the Hadamard product (that is, elementwise product) of the matrices MV and Yt,m as
whereMV
is a square matrix of movement probabilities, and
Y
is a matrix of zeros of the same dimension as MV with the diagonal set to Nt,m−Dtotal,t,m, which conditions movement from a management unit on survival to the next time step.
Fish must survive to the current time step to move during the next time step. The number of invasive carp emigrating from a management unit is the row-wise sum of Nmove specified as , and the number of fish immigrating to a management unit was calculated as the column-wise sums of Nmove and calculated as .
Aggregation to System-Level Accounting for Structural Uncertainty
We used four models to project management-unit-specific invasive carp relative abundance dynamics annually for 20 years and m indexes model-specific relative abundance values (Ni,t,m). Equal probabilities were assigned to each model to account for uncertainty in model performance. The system-level invasive carp relative abundance dynamics were calculated as the sum of the management unit-specific weighted abundance values as
whereA
is invasive carp relative abundance,
i
indexes management unit,
t
indexes the year,
m
indexes the recruitment model used to project relative abundance dynamics,
p
is the probability assigned to each alternative model (p=0.25), and
N
is the invasive carp relative abundance for management unit.
The overall invasive carp relative abundance (At) was used to calculate the performance metrics associated with the management objectives (table 3).
Evaluating Deterrent Site Locations and Sequence
The previous analysis by Post van der Burg and others (2021) evaluating invasive carp control strategies for the Tennessee River used a greedy optimization algorithm rather than simulating and evaluating all possible scenarios. Because of the constraints imposed on potential deterrent site locations, generating all possible deterrent site sequences for this decision problem was computationally feasible, including a no-deterrent option; therefore, we projected invasive carp relative abundance dynamics for all possible deterrent site sequences given the deterrent site locations constraints (table 2). Currently, a BioAcoustic Fish Fence (BAFF) experimentally operates at the entrance to the Barkley Dam lock (fig. 1) to evaluate invasive carp deterrent efficiency (Fritts and others, 2023). Because the BAFF is considered an experimental pilot implementation of a carp deterrent, it was uncertain if it would remain in operation after the evaluation period. Because of the uncertainty related to continued BAFF operation, the interest group considered two scenarios:
-
1. the existing BAFF deterrent is removed at Barkley Dam lock, and all possible deterrent site sequences (n=2,161) were evaluated, or
-
2. the BAFF remained in place, so deterrent sequences, including Barkley L&D, were removed from consideration (n=721).
We calculated a utility value for each scenario and deterrent site sequence to compare among site sequences. Specifically, we summed Ai,t=20 to quantify the projected system level relative invasive carp abundance. If the relative invasive carp abundance was 0 or greater than 0, the management unit invasive carp occupancy status was assigned as 0 (unoccupied) or 1 (occupied), respectively. The proportion of management units occupied during the 20 years was calculated as the mean occupancy status for year 20. The proportion of never-occupied management units was calculated as the number of never-occupied units divided by the number of management units. A single utility value was calculated from scaled performance metrics for each deterrent site sequence within each scenario and used to rank alternative deterrent site sequences for each scenario. We used proportional scaling (Conroy and Peterson, 2013) to normalize each performance metric to a common scale varying from 0 to 1, representing an undesirable to a desirable outcome. Then, each scaled performance metric was multiplied by the performance of the metric-specific weight specified in table 3. The utility for each site deterrent sequence was calculated as the sum of the weighted scaled performance metrics, and weights were assigned such that the two fundamental objectives were equally weighted. We sorted possible deterrent sequences by their utility value and identified the best-performing deterrent sequences as those with the highest utility value.
Sensitivity Analyses
The connection between the Tennessee River and the Tennessee–Tombigbee Waterway is unique because of the potential downstream expansion of invasive carp through the Tennessee–Tombigbee Waterway, and the interest group wanted to explore how the optimal site sequences changed with increasing downstream passage rates. We evaluated the optimal site sequence for scenarios where downstream movement through a lock was at a rate of 0, 0.001, 0.01, and 0.1 per year. The downstream passage rate was applied to all locks for downstream passage through the lock.
Results and Discussion
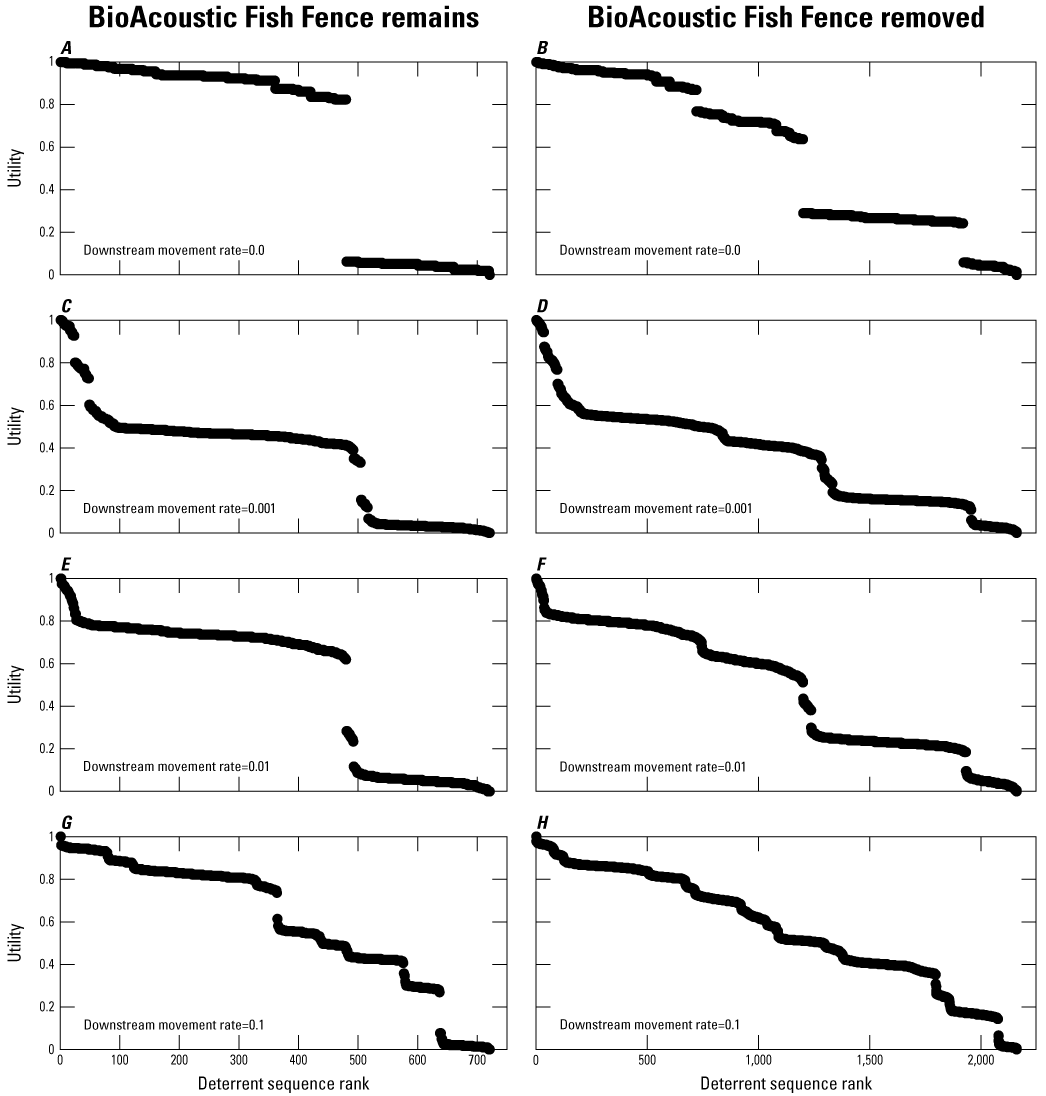
The optimal deterrent site sequence varied between BAFF scenarios and the downstream passage rates evaluated. In several cases, ties occurred among the optimal deterrent site sequences evaluated (table 4); for example, if the BAFF remained and given a downstream passage rate of 0.001, there were two optimal deterrent site sequences. In this instance, the deterrent site locations were the same between the two sequences, but the site sequencing differed. The consistent selection of Thad Cochran Lock A on the Tennessee–Tombigbee Waterway was surprising to the interest group and was further investigated by comparing the distribution and abundance dynamics of the no-deterrent alternative to optimal site sequences with the highest downstream passage rate evaluated. Refer to appendix 3 for all deterrent sequence rankings.
Table 4.
The optimal site deterrent sequences for locations and sequence for scenarios where the BioAcoustic Fish Fence remains in place or is removed at Barkley Lock.[L&D, lock and dam]
The difference between the no-deterrent alternative and the optimal site deterrent sequence for a downstream passage rate of 0.1 is illustrated in figures 2 and 3 for scenarios of the BAFF remaining in place and being removed, respectively. Invasive carp distribution, quantified as relative abundance values greater than 0, did not vary much with time relative to the no-deterrent alternative (figs. 2 and 3). The slight difference between the no-deterrent alternative and the optimal deterrent site sequence scenarios was associated with the timing of the invasion of Pool E on the Tennessee–Tombigbee Waterway (figs. 4 and 5). Comparing differences in abundance illustrated how a deterrent sited at Thad Cochran Lock A slowed invasive carp expansion upstream through the Tennessee–Tombigbee Waterway. Although this result was unexpected, it did make sense given the potential for invasive carp to bypass much of the Tennessee–Tombigbee Waterway if they escape over the Pool E Spillway. Specifically, if invasive carp pass over the Pool E spillway, they enter the Tombigbee River network and can travel unimpeded downstream and re-enter the Tennessee–Tombigbee Waterway at Aberdeen Lake, approximately 8 river kilometers [5 river miles] downstream from Thad Cochran L&D, with the potential to expand upstream to Pool A and downstream to Columbus Lake on the Tennessee–Tombigbee Waterway. If expansion into Pool A occurs, invasive carp can expand upstream in the Tennessee–Tombigbee Waterway towards Pool E, creating upstream and downstream invasion fronts.

Abundance dynamics for the no action alternative with the BioAcoustic Fish Fence remaining in place and for downstream movement rates of A, 0; B, 0.001; C, 0.01; and D, 0.1.

Abundance dynamics for the no action alternative where the BioAcoustic Fish Fence is removed and for downstream movement rates of A, 0; B, 0.001; C, 0.01; and D, 0.1.

Distribution and abundance dynamics for the no action alternative when the BioAcoustic Fish Fence remains in place and the downstream lock movement rate is 0.1. A, Differences in distribution between the optimal site sequence and the no-deterrent option. B, The absolute difference in invasive carp relative abundance between the optimal and the no-deterrent option.
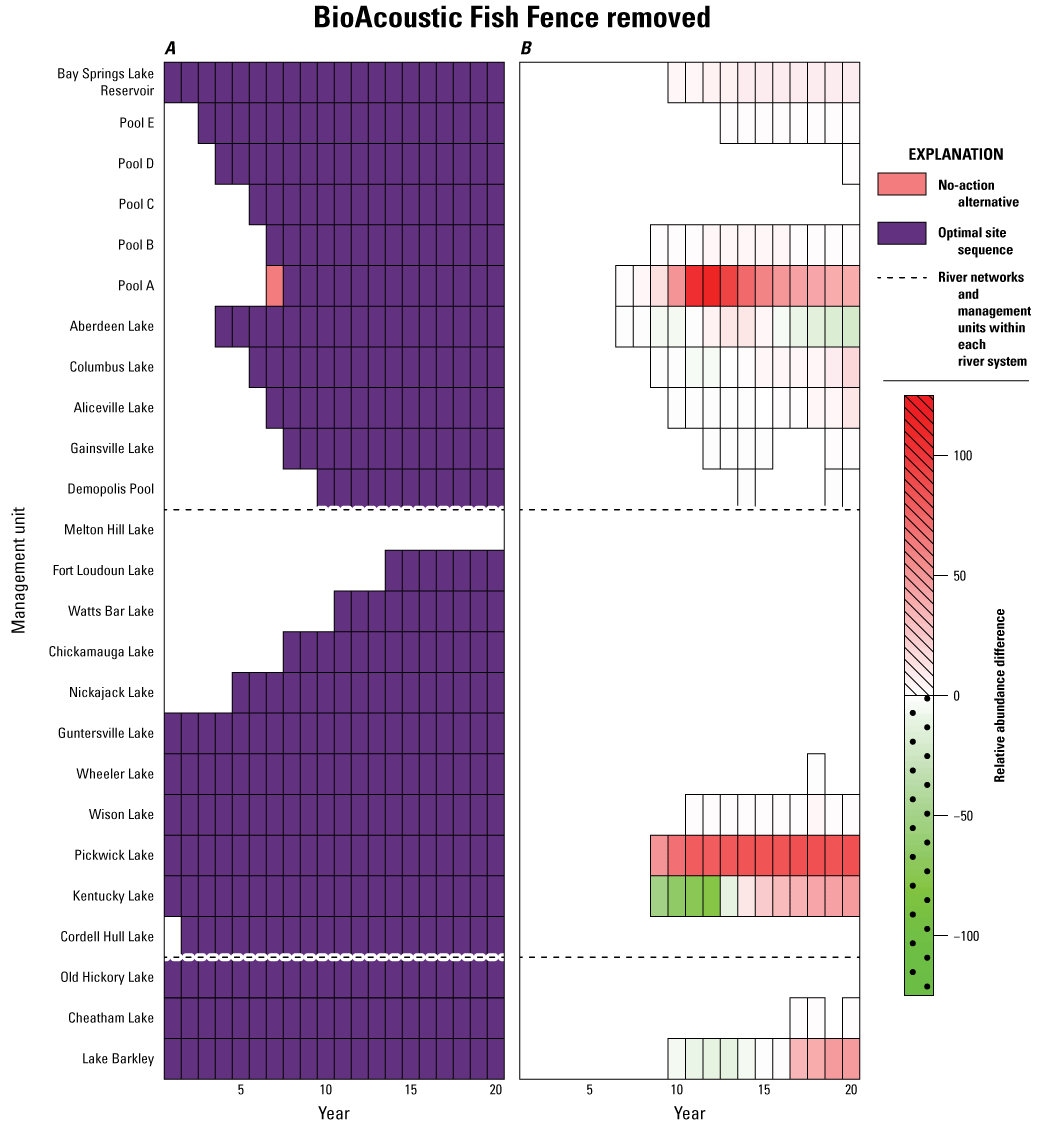
Distribution and abundance dynamics for the no action alternative when the BioAcoustic Fish Fence is removed and the downstream lock movement rate is 0.1. A, Differences in distribution between the optimal site sequence and the no-deterrent option. B, The absolute difference in invasive carp relative abundance between the optimal and the no-deterrent option.
Uncertainties associated with demographic rates, abundance, and distribution pose a challenge when evaluating deterrent site sequences or other control measures for invasive carp. Primarily, there is limited species information for newly invaded habitats, and the primary expansion pathways have yet to be challenged by invasive carp; therefore, upstream and downstream passage rates are unknown. Many of the parameters used to project invasive carp relative abundance can be monitored and likely estimated in the future as data accumulates from telemetry and deterrent studies. Regardless of the underlying uncertainties, decisions must be made; therefore, we did evaluate varying levels of downstream expansion rates given the unique downstream invasion risk to unoccupied Tennessee–Tombigbee Waterway management units. Additionally, low fish densities at the invasion front may be challenging to detect perfectly, resulting in false negatives. Time limitations during the Phase 1 process prevented a comprehensive evaluation of uncertainties; however, this analysis provided enough insight to the interest group that they could use the analysis to draft a recommendation letter for review by MICRA. MICRA then finalized, approved, and provided the draft recommendation letter to USACE for inclusion in PrEA. Phase 2 of this process includes a comprehensive evaluation of uncertainties and a more holistic set of management objectives.
References Cited
Barrowman, N.J., and Myers, R.A., 2000, Still more spawner-recruitment curves—The hockey stick and its generalizations: Canadian Journal of Fisheries and Aquatic Sciences, v. 57, no. 4, p. 665–676 [Also available at https://doi.org/10.1139/f99-282.]
Chick, J.H., Gibson-Reinemer, D.K., Soeken-Gittinger, L., and Casper, A.F., 2020, Invasive silver carp is empirically linked to declines of native sport fish in the Upper Mississippi River System: Biological Invasions, v. 22, no. 2, p. 723–734. [Also available at https://doi.org/10.1007/s10530-019-02124-4.]
Conroy, M.J., and Peterson, J.T., 2013, Decision making in natural resource management—A structured, adaptive approach: John Wiley & Sons, 456 p. [Also available at https://doi.org/10.1002/9781118506196.]
Cupp, A.R., Brey, M.K., Calfee, R.D., Chapman, D.C., Erickson, R., Fischer, J., Fritts, A.K., George, A.E., Jackson, P.R., Knights, B.C., Saari, G.N., and Kočovský, P.M., 2021, Emerging control strategies for integrated pest management of invasive carps: Journal of Vertebrate Biology, v. 70, no. 4, p. 21057.21051. [Also available at https://doi.org/10.25225/jvb.21057.]
Fritts, A.K., Gibson-Reinemer, D., Stanton, J.C., Mosel, K.J., Brey, M.K., Vallazza, J.M., Appel, D., Faulkner, J., Tompkins, J., Castro-Santos, T., Sholtis, M., Turnpenny, A., Sorensen, P., and Simmonds, R., 2023, Multimodal invasive carp deterrent study at Barkley Lock and Dam—Status update through 2022: U.S. Geological Survey Open-File Report 2023–1051, 18 p., accessed June 2024 at https://doi.org/10.3133/ofr20231051.
Gregory, R., Failing, L., Harstone, M., Long, G., McDaniels, T., and Ohlson, D., 2012, Structured decision making: John Wiley & Sons, 314 p. [Also available at https://doi.org/10.1002/9781444398557.]
Kramer, N.W., Phelps, Q.E., Pierce, C.L., and Colvin, M.E., 2019, A food web modeling assessment of Asian carp impacts in the Middle and Upper Mississippi River, USA: Food Webs, v. 21, p. e00120. [Also available at https://doi.org/10.1016/j.fooweb.2019.e00120.]
Patterson, L.A., and Doyle, M.W., 2018, A nationwide analysis of U.S. Army Corps of Engineers reservoir performance in meeting operational targets: Journal of the American Water Resources Association, v. 54, no. 2, p. 543–564. [Also available at https://doi.org/10.1111/1752-1688.12622.]
Post van der Burg, M., Smith, D.R., Cupp, A.R., Rogers, M.W., and Chapman, D.C., 2021, Decision analysis of barrier placement and targeted removal to control invasive carp in the Tennessee River Basin: U.S. Geological Survey Open-File Report 2021–1068, 28 p., accessed June 2024 at https://doi.org/10.3133/ofr20211068.
Quinn, T.J., and Deriso, R.B., 1999, Quantitative fish dynamics: New York, Oxford University Press, 542 p. [Also available at https://doi.org/10.1093/oso/9780195076318.001.0001.]
Ricker, W.E., 1975, Computation and interpretation of biological statistics of fish populations: Ottawa, Canada, Department of the Environment Fisheries and Marine Service, Bulletin of the Fisheries Research Board of Canada, Bulletin 191, 401 p. [Also available at https://waves-vagues.dfo-mpo.gc.ca/Library/1485.pdf.]
Ridgway, J.L., and Bettoli, P.W., 2017, Distribution, age structure, and growth of bigheaded carps in the lower Tennessee and Cumberland Rivers: Southeastern Naturalist, v. 16, no. 3, p. 426–442. [Also available at https://doi.org/10.1656/058.016.0309.]
Tennessee Valley Authority, 2025, Navigation on the Tennessee River: Tennessee Valley Authority web page, accessed May 2025 at https://www.tva.com/environment/managing-the-river/navigation-on-the-tennessee-river.
U.S. Army Corps of Engineers, undated, 6-Step planning process: accessed September 30, 2024, at https://planning.erdc.dren.mil/toolbox/processes.cfm?Id=0&Option=6-Step%20Planning%20Process&List=Visitor.
U.S. House of Representatives, 2020, Water Resources Development Act of 2020: U.S. Congress H.R. 7575, 209 p., accessed June 2024 at https://www.congress.gov/bill/116th-congress/house-bill/7575.
U.S. Senate Environment and Public Works Committee, 2022, Water Resources Development Act of 2022: U.S. Senate Report 117–224, 76 p., accessed June 2024 at https://www.congress.gov/bill/117th-congress/senate-bill/4136/all-actions.
Appendix 1. Problem Statement
-
● current invasive carp population status and dynamics of invasive carp populations in the river system, including the environmental effects and habitat potential for expansion and establishment;
-
● potential effects of invasive carp on system components like native mollusks and fish, recreational use of the system, and sportfish;
-
● effectiveness of current and developing management actions, logistics implementation timeline; and
-
● public and political support for management actions.
-
● funding constraints to implement the strategy (for example, cost-share, nonfederal sponsor) and support long-term operation and maintenance,
-
● compliance with State and Federal laws and regulations,
-
● maintenance of navigation and operational authorizations,
-
● infrastructure constraints like physical facilities, and
-
● uncertainties associated with management action effectiveness, non-Federal sponsor availability, and invasive carp population dynamics.
References Cited
U.S. House of Representatives, 2020, Water Resources Development Act of 2020: U.S. Congress H.R. 7575, 209 p., accessed June 2024 at https://www.congress.gov/bill/116th-congress/house-bill/7575.
U.S. Senate Environment and Public Works Committee, 2022, Water Resources Development Act of 2022: U.S. Senate Report 117–224, 76 p., accessed June 2024 at https://www.congress.gov/bill/117th-congress/senate-bill/4136/all-actions.
Appendix 2. System And Projection Model Parameters
Table 2.1.
Management unit descriptions and delineations for units in the Ohio River, Tennessee River, Cumberland River, Tennessee–Tombigbee Waterway, and Tombigbee River.[km2, square kilometer; NA, not applicable]
Table 2.2.
Connection information for management units.[ID, identifier; US, upstream; DS, downstream; L&D, lock and dam; NA, management unit numbers for DS or US connections outside of the study area]
Estimating Carrying Capacity
We used linear regression to estimate carrying capacity values needed to project density dependent relative abundance dynamics for Cumberland River and Tennessee–Tombigbee Waterway management units. Specifically, we developed a predictive linear relation of carrying capacity values elicited for Tennessee River management units available from Post van der Burg and others (2021) with management unit area. The linear model was fit using the lm() function in R (R Core Team, 2022). The model fit the data well (probability value=0.0015, coefficient of determination=0.65). The fitted model used to estimate carrying capacity for Cumberland River and Tennessee–Tombigbee Waterway management units was Ki=528.8+11.2×Areai, where K is the carrying capacity, i indexes management unit, and the area was the management unit area measured in square kilometers and reported in table 2.1.
References Cited
Post van der Burg, M., Smith, D.R., Cupp, A.R., Rogers, M.W., and Chapman, D.C., 2021, Decision analysis of barrier placement and targeted removal to control invasive carp in the Tennessee River Basin: U.S. Geological Survey Open-File Report 2021–1068, 28 p., accessed June 2023 at https://doi.org/10.3133/ofr20211068.
R Core Team, 2022, R—A language and environment for statistical computing: R Foundation for Statistical Computing, accessed June 2024 at https://www.R-project.org.
Appendix 3. Deterrent Sequence Rankings
Invasive carp deterrent site sequence rankings versus utility value for analyses where the BioAcoustic Fish Fence at Barkley lock and dam (L&D) remained in place or was removed. A, Barkley L&D remained in place and scenario was evaluated assuming a movement rate of 0.0. B, Barkley L&D was removed and scenario was evaluated assuming a movement rate of 0.0. C, Barkley L&D remained in place and scenario was evaluated assuming a movement rate of 0.001. D, Barkley L&D was removed and scenario was evaluated assuming a movement rate of 0.001. E, Barkley L&D remained in place and scenario was evaluated assuming a movement rate of 0.01. F, Barkley L&D was removed and scenario was evaluated assuming a movement rate of 0.01. G, Barkley L&D remained in place and scenario was evaluated assuming a movement rate of 0.1. H, Barkley L&D was removed and scenario was evaluated assuming a movement rate of 0.1.
Conversion Factors
Datums
Vertical coordinate information is referenced to the National Geodetic Vertical Datum of 1983.
Horizontal coordinate information is referenced to the North American Datum of 1983 (NAD 83).
Altitude, as used in this report, refers to distance above the vertical datum.
For more information about this publication, contact:
Director, USGS Columbia Environmental Research Center
4200 New Haven Road
Columbia, MO 65201
573–875–5399
For additional information, visit: https://www.usgs.gov/centers/cerc
Publishing support provided by the
Rolla and Baltimore Publishing Service Centers
Disclaimers
Any use of trade, firm, or product names is for descriptive purposes only and does not imply endorsement by the U.S. Government.
Although this information product, for the most part, is in the public domain, it also may contain copyrighted materials as noted in the text. Permission to reproduce copyrighted items must be secured from the copyright owner.
Suggested Citation
Colvin, M.E., Aldridge, C.A., Jackson, N., and Post van der Burg, M., 2025, Evaluating deterrent locations and sequence in the Tennessee and Cumberland Rivers and the Tennessee–Tombigbee Waterway to minimize invasive carp occupancy and abundance: U.S. Geological Survey Open-File Report 2025–1039, 27 p., https://doi.org/10.3133/ofr20251039.
ISSN: 2331-1258 (online)
Study Area
| Publication type | Report |
|---|---|
| Publication Subtype | USGS Numbered Series |
| Title | Evaluating deterrent locations and sequence in the Tennessee and Cumberland Rivers and the Tennessee–Tombigbee Waterway to minimize invasive carp occupancy and abundance |
| Series title | Open-File Report |
| Series number | 2025-1039 |
| DOI | 10.3133/ofr20251039 |
| Publication Date | July 22, 2025 |
| Year Published | 2025 |
| Language | English |
| Publisher | U.S. Geological Survey |
| Publisher location | Reston, VA |
| Contributing office(s) | Columbia Environmental Research Center, Northern Prairie Wildlife Research Center |
| Description | vii, 27 p. |
| Country | United States |
| State | Alabama, Georgia, Kentucky, Mississippi, Tennessee, Virginia |
| Other Geospatial | Cumberland River, Tennessee River, Tennessee-Tombigbee Waterway |
| Online Only (Y/N) | Y |
| Additional Online Files (Y/N) | N |