

Environmental Characteristics of Select Managed Ponds in the Sacramento–San Joaquin Delta: Implications for Native Fish Conservation and Research
Links
- Document: Report (2.7 MB pdf) , HTML , XML
- Data Release: USGS data release - Water quality and biological data from ponds on islands of the Sacramento–San Joaquin Delta
- Download citation as: RIS | Dublin Core
Acknowledgments
Funding was provided by Metropolitan Water District and State Water Contractors. U.S. Geological Survey staff Justin Clause, Matthew De Parsia, Jeff Gronemyer, Anthony Martinez, Danielle Palm, Matthew Uychutin, Veronica Violette, and Mitch Zheng assisted with fieldwork.
Abstract
The use of wetlands to support native fish research and conservation efforts in the Sacramento–San Joaquin Delta (Delta) of California is a growing priority. The purpose of our study was to examine the physiochemical and biological characteristics of select managed ponds in the Delta to determine if they would be suitable habitats for research involving the conservation of delta smelt (Hypomesus transpacificus). We studied 10 managed ponds distributed across the central part of the Delta situated on Bacon Island and Bouldin Island in San Joaquin County, and Holland Tract and Webb Tract islands in Contra Costa County. The managed ponds had a diversity of physical habitat configurations and were not directly connected to waterways surrounding the islands and, therefore, not affected by tides. We studied the managed ponds from approximately November 2021 to December 2023 to assess water quality, zooplankton, fish, and pesticide metrics. Water levels in the managed ponds were managed to varying degrees and were mostly independent of climate-driven wet-dry seasonality. Water quality conditions varied among ponds and were independent of geographic location. Overall, mean monthly chlorophyll a concentration ranged from 15 to 57 (mean=30) micrograms per liter (µg/L), dissolved oxygen concentration ranged from 4 to 9 (mean=7) milligrams per liter (mg/L), pH was 8, salinity was 1 practical salinity units (PSU), specific conductance ranged from 1,202 to 1,839 (mean=1,471) microsiemens per centimeter (µS/cm), and turbidity ranged from 13 to 24 (mean=19) Formazin Nephelometric Units (FNU). Water temperature thresholds that contribute to stress (21 degrees Celsius [°C]) and mortality (28 °C) of delta smelt were often exceeded during summer and fall, though vertical stratification contributed to lower bottom temperatures in the deepest managed ponds, which could potentially provide thermal refugia for delta smelt so long as dissolved oxygen concentrations are suitable. Zooplankton populations were broadly similar among managed ponds and included calanoid and cyclopoid copepods that would be suitable prey for delta smelt. Overall average total zooplankton biomass, as measured with a Schindler-Patalas trap, was 0.6 µg/L (min=0, max=63.6) and peaked during spring at more than 4 µg/L. Fish populations highly varied among the managed ponds with potential predators of delta smelt such as largemouth bass (Micropterus salmoides) and black crappie (Pomoxis nigromaculatus) present in several of the managed ponds; predator distribution among ponds seemed to have been driven primarily by deliberate stocking to facilitate local fisheries. Measured pesticide concentrations were below U.S. Environmental Protection Agency Aquatic Life Benchmarks except for exceedances of three compounds (diuron [herbicide], clothianidin [insecticide], and deltamethrin [pyrethroid insecticide]) in samples collected from ponds on Bouldin Island and Webb Tract. Overall, most managed ponds seemed suitable to support delta smelt, though physical control of potential predators and summer temperature might be needed. The results provide guidance on how to engineer and manage new managed ponds to support research and conservation efforts for delta smelt and other native fishes.
Introduction
The Sacramento–San Joaquin Delta (Delta) of California was historically a vast inland wetland system (Whipple and others, 2012). Land surface elevation of wetlands kept pace with sea level rise and produced organic peat soils up to 20 meters (m) in depth (Drexler, 2011). The natural system was heavily disturbed and altered starting in the late 1800s when about 95 percent of Delta wetlands were diked and drained to create “islands” for agricultural use (Drexler and others, 2009; Whipple and others, 2012). The drainage of wetlands and associated agricultural practices have contributed to the loss of peat soils and resulted in land surface subsidence up to 7 m below sea level on Delta islands (Weir, 1950; Prokopovich, 1985; Deverel and Rojstaczer, 1996; Lund and others, 2007). This habitat alteration and land subsidence has greatly affected the Delta’s ecology, increased carbon emissions, and, at present, pose a substantial threat to the integrity of the levees built to create the islands (Lund and others, 2007).
Restoration has been conceived as a tool to mitigate the loss of historic wetlands. Restoration in the form of creating managed impounded wetlands on Delta islands has the potential to halt oxidative loss of peat soils and may accrete organic matter, thereby gaining land surface elevation (Miller and others, 2008; Miller and Fujii, 2011). Restored wetlands also may play an important but complicated role for mitigating the effects of climate change. Converting drained peat soils to wetlands can sequester carbon but also may generate high methane emissions (Hemes and others, 2019; Arias-Ortiz and others, 2021). Results of studies of restored experimental wetlands on Delta islands indicate climate benefits are highly variable and may take upwards of two to eight decades to generate net positive greenhouse gas benefits (Deverel and others, 2014; Chamberlain and others, 2018). Considering slow and uncertain land surface elevation gains and climate benefits, there is interest in identifying additional beneficial uses of restored wetlands on Delta islands for conservation purposes. One such purpose under consideration is to use managed wetland ponds as tools to support native fish conservation efforts. A fundamental first step for this effort is examining managed pond habitat characteristics to assess their suitability to support native fish.
The purpose of our study was to examine the physiochemical and biological characteristics of select managed ponds on Delta islands to determine if they would be suitable habitats for studies focused on the conservation of delta smelt (Hypomesus transpacificus). Delta smelt is an imperiled species thought to be on the brink of extinction (Moyle and others, 2016; Hobbs and others, 2017). Recovery of delta smelt is important, among many reasons, because its critical habitat, the Delta, is a key component of California’s water supply and is subject to management actions to protect delta smelt that may affect water supply (Moyle and others, 2018). Supplementation of the wild delta smelt population with artificially propagated fish is considered a vital step in preventing extirpation from the wild (Lessard and others, 2018; Hung and others, 2019). Opportunities for research and rearing of artificially propagated delta smelt are currently limited (Lindberg and others, 2013). Our objective was to determine if managed ponds on Delta islands could be useful tools for research and development aspects of delta smelt reintroduction. One potential application would be to expand the limited existing infrastructure by using managed ponds to rear artificially propagated delta smelt before their release into Delta sloughs or channels (Maynard and others, 2004; Garlock and others, 2014).
Study Area
Our study involved a total of 10 managed ponds distributed across four separate central Delta islands: Bacon Island, Bouldin Island, Holland Tract, and Webb Tract (fig. 1). The managed ponds do not have official names, so we refer to them in a geographical context (Bacon North, and so on; table 1; fig. 1). The managed ponds have a variety of origins, including (1) borrow pits that were created from excavation of material used to repair levees (Bouldin East and Bouldin West), (2) eroded depressions that were not reclaimed after island flooding caused by levee breaks (Holland North), and (3) habitats created and managed for a variety of recreation and conservation purposes (Bacon North, Bacon South, Holland Middle, Holland South, Webb North, Webb Middle, and Webb East). The managed ponds had a diversity of physical configurations (table 1). They ranged in perimeter length from 470 m (Holland Middle) to 2,089 m (Webb East), ranged in surface area from 0.9 hectares (ha; Holland Middle) to 9.1 ha (Bacon North), and ranged in maximum depth from 0.7 m (Holland Middle) to 5.3 m (Bouldin East; table 1). Agriculture was the dominant land use on all islands, and pond perimeters were variably (0 to 100 percent) buffered from agricultural activities by riparian habitat that was broadly characterized into two groups: (1) tules, including other emergent wetland vegetation; and (2) forest, including cottonwoods, willows, and other woody plants (table 1). The managed ponds were not directly connected to sloughs surrounding the islands and were, therefore, not affected by tides. Water levels in the managed ponds were managed to varying degrees for different purposes based on land use activities on specific islands. Water is transported on and off the islands from adjacent sloughs via pumps and can be moved within islands through small canals and other infrastructure; water management activities are not documented quantitatively, and therefore, specific corresponding data are not available. Thus, water depth and associated volume was variable and largely independent of climatic wet-dry seasonality (fig. 2). The Holland Middle and South ponds, which lack inlet/outlet canals, dried up during this study.
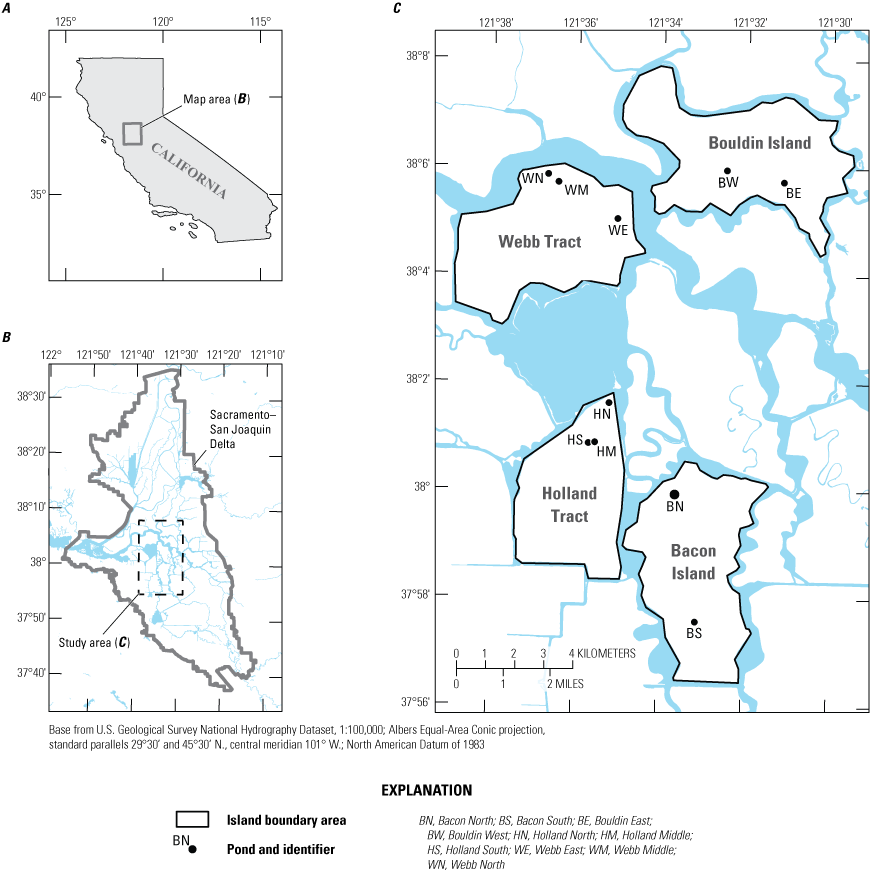
A, Location of the Sacramento–San Joaquin Delta in California; B, study area within the Sacramento–San Joaquin Delta; and C, managed pond study sites.
Table 1.
Managed pond study site physical characteristics within the Sacramento–San Joaquin Delta in California.[ha, hectare; m, meter; %, percentage]
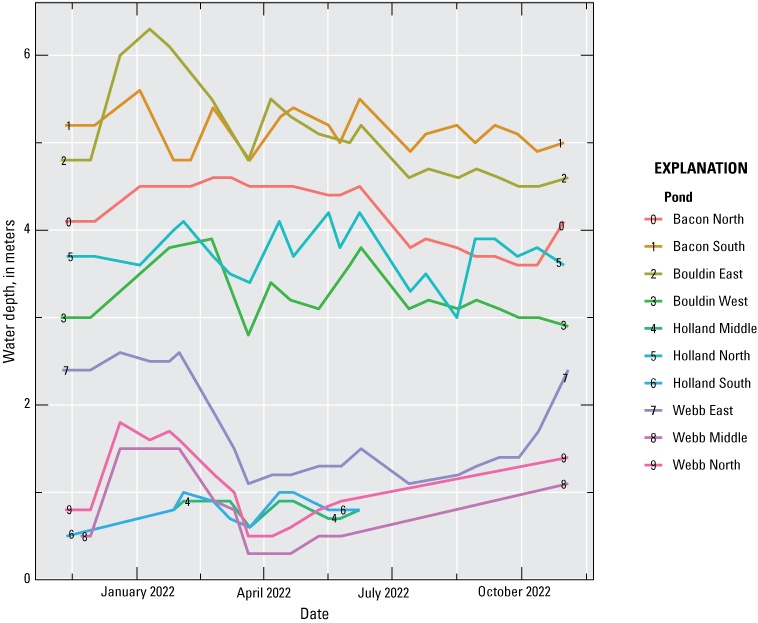
Water depth time series for managed pond study sites within the Sacramento–San Joaquin Delta in California. The Holland Middle and Holland South Pond study sites do not have complete time series because they dried up during the study.
Methods
We sought to generate a comprehensive baseline assessment of the overall physiochemical and biological characteristics of each managed pond. Our approach involved characterizing aspects of (1) water quality parameters using a combination of continuous and discrete measurements; (2) pesticide concentrations (the primary contaminants of concern) in water, suspended sediment, and bed sediment of managed ponds and adjoining inlet/outlet canals; (3) zooplankton species composition and density; and (4) fish occupancy. The study period was from November 2021 to December 2022.
Water Quality
Various water quality parameters were measured during the duration of the full study period. This included continuous (every 15 minutes) measurements of water temperature (in degrees Celsius [°C]) recorded by HOBO Pro v2 data loggers (Onset, Bourne, Massachusetts). Data loggers were positioned at the approximate center of each managed pond, near the surface and bed of managed ponds greater than 1.5 m in depth (Bacon North, Bacon South, Bouldin East, Bouldin West, Holland North, and Webb East) and only at mid-depth (0.75 m) in managed ponds less than 1.5 m in depth (app. 1; table 1). Discrete measurements of water temperature (°C), dissolved oxygen concentration in milligrams per liter (mg/L), specific conductance in microsiemens per centimeter (µS/cm), salinity in practical salinity units (PSU), turbidity in Formazin Nephelometric Units (FNU), chlorophyll a concentration in micrograms per liter (µg/L), and pH were obtained from handheld YSI EXO2 sondes (Yellow Springs Instruments, Yellow Springs, Ohio). Discrete measurements were made approximately every 2 weeks at the same locations within ponds where the HOBO loggers were positioned.
Additional water quality parameters were measured seasonally, once during winter and once during summer, to characterize baseline conditions. In these seasonal events, we measured concentrations of nutrients (ammonia, nitrate, nitrite, total nitrogen, organic nitrogen, and orthophosphate), metals (barium, calcium, magnesium, manganese, selenium, strontium, and zinc), sediment (suspended), dissolved organic carbon (DOC), chlorophyll a and pheophytin a, and inorganic aspects of water quality (silica and hardness). Water samples for analysis were collected with a Van Dorn sampler at the same locations and depths within ponds where the HOBO loggers were positioned. Water samples for suspended sediment analysis were collected in 1-liter (L) plastic bottles, stored at room temperature, and analyzed at the U.S. Geological Survey (USGS) Sediment Lab in Santa Cruz, Calif. Water samples collected for chlorophyll a, metals, and nutrients were stored on wet ice (less than 24 hours) and refrigerated until filtered in the laboratory. Chlorophyll a samples were prepared by filtering sample water over a 47 millimeter (mm) diameter, 1.7-micrometer (µm) pore size, pre-combusted glass fiber filter. Water samples for metals, nutrients, and dissolved organic carbon analyses were filtered through a 0.45-µm Pall capsule filter using a peristaltic pump. Water samples for metal analysis were collected in a 250-milliliter (mL) acid-rinsed clear polyethylene bottle and preserved with 2 mL of 7.5 normal (N) nitric acid (Ultrex HNO3). Water samples for nutrient analysis were collected in 125-mL amber-plastic bottles. Water samples for DOC analysis were collected in 125-mL glass-amber bottles and preserved with 1 mL of 4.5 N sulfuric acid (H2SO4). Chlorophyll a, metals, nutrients, and DOC samples were analyzed by the USGS National Water Quality Laboratory in Denver, Colorado.
Pesticides
Pesticides were assessed at three separate sampling events, which we term surveys, occurring in March 2022, June 2022, and February 2023. Survey periods were chosen to represent wet and dry seasons. Water, suspended sediment, and bed sediment samples were collected in each managed pond. Additional water samples were collected from select adjoining inlet/outlet canals (app. 2). Managed pond water samples for pesticide analysis were collected in 1-L amber-glass bottles using a weighted bottle sampler at approximately 0.5 m depth. Managed pond water samples for glyphosate analysis were collected by submerging a 50-ml amber-glass vial to a depth of 0.5 m. Managed pond bed sediment samples were collected using an Ekman dredge. The top 2 centimeters (cm) of depositional sediment collected within the dredge was subsampled using a stainless-steel scoop and placed in 250-ml amber-glass jars. Managed pond inlet water samples were collected by hand submerging 1-L and 50-ml amber-glass bottles below the water surface. Managed pond inlet bed sediment samples were collected using a stainless-steel scoop to transfer the top 2 cm of depositional sediment from multiple sites within 1–3 m of each other into 250-ml amber-glass jars.
All samples were placed on wet ice immediately after collection and delivered to the USGS Organic Chemistry Research Laboratory in Sacramento, Calif., for processing and analysis. Water samples and associated filtered residues (suspended sediment) were processed following established procedures (Gross and others, 2024). Bed sediment samples were processed following Black and others (2023).
Water, suspended sediment, and bed sediment samples were analyzed using liquid chromatography (LC) and gas chromatography (GC) with tandem mass spectrometry (MS/MS) following procedures described in Gross and others (2024). Water samples were analyzed for 178 pesticides, suspended sediment samples were analyzed for 173 pesticides, and bed sediment samples were analyzed for 162 pesticides (app. 3, table 3.1). Samples were analyzed using LC/MS/MS followed by GC/MS/MS. Glyphosate samples were analyzed using an enzyme-linked immunosorbent assay (ELISA) microtiter plate (Gold Standard Diagnostics, Davis, California). Analysis was completed on a ChroMate microplate reader (RayBiotech, Peachtree Corners, Georgia) and the absorbance was read at 450 nanometers (nm). Evaluation was performed using a 4-parameter logistic regression. All samples were analyzed in duplicate, and the reported concentrations were the average of the duplicate readings. Method detection and reporting limits for water and suspended sediment pesticide analyses were determined by U.S. Environmental Protection Agency (EPA) guidelines (U.S. Environmental Protection Agency, 2016) and described in Gross and others (2024). For glyphosate analyses by ELISA, the least detectable dose was 50 nanograms per liter (ng/L) and concentrations less than 75 ng/L are below the reporting limit.
Zooplankton
Zooplankton species composition and density were assessed approximately once per month. Samples to characterize zooplankton were collected using a 12-L Schindler-Patalas plankton trap fitted with a 200-ml dolphin bucket with 61-micron mesh and Nitrex filter net (54-mm cod end, 311-mm long, 63 micron). The Schindler-Patalas trap was used because variable water depth and vegetation density within and among managed ponds made it impossible to collect consistent, standardized samples with other methods, such as nets towed or retrieved through the water column. One sample was collected at a depth of approximately 1 m at the same geographical locations within managed ponds where the HOBO loggers were positioned. Samples were preserved in the field in 10-percent formalin and analyzed by a contractor (EcoAnalysts, Moscow, Idaho).
Fish
Each managed pond was comprehensively surveyed once to determine the presence-absence of individual fish species. One or more sampling gear types and methods—beach seine, gillnet, and boat electrofishing—were used, as feasible, in individual managed ponds based on their physical habitat in attempt to capture all species present. Beach seining was done in Bacon North, Bouldin East, Bouldin West, Holland Middle, and Holland South. Electrofishing was done in Bacon South, Bouldin East, Bouldin West, Holland North, Webb East, Webb Middle, and Webb North. Gillnetting was done in Bouldin East, Bouldin West, Holland North, and Webb East. Sampling was done in March and April 2022. The beach seine measured 6 × 1.2 m with 3-mm mesh. The gillnet measured 45.7 × 1.8 m with five equal length panels of 38-, 51-, 64-, 76-, and 89-mm mesh. Electrofishing was done with a Smith Root Model Generator Powered Pulsator pulsed direct current unit powered by a 5.5-horsepower generator mounted on a 3.6-m aluminum boat. All captured fishes were identified to species and released alive.
Data Analysis
Tabular and graphical summaries of data were constructed to assess patterns of measured parameters within and among ponds during the study period. For example, continuous water temperature data were plotted in time series with reference to temperature threshold values that contribute to stress (21 °C) and mortality (28 °C) of delta smelt (Hung and others, 2022). In two cases, we ran a principal components analysis (PCA) to statistically characterize dominant modes of variability within and among managed pond specific characteristics (R Core Team, 2020). These two cases involved: (1) discrete water quality measurements and (2) zooplankton species composition data. For the water quality PCA, we examined select water quality variables measured each month (temperature, dissolved oxygen concentration, turbidity, specific conductance, chlorophyll concentration, and pH), and included measurements taken at the surface or middle depth of each managed pond. For the zooplankton PCA, we included adult life stages of taxa, which consisted of greater than or equal to 1 percent of the overall total biomass reported across all managed ponds. It is noted that we also ran extensive exploratory modeling of data to identify relationships among specific managed ponds, water quality, zooplankton, and fish but ultimately deemed such analyses uninformative because it was apparent that pond management activities (for example, water level management and fish introductions) overwhelmed natural ecological processes.
Data Availability
Continuous and discrete water quality, zooplankton, and fish data are available in a USGS data release from Buxton and others (2023). Seasonal water quality and pesticide data are available from U.S. Geological Survey (2024). Full site lists are in appendixes 1 and 2.
Results
Water Quality
Continuous water temperature measurements indicated that water temperatures ranged from approximately 8 °C in winter to approximately 30 °C in summer, with patterns that were generally similar among ponds (fig. 3), except for Bacon South at the bottom. Seasonal vertical stratification of temperature was also observed. Bottom temperatures were in general, approximately 2–5 °C cooler than surface temperatures from approximately May to October (fig. 3). The delta smelt temperature stress threshold value of 21 °C was exceeded from May through October at the bottom and surface, with occasional surface exceedances also occurring as early as March and as late as November (table 2; fig. 3). The delta smelt temperature mortality threshold value of 28 °C was exceeded intermittently only at the surface from May through October (table 2; fig. 3).
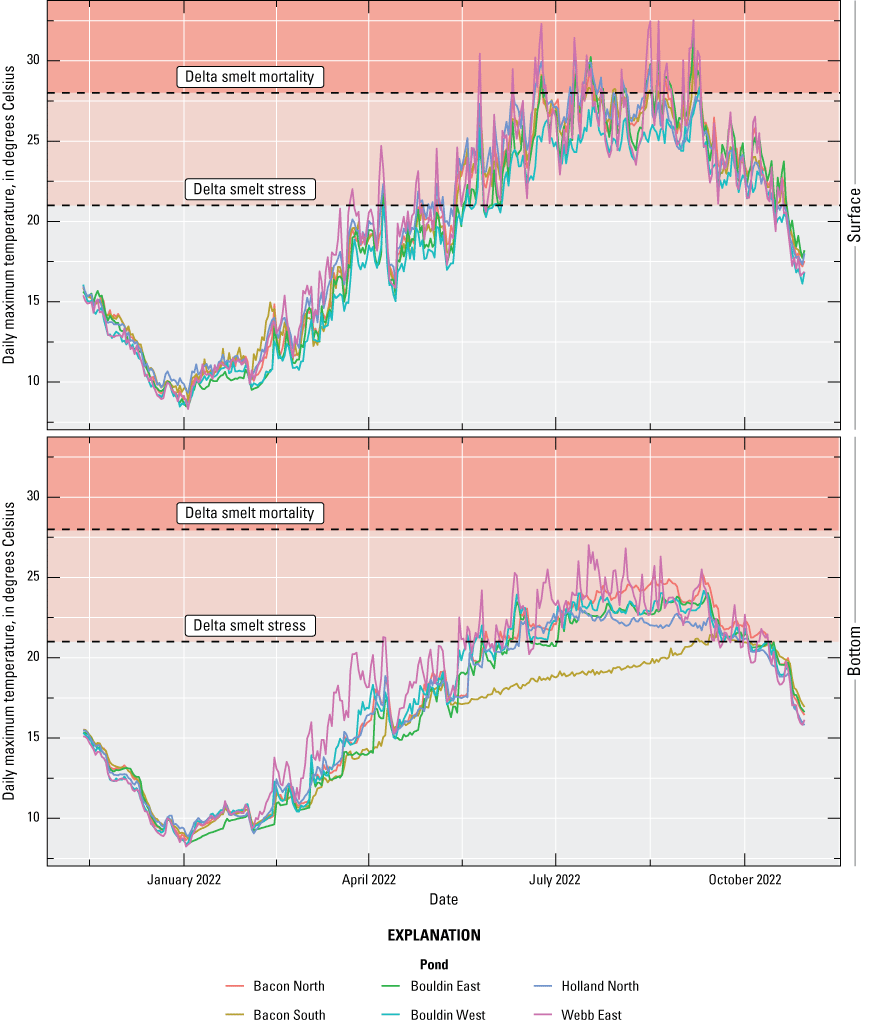
Maximum daily water temperature time series for surface and bottom of managed ponds greater than 1.5 meters (m) in depth within the Sacramento–San Joaquin Delta in California. Temperature ranges exceeding 21 degrees Celsius (°C) and 28 °C are indicated with colored shading and may potentially contribute to delta smelt stress and mortality, respectively (Hung and others, 2022). Data summarized from Buxton and others (2023).
Table 2.
Percentage of days that the daily maximum water temperature exceeded delta smelt temperature stress threshold of 21 degrees Celsius (°C) and temperature mortality threshold of 28 °C in managed ponds within the Sacramento–San Joaquin Delta in California. Data summarized from Buxton and others (2023).[≥, greater than or equal to]
Monthly discrete water quality measurements indicated a high degree of variability within and among ponds for all measured parameters (fig. 4). Overall, grand mean monthly (averaged across all ponds) chlorophyll a concentration was 30 µg/L, dissolved oxygen concentration was 7 mg/L, pH was 8, salinity was 1 PSU, specific conductance was 1,471 µS/cm, and turbidity was 19 FNU. Ponds greater than 1.5 m in depth (those in which we had surface and bottom measurements) indicated varying degrees of vertical stratification across all parameters as measured by percent difference of surface-to-bottom values (fig. 5). The most consistent pattern of vertical stratification was with temperature, dissolved oxygen concentration, and pH values being generally higher at surface than at bottom from approximately spring to summer, particularly in the deepest ponds (Bacon South, Bacon North, Holland North, Bouldin East, and Bouldin West; fig. 5). Results of the water quality PCA indicated water quality conditions were independent of geography with varying degrees of similarity among individual managed ponds (table 3; fig. 6). On Bacon Island, Bacon North was generally more turbid with higher pH and specific conductance than Bacon South. Similarly, on Bouldin Island, Bouldin West was generally more turbid with higher pH and specific conductance than Bouldin East. Holland Tract managed ponds indicated generally similar water quality conditions except that Holland Middle and Holland South had elevated salinity and specific conductance. Webb Tract managed ponds indicated the highest similarity in water quality parameters among managed ponds on an individual island.
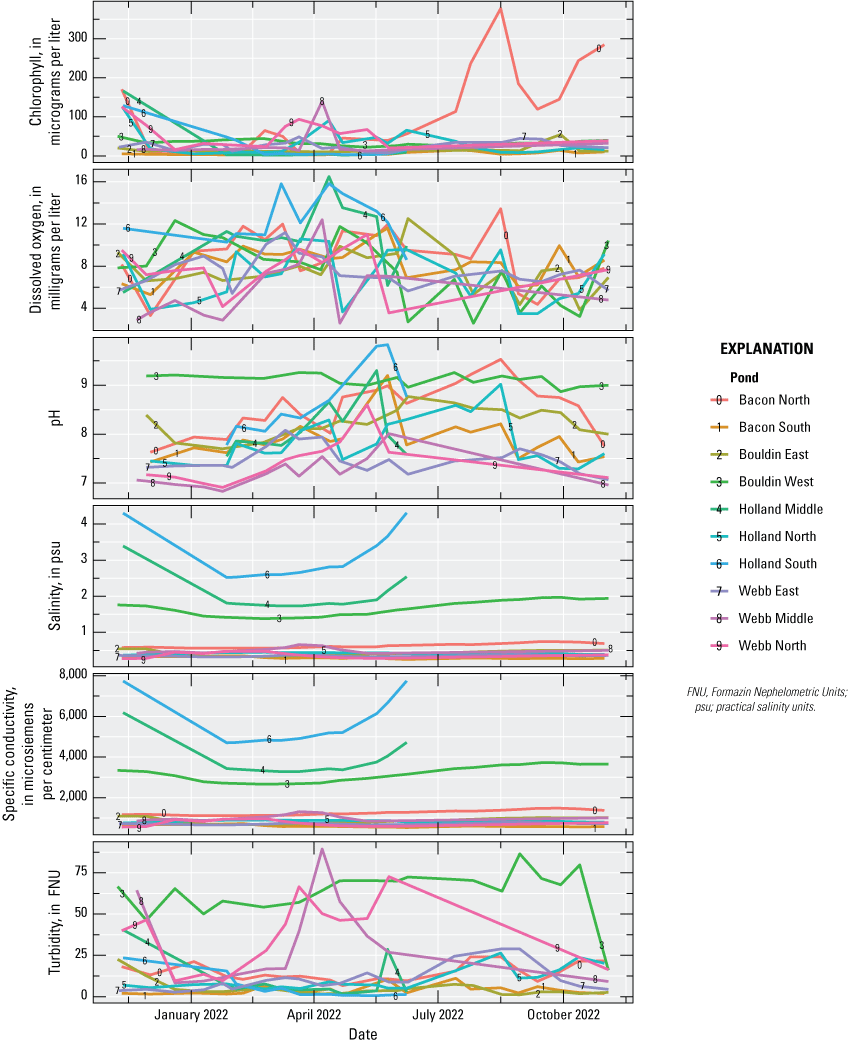
Water quality time series for managed ponds within the Sacramento–San Joaquin Delta in California. The Holland Middle and Holland South pond study sites do not have complete time series because they dried up during the study. Data summarized from Buxton and others (2023).
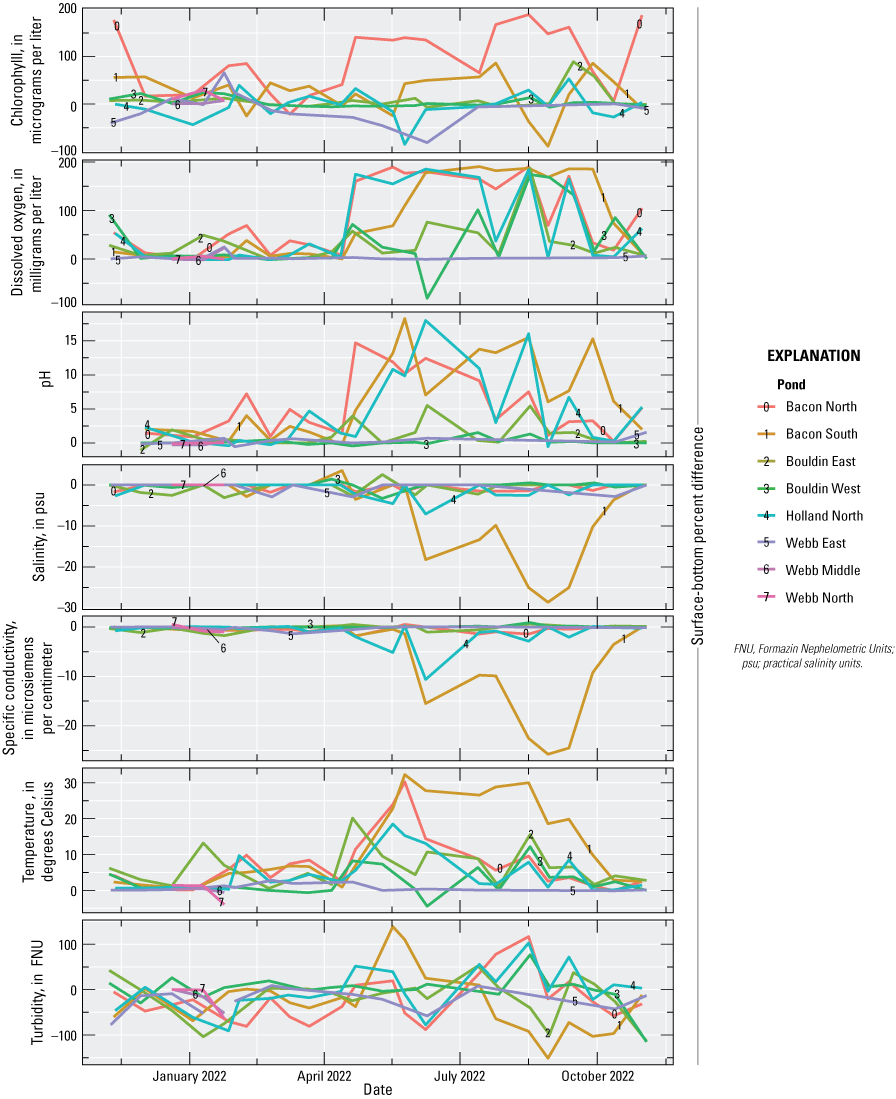
Water quality time series presented as the percent difference of surface relative to bottom, as an indicator of vertical stratification, for managed ponds greater than 1.5 m in depth within the Sacramento–San Joaquin Delta in California. Positive values indicate a water quality parameter showed higher values at the surface, whereas negative values indicate a water quality parameter showed higher values at the bottom. Data summarized from Buxton and others (2023).
Table 3.
Results of principal components analysis (PCA) completed separately on the discrete water quality measurements (Water quality PCA) and the zooplankton species composition data (Zooplankton PCA) for managed ponds within the Sacramento–San Joaquin Delta in California. Data summarized from Buxton and others (2023).[PC1, principal component 1; PC2, principal component 2; PC3, principal component 3]
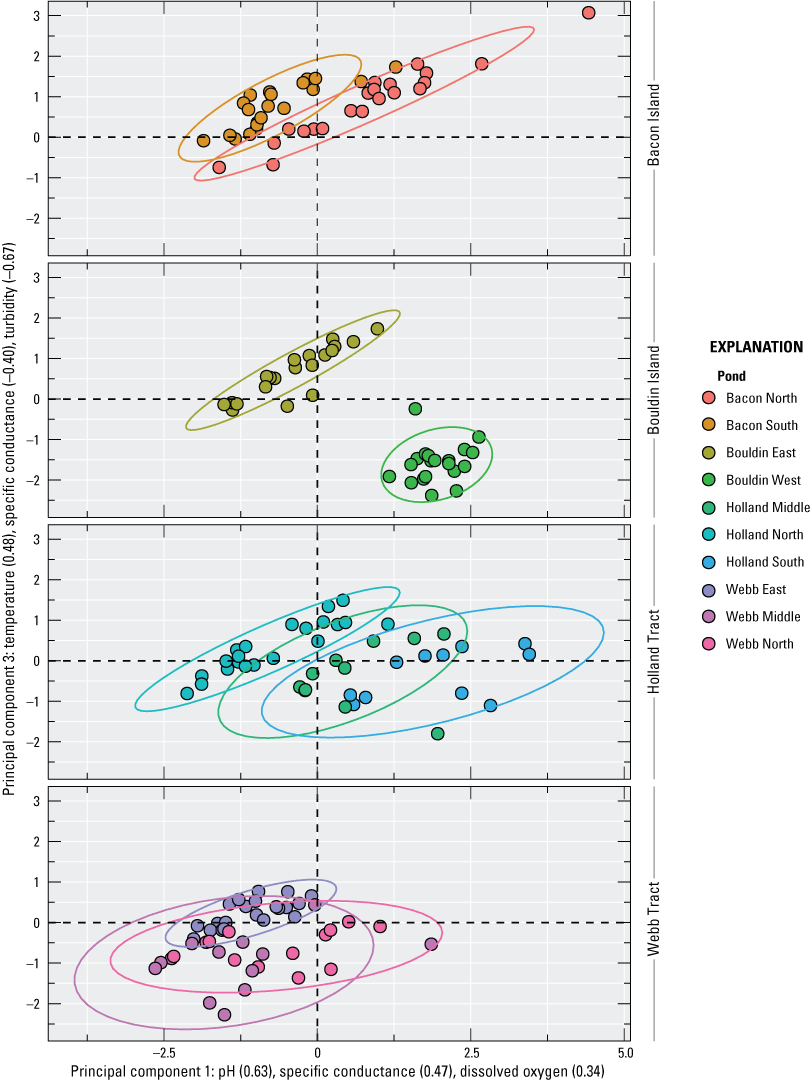
Scores from the first and third axes of a principal components analysis performed on discrete water quality data from managed ponds within the Sacramento–San Joaquin Delta in California. Scores are faceted by island to minimize superimposition and improve clarity. Ellipses are 95-percent confidence levels. Water quality parameters with loadings greater than 0.30 are shown for each axis. Data summarized from Buxton and others (2023).
Seasonal water quality measurements indicated high variability in the measured parameters among managed ponds and islands (table 4). See table 4 for absolute values of all measured parameters. Although overall variability was high, within islands, the measured parameters indicated the highest similarity among ponds on Webb Tract. Holland Middle and Holland South generally indicated the highest values across all non-organic parameters. Holland North indicated the highest concentrations of nutrient parameters (total nitrogen=3.1 mg/L; orthophosphate=0.975 mg/L; ammonia=1.956 mg/L). Among the organic parameters, DOC was highest in Bouldin West (58 mg/L) and chlorophyll a was highest in Bacon North (138.2 µg/L).
Table 4.
Water quality parameters measured in managed ponds within the Sacramento–San Joaquin Delta in California. Data summarized from Buxton and others (2023).[Values are the average (± one standard deviation) of four measurements: (1) winter, surface, (2) winter, bottom, (3) spring, surface, (4) spring, bottom. Abbreviations: mg/L, milligrams per liter; μg/L, micrograms per liter; —, below detection limits; ±, plus or minus]
Pesticides
A total of 35 pesticides were detected in water samples across all 3 surveys: 10 fungicides, 16 herbicides, and 9 insecticides (fig. 7; U.S. Geological Survey, 2024). The most frequently detected pesticides in water samples were methoxyfenozide (insecticide; 94 percent frequency), glyphosate (herbicide; 86 percent), and hexazinone (herbicide; 59 percent; U.S. Geological Survey, 2024). A total of 5 pesticides were detected in suspended sediment samples (deltamethrin [insecticide], dithiopyr [herbicide], p,p’-DDD [insecticide], p,p’-DDE [insecticide], and pendimethalin [herbicide]); though, in general, pesticide detections in suspended sediment samples were infrequent (fig. 7; U.S. Geological Survey, 2024). A total of 23 pesticides were detected in bed sediment samples (assessed only during Survey 1): 2 fungicides, 7 herbicides, 13 insecticides, and the synergist piperonyl butoxide (fig. 7; U.S. Geological Survey, 2024). The most frequently detected pesticides in bed sediment samples were p,p’-DDE (insecticide; 95 percent frequency), bifenthrin (insecticide; 75 percent), and pendimethalin (herbicide; 75 percent).
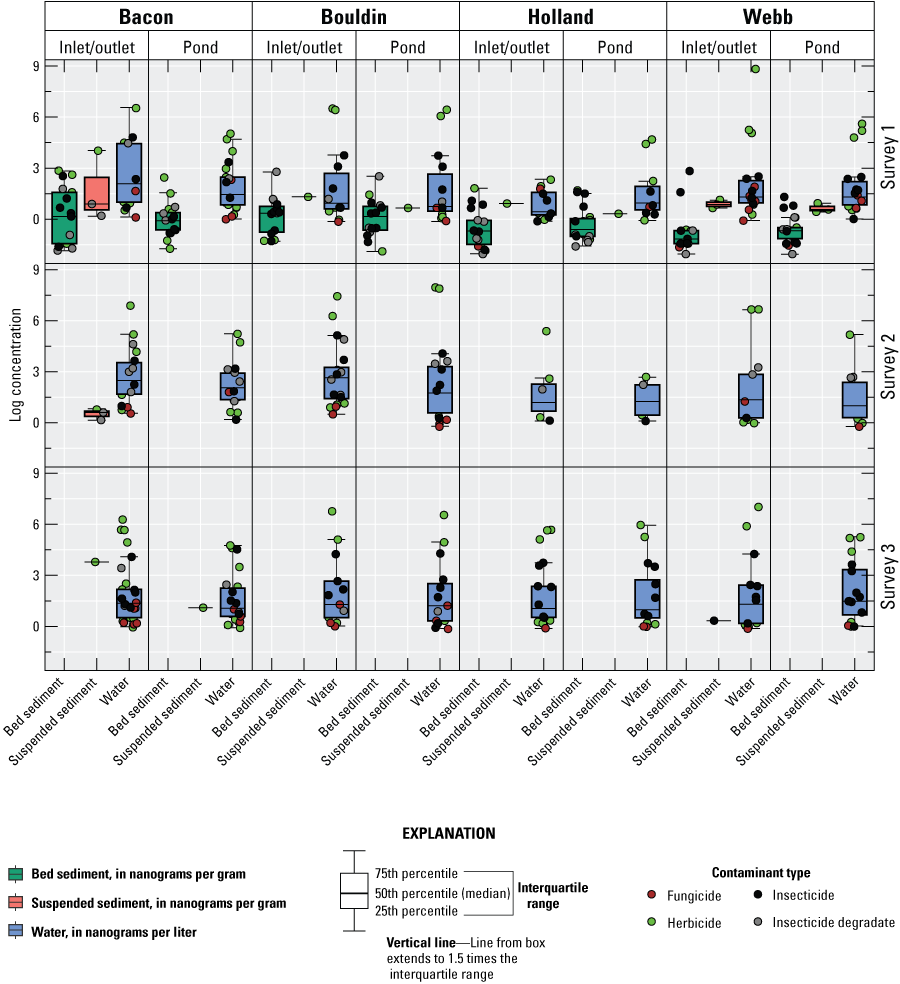
Pesticide concentrations in bed sediment (in nanograms per gram), suspended sediment (in nanograms per gram), and water (in nanograms per liter), by contaminant type, collected from managed ponds within the Sacramento–San Joaquin Delta in California. Concentration values are plotted on a log scale to facilitate visualization. Data summarized from U.S. Geological Survey, 2024.
In general, more pesticides, typically in higher concentrations, were detected in the adjoining inlet/outlet of the managed ponds than in the managed ponds themselves (figs. 7, 8). In water samples, 35 pesticides were detected in adjoining inlet/outlet canals versus 25 in managed ponds. In bed sediment samples, 22 pesticides were detected in adjoining inlet/outlet canals versus 19 in managed ponds. Total combined pesticide concentrations in water samples ranged from 3.7 ng/L at Holland Middle to 6,862 ng/L at the west inlet of Webb Tract East (fig. 8). Maximum concentrations of individual pesticides detected in water samples across sites were typically less than 100 ng/L, with the exception of the herbicides diuron (530 ng/L) at Bouldin East inlet, glyphosate (6,823 ng/L) at the west inlet of Webb East, hexazinone (292 ng/L) at Bacon South inlet, pendimethalin (288.1 ng/L) at Bacon South inlet, the diuron degradate DCPMU (134.3 ng/L) at Bouldin East inlet, and the insecticide methoxyfenozide (170.6 ng/L) at Bouldin East inlet (fig. 8; U.S. Geological Survey, 2024). For nearly all samples, herbicides made up the bulk of the total amount of pesticides, which was overwhelmingly composed of glyphosate (fig. 8). Total pesticide concentrations in water were generally higher for samples collected during Survey 2, although that result was heavily affected by samples from Bouldin Island (fig. 8). Total pesticide concentrations in bed sediment samples ranged from 0.5 to 62.0 nanograms per gram (ng/g) and, in most samples, insecticides made up most of the detections (U.S. Geological Survey, 2024). Pesticide concentrations in suspended sediment samples were generally below the method reporting limit but above the method detection limit for the pesticides detected (U.S. Geological Survey, 2024). Pesticide concentrations in bed sediment samples were generally less than 2 ng/g (fig. 7; U.S. Geological Survey, 2024).
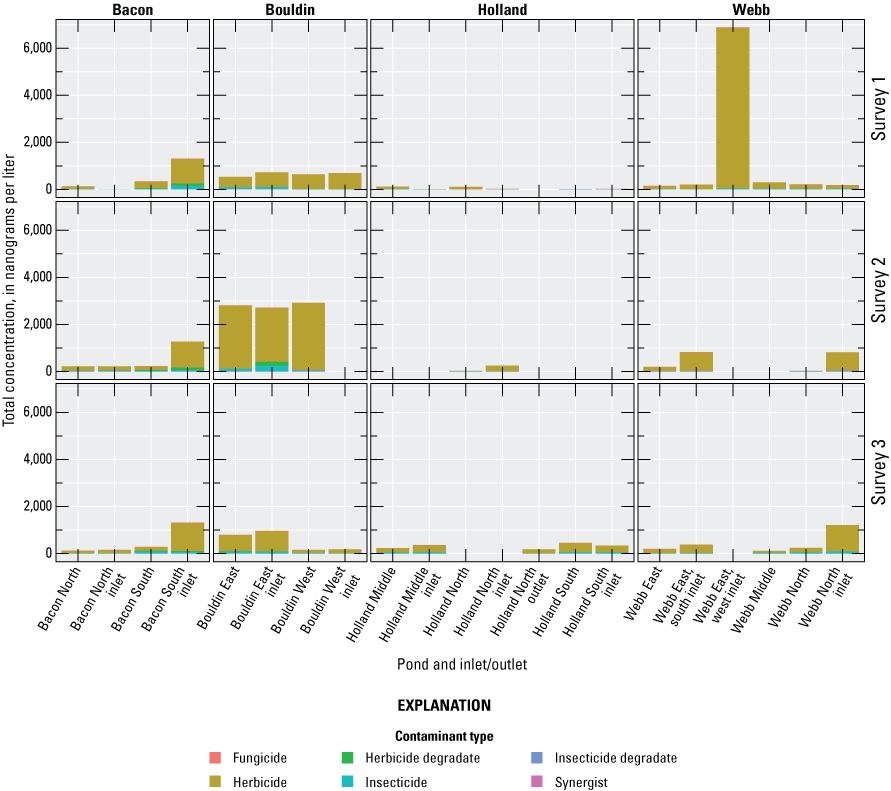
Total pesticide concentrations in water by contaminant type, collected from managed ponds within the Sacramento–San Joaquin Delta in California. Data summarized from U.S. Geological Survey, 2024.
Zooplankton
A total of 46 distinct zooplankton taxa were reported across all ponds (Buxton and others, 2023). Of this total, there were 18 taxa that each made up at least 1 percent of the total biomass (table 5). Numerous rare taxa comprised less than 1 percent of the total biomass. Copepod nauplii or copepodites, which were likely not effectively sampled, were excluded from the analysis. Overall total biomass was dominated by calanoid copepods (order Calanoida; 37.4 percent), cladocerans (order Diplostraca; 28.4 percent), cyclopoid copepods (order Cyclopoida; 29.3 percent), and ostracods (class Ostracoda; 4.9 percent; table 5; fig. 9). Arctodiaptomus dorsalis was the dominant calanoid copepod, Daphnia pulex was the dominant cladoceran, and Diacyclops thomasi was the dominant cyclopoid copepod. Ostracods were not identified to a lower taxonomic level of resolution and, therefore, are represented by the class Ostracoda. Overall average total zooplankton biomass was 0.6 µg/L (min=0, max=63.6) and peaked during spring at over 4 µg/L (fig. 9). Results of the zooplankton PCA (table 3) indicated high overlap in species composition among all ponds (fig. 10).
Table 5.
Zooplankton taxa which consisted of greater than or equal to 1 percent of the overall total biomass in managed ponds within the Sacramento–San Joaquin Delta in California. Data summarized from Buxton and others (2023).[Ostracoda orders are not provided. Abbreviations: μg, microgram; —, no data]
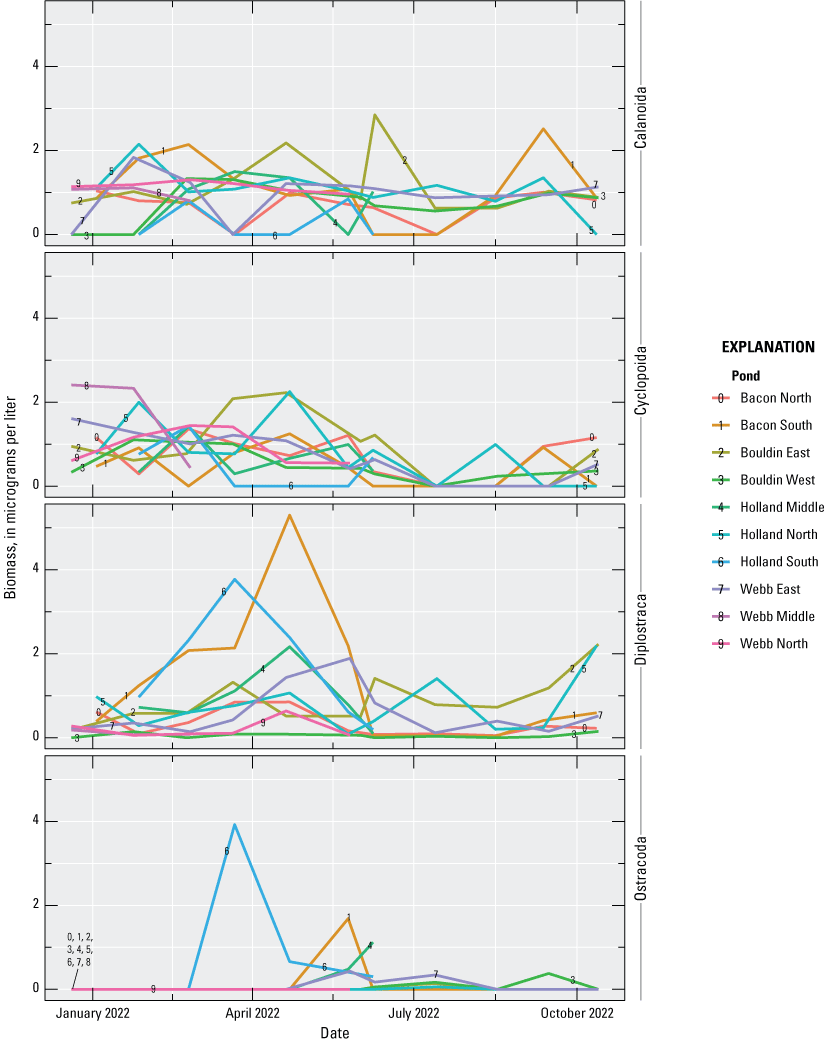
Zooplankton biomass time series in managed ponds within the Sacramento–San Joaquin Delta in California. Data summarized from Buxton and others (2023).
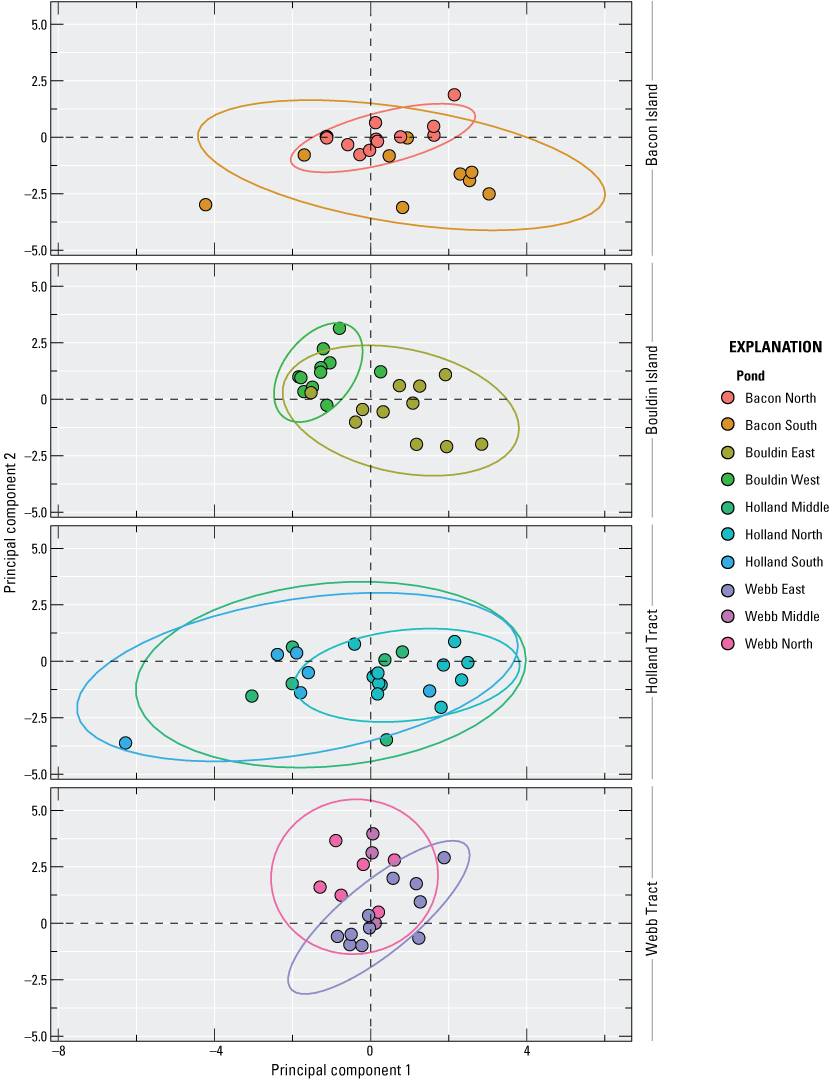
Scores from the first and second axes of a principal components analysis done on zooplankton species composition data from managed ponds within the Sacramento–San Joaquin Delta in California. Scores are faceted by island to minimize superimposition and improve clarity. Ellipses are 95-percent confidence levels. Data summarized from Buxton and others (2023).
Fish
Fish were reported in all managed ponds except Holland South (table 6). Among the managed ponds with fish present, the number of species reported ranged from 1 (Bouldin West, Holland Middle, and Webb Middle) to 8 (Holland North; table 6). Overall, a total of 12 individual species were reported with the most common being bluegill (Lepomis macrochirus) and western mosquitofish (Gambusia affinis), each having occurred in 5 individual managed ponds. Largemouth bass (Micropterus salmoides), a piscivorous species that could potentially prey on delta smelt, was present in four managed ponds, Bacon South, Bouldin East, Holland North, and Webb East. Black crappie (Pomoxis nigromaculatus), another piscivore and potential delta smelt predator, was present in one managed pond, Holland North. Prickly sculpin (Cottus asper) was the only native fish species reported and was present in three managed ponds, Bacon North, Bouldin East, and Webb.
Table 6.
Fish species reported in managed ponds within the Sacramento–San Joaquin Delta in California. Data summarized from Buxton and others (2023).[X, species detected; —, species not detected]
Discussion
Managed ponds in the Sacramento–San Joaquin Delta (Delta) of California surveyed in our study indicated a range of physical configurations, water quality characteristics, pesticide concentrations, and biological characteristics. Overall, water quality conditions in the surveyed managed ponds seemed to be driven primarily by a combination of physical habitat conditions and connectivity with adjacent managed ponds. Vertical stratification represented the dominant within-pond mode of variability in water quality conditions and was controlled by depth. Highly connected managed ponds, such as those on Webb Tract, indicated similar water quality conditions, whereas unconnected managed ponds, such as those on Bouldin Island, indicated unique water quality conditions (fig. 6). Terminal ponds with no outlets, Holland Middle and Holland South, indicated elevated salinity and high values across all non-organic water quality parameters, indicating evaporation is likely also an important driver of some aspects of water quality.
Temperature seemed to be the key physiochemical feature that may limit opportunities to support pond rearing of delta smelt. Elevated summer and fall temperatures may compromise delta smelt health and survival and thus may limit potential experimental activities to winter and spring (Komoroske and others, 2015; Jeffries and others, 2016). From May to October, the delta smelt temperature stress threshold value of 21 °C was consistently exceeded and the temperature mortality threshold value of 28 °C was intermittently exceeded (fig. 3). However, temperatures were consistently 2–5 degrees lower at the bottom of the deepest managed ponds (fig. 5), indicating that newly constructed ponds could potentially provide a deep water temperature refugia for delta smelt if properly engineered.
Pesticides were mostly detected at low concentrations but might pose a threat to delta smelt or other fishes under some specific circumstances. Measured contaminant concentrations were generally below EPA Aquatic Life Benchmarks, with just a few exceptions. Two water samples collected during Survey 2 contained pesticides at concentrations that exceeded EPA Aquatic Life Benchmarks. The Bouldin Island East Pond Inlet sample contained the herbicide diuron at a concentration of 530 ng/L, which exceeds the EPA benchmark for toxicity to vascular plants (130 ng/L). The Bouldin Island East Pond sample contained the insecticide clothianidin at a concentration of 58.6 ng/L, which exceeds the EPA benchmark for chronic toxicity to invertebrates (50 ng/L). Three water samples collected during Survey 3 contained pesticides at concentrations that exceeded EPA Aquatic Life Benchmarks. The Bouldin Island East Pond Inlet, Bouldin Island East Pond Center, and Webb Tract Middle Pond Inlet samples contained clothianidin at concentrations of 69.9, 72.8, and 70.3 ng/L, respectively, which exceeds the EPA benchmark for chronic toxicity to invertebrates. The Webb Tract East Pond South Inlet site also had a concentration of 1.4 ng/L of the pyrethroid insecticide deltamethrin in suspended sediments, which was above the EPA acute invertebrate toxicity benchmark of 0.1 ng/L. Six pyrethroid insecticides were detected in bed sediments. Specific pesticides such as fluoridone and glyphosate may be of concern because Jin and others (2018) indicated that fluoridone and glyphosate affected liver estradiol hormone and reduced oxidative enzyme, and fluoridone could affect brain activity in delta smelt. Additionally, Jeffries and others (2015) indicated that permethrin activated genes for protein synthesis and metabolism, and resulted in mortality in delta smelt, but the study used 100 times the concentrations of pesticides that were detected here in this study.
The surveyed managed ponds were all highly productive and seemed to possess food webs that could support delta smelt in terms of type and quantity of available prey. Chlorophyll a concentration, an index of potential primary productivity, indicated the managed ponds were productive, with several managed ponds indicating eutrophic (approximately 10–40 µg/L) or hypereutrophic (greater than 40 µg/L) conditions. Zooplankton populations were broadly similar among managed ponds and included calanoid and cyclopoid copepods that would be suitable prey for delta smelt. Additional research will be needed to estimate the carrying capacity of managed pond food webs to support delta smelt and other native fishes and to determine the potential uptake and bioaccumulation of pesticides (of high concentrations) in zooplankton or key food items of delta smelt.
Managed ponds may support fish species that could potentially prey on delta smelt. Potential predators such as largemouth bass and black crappie were reported in 4 and 1 of the surveyed managed ponds, respectively. The distribution of predators among ponds seemed to have been driven primarily by deliberate stocking to facilitate local fisheries. Overall, the surveyed pond fish communities were unnatural assemblages of species that did not mirror assemblages in adjacent sloughs (Feyrer and Healey, 2003; Nobriga and others, 2005), indicating that sportfish stocking and water management practices controlled fish occupancy.
Overall, the managed ponds surveyed in our study seem to be suitable to support delta smelt and other native fishes, at least during some parts of the year. Indeed, delta smelt experimentally reared during winter 2022–23 in Bouldin East and Bouldin West indicated high survival and good health (Shawn Acuña, Metropolitan Water District, unpub. data, 2025). The biggest challenge to successfully rearing delta smelt in managed ponds in the Delta may be the high summer water temperature. However, this could potentially be mitigated by managing pond depth and water circulation to provide thermal refugia and suitable water quality conditions. Properly engineered and managed ponds seem to hold great promise for research and conservation efforts involving delta smelt and other native fishes.
References Cited
Arias-Ortiz, A., Oikawa, P.Y., Carlin, J., Masqué, P., Shahan, J., Kanneg, S., Paytan, A., and Baldocchi, D.D., 2021, Tidal and nontidal marsh restoration—A trade-off between carbon sequestration, methane emissions, and soil accretion: Journal of Geophysical Research: Biogeosciences, v. 126, no. 12, 22 p. [Available at https://doi.org/10.1029/2021JG006573.]
Black, G.P., Woodward, E.E., Sanders, C.J., Gross, M.S., and Hladik, M.L., 2023, Multiresidue extraction of current-use pesticides from complex solid matrices using energized dispersive guided extraction with analysis by gas and liquid chromatography tandem mass spectroscopy: Chemosphere, v. 327, 23 p. [Available at https://doi.org/10.1016/j.chemosphere.2023.138550.]
Buxton, J.M., Enos, E.R., Feyrer, F.V., and Acuna, S., 2023, Water quality and biological data from ponds on islands of the Sacramento–San Joaquin Delta: U.S. Geological Survey data release. [Available at https://doi.org/10.5066/P97GLG5I.]
Chamberlain, S.D., Anthony, T.L., Silver, W.L., Eichelmann, E., Hemes, K.S., Oikawa, P.Y., Sturtevant, C., Szutu, D.J., Verfaillie, J.G., and Baldocchi, D.D., 2018, Soil properties and sediment accretion modulate methane fluxes from restored wetlands: Global Change Biology, v. 24, no. 9, p. 4107–4121, accessed February 20, 2025, at https://doi.org/10.1111/gcb.14124.
Deverel, S.J., Ingrum, T., Lucero, C., and Drexler, J.Z., 2014, Impounded marshes on subsided islands—Simulated vertical accretion, processes, and effects, Sacramento–San Joaquin Delta, CA USA: San Francisco Estuary and Watershed Science, v. 12, no. 2, 23 p. [Available at https://doi.org/10.15447/sfews.2014v12iss2art5.]
Deverel, S.J., and Rojstaczer, S., 1996, Subsidence of agricultural lands in the Sacramento‐San Joaquin Delta, California—Role of aqueous and gaseous carbon fluxes: Water Resources Research, v. 32, no. 8, p. 2359–2367, accessed February 20, 2025, at https://doi.org/10.1029/96WR01338.
Drexler, J.Z., 2011, Peat formation processes through the millennia in tidal marshes of the Sacramento–San Joaquin Delta: Estuaries and Coasts, v. 34, no. 5, p. 900–911, accessed February 20, 2025, at https://doi.org/10.1007/s12237-011-9393-7.
Drexler, J.Z., de Fontaine, C.S., and Deverel, S.J., 2009, The legacy of wetland drainage on the remaining peat in the Sacramento–San Joaquin Delta, California, USA: Wetlands, v. 29, no. 1, p. 372–386, accessed February 20, 2025, at https://doi.org/10.1672/08-97.1.
Feyrer, F., and Healey, M.P., 2003, Fish community structure and environmental correlates in the highly altered southern Sacramento–San Joaquin Delta: Environmental Biology of Fishes, v. 66, no. 2, p. 123–132, accessed February 20, 2025, at https://doi.org/10.1023/A:1023670404997.
Garlock, T.M., Monk, C.T., Lorenzen, K., Matthews, M.D., and St. Mary, C.M., 2014, Effects of hatchery rearing on Florida largemouth bass Micropterus floridanus resource allocation and performance under semi‐natural conditions: Journal of Fish Biology, v. 85, no. 6, p. 1830–1842. [Available at https://doi.org/10.1111/jfb.12514.]
Gross, M.S., Sanders, C.J., De Parsia, M.D., and Hladik, M.L., 2024, Methods of analysis—Determination of pesticides in filtered water and suspended sediment using liquid chromatography- and gas chromatography-tandem mass spectrometry: U.S. Geological Survey Techniques and Methods, book 5, chap. A12, 33 p., accessed February 20, 2025, at https://doi.org/10.3133/tm5A12.
Hemes, K.S., Chamberlain, S.D., Eichelmann, E., Anthony, T., Valach, A., Kasak, K., Szutu, D., Verfaillie, J., Silver, W.L., and Baldocchi, D.D., 2019, Assessing the carbon and climate benefit of restoring degraded agricultural peat soils to managed wetlands: Agricultural and Forest Meteorology, v. 268, p. 202–214, accessed February 20, 2025, at https://doi.org/10.1016/j.agrformet.2019.01.017.
Hobbs, J.A., Moyle, P.B., Fangue, N., and Connon, R.E., 2017, Is extinction inevitable for delta smelt and longfin smelt? An opinion and recommendations for recovery: San Francisco Estuary and Watershed Science, v. 15, no. 2, 19 p. [Available at https://doi.org/10.15447/sfews.2017v15iss2art2.]
Hung, T.-C., Hammock, B.G., Sandford, M., Stillway, M., Park, M., Lindberg, J.C., and Teh, S.J., 2022, Temperature and salinity preferences of endangered delta smelt (Hypomesus transpacificus, Actinopterygii, Osmeridae): Scientific Reports, v. 12, no. 1, 11 p. [Available at https://doi.org/10.1038/s41598-022-20934-w.]
Hung, T.-C., Rosales, M., Kurobe, T., Stevenson, T., Ellison, L., Tigan, G., Sandford, M., Lam, C., Schultz, A., and Teh, S., 2019, A pilot study of the performance of captive-reared delta smelt Hypomesus transpacificus in a semi-natural environment: Journal of Fish Biology, v. 95, no. 6, p. 1517–1522. [Available at https://doi.org/10.1111/jfb.14162.]
Jeffries, K.M., Connon, R.E., Davis, B.E., Komoroske, L.M., Britton, M.T., Sommer, T., Todgham, A.E., and Fangue, N.A., 2016, Effects of high temperatures on threatened estuarine fishes during periods of extreme drought: Journal of Experimental Biology, v. 219, no. 11, p. 1705–1716. [Available at https://doi.org/10.1242/jeb.134528.]
Jeffries, K.M., Komoroske, L.M., Truong, J., Werner, I., Hasenbein, M., Hasenbein, S., Fangue, N.A., and Connon, R.E., 2015, The transcriptome-wide effects of exposure to a pyrethroid pesticide on the Critically Endangered delta smelt Hypomesus transpacificus: Endangered Species Research, v. 28, no. 1, p. 43–60, accessed February 20, 2025, at https://doi.org/10.3354/esr00679.
Jin, J., Kurobe, T., Ramírez-Duarte, W.F., Bolotaolo, M.B., Lam, C.H., Pandey, P.K., Hung, T.-C., Stillway, M.E., Zweig, L., Caudill, J., Lin, L., and Teh, S.J., 2018, Sub-lethal effects of herbicides penoxsulam, imazamox, fluridone and glyphosate on delta smelt (Hypomesus transpacificus): Aquatic Toxicology, v. 197, p. 79–88, accessed February 20, 2025, at https://doi.org/10.1016/j.aquatox.2018.01.019.
Komoroske, L.M., Connon, R.E., Jeffries, K.M., and Fangue, N.A., 2015, Linking transcriptional responses to organismal tolerance reveals mechanisms of thermal sensitivity in a mesothermal endangered fish: Molecular Ecology, v. 24, no. 19, p. 4960–4981, accessed February 20, 2025, at https://doi.org/10.1111/mec.13373.
Lessard, J., Cavallo, B., Anders, P., Sommer, T., Schreier, B., Gille, D., Schreier, A., Finger, A., Hung, T.-C., Hobbs, J., May, B., Schultz, A., Burgess, O., and Clarke, R., 2018, Considerations for the use of captive-reared delta smelt for species recovery and research: San Francisco Estuary and Watershed Science, v. 16, no. 3, 15 p. [Available at https://doi.org/10.15447/sfews.2018v16iss3art3.]
Lindberg, J.C., Tigan, G., Ellison, L., Rettinghouse, T., Nagel, M.M., and Fisch, K.M., 2013, Aquaculture methods for a genetically managed population of endangered delta smelt: North American Journal of Aquaculture, v. 75, no. 2, p. 186–196. [Available at https://doi.org/10.1080/15222055.2012.751942.]
Lund, J., Hanak, E., Fleenor, E., Howitt, R., Mount, J., and Moyle, P., 2007, Envisioning futures for the Sacramento–San Joaquin Delta: San Francisco, Public Policy Institute of California, 285 p., accessed February 20, 2025, at https://www.policyarchive.org/handle/10207/4802.
Maynard, D., Riley, S., Flagg, T., Iwamoto, R., Mahnken, C., Berejikian, B., Tatara, C., Endicott, R., Atkins, J., Scheurer, J., LaRae, A., Colt, J., Dixon, J., McDowell, G., and Vander Haegen, G., 2004, Development of a natural rearing system to improve supplemental fish quality: Bonneville Power Administration, Final Report 2004, Project No. 199105500, Report DOE/BP-00004768-2, 171 p., accessed February 20, 2025, at https://docs.streamnetlibrary.org/BPA_Fish_and_Wildlife/00004768-2.pdf.
Miller, R.L., Fram, M.S., Fujii, R., and Wheeler, G., 2008, Subsidence reversal in a re-established wetland in the Sacramento–San Joaquin Delta, California, USA: San Francisco Estuary and Watershed Science, v. 6, no. 3, 20 p., accessed February 20, 2025, at https://doi.org/10.15447/sfews.2008v6iss3art1.
Moyle, P.B., Brown, L.R., Durand, J.R., and Hobbs, J.A., 2016, Delta smelt—Life history and decline of a once-abundant species in the San Francisco Estuary: San Francisco Estuary and Watershed Science, v. 14, no. 2, 30 p. [Available at https://doi.org/10.15447/sfews.2016v14iss2art6.]
Moyle, P.B., Hobbs, J.A., and Durand, J.R., 2018, Delta smelt and water politics in California: Fisheries, v. 43, no. 1, p. 42–50, accessed February 20, 2025, at https://doi.org/10.1002/fsh.10014.
Nobriga, M.L., Feyrer, F., Baxter, R.D., and Chotkowski, M., 2005, Fish community ecology in an altered river delta—Spatial patterns in species composition, life history strategies, and biomass: Estuaries and Coasts, v. 28, no. 5, p. 776–785, accessed February 20, 2025, at https://doi.org/10.1007/BF02732915.
Prokopovich, N.P., 1985, Subsidence of peat in California and Florida: Bulletin of the Association of Engineering Geologists, v. XXII, no. 4, p. 395–420, accessed February 20, 2025, at https://doi.org/10.2113/gseegeosci.xxii.4.395.
R Core Team, 2020, R—The R project for statistical computing: Vienna, Austria, R Foundation for Statistical Computing, https://www.r-project.org.
U.S. Environmental Protection Agency, 2016, Definition and procedure for the determination of the method detection limit, revision 2: U.S. Environmental Protection Agency, Office of Water, EPA 821-R-16-006, 6 p. [Available at https://www.epa.gov/sites/default/files/2016-12/documents/mdl-procedure_rev2_12-13-2016.pdf. Text contains Revision 2 of Code of Federal Regulations, title 40, part 136, appendix B, released as a standalone document.]
U.S. Geological Survey, 2024, USGS water data for the Nation: U.S. Geological Survey National Water Information System database, accessed January 24, 2025, at https://doi.org/10.5066/F7P55KJN.
Weir, W.W., 1950, Subsidence of peat lands of the Sacramento–San Joaquin Delta, California: Hilgardia, v. 20, no. 3, p. 37–56, accessed February 20, 2025, at https://doi.org/10.3733/hilg.v20n03p037.
Whipple, A.A., Grossinger, R.M., Rankin, D., Stanford, B., and Askevold, R.A., 2012, Sacramento–San Joaquin Delta historical ecology investigation—Exploring pattern and process: Richmond, Calif., Prepared for the California Department of Fish and Game and Ecosystem Restoration Program, San Francisco Estuary Institute-Aquatic Science Center [SFEI-ASC], A Report of SFEI-ASC’s Historical Ecology Program, Publication #672, 408 p., accessed February 20, 2025, at https://www.sfei.org/DeltaHEStudy#sthash.2rW7Pdqw.dpbs.
Appendix 1. Water Quality Survey Sample Sites
Table 1.1.
Water quality survey sample sites in managed ponds within the Sacramento–San Joaquin Delta in California (U.S. Geological Survey, 2024).[USGS, U.S. Geological Survey]
Reference Cited
U.S. Geological Survey, 2024, USGS water data for the Nation: U.S. Geological Survey National Water Information System database, accessed January 24, 2025, at https://doi.org/10.5066/F7P55KJN.
Appendix 2. Pesticide Survey Sample Sites
Table 2.1.
Pesticide survey sample sites in managed ponds within the Sacramento–San Joaquin Delta in California (U.S. Geological Survey, 2024).[USGS, U.S. Geological Survey]
Reference Cited
U.S. Geological Survey, 2024, USGS water data for the Nation: U.S. Geological Survey National Water Information System database, accessed January 24, 2025, at https://doi.org/10.5066/F7P55KJN.
Appendix 3. Method Detection and Reporting Limits for Pesticides Dissolved in Water and Sediments Measured by the U.S. Geological Survey Organic Chemistry Research Laboratory
Table 3.1.
Method detection and reporting limits for pesticides dissolved in water and sediments measured by the U.S. Geological Survey Organic Chemistry Research Laboratory.[CAS, chemical abstracts service; GC/MS/MS, gas chromatography with tandem mass spectrometry; LC/MS/MS, liquid chromatography with tandem mass spectrometry; MDL, method detection limit; NA, not analyzed; ng/g, nanograms per gram; ng/L, nanograms per liter; NWIS, National Water Information System; RL, reporting limit]
Supplemental Information
Specific conductance is in microsiemens per centimeter at 25 degrees Celsius (µS/cm at 25 °C).
Concentrations of chemical constituents in water are in either milligrams per liter (mg/L) or micrograms per liter (µg/L).
For more information concerning the research in this report, contact the
Director, California Water Science Center
U.S. Geological Survey
6000 J Street, Placer Hall
Sacramento, California 95819
https://www.usgs.gov/centers/ca-water/
Publishing support provided by the Science Publishing Network,
Sacramento Publishing Service Center
Disclaimers
Any use of trade, firm, or product names is for descriptive purposes only and does not imply endorsement by the U.S. Government.
Although this information product, for the most part, is in the public domain, it also may contain copyrighted materials as noted in the text. Permission to reproduce copyrighted items must be secured from the copyright owner.
Suggested Citation
Feyrer, F.V., Acuña, S., Buxton, J.M., Enos, E.R., Hladik, M.L., Orlando, J., and Young, M.J., 2025, Environmental characteristics of select managed ponds in the Sacramento–San Joaquin Delta—Implications for native fish conservation and research: U.S. Geological Survey Open-File Report 2025–1040, 35 p., https://doi.org/10.3133/ofr20251040.
ISSN: 2331-1258 (online)
Study Area
| Publication type | Report |
|---|---|
| Publication Subtype | USGS Numbered Series |
| Title | Environmental characteristics of select managed ponds in the Sacramento–San Joaquin Delta—Implications for native fish conservation and research |
| Series title | Open-File Report |
| Series number | 2025-1040 |
| DOI | 10.3133/ofr20251040 |
| Publication Date | July 23, 2025 |
| Year Published | 2025 |
| Language | English |
| Publisher | U.S. Geological Survey |
| Publisher location | Reston, VA |
| Contributing office(s) | California Water Science Center |
| Description | Report: viii, 35 p.; Data Release |
| Country | United States |
| State | California |
| County | Contra Costa County, San Joaquin County |
| Other Geospatial | Bacon Island, Bouldin Island, Holland Tract Island, Webb Tract Island |
| Online Only (Y/N) | Y |