

A Crosswalk of the 2015 World Terrestrial Ecosystems to the International Union for the Conservation of Nature Global Ecosystem Typology Framework
Links
- Document: Report (12.6 MB pdf) , HTML , XML
- Appendixes:
- Appendix (70.4 KB xlsx) - A Crosswalk of the U.S. Geological Survey/Esri/The Nature Conservancy World Terrestrial Ecosystems to the International Union for the Conservation of Nature Global Ecosystem Typology (GET) Ecosystem Functional Groups
- Appendix (215 KB csv) - A Crosswalk of the U.S. Geological Survey/Esri/The Nature Conservancy World Terrestrial Ecosystems to the International Union for the Conservation of Nature Global Ecosystem Typology (GET) Ecosystem Functional Groups in a CSV file
- Download citation as: RIS | Dublin Core
Abstract
To support ecosystem mapping and accounting applications, we aligned the 2015 U.S. Geological Survey/Esri/The Nature Conservancy-World Terrestrial Ecosystems (WTEs) with the International Union for Conservation of Nature Global Ecosystem Typology (GET) framework. This process, known as “crosswalking,” enabled the development of a global map of GET level 3 Ecosystem Functional Groups (EFGs) at a 250-meter spatial resolution. Crosswalking involved manually assigning 1,781 biogeographically stratified WTEs to their most probable EFG based on similarities in climate, terrain, vegetation, and geographic distribution. We compared attributes of the WTE dataset with summary characteristics of the EFGs. The resulting crosswalked global map of International Union for Conservation of Nature GET ecosystems is intended to be useful for standardizing ecosystem classification and reporting under frameworks such as the Kunming-Montreal Global Biodiversity Framework and the United Nations System of Environmental-Economic Accounting. We discuss key challenges in reconciling non-identical classifications, such as many-to-one relationships and variation in data quality.
Introduction
Ecosystems are dynamic systems comprising living organisms that interact with each other and their physical environment (Odum, 1953). Ecosystems vary in scale, from microecosystems (for example, tidepools) to macroecosystems (for example, boreal taiga forests), and their global distributions are shaped by environmental drivers such as climate, terrain, and substrate properties (Bailey, 2009). Ecosystems can be mapped as areas with unique combinations of environmental factors, and the U.S. Geological Survey, Esri, and The Nature Conservancy (TNC) have taken this approach to develop a comprehensive map of World Terrestrial Ecosystems (WTEs; Sayre and others, 2020). This 250-meter spatial resolution map is globally standardized and is based on data that characterize land areas with unique combinations of climate regimes, landforms, and vegetation or land-cover types (Sayre and others, 2020).
In 2021, the United Nations (UN) Statistical Commission adopted the UN System for Environmental and Economic Accounting (UN SEEA; United Nations, 2021) as a standard for national ecosystem accounting; this standard emphasizes measuring ecosystem extents for policy and decision-making purposes. Ecosystem accounting requires area-based measurements of ecosystem distributions, commonly referred to as ecosystem extent. The UN SEEA guidance encourages the use of national ecosystems maps and data for country-level ecosystem accounting. Although some countries have detailed national ecosystem maps for conservation planning and territorial management (for example, Colombia; IDEAM and others, 2017), others may need to develop a national map from the bottom-up or use a national map derived from a regional or global ecosystems map.
National ecosystems maps may vary considerably based on mapping concept (structure-based mapping versus function-based mapping versus composition-based mapping), use of proxies (for example, land cover), and spatial and classification resolution, among other factors (Geller and others, 2023). To allow for standardized reporting and comparison of national ecosystem accounts, the UN SEEA has recommended using a reference ecosystem classification known as the International Union for Conservation of Nature (IUCN) Global Ecosystem Typology (GET). The GET consists of a list of global ecosystems and their descriptions that is hierarchical, based on ecosystem functional properties, and comprehensive across terrestrial, freshwater, and marine domains (Keith and others, 2022). The UN SEEA guidance identifies the third level in the GET hierarchy, Ecosystem Functional Groups (EFGs), as the standardized reporting unit recommended for ecosystem accounting. As such, if a country has an existing national ecosystem map it uses for ecosystem accounting, the results should be summarized as EFGs. If a country does not have a baseline national ecosystems map, the UN SEEA guidance suggests other resources that may be consulted. Notably, the WTEs produced collectively by the U.S. Geological Survey, Esri, and TNC (Sayre and others, 2020) are the first alternative, top-down, ecosystem data sources that the UN SEEA guidance suggests consulting (United Nations, 2021).
The United Nations Convention on Biological Diversity’s Kunming-Montreal Global Biodiversity Framework (CBD GBF) has also adopted the GET EFGs as its reference ecosystem conservation status reporting unit. Countries reporting progress towards achieving the “30 by 30” conservation goal (30 percent of the area of all ecosystems conserved by 2030) are expected to use the GET EFGs as the reporting unit, enabling consistent characterization of the conservation status of all of Earth’s ecosystems (CBD, 2024). Additionally, developing GET-consistent, country-level ecosystem maps is a priority activity of the Group on Earth Observation (GEO) Global Ecosystem Atlas Initiative (https://globalecosystemsatlas.org/).
The GET resource is an unmapped “comprehensive classification framework for Earth’s ecosystems that integrates their functional and compositional features”; it was designed to support conservation planning and management, research, and other applications (https://global-ecosystems.org/). Because the GET EFGs are the reference classification for UN SEEA national ecosystem accounting and CBD GBF national ecosystem conservation status reporting, if nations wish to participate then they will need to develop EFG national maps by a number of methods—(1) by creating them bottom-up from scratch, (2) by crosswalking from existing national maps, or (3) by deriving them from regional or global EFG maps. In support of extracting national EFG maps from global EFG maps, we developed a global EFGs map as a crosswalk from the existing global 2015 WTEs map.
For data and mapping applications, crosswalking refers to identifying relations between data elements, in this case, ecosystem types, and matching these from one source schema to another target schema (Wu and others, 2023). Crosswalking attempts to make an output from one classification or map compatible with the units from another classification or map.
Crosswalking between ecosystems classifications and maps is rarely straightforward because of differing spatial and classification resolutions. These maps are typically purpose-driven in development and are almost always valid if they are fit-for-purpose and fit-for-scale. However, the more similar classifications or maps are in thematic nature, spatial resolution, currency, and other characteristics, the easier they are to crosswalk (Hearn and others, 2011).
We developed a global terrestrial EFGs map by crosswalking between the IUCN GET and WTE classifications, focusing on the similarities of defining characteristics used to map the WTEs. We associated WTEs with “most probable” EFGs by examining similarities in climate setting, terrain types, and land-cover characteristics. The characteristics of the GET classifications were derived from a set of summary descriptions for each ecosystem (Keith and others, 2020). We also used the biogeographic distribution of WTEs to associate them with generalized locator maps of EFG distributions (Keith and others, 2020). The WTE characteristics were available as attributes in a geographic information system (GIS) data layer (https://data.usgs.gov/datacatalog/data/USGS:6296791ed34ec53d276bb293). In this report, we describe the crosswalking approach in more detail and present the global EFG map produced from the reconciliation of the WTE and EFG resources.
Purpose and Scope
The 2015 World Terrestrial Ecosystems (WTEs) map, developed by a top-down (globally comprehensive), standardized approach, provides a global resource for ecosystem characterization. However, no equivalent global top-down classification of Ecosystem Functional Groups (EFGs) exists. Some countries (for example, Myanmar; Murray and others, 2020) have developed bottom-up (derived from field observations or local knowledge), national EFG classifications and maps. By matching detailed WTEs with policy relevant EFG units we aim to facilitate use of the IUCN GET classification for ecosystem conservation status reporting and ecosystem accounting assessments. A global map of EFGs, derived as a crosswalk from the global map of WTEs, could be a useful interim product while bottom-up national ecosystem maps are developed.
The geographic scope for this new EFGs map is global and represents EFG distributions from 2015 that align with the WTE source data. This work focuses exclusively on terrestrial ecosystems, excluding freshwater aquatic and marine systems, to provide a preliminary global map of terrestrial EFGs aligned with the WTEs.
Methods
The crosswalking was accomplished by a single human analyst with appropriate technical knowledge to associate each WTE with the most probable EFG. The input WTE data and the target EFGs are described below, followed by a characterization of the crosswalking process.
Input Data
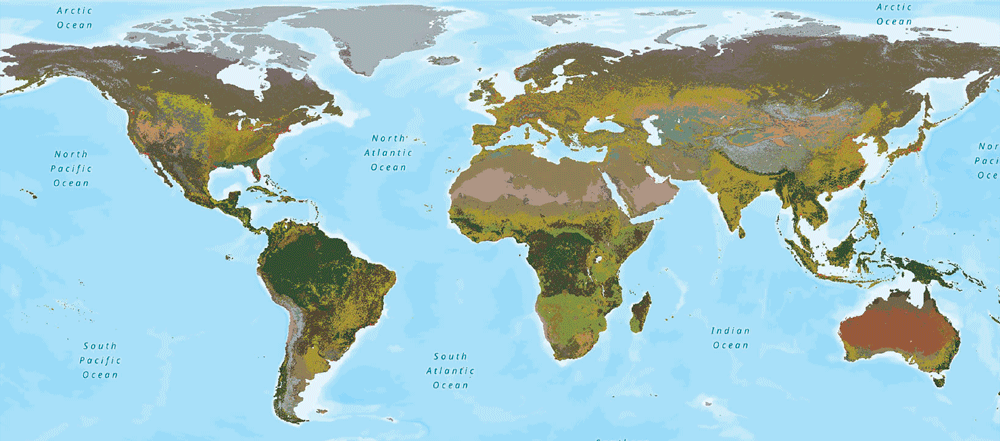
The source units for the crosswalking were 1,781 biogeographically stratified WTEs. The target units for the crosswalking were the IUCN GET level 3 EFGs. The crosswalk was accomplished by assigning each WTE into one or more EFGs. The WTE source classification included 431 global units stratified into 7 biogeographic realms (Nearctic, Neotropical, Palearctic, Afrotropical, Australasian, Indomalayan, and Oceania) for a total of 1,781 WTEs (Sayre and others, 2020). These realms are shown overlaid on the WTEs in figure 1. This biogeographic stratification ensured that structurally similar ecosystems with differing species compositions were appropriately accounted for. As such, the WTE “Nearctic warm temperate moist forest on plains” is expected to be structurally and functionally like the WTE “Palearctic warm temperate moist forest on plains” but with different species assemblages. The WTEs are areas with unique combinations of climate settings (temperature and moisture regimes), landform types, and 2015 vegetation/landcover class types. The values for these attributes are depicted in figure 2.
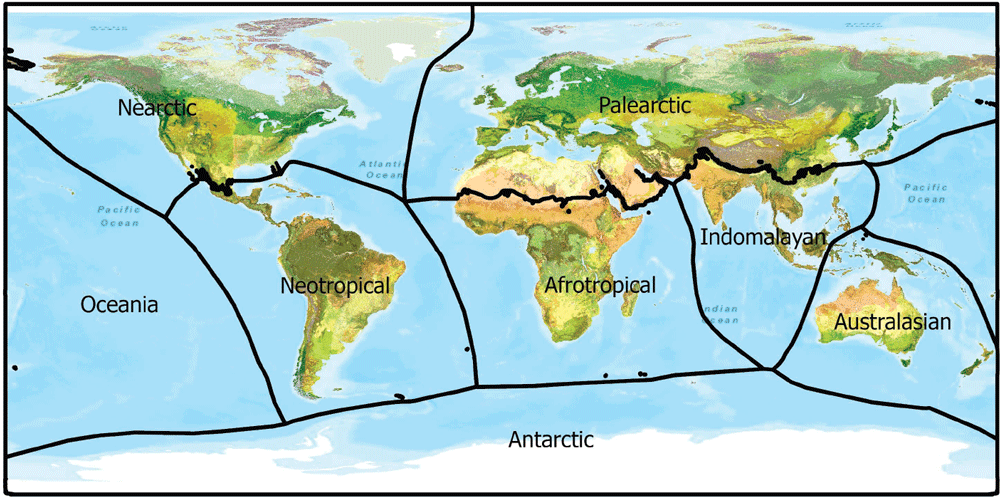
Map showing the distribution of the 2015 World Terrestrial Ecosystems (WTEs) in seven biogeographic realms (Nearctic, Neotropical, Palearctic, Afrotropical, Australasian, Indomalayan, and Oceania). The WTEs were produced by spatially integrating World Climate Regions, Global Landforms, and 2015 Global Land Cover (Sayre and others, 2020).
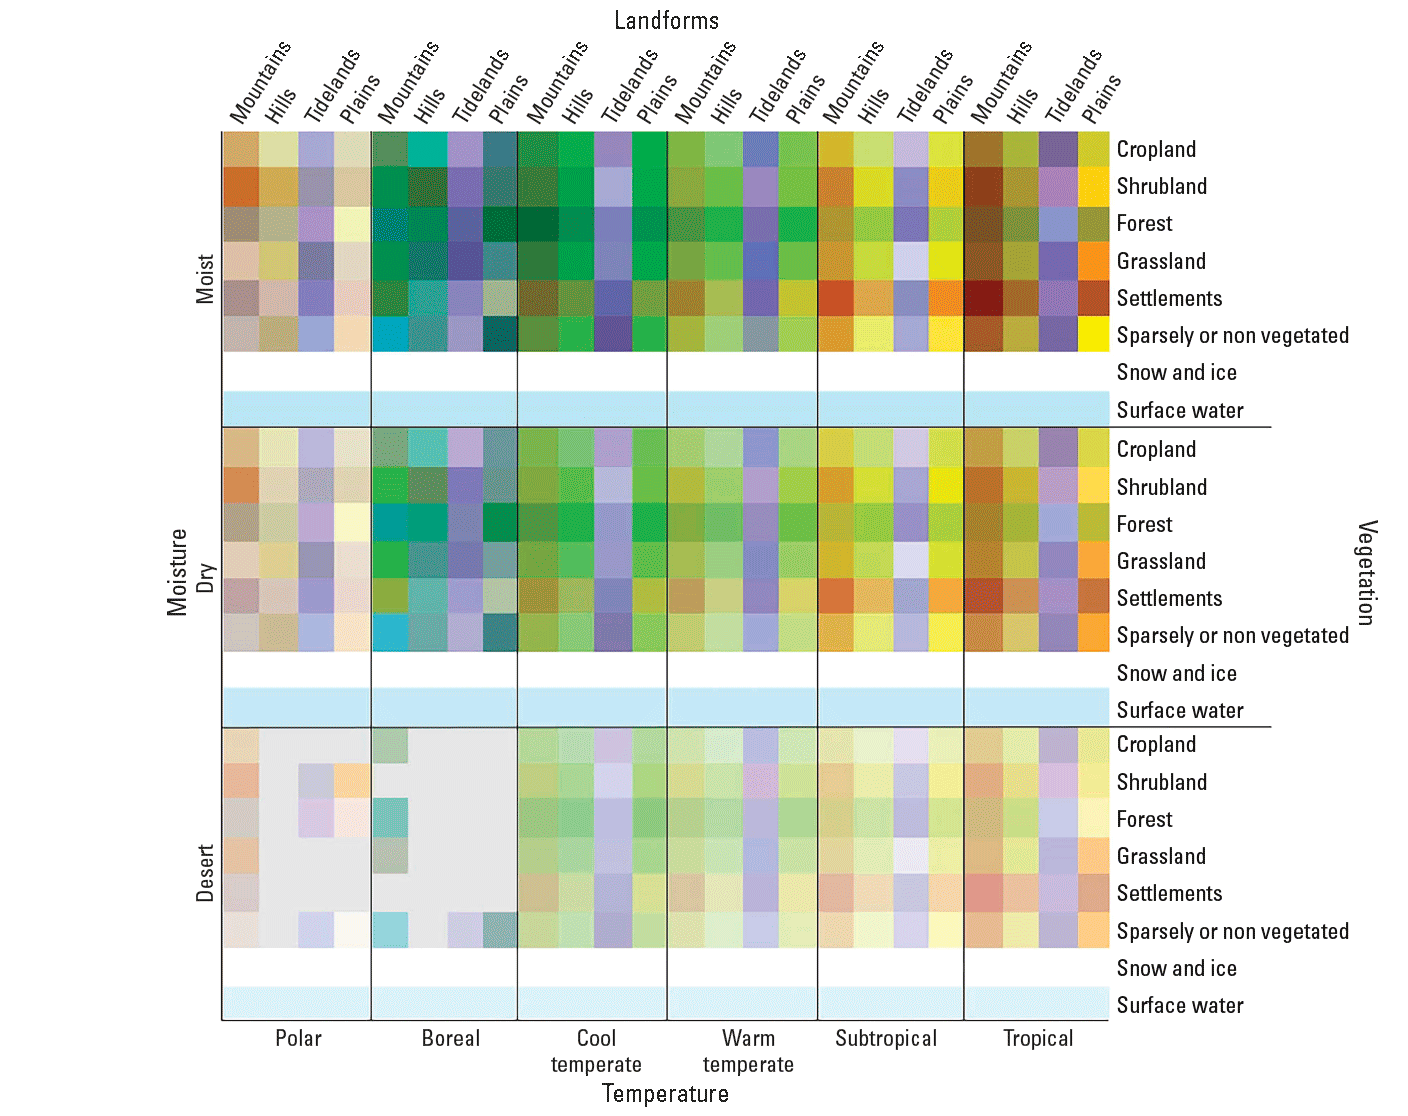
The legend block for the World Terrestrial Ecosystems map depicted in figure 1, showing all possible values for each of the attributes (temperature regime, moisture regime, landform type, and vegetation type) (Sayre and others, 2020).
The target classification units are the 110 EFGs that comprise level 3 in the IUCN GET hierarchy. The GET units are organized hierarchically: the upper levels are grouped by functional features and the lower levels by compositional features. The upper levels include 5 global realms, 25 biomes, and 110 EFGs. The GET hierarchical levels are as follows:
The EFGs describe groups of ecosystems that share characteristics and exhibit convergent traits within a biome. The IUCN GET 2.0 provides interactive indicative maps of these EFGs; these maps illustrate global distribution patterns, but do not depict fine-scale details. (Keith and others, 2020). Profiles for each of the 110 EFGs are available, along with indicative maps showing the World Wildlife Fund (Olson and others, 2001) ecoregions where the EFGs are known or expected to be. These EFG profiles and maps were the primary sources of information used to assign the WTEs to the EFGs. Because we did not include freshwater aquatic ecosystems or coastal and marine ecosystems in our analysis, only 41 EFGs were ultimately included in the resulting map.
Crosswalking Process
The crosswalking exercise was implemented by extracting the 1,781 WTEs from the GIS attribute table and listing them in a spreadsheet, along with the values from four attributes (temperature zone, moisture zone, landform type, and vegetation/land-cover type). The EFGs were preliminarily grouped according to these four attributes to facilitate the assignment of WTEs into EFGs. Then, a single researcher assigned each of the 1,781 WTEs into a “most probable” EFG class as well as an “also possible” EFG class when appropriate. The WTEs were then matched by (1) semantic concordance (similarity in labels) and (2) apparent geographic overlap (by visual inspection) in distribution when comparing mapped WTE distributions with EFG distributions from the indicative distribution maps. For each WTE, the most probable EFG assignment was added as an attribute to the WTE GIS layer, or when a match was not possible, it was listed as “unmatched.”
Results
Maps of the crosswalking results are shown (1) for the northeastern United States and Canada, (2) for Australia, and (3) for the world in figures 3, 4, and 5, respectively. Assignments of WTEs into EFGs are given in the appendix available online at https://doi.org/10.3133/ofr20251043. A plot showing the number of WTE ecosystems associated with each EFG is in figure 6.
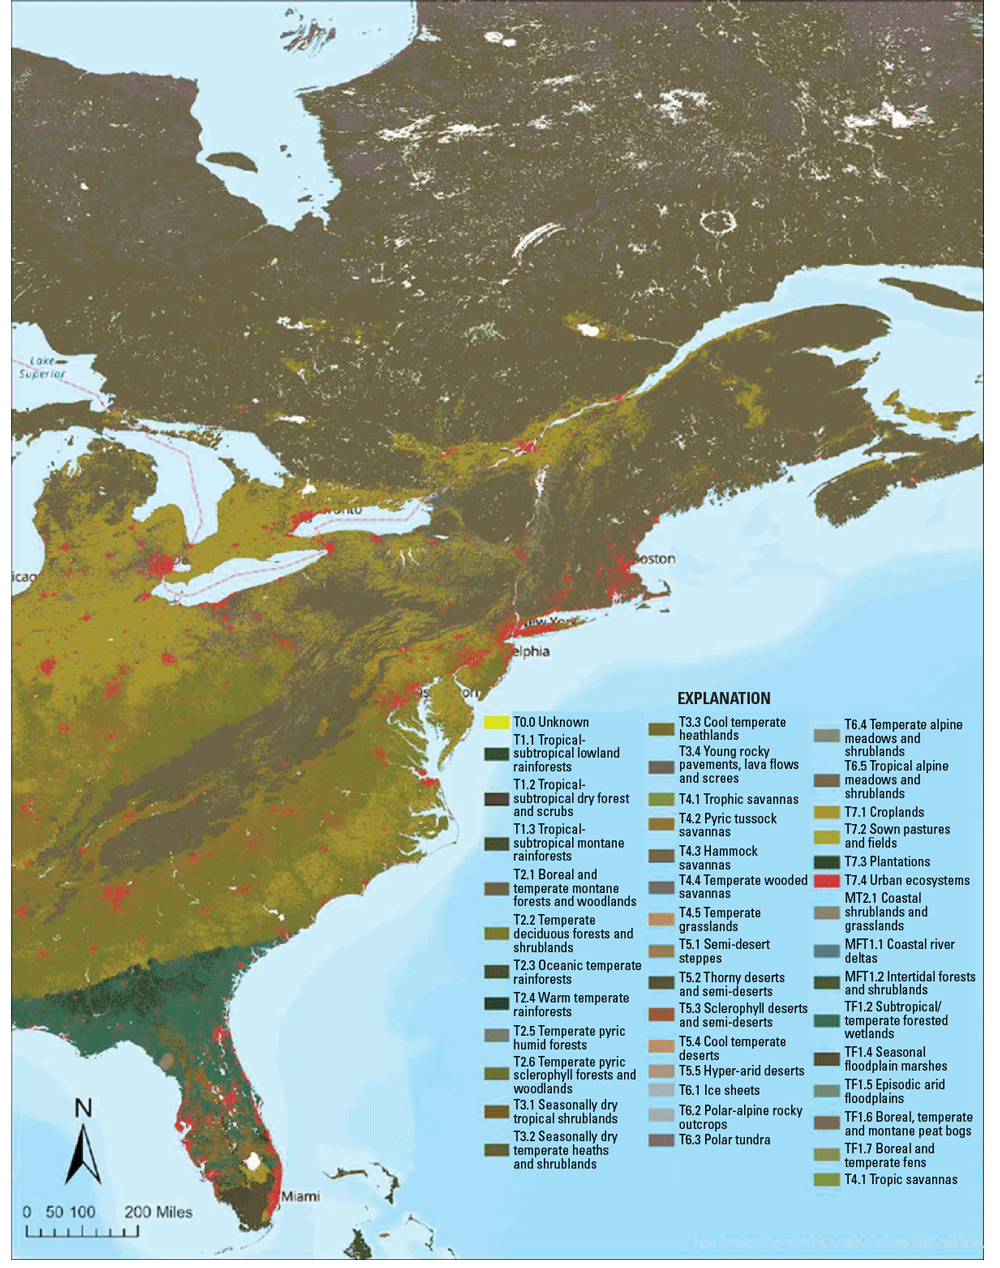
The distribution of level 3 Terrestrial Ecosystem Functional Groups in the northeastern United States and Canada produced from a crosswalk of 1,781 biogeographically stratified and mapped World Terrestrial Ecosystems into the International Union for the Conservation of Nature Global Ecosystem Typology.
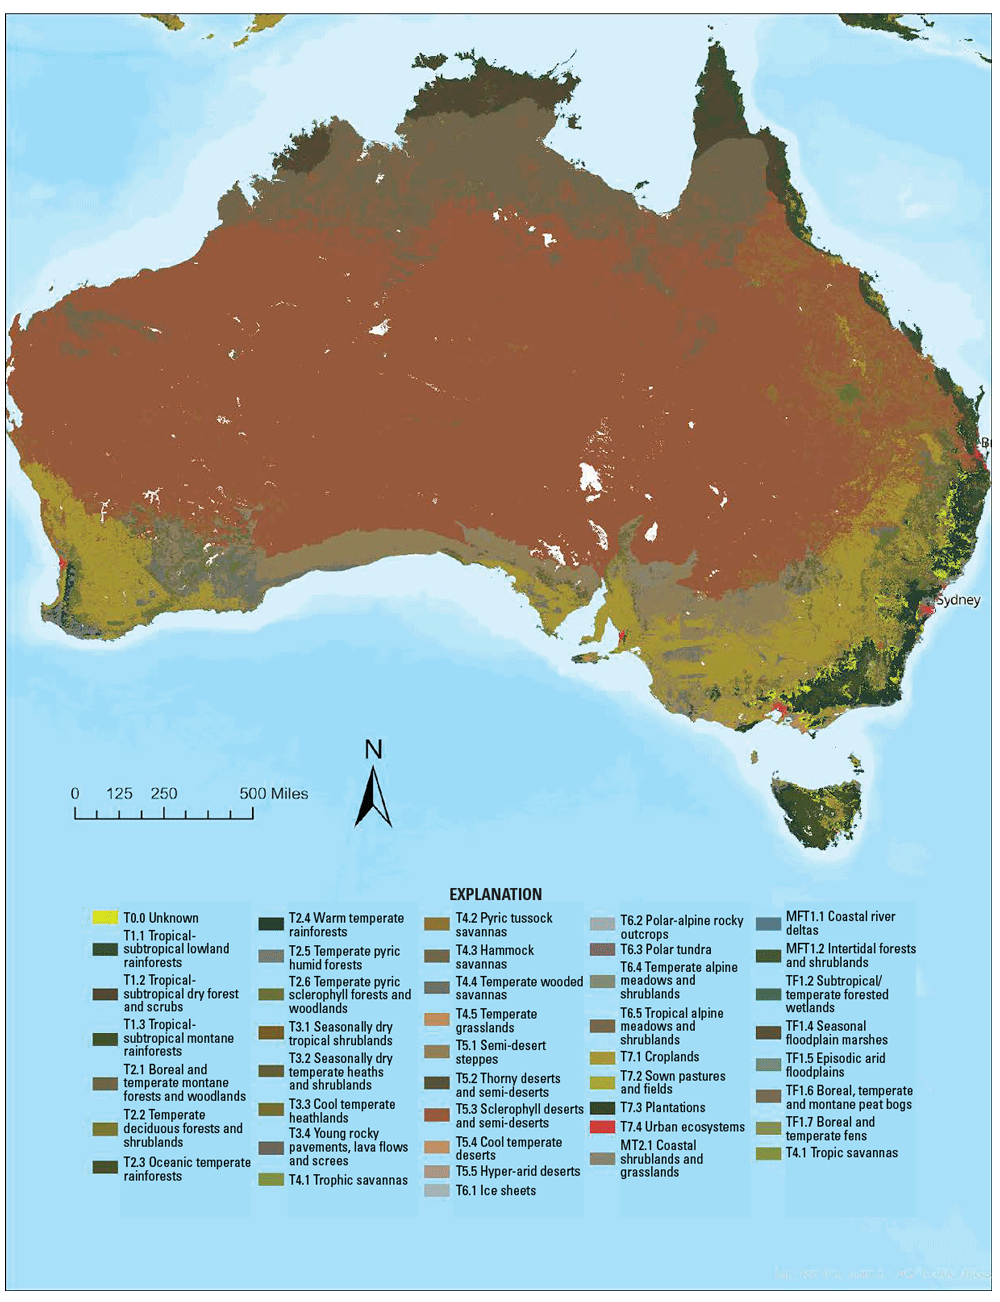
The distribution of level 3 Terrestrial Ecosystem Functional Groups in Australia produced from a crosswalk of 1,781 biogeographically stratified and mapped World Terrestrial Ecosystems into the International Union for the Conservation of Nature Global Ecosystem Typology.
Map showing the global distribution of 41 International Union for the Conservation of Nature Ecosystem Functional Groups produced from a crosswalk of 1,781 World Terrestrial Ecosystems. The color assignments and corresponding Ecosystem Functional Group types are the same as in figures 3 and 4.
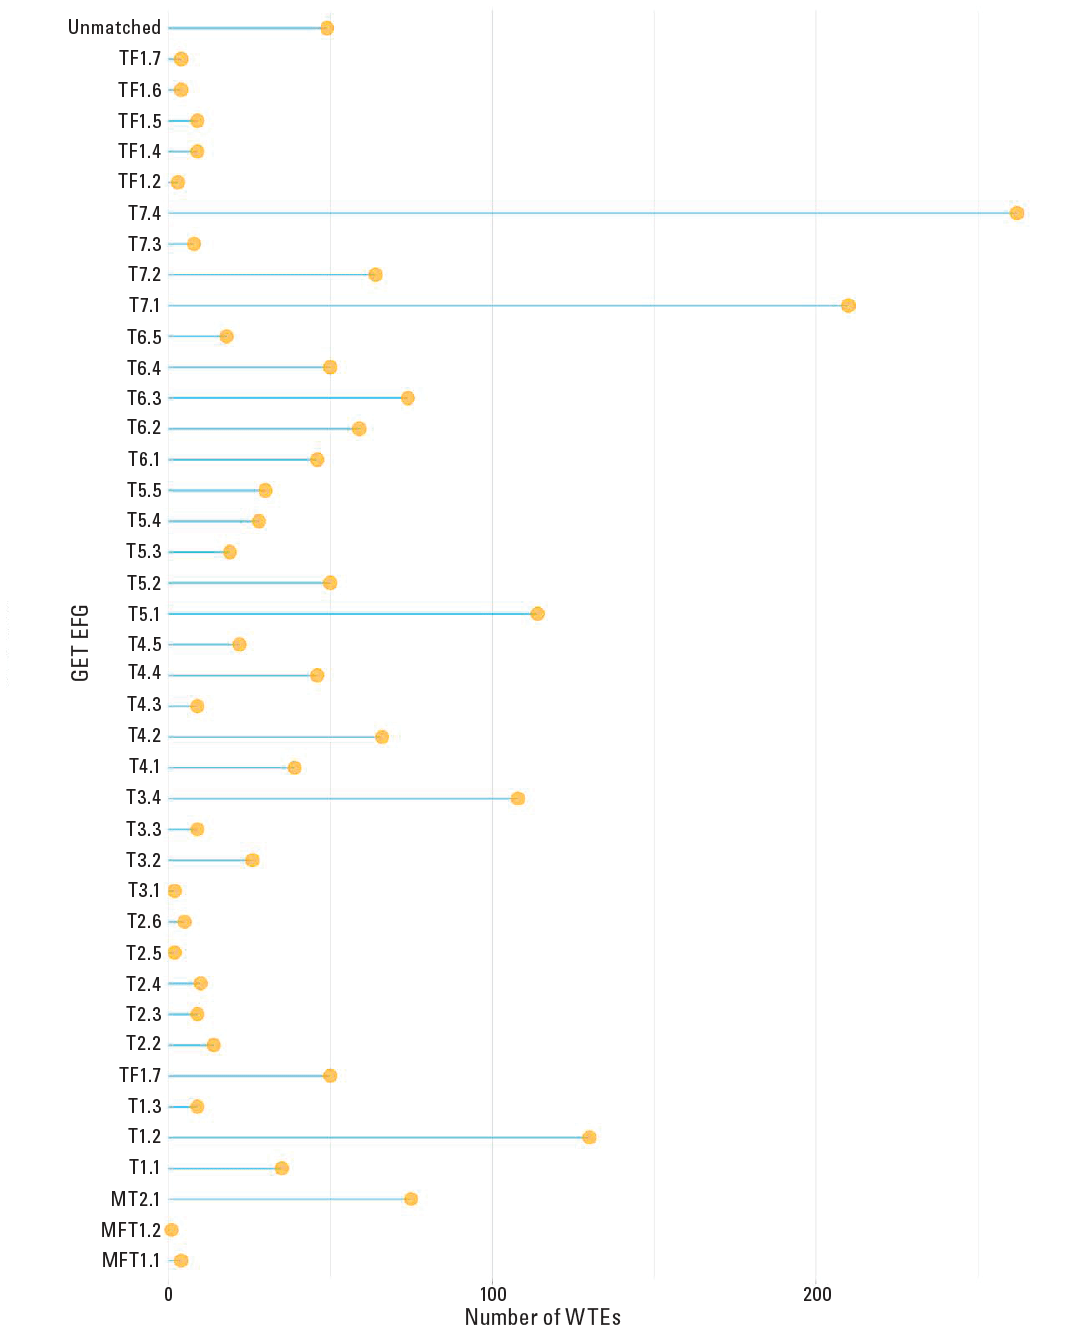
Plot showing the number of source ecosystems (World Terrestrial Ecosystems; WTE) associated with target ecosystems (International Union for the Conservation of Nature Global Ecosystem Typology [GET] Ecosystem Functional Groups [EFG]).
Discussion
We made a preliminary best attempt to match the WTEs with a corresponding EFG. The crosswalk from this study resulted in predominantly many-to-one relations (fig. 6), where multiple WTEs corresponded with a single EFG. For example, the EFG T1.2 (Tropical-subtropical Dry Forests and Scrubs) aggregated 16 distinct WTEs differentiated by landform type and climatic variation. One-to-many relations were observed for 70 percent of the WTEs. The large percentage of many-to-one relations was expected due to the significantly larger number of WTEs compared to EFGs.
In general, the EFG maps (figs. 3, 4, and 5) appear relatively homogenized compared with the map of WTEs (fig. 1), again to be expected given the magnitude of order reduction in number of resulting EFG classes (41) compared with the original number of unstratified WTEs (421).
The IUCN GET hierarchy includes six levels, and the WTE-to-GET crosswalking exercise was done at a relatively coarse level of the GET hierarchy (the level 3 EFGs), resulting in significant generalization. The classification resolution of the WTEs was likely too fine for the relatively coarser EFGs, and a crosswalking attempt of the WTEs with GET ecosystem units at level 4, level 5, or level 6 might be more appropriate in terms of better-matched classification and spatial resolution. However, the GET typology is not complete beyond level 3. In the future, when GET ecosystem types (a) exist and (b) are mapped for the lower levels of the hierarchy, the WTE-to-GET crosswalk might produce fewer many-to-one relations.
Summary
We crosswalked a global set of 1,781 World Terrestrial Ecosystems (WTE) with 41 International Union for the Conservation of Nature Global Ecosystem Typology (GET) Ecosystem Functional Groups. The higher classification resolution of the source data resulted in a considerably generalized product, and many-to-one (WTE-to-Ecosystem Functional Group) relations were common. Although the crosswalking process is potentially valuable for producing standardized, GET-compatible maps for ecosystem accounting and monitoring applications, the resulting homogenization and loss of geographic detail that happens during the process may represent a significant tradeoff. However, the WTEs are likely at a classification and spatial resolution that, for crosswalking purposes, would better match lower levels of the GET hierarchy that have not yet been developed.
Acknowledgments
The authors acknowledge and appreciate the helpful reviews of U.S. Geological Survey colleagues Iris Garthwaite and David Helweg.
References Cited
Bailey, R.G., 2009, Ecosystem geography—From ecoregions to sites (2d ed.): New York, N.Y., Springer, 251 p. [Also available at https://link.springer.com/book/10.1007/978-0-387-89516-1.]
Convention on Biological Diversity [CBD], 2024, Guidance on using the indicators of the monitoring framework of the Kunming-Montreal Global Biodiversity Framework: Nairobi, Kenya, Convention on Biological Diversity, report number CBD/SBSTTA/REC/26/1, accessed June 23, 2025, at https://cbd.int/doc/recommendations/sbstta-26/sbstta-26-rec-01-en.pdf.
Geller, G., Levick, S., Luque, S., Sayre, R., Brink, A., Coops, N., Durrieu, S., Ewald, J., Feilhauer, H., Feret, J.-B., Ferrier, S., Honzák, M., Lenco, D., Koltz, A., Lele, N., Lombardo, S., Mahecha, M., Meyer, C., Paganini, M., Rankine, C., Rocchini, D., Rosenthal, A., Santos, M.J., Viciano, L., 2023, Space-based Earth observation and ecosystem extent—Exploring opportunities: Committee on Earth Observation Satellites (CEOS) Ecosystem Extent Task Team Whitepaper v1.1., 38 p., accessed June 23, 2025, at https://ceos.org/EETT White Paper V1.1 2023-12-04.
Hearn, S.M., Healey, J.R., McDonald, M.A., Turner, A.J., Wong, J.L.G., and Stewart, G.B., 2011, The repeatability of vegetation classification and mapping: Journal of Environmental Management, v. 92, no. 4, p. 1174–1184, accessed June 23, 2025, at https://doi.org/10.1016/j.jenvman.2010.11.021.
IDEAM, PNUD, MADS, DNP, CANCILLERÍA, 2017, Tercera Comunicación Nacional De Colombia—A La Convención Marco De Las Naciones Unidas Sobre Cambio Climático (CMNUCC)—Tercera Comunicación Nacional de Cambio Climático: Bogotá D.C., Colombia, accessed June 23, 2025, at https://unfccc.int/sites/default/files/resource/RESUMEN%20EJECUTIVO%20TCNCC%20COLOMBIA%20A%20LA%20CMNUCC%202017.pdf.
Keith, D.A., Ferrer-Paris, J.R., Nicholson, E., and Kingsford, R.T., eds., 2020, IUCN global ecosystem typology 2.0—Descriptive profiles for biomes and ecosystem functional groups: Gland, Switzerland, International Union for Conservation of Nature, 192 p., accessed June 23, 2025, at https://doi.org/10.2305/IUCN.CH.2020.13.en.
Keith, D.A., Ferrer-Paris, J.R., Nicholson, E., Bishop, M.J., Polidoro, B.A., Ramirez-Llodra, E., Tozer, M.G., Nel, J.L., Mac Nally, R., Gregr, E.J., Watermeyer, K.E., Essl, F., Faber-Langendoen, D., Franklin, J., Lehmann, C.E.R., Etter, A., Roux, D.J., Stark, J.S., Rowland, J.A., Brummitt, N.A., Fernandez-Arcaya, U.C., Suthers, I.M., Wiser, S.K., Donohue, I., Jackson, L.J., Pennington, R.T., Iliffe, T.M., Gerovasileiou, V., Giller, P., Robson, B.J., Pettorelli, N., Andrade, A., Lindgaard, A., Tahvanainen, T., Terauds, A., Chadwick, M.A., Murray, N.J., Moat, J., Pliscoff, P., Zager, I., and Kingsford, R.T., 2022, A function-based typology for Earth’s ecosystems: Nature, v. 610, no. 7932, p. 513–518, accessed June 23, 2025, at https://doi.org/10.1038/s41586-022-05318-4.
Murray, N.J., Keith, D.A., Duncan, A., Tizard, R., Ferrer-Paris, J.R., Worthington, T.A., Armstrong, K., Hlaing, N., Htut, W.T., Oo, A.H., Ya, K.Z., Grantham, H., 2020, Myanmar’s terrestrial ecosystems—Status, threats and conservation opportunities: Biological Conservation, v. 252, no. 108834, accessed June 23, 2025, at https://doi.org/10.1016/j.biocon.2020.108834.
Olson, D., Dinerstein, E., Wikramanayake, E., Burgess, N., Powell, G., Underwood, E., D’Amico, J., Ilanga, I., Strand, H., Morrison, J., Loucks, C., Allnutt, T., Ricketts, T., Kura, Y., Lamoreux, J., Wettengel, W., Hedao,P., and Kassem, K., 2001, Terrestrial ecoregions of the world—A new map of life on Earth—A new global map of terrestrial ecoregions provides an innovative tool for conserving biodiversity: Bioscience, v. 51, no. 11, p. 933–938, accessed June 23, 2025, at https://doi.org/10.1016/10.1641/00063568(2001)051[0933:TEOTWA]2.0.CO;2,
Sayre, R., Karagulle, D., Frye, C., Boucher, T., Wolff, N.H., Breyer, S., Wright, D., Martin, M., Butler, K., Van Graafeiland, K., Touval, J., Sotomayor, L., McGowan, J., Game, E.T., and Possingham, H., 2020, An assessment of the representation of ecosystems in global protected areas using new maps of world climate regions and world ecosystems: Global Ecology and Conservation, v. 21, 21 p., accessed June 23, 2025, https://doi.org/10.1016/j.gecco.2019.e00860.
United Nations, 2021, System of environmental-economic accounting—Ecosystem accounting: Department of Economic and Social Affairs, Statistics Division, White cover publication, Series F, No. 124, pre-edited text subject to official editing, accessed June 23, 2025, at https://seea.un.org/sites/seea.un.org/files/documents/EA/seea_ea_f124_web_12dec24.pdf.
Wu, M., Richard, S.M., Verhey, C., Castro, L.J., Cecconi, B., and Juty, N., 2023, An analysis of crosswalks from research data schemas to schema.org: Data Intelligence, v. 5, no. 1, p. 100–121, accessed June 23, 2025, https://doi.org/10.1162/dint_a_00186.
For more information about this publication, contact
Director, U.S. Geological Survey Land Change Science Program Office
12201 Sunrise Valley Drive
Reston, VA 20192
For additional information, visit https://www.usgs.gov/programs/land-change-science-program
Publishing support provided by the Reston and the Baltimore Publishing Service Centers
Disclaimers
Any use of trade, firm, or product names is for descriptive purposes only and does not imply endorsement by the U.S. Government.
Although this information product, for the most part, is in the public domain, it also may contain copyrighted materials as noted in the text. Permission to reproduce copyrighted items must be secured from the copyright owner.
Suggested Citation
Sides, K.B., Naji, N., Kremer, A., Burton, D., and Sayre, R., 2025, A crosswalk of the 2015 World Terrestrial Ecosystems to the International Union for the Conservation of Nature Global Ecosystem Typology Framework: U.S. Geological Survey Open-File Report 2025–1043, 10 p., https://doi.org/10.3133/ofr20251043.
ISSN: 2331-1258 (online)
| Publication type | Report |
|---|---|
| Publication Subtype | USGS Numbered Series |
| Title | A crosswalk of the 2015 World Terrestrial Ecosystems to the International Union for the Conservation of Nature Global Ecosystem Typology Framework |
| Series title | Open-File Report |
| Series number | 2025-1043 |
| DOI | 10.3133/ofr20251043 |
| Publication Date | August 26, 2025 |
| Year Published | 2025 |
| Language | English |
| Publisher | U.S. Geological Survey |
| Publisher location | Reston, VA |
| Contributing office(s) | National Land Imaging |
| Description | Report: iv, 10 p.; 2 Appendixes |
| Online Only (Y/N) | Y |
| Additional Online Files (Y/N) | Y |