

Modeling Floods, Sediment Entrainment, and Downstream Debris Flows from Hypothetical Breaches of the Blockage at Spirit Lake, Washington
Links
- Document: Report (26.4 MB pdf) , HTML , XML
- Data Release: USGS data release - Simulated floods, sediment entrainment, and debris-flow inundation in the Toutle and Cowlitz River valleys resulting from hypothetical dam breaches of Spirit Lake, Washington
- NGMDB Index Page: National Geologic Map Database Index Page
- Download citation as: RIS | Dublin Core
Acknowledgments
This report was funded in part by the U.S. Department of Agriculture Forest Service Gifford Pinchot National Forest, and the U.S. Geological Survey (USGS). The authors wish to thank Francis Rengers, Roger Denlinger, and Jon Major (all of the USGS) for valuable feedback.
Abstract
This report describes a modeling investigation by the U.S. Geological Survey (USGS) of hazards in the Toutle and Cowlitz River valleys posed by hypothetical outburst floods from Spirit Lake, Washington. A massive debris avalanche resulting from the collapse of Mount St. Helens’ north flank during the May 18, 1980, eruption blocked Spirit Lake’s natural outlet into the North Fork Toutle River. Lacking a natural outlet, subsequent runoff in the Spirit Lake watershed contributed to a rising lake level, elevating the potential for debris-dam breaching or catastrophic failure. The influence of highly erodible bed sediment in the upper North Fork Toutle River on downstream flood and debris-flow dynamics and extent is assessed in this study. Simulations of clear-water (non-erosive) outburst floods were used as a baseline and compared to erosive flows that entrain large volumes of material and transition into debris flows along their flow path, revealing the influence of entrainment on hazard extent. Clear-water floods were modeled with the shallow water equations. Erosive flows were modeled with a two-phase granular fluid model that accommodates mobilization and incorporation of sediment from the bed into the overlying flow and resultant changes in flow rheology across a wide range of solid concentrations, from dilute suspensions to dense-granular debris flows. Entrainment of bed material was found to substantially increase the total flow volume (total volume of transported water and sediment is approximately 150 percent of the water volume for non-erosive flows). Erosive flows are shown to exhibit higher flow-front speeds and faster downstream arrival times than non-erosive flows, consistent with volume amplification effects near the actively mobilizing flow front. However, the larger total volume of transported material does not necessarily lead to an enhancement of total volume throughput (cumulative discharge) or inundation extent (total affected area) for all locations along the entire flow path; while entrainment leads to the displacement of a larger volume of material overall, much of this dislocated material (water and sediment) deposits upstream from the distal extent of the flows. These results are consistent with energetic considerations of initial potential energy and granular shear resistance.
Introduction
Spirit Lake lies in the Cascade Range at the foot of Mount St. Helens, Washington (fig. 1). The massive debris avalanche resulting from the collapse of Mount St. Helens’ north flank during the May 18, 1980, eruption blocked Spirit Lake’s natural outlet into the North Fork Toutle River and altered the lake bathymetry and surrounding topography. Lacking a natural outlet, subsequent runoff in the Spirit Lake watershed contributed to a rising lake level, elevating the potential for dam breaching or catastrophic failure. A failure of the debris dam impounding Spirit Lake would release a torrent of flood water and pose a substantial risk to downstream communities in the Toutle and Cowlitz River valleys (Grant and others, 2017). To mitigate such risk, in 1984–85 the U.S. Army Corps of Engineers (USACE) built an approximately (~) 2.6-kilometer (km) outlet tunnel through bedrock (~1 km north of the debris dam), allowing the stabilization of lake levels by enabling the controlled release of water into South Coldwater Creek, a tributary of the North Fork Toutle River (fig. 2). The U.S. Department of Agriculture (USDA) Forest Service (USFS) continues to manage tunnel operations. The threat posed by potential outbreak floods remains, as the aging tunnel requires periodic repairs and closures (leading to temporary though hazardous lake-level rises), and its future viability is uncertain. Alternative solutions are under exploration (Grant and others, 2017).
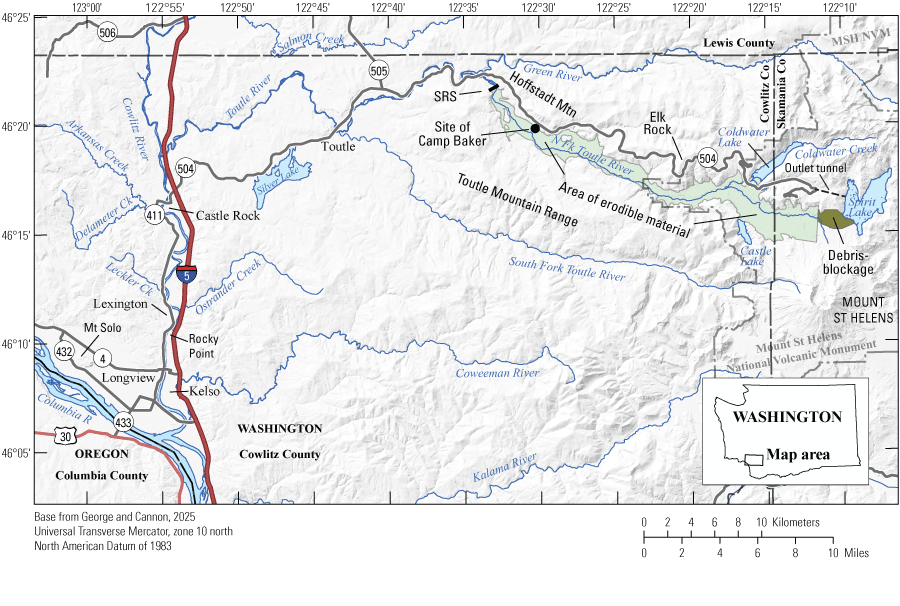
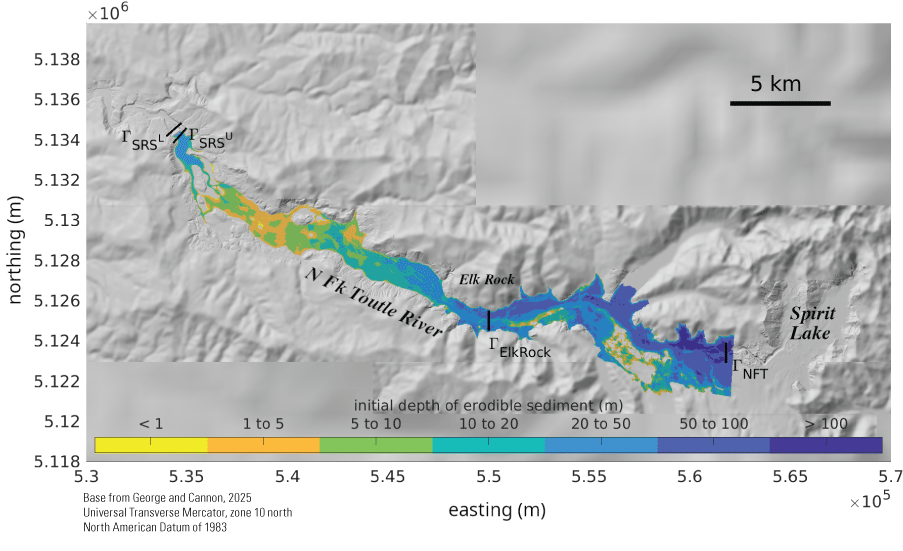
Shaded-relief map of Spirit Lake, Washington, and the surrounding region including the Toutle and Cowlitz River drainages. Map extent corresponds to the model domain of the study area. Light green shaded area, downstream of the debris blockage (dark green), is the location of erodible bed sediment considered in the model simulations. The location of the sediment retention structure constructed by the U.S. Army Corps of Engineers in 1989 is labeled SRS.
In addition to altering and impounding Spirit Lake, the 1980 debris avalanche and subsequent lahars, pyroclastic flows, and ash fall dramatically altered the surrounding landscape and filled the upper North Fork Toutle River valley with highly erodible sediment—the debris avalanche alone contributed ~2.5 cubic kilometers (km3) of poorly-sorted debris, covering ~60 square kilometers (km2) to an average depth of 45 meters (m) (150 feet [ft]) (Glicken, 1996; Grant and others, 2017). Since 1980, the topography surrounding the upper North Fork Toutle River has undergone considerable geomorphic evolution through channel erosion and migration and accompanying sediment transport (Janda and others, 1984; Major and others, 2000, 2020). Flood-mitigation strategies have altered the drainage system as well. In 1989, the U.S. Army Corps of Engineers (USACE) completed construction of the sediment retention structure (SRS)—an earthen dam and spillway (575 m wide and ~60 m high) located ~35 km downstream from Spirit Lake on the upper North Fork Toutle River (fig. 1), with the intent of controlling the large volumes of sediment delivery to the Toutle and Cowlitz Rivers (Willingham, 2005). Accumulation behind the structure has filled the valley with a highly erodible sediment plain stretching ~15 km upstream. Erosion of the debris avalanche and other volcanic deposits continues to deliver large volumes of erodible sediment to the North Fork Toutle River (Major and others, 2020).
In the event of a breakout flood from Spirit Lake, the influence of massive volumes of downstream erodible bed sediment on flood volume, stage, discharge, and inundation extents are difficult to predict but may elevate the downstream effects. The entrainment of granular solids by overriding flow can alter runout extent and flow dynamics in two primary ways: (1) flood-volume amplification or “bulking” simply through the mobilization and incorporation of additional material; large floods and debris flows are well-known to increase substantially in volume through this process (Vallance and Scott, 1997), and (2), transformation of fluid-mechanical or rheological properties owing to changes in density, fluid pressure, and frictional resistance of the granular-fluid mixture. Entrainment may enhance or hinder flood extent and discharge rates through complex feedback mechanisms which cannot be rigorously assessed through simple volumetric estimations of entrainment rates. Rather, computer modeling with physically suitable mathematical models for entrainment and granular-fluid flow dynamics are warranted.
This report summarizes an investigation of the downstream hazard extent posed by hypothetical outburst floods from Spirit Lake, particularly with respect to the influence of downstream erodible sediment in the upper North Fork Toutle River. We do not address the likelihood of, or detailed mechanics leading to or accompanying, a debris-dam breach or catastrophic failure. We employed modern sophisticated mathematical models and computational software packages capable of high-resolution flow modeling of water as well as variably concentrated granular-fluid flows over erodible topography (see the “Methodology” section). In this report, we compare simulations of non-eroding clear-water floods with simulations of erosive flows that begin as clear-water outflow and transform into denser solid-content debris flows, through the erosion and entrainment of bed sediment along their flow path.
Our simulations were initialized with pre-constructed hypothetical open channels carved through the Spirit Lake blockage (see the “Methodology” section). While broadly informed by the subsurface geology of the debris blockage, our channel cuts represent highly approximate and hypothetically prescribed representations of topography postulated to exist after a dynamic and stochastic breaching process—the details of which we neglect due to large uncertainties. However, to roughly characterize the sensitivity of downstream flooding to different discharge characteristics, we modeled outflow through multiple combinations of alternative channels and initial Spirit Lake elevations.
Study Site—Spirit Lake and the Sediment Blockage
Spirit Lake occupies the upper parts of two valleys. The west arm is the smaller of the two arms (fig. 1). It has a more irregular topography and a greater area lower than 1,015 m elevation (NAVD 88). Hummocky debris avalanche deposits are present near Bear Cove north of the west arm (Evarts and Ashley, 1993; Glicken, 1996) and presumably underlie the entire western lake. At current typical operating levels, the west arm is about 36 m deep at its deepest point. In 1974, the west arm was at least 37 m deep (120-ft contour in Bortleson and others, 1976). Before the May 1980 eruption, the outlet of Spirit Lake was on the southwest side of the west arm adjacent to Harrys Ridge. The east arm is fed by several unnamed tributaries and is about three times larger than the west arm. At current typical operating levels, the east arm is about 36 m deep at its deepest point. In 1974, the east arm was at least 55 m deep (180 ft in Bortleson and others, 1976; Gawel and others, 2018).
The May 18,1980 debris avalanche left a massive deposit south of Harrys Ridge at the western edge of Spirit Lake (figs. 1 and 2), blocking the outlet and raising the lake basin elevation by ~60 m (Glicken, 1996). Glicken and others (1989) estimated the blockage to be about 1,465 m wide (east-west) by 1,950 m long (north-south), consisting primarily of a heterogeneous assortment of fractured rock, gravel, and sands ranging in thickness from about 60–150 m along its crest (Glicken, 1996). It is overlain by layers of pyroclastic deposits of variable thickness, which are highly erodible (Grant and others, 2017; Major and others, 2020). The toe of the blockage lies about 23 m (1,027 m elevation [NGVD29]) below the current average lake level (Grant and others, 2017). Post-eruption field surveys and dam stability analysis (for example, Youd and others, 1981) suggested that lake-level rise and erosive piping through the pyroclastic deposit layer presented the most likely mode of debris-dam failure. Incision through the loose pyroclastic layer could lead to further downcutting of the underlying debris-avalanche deposit, potentially leading to catastrophic outbreak flooding. This prompted efforts to identify the elevation of the boundary between the debris-avalanche and more erodible overlying pyroclastic deposits (USACE, 1983). The lowest identified points of this boundary were assumed to be critical or threshold values for the maximum lake-surface elevation above which the risk of dam failure was deemed too risky. Glicken and others (1989) identified two such low points lying underneath the crest of the dam—referred to as critical point north (CPN) and critical point south (CPS) at elevations 1,071 m and 1,069 m respectively (fig. 2). Based on mitigation for potential future hydrologic or volcanic events, 1,055 m was determined to be the maximum safe operating level for the lake elevation (USACE, 1983).
At current typical operating conditions, the lake has a water-surface elevation of about 1,050 m and a volume of about 230 million m3 (Mm3). At a theoretical maximum water-surface elevation of 1,070 m, the Spirit Lake volume of 468 Mm3 is about double the volume when the lake level is 1,050 m. At water levels below about 1,027 m, the arms of Spirit Lake become separate bodies of water, both of which have low points of about 1,014 m. The resulting eastern sub-lake is about three times larger than the west sub-lake and has a volume of 27 Mm3 compared to a volume of about 9 Mm3 for the resulting western sub-lake. The western sub-lake has a volume of about 4 percent of the current lake and 2 percent that of the theoretical maximum lake. The eastern sub-lake has a volume of about 11 percent of the current lake and 6 percent that of the theoretical maximum lake. The shortest distance from the crest of the debris dam to the western sub-lake margin is less than 1 km and is 2–2.5 km to the eastern sub-lake margin.
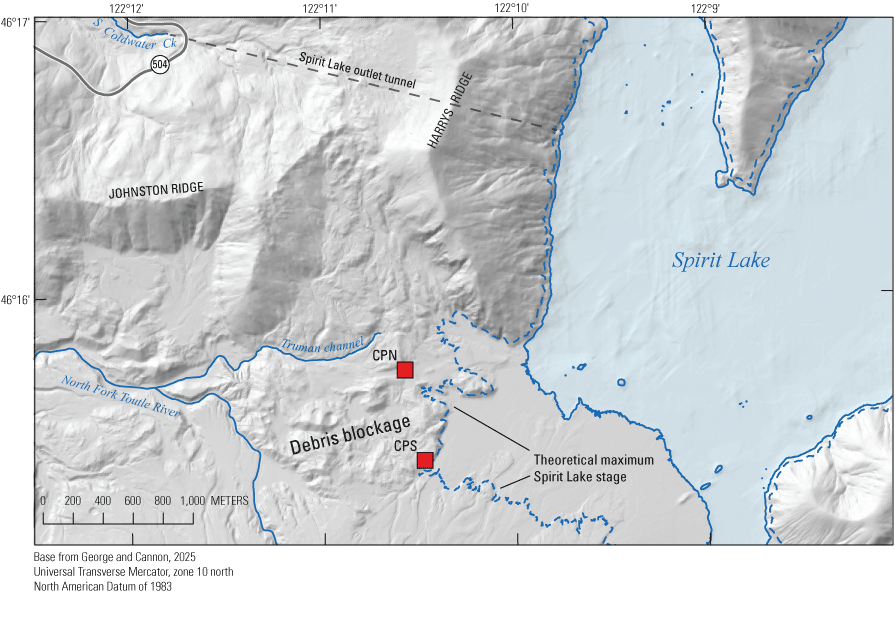
Relief map of the Spirit Lake debris dam blocking the Spirit Lake outlet into the North Fork Toutle River, Washington. The lowest identified points of the elevation of the boundary between the debris-avalanche and more erodible overlying pyroclastic deposits boundary were assumed to be critical or threshold values for the maximum lake-surface elevation above which the risk of dam failure was deemed too risky. Glicken and others (1989) identified two such low points lying underneath the crest of the dam. Critical points north and south (CPN and CPS) are the red squares located along the crest of the dam and are low points of the volcanic deposits contact with elevations of 1,071 meters (m) and 1,069 m, respectively. Points are shown in relation to lake elevation levels of 1,050.4 m (solid blue outline) and 1,070 m (dashed blue outline).
Previous Spirit Lake Outflow Modeling and Lahar Hazard Assessment
Swift and Kresch (1983) previously modeled outbreak floods from Spirit Lake, using a one-dimensional (1D) shallow-water (channel flow) numerical model to predict flow stages (and approximating runout based on cross-sectional topography) in the Toutle and Cowlitz River valleys. They used an estimated hydrograph as an inflow boundary condition near Camp Baker (formerly located at lat 46°19′48″ N., long 122°30′44″ W. near the foot of the debris-avalanche deposit and ~4.5 km upstream of the SRS), based on a hypothetical sudden debris-dam-break release of 390 Mm3 (corresponding to a Spirit Lake elevation of ~1,060 m) of clear water from Spirit Lake. They augmented their clear-water inflow hydrograph with 2.4 billion m3 of sediment presumed to have been entrained from deposits above Camp Baker. A static friction correction was added to the bulked flow to account for the sediment content in the ~2.8 billion m3 lahar.
Massive prehistoric lahars with volumes and depths comparable to those predicted by the Swift and Kresch study have been inferred from geologic deposits in the Toutle River Valley (Scott, 1988, 1989). Those lahars were believed to have non-eruptive origins and presumably resulted from breaching of ancestral Spirit Lake. However, the scarcity of data characterizing the geologic and hydrologic conditions accompanying those Holocene lahars prevents a rigorous comparison or hazard assessment of present conditions.
Methodology
Our study leverages technological and theoretical advances occurring since the 1983 Swift and Kresch study, including the availability of high-resolution digital elevation models (see “Base Topography and Bathymetry Digital Elevation Model” section), advances in computational methods (for example, George, 2008, 2011 George and Iverson, 2014), available geologic data (for example, Mosbrucker, 2014; Major and others, 2020), and theoretical advances in the modeling of debris-flow physics (for example, Iverson, 1997; Iverson and George, 2014). This enables the direct simulation of sediment entrainment and its influence on evolving downstream flow dynamics as an emergent phenomenon, including the development of debris flows. Conversely, earlier outburst flood-modeling approaches that accounted for sediment entrainment commonly used a static addition of volume to input hydrographs and (or) the use of enhanced friction for an assumed uniform and fixed solid concentration, neglecting many of the dynamic complexities of an evolving granular-fluid flow. Furthermore, traditional sediment transport models, developed primarily for steady fluvial systems, do not fully account for evolving rheological effects that accompany high-solid concentrations and debris flows developing from highly energetic outburst floods. As demonstrated in this study, a substantial volume of sediment can be added through the mobilization and incorporation of erodible material—affecting solid concentrations and resistance, discharge rates, total volume throughput, and runout extent in a complex and dynamic fashion that cannot be easily predicted through static volumetric and frictional approximations for the sediment load. We include results for clear-water floods without entrainment for several reasons. First, it allows us to isolate and characterize the effects of entrainment directly between similar modeling approaches—previous modeling efforts used different initialization scenarios, model assumptions, input data, and numerical schemes. Therefore, our clear-water results provide a baseline that illuminates the influence of entrainment. Second, we present erosive simulations with only one parameter value related to the entrainment rate. The value of the parameter that we chose leads to a relatively high amount of bed-sediment mobilization. Lower values of this parameter led to results intermediate to the clear-water floods and the erosive ones presented. See the “Entrainment Mechanism” section for discussion related to the entrainment model assumptions.
Models and Software
We simulated clear-water outbreak floods lacking erosive entrainment (or volume adjustments to account for sediment) using the software GeoClaw (George, 2008, 2011; Berger and others, 2011). GeoClaw solves the shallow-water equations, a commonly employed depth-averaged mathematical model used for water wave propagation (for example, George, 2008 LeVeque and others, 2011) and large-scale overland flooding (for example, George, 2011; Denlinger and others, 2021). GeoClaw has algorithms tailored for accurately resolving dam-break outflow conditions and inundation fronts over complex topography (George, 2008, 2011).
To model entrainment and its rheological effects, we used the depth-averaged two-phase granular-fluid model, D-Claw (George and Iverson, 2014; Iverson and George, 2014). D-Claw was originally developed for modeling variably dense granular landslides and large-scale debris flows for which high solid-volume fractions (greater than roughly 40–50 percent) and pore-fluid pressure coevolve in a tightly coupled manner. This feedback process controls the local dynamic, effective basal-shear resistance, and thereby dramatically influences flow mobility (see Iverson, 1997; Iverson and George, 2014). D-Claw’s model equations reduce to the shallow-water equations if solid grains are absent and therefore it can be used for surface flow problems that feature the interaction of water with granular sediment, and a spectrum of granular concentrations ranging from clear-water flows to dense debris flows (see for example, George and others 2017, 2019, 2022; Barnhart and others, 2021; Kafle and others, 2024).
Base Topography and Bathymetry Digital Elevation Model
A digital elevation model (DEM) of the model domain was assembled from various sources (George and Cannon, 2025). Topography data for valley bottoms of the Cowlitz and Toutle River systems is mostly based on surveys from 2007 to 2012 acquired to support USGS, USACE, and other studies (USACE, 2010; Mosbrucker 2014, 2015). DEMs derived from USGS data (see George and Cannon [2025] for more information) and various other surveys acquired from 2002 to 2012 were obtained from the Washington Department of Natural Resources (WA DNR) lidar portal (WA DNR, 2025; https://lidarportal.dnr.wa.gov). The source datasets were obtained as DEMs, re-projected to Universal Transverse Mercator zone 10 north and North American Datum of 1983, and mosaicked to form a single DEM covering the study area. The DEM was merged with a bathymetric DEM derived from surveys carried out in August 2009 and July 2010 (Gawel and others, 2018).
Channel-Cut Construction
We modified our DEM to contain elevations of hypothetical outlet channels through the Spirit Lake blockage. The hypothetical channels were assembled along thalweg lines drawn to extend from local minima in Spirit Lake through the critical points of Glicken and others (1989) to an elevation lower than the bed of Spirit Lake in the North Fork Toutle River valley (fig. 3; table 1). The channels were assumed to have approximately parabolic cross-sectional profiles. We constructed two channels that we refer to as the “north” and “south” channels. The channels run east-west, bisecting a ~100-m-thick heterogeneous assortment of sediment and volcanic deposits overlying the pre-1980 topography. The channels extend eastward into Spirit Lake bathymetry to varying extents (fig. 3).
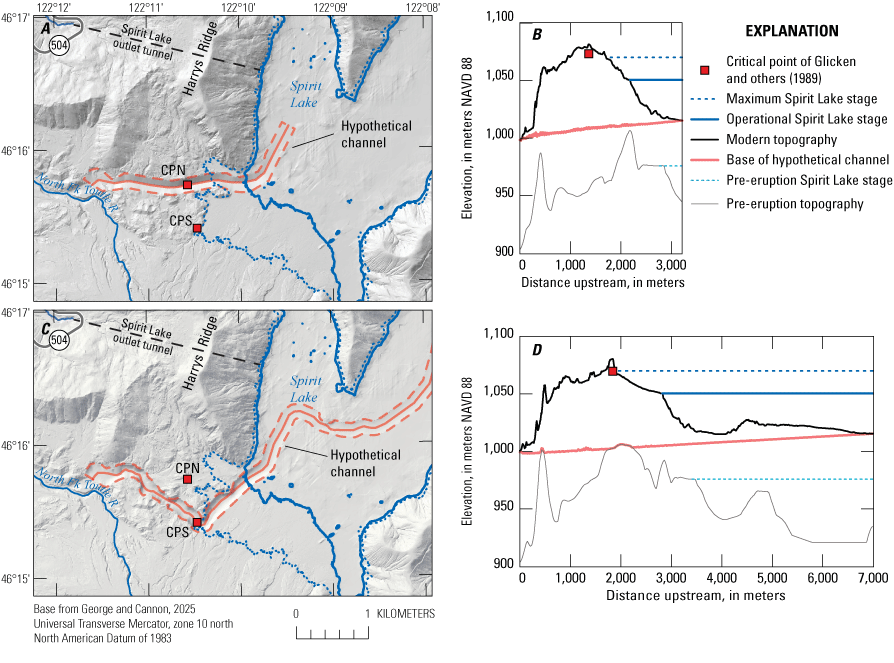
Shaded-relief maps and transect profiles showing our constructed channel cuts through the Spirit Lake, Washington, debris blockage. Channels were constructed through critical point north (CPN; 1,071 meters [m] elevation) (A and B), and critical point south (CPS; 1,069 m elevation) (C and D). Parts B and D show the elevation along the channel thalwegs, and “distance upstream” refers to the arc length from the downstream terminus of the hypothetical channels. The channels extend eastward into lake bathymetry to varying degrees, with the south channel extending farther through the submerged divide separating the east and west arms of Spirit Lake. Dashed orange lines (parts A and C) indicate the margin of the channels, solid orange lines indicate the channel thalweg (parts A and C) or elevation (parts B and D).
The north channel-cut scenario is a 200-m-wide cut through the north end of the blockage and passing through the CPN of Glicken and others (1989). The channel thalweg descends linearly from an elevation of 1,015 m in the west arm of Spirit Lake (the west arm has about 14,800 m2 of lakebed lower than 1,015 m) to about 1,000 m (996 m) in the North Fork Toutle River downstream of the debris blockage. The alignment of the north channel roughly follows the “Truman Channel” (Major and others, 2020; fig. 2), which was mostly incised by water pumped from Spirit Lake by USACE in the early 1980s. This leads to a maximum channel depth about 60 m below the crest of the blockage. In constructing the channel depth, we assumed that pre-eruptive topography was non-erodible. Note that the channel thalweg passes just a few meters above debris-submerged bedrock extensions of north-south trending Harrys Ridge and an unnamed ridge to the west (fig. 3).
The south channel-cut scenario follows a thalweg that descends linearly from an elevation of ~1,014 m in the bed of Spirit Lake to 996 m at its confluence with North Fork Toutle River, passing through the CPS of Glicken and others (1989; fig. 3). The north and south channel cuts are nearly co-located at Spirit Lake’s current typical shoreline (~1,050 m elevation), and they terminate in similar locations on the North Fork Toutle River. However, the south channel cut takes a more circuitous path through the debris dam, heading southward through the CPS and turning northward toward its confluence with the North Fork Toutle River. This endows the south channel with a deeper cut through the debris dam while remaining above pre-eruptive topography. Additionally, the upstream end of the south channel cut extends several kilometers into lake bathymetry, bisecting the submerged divide between the west and east arms of Spirit Lake. The extension was constructed with the goal of providing lake drainage from the east arm of Spirit Lake for establishing a reasonable upper bound on outflow volume—it was not based on a physical assessment of probable lake-bed erosion.
Erodible Bed Sediment
D-Claw requires a predetermined specification of the spatially varying thickness of available erodible bed-sediment as a raster dataset, which we developed for the upper North Fork Toutle River from the downstream terminus of our channel cuts to immediately upstream of the SRS (fig. 4). The approximation was made by subtracting a DEM derived from 1950s maps (Cannon, 2023) from the modern DEM, which in our area of erodible sediment was derived from 2009 and 2012 lidar surveys. This resulted in an erodible layer up to ~195-m-thick with a total volume of 1.7 billion m3. Note that this represents available erodible material in a wide swath, not just the erodible sediment in the Toutle River channel or the actual volume of eroded sediment in simulations. Both upstream and downstream of this segment, the bed was considered non-erodible (fig. 1). The debris-dam failure and breach-growth process were not modeled directly; that process was implied by the specified channel cuts. The bed surfaces of the hypothetical outlet channel cuts were assumed to have stabilized following breach growth and erosion and lacked remaining erodible material. We avoided adding an approximation of channel-eroded solid volume from the hypothetical channel cuts to our outflow discharge, as doing so in a simple fashion could violate energetic constraints (refer to the “Entrainment Mechanism” section ). However, the volume of that neglected sediment is small, roughly10 percent of the total eroded sediment in the upper Toutle River (see the “Results” section). We assumed that the river below the SRS would contribute negligible net entrainment rates compared to the segment above the SRS, based on topographic gradients and erodible sediment data.
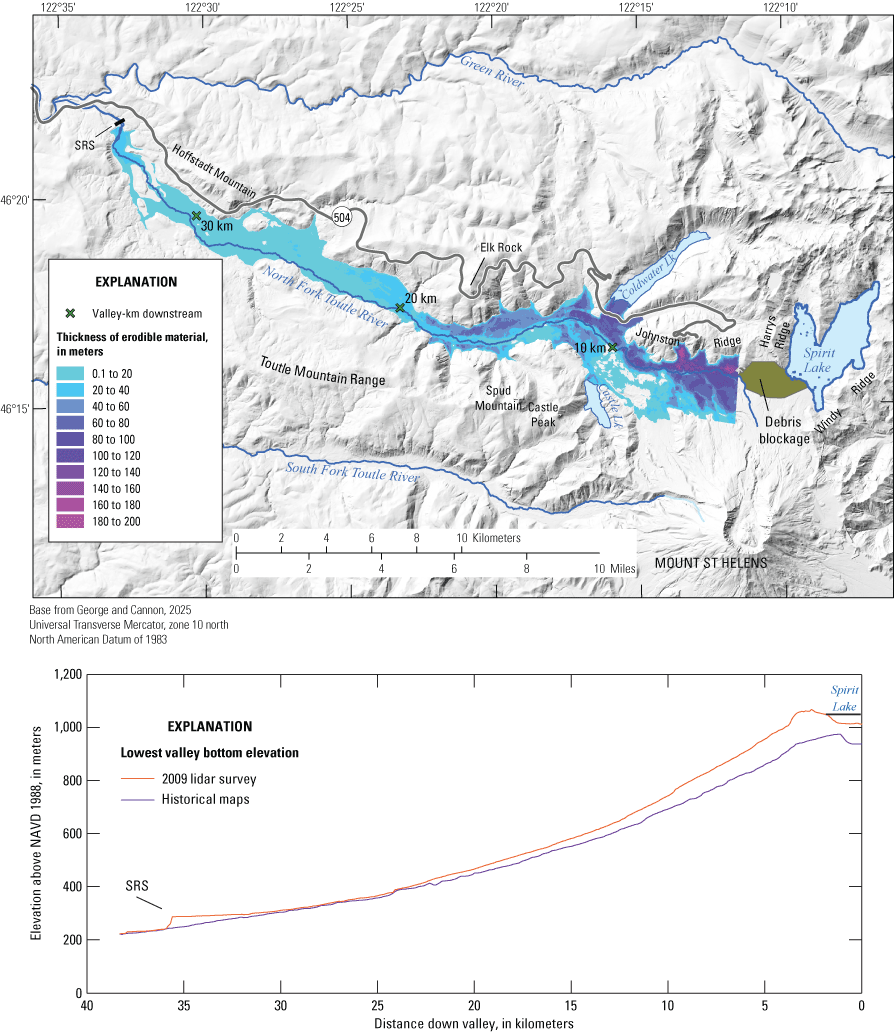
Shaded-relief map with colored depth contours (A) and longitudinal profile (B) showing erodible material in North Fork Toutle River lying between the Spirit Lake blockage and sediment retention structure (SRS). The depth-map was derived by subtracting a digital elevation model (DEM) derived from 1950s maps (Cannon, 2023) from the modern DEM, specifically from 2009 and 2012 lidar surveys for the area of erodible sediment. The difference between the two DEMs yielded a total volume of 1.7 billion cubic meters (m3) of available erodible material. km, kilometer; NAVD 88, North American Vertical Datum of 1988.
Entrainment Mechanism
In depth-averaged models of entrainment, the incorporation of material into the overriding flow is typically assumed to occur at the basal interface between moving material and static erodible sediment (as opposed to longitudinal mobilization of material or collapse and failure en masse, see McGuire and others, 2017). Numerically, at each timestep and for each computational grid cell where entrainment occurs, a total mass per unit area is added of ρb Δh (where ρb is the density of saturated granular material in the erodible bed and Δh is the thickness of mobilized material or equivalently the reduction in the height of the bed surface) and a solid volume mb Δh (where mb is the solid-volume fraction of the erodible bed material, table 2). This process exchanges momentum between the overriding flow and the mobilized bed material without contributing directly to net flow momentum (equivalent to discharge or mass-flux). The addition of mass therefore decreases the local flow velocity upon entrainment while the mass-flux is unchanged. However, the process transfers potential energy from the static bed to the flow, which can be subsequently harnessed into downslope flow momentum (discharge or mass-flux). This can lead to apparent momentum growth at the flow front (see, for example, Iverson and others, 2011); however, the added contribution of entrained material to the cumulative discharge of the entire flow body is limited by the initial potential energy of that material minus its contribution to flow resistance and energy dissipation.
The physical processes described above are implied by basic physical conservation laws of mass, momentum, and energy. However, the entrainment rate (the amount of material Δh that is mobilized over a timestep in a grid cell) is not rigorously described by physical models and is poorly constrained by available data (see for example Iverson and Ouyang, 2015; Conroy and George, 2022; Lee and others, 2022; Könz and others, 2024). We follow a traditional empiricism (see, for example, Lee and others, 2022) of using an affine function for the entrainment rate that depends on approximations of the bed-shear stresses, critical mobilization or threshold stresses, and uncertain, or calibrated parameters. In D-Claw, the bed-shear stress is approximated as the sum of the effective basal coulomb friction, an effective fluid viscosity, and a Manning resistance formula (see the “Model Scenarios and Initation” section, Iverson and George, 2014; George and Iverson, 2014). Because of the wide range of flow regimes, solid concentrations, and uncertainty and (or) variability in the bed characteristics (for example, saturation levels) of the modeling described herein, we used a very simple model with a single tunable proportionality constant (Ce=01) relating the bed-shear stresses to the entrainment rate, which provided the best fit for large-scale experimental data of entrainment of loose saturated material at the USGS debris-flow flume (Iverson and others, 2011). It is worth noting that highly energetic outburst floods and debris flows can mobilize considerably more material than what would be predicted by more common fluvial sediment transport models or runoff models that use grain-by-grain mobilization and suspension or bed-load transport (see, for example, Iverson and others, 2011; McGuire and others, 2017, Roelofs and others, 2022, 2023).
Deposition in our modeling occurs en masse through flow halting: grain by grain deposition through vertical particle settling is neglected. Inclusion of this latter effect would presumably have little effect near high-energy flow fronts but may lead to larger deposits in the late downstream stages of the floods. However, the validity of extending depositional settling models developed for fluvial and coastal systems to highly energetic and concentrated debris flows is largely untested (see, for example, Cheng, 1997; Iverson and others, 2011).
We tested several alternative entrainment schemes in D-Claw; however, different schemes produce nearly equivalent results given adjustments of unconstrained tunable parameters. Therefore, we present results for one scheme and one entrainment-rate parameter value and focus on the effects of the entrained material on flow dynamics rather than presenting a broad comparison of entrainment models and rates. An exploration of lower entrainment rate coefficents, Ce, than used for the results presented produced results intermediate between the erosive and clear-water floods. Higher entrainment rates than those presented produced less mobile flows overall due to substantially enhanced friction in the lower gradient valleys.
Model Scenarios and Initiation
Our simulations are initiated with Spirit Lake filled to a specified water level bounded planimetrically by the lake-surface intersection with current (non-eroded) topography, which predicates lake volumes that precede dam breaching and outflow (fig. 5). Because our simulations begin with preexisting channel cuts, dam-break initial conditions occur at the outlet upon model initiation. We neglected flood initiation mechanics for which outflow, breach growth, and entrainment of dam material co-evolve in a complex sequence. These inherently stochastic processes can be modeled with D-Claw (for example, George and others, 2019); however, results are sensitively dependent on material parameters that characterize the subsurface geology for which well-constrained modeling inputs are lacking. Assessing the variability of results within the range of uncertainty is beyond the scope of this study.
We modeled multiple sets of clear-water and erosive floods with identical outflow conditions, providing baseline comparisons regarding the effects of downstream entrainment on hazard extent. Variable lake levels and channel cuts are intended to help characterize the sensitivity of downstream variability to outflow conditions. The volumes of material removed to produce our channel-cut DEMs (the volume of material that would be lying above the hypothetical channel-cut bed if we left our base DEM unaltered ) are 12.9 Mm3 and 25.0 Mm3 for the north and south channel cuts, respectively. For comparison, the volumes of actual eroded sediment in our simulations varied but were less than 300 Mm3 (see the “Results” section), about 10 times the volume removed from the channel cuts.
We carried out simulations for two lake levels: 1,070 m and 1,050.4 m, corresponding to total lake volumes of 468 Mm3 and 234 Mm3, respectively. The higher lake level is based on the assessment of Glicken and others (1989) for the maximum lake level above which breaching becomes more likely. The lower lake level corresponds to the lake surface in recent lidar, and we use it for our lower bound on lake volume in the event of a catastrophic failure.
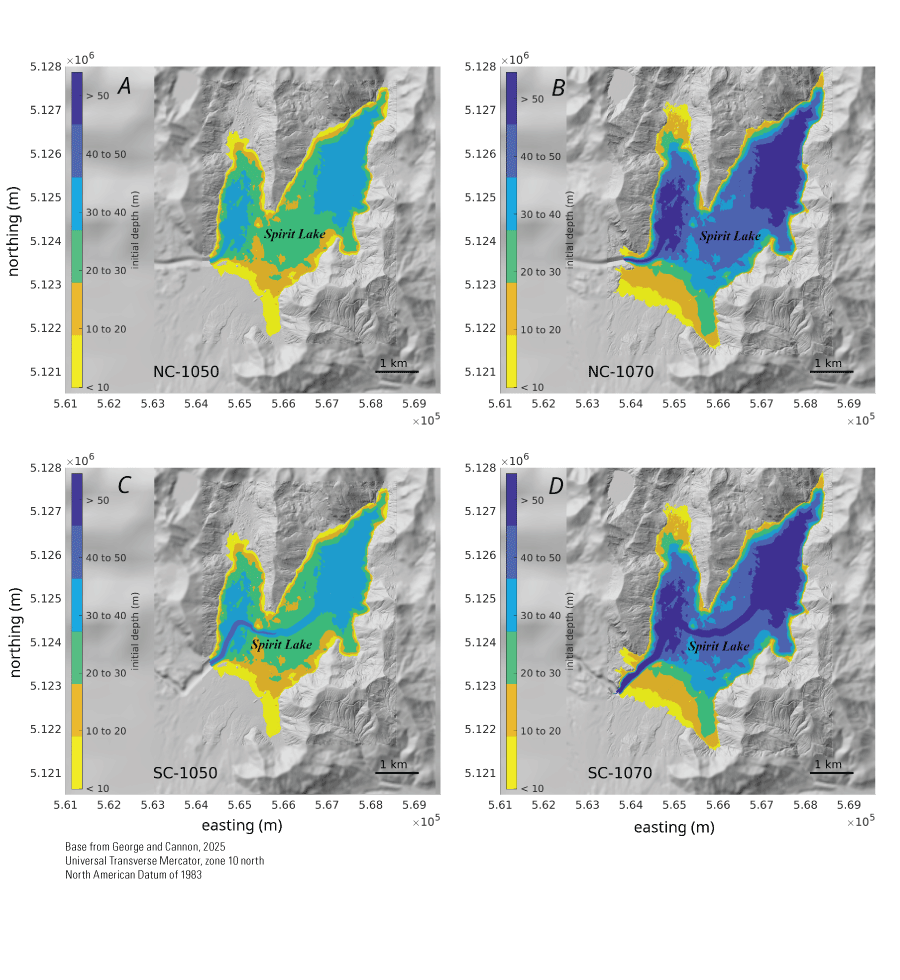
Panels showing the numerical solution with colored contours indicating the water depth in Spirit Lake, Washington, prior to model initiation for the four initial conditions: lake levels of 1,050.4 meters (m) for the north and south channel cuts (A and C respectively) and 1,070 m for the north and south channel cuts (B and D respectively). See figure 3 for shaded-relief maps and transect profiles showing our constructed channel cuts through the Spirit Lake blockage. Shaded-relief topography is the dynamic numerical resolution of the base digital elevation model with adaptive mesh refinement (coarser areas appear blurry). SC, south channel; NC, north channel.
Simulations for both lake levels, through the north and south channel cuts, with and without erosion, result in a total of eight simulations described in this report (table 1). The simulations are denoted with abbreviations for the channel (NC or SC), lake level (1070 or 1050), and erosive or clear water (ER or CW) (for example, NC-1070-ER, SC-1050-CW, and so forth).
Table 1.
Lake levels, water volumes, and removed channel-cut and available erodible sediment volumes for each of the eight dam-breach simulations, Spirit Lake, Washington.[See figure 3 for shaded-relief maps and transect profiles showing our constructed channel cuts through the Spirit Lake blockage. Vertical elevations are referenced to the North American Vertical Datum of 1988 (NAVD 88). The scenarios are denoted with abbreviations: NC, north channel; SC, south channel; lake level, 1,070 or 1,050 meters (m); and ER, erosive water; CW, clear water. m, meter; Mm3, million cubic meter; ~, approximately; %, percent.]
Our simulations were computed on a 78 km (east-west) by 40 km (north-south) domain, encompassing Spirit Lake, the Toutle River valley, and the Cowlitz River valley extending ~10 km to the north of the Toutle River mouth and ~10 km to the southwest of the Cowlitz River mouth at the Columbia River. To optimize computational efficiency and accuracy with respect to numerical grid resolution, available DEM resolution, or regions of particular interest, the GeoClaw and D-Claw software packages employ adaptive mesh refinement (AMR) schemes (Berger and Oliger, 1984) designed for free-surface flows over topography (Berger and others, 2011; George, 2011; LeVeque and others, 2011). AMR provides patches of variable resolution grids that evolve with the advancing flow path and flow dynamics. Spirit Lake, the outlet, and flow in the channel cuts were resolved at a grid resolution of 4 m. Flows downstream of the channel cuts were resolved at a grid resolution of 10 m and simulated for up to 24 hours from the debris-dam-break initiation. Optimal temporal resolution (time step sizes) is variable and based on numerical accuracy and stability constraints.
For the D-Claw erosive flows, model input parameters characterizing the erodible and entrained material are constrained only to the degree possible based on available data for granular sediment samples used in controlled experiments (for example, Iverson and others, 2010) and shown in table 2. Refining these parameters based on samples of actual sediment deposits in the North Fork Toutle River would require further study. For a description of these parameters and their effect on simulation results, see George and Iverson (2014), Iverson and George (2016), and George and others (2022).
Table 2.
D-Claw model input and material parameters for saturated erodible and entrained sediment (see George and Iverson, 2014).[Units: m2, square meter; N s/m2 newton second per square meter; kg/m3, kilogram per cubic meter; m1/3/s, meter to the cube root per second; s m2/kg, second square meter per kilogram.]
Results
Dam-Break Initiation, Outflow Discharge, and Spirit Lake Drainage
Simulations began (defined as time [t] =0 seconds [s]) with the release of water as dam-break initial conditions located at the lake boundary and channel-cut intersections (fig. 5). The erosive and clear-water simulations are identical (aside from small numerical discrepancies due to different software implementations) upstream of the erodible sediment (fig. 4) that lies below the hypothetical channel cuts, yielding four pairs of outflow scenarios (table 1). Channelized flow quickly advances through the pre-computed breach cuts and into North Fork Toutle River. Outflow discharge for the four scenarios was computed along a transect across the Spirit Lake outlet (labeled ΓSLO, figs. 6 and 7). For all outflow scenarios, peak discharges at the outlet are reached within 3 minutes, and lake drainage continues for ~12 hours. The south channel cut scenarios lead to more complete lake drainage by providing a lake-floor bathymetric channel from Spirit Lake’s east arm (fig. 3). The remaining lake levels after 12 hours of drainage are shown in figure 8. Discharge and total volume of outflow for the four scenarios are shown in table 3.
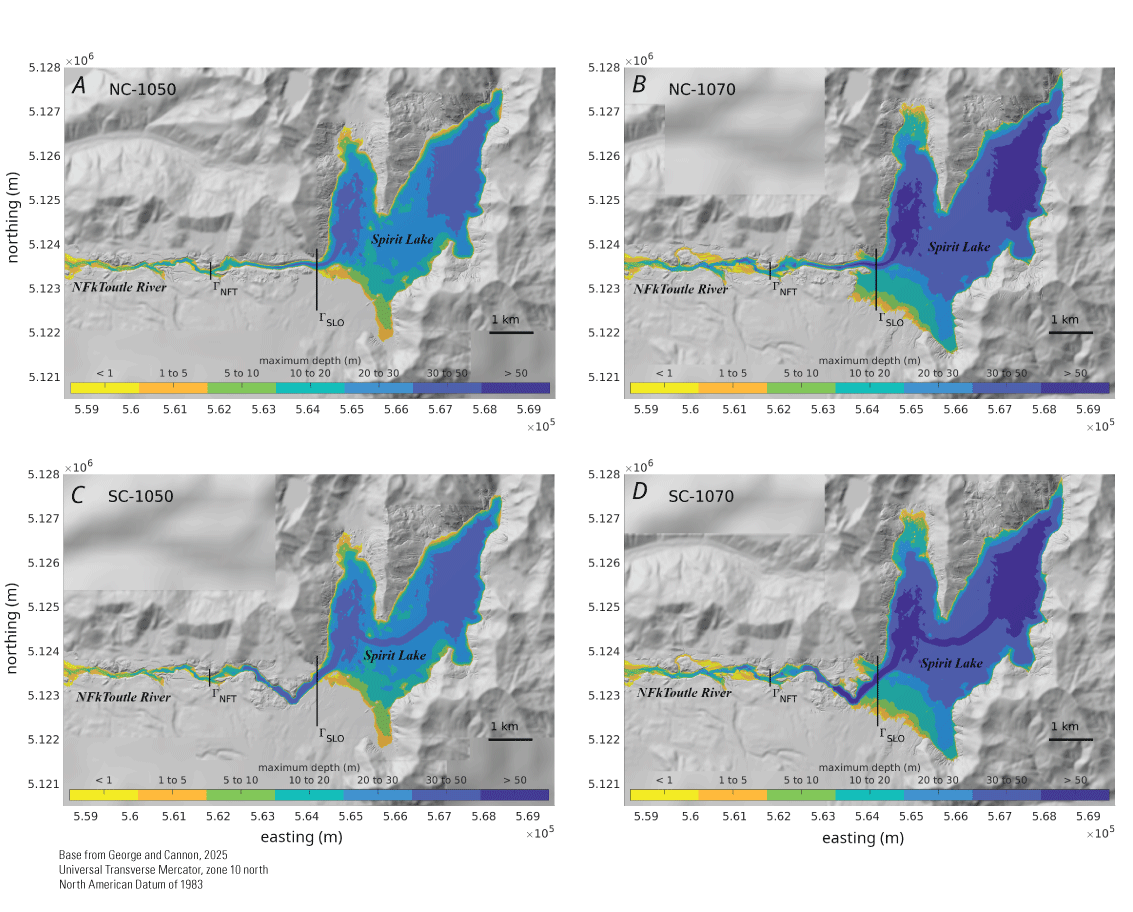
Panels showing the numerical solution with colored contours indicating the maximum water depth observed during the first 10 minutes of simulation time, indicating outflow through the channel cuts connecting Spirit Lake with North Fork Toutle River, Washington. Black vertical lines indicate the locations of transects for computed time series (see fig. 7) at the Spirit Lake outlet (ΓSLO) and on the upper North Fork Toutle River (ΓNFT), which lies downstream of the north and south channel cuts (fig. 3). Individual panels correspond to the four initialization conditions. The scenarios are denoted with abbreviations: NC, north channel (A, B); SC, south channel (C, D); lake level, 1,050 (A, C) or 1,070 meters (m) (B, D). Shaded-relief topography is the adaptive mesh resolution of the base digital elevation model (coarser areas appear blurry). km, kilometer.
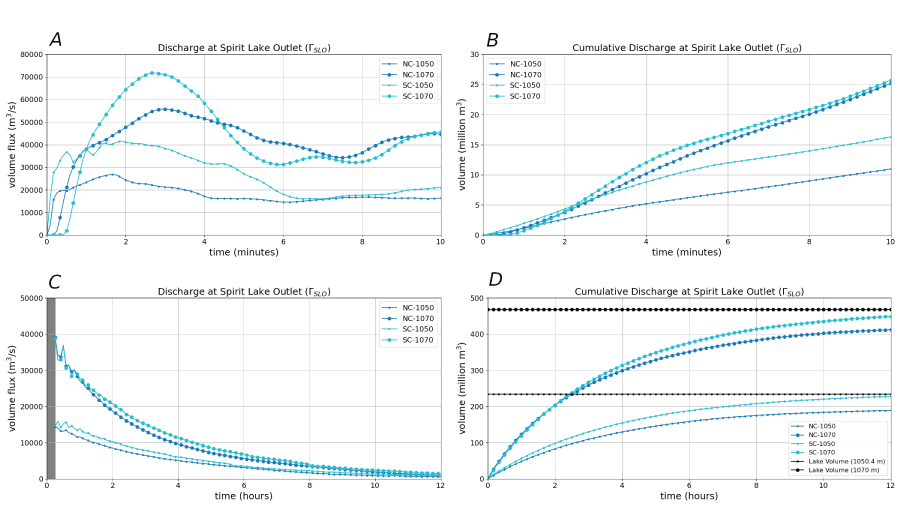
Graphs of flow discharge and total volume passing through the Spirit Lake, Washington, outlet at transect ΓSLO (location shown in fig. 6) following model initiation at time (t) =0 for both lake levels and channel cuts (see fig. 3). Parts A and C show time series of the discharge rates (total volume flux), and parts B and D show the cumulative discharge (total volume of water). Parts A and B show peak discharges occurring in the first 10 minutes, Parts C and D show 12 hours of simulation time. Part D includes the total initial lake volumes (468 and 234 million cubic meters [m3]) for the lake surface elevations (1,070 and 1,050.4 meters [m]), indicating nearly complete lake drainage within 12 hours, with somewhat more drainage from Spirit Lake’s east arm through the south channel cut. The scenarios are denoted with abbreviations NC, north channel; SC, south channel; lake level, 1,070 or 1,050 m. m3/s, cubic meter per second.
Table 3.
Discharge, total outflow, and lake drainage volumes for the four debris-dam-break scenarios at Spirit Lake, Washington.[See figure 3 for shaded-relief maps and transect profiles showing our constructed channel cuts through the Spirit Lake blockage. Vertical elevations are referenced to the North American Vertical Datum of 1988 (NAVD 88). The scenarios are denoted with abbreviations: NC, north channel; SC, south channel; lake level, 1,070 or 1,050 meters (m); m3/s, cubic meter per second; Mm3, million cubic meter; %, percent; ~, approximately.]
Majority of remaining water is in the east arm of Spirit Lake for the north channel scenarios (see figure 8).
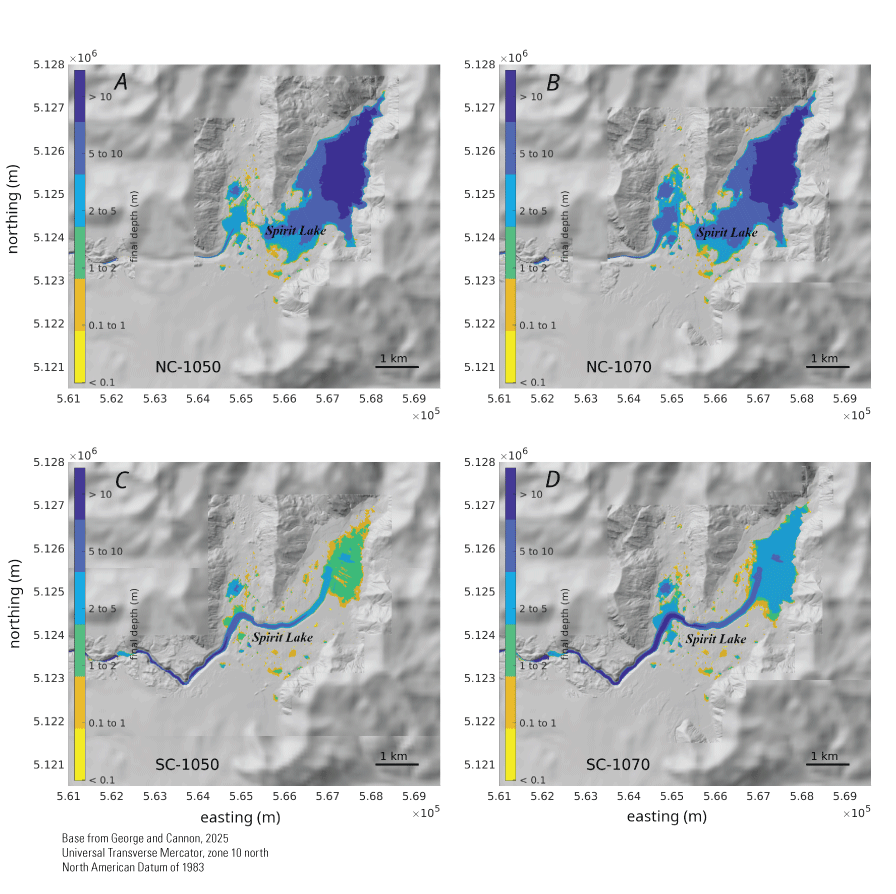
Panels showing the numerical solution with colored contours indicating water depth in Spirit Lake, Washington, after 12 hours of outflow and lake drainage. Individual panels correspond to each scenario configuration with respect to the initial lake surface elevation and channel cut (fig. 3). The north channel cut (A, B) provides less complete drainage of the east arm of Spirit Lake compared to the south channel cut (C, D). The scenarios are denoted with abbreviations: NC, north channel; SC, south channel; lake level, 1,070 or 1,050 meters (m). Shaded-relief topography is the dynamic adaptive mesh resolution of the base digital elevation model (coarser areas appear blurry). km, kilometer.
Comparison of Flows in the Upper North Fork Toutle River Overlying Erodible Sediment
Erodible bed material was considered only between the channel cuts and the SRS (fig. 4). In this reach of the North Fork Toutle River, the erosive flows simulated with D-Claw mobilize and entrain bed material, increasing the total flow volume (defined as the summed volume of any material [water or sediment] displaced from its initial location). The influence of sediment entrainment on flow dynamics is observable immediately as floodwaters encounter the erodible bed material. Flow variables for the eight scenarios are compared at a set of cross-channel transects located progressively downstream (figs. 9–11, table 4). Below the upstream boundary of erodible sediment (ΓNFT), the peak and cumulative discharges are reduced by the entry of flood waters into thick, erodible, material. This presumably occurs because the mobilization of frictionally resistive material acts as an energy sink before entrained material gains momentum downslope. Farther downstream, at ΓElkRock and below (fig. 9), this pattern is reversed as the peak and early discharge rates of the erosive flows are elevated substantially from that of the non-erosive flows in the leading rush (less than [<] 1 hour) (fig. 10 and 11). Note also that the peak discharges for the erosive flows increase progressively downstream, while those for the clear-water flows decrease. This pattern occurs from the accumulation of mobilized mass and accompanying potential energy that is released downslope, leading to a larger and more energetic flow front. At later times (greater than [>] 1 hour), as the overall discharge rates of both the clear-water and erosive floods begin to wane, the discharges of the erosive flows fall below that of the clear-water floods (figs. 10, 11). We attribute this to the presence of resistive and slowly moving sediment-laden flows.
The erosive flows achieve larger maximum flow depths along the upper North Fork Toutle River; however, note that inundation extent (affected area) is only marginally increased with bulking (fig. 12). This pattern is intuitive if one considers the combination of the larger volume flow fronts and erosion of the channel (the depth of bed scour and remaining erodible material are shown in figure 13); a flow composition of resistive granular material does not spread laterally as easily as clear water.
In summary, active entrainment of material affects the flow discharge in complex and variable ways depending on time and location. The competing effects of momentum growth upon the release of potential energy with that of increased shear resistance from the presence of solids lead to faster and more energetic flow fronts followed by slower and less energetic trailing flows subject to higher frictional resistance. The pore-fluid pressure response to the mobilization of solid-grains may accentuate the enhanced mobility of the flow fronts due to high fluid pressure followed by more resistive trailing flows with low pressure (see Iverson and George, 2014). Note that although the erosive flows lead to the displacement of more volume overall (bulking), this does not imply that more volume is ultimately transported long distances downstream or beyond the SRS—more material (sediment and water) is also left behind in resistive deposits (fig. 10; see the “Discussion and Summary” section). Conversely, clear water ultimately drains thoroughly (fig. 10).
Panel with colored contours indicating the location and thickness of the initial erodible sediment used in the simulations between Spirit Lake, Washington, and the sediment retention structure (SRS) on the upper North Fork Toutle River. Black lines indicate the locations of transects where time series data are computed. Transects are ΓElkRock, upper North Fork Toutle River at Elk Rock; ΓSRSU and ΓSRSL, upper North Fork Toutle River at above and below the SRS, respectively; and ΓNFT, upper North Fork Toutle River downstream of the channel cut. Shaded-relief topography is the dynamic adaptive mesh resolution of the base digital elevation model (coarser areas appear blurry). m, meter; km, kilometer.
Table 4.
Peak discharges on the upper North Fork Toutle River through four transects for each debris-dam-breach scenario of the Spirit Lake, Washington, blockage.[The locations of the transects are shown in figure 9. The scenarios are denoted with abbreviations: NC, north channel; SC, south channel (see fig. 3); lake level, 1,070 or 1,050 meters (m); and ER, erosive water; CW, clear water. ΓNFT, upper North Fork Toutle River transect downstream of the channel cut; ΓElkRock, upper North Fork Toutle River transect at Elk Rock; ΓSRSU and ΓSRSL, upper North Fork Toutle River transects at the above and below the sediment retention structure (SRS) m3/s, cubic meter per second.]
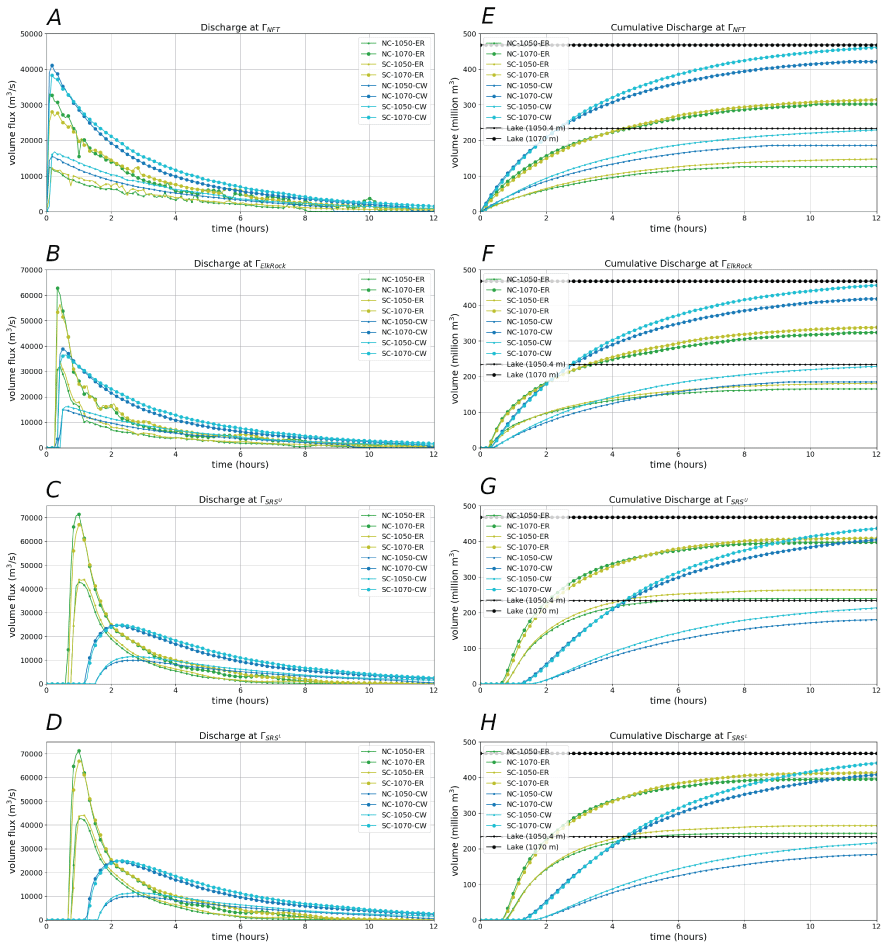
Graphs of time series of flow discharge through transects at selected locations on the upper North Fork Toutle River for the first 12 hours of simulated time for each debris-dam-breach scenario of the Spirit Lake, Washington, blockage. Transect locations are shown in figure 9. Parts A through D show the discharge rate or volume flux through the transect. Parts E through H show the cumulative discharge, or total volume passing through the transect over time. The total lake volume for each initial lake level is shown in the right panels. The scenarios are denoted with abbreviations: NC, north channel; SC, south channel (see fig. 3); lake level, 1,070 or 1,050 meters (m); ER, erosive water; and CW, clear water. Transects are ΓNFT, upper North Fork Toutle River downstream of the channel cut; ΓElkRock, the upper North Fork Toutle River at Elk Rock; and ΓSRSU and ΓSRSL, upper North Fork Toutle River above and below the sediment retention structure (SRS), respectively. m3, cubic meter; m3/s, cubic meter per second.
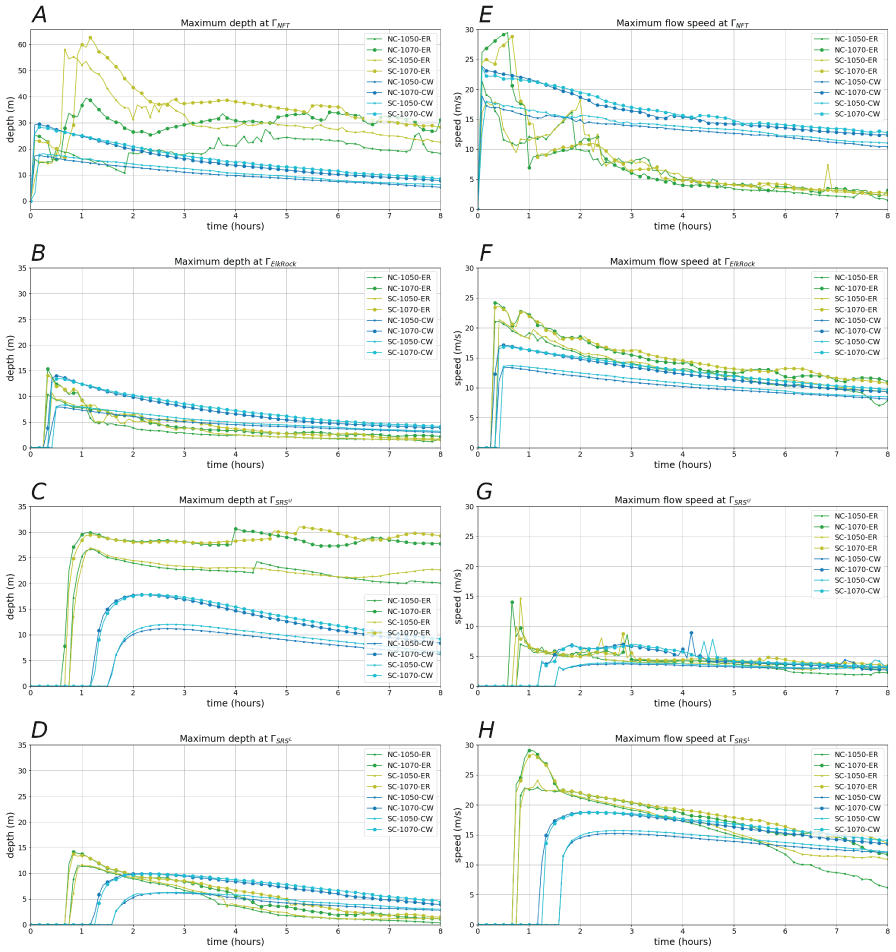
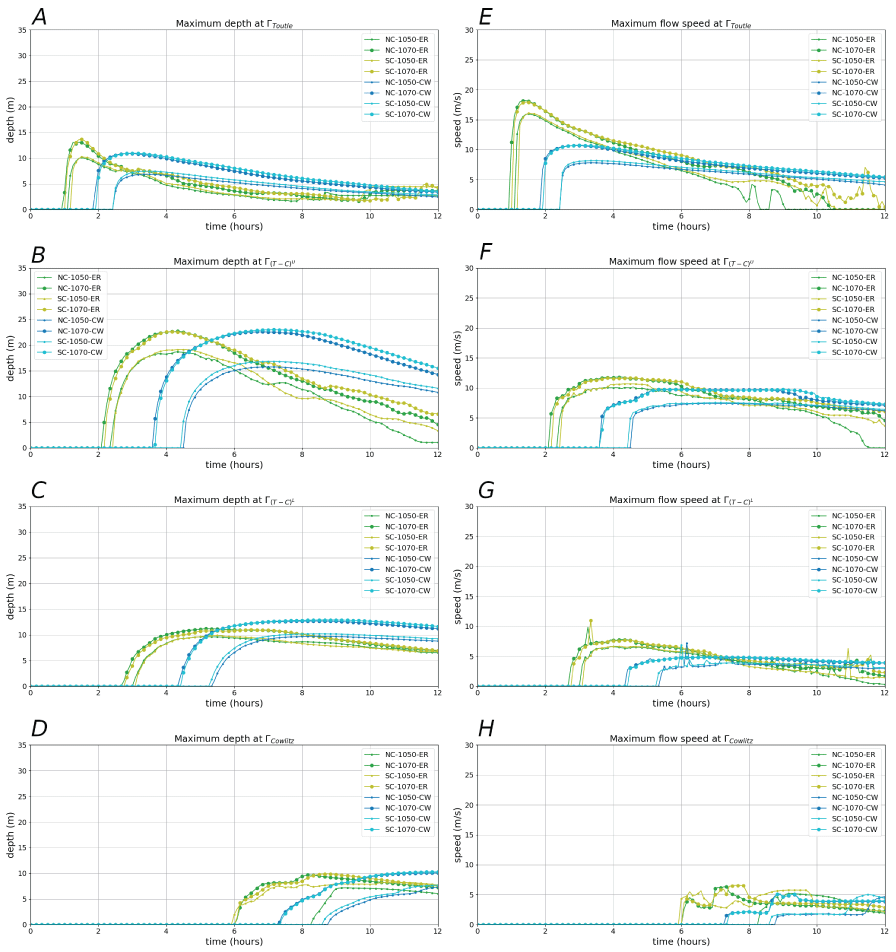
Graphs of time series of maximum depths and flow speeds along transects at selected locations on the upper North Fork Toutle River for the first 8 hours of simulated time for each debris-dam-breach scenario of the Spirit Lake, Washington, blockage. Transect locations are shown in figure 9. Parts A through D show the maximum depth along transects as a function of time, for each scenario. Parts E through H show the maximum flow speed along transects as a function of time, for each scenario. Because of cross-channel variation, the maximum values are not in general co-located and therefore do not together represent discharge, which is shown in figure 10. The scenarios are denoted with abbreviations: NC, north channel; SC, south channel (see fig. 3); lake level, 1,070 or 1,050 meters; ER, erosive water; and CW, clear water. Transects are ΓNFT, upper North Fork Toutle River transect downstream of the channel cut; ΓElkRock, upper North Fork Toutle River at Elk Rock; and ΓSRSU and ΓSRSL, upper North Fork Toutle River above and below the sediment retention structure (SRS), respectively. m/s, meter per second.
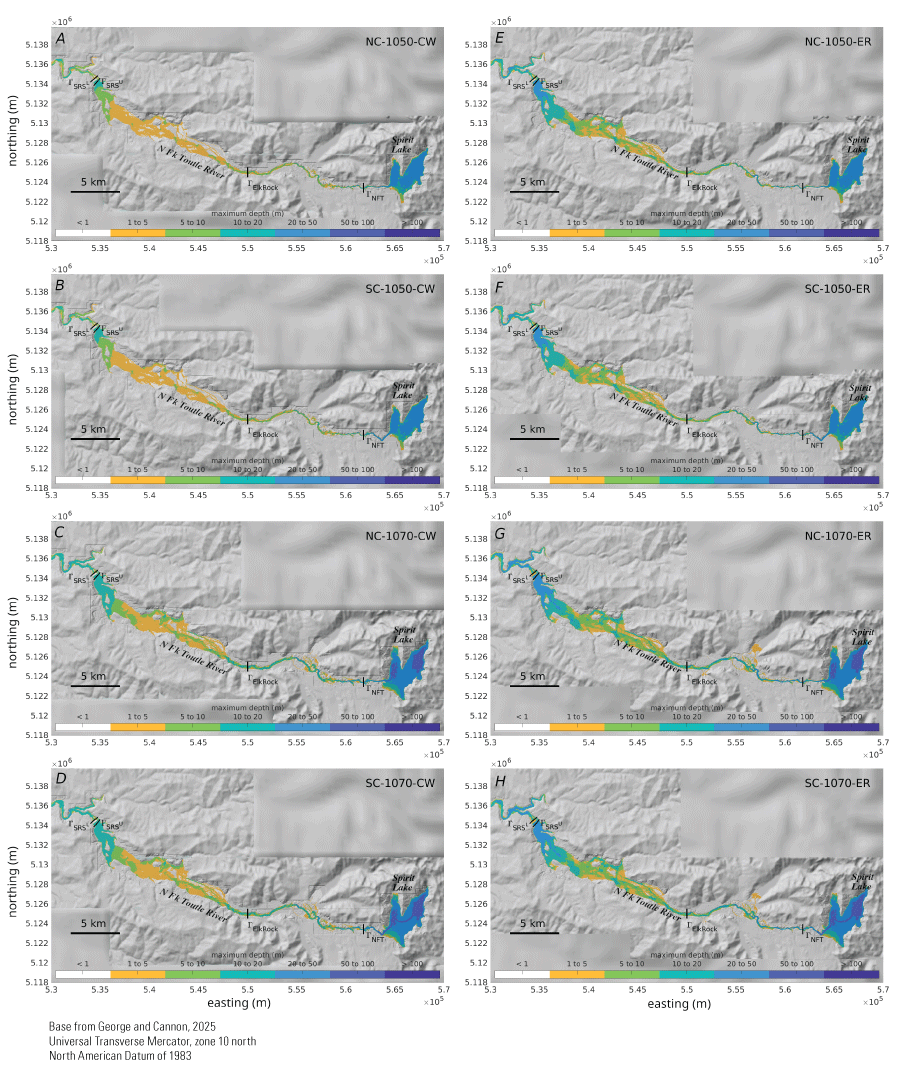
Panels showing the numerical solution of the upper North Fork Toutle River between Spirit Lake, Washington, and the sediment retention structure (SRS) with colored contours indicating the maximum flow depths observed during 12 hours of simulated time for each of the eight debris-dam-breach scenarios. Parts A through D (left) show the clear-water flood scenarios and parts E through H (right) show the erosive-flood scenarios. The scenarios are denoted with abbreviations: NC, north channel; SC, south channel (see fig. 3); lake level, 1,070 or 1,050 meters (m); and ER, erosive water; and CW, clear water. Transects are ΓNFT, upper North Fork Toutle River transect downstream of the channel cut; ΓElkRock, upper North Fork Toutle River at Elk Rock; and ΓSRSU and ΓSRSL, upper North Fork Toutle River above and below the SRS, respectively. Shaded-relief topography is the dynamic adaptive mesh resolution of the base digital elevation model (coarser areas appear blurry). km, kilometer.
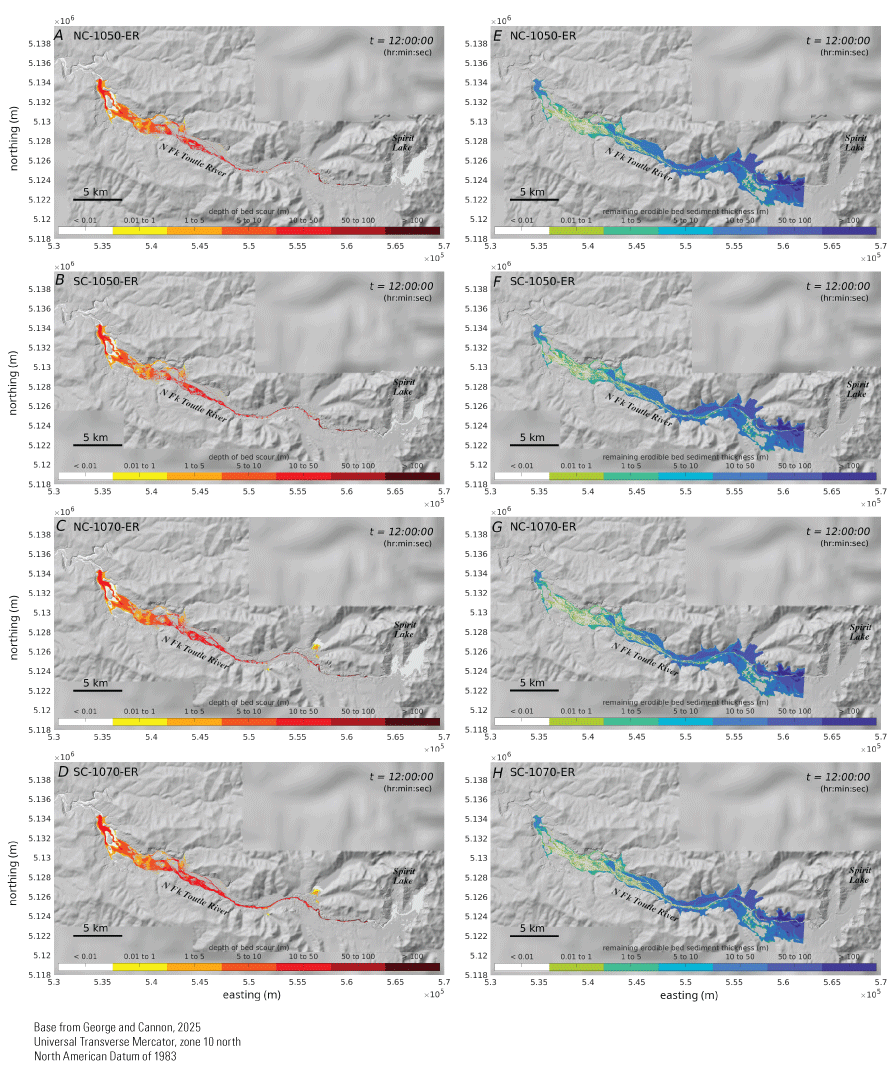
Panels showing the numerical solution of the upper North Fork Toutle River between Spirit Lake, Washington, and the sediment retention structure (SRS), with colored contours indicating the total depth of eroded sediment or bed scour (A–D) and the thickness of remaining erodible sediment (E–H) at time (t) =12 hours for the four erosive scenarios. The scenarios are denoted with abbreviations: NC, north channel; SC, south channel (see fig. 3); lake level, 1,070 or 1,050 meters (m); and ER, erosive water. Shaded-relief topography is the dynamic adaptive mesh resolution of the base digital elevation model (coarser areas appear blurry). km, kilometer.
Comparison of Flows Downstream of the Sediment Retention Structure (SRS)
Downstream of the SRS, erodible bed sediment is absent in the model simulations—topography is considered non-erodible in this region (refer to figs. 14 and 15 for map views and transect locations); however, the erosive flows continue as debris flows carrying sediment entrained from upstream.
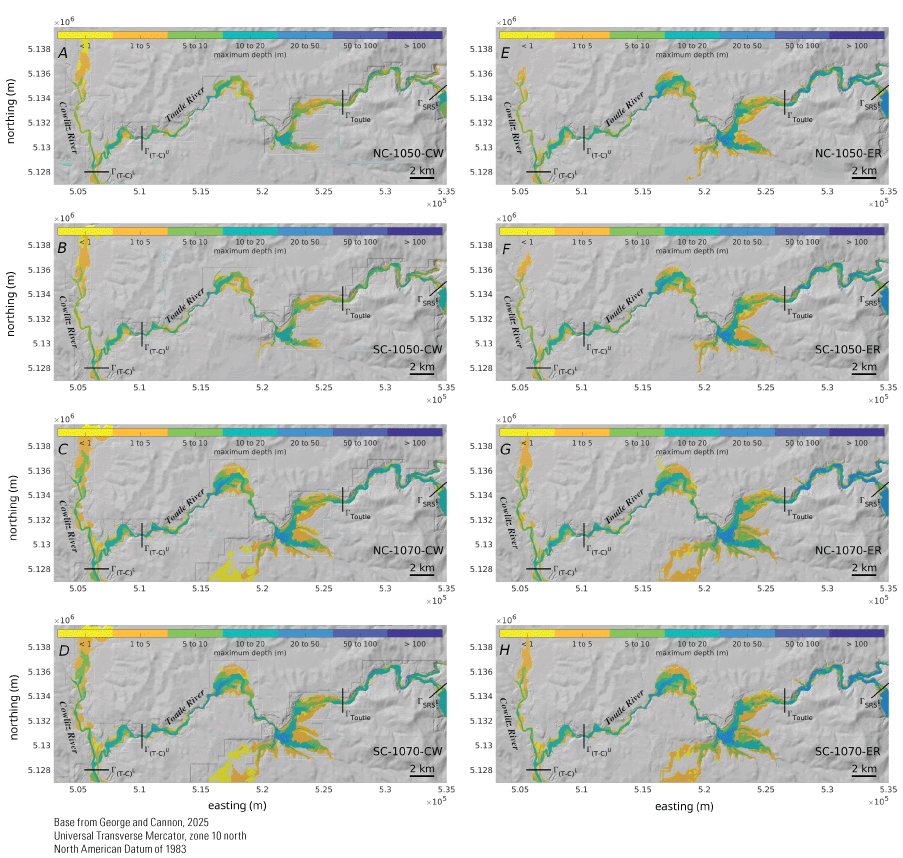
Panels showing the numerical solution of the Toutle River below the sediment retention structure (SRS) with colored contours indicating the maximum flow depths observed during 12 hours of simulated time for each of the eight dam-breach scenarios. Panels A through D show the clear water floods and panels E through H show the erosive flows. Black lines indicate the locations of transects where time series are computed. The scenarios are denoted with abbreviations: NC, north channel; SC, south channel (see fig. 3); lake level, 1,070 or 1,050 meters (m); ER, erosive flows; and CW, clear water. Transects are ΓSRS L, upper North Fork Toutle River transect just below the SRS; ΓToutle, on the Toutle River; and Γ(T-C)U and Γ(T-C)L, above and below, respectively, the confluence of the Toutle and the Cowlitz Rivers. Shaded-relief topography is the dynamic adaptive mesh resolution of the base digital elevation model (coarser areas appear blurry). km, kilometer.
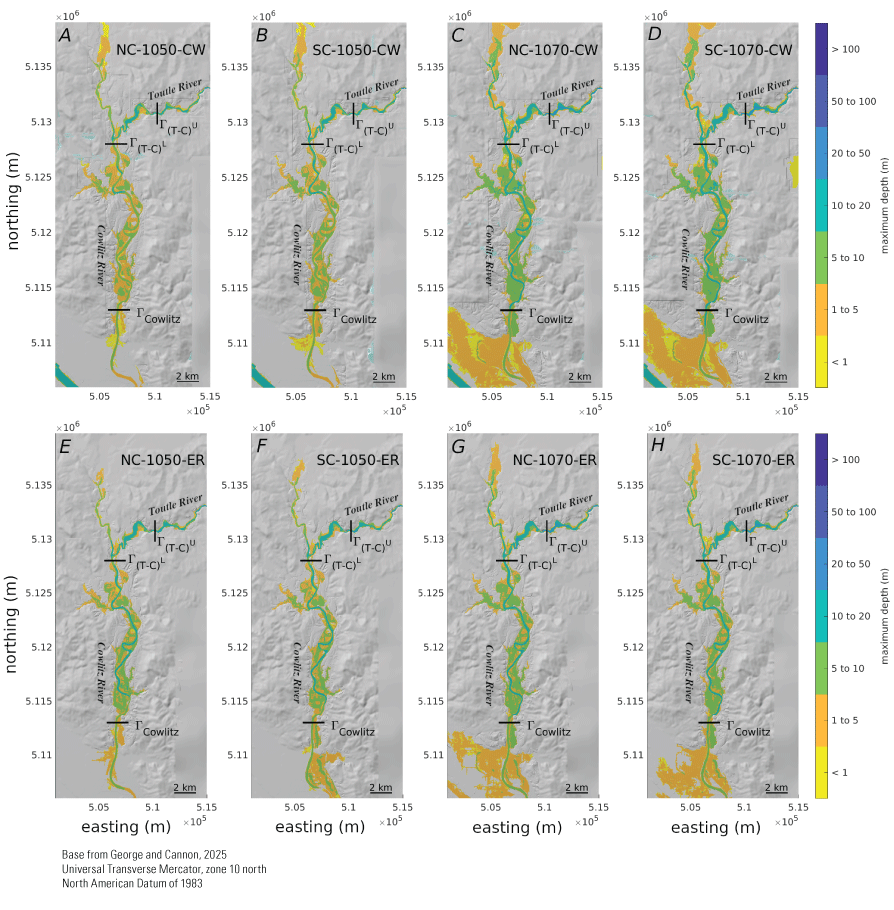
Panels showing the numerical solution of the Cowlitz River with colored contours indicating the maximum depths observed during 12 hours of simulated time for each of the eight debris-dam-breach scenarios. Panels A through D show the clear-water floods and panels E through H show the erosive flows. Black lines indicate the locations of transects where time series are computed. The scenarios are denoted with abbreviations: NC, north channel; SC, south channel (see fig. 3); lake level, 1,070 or 1,050 meters (m); ER, erosive water; and CW, clear water. Transects are Γ(T-C)U and Γ(T-C)L, above and below, respectively, the confluence of the Toutle and the Cowlitz Rivers; and ΓCowlitz, the farthest downstream on the Cowlitz River. Shaded-relief topography is the dynamic adaptive mesh resolution of the base digital elevation model (coarser areas appear blurry). km, kilometer.
At the most upstream transect in this reach (ΓToutle), flows maintain characteristics observed at locations in the active zone of entrainment above the SRS—the erosive flows have a substantially larger and faster leading phase followed by a more rapid drawdown in discharge later, compared to the clear-water flows (figs. 16, 17). However, in contrast to the zone of active entrainment upstream (above the SRS), the peak discharges in the leading phase of the erosive flows decrease monotonically downstream, dropping faster than their non-erosive counterparts (table 5). This leads to greater similarity between the discharge curves of the erosive and non-erosive flows with distance downstream from the lower segment of the Toutle River (fig. 14) to the lower Cowlitz River (fig. 15). This likely occurs because the volumes of the granular-fluid flows are no longer bolstered with the addition of sediment, but they retain the resistive granular material from upstream. Although arriving considerably earlier because of their high speeds achieved upstream, the erosive flows more closely resemble their non-erosive counterparts the farther they are observed downstream from the reach where material is entrained (figs. 16, 17; table 5). Note that at the farthest downstream transect, ΓCowlitz, the peak discharges of the clear-water floods exceed that of their erosive counterparts (table 5), which deliver more material that ultimately inundates more of the low-lying areas adjacent to the Columbia River (fig. 17). This pattern is consistent with the fact that the mobile flow volume of the debris flows diminishes because stalled resistive material remains upstream.
Table 5.
Peak discharges on the Toutle and Cowlitz Rivers along four transects for each debris-dam-breach scenario of the Spirit Lake blockage, Washington.[Locations of the transects found on figures 14 and 15. The scenarios are denoted with abbreviations: NC, north channel; SC, south channel (see fig. 3); lake level, 1,070 or 1,050 meters (m); and ER, erosive water; CW, clear water. ΓToutle, farthest upstream transect on the Toutle River; Γ(T-C)U and Γ(T-C)L, transects above and below, respectively, the confluence of the Toutle and the Cowlitz Rivers; ΓCowlitz, the farthest downstream transect on the Cowlitz River; m3/s, cubic meter per second.]
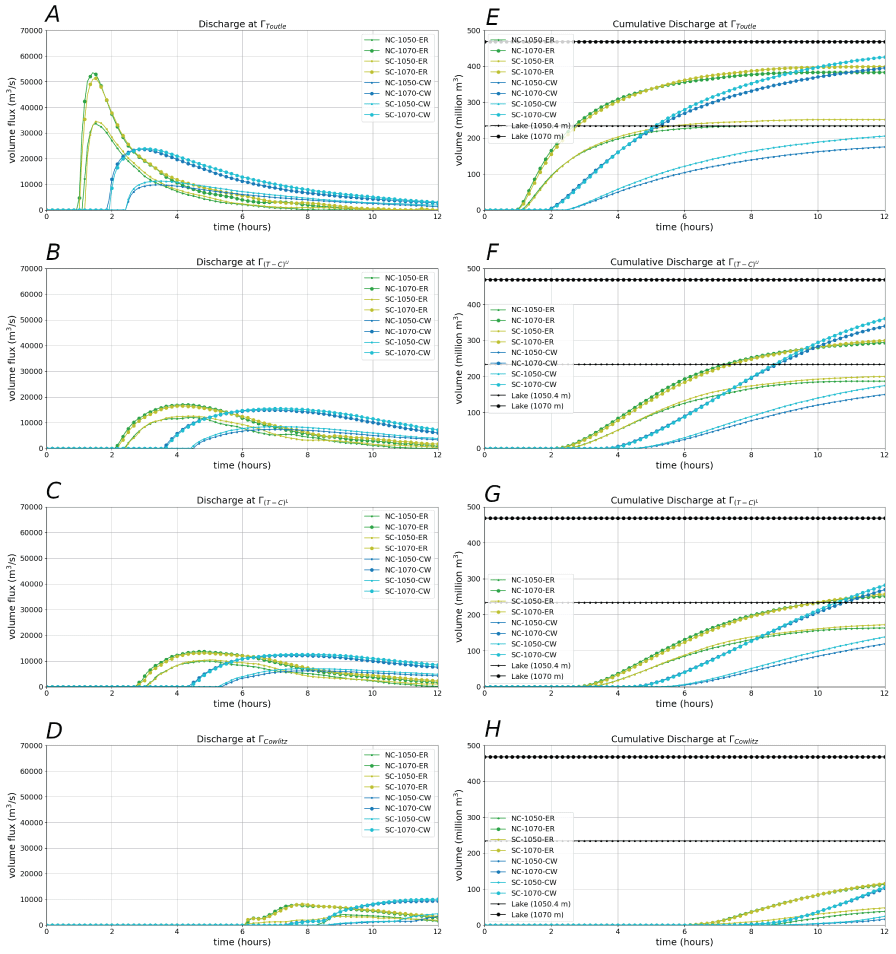
Graphs of time series of flow discharge through transects at selected locations on the Toutle and Cowlitz Rivers for the first 12 hours of simulated time for each of the eight debris-dam-breach scenarios. Transect locations are shown in figures 14 and 15. Parts A through D show the discharge rate or volume flux through the transect. Parts E though H show the cumulative discharge, or total volume passing through the transect. The total lake volume for each initial lake level is shown in the right panels. The scenarios are denoted with abbreviations: NC, north channel; SC, south channel (see fig. 3); lake level, 1,070 or 1,050 meters (m); ER, erosive flow; and CW, clear water. Transects are ΓToutle, farthest upstream on the Toutle River; Γ(T-C)U and Γ(T-C)L, above and below, respectively, the confluence of the Toutle and the Cowlitz Rivers; and ΓCowlitz, the farthest downstream on the Cowlitz River. m3, cubic meter; m3/s, cubic meter per second.
Graphs of time series of maximum depths and flow speeds along cross-channel transects at selected locations on the Toutle and Cowlitz Rivers for the first 12 hours of simulated time for each of the eight debris-dam-breach scenarios. Transect locations are shown in figures 14 and 15. Parts A through D show the maximum depth along transects as a function of time, for each scenario. Parts E through H show the maximum flow speed along transects as a function of time, for each scenario. Note that the maximum depth and speed are not in general colocated at any given time and so they do not indicate discharge (shown in fig. 16). The scenarios are denoted with abbreviations: NC, north channel; SC, south channel (see fig. 3); lake level, 1,070 or 1,050 meters (m); ER, erosive water; and CW, clear water. Transects are ΓToutle, farthest upstream on the Toutle River; and Γ(T-C)U and Γ(T-C)L, above and below, respectively, the confluence of the Toutle and the Cowlitz Rivers; and ΓCowlitz, the farthest downstream transect on the Cowlitz River. m3, cubic meter; m3/s, cubic meter per second.
Erosive-Flow Composition and the Development of Debris Flows
In this section we look more closely at the erosive-flow composition resulting from incorporation of granular sediment and focus on comparisons of just two scenarios: the NC–1070–ER erosive flow and the NC–1070–CW clear-water flood.
As flood waters begin to entrain large amounts of debris below the channel cuts, their solid-volume fraction increases accordingly. This occurs progressively downstream; fractions increase moving downstream at a given time, and fractions at a given location increase at later times (figs. 18A–D, 19). However, most erosion occurs in the first 2 hours (figs. 18E–H, 20). The increasing solid-volume fractions at later times may occur because the lake outflow discharge diminishes substantially yet erosion and deposition persist. Substantially more erosion is observed in the narrower, steeper, section near the channel outflow (ΓNFT, fig. 20A and fig. 21A), compared to the flatter river valley above the sediment retention structure (ΓSRSU, fig. 20B and fig. 21C). In the first few hours (t<2h) flows range from 20–30 percent solids nearer to the upstream extent of the erodible material to about 50–60 percent near the SRS, indicating that the sediment-laden floodwaters transition to debris flows as they accumulate eroded material. At later times (6–12 hours) slowly moving or stationary material with >60 percent solid content remains above the SRS.
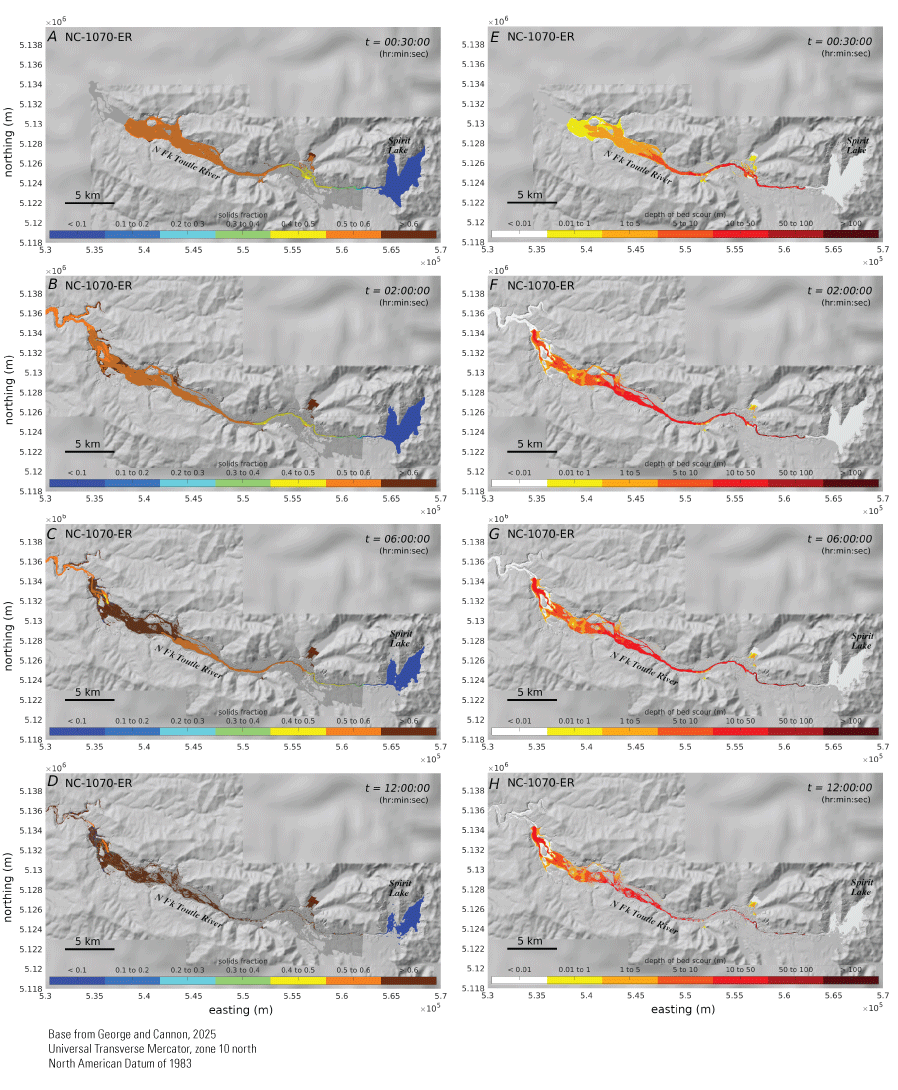
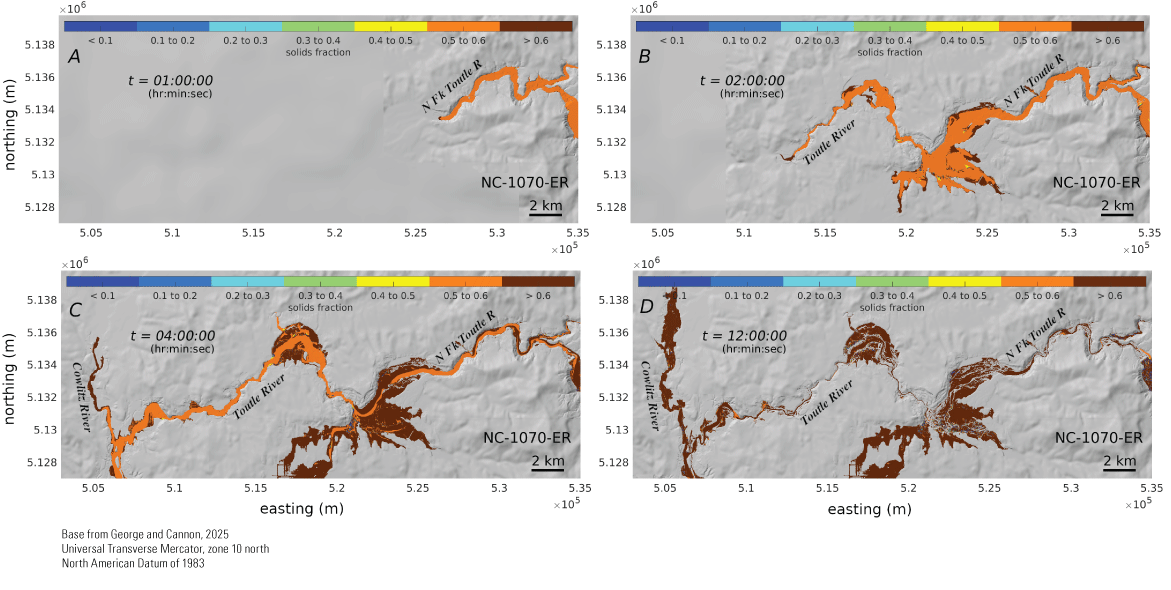
Panels showing the numerical solution with colored contours indicating the erosion and incorporation of solid material at selected times (t) in the North Fork Toutle River downstream of the Spirit Lake blockage and channel cuts. Panels A through D show the evolving solid-volume fraction and developing debris flows. Fractions increase moving downstream at a given time, and fractions at a given location increase at later times. Panels E though H show the evolving bed erosion or depth of bed scour. Most erosion occurs in the first 2 hours. The NC–1070–ER scenario is through the north channel with lake level at 1,070 meters (m) and erosive water (fig. 3). Shaded-relief topography is the dynamic adaptive mesh resolution of the base digital elevation model (coarser areas appear blurry). km, kilometer.
As sediment is entrained, it contributes to momentum growth at the flow-front leading to increasing peak discharges progressively downstream (time series of the total and constituent [solid versus fluid] discharges are depicted in fig. 21). Cumulative discharges or total volume throughput (fig. 21A–D) indicate that a substantial volume of both water and sediment remains upstream above the sediment retention structure.
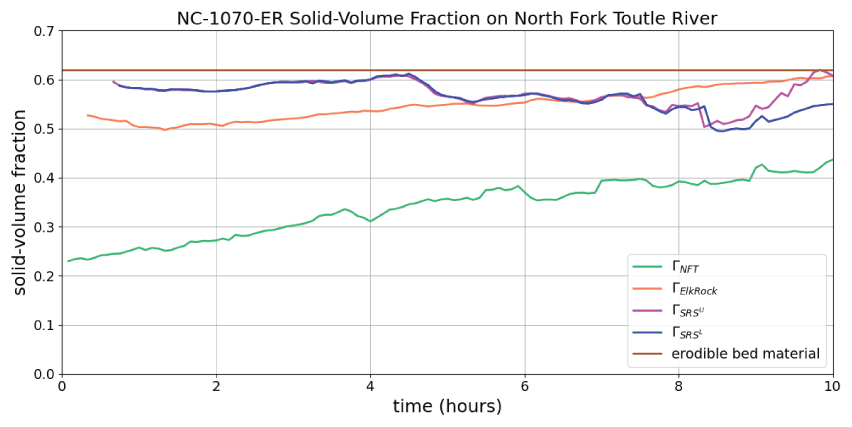
Graph of time series of the evolving solid-volume fraction averaged along crossflow transects at various locations on the upper North Fork Toutle River downstream of the Spirit Lake blockage. The NC–1070–ER scenario is through the north channel with lake level at 1,070 meters (m) and erosive water (see fig. 3). Transects are ΓNFT, upper North Fork Toutle River downstream of the Spirit Lake blockage and channel cuts; ΓElkRock, upper North Fork Toutle River near Elk Rock; ΓSRSU and ΓSRSL, upper North Fork Toutle River at the upper and lower positions of the sediment retention structure (SRS), respectively. Transect locations can be found in figure 9.
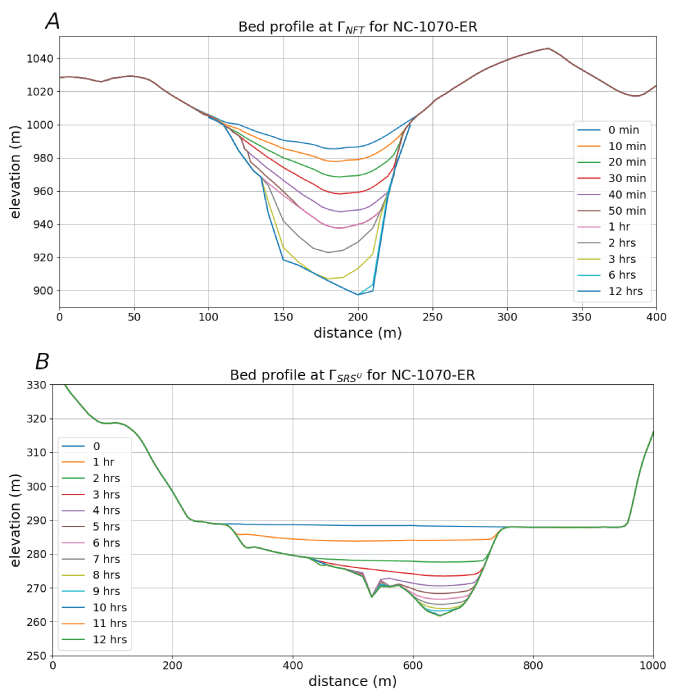
Cross-section profiles of the eroding bed elevation at selected times along the North Fork Toutle River downstream from the Spirit Lake blockage and channel cuts. A, ΓNFT, is the North Fork Toutle transect. B, ΓSRSU is the transect just upstream from the sediment retention structure. Locations of transects in figure 9.
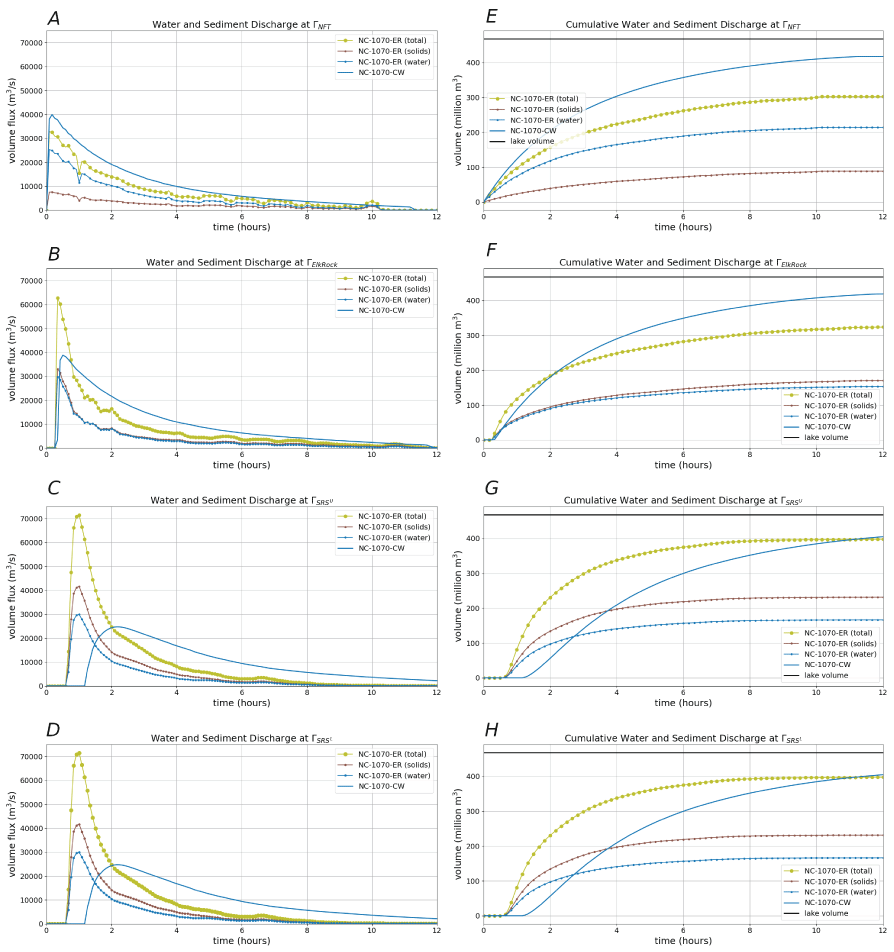
Graphs of time series for the total, solid, and fluid discharge rates (A–D) and cumulative discharge or total volume (E–H) for the erosive flow (NC–1070–ER scenario) through selected transects on the upper North Fork Toutle River between the channel cuts and the sediment retention structure (SRS). The total discharge of the clear-water flood (NC–1070–CW scenario) is shown for comparison. Both scenarios are through the north channel with a Spirit Lake level at 1,070 meters (fig. 3). Transects are ΓNFT, upper North Fork Toutle River downstream of the Spirit Lake blockage and channel cuts; ΓElkRock, upper North Fork Toutle River near Elk Rock; and ΓSRSU and ΓSRSL, upper North Fork Toutle River transects at the upper and lower positions of the SRS, respectively. Location of transects in figure 9. m3, cubic meter; m3/s, cubic meter per second.
Downstream of the reach where entrainment occurs (below the SRS), the sediment-rich flows can be characterized as variably dense debris flows (~50–60 percent solids). Solid concentration maps at selected times on the Toutle and Cowlitz Rivers are shown in figures 22 and 23, respectively. Time series of the total and constituent (solid and fluid) discharges and time series of solid-volume fractions at transect locations along the Toutle and Cowlitz Rivers are compared in figures 24 and 25, respectively. The fraction of solid material increases slightly at later times—a pattern observed upstream in the upper North Fork Toutle River. The slightly denser and more resistive material appears near the edges of the flow, apparently shouldered aside by more dilute and mobile material nearer the channel thalweg (figs. 22, 23).
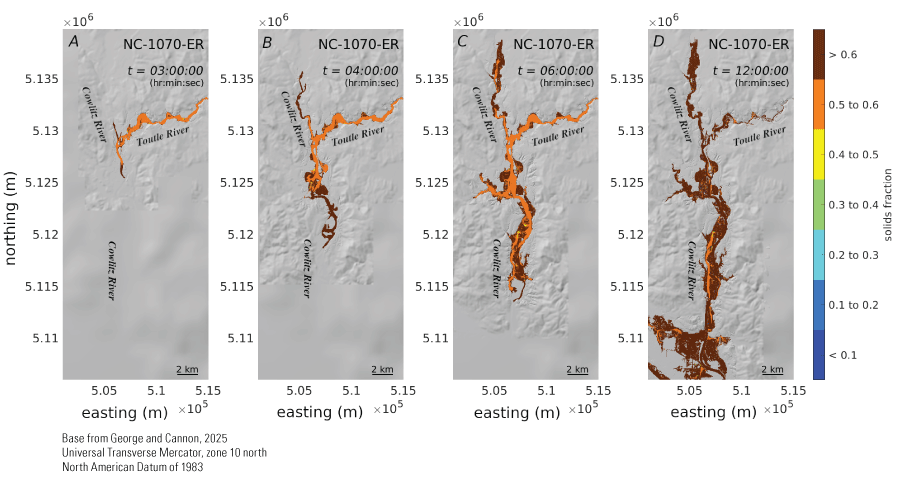
Panels showing the numerical solution at selected times (t) showing the debris flows generated by the erosive flow (NC–1070–ER scenario; see fig. 3) progressing along the Toutle River toward its confluence with the lower Cowlitz River. The slightly denser and more resistive material appears near the edges of the flow, apparently shouldered aside by more dilute and mobile material nearer the channel thalweg. Color shading indicates the evolving solid-volume fraction. The NC–1070–ER scenario is through the north channel with a Spirit Lake level at 1,070 meters (m; see fig. 3). Shaded-relief topography is the dynamic adaptive mesh resolution of the base digital elevation model (coarser areas appear blurry). km, kilometer.
Shaded-relief maps at selected times (t) showing the debris flows generated by the erosive flow (NC–1070–ER scenario) progressing along the lower Cowlitz River toward its confluence with the Columbia River. The slightly denser and more resistive material appears near the edges of the flow, apparently shouldered aside by more dilute and mobile material nearer the channel thalweg. Color shading indicates the evolving solid-volume fraction. The NC–1070–ER scenario is through the north channel with a Spirit Lake level at 1,070 meters (m) and erosive water (see fig. 3). Shaded-relief topography is the dynamic adaptive mesh resolution of the base digital elevation model (coarser areas appear blurry). km, kilometer.
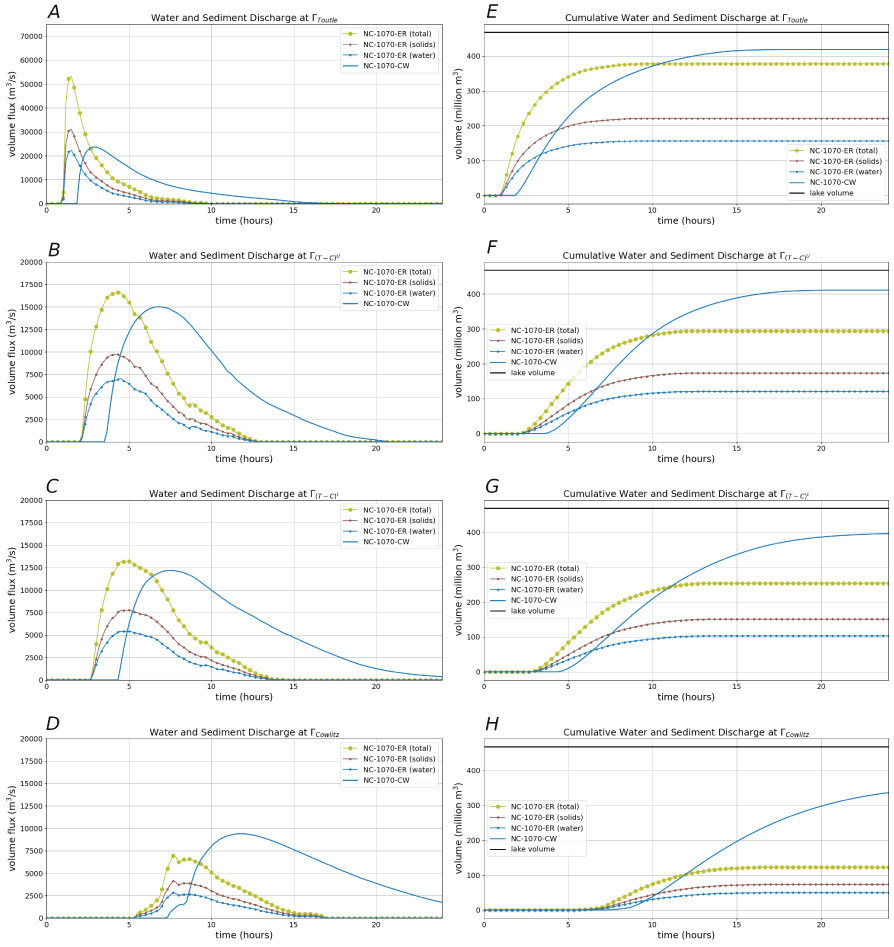
Graphs of time series for the total, solid, and water discharges for the erosive flow (NC–1070–ER scenario) through transects at selected locations (figs. 14, 15) on the Toutle and lower Cowlitz Rivers, Washington. The total discharge of the clear-water flood (NC–1070–CW scenario) is shown for comparison. Both scenarios are through the north channel with Spirit Lake level at 1,070 meters (fig. 3). Transects are ΓToutle, farthest upstream on the Toutle River; Γ(T-C)U and Γ(T-C)L, above and below, respectively, the confluence of the Toutle and the Cowlitz Rivers; and ΓCowlitz, the farthest downstream on the Cowlitz River. m3, cubic meter; m3/s, cubic meter per second.
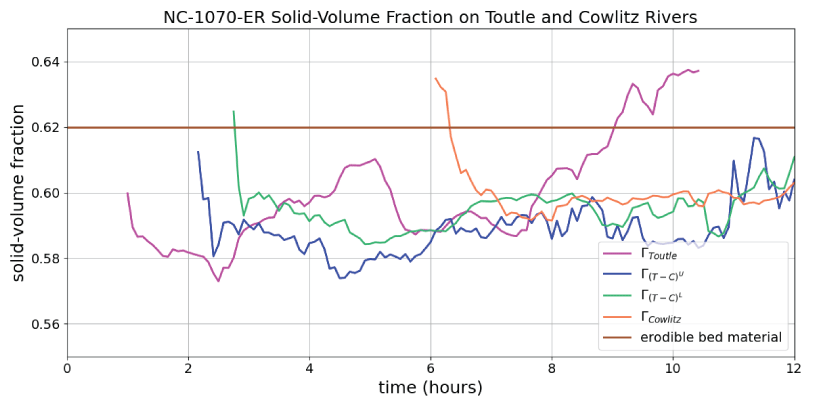
Graph of the evolving solid-volume fraction time series averaged along cross-stream transects at selected locations (figs. 14 and 15) along the Toutle and Cowlitz Rivers. NC–1070–ER, north channel with Spirit Lake level at 1,070 meters and erosive entrainment (fig. 3). Transects are ΓToutle, farthest upstream on the Toutle River; Γ(T-C)U and Γ(T-C)L, above and below, respectively, the confluence of the Toutle and the Cowlitz Rivers; and ΓCowlitz, the farthest downstream on the Cowlitz River.
Comparison of Arrival Times, Inundation Extents, and Volumes
A noteworthy distinction between the erosive and non-erosive simulations are the faster flow-front speeds and shorter arrival times of the erosive flows (observed in time-series plots and depicted as map-view arrival-time contours in figs. 26, 27). We attribute this difference to the larger volume and higher energy leading phase of the erosive flows due to bulking and attendant momentum growth. Larger flows travel faster—a simple rough estimate for flow-front speeds of a shallow gravity-driven mass flow is given by
where However, a variety of factors determine the actual front-speed. Note that the final inundation extent of the erosive flow (NC–1070–ER) is only slightly larger than the clear-water flood (NC–1070–CW) in the upper North Fork Toutle River (fig. 26), and smaller farther downstream in the lower Cowlitz River, particularly near the Columbia River (fig. 27). As described in section “Comparison of Flows Downstream of the Sediment Retention Structure (SRS),” these results are likely due to the resistive composition of the debris-flow material and the fact that the mobile volume of the erosive flows diminishes as resistive material deposits (stalls) upstream of their distal extent whereas clear-water continues to flow freely, as can be ascertained by cumulative discharge curves.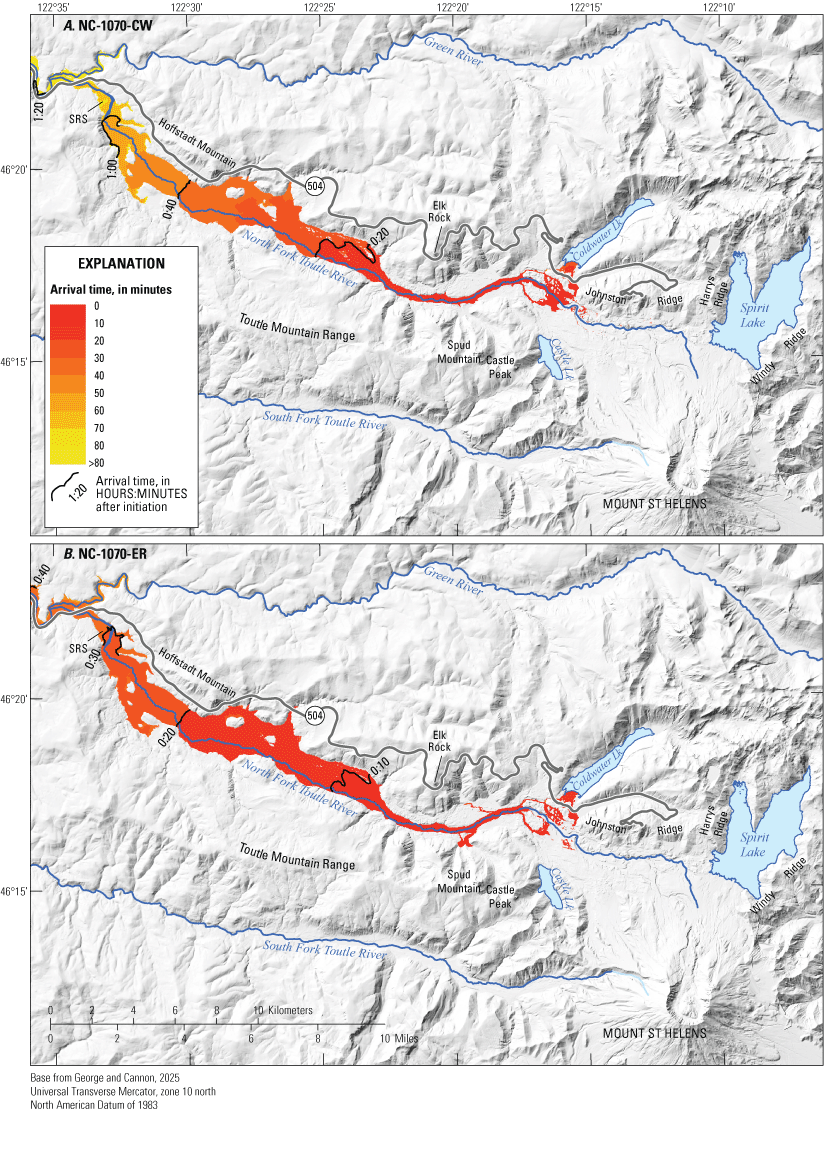
Shaded-relief maps showing the simulated arrival times and inundation bounds of the clear-water flow for the NC–1070–CW scenario (A), and erosive flow for the NC–1070–ER scenario (B), between Spirit Lake and the sediment retention structure (SRS). Selected arrival times are shown as black contours. Both scenarios are through the north channel with a Spirit Lake level at 1,070 meters.
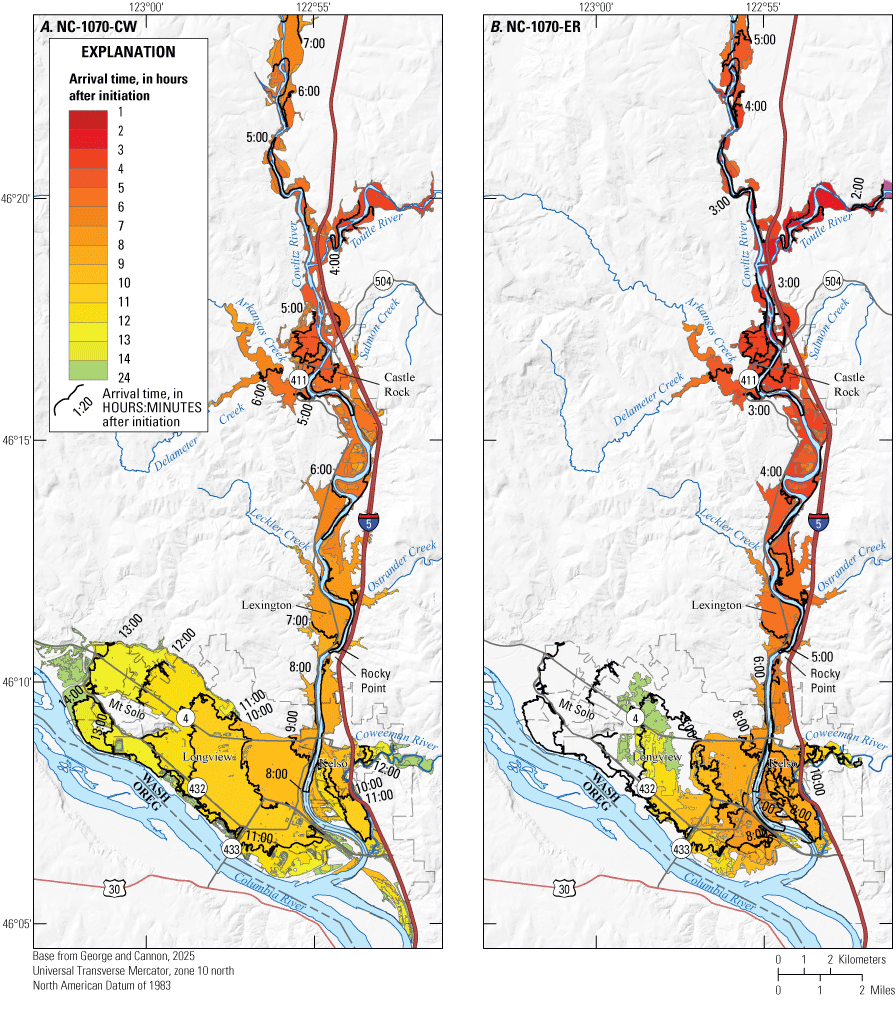
Shaded-relief maps showing the simulated arrival times and inundation bounds of dam-breach simulations for Spirit Lake for clear-water flow for the NC–1070–CW scenario (A), and erosive flow for the NC–1070–ER scenario (B) arriving on the lower Cowlitz River. Selected arrival times are shown as black contours. Both scenarios are through the north channel with a Spirit Lake level at 1,070 meters.
Several volumetric calculations for the NC–1070–ER and NC–1070–CW scenarios are shown for comparison in figure 28 and table 6. The mobile volumes for the two scenarios are determined by summing the total flow-volume elements with non-zero velocity on the entire domain. The erosive flow volume exceeds that of the clear-water flood as material is entrained, reaching a maximum of 624 Mm3 within 1 hour before subsequently declining substantially, dropping below that of the clear-water flood after about 4 hours. Note that the total volume of mobilized material (lake plus total entrained volume—material that has been mobilized over all time) exceeds the total mobile volume at any given time (fig. 28, table 6) because of flow deposition (stalled flow). After ~4 hours, the clear-water flood comprises a larger volume of flowing material—water which encounters considerably less resistance.
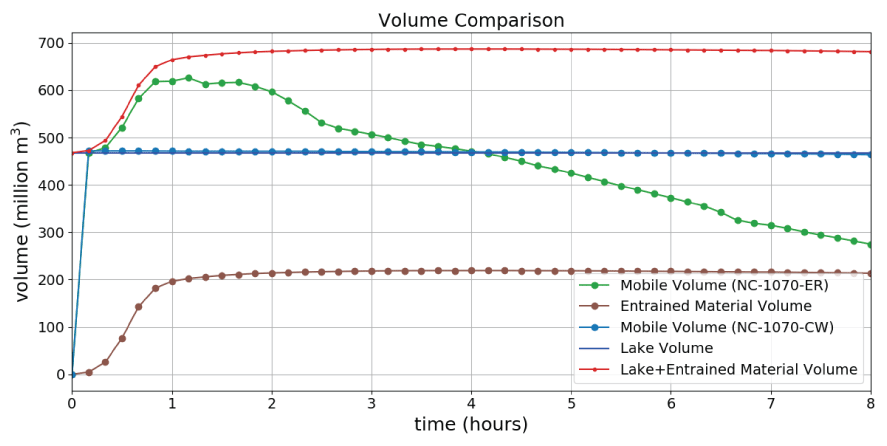
Graph of the comparison of lake, entrained, and evolving mobile volumes for the non-erosive (clear water; NC–1070–CW) and erosive (entrained sediment; NC–1070–ER) scenarios. Both scenarios are through the north channel with a Spirit Lake level at 1,070 meters. m3, cubic meter.
Table 6.
Volumes, discharges, and various metrics of the bulking factor for the erosive NC–1070–ER and non-erosive NC–1070–CW debris-dam-breach scenarios for the Spirit Lake blockage, Washington.[NC–1070–ER, north channel with Spirit Lake level at 1,070 meters (m) and erosion; NC–1070–CW, with clear water; m3/s, cubic meter per second; Mm3, million cubic meter; ΓSLO, transect used to compute the outflow discharge at the Spirit Lake outlet; ΓSRSU, upper North Fork Toutle River transect above the sediment retention structure (SRS). Location of transects in figures 6 and 9.]
Refers to the maximum volume of moving material occurring at some time throughout the simulation. For the clear-water flood (NC–1070–CW scenario), this value exceeds the outflow volume because of wave motion in the lake.
Value is the total cumulative volume of mobilized (displaced) material throughout the simulation. For the erosive flow (NC–1070–ER scenario), this value includes lake water+material that has been mobilized at any time. It therefore exceeds the maximum ambient mobile volume which can increase or decrease depending on the net contribution of mobilization and deposition.
Discussion and Summary
Mobilization and incorporation of erodible material in the North Fork Toutle River leads to increases in volume of over 50 percent (total volume ~150% of the clear-water volume, see table 6), for the Spirit Lake outburst-flood scenarios modeled in this study. This leads to substantial increases in the discharge rates of the leading phase and flow-fronts which move downvalley at faster speeds producing arrival times in the Cowlitz River nearly an hour earlier relative to clear water scenarios. The erosive flows entrain enough solid material to transition into debris flows (solids >~50 percent) in the upper North Fork Toutle River. The erosive flows continue as high-speed debris flows downstream from where active erosion of sediment is considered. The greater relative peak and early discharges of the debris flows, compared to the clear-water floods, begin to subside farther downstream toward the confluence of the Toutle and Cowlitz Rivers and below. In these lower reaches of the flow path, the debris flows more closely resemble their clear-water counterparts in terms of discharges and speeds, though their solid concentrations remain high.
The debris flows leave behind more resistive material (as stalled deposits) than the clear-water floods. Despite substantially larger discharges (volume fluxes) and speeds in the leading phases of the debris flows, the total volume throughput, or cumulative discharge, of the substantially bulked erosive flows eventually falls below that of the corresponding clear-water flows, which ultimately transport a greater volume of water to their distal extent above the mouth of the Cowlitz River. Clear-water flows consequently inundate more low-lying areas adjacent to the Columbia River. We attribute these differences to the higher frictional resistance of the debris-flow material. Our results for these scenarios imply that, while the erosive flows and debris flows may be considerably larger, more energetic, and potentially hazardous in the more upstream reaches of their flow path, they do not necessarily lead to a larger inundation extent far downstream, given the assumptions in our model scenarios.
Finally, it must be emphasized that model results are subject to error and a large degree of uncertainty related to model inputs. The mechanics and rheology of debris flows evolve in a complex fashion depending on the coevolution of the solid-volume fraction and pore-fluid pressure—which may increase substantially to the point of liquefaction with an attendant reduction in effective shear resistance (see Iverson, 1997, and Iverson and George, 2014 for details). Because of this complex rheology, frictional resistance does not increase in proportion to solid concentrations in a simple manner. Volume-amplification, potential energy extraction, and pore-fluid pressure responses from entrainment may enhance flow mobility leading to momentum growth near the flow front. This is observed in the modeling results presented in the previous sections and has been studied and verified in large-scale experimental results (Iverson and others, 2011). However, higher frictional resistance of granular-fluid mixtures compared to clear water may also hinder the flows, and they may more readily deposit as they lose energy. Modeling results therefore depend on a complex spatial and temporal balance of these competing effects and may be sensitive to input parameters. A more comprehensive assessment of the model variability and sensitivity for the scenarios presented here would require further study.
References Cited
Barnhart, K.R., Jones, R.P., George, D.L., Coe, J.A., and Staley, D.M., 2021, Preliminary assessment of the wave generating potential from landslides at Barry Arm, Prince William Sound, Alaska: U.S. Geological Survey Open-File Report, 2021–1071, 28 p., https://doi.org/10.3133/ofr20211071.
Berger, M.J., George, D.L., LeVeque, R.J., and Mandli, K.T., 2011, The GeoClaw software for depth-averaged flows with adaptive refinement: Advances in Water Resources, v. 34, no. 9, p. 1195–1206, https://doi.org/10.1016/j.advwatres.2011.02.016.
Berger, M.J., and Oliger, J., 1984, Adaptive mesh refinement for hyperbolic partial differential equations: Journal of Computational Physics, v. 53, no. 3, p. 484–512, https://doi.org/10.1016/0021-9991(84)90073-1.
Bortleson, G.C., Dion, N.P., McConnell, J.B., and Nelson, L.M., 1976, Reconnaissance data on lakes in Washington, Volume 4, Clark, Cowlitz, Grays Harbor, Lewis, Pacific, Skamania, and Thurston Counties: Washington Department of Ecology Water-Supply Bulletin 43, 195 p. [Also available at https://apps.ecology.wa.gov/publications/documents/wsb43d.pdf.]
Cannon, C.M., 2023, Digital terrain model of upper North Fork Toutle River valley, Washington, derived from historical topographic maps: U.S. Geological Survey data release, https://doi.org/10.5066/P9MT4FVL.
Cheng, N.-S., 1997, Effect of concentration on settling velocity of sediment particles: Journal of Hydraulic Engineering, v. 123, no. 8, p. 728–731, https://doi.org/10.1061/(ASCE)0733-9429(1997)123:8(728).
Conroy, C., and George, D.L., 2022, Sediment entrainment by shallow mass flows over sloped topography, in American Geophysical Union Fall Meeting, Chicago, December 12–16, 2022, Abstracts: American Geophysical Union, article 2022AGUFMNNH12B.09C, accessed June 16, 2025, at https://ui.adsabs.harvard.edu/abs/2022AGUFMNH12B..09C/abstract.
Denlinger, R.P., George, D.L., Cannon, C.M., O’Connor, J.E., and Waitt, R.B., 2021, Diverse cataclysmic floods from Pleistocene glacial Lake Missoula, in Waitt, R.B., Thackray, G.D., and Gillespie, A.R., eds., Untangling the Quaternary Period—A Legacy of Stephen C. Porter: Geological Society of America, p. 333–350, https://doi.org/10.1130/2021.2548(17).
Evarts, R.C. and Ashley, R.P., 1993, Geologic map of the Spirit Lake West quadrangle, Skamania and Cowlitz Counties, Washington: U.S. Geological Survey Geologic Quadrangle 1681, https://doi.org/10.3133/gq1681.
Gawel, J.E., Crisafulli, C.M., Miller, R., 2018, The new Spirit Lake—Changes to hydrology, nutrient cycling, and biological productivity, in Crisafulli, C., Dale, V., eds., Ecological responses at Mount St. Helens—Revisited 35 years after the 1980 eruption: New York, NY, Springer, p. 71–95, https://doi.org/10.1007/978-1-4939-7451-1_4.
George, D.L., 2008, Augmented Riemann solvers for the shallow water equations over variable topography with steady states and inundation: Journal of Computational Physics, v. 227, no. 6, p. 3089–3113, https://doi.org/10.1016/j.jcp.2007.10.027.
George, D.L., 2011, Adaptive finite volume methods with well-balanced Riemann solvers for modeling floods in rugged terrain—Application to the Malpasset dam-break flood (France, 1959): International Journal for Numerical Methods in Fluids, v. 66, no. 8, p. 1000–1018, https://doi.org/10.1002/fld.2298.
George, D.L., and Iverson, R.M., 2014, A depth-averaged debris-flow model that includes the effects of evolving dilatancy, II—Numerical predictions and experimental tests: Proceedings of the Royal Society A, v. 470, no. 2170, 31 p., https://doi.org/10.1098/rspa.2013.0820.
George, D.L., Iverson, R.M., and Cannon, C.M., 2017, New methodology for computing tsunami generation by subaerial landslides—Application to the 2015 Tyndall Glacier landslide, Alaska: Geophysical Research Letters, v. 44, no. 14, p. 7276–7284, https://doi.org/10.1002/2017GL074341.
George, D.L., Iverson, R.M., and Cannon, C.M., 2019, Seamless numerical simulation of a hazard cascade in which a landslide triggers a dam-breach flood and consequent debris flow, in 7th International Conference on Debris-Flow Hazards Mitigation, Golden, Colo., June 10–13, 2019: Association of Environmental and Engineering Geologists, special publication 28, 7 p. [Also available at https://doi.org/10.25676/11124/173208.]
George, D.L., Iverson, R.M., and Cannon, C.M., 2022, Modeling the dynamics of lahars that originate as landslides on the west side of Mount Rainier, Washington: U.S. Geological Survey Open-File Report 2021–1118, 54 p., https://doi.org/10.3133/ofr20211118.
George, D.L., and Cannon, C.M., 2025, Simulated floods, sediment entrainment, and debris-flow inundation in the Toutle and Cowlitz River valleys resulting from hypothetical dam breaches of Spirit Lake, Washington, U.S. Geological Survey data release, https://doi.org/10.5066/P139AC3R.
Glicken, H.X., 1996, Rockslide-debris avalanche of May 18, 1980, Mount St. Helens Volcano, Washington: U.S. Geological Survey Open-File Report 96–677, 90 p., 5 pl. [Also available at https://doi.org/10.3133/ofr96677.]
Glicken, H.X, Meyer, W., Sabol, M.A., 1989, Geology and ground-water hydrology of Spirit Lake blockage, Mount St. Helens, Washington, with implications for lake retention: U.S. Geological Survey Bulletin 1789, 33 p., 3 pl. [Also available at https://doi.org/10.3133/b1789.]
Grant, E.G., Major, J.J., and Lewis, S.L., 2017, The geologic, geomorphic, and hydrologic context underlying options for long-term management of the Spirit Lake Outlet near Mount St. Helens, Washington: U.S. Department of Agriculture Forest Service General Technical Report PNW-GTR-954, 164 p., https://doi.org/10.2737/PNW-GTR-954.
Iverson, R.M., 1997, The physics of debris flows: Reviews of Geophysics, v. 35, no. 3, p. 245–296, https://doi.org/10.1029/97RG00426.
Iverson, R.M., and George, D.L., 2014, A depth-averaged debris-flow model that includes the effects of evolving dilatancy, I—Physical basis: Proceedings of the Royal Society A, v. 470, no. 2170, 31 p., https://doi.org/10.1098/rspa.2013.0819.
Iverson, R.M., and George, D.L., 2016, Modelling landslide liquefaction, mobility bifurcation and the dynamics of the 2014 Oso disaster: Geotechnique, v. 66, no. 3, p. 175–187, https://doi.org/10.1680/jgeot.15.LM.004.
Iverson, R.M., Logan, M., LaHusen, R.G., and Berti, M., 2010, The perfect debris flow? Aggregated results from 28 large-scale experiments: Journal of Geophysical Research Earth Surface, v. 115, no. F3, 29 p., https://doi.org/10.1029/2009JF001514.
Iverson, R.M., and Ouyang, C., 2015, Entrainment of bed material by Earth-surface mass flows: review and reformulation of depth-integrated theory: Reviews of Geophysics, v. 53, no. 1, p. 27–58, https://doi.org/10.1002/2013RG000447.
Iverson, R.M., Reid, M.E., Logan, M., LaHusen, R.G., Godt, J.W., and Griswold, J.P., 2011, Positive feedback and momentum growth during debris-flow entrainment of wet bed sediment: Nature Geoscience, v. 4, 116–121, https://doi.org/10.1038/ngeo1040.
Janda, R.J, Meyer, D.F, and Childers, D., 1984, Sedimentation and geomorphic changes during and following the 1980–1983 eruptions of Mount St. Helens, Washington: Journal of the Japan Society of Erosion Control Engineering, v. 37, no. 3, p. 5–19, https://doi.org/10.11475/sabo1973.37.3_5.
Kafle, L., Xu, W.J, and Nagel, T., 2024, Numerical investigation of a potential landslide-induced tsunami at the Suofengying reservoir in China: Landslides, v. 21, p. 1083–1093, https://doi.org/10.1007/s10346-024-02217-9.
Könz, A.L., Hirschberg, J., McArdell, B.W., Mirus, B.B., de Haas, T., Bartelt, P., and Molnar, P., 2024, Debris-flow entrainment modelling under climate change—Considering antecedent moisture conditions along the flow path: Earth Surface Processes and Landforms, v. 49, no. 10, p. 2950–2964, https://doi.org/10.1002/esp.5868.
Lee, S., An, H., Kim, M., Lee, G. and Shin, H., 2022, Evaluation of different erosion-entrainment models in debris-flow simulation. Landslides, v. 19, no. 9, p. 2075–2090, https://doi.org/10.1007/s10346-022-01901-y.
LeVeque, R.J., George, D.L., and Berger, M.J., 2011, Tsunami modeling with adaptively refined finite volume methods: Acta Numerica, v. 20, p. 211–289, https://doi.org/10.1017/S0962492911000043.
Major, J.J., Grant, G.E., Sweeney, K., and Mosbrucker, A.R., 2020, A multidecade analysis of fluvial geomorphic evolution of the Spirit Lake blockage, Mount St. Helens, Washington: U.S. Geological Survey Scientific Investigations Report 2020–5027, 54 p., https://doi.org/10.3133/sir20205027.
Major, J.J., Pierson, T.C., Dinehart, R.L., and Costa, J.E. 2000, Sediment yield following severe disturbance—A two-decade perspective from Mount St. Helens: Geology, v. 28, no. 9., p. 819−822, https://doi.org/10.1130/0091-7613(2000)28<819:SYFSVD>2.0.CO;2.
McGuire, L., Rengers, F.K., Kean, J.W., and Staley, D.M., 2017, Debris flow initiation by runoff in a recently burned basin—Is grain-by-grain sediment bulking or en masse failure to blame?: Geophysical Research Letters, v. 44, no. 14, p. 7310–7319, https://doi.org/10.1002/2017GL074243.
Mosbrucker, A.R., 2014, High-resolution digital elevation model of Mount St. Helens crater and upper North Fork Toutle River basin, Washington, based on an airborne lidar survey of September 2009: U.S. Geological Survey Data Series 904, https://doi.org/10.3133/ds904.
Mosbrucker, A.R., 2015, High-resolution digital elevation model of lower Cowlitz and Toutle Rivers, adjacent to Mount St. Helens, Washington, based on an airborne lidar survey of October 2007: U.S. Geological Survey Data Series 936, https://doi.org/10.3133/ds936.
Roelofs, L., Colucci, P., and de Haas, T., 2022, How debris-flow composition affects bed erosion quantity and mechanisms: an experimental assessment. Earth Surface Processes and Landforms, v. 47, no. 8, p. 2151–2169, https://doi.org/10.1002/esp.5369.
Roelofs, L., Nota, E.W., Flipsen, T. C.W., Colucci, P., and de Haas, T., 2023, How bed composition affects erosion by debris flows—An experimental assessment: Geophysical Research Letters, v. 50, no. 14, 11 p., https://doi.org/10.1029/2023GL103294.
Scott, K.M., 1988, Origins, behavior, and sedimentology of prehistoric catastrophic lahars at Mount St. Helens, Washington, in Edward, C.H., ed., Sedimentologic consequences of convulsive geologic events: Geological Society of America, Special Paper 229, p. 23−36, https://doi.org/10.1130/SPE229-p23.
Scott, K.M., 1989, Magnitude and frequency of lahars and lahar-runout flows in the Toutle-Cowlitz River system: U.S. Geological Survey Professional Paper 1447–B, 33 p. [Supersedes USGS Open-File Report 86–500. Also available at https://doi.org/10.3133/pp1447B.]
Swift, C.H., III, and Kresch, D.L., 1983, Mudflow hazards along the Toutle and Cowlitz Rivers from a hypothetical failure of Spirit Lake blockage: U.S. Geological Survey-Water Resources Investigations Report 82−4125, 15 p., 10 pl., [Also available at https://doi.org/10.3133/wri824125.]
U.S. Army Corps of Engineers [USACE], 2010, Lower Columbia digital elevation model, 2010: Lower Columbia Estuary Partnership website, accessed June 26, 2025, at https://www.estuarypartnership.org/lower-columbia-digital-elevation-model-2010.
Vallance, J.W., and Scott, K.M., 1997, The Osceola Mudflow from Mount Rainier—Sedimentology and hazard implications of a huge clay-rich debris flow: Geological Society of America Bulletin, v. 109, no. 2, p. 143–163. [Also available at https://doi.org/10.1130/0016-7606(1997)109<0143:TOMFMR>2.3.CO;2.]
Washington Department of Natural Resources [WA DNR], 2025, Washington lidar portal [Clark 2002, Lower Columbia 2005, St Helens 2002, St Helens Oct and Nov 2004, Toutle River 2012]: Washington Department of Natural Resources, Division of Geology and Earth Resources database, accessed June 26, 2025, at https://lidarportal.dnr.wa.gov/.
Willingham, W.F., 2005, The Army Corps of Engineers’ short-term response to the eruption of Mount St. Helens: Oregon Historical Quarterly, v. 106, no. 2 (summer, 2005), p. 174−203. [Also available at https://www.jstor.org/stable/20615526.]
Youd, T.L., Wilson, R.C., and Schuster, R.L., 1981, Stability of blockage in North Fork Toutle River, in Lipman, P.W., and Mullineaux, D.R., eds., The 1980 eruptions of Mount St. Helens, Washington: U.S. Geological Survey Professional Paper 1250, p. 821−828, 1 pl., https://doi.org/10.3133/pp1250.
Conversion Factors
U.S. customary units to International System of Units
International System of Units to U.S. customary units
Datum
Vertical coordinate information is referenced to the North American Vertical Datum of 1988 (NAVD 88).
Horizontal coordinate information is referenced to the North American Datum of 1983 (NAD 83), Universal Transverse Mercator zone 10 north.
Altitude, as used in this report, refers to distance above the vertical datum.
Disclaimers
Any use of trade, firm, or product names is for descriptive purposes only and does not imply endorsement by the U.S. Government.
Although this information product, for the most part, is in the public domain, it also may contain copyrighted materials as noted in the text. Permission to reproduce copyrighted items must be secured from the copyright owner.
Suggested Citation
George, D.L., and Cannon, C.M., 2025, Modeling floods, sediment entrainment, and downstream debris flows from hypothetical breaches of the blockage at Spirit Lake, Washington: U.S. Geological Survey Open-File Report 2025–1046, 37 p., https://doi.org/10.3133/ofr20251046.
ISSN: 2331-1258 (online)
Study Area
| Publication type | Report |
|---|---|
| Publication Subtype | USGS Numbered Series |
| Title | Modeling floods, sediment entrainment, and downstream debris flows from hypothetical breaches of the blockage at Spirit Lake, Washington |
| Series title | Open-File Report |
| Series number | 2025-1046 |
| DOI | 10.3133/ofr20251046 |
| Publication Date | November 17, 2025 |
| Year Published | 2025 |
| Language | English |
| Publisher | U.S. Geological Survey |
| Publisher location | Reston, VA |
| Contributing office(s) | Volcano Science Center |
| Description | Report: ix, 37 p.; Data Release |
| Country | United States |
| State | Washington |
| Other Geospatial | Spirit Lake |
| Online Only (Y/N) | Y |