

Upper Mississippi River Restoration Future Hydrology Meeting Series
Links
- Document: Report (4.3 MB pdf) , HTML , XML
- Download citation as: RIS | Dublin Core
Acknowledgments
The authors acknowledge the important contributions of the workshop participants, workshop facilitator Rebecca Seal-Soileau (U.S. Army Corps of Engineers [USACE]), and small group discussion leaders whose investments of time and thought helped set the direction of much future work for the Upper Mississippi River Restoration program. We also thank members of the USACE Climate Preparedness and Resilience Community of Practice who helped prepare and execute the meeting and its materials. Karen Hagerty and Nicole Manasco (USACE) graciously assisted in meeting logistics. We are grateful to Jon Hendrickson (USACE) for his thoughtful review.
We also thank John Delaney (U.S. Geologic Survey [USGS]) for his thoughtful review and Jennifer Sauer (USGS), Jeffrey Houser (USGS), and staff of the Science Publishing Network (USGS) for editorial assistance.
Preface
This report was produced by the U.S. Army Corps of Engineers Upper Mississippi River Restoration program’s Long Term Resource Monitoring element. The Long Term Resource Monitoring element is implemented by the U.S. Geological Survey Upper Midwest Environmental Sciences Center, in cooperation with the five Upper Mississippi River System States: Illinois, Iowa, Minnesota, Missouri, and Wisconsin. The U.S. Army Corps of Engineers provides guidance and has overall Upper Mississippi River Restoration program responsibility.
Abstract
The Upper Mississippi River Restoration (UMRR) program, a broad partnership of State and Federal agencies administered by the U.S. Army Corps of Engineers, integrates ecosystem monitoring, research, and modeling to rehabilitate habitat and evaluate ecosystem trends over time in the Upper Mississippi River System. Hydrologic data are integral to the UMRR program because they are used in scientific research, decision-making, and restoration project planning. However, a lack of quantitative hydrologic data representing potential future conditions limits the ability to complete informative research on how future conditions may affect river ecology, achieve management goals, and design restoration projects for 50-year horizons.
The U.S. Geological Survey and the U.S. Army Corps of Engineers led a series of workshops with UMRR partners to (1) prioritize needs for understanding future hydrology, (2) discuss appropriate datasets that could address these needs, and (3) develop a plan for acquiring and distributing a hydrologic dataset of potential future conditions. Agency priorities for understanding future hydrology were broad, spanning ecologic, geomorphic, resource management, and engineering disciplines, and were identified for a range of spatial (project site, navigation pool, reach, system) and temporal (daily, seasonal, annual) scales. The LOcalized Constructed Analogs-Variable Infiltration Capacity-mizuRoute hydrologic data products were identified as a potential source of off-the-shelf data to meet UMRR priority needs but warranted a robust quantitative evaluation. The final meeting in the series scoped a proposal to evaluate the LOcalized Constructed Analogs-Variable Infiltration Capacity-mizuRoute hydrologic data products for use in UMRR applications, including contingencies if the data were determined to be unreliable.
Plain Language Summary
A series of workshops was held so participants from several agencies could work together to prioritize needs for understanding future hydrologic scenarios, discuss appropriate datasets that could address these needs, and develop a plan for acquiring and distributing a hydrologic dataset representing potential future conditions. Agency priorities for understanding future hydrology spanned ecologic, geomorphic, resource management, and engineering disciplines and were identified for a range of spatial (project site, navigation pool, reach, system) and temporal (daily, seasonal, annual) scales. Participants described desired characteristics of a hydrologic dataset of potential future conditions that could meet agency priority needs and developed a workflow to evaluate a readily available data product.
Introduction
The Upper Mississippi River System (not shown) is congressionally defined as the commercially navigable portions of the Mississippi River main stem north of Cairo, Illinois, and its commercially navigable tributaries, including the entire Illinois River (Water Resources Development Act of 1986, 33 U.S.C. § 652). The Upper Mississippi River System includes these rivers and their floodplains and comprises a variety of aquatic and floodplain habitats. The 1986 Water Resources Development Act created a program to monitor and rehabilitate the Upper Mississippi River System because of the system’s recognized ecological and economic importance and ongoing stressors. The Upper Mississippi River Restoration (UMRR) program fulfills this function by integrating ecosystem monitoring, research, and modeling through two program elements: Habitat Restoration and Enhancement Projects (HREP) and Long Term Resource Monitoring (LTRM). The HREP element uses a variety of construction techniques and approaches (for example, water level management, shoreline protection, backwater dredging and floodplain restoration) to address specific ecological goals determined through a comprehensive planning process. The LTRM element provides scientific leadership to the program by collecting, analyzing, and interpreting field data; leading applied ecosystem research; and managing datasets. The ecosystem understanding and over 30 years of monitoring data from the LTRM element are used in the HREP planning process to help identify management goals, inform restoration designs, and improve project effectiveness. The UMRR program is administered by the U.S. Army Corps of Engineers (USACE) and is implemented by a broad partnership of Federal and State agencies.
The hydrologic regime is a fundamental driver of ecosystem patterns and processes in the Upper Mississippi River System and is relevant for effective implementation of the UMRR program. Inter- and intra-annual variability in flow affects the nature of longitudinal and lateral connectivity, controlling variables that enable exchanges of materials and energy through the system (Bouska and others, 2018, 2019). Anthropogenic factors such as land-use changes, navigational infrastructure, protective levees, and active water level management have contributed to high-flow conditions outside of the historical spring flood pulse period (Yin and others, 1997; Sparks and others, 1998; Zhang and Schilling, 2006; Theiling and Nestler, 2010), and in certain areas, dam operations can cause higher water levels during summer and drier conditions during the spring and fall (Sparks and others, 1998). Evidence also exists that climatic changes in precipitation regimes interact with land-use changes to contribute to shifts in the hydrologic regime (Zhang and Schilling, 2006). Recent episodes of longer duration spring events and late season flood events and increases in average annual discharges (Van Appledorn, 2022) raise questions about the potential for such conditions to be the “new normal” and how such conditions may affect biota and habitats of the Upper Mississippi River System. Answers to such questions would inform implementation of the UMRR program, including project planning, habitat management and restoration activities, and scientific investigations.
Hydrologic data are foundational in anticipating how the Upper Mississippi River System ecosystem might respond to any potential future changes in the hydrologic regime and how to best manage for those potential conditions. Hydrologic data are necessary for describing historical environmental conditions, contextualizing contemporary conditions, projecting potential future conditions, completing scientific research on aquatic and floodplain organisms and processes, assessing alternative scenarios as required for UMRR restoration projects, and many other applications. Studies that explore the implications of projected hydrologic changes on ecological endpoints can use models of ecohydrologic relations that link hydrologic data to datasets such as the LTRM fish, water quality, and aquatic vegetation data, although careful attention to issues of uncertainty, model error, and scale is necessary in such studies (Rangwala and others, 2021). A substantial body of work describes ecohydrologic relations in the river, and ongoing projects further expand our understanding. For example, time series of water surface elevations and (or) discharge from USACE streamgage locations are used to drive simulations of aquatic vegetation distribution (Carhart and De Jager, 2019), inundation dynamics (Van Appledorn and others, 2021), and interactions between flooding and forest succession dynamics (De Jager and others, 2019); establish ecohydrologic relations with LTRM monitoring datasets (for example, Ickes and others [2014], Houser [2016], and Lund [2019]); and quantify indicators of resilience throughout the Upper Mississippi River System (De Jager and others, 2018; Bouska and others, 2019). Models relating hydrologic characteristics to successful habitat distribution are used by HREP teams to plan and design restoration projects. Upper Mississippi River System hydrologic data are also used to investigate fish passage through navigation dams (Montenero and others, 2018), spawning patterns of invasive carps (Larson and others, 2017), forest communities (Guyon and Battaglia, 2018), and other topics.
As of 2021, the UMRR program did not have ready access to hydrologic data representing potential future conditions for the main stem of the Upper Mississippi River System. The lack of quantitative information about plausible future hydrologic regimes has been a limitation in addressing an important recurring question within the partnership: How are geomorphic, hydrologic, and ecological patterns and processes likely to change in the future? Lacking quantitative projections of future hydrologic regimes has hindered the ability to identify and understand their implications for the structure, function, management, and restoration of the Upper Mississippi River System.
Purpose and Scope
In this report, we describe the activities and outcomes of work funded in fiscal year 2020 by the UMRR program to document its priorities for understanding potential future hydrology, identify potential datasets and (or) approaches for addressing those priorities, and develop a blueprint for acquiring a dataset of hydrologic projections for the Upper Mississippi River System. Our goal is to document the important discussions and their supporting materials related to future hydrology among the UMRR partners, including decision points for acquiring a dataset of hydrologic projections and directions for future research and applications.
Methods
We planned a series of three virtual meetings to discuss UMRR priorities for understanding future hydrologic conditions, identify potential datasets and (or) approaches for addressing priority needs, and develop a proposal for acquiring a dataset of hydrologic projections for the Upper Mississippi River System (table 1). The meeting series had two overarching goals: (1) to facilitate discussion among the UMRR partnership around specific needs, methodological approaches, and desired outcomes for understanding potential future hydrologic conditions in relation to the UMRR mission and (2) to develop a blueprint for acquiring hydrologic data projections for the Upper Mississippi River System.
Table 1.
Summary of the Upper Mississippi River Restoration program’s virtual meeting series to discuss Upper Mississippi River System future hydrology.[Dates are given in month/day/year format. UMRR, Upper Mississippi River Restoration; n, number of people; USACE, U.S. Army Corps of Engineers; CPR CoP, Climate Preparedness and Resiliency Community of Practice]
All meetings were held through WebEx because of ongoing limitations related to the COVID-19 pandemic. Meetings were facilitated by Dr. Rebecca Seal-Soileau (USACE-St. Paul District), who had experience facilitating multiagency discussions on water related resources, interdisciplinary river management, and hydrology. Agendas (app. 3, 4, and 5, figs. 3.1, 4.1, and 5.1) were distributed to attendees in advance of each meeting by the organizers (Lucie Sawyer, USACE, and Molly Van Appledorn, U.S. Geological Survey [USGS]). In addition to meeting attendance, participants were also encouraged to complete a few activities outside of meeting times (for example, premeeting reading, homework activities, and a ranking exercise), which are described in the “Meeting Discussions and Outcomes” section.
UMRR partners had a high level of interest in the meeting series. To have productive conversations and achieve equitable representation across the partnership, however, organizers had to limit meeting attendance. Participation was extended to each A-team member (or designated substitute) to ensure each State in the UMRR partnership was represented: 1 biologist and 1 engineer from each of the 3 USACE districts; a select group of climate change experts from the USGS’s Northeast Climate Adaptation Science Center (known in 2025 as the Midwest Climate Adaptation Science Center) and USACE’s Climate Preparedness and Resiliency Community of Practice (CPR CoP); USGS LTRM scientists; representatives from the U.S. Fish and Wildlife Service with experience with either the UMRR program, hydrology, or both; UMRR program management and the LTRM management team; and representatives from the Upper Mississippi River Basin Association (app. 1, table 1.1). Attendees were encouraged to engage their agency colleagues in the meeting series subject matter throughout the duration of the meeting series, and specific opportunities for broader agency input were intentionally developed for the meeting series (for example, meeting 1 homework activities, app. 3). Open communication between attendees and meeting organizers was encouraged. In addition, meeting organizers presented updates on the meeting series to various outlets to keep the broader UMRR partnership informed, including the UMRR A-team (July 20, 2021), LTRM Management Team (numerous dates before and during meeting series), UMRR Coordinating Committee meeting (August 11, 2021), the USACE–USGS Flooding Small Working Group meeting (October 5, 2021), the UMRR Science in Support of Restoration Partnership Updates webinar series (December 2, 2021), and the UMRR Science Meeting (February 8–11, 2022). Materials collectively compiled during each meeting (for example, group-generated list of UMRR “needs”) were distributed to attendees within a week of each meeting’s conclusion.
A variety of tools including read-ahead materials and online capabilities were used to encourage the fullest engagement of meeting attendees in a virtual meeting platform. Details of some of these methods are provided in the “Meeting Discussions and Outcomes” section. First, organizers distributed read-ahead materials in the form of a briefing book and homework activities ahead of meeting 1. The goal of the briefing book was to familiarize attendees with diverse experiences in hydrology and climate change with relevant background information on these topics. The goal of the homework activities was to ensure agency perspectives were communicated and represented during the meeting. Homework activities were especially important given that logistical constraints prohibited everyone who was interested in attending from participation in the meeting series. Second, organizers leveraged the WebEx platform and other online tools to make the virtual meeting format as participatory as possible and to encourage equitable representation of opinions among meeting attendees. Tools included concurrent break-out groups, round-robin discussions, interactive WebEx drawing and editing tools, live note taking, mind mapping via https://www.mindmeister.com/, and live polling via https://www.polleverywhere.com/.
Meeting 1 Activities
The purpose of meeting 1 was for the UMRR partnership to identify (1) what questions need to be answered and (2) what decision would be made with a future hydrologic dataset for the Upper Mississippi River System. Our expectation was to produce a prioritized list of program needs related to Upper Mississippi River System future hydrologic data and information by the end of meeting 1. Meeting participants were encouraged to review a briefing book and complete homework activities ahead of the meeting to facilitate productive discussions towards these goals. The meeting took place over 2 days for a total of 8 hours (app. 3). A total of 36 people representing the UMRR program attended at least part of meeting 1, including meeting organizers and the facilitator.
During meeting 1, participants discussed compiled responses from the homework activities (app. 2, table 2.13). A first step was to identify challenges faced by the UMRR program presented by an uncertain hydrologic future. This step was done by editing a composite mind map of challenges that was derived by meeting organizers from returned homework responses. Break-out teams that consisted of representatives from diverse roles within the UMRR program (for example, HREP practitioners, LTRM researchers, river-resource managers, and so on) edited the mind map to reflect relations or concepts that were missing or deemed incorrect from the original mind map. Based on the updated mind map of challenges faced by the UMRR program related to uncertain future hydrologic conditions, break-out group participants collectively compiled lists of important “needs” related to hydrology for addressing the challenges identified in the mind-mapping exercise through round-robin exercises. Members of each break-out group shared their progress with the entire meeting assembly, discussed how they arrived at their lists of needs, and participated in a question and answer session from the larger group.
After the meeting, organizers compiled the needs lists from each break-out group into a single, large needs list. The total list of 378 needs is provided in appendix 3 in a minimally edited format and in no particular order (table 3.1). Meeting organizers then combined similar needs to make the list more tractable for use in future meetings, including a subsequent ranking exercise. Organizers grouped needs into three themes that emerged during group discussions, from the mind-mapping exercise, and from the needs list itself: geomorphology, HREP and management decisions, and ecology.
Participants also collectively generated a list of potential criteria for ranking the needs list into UMRR program priorities. Each working group brainstormed potential criteria during the meeting, and criteria were compiled by meeting organizers after the meeting. A total of 34 potential criteria were generated across working groups, but not all were unique (app. 3, table 3.2). Meeting participants voted via https://www.polleverywhere.com/ on the question “What criteria should we use to rank needs for deep dive on details at meeting 2?” to identify important criteria (app. 3). The results of the poll indicate the importance of systemic applicability, relevance for multiple river system components, effect on the UMRR program’s mission, and applicability to multiple uses (app. 3, table 3.3). Criteria related to logistics (for example, time sensitive, low-hanging fruit, sequencing) were considered less important in ranking UMRR program needs. Meeting organizers discussed the poll results and selected two criteria to make the subsequent ranking exercise tractable: “maximizes the effect on the program’s capacity to meet the mission/vision/priorities” and “this need must be met before the other in sequencing the work.” The former criterion is a compilation of the top polling criteria; the latter criterion ranked in the middle of the polled criteria but represented the top choice related to logistics (app. 3, table 3.2). The top-ranking criterion related to systemwide applicability was not included because of its focus on spatial scales that would presumably be discussed further in the context of data products or methodologies (meeting 2).
After meeting 1 and before meeting 2, participants completed a paired-ranking exercise outside of the meeting. In this exercise, participants assigned a rank order to each UMRR program need by comparing that need with each other need within a given theme (for example, “Geomorphology”). This was repeated for each criterion. Meeting organizers compiled ranking results from all participants and summed them to compute a ranking score for every UMRR program need. The final product was a prioritized list of UMRR program needs related to understanding Upper Mississippi River System future hydrology for three themes, geomorphology, HREP and management decisions, and ecology (app. 4, tables 4.1, 4.2, and 4.3).
Meeting 2 Activities
The goal of meeting 2 was for the UMRR partnership and external climate change experts to discuss appropriate datasets and approaches that could be used to meet the priority needs for understanding future hydrology identified in meeting 1. Two outcomes for the meeting were desired: (1) a description of an ideal quantitative future hydrologic dataset that meets the program priority needs (for example, time steps, metrics, spatial scales) and (2) a participant list for meeting 3. The meeting took place over 2 days for a total of 8 hours (app. 4). A total of 30 people representing the UMRR partnership attended at least part of meeting 2, including meeting organizers and the facilitator.
Meeting 2 began with a set of four presentations (app. 4, fig. 4.1). The presentations familiarized participants with the results of the UMRR program needs paired-ranking exercise, relevant homework responses for meeting 2 discussions, methods for assessing future hydrology, and examples of future hydrologic datasets. Participants then broke up into three working groups by discipline—geomorphology, HREP and management decisions, and ecology—with representatives from the USACE CPR CoP serving as technical experts in each group. Each working group was tasked with describing the time steps, time span, location of data, and hydrologic metrics of hypothetical hydrologic data that would be used to meet each ranked priority need within the disciplinary theme of the group. All participants joined together at the end of the meeting to discuss commonalities across hypothetical hydrologic data to reach a consensus about what an ideal dataset of projected hydrologic conditions would look like for the Upper Mississippi River System. Finally, a large group discussion was used to identify potential participants of meeting 3 or who may be good references as technical experts in future projects. Technical experts suggested an existing dataset for the starting point for a detailed discussion during meeting 3.
Meeting 3 Activities
The goal of meeting 3 was to discuss in detail the steps of how to acquire a dataset of future hydrology projections for the Upper Mississippi River System that would meet the UMRR program’s priority needs. Because an existing dataset was identified as a potential starting point during the previous meeting, meeting 3 was used to discuss details about how to evaluate the dataset for UMRR program applications, how to disseminate any data determined to be of suitable use, and alternative actions for acquiring a dataset if the evaluation indicated the existing dataset was unsuitable. Two outcomes for the meeting were desired: (1) define action steps and necessary resources for completing each component of a suggested workflow for data acquisition, and (2) have a workplan in place for completing a draft proposal for the UMRR program’s fiscal year 2022 Science in Support of Restoration funding opportunity by the March 2022 deadline. The meeting took place over 4 days for a total of 16 hours (app. 5, fig. 5.1). There were 16 participants, including the meeting organizers and facilitator, who were able to attend at least part of meeting 3. Participants included 7 LTRM scientists, a USGS scientist, 3 USACE personnel with past involvement in the UMRR program and 1 serving as meeting facilitator, a representative from the U.S. Fish and Wildlife Service, and 3 technical experts from the USACE CPR CoP (app. 1, table 1.1).
Meeting organizers worked with USACE CPR CoP technical experts before meeting 3 to develop an initial workflow for acquiring hydrologic projection data for the Upper Mississippi River System. The agenda of meeting 3 (app. 5, fig. 5.1) was organized around the workflow. Each workflow component was discussed in detail over the duration of the meeting. Participants collectively filled out a template to document which people, timeframes, resources, and other details would be necessary for completing each workflow component or “action step.” This activity was meant to collect information that would be used in determining which components of the workflow were feasible to include in a proposal and which may be more suited as future work. The information was also intended to aid principal investigators (PIs) in writing a proposal for submission to the UMRR program’s fiscal year 2022 Science in Support of Restoration funding opportunity. Finally, participants helped identify a workplan for completing the proposal writing, including who would serve as PI and who would serve as early draft reviewers.
Meeting Discussions and Outcomes
This section presents key outcomes and decision points from the meeting series. The first subsection describes the major challenges faced by the UMRR program that were identified from the homework activities and during a group mind-mapping exercise during meeting 1. The second subsection summarizes key meeting discussions on the topics of programmatic and agency priorities for understanding potential future hydrologic conditions and characteristics of an ideal hydrological dataset that could meet the UMRR program’s priority needs. The third subsection describes a workflow for evaluating and disseminating an ideal hydrological dataset that was developed during meeting 3 in consult with technical experts.
What Challenges Are Presented by an Uncertain Hydrologic Future?
Major challenges facing the UMRR program were identified during the mind-mapping exercise (fig. 1), and homework exercises (app. 2) were along the themes of hydrology, geomorphology, ecology and biota, HREPs and management decisions, and general methods and data distribution. Uncertainty around future hydrologic conditions was believed to contribute to difficulties anticipating how geomorphological processes, ecological processes, and the biota would respond. Lack of understanding about potential future responses to hydrologic change could hamper effective river management decisions, including HREP planning and design, and present methodological challenges to those completing field work or modeling exercises aimed at improving decision making.
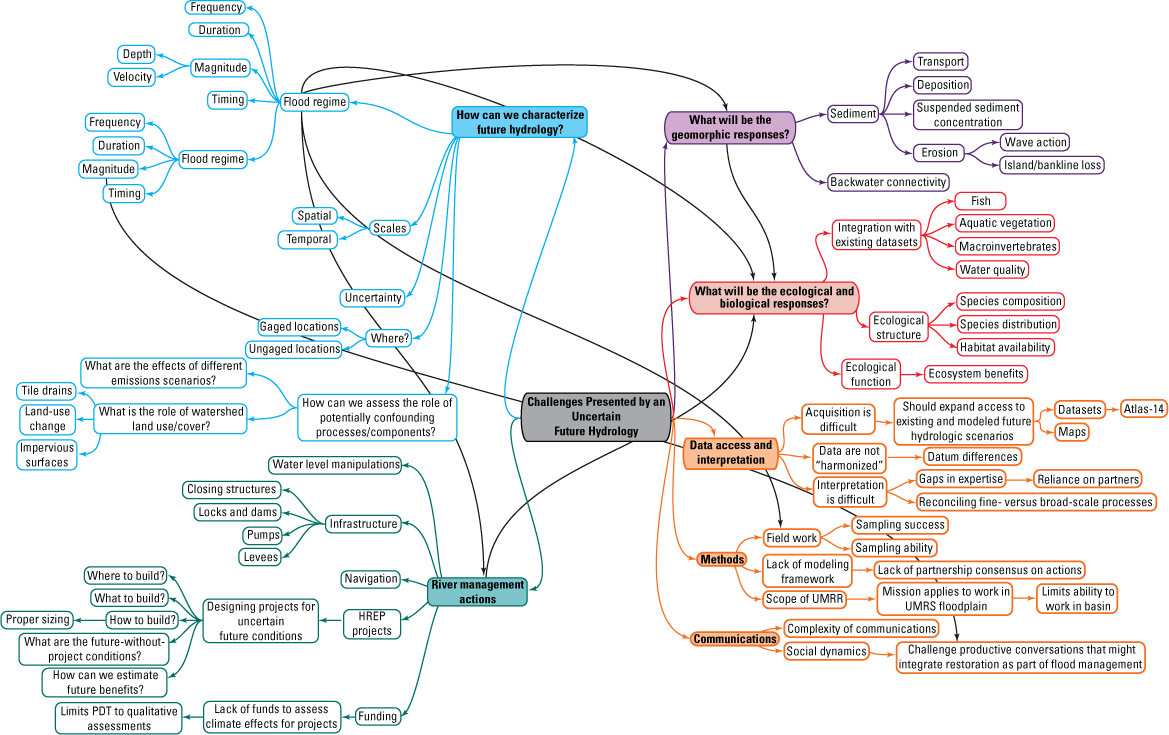
Mind map of challenges facing the Upper Mississippi River Restoration program that are presented by an uncertain hydrologic future. Challenges were related to the themes of hydrology (blue), geomorphology (purple), ecology and biota (red), Habitat Restoration and Enhancement Project and management decisions (teal), and general methods and data distribution (orange). The black lines indicate indirect connections between mind-map ideas. [HREP, Habitat Restoration and Enhancement Project; PDT, project delivery team; UMRR, Upper Mississippi River Restoration; UMRS, Upper Mississippi River System]
Challenges related to hydrology included issues of spatial and temporal scales, uncertainty and how it may be addressed in any modeling process, and where future hydrologic patterns should be summarized (fig. 2). Decisions about how to characterize future hydrology to capture aspects of the flow and flood regimes (for example, flow frequency or flood magnitude) also appeared as challenges. However, these decisions may be consequential given the importance of flow regime characterizations (which includes flood regime characterizations) to other challenges facing the UMRR program (fig. 2).
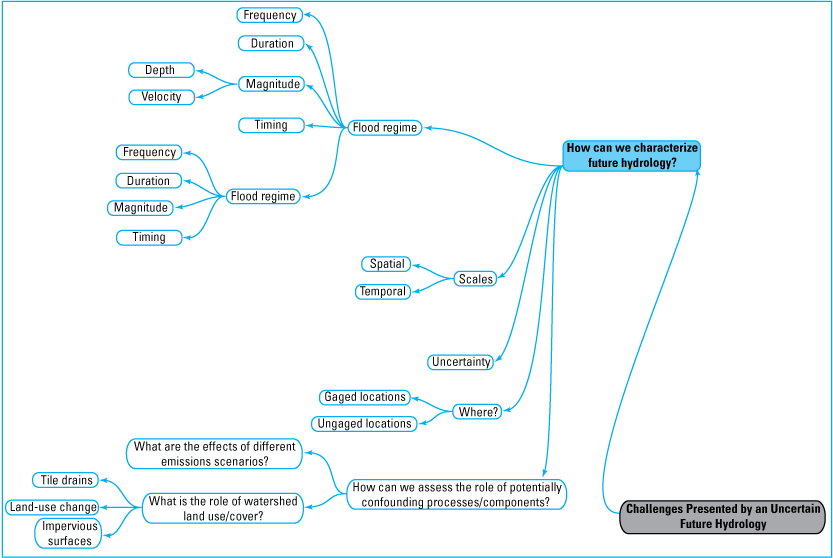
Subsection of mind map of challenges facing the Upper Mississippi River Restoration program that are presented by an uncertain hydrologic future related to the theme of hydrology. The blue box indicates mind-map items related to the theme of hydrology; blue lines indicate direct connections between mind-map ideas.
Challenges related to geomorphology included understanding how the river may respond to future flow conditions in terms of sediment dynamics and patterns of connectivity (fig. 3). Topics identified as being of particular interest include sediment transport, deposition, erosion (including wave action and island/bankline loss), and suspended sediment concentration. The importance of the geomorphic template to river ecology was indicated by connections to items in the ecology theme (fig. 3).
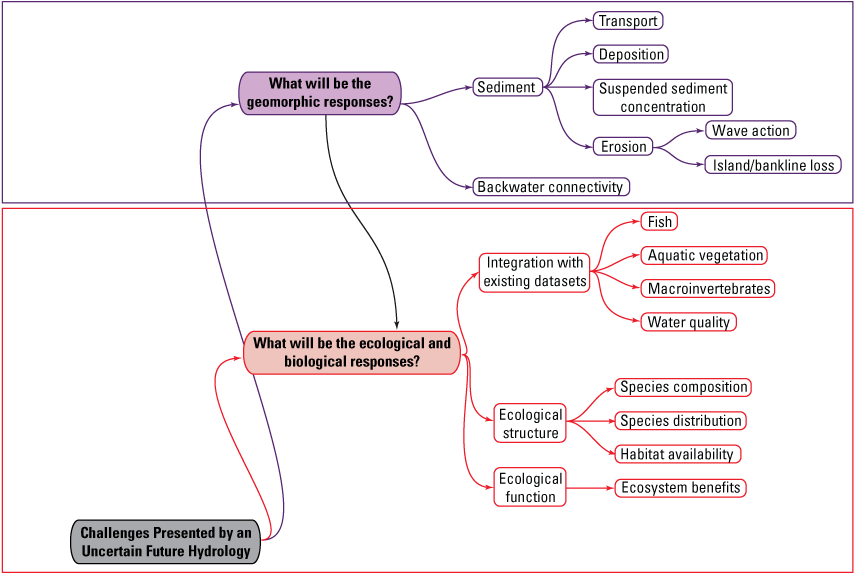
Subsection of mind map of challenges facing the Upper Mississippi River Restoration program that are presented by an uncertain hydrologic future related to the themes of geomorphology (purple box) and ecology (red box). Purple and red lines indicate direct connections between mind-map ideas related to the themes of geomorphology and ecology, respectively; the black line indicates an indirect connection between mind-map ideas.
Anticipating ecological and biotic responses to future hydrologic conditions was identified as a major challenge during meeting 1 (fig. 3). Participants noted that ecological structure and function, including species composition and distributions, habitat availability, and ecosystem benefits, were particular examples of how future changes may manifest. Participants also identified the challenge of integrating existing datasets, especially LTRM monitoring datasets, with any projected hydrologic data the Program may invest in acquiring.
Challenges related to HREP and management decisions were numerous (fig. 4). An uncertain hydrologic future was expected to complicate decisions on water level management; the operation, effectiveness, and maintenance of infrastructure (for example, closing structures, locks and dams, pumps, levees); and navigation throughout the Upper Mississippi River System. Participants were also concerned that there may be a lack of funds to assess climate effects for projects, limiting HREP project development teams to qualitative climate change assessments instead of quantitative assessments. Uncertainty surrounding the Upper Mississippi River System’s future hydrology also presented challenges to HREP planning, design, and assessment (for example, Will UMRR program projects that are designed [to] “hold up” be effective and useful with future hydrologic conditions?; app. 2). The challenges of how to decide where, what, and how to build to last in an uncertain hydrologic future were discussed at length. Participants also noted the difficulty of estimating project habitat benefits (and future-without-project conditions) and how they may change over a 50-year project design life given the lack of understanding about future hydrologic conditions.

Subsection of mind map of challenges facing the Upper Mississippi River Restoration program that are presented by an uncertain hydrologic future related to the theme of Habitat Restoration and Enhancement Projects and management decisions (teal box). Teal lines indicate direct connections between mind-map ideas.
Several challenges related to general methods and data distribution were identified in the mind-mapping exercise (fig. 5) and homework responses (app. 2). The challenges reflected the diversity of agencies within the UMRR program’s partnership and their past experiences obtaining, handling, applying, and interpreting hydrologic data and communicating their meaning in various outlets (for example, scientific articles, public forums). First, related to general methodologies used by the UMRR program’s partner agencies, an uncertain hydrologic future would likely affect field work, including the ability to sample and sampling success, and other hydrologically related work on the river and floodplain. For example, a future where water levels remained higher for longer periods, or where high-water events shifted in seasonality, could limit or change the periods for effective field sampling. Accessing and interpreting data and interpreting them was also identified as a challenge because of issues with existing databases, sampling methods, and data quality. It was also noted that gaps in expertise could exist in certain agencies and could hinder effective interpretation and data use, potentially causing some agencies to rely more heavily on partners rather than their own personnel. Finally, challenges were associated with effectively communicating about future hydrologic data. For example, social dynamics and past histories of interactions between agencies and the public may make productive conversations with the public about any projected high-water levels difficult.
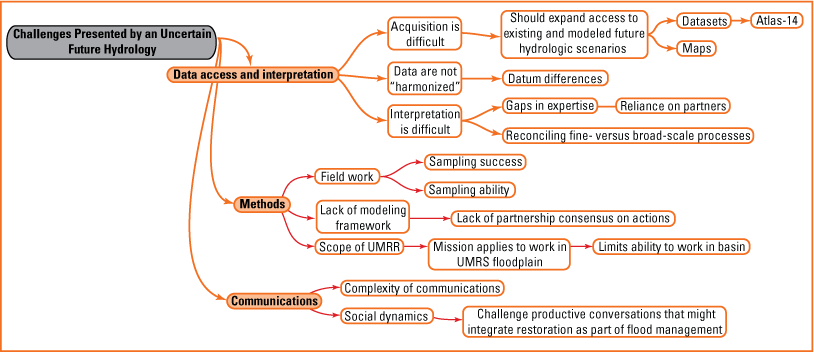
Subsection of mind map of challenges facing the Upper Mississippi River Restoration program that are presented by an uncertain hydrologic future related to the theme of general methods and data distribution (orange box). Orange lines indicate direct connections between mind-map ideas. [UMRR, Upper Mississippi River Restoration; UMRS, Upper Mississippi River System]
Upper Mississippi River Restoration Program Priorities for Understanding Potential Future Hydrology
Agency priorities for understanding future hydrology were broad, spanning geomorphic, resource management, engineering, and ecological disciplines (table 2). The theme with the most priorities identified was ecology (11 priorities), followed by geomorphology (9 priorities) and HREP and management decisions (6 priorities). Top priorities for ecology were related to understanding how ecological patterns and processes may respond to future hydrologic conditions across a variety of habitats in the Upper Mississippi River System. Determining appropriate metrics to link hydrology and ecological endpoints, modeling frameworks, and scales of analysis were also important. Top priorities for geomorphology included understanding how general geomorphic responses, flood water conveyance, and backwater sedimentation may change under future conditions. Understanding sedimentation or sediment dynamics was the focus of most geomorphology priorities (5 of 9 priorities). For the HREP and management decisions theme, understanding how future hydrologic conditions may affect restoration design and planning guidance, including the consideration of new features, was important. Some priorities did not exclusively fall within a single theme. For example, the fourth ranking priority under HREP and management decision needs references understanding how the distribution of habitat suitability for plants may change under future hydrologic conditions, an ecological response. Such priorities reflect the integrative nature of the UMRR program and the complexity of the Upper Mississippi River System.
Table 2.
Priority of Upper Mississippi River Restoration program needs related to the themes of geomorphology, Habitat Restoration and Enhancement Project and management decisions, and ecology.[Values in parentheses represent scores computed from a paired-ranking exercise. Larger scores indicate higher ranking, and ranking scores are only comparable within each theme, not across themes. Note that fewer needs were identified for the geomorphology and Habitat Restoration and Enhancement Project (HREP) and management decision themes than for the ecology theme; --, no additional needs were discussed within the theme]
Priorities were identified for a range of spatial (project site, navigation pool, reach, system) and temporal (daily, seasonal, annual) scales during discussions, some of which were mentioned explicitly in the final priority listing (table 2). For example, understanding how future hydrology may affect HREP designs may be most applicable to individual project planning efforts (site scale), but understanding how future hydrology may affect where restoration is needed may be viewed at broader spatial scales, including across the entire system. Most priorities, however, did not specify a particular spatial or temporal scale of interest. Instead, priorities were more general in nature, reflecting the difficulty of synthesizing challenges faced by multiple partnering agencies of the UMRR program.
Ideal Dataset to Meet Upper Mississippi River Restoration Priority Needs
The ideal dataset for meeting the UMRR program’s priority needs consists of discharge data at a daily time step for a minimum 50-year time horizon across the entire Upper Mississippi River System (table 3). Such a dataset would allow the greatest amount of flexibility for summarizing custom hydrologic metrics over various spatial and temporal scales, an important quality given the diversity of potential applications of the data (app. 2). A high priority was placed on systemic coverage of the Upper Mississippi River System so that the data could be available to all UMRR program partners and across LTRM study reaches. However, it was noted during discussions that there may be added challenges of acquiring and (or) evaluating existing datasets for the Mississippi River below the confluence with the Missouri River.
Table 3.
Characteristics of an ideal future hydrology projection dataset for the Upper Mississippi River Restoration program’s partnership.[UMRR, Upper Mississippi River Restoration]
An off-the-shelf data product was discussed as a potential resource for the partnership as an alternative to new modeling efforts that would require substantially greater amounts of funding and development time. The LOcalized Constructed Analogs- (LOCA-) Variable Infiltration Capacity- (VIC-) mizuRoute hydrologic data products represent the most recent data produced by collaborators from Federal agencies, including the Bureau of Reclamation, USACE, USGS, and other academic and research institutions. The name “LOCA-VIC-mizuRoute” comes from the chain of models that produce the data: LOcalized Constructed Analogs (downscaled Coupled Model Intercomparison Project Phase 5 global climate data; Pierce and others, 2014; Vano and others, 2020), Variable Infiltration Capacity macroscale hydrological model (Liang and others, 1994), and the mizuRoute hydrologic routing model (Mizukami and others, 2016). The data products themselves represent a total of 64 time series projections of meteorology, hydrological fluxes, and routed river discharge from 1950 to 2099 for the conterminous United States. These datasets are derived from the simulations of global weather patterns from 32 global climate models for two emissions scenarios. These two emissions scenarios, or representative concentration pathways (RCPs), are a moderate emissions pathway where radiative forcing from greenhouse gas emissions levels off before the year 2100 at a level of 4.5 watts per square meter (RCP 4.5) and a high-emissions pathway where radiative forcing continues to rise, reaching 8.5 watts per square meter by 2100 (RCP 8.5). The hydrologic projections are available for every river segment in the conterminous Unites States in the USGS geospatial fabric (Viger and Bock, 2014). The data driving the LOCA-VIC-mizuRoute hydrologic data products are available at https://gdo-dcp.ucllnl.org/downscaled_cmip_projections/, and the routed streamflow products are housed locally on USACE servers.
Workflow for Acquiring a Dataset of Future Hydrology Projections for the Upper Mississippi River System
A workflow was drafted before meeting 3 (app. 5, fig. 5.2) and was refined during meeting 3 (fig. 6) as a blueprint for acquiring future hydrologic projections of the Upper Mississippi River System for use by the UMRR Program. The workflow focused on an evaluation of the existing LOCA-VIC-mizuRoute hydrologic data products for use in the Upper Mississippi River System. Evaluation was determined to be a logical first step because the LOCA-VIC-mizuRoute hydrologic data products share many of the characteristics of the ideal dataset (table 3). The data products are also readily available and would be less expensive to evaluate than an effort to generate custom hydrologic projections for the Upper Mississippi River System through an independent hydrologic modeling effort. Evaluation of the LOCA-VIC-mizuRoute hydrologic data products is necessary because the conterminous United States scale climate and hydrologic models are not calibrated for any specific drainage basin, including the Upper Mississippi River System. The lack of regionally calibrated models used to produce the LOCA-VIC-mizuRoute hydrologic data products could be problematic because important processes that drive the Upper Mississippi River System’s regional climate or basin flow regime may not be well represented, leading to unreliable projections.

Workflow process for evaluating the LOcalized Constructed Analogs- (LOCA-) Variable Infiltration Capacity- (VIC-) mizuRoute data products. [USACE, U.S. Army Corps of Engineers; ECB, engineering and construction bulletins; CHAT, Climate Hydrology Assessment Tool; USACE ECB requirements refers to “Guidelines for Incorporating Climate Change Impacts to Inland Hydrology in Civil Works Studies, Designs, and Projects” (U.S. Army Corps of Engineers, 2018)]
The workflow begins with an assessment of data reliability (fig. 6, black boxes) that would inform the pathway (fig. 6, green, blue, and red boxes) for subsequent steps. For example
-
1. If the LOCA-VIC-mizuRoute hydrologic data products were determined to be reliable for use in the Upper Mississippi River System with no further data processing necessary, the green pathway would be pursued.
-
2. If the LOCA-VIC-mizuRoute hydrologic data products were somewhat reliable and could be improved for use in the Upper Mississippi River System through postprocesses such as correcting for systematic biases or scaling applications, the blue pathway would be pursued.
-
3. If reliability issues of the LOCA-VIC-mizuRoute hydrologic data products could not be addressed through systematic bias correction or scaling, the red pathway would be pursued.
Black Boxes
The black boxes represent the starting point of the LOCA-VIC-mizuRoute hydrologic data product evaluation process. The goals of the activities are to articulate the project’s purpose (black box 1), identify metrics for evaluating model performance (black box 2), and quantify model performance (black box 3). The activities carried out in these boxes would determine which pathway would be subsequently followed given the results of model performance.
Progress through the black boxes was made via the UMRR program’s future hydrology meeting series. During the meeting series, the partnership helped identify the questions and applications for which any projected future hydrologic dataset could be used. When the workflow is implemented, a small team of USACE district representatives would build on the partnership discussions to refine how a projected future hydrologic dataset could integrate with HREP planning and design. The outcome of these discussions would help guide the selection of data reliability metrics (fig. 6, black box 2) and inform documentation related to the data dissemination steps (fig. 6, green and blue boxes).
The bulk of the remaining research activities largely relate to defining data reliability metrics and completing the actual evaluation (fig. 6, black boxes 2 and 3). The reliability of the LOCA-VIC-mizuRoute hydrologic data products would be assessed using metrics identified through literature review completed by technical experts with input from the PIs. Metrics would be used to help identify any systematic biases in the LOCA-VIC-mizuRoute hydrologic data products. Examples of systematic biases may include a poor representation of hydrologic responses to precipitation events, insufficient accounting of groundwater contributions, or snowmelt timing and dynamics. Insufficiencies like these may manifest as biases in the LOCA-VIC-mizuRoute modeled historical discharge data that can be detected when compared to observed historical discharge data using selected metrics. Based on discussions during the UMRR program’s future hydrology meeting series, evaluation metrics would assess annual, seasonal, and monthly flow duration, variability, magnitude, and timing to understand how well low and high flows are simulated across a range of time steps. Metrics for observed and modeled historical discharge would be directly compared using nonparametric statistics (for example, Kolmogorov-Smirnov or Cramér-von Mises tests).
Once the metrics have been chosen, historical (1950–2005) modeled discharge data from the LOCA-VIC-mizuRoute hydrologic data products would be compared against observed unimpaired discharges using the chosen metrics (fig. 6, black box 3). The comparisons would be done at USGS streamgage locations selected by the technical experts to represent a range of physiographic conditions determined in the basin that are not affected by upstream regulation or land-use changes over the historical period. Modeled daily discharge data from the LOCA-VIC-mizuRoute products would be extracted using custom scripts. Streamgages that are not affected by regulation are being mapped and historical observed unimpaired discharge datasets are being compiled as part of the Upper Mississippi River and Missouri River flow frequency studies that are underway. The modeled and observed historical data would be summarized separately using the set of metrics established by the technical experts fig. 6, black box 2), allowing for quantitative comparisons (for example, nonparametric statistics) and qualitative comparisons (graphical comparisons of metrics) between the modeled and observed discharge datasets. The quantitative comparisons across multiple streamgage locations will offer insight as to whether the climate and (or) hydrologic models underlying the LOCA-VIC-mizuRoute hydrologic data products can sufficiently represent drainage basin processes that may vary spatially. The quantity and severity of deviations between modeled and observed metrics can indicate overall data reliability (fig. 6, green pathway), whether the modeled hydrologic data have a problematic degree of systematic biases and whether they can be corrected easily (fig. 6, blue pathway), or whether insurmountable issues relating to process fidelity with the data products may exist and would necessitate looking for alternative solutions (fig. 6, red pathway).
The outcome of the black boxes would be a quantitative analysis with data summaries in numeric and visual form that would be interpreted by a group of technical experts and the project PIs. The group would meet to discuss the results and agree on a level of data reliability, which determines the activities for the rest of the project. The possible outcomes are all data are reliable and no further modifications are necessary (green pathway), there are indicators of reliability, but the data require bias correction or scaling postprocessing (blue pathway), or the existing data seem unreliable for quantitative analysis and issues cannot be addressed through bias correction or scaling postprocessing (fig. 6, red pathway). The evaluation results and consensus formed during these discussions about the best path forward would be communicated to the LTRM management team.
Green Pathway
Under the green pathway, the LOCA-VIC-mizuRoute hydrologic data products would be determined to be reliable for applications in the Upper Mississippi River System without any additional postprocessing, and the project team would proceed with disseminating the LOCA-VIC-mizuRoute hydrologic data products. The spatial resolution at which resulting streamflow projections would be made available cannot be determined in advance of the evaluation (fig. 6, black box 3). However, providing projections of streamflow will be prioritized for locations along the main stem Upper Mississippi and Illinois Rivers and major tributaries, where streamflow observations are available for the same historical modeling period as the LOCA-VIC-mizuRoute hydrologic data products (that is, 1950 or earlier). At each location, we would intend to serve the modeled daily discharge values from 1950 to 2099 for both emissions scenarios and 32 global climate models, resulting in a total of 64 time series per location.
Data products would be made publicly available through a website with features to help users navigate, explore, and interpret the large amount of data. Website construction would be led by the USACE Engineer Research and Development Center, that has completed a similar project for the Columbia River Basin. Features would likely include data queries by map and location list, graphical summaries of aggregated projection results across the entire period of record (1950–2099) at each location, and graphical summaries of projections by season for each location. Data would be made available to download via the website by individual locations or groups of locations. All 64 time series datasets would be served at each location to allow for maximum flexibility for end users, but website visualization tools would summarize aggregate patterns across all datasets for interpretability and clarity to allow users to explore the model outputs before downloading the packaged datasets for their desired location(s). The project team would develop documentation to help describe the data and their appropriate uses. Documentation will accompany the data products on the website and would likely summarize the models underlying the LOCA-VIC-mizuRoute data products, the emissions scenarios, and issues with uncertainty. Strengths and limitations of the data would be discussed at length to assist stakeholders in understanding how best to interpret and use the data.
Finally, the principal investigators would host a webinar for the UMRR partnership to showcase the results of the project. The goal of the webinar would be to educate attendees on how to access, interpret, and use the data given the diversity of experiences working with hydrologic data across the UMRR partnership. Topics discussed would likely include the results of the evaluation, an introduction to the data themselves and how to access them on the website, an overview of the documentation and review of best practices for use (including appropriate time scales of analyses), a discussion of uncertainty in modeled hydrologic data, and a question and answer session to address specific concerns from the partnership.
Blue Pathway
The blue pathway would be followed in the event the LOCA-VIC-mizuRoute hydrologic data products were determined to adequately represent the hydrological processes in the Upper Mississippi River System but still display some systematic underlying biases that would limit the intended interpretations and applications. In this pathway, the effects of these systematic biases could be reduced by applying a bias-correction technique or scaling the intended applications of the processed data product.
Bias correction (fig. 6, blue box 1) is a statistical adjustment of the data to correct for the systematic biases that arise during a model simulation. Examples of correctable systematic biases include consistent underestimations of annual peak flows, underestimates of low flows, or misrepresentation of flow conditions during a certain season. There are several bias-correction methods. Different methods are used to correct for different types of biases. There are several steps to apply a bias-correction technique. First the systematic biases that require correction would be identified by the technical experts reviewing the results of the data product evaluation. Then, the technical experts would identify the most appropriate bias-correction method to use given the biases present. Third, the bias-correction method would be applied to the data products, including cross-checks that the bias has been corrected to an acceptable degree.
When results from the evaluation look good overall but indicate that the data may not be suited for all intended data applications, then some constraints for application must be defined. This outcome is referred to as “scale processed data product” (fig. 6, blue box 2). In this situation, quantitative analysis using the LOCA-VIC-mizuRoute hydrologic data products would be limited to a certain time interval (duration) or to certain locations. The outcome of this scenario is either a list of appropriate uses for the data products or a filter of the data to certain locations for which the data are most appropriate. If the former is necessary, results from the evaluation would be shared with a larger group of UMRR program partners to gain consensus on which applications are most appropriate for the data.
After completion of either blue box 1 or blue box 2 (fig. 6), the resulting datasets would be packaged up for dissemination. Data dissemination would largely follow the dissemination steps described in the green pathway. If the scale processed data product methods are used (fig. 6, blue box 2), then any limitations would be communicated through the data documentation.
Red Pathway
The red pathway would be followed if the comparisons of the LOCA-VIC-mizuRoute hydrologic data products to observed hydrological datasets (fig. 6, black box 3) indicated that no postprocessing could rectify the data. If the evaluation results also indicated that the data had significant deficiencies in representing key hydroclimatic processes in the basin, the red box 1 (fig. 6) pathway would be followed. Under this scenario, we would complete a quantitative evaluation of the likelihood that a recalibration of the VIC model could overcome these biases. The results of the evaluation would then be shared in a virtual workshop format among project PIs, CPR CoP members, and UMRR program participants who attended meeting 3. The purpose of the workshop would be to discuss the test calibration results and implications for meeting UMRR program priorities and to scope an appropriate modeling effort for generating projected Upper Mississippi River System hydrology if the results indicated likely success of this pursuit. Depending on the outcome of the test calibration, modeling efforts could include full basin calibration of the VIC model and development of a new hydrological projection dataset or consideration of a different hydrologic model for the Upper Mississippi River System, preferably existing, to generate a new projection dataset. Any efforts to generate projected Upper Mississippi River System hydrology would be guided by the outcomes of the Upper Mississippi River System future hydrology meeting series, including descriptions of UMRR program priorities for a future hydrologic dataset, ideal dataset description, and emphasis on acquiring systemic data.
It is possible that data issues could not be improved through systematic bias correction, scaling of applications, or hydrologic modeling and calibration. Under this scenario, the project team would first consider the availability, strengths, and limitations of existing regionally developed datasets that may meet some of the UMRR program’s priority needs for understanding future Upper Mississippi River System hydrology (fig. 6, red box 2). During meeting 3, it was noted that there may be efforts within the region to develop regional downscaled climate and hydrologic products. Although conterminous United States derived products like the LOCA-VIC-mizuRoute hydrologic datasets would have comprehensive coverage for the Upper Mississippi River System, the entire Upper Mississippi River System may not necessarily be in the domain of a regional downscaled climate and hydrologic product. In addition, regional hydrologic products may not necessarily have all the characteristics the UMRR program partners identified as ideal for meeting their priority needs (table 3). Any potential regional products would need to be identified and evaluated for their suitability in the Upper Mississippi River System within the context of the UMRR partnership’s priority needs and desirable dataset characteristics. Evaluation of any regionally developed streamflow product would follow the same process used for evaluation of the LOCA-VIC-mizuRoute hydrologic data products (fig. 6, black box 3) and finish with an update to the LTRM project management team to determine appropriate next steps.
If alternative downscaled products tailored for the region are not available, then the project purpose would be reframed and the use of the existing LOCA-VIC-mizuRoute hydrology would be limited to qualitative comparisons such as those provided in the Climate Hydrology Assessment Tool (CHAT; fig. 6, red box 3). CHAT summarizes metrics at the hydrologic unit code (HUC) 08 scale and as of meeting 3 of the series reports the annual-maximum value of the average monthly in-channel routed runoff, and various summaries of precipitation and temperature projections. The project team would host a virtual workshop for the UMRR partnership (attendance list similar to the UMRR program’s future hydrology meeting series) to introduce partners to the CHAT, describe its strengths and weaknesses, and identify how it could be appropriately used in research and management.
Gold Box
The gold title box in figure 6 represents fulfillment of Engineering and Construction Bulletin 2018–14, “Guidelines for Incorporating Climate Change Impacts to Inland Hydrology in Civil Works Studies, Designs, and Projects,” requirements (USACE, 2018). This effort would involve coordination with the USACE CPR CoP. The qualitative assessment of climate change required by Engineering and Construction Bulletin 2018–14 will be completed by a PI and includes a literature review of observed and projected trends in climate change, trend analysis and nonstationarity detection in observed hydrology, and relevant climate variables. The CHAT would be used to evaluate trends in the projected annual maximum of average-monthly streamflow at the 8-digit HUC scale for the Upper Mississippi River (HUC 07) and Missouri River (HUC 10) drainage basin, and a drainage basin vulnerability assessment would be completed at the 4-digit HUC scale using the vulnerability assessment tool. Recent qualitative assessments completed for the Upper Mississippi River and Missouri River flow frequency updates would be leveraged to support the qualitative assessment proposed herein. As a result of this existing body of work, the primary focus of this effort would be to provide consistency, particularly in the use of the CHAT tool, between the Mississippi River and Missouri River analyses that would be completed independently. Updates to the vulnerability assessment would be required to meet USACE guidance for their ecosystem restoration business line.
Discussion
The Upper Mississippi River System future hydrology meeting series represented the first comprehensive and topical discussion among UMRR program partners about future hydrology and the challenges it presents to carrying out the mission of the UMRR program. Participants accomplished the two goals for the meeting series: (1) to discuss specific needs, methodological approaches, and desired outcomes for understanding climate-changed hydrology in relation to the UMRR program’s mission and (2) to develop a blueprint for acquiring future hydrology projections for the Upper Mississippi River System. The results, described previously, and the appendixes provide important documentation of discussions and decision points made by the partnership in working towards acquiring a dataset of projected hydrologic data for the Upper Mississippi River System.
Meeting Series Outcomes
The challenges presented by an uncertain hydrologic future were specific to the Upper Mississippi River System and can serve as a useful reference for the UMRR partnership to frame further discussions. In particular, challenges associated with HREP and management decisions were rooted in the years of experience since the inception of the UMRR program. HREP designs are tailored to specific places within the Upper Mississippi River System and often require site-specific hydrologic information in the planning process (U.S. Army Corps of Engineers, 2012). There remain, however, questions of exactly how any quantitative dataset of projected future hydrology would integrate with existing workflows of the HREP planning and design process. Discussions planned for the early part of the LOCA-VIC-mizuRoute hydrologic data product evaluation (fig. 6, black box 1) are intended to initiate communications on the role and use of any projected future hydrologic dataset in HREP planning and design. Future discussions will be held after the black box evaluation, in consultation with the USACE CPR CoP, because of the complexity of the issue, wide range of HREP designs, and uncertainty about the nature of any projected future hydrologic dataset (for example, uncertainty or spatial and temporal scales).
Although crafted with the Upper Mississippi River System in mind, many of the challenges identified are like those facing other river ecosystems, especially other large, multiuse rivers. Common challenges include those related to modeling potential ecological and geomorphic responses and developing management strategies in the face of uncertain hydrologic futures. Modeling potential future responses to altered flows remains difficult in any river system because of the unprecedented nature of flow regime change expected in many systems, complex relations among river systems’ ecological and geomorphic components, dynamic interactions among biota themselves, difficulty untangling natural variability from the effects of climate change, and differences in model complexity across linked model frameworks (Vaughan and others, 2009; Olden and others, 2010; Angert and others, 2013; Filipe and others, 2013; Palmer and Ruhi, 2019; John and others, 2021). A variety of modeling approaches linking hydrology to ecological endpoints exist. However, interactions between hydrologic variation and ecological responses should be explicitly captured in a modeling framework by combining ecological and hydrologic methods of comparable complexity in order for the risks of climate change to river ecosystems to be properly represented (John and others, 2021). Developing management strategies in the face of uncertain hydrologic futures is a key challenge for river managers around the world (Krysanova and others, 2010). Several frameworks aid in these efforts (for example, scenario planning [Miller and others, 2022] and resist, accept, or direct [Thompson and others, 2021]), but effective climate change adaptation relies upon understanding projected changes including the full range of potential trajectories. The LOCA-VIC-mizuRoute hydrologic data products, if reliable, will provide managers and researchers with a critical component needed for successful climate change adaptation planning efforts to ensure that restoration and management actions are appropriate and suitable for future conditions.
Agency priorities for understanding future hydrology were broad, which reflected the diversity of perspectives among meeting attendees and their respective agencies. The broadness of the priorities also was an artifact of the ranking process itself, in which more general ideas were ranked higher because they encompassed more specific issues that may have been raised in separate priorities. Although more specific priorities may have been more tractive to link to specific qualities of a hydrologic dataset or intended dataset applications, the generality of the priorities gives space for the partnership to address them in a variety of ways, depending on the skill sets and resources available at any point in time. Within the rankings, some clear breaks were in the degree of support. For example, understanding geomorphic responses to changing hydrology was ranked as the top geomorphology priority with a score of 131 points, but the next two priorities were clumped lower together (rankings between 108 and 103) and a second break was between the next clump of priorities (staring with a score of 73.8). Priorities under the theme of HREP and management decisions also had breakpoints in the distribution of ranking scores. In contrast, ecological priorities were more evenly distributed in their ranking scores. These results indicate that a preference may exist for putting more resources toward addressing a limited number of geomorphic and HREP/management decision priorities in the future and a more distributed effort to address several ecological priorities.
The topic of scale came up repeatedly during the meeting series. Issues of scale are fundamental to understanding ecological patterns and processes, but no single spatial or temporal scale exists over which to best describe ecological phenomena (Wiens, 1989; Levin, 1992; Chave, 2013). It was apparent from homework responses and meeting discussions that agencies differed in their experience working with hydrologic data at various spatial and temporal scales. This fact affected the desired characteristics of a projected hydrologic dataset. Ideally, hydrologic data would be available at the daily scale to allow for the greatest degree of flexibility in subsequent processing; for example, daily data can be summarized at coarse time steps such as weekly, monthly, seasonally, annually, and coarser depending on the intended outcome, application, or analysis. In addition, any future dataset would ideally be available systemically and for locations with existing hydrologic data. These characteristics would allow comparisons of river hydrology across the entire Upper Mississippi River System (spatial comparisons) and comparisons of specific streamgage locations through time (temporal comparisons). It should be noted that the appropriateness of any comparison should be evaluated in the context of the LOCA-VIC-mizuRoute hydrologic data product evaluation results, especially with regards to the degree of uncertainty.
Uncertainty is inherent in any modeling exercise, especially those related to projecting future hydrologic conditions. Understanding the potential sources of uncertainty and how they contribute to modeling outcomes is an emerging practice (Dobler and others, 2012). A full assessment of uncertainty, its sources, and its effect on model results is not a focus of the blueprint for acquiring a dataset of future hydrology projections for the Upper Mississippi River System. However, a future study could provide ample opportunity to pursue these topics. The issue of uncertainty was raised on several occasions during the meeting series; technical experts emphasized the importance of communicating uncertainty in any final hydrologic data product deemed suitable for use by the UMRR program’s partnership. Doing so would help guide the appropriate uses and interpretation of hydrologic patterns. It was recommended that any accompanying documentation related to a data dissemination effort include a discussion of uncertainty and appropriate uses of the data product.
We learned that the input of technical experts was invaluable to the success of the meeting series. Navigating guidance that informs climate-related work within the USACE can be difficult because of changing guidance, lack of official documents, and other issues. Early communication with the USACE CPR CoP was important to help develop expectations for any subsequent climate-change-related work that would be required to meet USACE guidance. Early communication also helped build positive relations and understanding that led to productive meeting discussions with the UMRR program’s partnership, as well as helping to identify related projects from other parts of the country and contacts who could aid Upper Mississippi River System work. Should any additional climate-related projects be taken on in the future by the UMRR program’s partnership, early and frequent communication with the USACE CPR CoP is encouraged.
Blueprint for Acquiring a Dataset of Projected Hydrologic Conditions for the Upper Mississippi River System
The workflow described previously (fig. 6) represents a path towards acquiring a dataset of projected hydrologic conditions for the Upper Mississippi River System. The workflow is rooted in the discussions from the meeting series on challenges faced by the UMRR program’s partnership by an uncertain future, priorities for understanding future hydrology in the context of the UMRR mission, and the landscape of modeling approaches and datasets available at the time of the meeting series and identified with the help of technical experts. Although crafted with the LOCA-VIC-mizuRoute hydrologic data products in mind, the workflow is a series of generic steps that can be applied for evaluating a variety of datasets that represent potential future hydrologic conditions. The workload may be substantially reduced if the workflow is reapplied to alternative datasets after an evaluation of the LOCA-VIC-mizuRoute hydrologic data products. This is because initial implementation of steps within the black boxes are designed to generate guiding information and quantitative processing scripts that could be reused in subsequent evaluations. It is possible that even with repeated evaluations, there is no hydrologic data product that fully reliable. In this case, this report and workflow offer insights into reasonable next steps like applying bias correction methods, reassessing the intended use of the data products, or developing custom hydrologic models (fig. 6).
If the UMRR program’s partnership acquires projected hydrologic data for the Upper Mississippi River System in the future, careful attention to how the data would be disseminated will be necessary. The wide variety of experience accessing, working with, and interpreting hydrologic data by UMRR program partners was evident in homework responses and in meeting discussions. Issues with data access and communication were also identified as challenges to the partnership. In response, data dissemination plans discussed during meeting 3 were affected by the diverse experiences of UMRR program partners with hydrologic data. The framework for data dissemination outlined in the “Meeting Discussions and Outcomes” section prioritized flexibility in distribution methods (for example, data linked to mapped locations or data made searchable by sites). Distribution methods discussed include premade interpretive graphs for easier data exploration, thorough documentation to help users interpret and work with the data and a webinar to discuss the results and how they can be accessed. Exact details of these components would need to be worked out with technical experts involved in the data evaluation process and website developers involved with the data dissemination process, with input from the broader partnership as needed.
Summary
The Upper Mississippi River Restoration (UMRR) program integrates ecosystem monitoring, research, and modeling to rehabilitate habitat and evaluate ecosystem trends over time in the Upper Mississippi River System. Hydrologic data are foundational to the UMRR program’s scientific and management activities, especially those that consider the river system’s potential future conditions. A lack of quantitative hydrologic data representing potential future conditions limits the ability to complete informative research on how future conditions may affect river ecology, achieve management goals, and design restoration projects for 50-year horizons.
The U.S. Geological Survey and the U.S. Army Corps of Engineers (USACE) led a series of three virtual meetings with UMRR program partners to (1) prioritize needs for understanding future hydrology, (2) discuss appropriate datasets that could address the UMRR program’s needs, and (3) develop a plan for acquiring and distributing a hydrologic dataset of potential future conditions. Participants included representatives from State agencies in the UMRR partnership; biologists and engineers from USACE districts spanning the Upper Mississippi River System; technical experts from the U.S. Geological Survey and USACE; representatives from the U.S. Fish and Wildlife Service with experience in the UMRR Program, hydrology, or both; UMRR Program management; and representatives from the Upper Mississippi River Basin Association.
Agency priorities for understanding future hydrologic conditions were identified in meeting 1. Participants began by identifying challenges presented to the UMRR program by an uncertain hydrologic future along the themes of hydrology, geomorphology, ecology and biota, Habitat Restoration and Enhancement Projects and management decisions, and general methods. Participants then discussed and defined agency priorities to understanding potential future hydrologic conditions and developed criteria for ranking the priorities. The criteria were applied in a ranking exercise, producing a list of top priorities related to understanding potential future hydrologic conditions for the UMRR program.
In meeting 2, participants defined characteristics of an ideal quantitative dataset that could be used to address the top-ranking priorities. The ideal dataset would consist of daily discharge data available for a minimum 50-year time horizon into the future across the Upper Mississippi River System. The LOcalized Constructed Analogs-Variable Infiltration Capacity-mizuRoute hydrologic data products were identified by technical experts as an existing dataset with these characteristics that might be potential resource for the UMRR program.
A subset of participants from the meeting series drafted a workflow for acquiring a hydrologic dataset of potential future conditions during meeting 3. The workflow focused on evaluating the LOcalized Constructed Analogs-Variable Infiltration Capacity-mizuRoute hydrologic data products to meet UMRR program priorities identified in the meeting series. However, it included generic steps that could be adapted and applied to other datasets. The workflow includes an initial data reliability assessment and then describes various pathways for data dissemination, data correction options, and other actions that are dependent on the outcome of the reliability assessment. The workflow represents a blueprint for the UMRR program that is rooted in the discussions from the meeting series on challenges faced by the UMRR program’s partnership by an uncertain future, priorities for understanding future hydrology in the context of the mission of the UMRR program, and the landscape of modeling approaches and datasets available at the time of the meeting series.
References Cited
Angert, A.L., LaDeau, S.L., and Ostfeld, R.S., 2013, Climate change and species interactions—Ways forward: Annals of the New York Academy of Sciences, v. 1297, no. 1, p. 1–7. [Also available at https://doi.org/10.1111/nyas.12286.]
Bouska, K.L., Houser, J.N., De Jager, N.R., and Hendrickson, J., 2018, Developing a shared understanding of the Upper Mississippi River—The foundation of an ecological resilience assessment: Ecology and Society, v. 23, no. 2, article 6, 23 p., accessed May 18, 2022, at https://doi.org/10.5751/ES-10014-230206.
Bouska, K.L., Houser, J.N., De Jager, N.R., Van Appledorn, M., and Rogala, J.T., 2019, Applying concepts of general resilience to large river ecosystems—A case study from the Upper Mississippi and Illinois Rivers: Ecological Indicators, v. 101, p. 1094–1110, accessed June 1, 2022, at https://doi.org/10.1016/j.ecolind.2019.02.002.
Carhart, A.M., and De Jager, N.R., 2019, Spatial and temporal changes in species composition of submersed aquatic vegetation reveal effects of river restoration: Restoration Ecology, v. 27, no. 3, p. 672–682, accessed May 31, 2022, at https://doi.org/10.1111/rec.12911.
Chave, J., 2013, The problem of pattern and scale in ecology—What have we learned in 20 years?: Ecology Letters, v. 16, no. 1 (special issue), p. 4–16, accessed June 28, 2022, at https://doi.org/10.1111/ele.12048.
De Jager, N.R., Rogala, J.T., Rohweder, J.J., Van Appledorn, M., Bouska, K.L., Houser, J.N., and Jankowski, K.J., 2018, Indicators of ecosystem structure and function for the Upper Mississippi River System: U.S. Geological Survey Open-File Report 2018–1143, 115 p., including 4 appendixes. [Also available at https://doi.org/10.3133/ofr20181143.]
De Jager, N.R., Van Appledorn, M., Fox, T.J., Rohweder, J.J., Guyon, L.J., Meier, A.R., Cosgriff, R.J., and Vandermyde, B.J., 2019, Spatially explicit modelling of floodplain forest succession—Interactions among flood inundation, forest successional processes, and other disturbances in the Upper Mississippi River floodplain, USA: Ecological Modelling, v. 405, p. 15–32, accessed August 30, 2019, at https://doi.org/10.1016/j.ecolmodel.2019.05.002.
Dobler, C., Hagemann, S., Wilby, R.L., and Stötter, J., 2012, Quantifying different sources of uncertainty in hydrological projections in an Alpine watershed: Hydrology and Earth System Sciences, v. 16, no. 11, p. 4343–4360, accessed August 2, 2022, at https://doi.org/10.5194/hess-16-4343-2012.
Filipe, A.F., Lawrence, J.E., and Bonada, N., 2013, Vulnerability of stream biota to climate change in Mediterranean climate regions—A synthesis of ecological responses and conservation challenges: Hydrobiologia, v. 719, p. 331–351, accessed June 28, 2022, at https://doi.org/10.1007/s10750-012-1244-4.
Guyon, L.J., and Battaglia, L.L., 2018, Ecological characteristics of floodplain forest reference sites in the Upper Mississippi River System: Forest Ecology and Management, v. 427, p. 208–216, accessed May 18, 2022, at https://doi.org/10.1016/j.foreco.2018.06.007.
Houser, J.N., 2016, Contrasts between channels and backwaters in a large, floodplain river—Testing our understanding of nutrient cycling, phytoplankton abundance, and suspended solids dynamics: Freshwater Science, v. 35, no. 2, p. 457–473, accessed May 18, 2022, at https://doi.org/10.1086/686171.
Ickes, B.S., Sauer, J.S., Richards, N., Bowler, M., and Schlifer, B., 2014, Spatially explicit habitat models for 28 fishes from the Upper Mississippi River System (AHAG 2.0) (ver. 1.1, July 2014): U.S. Army Corps of Engineers Upper Mississippi River Restoration-Environmental Management Program, Technical Report 2014–T002, prepared by the U.S. Geological Survey, 89 p., including appendixes 1 and 2, accessed August 8, 2022, at https://pubs.usgs.gov/mis/ltrmp2014-t002/.
John, A., Horne, A., Nathan, R., Stewardson, M., Webb, J.A., Wang, J., and Poff, N.L., 2021, Climate change and freshwater ecology—Hydrological and ecological methods of comparable complexity are needed to predict risk: WIREs Climate Change, v. 12, no. 2, article e692, 12 p., accessed June 14, 2022, at https://doi.org/10.1002/wcc.692.
Krysanova, V., Dickens, C., Timmerman, J., Varela-Ortega, C., Schlüter, M., Roest, K., Huntjens, P., Jaspers, F., Buiteveld, H., Moreno, E., de Pedraza Carrera, J., Slámová, R., Martínková, M., Blanco, I., Esteve, P., Pringle, K., Pahl-Wostl, C., and Kabat, P., 2010, Cross-comparison of climate change adaptation strategies across large river basins in Europe, Africa and Asia: Water Resources Management, v. 24, no. 14, p. 4121–4160, accessed June 14, 2022, at https://doi.org/10.1007/s11269-010-9650-8.
Larson, J.H., Knights, B.C., McCalla, S.G., Monroe, E., Tuttle-Lau, M., Chapman, D.C., George, A.E., Vallazza, J.M., and Amberg, J., 2017, Evidence of Asian carp spawning upstream of a key choke point in the Mississippi River: North American Journal of Fisheries Management, v. 37, no. 4, p. 903–919, accessed August 10, 2022, at https://doi.org/10.1080/02755947.2017.1327901.
Levin, S.A., 1992, The problem of pattern and scale in ecology—The Robert H. MacArthur Award lecture: Ecology, v. 73, no. 6, p. 1943–1967, accessed June 28, 2022, at https://doi.org/10.2307/1941447.
Liang, X., Lettenmaier, D.P., Wood, E.F., and Burges, S.J., 1994, A simple hydrologically based model of land surface water and energy fluxes for general circulation models: Journal of Geophysical Research, v. 99, no. D7, p. 14415–14428, accessed August 10, 2022, at https://doi.org/10.1029/94JD00483.
Lund, E., 2019, Time lag investigation of physical conditions and submersed macrophyte prevalence in upper navigation pool 4, Upper Mississippi River: La Crosse, Wis., U.S. Army Corps of Engineers Upper Mississippi River Restoration Program, LTRM–2015A8, prepared by the U.S. Geological Survey, 24 p.
Miller, B.W., Schuurman, G.W., Symstad, A.J., Runyon, A.N., and Robb, B.C., 2022, Conservation under uncertainty—Innovations in participatory climate change scenario planning from U.S. national parks: Conservation Science and Practice, v. 4, no. 3, article e12633, 4 p., accessed June 29, 2022, at https://doi.org/10.1111/csp2.12633.
Mizukami, N., Clark, M.P., Sampson, K., Nijssen, B., Mao, Y., McMillan, H., Viger, R.J., Markstrom, S.L., Hay, L.E., Woods, R., Arnold, J.R., and Brekke, L.D., 2016, mizuRoute version 1—A river network routing tool for a continental domain water resources applications: Geoscientific Model Development, v. 9, no. 6, p. 2223–2238. [Also available at https://doi.org/10.5194/gmd-9-2223-2016.]
Montenero, M.P., Brey, M.K., Knights, B.C., and Nock, T., 2018, Assessing techniques to enhance barrier characteristics of high-head navigation dams on the Upper Illinois River—Data: U.S. Geological Survey data release, accessed August 10, 2022, at https://doi.org/10.5066/F7833R62.
Olden, J.D., Kennard, M.J., Leprieur, F., Tedesco, P.A., Winemiller, K.O., and García-Berthou, E., 2010, Conservation biogeography of freshwater fishes—Recent progress and future challenges: Diversity and Distributions, v. 16, no. 3, p. 496–513, accessed June 18, 2013, athttps://doi.org/10.1111/j.1472-4642.2010.00655.x.
Palmer, M., and Ruhi, A., 2019, Linkages between flow regime, biota, and ecosystem processes—Implications for river restoration: Science, v. 365, no. 6459, article eaaw2087, 13 p., accessed June 28, 2022, at https://doi.org/10.1126/science.aaw2087.
Pierce, D.W., Cayan, D.R., and Thrasher, B.L., 2014, Statistical downscaling using localized constructed analogs (LOCA): Journal of Hydrometeorology, v. 15, no. 6, p. 2558–2585, accessed August 10, 2022, at https://doi.org/10.1175/JHM-D-14-0082.1.
Rangwala, I., Moss, W., Wolken, J., Rondeau, R., Newlon, K., Guinotte, J., and Travis, W.R., 2021, Uncertainty, complexity and constraints—How do we robustly assess biological responses under a rapidly changing climate?: Climate (Basel), v. 9, no. 12, 28 p., accessed May 19, 2022, at https://doi.org/10.3390/cli9120177.
Sparks, R.E., Nelson, J.C., and Yin, Y., 1998, Naturalization of the flood regime in regulated rivers: BioScience, v. 48, no. 9, p. 706–720, accessed May 18, 2022, at https://doi.org/10.2307/1313334.
Theiling, C.H., and Nestler, J.M., 2010, River stage response to alteration of Upper Mississippi River channels, floodplains, and watersheds: Hydrobiologia, v. 640, no. 1, p. 17–47, accessed May 18, 2022, at https://doi.org/10.1007/s10750-009-0066-5.
Thompson, L.M., Lynch, A.J., Beever, E.A., Engman, A.C., Falke, J.A., Jackson, S.T., Krabbenhoft, T.J., Lawrence, D.J., Limpinsel, D., Magill, R.T., Melvin, T.A., Morton, J.M., Newman, R.A., Peterson, J.O., Porath, M.T., Rahel, F.J., Sethi, S.A., and Wilkening, J.L., 2021, Responding to ecosystem transformation—Resist, accept, or direct?: Fisheries (Bethesda, Md.), v. 46, no. 1, p. 8–21, accessed June 29, 2022, at https://doi.org/10.1002/fsh.10506.
U.S. Army Corps of Engineers, 2018, Guidance for incorporating climate change impacts to inland hydrology in civil works studies, designs, and projects (revision 2): U.S. Army Corps of Engineers Engineering and Construction Bulletin 2018–14, 15 p., accessed June 12, 2025, at https://www.wbdg.org/FFC/ARMYCOE/COEECB/ARCHIVES/ecb_2018_14_rev_2.pdf.
Van Appledorn, M., 2022, Hydrologic indicators, chap. B. of Houser, J.N., ed., Ecological status and trends of the Upper Mississippi and Illinois Rivers (ver. 1.1, July 2022): U.S. Geological Survey Open-File Report 2022–1039, p. 38–54. [Also available at https://doi.org/10.3133/ofr20221039.]
Van Appledorn, M., De Jager, N.R., and Rohweder, J.J., 2021, Quantifying and mapping inundation regimes within a large river‐floodplain ecosystem for ecological and management applications: River Research and Applications, v. 37, no. 2 (special issue), p. 241–255. [Also available at https://doi.org/10.1002/rra.3628.]
Vano, J., Hamman, J., Gutmann, E., Wood, A., Mizukami, N., Clark, M., Pierce, D.W., Cayan, D.R., Wobus, C., Nowak, K., and Arnold, J., 2020, Comparing downscaled LOCA and BCSD CMIP5 climate and hydrology projections—Release of downscaled LOCA CMIP5 hydrology: Lawrence Livermore National Laboratory, 96 p., accessed August 10, 2022, at https://gdo-dcp.llnl.gov/downscaled_cmip_projections/techmemo/LOCA_BCSD_hydrology_tech_memo.pdf.
Vaughan, I.P., Diamond, M., Gurnell, A.M., Hall, K.A., Jenkins, A., Milner, N.J., Naylor, L.A., Sear, D.A., Woodward, G., and Ormerod, S.J., 2009, Integrating ecology with hydromorphology—A priority for river science and management: Aquatic Conservation—Marine and Freshwater Ecosystems, v. 19, no. 1, p. 113–125, accessed May 18, 2022, at https://doi.org/10.1002/aqc.895.
Viger, R.J., and Bock, A., 2014, GIS features of the geospatial fabric for national hydrologic modeling (1st ed.): U.S. Geological Survey data release, accessed June 12, 2025, at https://dx.doi.org/doi:10.5066/F7542KMD.
Wiens, J.A., 1989, Spatial scaling in ecology: Functional Ecology, v. 3, no. 4, p. 385–397. [Also available at https://doi.org/10.2307/2389612.]
Yin, Y., Nelson, J.C., and Lubinski, K.S., 1997, Bottomland hardwood forests along the Upper Mississippi River: Natural Areas Journal, v. 17, p. 164–173, accessed May 18, 2022, at https://www.jstor.org/stable/43911662.
Zhang, Y.-K., and Schilling, K.E., 2006, Increasing streamflow and baseflow in Mississippi River since the 1940s—Effect of land use change: Journal of Hydrology, v. 324, nos. 1–4, p. 412–422, accessed June 1, 2022, at https://doi.org/10.1016/j.jhydrol.2005.09.033.
Appendix 1. Participant List
Table 1.1.
List of participants of the Upper Mississippi River Restoration program’s future hydrology meeting series and their affiliations. Participants are listed alphabetically by agency.[FWS, U.S. Fish and Wildlife Service; X, indicates meeting attendance, even if partial; --, absent; IA DNR, Iowa Department of Natural Resources; IL DNR, Illinois Department of Natural Resources; MN DNR, Minnesota Department of Natural Resources; MDC, Missouri Department of Conservation; WI DNR, Wisconsin Department of Natural Resources; UMRBA, Upper Mississippi River Basin Association; USACE, U.S. Army Corps of Engineers; CPR CoP, Climate Preparedness and Resilience Community of Practice; LTRM, Long Term Resource Monitoring; MVP, St. Paul District; MVR, Rock Island District; *, indicates meeting facilitator; +, indicates meeting organizer; MVS, St. Louis District; USGS, U.S. Geological Survey; MWCASC, Midwest Climate Adaptation Science Center; UMESC, Upper Midwest Environmental Sciences Center; UMWSC, Upper Midwest Water Science Center]
Appendix 2. Compiled Responses to Homework Activities
Part 1. Understanding Upper Mississippi River Restoration Program Priorities, Current Use of Hydrologic Data, and Potential Uses of a Future Hydrologic Dataset
The purposes of this activity are to (1) gather information on broad partnership needs and priorities for understanding climate-changed hydrology, (2) understand how hydrologic data and information are used in partnership activities, and (3) capture the ways a dataset of Upper Mississippi River System future hydrology might be useful. Responses to homework activities were submitted in September 2021. References to “current” or “existing” should therefore be interpreted in relation to this timeframe.
Section 1. Understanding Upper Mississippi River Restoration Program Priorities
Question 1A.—In your opinion, what are the top three challenges facing your or your agency’s ability to accomplish the Upper Mississippi River Restoration (UMRR) program’s mission with regards to understanding future hydrologic conditions (to enhance habitat and advance knowledge for restoring and maintaining a healthier and more resilient Upper Mississippi River ecosystem)?
Participant responses emphasized that the uncertainty around characterizing future hydrologic conditions was a challenge for carrying out their agency’s mission. Responses also pointed out that this uncertainty also meant that anticipating how geomorphological processes, ecological processes, and the biota would respond was difficult. Together, these factors can hamper effective river management decisions, including Habitat Restoration and Enhancement Project (HREP) planning and design, and present methodological challenges to those completing field work or modeling exercises aimed at improving decision making. Compiled responses are listed in table 2.1 and are organized under general topical headings.
Table 2.1.
Responses to question 1A (In your opinion, what are the top three challenges facing your or your agency’s ability to accomplish the Upper Mississippi River Restoration program’s mission with regards to understanding future hydrologic conditions [to enhance habitat and advance knowledge for restoring and maintaining a healthier and more resilient Upper Mississippi River ecosystem]?) submitted in September 2021. References to “current” or “existing” should therefore be interpreted in relation to this timeframe. Responses are minimally edited to retain original context.[UMESC, Upper Midwest Environmental Sciences Center; HREP, Habitat Restoration and Enhancement Project; UMRR, Upper Mississippi River Restoration program; O&M, operations and maintenance; USFWS, U.S. Fish and Wildlife Service; watershed, term used to describe drainage basin; NOAA, National Oceanic and Atmospheric Administration]
| Participant responses |
|---|
| There is a need for an understanding of future hydrologic conditions at a variety of scales; systemically across the Upper Mississippi River System and within project-specific areas/local watersheds. |
| Quantifying future variability in hydrologic conditions |
| Uncertainty of future flood frequencies |
| Uncertainty of future flood durations |
| Assessing hydrologic conditions at ungaged locations |
| Hydrologic data analysis |
| Uncertain future hydrologic conditions and geomorphic response |
| Scientists at UMESC do not fully understand how climate change and (or) changes in basinwide land-use practices are projected to affect river flows. |
| UMESC does not have any tools or models in use that simulate effects of different emissions scenarios on river flows/depth and thus cannot extend existing climate change forecasts to the Upper Mississippi River System. |
| Uncertainty of future land-use changes in the watershed that could affect future hydrological events and frequencies (for example, changes in farming methods—tiling fields, changes in amount of paved surfaces) |
| The effects of hydrologic change on other river processes is unknown. |
| Uncertainty of sediment transport associated with future flood frequencies |
| Unknown effects on other processes. How does future hydrology affect watershed and in-channel sediment transport and geomorphic processes, including suspended sediment concentration, wave action, island/bank line loss/erosion, backwater connectivity, and sediment deposition. |
| Flow magnitude and frequency affecting sampling ability and success |
| Biologic change in response to future hydrologic conditions |
| Integration of hydrologic data into additional datasets such as fish, vegetation, macroinvertebrates, and water quality |
| Lack of tools/models to simulate effects of different emissions scenarios on river flows/depth makes it impossible to assess ecological outcomes of future scenarios that do not include management actions, as well as scenarios that include management actions, such as manipulating water depth or velocity through dredging, altering connectivity, building islands, or water level manipulations. |
| Linking biological endpoints to hydrologic metrics |
| Magnitude, frequency, duration, and timing affecting species composition and distribution |
| Timing, magnitude, and duration of flows shifting timing and distribution of habitat availability |
| Increased/extended frequency of high-water events negatively affecting establishment, presence, and density of aquatic vegetation beds (wiping out or severely hindering aquatic vegetation and its associated habitat and water quality benefits) |
| Assessing the resilience of habitats in the face of climate change |
| The substantial resources and habitats affected by hydrologic change and river processes is unknown. |
| We do not have a good framework for capturing ecosystem benefits. |
| UMRR project effectiveness in the future—Will UMRR projects that are designed “hold up” and be effective and useful with future hydrologic conditions? For example, elevation enhancement or closing structures need to be designed for the future (50 years). If data are limited, we are really guessing what the future might be for hydrology and building around that. More accurate modelling would help the UMRR Program. |
| Where, what, and how to build to last |
| Unknown future hydrologic conditions make analysis of future without project conditions challenging, making project benefit calculations more challenging. |
| Designing resilient projects for uncertain future hydrologic conditions |
| Making good decisions in the face of uncertain geomorphic change |
| We do not have enough information to assess how design of HREP features will perform over the long term. For example, how much additional sedimentation in backwater fish overwintering areas will result from increased flows? |
| Without a rigorous modelling framework, agencies are left to come up with their own hypotheses regarding anticipated effects of climate change, making it difficult to come to a consensus on how to manage the river system in the face of a changing climate. Having a common understanding of future hydrologic projections and uncertainty across the partnership will be beneficial as conversations move forward on how to adapt to these changes. |
| Proper sizing of water control structures, pumps, levees, and so on is difficult. |
| Understanding O&M responsibilities of sponsors is difficult. |
| HREP habitat benefits—A lack of understanding of future with and without project conditions makes it difficult to estimate habitat benefits and how they may change over the 50-year design life of the project. |
| HREP feature design—Without knowledge of future hydrology, we do not know what range of flow/stage conditions our features should be designed to perform under. We therefore do not know which project features are more or less vulnerable/robust to climate change. |
| It can be difficult to apply and translate existing hydrologic information in a way that is directly and obviously applicable to the specific resource management problems that need to be informed. For example, river streamgage information can be difficult to translate into what things look like out on the river. Also, stage readings vary across different locations. Finally, because there can be a great distance between different streamgages, or tributaries between successive streamgages, there is a need to interpolate, and the best available interpolation still may not be very reliable. Different streamgages may use different datums, but the actual datum is not often provided with the data that are available on the internet. |
| Hydrologic data access |
| Getting the data (standardized data source; data are not served in real time and in a standardized output). |
| Access to existing and modeled future hydrologic condition datasets and maps must be expanded. With climate change, the use of past experience to estimate effects of seasonal flows and the effects of acute rain events will be less useful, and the user base for these data within the USFWS will expand significantly. |
| Hydrology is a technical area that most or all refuge staff have little to no background in, or have a very limited understanding of the technical aspects involved. This requires a great amount of reliance on partners to do and explain all things hydrology that are involved with working on a river. |
| Long-term climate projections; for example, updated NOAA Atlas 14 (Bonnin and others, 2006; Perica and others, 2013) |
| {Scale} When working on small-scale projects (for example, a single HREP) within a larger scale watershed (the entire Upper Mississippi River System), the phenomena inherent to such a large scale are a substantial barrier to understanding existing and potential future hydrologic conditions at the smaller scale. |
| {Funding} Limited project funds for assessing climate change effects for each project limits the project delivery team to the use of currently available qualitative analysis tools. |
| {Scope of UMRR} The UMRR mission applies to work done in the river floodplain, but so much of the work we do is affected by things that are happening in the huge watershed-scale landscape, particularly agricultural land-use practices and their effects on soil health. The “partnership” has a very limited ability to address those issues (USFWS Fish and Wildlife Conservation Office being an exception). |
| {Communications} Complexity in communications |
| {Hydrology versus anthropologic drivers} In addition to climate-changed components of hydrology, there are confounding anthropogenic components of hydrology that are also changing. The anthropogenic components can be very important, but it can often be difficult to know which component is being expressed in any hydrology metric that is exhibiting change. Additionally, the anthropogenic response to climate-changed hydrology may contribute to a feedback that further affects the total amount of change. |
| {Social dynamics} The social dynamic that challenges productive conversations that might integrate floodplain restoration as part of flood management; that is, risk reduction, control, and so forth |
Question 1B.—What are at least three of the most important or outstanding questions you or your agency has with regards to understanding the future hydrology of the Upper Mississippi River System? Feel free to list more if you wish.
Responses typically fell into one of three classes: responses related to hydrology and (or) geomorphology, responses related to ecological processes and (or) biota, or responses related to river management. Many questions mentioned certain attributes of a river’s flow regime (for example, flow magnitude, frequency, or duration) or flood regime (for example, depth, timing, or duration). Compiled responses are listed in table 2.2 and are organized under general topical headings. Word clouds were constructed for each topic to indicate the relative frequency of word mentions (figs. 2.1, 2.2, and 2.3).
Table 2.2.
Responses to question 1B (What are at least three of the most important or outstanding questions you or your agency has with regards to understanding the future hydrology of the Upper Mississippi River System? Feel free to list more if you wish.) submitted in September 2021. References to “current” or “existing’ should therefore be interpreted in relation to this timeframe. Responses are minimally edited to retain original context. Referenced geographic features are not shown on a corresponding map.[DO, dissolved oxygen; HREP, Habitat Restoration and Enhancement Project; UMRR, Upper Mississippi River Restoration program; HEC–RAS, Hydrologic Engineering Center-River Analysis System; AdH, Adaptive Hydraulics; OHWM, ordinary high-water mark]

Top 40 most frequently used words in question 1B (What are at least three of the most important or outstanding questions you or your agency has with regards to understanding the future hydrology of the Upper Mississippi River System? Feel free to list more if you wish.) responses related to hydrology or geomorphology. All words have at least two mentions. Font size is proportional to frequency of mentions (fig. generated by WordItOut, licensed under the Creative Commons Attribution-NonCommercial-NoDerivatives 4.0 International license; https://creativecommons.org/licenses/by-nc-nd/4.0/. No changes were made to the material generated by WordItOut.).
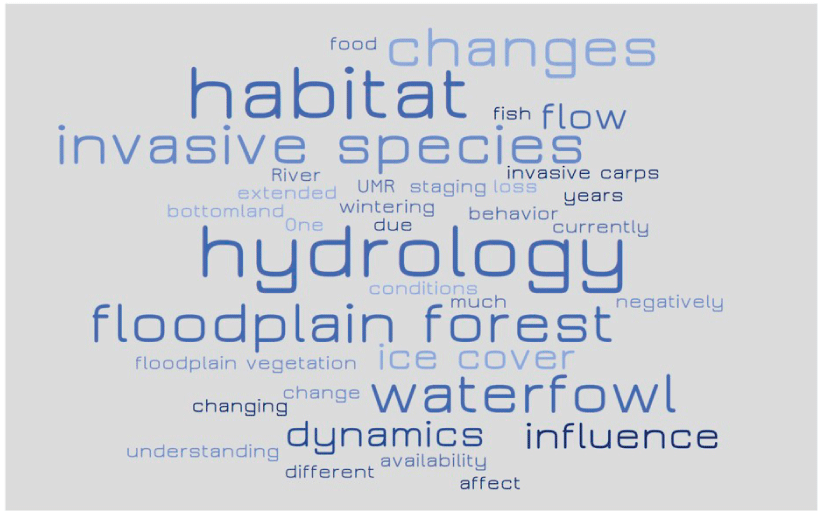
Word cloud of the 40 most frequently used words in question 1B (What are at least three of the most important or outstanding questions you or your agency has with regards to understanding the future hydrology of the Upper Mississippi River System? Feel free to list more if you wish.) responses related to river ecology and biota. All words have at least two mentions. Font size is proportional to frequency of mentions (fig. generated by WordItOut, licensed under the Creative Commons Attribution-NonCommercial-NoDerivatives 4.0 International license; https://creativecommons.org/licenses/by-nc-nd/4.0/. No changes were made to the material generated by WordItOut.). [UMR, Upper Mississippi River]

Top 40 words in question 1B (What are at least three of the most important or outstanding questions you or your agency has with regards to understanding the future hydrology of the Upper Mississippi River System? Feel free to list more if you wish.) responses related to river management issues. All words have at least two mentions. Font size is proportional to frequency of mentions (fig. generated by WordItOut, licensed under the Creative Commons Attribution-NonCommercial-NoDerivatives 4.0 International license; https://creativecommons.org/licenses/by-nc-nd/4.0/. No changes were made to the material generated by WordItOut.). [HREP, Habitat Restoration and Enhancement Project]
Section 2. Understanding Use of Hydrologic Data
Question 2A.—How do you use hydrologic information in your decision making, research, or other work?
Hydrologic information is used in a variety of ways by the partnership. For example, HREP planning, design, and construction are informed by information about flow frequencies, inundation periods, seasonality of flows, and so on. Hydrologic information is also used for regulatory purposes, water level management, operation of pumps or other management actions, developing agency reports, and planning field work campaigns. Hydrologic information is also used in developing other models of river function such as hydraulic models, ecological models, and geospatial models of water depth. The time step of hydrologic information necessary for completing these tasks varies depending on the task but can include daily, monthly, seasonal, or annual time steps. Compiled responses are listed in table 2.3 and are organized by general topic.
Table 2.3.
Responses to question 2A (How do you use hydrologic information in your decision making, research, or other work?) submitted in September 2021. References to “current” or “existing” should therefore be interpreted in relation to this timeframe. Responses are minimally edited to retain original context.[HREP, Habitat Restoration and Enhancement Project; LSOH, Lessard-Sams Outdoor Heritage Council; OHWM, ordinary high-water mark; D, dimensional; USGS, U.S. Geological Survey; HUC, hydrologic unit code; Q, discharge; UMESC, Upper Midwest Environmental Sciences Center; SAV, submerged aquatic vegetation; <, less than; cm/s, centimeter per second; LTRM, Long Term Resource Monitoring; WSE, water surface elevation; WRTDS, Weighted Regressions on Time, Discharge, and Season; N, nitrogen; UMRR, Upper Mississippi River Restoration program]
Question 2B.—Are there certain hydrologic criteria you use in your decision making, research, or other work (for example, thickness of ice cover, timing of peak discharge, number of days of discharge greater than or less than a given threshold)? Please be as specific as possible.
A river’s hydrologic regime can be described using several qualities including frequency, duration, timing, and magnitude among others. For example, frequency may refer to the likelihood of certain flows in any given year, duration may capture the number of days a particular floodplain inundation event may last, timing may refer to the seasonality of flow conditions, and magnitude may refer to water depths or peak flows. Compiled responses are listed in table 2.4 and are organized by the quality of hydrologic regime to which the variables/criteria mentioned are most closely related, as interpreted to the best abilities of the meeting organizers. A word cloud was constructed to indicate the relative frequency of word mentions (fig. 2.4).
Table 2.4.
Responses to question 2B (Are there certain hydrologic criteria you use in your decision making, research, or other work [for example, thickness of ice cover, timing of peak discharge, number of days of discharge greater than or less than a given threshold]? Please be as specific as possible.) submitted in September 2021. References to “current” or “existing” should therefore be interpreted in relation to this timeframe. Responses are minimally edited to retain original context. Referenced geographic features are not shown on a corresponding map.[F, frequency; HREP, Habitat Restoration and Enhancement Project; D, duration (length of time); DO, dissolved oxygen; T, timing (seasonality); M, magnitude; USACE, U.S. Army Corps of Engineers; WSE, water surface elevation; UMESC, Upper Midwest Environmental Sciences Center; LTRM, Long Term Resource Monitoring; O, other; ~, about; TSS, total suspended solids; N, nitrogen; P, phosphorus; Q, discharge; NWIS, National Water Information System database; HAB, harmful algal bloom; EPA, U.S. Environmental Protection Agency]
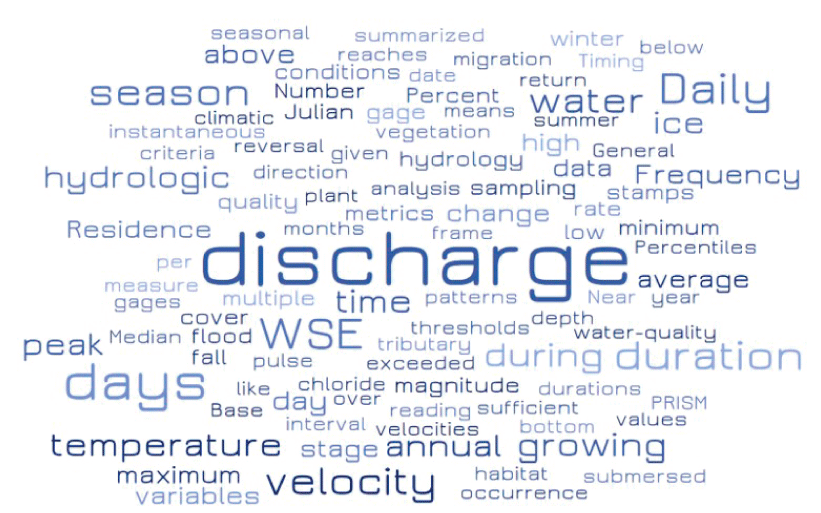
Word cloud of specific variables or criteria listed in responses to question 2B (Are there certain hydrologic criteria you use in your decision making, research, or other work [for example, thickness of ice cover, timing of peak discharge, number of days of discharge greater than or less than a given threshold]? Please be as specific as possible.). Font size is proportional to frequency of mentions (fig. generated by WordItOut, licensed under the Creative Commons Attribution-NonCommercial-NoDerivatives 4.0 International license; https://creativecommons.org/licenses/by-nc-nd/4.0/. No changes were made to the material generated by WordItOut.). [WSE, water surface elevation; gages, streamgages]
Question 2C.—If you use hydrologic data in your work, where do you acquire Upper Mississippi River System hydrologic data and in what format?
Users obtain hydrologic data from a variety of sources. A summary bar chart shows the distribution of sources based on response mentions (fig. 2.5). Data are often, but not always, in a “raw” format that facilitates direct, quantitative analysis of some kind. Specific hydrologic variables were often mentioned in the responses. Compiled responses are listed in table 2.5 and are organized into the topics of sources, formats, and hydrologic variables (some responses may be listed under more than one topic heading).
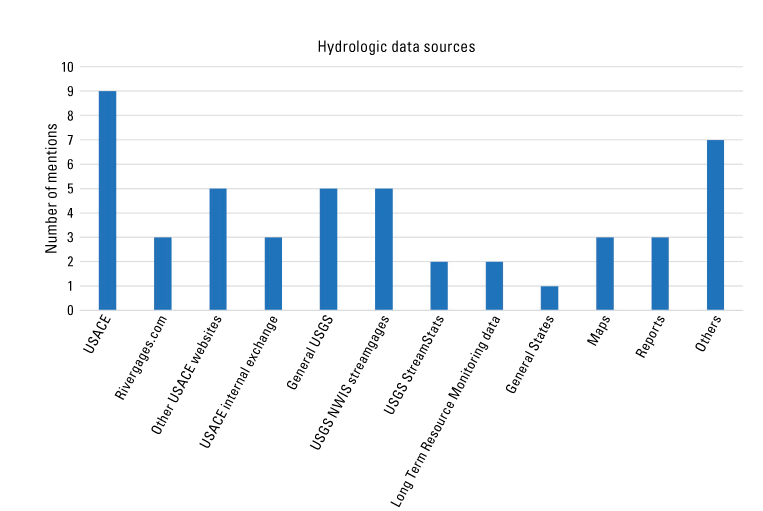
Distribution of sources used to obtain hydrologic data. [USACE, U.S. Army Corps of Engineers; USGS, U.S. Geological Survey; NWIS, National Water Information System; “general” indicates no additional specified information was mentioned, “reports” also includes appendices, and “other” includes direct acquisition from unspecified personnel, other governmental sources (for example, National Weather Service), or otherwise unspecified sources; Rivergages.com refers to USACE website https://rivergages.mvr.usace.army.mil/WaterControl/new/layout.cfm]
Table 2.5.
Responses to question 2C (If you use hydrologic data in your work, where do you acquire Upper Mississippi River System hydrologic data and in what format?) submitted in September 2021. References to “current” or “existing” should therefore be interpreted in relation to this timeframe. Responses are minimally edited to retain original context.[MVR, USACE Rock Island District; EC–HW, Engineering and Construction Division, Hydrology and Hydraulics Branch, Water Control Section; WSE, water surface elevation; DSS, Data Storage System; USGS, U.S. Geological Survey; USACE, U.S. Army Corps of Engineers; NWIS, National Water Information System; NWS, National Weather Service; CSV, comma separated values; lidar, light detection and ranging; HEC–DSS, Hydrologic Engineering Center-Data Storage System; VBA, Visual Basic for Applications; QAQC, quality assurance and quality control; H&H, hydrology and hydraulic; MVS, USACE St. Louis District; UMESC, Upper Midwest Environmental Sciences Center; LTRM, Long Term Resource Monitoring; %, percent; GIS, geographic information system; CWA, Clean Water Act; --, not applicable; NOAA, National Oceanic and Atmospheric Administration; ADCP, acoustic Doppler current profiler; EC–HQ, Engineering and Construction Division, Hydrology and Hydraulics Branch, Water Quality and Sedimentation Section; ft, foot; ft3/s, cubic foot per second; HEC–SSP, Hydrologic Engineering Center-Statistical Software Package]
| Participant responses | Hydrologic data source, format, or variable |
|---|---|
| MVR Water Control (EC–HW) daily WSE and discharge in DSS format | MVR Water Control |
| River streamgages—daily WSE and discharge in Excel format | River streamgages |
| USGS or USACE | USGS, USACE |
| USACE websites | USACE |
| USGS streamgages—stage, discharge | USGS streamgages |
| USGS websites | USGS websites |
| USGS streamgages for daily and peak stage/discharge and water quality parameters | USGS streamgages |
| USGS StreamStats—estimates of streamflow for ungaged sites | USGS StreamStats |
| USGS StreamStats | USGS StreamStats |
| USGS NWIS streamgage data | USGS NWIS |
| USGS data (https://waterdata.usgs.gov/wi/nwis/sw)—high quality but not in every pool. Also lack of discharge data at McGregor is a major problem. Stage only data need to be related back to discharge | USGS (https://waterdata.usgs.gov/wi/nwis/sw) |
| USACE Access to Water Resources Data website (https://water.usace.army.mil/), NWS hydrographs, and whatever the USACE gives us for specific projects | USACE Access to Water Resources Data website (https://water.usace.army.mil/); NWS |
| Stage elevations are obtained from the USACE locks and dams. | USACE |
| Streamflow and stage data from streamgages operated by the USGS, USACE, and States; graphs, CSV files, and so on | USGS, USACE, and States |
| Lidar data in ArcGIS from a variety of sources | Lidar |
| USACE Rivergages.com website (https://rivergages.mvr.usace.army.mil/WaterControl/new/layout.cfm) | USACE Rivergages.com website (https://rivergages.mvr.usace.army.mil/WaterControl/new/layout.cfm) |
| USACE Rivergages.com stage website (https://rivergages.mvr.usace.army.mil/WaterControl/new/layout.cfm) | USACE Rivergages.com stage website (https://rivergages.mvr.usace.army.mil/WaterControl/new/layout.cfm) |
| Directly from USACE personnel or district website. | USACE personnel or district websites |
| USACE Water Management website (https://www.mvp-wc.usace.army.mil/)—this site is problematic because data are not current for much of the year, winter months especially; occasional errors as well | USACE Water Management website (https://www.mvp-wc.usace.army.mil/) |
| USACE recurrence intervals | USACE |
| USACE and USGS discharge and WSE are available at daily or more frequent time scales and can be obtained and analyzed as HEC–DSS files, CSV, or spreadsheets | USACE and USGS |
| Sending emails to USACE districts to request data because data served are not current (especially during the winter months)—frustrating and time consuming | USACE district emails |
| Water exchange rates and WSE are measured by USACE staff as needed for projects. | USACE measurements |
| In management, we acquire most of our hydrological data from the USACE via the Water Management website (https://www.mvp-wc.usace.army.mil/Data.shtml). Typically, this website is accessed using an Excel program specific to the streamgage in question, which runs VBA code to scrape the data from the website and assemble a hydrograph for the selected streamgage. Limits to this method include minimal QAQC and issues with sometimes extensive shutdowns of these websites by the USACE. | USACE |
| I either get it from our H&H folks or download it from the USACE water control website. | H&H staff; USACE water control website |
| MVS Water Control | MVS Water Control |
| UMESC compilation database of daily water surface elevations | UMESC |
| LTRM water quality data | LTRM |
| LTRM fish and water quality datasets | LTRM |
| Some from LTRM website for specifics (for example, 75% exceedance levels in GIS or viewer) | LTRM |
| LTRM—Seems like I get them from a different place every year (for example, Rivergages.com [https://rivergages.mvr.usace.army.mil/WaterControl/new/layout.cfm]), but all have fatal flaws (reliability issues, ability to download select periods or periods that are more than 1 year old, and so on). | LTRM |
| USACE hydraulic model and H&H appendices for projects is often sole data source for locally scaled hydrologic relations | USACE hydraulic model and H&H appendices |
| I do not use it, but want to, with respect to progress tracking for nutrient reduction, and potentially, setting chloride criteria as well as thresholds for CWA designated-use assessments. | -- |
| Anecdotal evidence from sponsor/local stakeholder | Anecdotal evidence |
| Annual maximum rainfall—published values (NOAA Atlas 14, Illinois updated Bulletin 70) | NOAA Atlas 14 (Bonnin and others, 2006; Perica and others, 2013), Illinois updated Bulletin 70 (Angel and Markus, 2019) |
| ADCP velocity measurements (for hydraulic model calibration) from MVR Water Quality Section EC–HQ, Excel/GIS shapefile format | Measurements from MVR Water Quality Section |
| Watershed Erosion Prediction Project | Watershed Erosion Prediction Project |
| A recent report (Kerkhoff and others, 2021) used streamgage height (ft) and discharge (ft3/s) data obtained from USGS streamgage 05378500 in pool 6 and streamgage 05389500 in pool 10 to characterize the study environment. The data were obtained from the USGS NWIS database (https://waterdata.usgs.gov/nwis/%5d). The format was screenshots of graphs provided on the USGS website. | USGS NWIS database |
| We have used an inundation model, provided by the USACE foresters, to work on forestry projects. | USACE inundation model |
| Primarily bathymetry maps served by USGS UMESC that we plug into ArcGIS to generate sampling maps | Bathymetry maps from USGS UMESC |
| MVR Water Control (EC–HW) daily WSE and discharge in DSS format | DSS |
| River streamgages—daily WSE and discharge in Excel format | Excel |
| ADCP velocity measurements (for hydraulic model calibration) from MVR Water Quality Section EC–HQ, Excel/GIS shapefile format | Excel/GIS shapefile |
| Primarily bathymetry maps served by USGS UMESC that we plug into ArcGIS to generate sampling maps | ArcGIS |
| A recent report (Kerkhoff and others, 2021) used streamgage height (ft) and discharge (ft3/s) data obtained from USGS streamgage 05378500 in pool 6 and streamgage 05389500 in pool 10 to characterize the study environment. The data were obtained from the USGS NWIS database (https://waterdata.usgs.gov/nwis/%5d). The format was screenshots of graphs provided on the USGS website. | Screenshots of graphs provided on the USGS website |
| USACE Access to Water Resources Data website (https://water.usace.army.mil/), NWS hydrographs, and whatever the USACE gives us for specific projects | Hydrographs |
| Streamflow and stage data from streamgages operated by the USGS, USACE, and States; Graphs, CSV files, and so on | Graphs, CSV files |
| Lidar data in ArcGIS from a variety of sources | ArcGIS |
| USACE and USGS discharge and WSE are available at daily or more frequent time scales and can be obtained and analyzed as HEC–DSS files, CSV, or spreadsheets | HEC–DSS files, CSV or spreadsheets |
| In management, we acquire most of our hydrological data from the USACE via historical data from the Water Management website (https://www.mvp-wc.usace.army.mil/Data.shtml). Typically, this website is accessed using an Excel program specific to the streamgage in question, which runs VBA code to scrape the data from the website and assemble a hydrograph for the selected streamgage. Limits to this method include minimal QAQC and issues with sometimes extensive shutdowns of these websites by the USACE. | Excel, VBA code |
| Some from LTRM website for specifics (for example, 75% exceedance levels in GIS or viewer) | GIS or LTRM data viewer (https://umesc.usgs.gov/data_library/tools/data_visualization_tools.html) |
| We use daily discharge data (tabulated) from USGS streamgages acquired through NWIS, annual peak flow data from DSS-Vue, and daily discharge data for duration analysis through HEC–SSP. We acquire monthly, watershed averaged, gridded precipitation data from the Minnesota State Climatology office (tabulated format). These data are derived from high-density statewide local monitoring program data along with other long-term precipitation streamgages. Additionally, PRISM gridded data are used for other analysis within an R scripted analysis package. | Tabulated, DSS, HEC, gridded |
| Excel format | Excel |
| Standardization of vertical datum needs to be completed. It is a frustrating mix currently. | -- |
| MVR Water Control (EC–HW) daily WSE and discharge in DSS format | Daily WSE |
| River streamgages—daily WSE and discharge in Excel format | Daily WSE and discharge |
| LTRM water quality data | Water quality |
| USGS streamgages for daily and peak stage/discharge and water quality parameters | Peak stage/discharge and water quality |
| USGS StreamStats—estimates of streamflow for ungaged sites | Streamflow |
| Annual maximum rainfall—published values (NOAA Atlas 14, Illinois updated Bulletin 70) | Annual maximum rainfall |
| ADCP velocity measurements (for hydraulic model calibration) from MVR Water Quality Section E–-HQ, Excel/GIS shapefile format | Velocity |
| A recent report (Kerkhoff and others, 2021) used streamgage height (ft) and discharge (ft3/s) data obtained from USGS streamgage 05378500 in pool 6 and streamgage 05389500 in pool 10 to characterize the study environment. The data were obtained from the USGS NWIS database (https://waterdata.usgs.gov/nwis/%5d). The format was screenshots of graphs provided on the USGS website. | Streamgage height and discharge |
| Stage elevations are obtained from the USACE locks and dams. | Stage elevations |
| Streamflow and stage data from streamgages operated by the USGS, USACE, and States; graphs, CSV files, and so on | Streamflow and stage |
| USACE recurrence intervals. | USACE recurrence intervals |
| USACE and USGS discharge and WSE are available at daily or more frequent time scales and can be obtained and analyzed as HEC–DSS files, CSV, or spreadsheets | Discharge and WSE |
| Water exchange rates and WSE are measured by USACE staff as needed for projects. | Water exchange rates and WSE |
| Some from LTRM website for specifics (for example, 75% exceedance levels in GIS or viewer) | 75% exceedance levels |
| We use daily discharge data (tabulated) from USGS streamgages acquired through NWIS, annual peak flow data from DSS-Vue, and daily discharge data for duration analysis through HEC–SSP. We acquire monthly, watershed averaged, gridded precipitation data from the Minnesota State Climatology office (tabulated format). These data are derived from high-density statewide local monitoring program data along with other long-term precipitation streamgages. Additionally, PRISM gridded data are used for other analysis within an R scripted analysis package. | Daily discharge; annual peak flow; monthly, watershed averaged, gridded precipitation data; PRISM gridded data |
| USGS streamgages—stage, discharge | Stage, discharge |
| USACE Rivergages.com stage website (https://rivergages.mvr.usace.army.mil/WaterControl/new/layout.cfm) | Stage |
Question 2D.—If you use hydrologic data in your work, what spatial and (or) temporal scales do you use (for example, daily time steps, annual summaries, one streamgage location, multiple streamgages, 2-dimensional data)? Please be as descriptive as possible.
There is a wide diversity of spatial and temporal scales that are used when dealing with Upper Mississippi River System hydrologic data. This diversity reflects the variety of applications for which the data are being used and the diversity of hydrologic metrics analyzed. Compiled responses are listed in table 2.6 and are organized by topical relevance.
Table 2.6.
Responses to question 2D (If you use hydrologic data in your work, what spatial and [or] temporal scales do you use [for example, daily time steps, annual summaries, one streamgage location, multiple streamgages, two-dimensional data]? Please be as descriptive as possible.) submitted in September 2021. References to “current” or “existing” should therefore be interpreted in relation to this timeframe. Responses are minimally edited to retain original context.[HREP, Habitat Restoration and Enhancement Project; D, dimensional; LTRM, Long Term Resource Monitoring; UMESC, Upper Midwest Environmental Sciences Center; USACE, U.S. Army Corps of Engineers; USGS, U.S. Geological Survey; WSE, water surface elevation; WQ, water quality; <, less than; LD, lock and dam; MC, main channel; ADCP, acoustic Doppler current profiler; watershed, a term used to describe a drainage basin]
| Participant responses | Scale reference |
|---|---|
| Depending on the HREP location, objectives, and modeling extent, daily stage and discharge data are typically evaluated at the bounding upstream and downstream streamgages. | Bounding upstream and downstream streamgages |
| Mostly use a specific pool-level spatial scale (for example, pool 13), an annual temporal scale, and pool-specific streamgage data | Pool-level spatial scale; pool-specific streamgage data |
| We typically use this at the individual project scale for HREPs, but we need it systemically. | Individual project scale for HREPs; need it systemically |
| The previously mentioned report (Kerkhoff and others, 2021) used daily data collected during 2013–19 from two streamgages that spanned the upper and lower limits of the study area. | Two streamgages that spanned the upper and lower limits of the study area |
| We use all the examples provided in this question’s examples, as indicated by the long list we provided in response to the previous question. | All the examples provided in this question’s examples |
| Project scale (1–10 miles) to navigation pool scale (20–40 miles) | Project scale; navigation pool scale |
| Valleywide | Valleywide |
| Tributaries | Tributaries |
| 2D horizontal parameters are measured and modeled. | 2D |
| Assumption of vertical mixing is usually done, but winter thermal stratification is a consideration for backwater fish projects. Vertical sediment gradients are considered. | Backwater fish projects |
| Annual summaries, individual/multiple streamgages, 2D data for inundation/flood stage models | Individual/multiple streamgages, 2D data |
| LTRM—daily time steps, multiple streamgages | Multiple streamgages |
| We assess daily and annual values at a single streamgage location. When multiple streamgages are located within a watershed, we will assess them together. Adjacent watersheds may be used for comparative analyses as well, or when an ungaged watershed is assessed for resources planning. Comparing upstream to downstream streamgages is also valuable in assessing change dynamics within major watersheds to develop strategies. | Single streamgage location; multiple streamgages; upstream to downstream streamgages |
| For modeling purposes, UMESC aggregates information upward (for example, from daily to weekly, monthly, or yearly time scales). But it is important to start with the finest scale possible to allow for maximum flexibility. Daily time step, for every streamgage possible (USACE streamgages ideally but also USGS streamgages and major tributary streamgages). This information is then interpolated using some form of model to provide information between streamgages. If doing this “system wide” causes problems, perhaps pick a few pools (for example, key pools) to make it more manageable. Providing summaries/data for major tributaries that are between streamgages may also be important to consider. | Start with the finest scale possible; every streamgage possible |
| Generally, annual summaries at nearest streamgage locations to sampling areas | Streamgage locations |
| Daily time steps, streamgage locations dependent on sampling location | Streamgage locations |
| Generate exceedance probabilities (discharge and elevation), sometimes one streamgage but frequently multiple streamgages to interpolate WSE | One streamgage, multiple streamgages |
| Many uses of hydrologic data are to investigate WQ and biotic responses at scales <1,000 acres (quite often <10 acres); however, in most cases, hydrologic data used are limited to what is available at a pool or even reach scale (that is, now difficult to get discharge data from LD, so Winona discharge is used for a reach of pools instead of discharge from or into a pool). | Scales <1,000 acres; pool or even reach scale |
| Tool to look at lateral water surface elevation slope across floodplain MC to lateral backwaters (across a range of discharge values) | Across floodplain MC to lateral backwaters |
| Derive wetted perimeter and cross-sectional area | Wetted perimeter, cross-sectional area |
| Typically use period of record for one streamgage location | One streamgage location |
| Multiple streamgages as needed to cover the project area. | Multiple streamgages, project area |
| Up-to-date 3D bathymetry and topographic information | 3D |
| Depending on the HREP location, objectives, and modeling extent, daily stage and discharge data are typically evaluated at the bounding upstream and downstream streamgages. | Daily |
| Daily water surface elevation or daily discharge for duration analysis (planting elevations, water level management analysis) | Daily |
| Daily water surface elevation data, daily discharge data, and instantaneous ADCP velocity data for hydraulic model calibration (used to determine flow velocities) | Daily |
| Daily data are often used to develop annual or seasonal duration curves. | Daily |
| Discharge data (usually daily) | Daily |
| Stage data (usually daily) | Daily |
| Daily time steps, streamgage locations dependent on sampling location | Daily |
| Mostly use a specific pool-level spatial scale (for example, pool 13), an annual temporal scale, and pool-specific streamgage data | Annual |
| Typically use daily time step data | Daily |
| LTRM—daily time steps, multiple streamgages | Daily |
| The previously mentioned report (Kerkhoff and others, 2021) used daily data collected during 2013–19 from two streamgages that spanned the upper and lower limits of the study area. | Daily |
| Daily, growing season, to annual time scales are considered | Daily, growing season, annual |
| Seasonal discharge/stage trends | Seasonal |
| Annual summaries, individual/multiple streamgages, 2D data for inundation/flood stage models | Annual |
| We assess daily and annual values at a single streamgage location. When multiple streamgages are located within a watershed, we will assess them together. Adjacent watersheds may be used for comparative analyses as well, or when an ungaged watershed is assessed for resources planning. Comparing upstream to downstream streamgages is also valuable in assessing change dynamics within major watersheds to develop strategies. | Daily; annual |
| For modeling purposes, UMESC aggregates information upward (for example, from daily to weekly, monthly, or yearly time scales). But it is important to start with the finest scale possible to allow for maximum flexibility. Daily time step, for every streamgage possible (USACE streamgages ideally but also USGS streamgages and major tributary streamgages). This information is then interpolated using some form of model to provide information between streamgages. If doing this “system wide” causes problems, perhaps pick a few pools (for example, key pools) to make it more manageable. Providing summaries/data for major tributaries that are between streamgages may also be important to consider. | Daily, weekly, monthly, yearly; finest scale possible |
| Generally, annual summaries at nearest gauge locations to sampling areas | Annual |
| Annual maximum discharge data for flow frequency analysis (are relevant to floodplain analysis, inundation frequency analysis, overtopping frequency determinations) | Annual |
| Annual summaries | Annual |
| Hydrologic data usage ranges from daily to annual data, depending on the analysis/study. For example, assessment of backwater fisheries overwintering habitat often uses January–February hydrologic data, but aquatic vegetation investigations may use May–June if interest is in drivers affecting germination. However, June–August may be more appropriate for assessment of driver effect on aquatic vegetation growth. | From daily to annual; January–February, May–June, June–August |
| It would be useful to have a tool that could point to an area and generate summary information automatically. Tool should be able to accommodate user-defined time scales. | User-defined time scales |
| Typically use period of record for one streamgage location. | Period of record |
| We use all the examples provided in this question’s examples, as indicated by the long list we provided in response to the previous question. | All the examples provided in this question’s examples |
Section 3. Potential Uses of a Future Hydrologic Dataset
Question 3A.—How would a projected hydrologic dataset benefit your ability to accomplish your job?
Most responses described how a projected hydrologic dataset would benefit aspects of the HREP process, including project planning, cost analyses, design, project ranking, and siting. Other responses described the importance of a future hydrologic dataset to assess ecological responses to climate change, evaluation of strategic realty decisions, and advocation. Compiled responses are listed in table 2.7 and are organized by topical relevance.
Table 2.7.
Responses to question 3A (How would a projected hydrologic dataset benefit your ability to accomplish your job?) submitted in September 2021. References to “current” or “existing” should therefore be interpreted in relation to this timeframe. Responses are minimally edited to retain original context.[HREP, Habitat Restoration and Enhancement Project; USACE, U.S. Army Corps of Engineers; UMRR, Upper Mississippi River Restoration; FPMS, Floodplain Management Services; O&M, operations and maintenance; DQC, district quality control; ATR, agency technical review; watershed, a term used to describe a drainage basin; LTRM, Long Term Resource Monitoring; UMESC, Upper Midwest Environmental Sciences Center; WQ, water quality]
Question 3B.—To what extent would a future hydrologic dataset improve your decisions? What information is required to make a different decision?
Responses indicate a future hydrologic dataset would benefit the HREP and LTRM sides of the UMRR program’s partnership, as well as other activities carried out by partnering organizations (for example, communications, river management decisions, risk assessment). Some responses acknowledged that the benefit of any dataset would be weighed in part by its assumptions, certainty/uncertainty, accuracy and precision, confidence/trustworthiness, and interpretability. Compiled responses are listed in table 2.8 and are organized by general topic.
Table 2.8.
Responses to question 3B (To what extent would a future hydrologic dataset improve your decisions? What information is required to make a different decision?) submitted in September 2021. References to “current” or “existing” should therefore be interpreted in relation to this timeframe. Responses are minimally edited to retain original context. Referenced geographic features are not shown on a corresponding map.[HREP, Habitat Restoration and Enhancement Project; L&D, lock and dam; O&M, operations and maintenance; >, greater than; %, percent; watershed, a term used to describe a drainage basin; USACE, U.S. Army Corps of Engineers; UMESC, Upper Midwest Environmental Sciences Center; WQ, water quality]
Question 3C.—What level of certainty should a future hydrologic dataset have for it to be useful in your work?
Answers ranged widely, likely reflecting the difficulty in answering this question. Compiled responses are listed in table 2.9 and are organized into responses that offered numerical estimates, that were more descriptive, and that mentioned a way to convey certainty.
Table 2.9.
Responses to question 3C (What level of certainty should a future hydrologic dataset have for it to be useful in your work?) submitted in September 2021. Responses are minimally edited to retain original context. Referenced geographic features are not shown on a corresponding map.[%, percent; >, greater than; USACE, U.S. Army Corps of Engineers]
Question 3D.—How far into the future would you want to understand Upper Mississippi River System hydrology?
Most responses offered a specific period of interest, typically a 50- or 100-year period. Such responses tended to be linked to agency guidance of some kind (for example, HREP design life span, conservation, or management plans). Other responses were more descriptive and offered considerations for deciding an appropriate timeframe of projections (for example, considering the life span of species of interest, the degree of certainty/uncertainty of the projections, and trends in climate change). Compiled responses are listed in table 2.10 and are organized into responses referencing specific periods and responses offering descriptive insights.
Table 2.10.
Responses to question 3D (How far into the future would you want to understand Upper Mississippi River System hydrology?) submitted in September 2021. Responses are minimally edited to retain original context.[HREP, Habitat Restoration and Enhancement Project; --, no data or not applicable]
Question 3E.—What aspects of future hydrology are of most use for you (for example, discharge at lock/dam locations, monthly peak water surface elevation, annual average discharge, and so on)?
A river’s hydrologic regime can be described using several qualities including frequency, duration, timing, and magnitude (among others). For example, frequency may refer to the likelihood of certain flows in any given year, duration may capture the number of days a particular floodplain inundation event may last, timing may refer to the seasonality of flow conditions, and magnitude may refer to water depths or peak flows. Compiled responses are listed in table 2.11 and are organized by the quality of hydrologic regime to which the variables/criteria mentioned are most closely related, as interpreted to the best abilities of the meeting organizers.
Table 2.11.
Responses to question 3E (What aspects of future hydrology are of most use for you [for example, discharge at lock/dam locations, monthly peak water surface elevation, annual average discharge, and so on]?) submitted in September 2021. Responses are minimally edited to retain original context.[F, frequency; M, magnitude; lidar, light detection and ranging; D, duration (length of time); T, timing (seasonality); O, other; WSE, water surface elevation; watershed, a term used to describe a drainage basin; DO, dissolved oxygen]
Question 3F.—What spatial and temporal scales should a future hydrologic dataset be in order to be useful for your work? Are they the same as you currently use, or are there other scales of interest?
There is a wide diversity of spatial and temporal scales that may be of interest for a future Upper Mississippi River System hydrologic dataset. This diversity reflects the variety of applications the data could be used for and the diversity of hydrologic metrics that could be analyzed. Compiled responses are listed in table 2.12 and are organized by topical relevance. Some responses are included in both topic areas.
Table 2.12.
Responses to question 3F (What spatial and temporal scales should a future hydrologic dataset be in order to be useful for your work? Are they the same as you currently use, or are there other scales of interest?) submitted in September 2021. References to “current” or “existing” should therefore be interpreted in relation to this timeframe. Responses are minimally edited to retain original context. Referenced geographic features are not shown on a corresponding map.[HREP, Habitat Restoration and Enhancement Project; HUC, hydrologic unit code; watershed, a term used to describe a drainage basin; USGS, U.S. Geological Survey; WSE, water surface elevation]
Part 2. Brainstorming Uses for an Upper Mississippi River System Future Hydrologic dataset
The purpose of this exercise was to collect specific ideas about the utility of an Upper Mississippi River System future hydrologic dataset. For example, what kinds of projects would benefit from researchers knowing something about future hydrology? What kinds of questions would you like to be able to answer with a future hydrologic dataset? Participants were invited to consider how a climate-changed hydrologic dataset for the Upper Mississippi River System might be useful for carrying out the UMRR program’s mission and to brainstorm particular situations, decision points, research projects, or other activities that might benefit from a knowledge of future hydrologic conditions. Compiled responses submitted by participants in September 2021 are listed in table 2.13.
Table 2.13.
Compiled responses describing what projects, research, or other work may benefit from a climate-changed hydrologic dataset for the Upper Mississippi River System. Responses were submitted in September 2021. References to “current” or “existing” should therefore be interpreted in relation to this timeframe. Responses are minimally edited to retain original context. Referenced geographic features are not shown on a corresponding map.[%, percent; --, no data or not applicable; HREP, Habitat Restoration and Enhancement; cm/s, centimeter per second; <, less than; SAV, submerged aquatic vegetation; ft, foot; >, greater than; RCG, reed canary grass; XXX, a generic example; UMRR, Upper Mississippi River Restoration program; DO, dissolved oxygen; NWR, National Wildlife Refuge; C, degree Celsius]
| Location List project location/geographic scope |
Project goal(s) Describe the project’s goal, objective, and (or) purpose(s) |
Example question(s) that should be answered List questions that the project should answer upon completion |
Other thoughts |
|---|---|---|---|
| Beaver Island | Island building/restoration through chevron/bullnose dike construction—crest of structure recommended to be overtopped 30% of the time | How will the 30% annual exceedance duration flow/water surface elevation change under future hydrology? | -- |
| Beaver/Steamboat Island | Mussel habitat | How does bed shear stress change in areas with existing mussel habitat under future hydrology? | -- |
| Huron Island, Beaver Island, Steamboat Island (various overwintering habitat HREPs) | Create overwintering habitat by ensuring overwintering velocities are less than 1 cm/s. | How high must closure structures be built to eliminate flow to overwintering areas during the overwintering period and maintain velocities <1 cm/s? | -- |
| Lower pool 13 HREP | Still being finalized but currently include maintaining and enhancing the distribution and abundance of wild celery in the impounded area | What discharge range should be considered in determining the designing and location of the physical structures to be constructed or rehabilitated? | A key factor for the project is creating acceptable flow conditions for wild celery. The dimensions and locations of the physical structure that will modify flows, depend on knowing the range of flows likely to be experienced. |
| Lower pool 13 HREP | Improve water clarity to maintain and enhance aquatic vegetation, benefitting migratory waterfowl. | How will SAV in lower pool 13 change 50 years from now under a climate-changed hydrology? | This could be important information for our closed areas and other waterfowl (that is, canvasbacks [Aythya valisineria]) areas. This could apply to many HREPs. |
| Lower pool 13 water level management (feasibility stage) | Protect and improve emergent aquatic vegetation in the project area. | Can a 30-day, 1-ft drawdown at lock and dam 13 be implemented at least 1 in 5 years? | Maximum flow for which water level management can be implemented is controlled by the lock and dam 13 structure. Minimum flow for which water level management can be implemented is controlled by the navigation authority requirement to maintain a 9-ft navigation channel. Climate change will not affect the mechanics of how water level management is implemented, but it may affect how often implementation of a drawdown is possible—and therefore, project success. |
| Lower pool 13 southwest corner (feasibility stage) | Protect and improve submergent aquatic vegetation in the project area. | How can built features improve velocities and turbidity (background and wind-wave driven) in the lower pool 13 southwest corner to be more ideal for submergent vegetation? | Parsing out the effects and relations of hydrology, wind-driven waves, turbidity, and submergent vegetation growth has proven difficult. Shifts in future hydrology add another layer of complexity to this feasibility study. |
| Huron Island, Beaver Island, Steamboat Island (various floodplain forest HREPs) | Floodplain forest restoration using topographic diversity | How high must we plant floodplain forest species with minimal flood tolerance to ensure they are only wet >25 days during the growing season 1 time per 4 years? | Different floodplain forest species have different vulnerabilities to climate change (that is, thresholds/ranges for success). Scrub shrub may be more vulnerable to drought compared to hard mast trees that can withstand low water. |
| Black River Bottoms HREP, pool 8 HREP, maybe pool 12 HREP | Maintain and enhance existing forest habitat, reestablish forest in areas where it has been converted to RCG, raise floodplain elevation in low RCG patches to establish forest, improve wet meadow habitat | How many acres of forest will be lost to hydrophication in the next 50 years and where? To which elevation should the project target topographic enhancements to mitigate conversion to RCG? Can we predict a future change in depth to groundwater during various time steps? How/where will future hydrologic conditions affect priority wet meadow communities? | Any predictive services that can be rendered to model how much and where forest mortality is caused by hydrophication would be a benefit to any Upper Mississippi River System forest project; pool 12 HREP may be too far along in the planning, but pool 8 and the Black River Bottoms project are still a few years out. Wet meadow and forest habitat enhancement features may have a limited footprint, and prioritization will be feasible with an improved hydrologic dataset. |
| XXX HREP | Restore flows throughout complex. | How will flows change over 50 years? What scenarios might result in reduced flows or increased flows? | Riverine conditions for mussels and fish |
| XXX HREP | Improve waterfowl habitat by increasing the coverage of submersed, rooted floating-leaved, and emergent aquatic vegetation. | In 50 years, where will hydrodynamic conditions be conducive for the maintenance, establishment/expansion of diverse aquatic vegetation beds? | This could be important information for our closed areas and other waterfowl (that is, canvasbacks) areas. |
| Harpers Slough, Capoli, pool 8 islands, Ambrough Slough, and so on | Establish fish overwintering sites. | How long will it take for sedimentation to fill in sites that have been dredged for overwintering? | Can such sites be designed to self-maintain (scour) under high flows? |
| Peterson Lake (pool 4) HREP/modifications | Monitor effectiveness of HREP modifications as per stated objectives (increased overwinter fish habitat) under various discharge regimes. | What is the amount of suitable overwintering habitat during various discharge regimes (for example, low, moderate, high)? | -- |
| Open river | Maintain connectivity to side channels and backwaters. | Do extreme low flows become more common? How will this affect connectivity of side channels and backwaters in the open river? Is loss of connectivity for extended duration? | Interested in magnitude of low flows, duration of low flows, and frequency of low flows. |
| Upper Mississippi River System—systemwide | Provide current and future floodplain inundation mapping resources to natural resource managers and communities on the Upper Mississippi River System. | What are the probability and duration of floodplain inundation along the Upper Mississippi River System, now and in the future? Can this information be compiled into an interactive standardized format for use in determining appropriate and resilient locations for habitat restoration? | Ideally, this would be an interactive mapping layer that could be related to streamgages along the Upper Mississippi River. Elevation data should be standardized. The probability (frequency) of various flood levels now and in the future could be delineated on the map, as well as average number of days during growing season. Habitat restoration emphasis but could benefit communities as well. Similar to https://fim.wim.usgs.gov/fim/ but with future projections and aspects specific to restoration decisions. |
| Regional waterfowl habitat conservation planning | Quantify where waterfowl food resources are or will be available in the Upper Mississippi River System during the fall and spring migration. | How will changing ice cover affect waterfowl use of staging and wintering habitats used in the fall, during the winter, and in the spring? | In many, perhaps most, of the refuges and wildlife management areas of the Upper Mississippi River System, waterfowl use the habitats in the fall as a staging area where they feed, rest, and gain weight before continuing their migration to wintering areas farther south or east. The waterfowl foods that were not consumed in the fall are available for consumption in the spring. If ice cover develops later in the fall/winter, waterfowl may stage for longer periods before departing to their wintering grounds, which may result in less food being available in the spring. If ice cover fails to develop, waterfowl may stay throughout the winter, which would result in even more food being consumed before the spring migration. |
| Upper Mississippi River System—systemwide | Develop a framework in which HREP benefits are quantified in terms of ecosystem services as related to hydrology. | What is the value (monetary or nonmonetary) of HREPs (individual or collectively) to the human population in terms of flood risk management, water treatment, recreation, and so on? | Demonstrating the long-term value of the UMRR in ways other than habitat units will enhance support for the program. |
| Upper Mississippi River System—systemwide | Assess the vulnerability various cool water fish species (particularly walleye (Sander vitreus) and northern pike (Esox lucius) for recreational commercial importance). | How often and for what duration are water temperatures expected to exceed incipient lethal temperatures for these species? Under what future scenario does this occur? Where is this expected to happen within the Upper Mississippi River System? | Water temperature, duration, and timing of predicted peaks in water temperature |
| Upper Mississippi River System—systemwide | Assess the effect of various flow regimes on fish species in the Upper Mississippi River System. This will allow better integration of predicted flow data with population dynamics and vital rates of Upper Mississippi River System fish species. | Are there critical flow periods for the species? How do changes in flow/temperature affect growth, reproduction, mortality, and so on for each species? | Water temperature, duration, magnitude, and timing of predicted peaks in water temperature and flow data |
| Upper Mississippi River System—systemwide | Better understanding of where, and at what rates, the geomorphology of the Upper Mississippi River System is changing | How should currently observable locations and rates of change be expected to change in response to a changing hydrograph? | -- |
| Backwater residence time—various projects | Characterize backwater residence time for all backwater areas greater than 3 acres. | Is measured residence time likely to result in the correct mix of temperature/DO for backwater fish in the summer and winter months? How will measured residence time affect zooplankton production, cyanobacteria production, walleye (and other fish species) production? How is changing residence time altering backwater sedimentation patterns? | Future projection of how backwater residence time will change in the next 50 years is needed. Which backwaters have higher potential to be maintained and which will we have to walk away from? Which areas could benefit from a project to target optimal water exchange (residence time)? |
| Link between altered hydrology and backwater health (flushing, sedimentation, productivity, fisheries recruitment) | Characterize linkage between elevated discharge and backwater sedimentation, flushing, and rates of productivity. | Make linkage between projected hydrology and future backwater conditions (flushing rate, primary, secondary and fisheries production)? | It is clear we are in trouble. How bad will conditions become? What species/biotic guilds are likely to be winners and losers under future projections? |
| Forest loss projections | Characterize where and when we are likely to lose forest. | It is clear we will have to tolerate some level of forest loss. Which areas can be protected and are worth the resources to protect? | We need to know where it is sensible to use our finite resources. |
| Navigation channel maintenance | Characterize how much sediment will be generated to maintain the navigation channel and increases in outflows from main channel. | How quickly will problem areas develop under future hydrologic scenarios? | Again, how bad will this get? Is the current trajectory sustainable? What are the predicted lock closures related to high and low river levels and frequency of these closures? |
| Island loss | Determine where islands will be lost and at what rate. | Where will islands be lost? Which ones should be saved, and where should new ones be established or reestablished? | -- |
| Breaches in natural levees | Breaches in natural levees are causing significant damage to quiescent backwater habitat. Characterize when, where, and rate at which this is happening. | Where are breaches in natural levees likely and how quickly do they accumulate enough flow to cause changes in residence time, sedimentation patterns, or main channel competency? | These seem to be happening with increasing frequency under the high-discharge climate-change era. The cost benefit of correcting (and preventing) these breaches is very high. |
| Cyanobacteria/cyanotoxin | Certain areas effectively leveed off from the river are unable to be operated efficiently during the current high-discharge era (for example, Trempealeau NWR). | What areas similar to Trempealeau NWR would benefit from reconnection to the river from a cyanobacteria/cyanotoxin production standpoint? | Some in the north, but many of these areas would be quite far south. |
| Climate consequences | To what degree would maximum temperatures and days >20 C change? | Water temperature increase will also magnify cyanobacteria/cyanotoxin problems. | |
| Future discharge and water surface elevation projections | Characterize what discharge and water surface elevation will look like in 50 years. | How will discharge and water surface elevation look in 50 years (timing, duration, frequency, and associated sediment load)? | We need some reasonable projections if they are likely accurate enough to be useful. We will need this to account for island design heights and other habitat project variables. If this is unknowable, we need to state this. Inaccurate projections could do more harm than good. |
| Assessing vulnerability of aquatic vegetation—Upper Impounded Reach | Assess the vulnerability of aquatic vegetation to changes in water levels, discharge, temperature associated with climate change. Predict the spatial distribution of aquatic vegetation under different hydrologic conditions (State changes, community changes, biomass changes). | Are there hydrologic thresholds or certain scenarios where aquatic vegetation habitat is more at risk of degradation? Thresholds that cause ecological shifts and (or) community changes? | Increased frequency and duration of high water decreases the light availability for aquatic plants and reduces the band of elevations suitable for submersed vegetation. Yin’s model uses growing season daily water level. It is important to be able to predict changes in aquatic vegetation communities/ecological states (for example, migrating waterfowl populations depend on this resource). |
| Assessing vulnerability of aquatic fish | Assess the vulnerability of various fish species to changes in water levels, discharge, temperature associated with climate change. | What species are likely to become imperiled under likely future hydrologic scenarios? | It is important to be able to predict changes in the fish community under future hydrologic/climate conditions. |
| Assessing vulnerability of mussels | Assess vulnerability of mussels to changes in water temperature, discharge, and so on. | Combine hydrology with life history thresholds and pathogens | It is important to be able to predict changes in the mussel community under future hydrologic/climate conditions. |
References Cited
Angel, J.R., and Markus, M., 2019, Frequency distributions of heavy precipitation in Illinois—Updated Bulletin 70: Illinois State Water Survey, 70 p., accessed June 16, 2025, at http://hdl.handle.net/2142/103172.
Bonnin, G.M., Martin, D., Lin, B., Parzybok, T., Yekta, M., and Riley, D., 2006, Precipitation-frequency atlas of the United States: Silver Spring, Md. National Weather Service, National Oceanic and Atmospheric Administration Atlas 14, v. 2, ver. 3.0, 295 p., accessed June 11, 2025, at https://www.weather.gov/media/owp/oh/hdsc/docs/Atlas14_Volume2.pdf.
Kerkhoff, J., Xiong, J., Peterson, E., Hygnstrom, S., Winter, S., Jackson, D., and Griffin, M., 2021, Final report, chapter 1—Odonata surveys in pools 5A–10 of the Upper Mississippi River, 2013–2018: Chaseburg, Wis., Upper Mississippi River National Wildlife and Fish Refuge, 29 p., accessed June 12, 2025, at https://iris.fws.gov/APPS/ServCat/DownloadFile/202833.
Perica, S., Martin, D., Pavlovic, S., Roy, I., St. Laurent, M., Trypaluk, C., Unruh, D., Yekta, M., and Bonnin, G., 2013, Precipitation-frequency atlas of the United States: Silver Spring, Md. National Weather Service, National Oceanic and Atmospheric Administration Atlas 14, v. 8, ver. 2.0, 289 p., accessed June 11, 2025, at https://www.weather.gov/media/owp/oh/hdsc/docs/Atlas14_Volume8.pdf.
Appendix 3. Meeting 1 Agenda and Outcomes

Agenda for meeting 1 (2-day meeting held on September 21 and 23, 2021).
Table 3.1.
Unranked, complete list of Upper Mississippi River Restoration program needs for understanding future hydrology generated by five working groups at meeting 1. Needs listed are minimally edited to retain original context and are in no particular order.[UMRR, Upper Mississippi River Restoration program; H&H, hydrology and hydraulics; WQ, water quality; HREP, Habitat Restoration and Enhancement; LTRM, Long Term Resource Monitoring; DQC, district quality control; ATR, agency technical review; O&M, operations and maintenance; HEC–RAS, Hydrologic Engineering Center-River Analysis System]
Table 3.2.
Unranked, complete list of potential ranking criteria generated by five working groups at meeting 1. Needs listed are minimally edited to retain original context and are in no particular order.[UMRR, Upper Mississippi River Restoration; US, upstream; DS, downstream; PDT, project delivery team; WQ, water quality; HREP, Habitat Restoration and Enhancement]
Table 3.3.
Results of live polling (via https://www.polleverywhere.com/) to identify criteria by which to rank Upper Mississippi River Restoration program needs. Criteria listed are minimally edited to retain original context of the criteria presented to voters in https://www.polleverywhere.com/.[UMRR, Upper Mississippi River Restoration program]
Appendix 4. Meeting 2 Agenda and Outcomes

Agenda for meeting 2 (2-day meeting held on November 1 and 2, 2021).
Table 4.1.
Ranked list of geomorphology needs and hydrologic characteristics for the theme’s top three priority needs. The list reflects participant responses to the question, “What are the characteristics of a future hydrologic dataset necessary in order to meet the stated geomorphology needs?” Responses are minimally edited to retain original context, and referenced geographic features are not shown on a corresponding map.[IL-R, Illinois River; USACE, U.S. Army Corps of Engineers; USGS, U.S. Geological Survey; LOCA, LOcalized Constructed Analogs; no., number; GCM, global climate model; RCP, representative concentration pathway; TSS, total suspended solids; NGWOS, next generational water observing system; CoP, community of practice; ppt, precipitation; LCR, Little Colorado River]
| Rank | Geomorphology needs | Temporal resolution | Spatial resolution | Hydrologic metrics | Approach for evaluating future | Notes | |||
|---|---|---|---|---|---|---|---|---|---|
| Time steps | Time span | Location of desired data | Flow metrics | Flood metrics | Other metrics | ||||
| 1 | To understand how future hydrology may affect geomorphic responses (for example, island loss, natural levees) in channels, shorelines, backwaters and floodplains | Input data at a daily time step. The conclusions (output) will be made at an annual and seasonal time step for these features for large scale geomorphic features. | (2020–70) 50 years from when planning was done | Upper Mississippi River from Anoka to above the Ohio River and IL-R. Reach scale is resolution. For specific features, we would need data at the scale of the feature. Predict subpool scale in 50-year life of project. USACE and USGS streamgage locations (LOCA currently available at 14-square-mile scale) | Annual peak discharge, flow duration curves, velocity | Flood frequency analysis, duration, depth, velocity, flow duration curves | Shear stress, water surface slope between streamgages. Sediment mobility and vegetation (see Geomorphology Needs no. 5 in table 2); change in ice effects | Climate change scenario study, outputs would be input for the geomorphic study | (Hydraulic model to generate velocity) Look at what is sensitive first. Where inputs cause effects. Sensitivity guides in-depth modeling needs. Identify areas that will be stressed first (for example, island loss) so that even if you do not know how the hydrology will change they will indicate effects earliest. Consider continuing result of channel training structures. |
| 2 | To understand how natural geomorphic features and navigation infrastructure affect the conveyance of water across the river floodplain | Input data are needed at a daily time step. The conclusions (output) will be made at annual and seasonal time steps for these features for large-scale geomorphic features. | (2020–70) 50 years from when planning was done | Upper Mississippi River from Anoka to above the Ohio River and IL-R. Reach scale is resolution. For specific features, we would need data at the scale of the feature. Predict subpool scale in 50-year life of project. USACE and USGS streamgage locations (LOCA currently available at 14-square-mile scale) | Annual peak discharge, water surface elevations, flow duration | Flood frequency analysis, duration, depth, flow duration curves | -- | Climate change scenario study, outputs would be input for the geomorphic study. Including temperatures (LOCA daily; different GCM and RCP) | Inputs are the same but asking different questions of the model. This is just hydraulics instead of geomorphology. Baseline interactions of features with the conveyance, regardless of future or historical climate. What if we doubled the frequency of a flood? Thought experiment—If there were information, what would we need to know to interpret effect on landscape? Low-flow management will vary up and downstream on the river. Extreme highs will affect sediment mobilization. |
| 3 | To assess how changing hydrology may affect backwater sedimentation in the Mississippi and Illinois Rivers | Input data are needed at a daily time step. The conclusions (output) will be made at annual and seasonal time steps for these features for large-scale geomorphic features. | (2020–70) 50 years from when planning was done | Linking data at streamgages with residence time and other changes in the backwaters | Annual peak discharge, water surface elevations, flow duration, TSS | When is the flood happening, how many in a year? Rate of rise and fall? May be inferred from increases in variance | Sedimentation rates, snow to rain shift, timing of ice- out conditions, thaw effects on sediment delivery, response to rain on snow, winter rain events | -- | How much do we know about current sedimentation rate? Is there a sediment budget analysis? Some scaled up to backwater scale. There is work to be done on sediment source tracking. For example, part of NGWOS program. Will be related to vegetation on land and delivery of sediment to backwater areas. Have climate models been used to drive sediment transport and delivery models? The CoP can provide ppt and hydrology information to drive the local models on these issues. There can be a difference from using precipitation data. USGS and Eric Grossman has done some related research in the Skagit River and lower Columbia River. |
Table 4.2.
Ranked list of Habitat Restoration and Enhancement Project (HREP) and management decision needs and hydrologic characteristics for the theme’s top three priority needs. The list reflects responses to the question, “What are the characteristics of a future hydrologic dataset necessary in order to meet the stated HREP and management decision needs?” Responses are minimally edited to retain original context.[WSE, water surface elevation; RCP, representative concentration pathway; USGS, U.S. Geological Survey; USACE, U.S. Army Corps of Engineers; Q, discharge; MVP, St. Paul District, U.S. Army Corps of Engineers; --, no response was generated; 1D/2D, one dimensional/two dimensional; <, less than; LOCA, LOcalized Constructed Analogs; VIC, Variable Infiltration Capacity; SAV, submerged aquatic vegetation; LTRM, Long Term Resource Monitoring; MACA, multivariate adaptive constructed analogs]
Table 4.3.
Ranked list of ecology needs and hydrologic characteristics for the theme’s top three priority needs. The list reflects responses to the question, “What are the characteristics of a future hydrologic dataset necessary in order to meet the stated ecology needs?” Responses are minimally edited to retain original context, and referenced geographic features are not shown on a corresponding map.[--, no response was generated; ~, about; watershed, a term used to describe a drainage basin; VIC, Variable Infiltration Capacity; O&M, operations and maintenance]
Appendix 5. Meeting 3 Agenda and Outcomes

Agenda for meeting 3 (4-day meeting held on January 18, 19, 26, and 27, 2022). [U.S. Army Corps of Engineers Engineering and Construction Bulletin 2018–14 refers to “Guidelines for Incorporating Climate Change Impacts to Inland Hydrology in Civil Works Studies, Designs, and Projects” (U.S. Army Corps of Engineers, 2018)]

Initial draft of workflow for evaluating the LOcalized Constructed Analogs- (LOCA-) Variable Infiltration Capacity- (VIC-) mizuRoute dataset that was revised and discussed on day 1 of meeting 3. The final workflow is shown in figure 6 of the main report. [USACE, U.S. Army Corps of Engineers; ECB, engineering and construction bulletins; CHAT, Climate Hydrology Assessment Tool]
Reference Cited
U.S. Army Corps of Engineers, 2018, Guidance for incorporating climate change impacts to inland hydrology in civil works studies, designs, and projects (revision 2): U.S. Army Corps of Engineers Engineering and Construction Bulletin 2018–14, 15 p., accessed June 12, 2025, at https://www.wbdg.org/FFC/ARMYCOE/COEECB/ARCHIVES/ecb_2018_14_rev_2.pdf.
Conversion Factors
U.S. customary units to International System of Units
Supplemental Information
Radiative forcing from greenhouse gas emissions is given in watts per square meter (W/m2).
Abbreviations
CHAT
Climate Hydrology Assessment Tool
CPR CoP
Climate Preparedness and Resiliency Community of Practice
HREP
Habitat Restoration and Enhancement Project
HUC
hydrologic unit code
LOCA
LOcalized Constructed Analogs
LTRM
Long Term Resource Monitoring
PI
principal investigator
RCP
representative concentration pathway
UMRR
Upper Mississippi River Restoration
USACE
U.S. Army Corps of Engineers
USGS
U.S. Geological Survey
VIC
Variable Infiltration Capacity
For more information about this publication, contact:
Director, USGS Upper Midwest Environmental Sciences Center
2630 Fanta Reed Road
La Crosse, Wisconsin 54603
608–783–6451
For additional information, visit: https://www.usgs.gov/centers/umesc
Publishing support provided by the
Rolla, Lafayette, and Reston Publishing Service Centers
Disclaimers
Any use of trade, firm, or product names is for descriptive purposes only and does not imply endorsement by the U.S. Government.
Although this information product, for the most part, is in the public domain, it also may contain copyrighted materials as noted in the text. Permission to reproduce copyrighted items must be secured from the copyright owner.
Suggested Citation
Van Appledorn, M., and Sawyer, L., 2025, Upper Mississippi River Restoration future hydrology meeting series: U.S. Geological Survey Open-File Report 2025–1050, 93 p., https://doi.org/10.3133/ofr20251050.
ISSN: 2331-1258 (online)
Study Area
| Publication type | Report |
|---|---|
| Publication Subtype | USGS Numbered Series |
| Title | Upper Mississippi River Restoration future hydrology meeting series |
| Series title | Open-File Report |
| Series number | 2025-1050 |
| DOI | 10.3133/ofr20251050 |
| Publication Date | September 22, 2025 |
| Year Published | 2025 |
| Language | English |
| Publisher | U.S. Geological Survey |
| Publisher location | Reston, VA |
| Contributing office(s) | Upper Midwest Environmental Sciences Center |
| Description | vii, 93 p. |
| Country | United States |
| State | Illinois, Iowa, Minnesota, Missouri, Wisconsin |
| Other Geospatial | Upper Mississippi River system |
| Online Only (Y/N) | Y |
| Additional Online Files (Y/N) | N |