

Report of the River Master of the Delaware River for the Period December 1, 2017–November 30, 2018
Links
- Document: Report (16.1 MB pdf) , HTML , XML
- Download citation as: RIS | Dublin Core
Acknowledgments
The Office of the Delaware River Master’s (ODRM) daily operation records were prepared from hydrologic data collected daily. Data for these records were collected and computed by the ODRM or provided by the following agencies and utilities. Data for streamflow of the Delaware River at Montague, New Jersey, and other locations and tributaries were provided by the U.S. Geological Survey (USGS). The New York City Department of Environmental Protection provided data for the Pepacton, Cannonsville, and Neversink Reservoirs. Brookfield Renewable U.S. provided data for Lake Wallenpaupack. Eagle Creek Renewable Energy, LLC, provided data for Rio Reservoir. The National Weather Service offices in Binghamton, New York, and State College, Pennsylvania, provided quantitative precipitation forecasts and some precipitation data. Darwin Ockerman of the USGS assisted and contributed to this report by collecting and organizing data.
River Master Letter of Transmittal and Special Report
Office of the Delaware River Master
U.S. Geological Survey
415 National Center
Reston, VA 20192
August 6, 2025
The Honorable
John G. Roberts, Jr.
Chief Justice of the United States
The Honorable
Matt Meyer
Governor of Delaware
The Honorable
Phil Murphy
Governor of New Jersey
The Honorable
Kathy Hochul
Governor of New York
The Honorable
Josh Shapiro
Governor of Pennsylvania
The Honorable
Eric Adams
Mayor of the City of New York
No. 5, Original—October Term, 1950
State of New Jersey, Complainant,
v.
State of New York and City of New York, Defendants,
Commonwealth of Pennsylvania and State of Delaware, Intervenors.
To the Chief Justice of the United States:
For the record, and in compliance with the provisions of the Amended Decree of the Supreme Court of the United States entered June 7, 1954, I hereby transmit the 65th Annual Report of the River Master of the Delaware River for December 1, 2017, to November 30, 2018. In this report, this period is referred to as the River Master “report year.”
During the 2018 River Master report year, monthly precipitation in the upper Delaware River Basin ranged from 46 percent of the long-term average in December 2018 to 231 percent of the long-term average in August 2018. Precipitation from December to May, when reservoirs typically refill, was 20.51 inches. Precipitation was below normal in December, March, April, May, and June and above normal in the other 7 months.
When the report year began on December 1, 2017, combined useable storage in the New York City reservoirs in the upper Delaware River Basin was 193.230 billion gallons or 71.3 percent of combined storage capacity. Combined storage in Pepacton, Cannonsville, and Neversink Reservoirs decreased in January 2018 and rose to more than 80 percent of combined usable storage in February, remaining above that level through November 2018. The combined usable storage was 264.292 billion gallons at the end of the report year on November 30, 2018.
Throughout the report year, River Master operations were conducted as stipulated by the Decree and the 2017 Flexible Flow Management Program (FFMP2017) through the U.S. Geological Survey (USGS) Office of the Delaware River Master (ODRM) located at Milford, Pennsylvania (Pa.). Kendra Russell, Deputy Delaware River Master, was in charge of the office, assisted by Vincent DiFrenna, hydrologist.
Shortly after the Decree was issued, the River Master established the River Master Advisory Committee (Advisory Committee), which consisted of principal representatives of the Decree Parties to provide advice and counsel regarding River Master operations. During the report year, the following individuals served as members of the Advisory Committee:
During the year, the Deputy River Master participated in two rounds of meetings with individual Advisory Committee members and staff of the Delaware River Basin Commission (DRBC) to introduce new staff and discuss a proposed ODRM 5-year plan of operations. On July 16, 2018, the full Advisory Committee met at New York City construction facilities in Marlborough, New York (N.Y.), with the River Master, Deputy River Master, and staff of the DRBC to discuss the newly drafted 5-year plan and to formulate plans for conducting studies identified in the FFMP2017. The Deputy Delaware River Master also met periodically with representatives of the Decree Parties as a member of the Decree Parties’ Work Group and the DRBC’s Regulated Flow Advisory Committee.
During the year, the ODRM continued the weekly distribution of a summary hydrologic report. These reports contain provisional data on precipitation in the upper Delaware River Basin, releases and spills from New York City reservoirs to the Delaware River, diversions to the New York City water-supply system, reservoir contents, daily segregation of flow of the Delaware River at the USGS Montague, New Jersey, streamgage, and diversions by New Jersey. The reports were distributed to members of the Advisory Committee and other parties interested in ODRM operations. A monthly summary of hydrologic conditions was also provided to Advisory Committee members. The weekly hydrologic reports are available through the ODRM website (https://webapps.usgs.gov/odrm/data/data.html).
The first section of this report documents ODRM operations during the report year. During the year, New York City diverted 166.862 billion gallons from the Delaware River Basin and released 306.379 billion gallons from Pepacton, Cannonsville, and Neversink Reservoirs to the Delaware River. A total of 80.566 billion gallons was spilled from the Pepacton, Cannonsville, and Neversink Reservoirs. The ODRM directed releases from these reservoirs to the Delaware River that totaled 8.024 billion gallons.
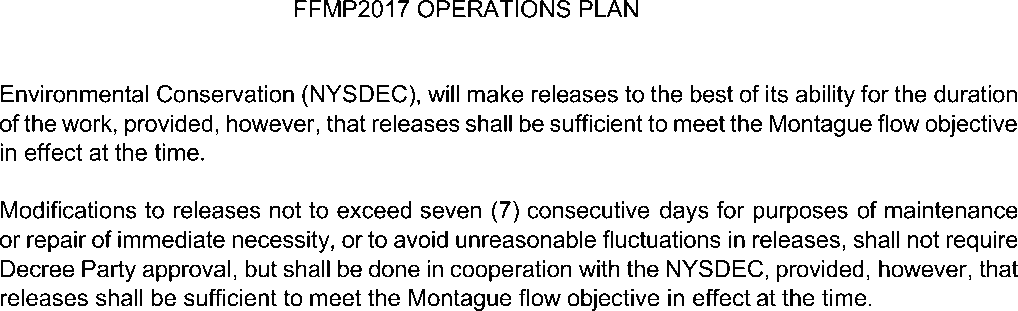
Throughout the year, diversions to New York City’s water-supply system and releases designed to maintain the flow of the Delaware River at the Montague site were made as directed by the ODRM. Diversions by New York City from its reservoirs in the Delaware River Basin did not exceed the limits stipulated by the Decree. Diversions by New Jersey were also within stipulated limits.
The ODRM’s daily operation records were prepared from hydrologic data collected daily. Data for these records were collected and computed by the ODRM or were furnished by the following agencies and utilities: (1) data for streamflow of the Delaware River at Montague, New Jersey, by the USGS New Jersey Water Science Center (WSC) and for other locations and tributaries by the USGS New York and Pennsylvania WSCs; (2) data for Pepacton, Cannonsville, and Neversink Reservoirs by the New York City Department of Environmental Protection (NYCDEP), Bureau of Water Supply; (3) data for Lake Wallenpaupack by Brookfield Renewable U.S.; and (4) data for Rio Reservoir by Eagle Creek Renewable Energy, LLC, including plans for power generation and furnishing data on reservoir releases and elevations. The National Weather Service offices in Binghamton, N.Y., and State College, Pa., provided quantitative precipitation forecasts and some precipitation data. The River Master and staff are grateful for the continued cooperation and support of the Decree Parties and these agencies and utilities.
Sincerely yours,
/Signed/
Joseph P. Nielsen
Acting Delaware River Master
Executive Summary
A Decree of the Supreme Court of the United States entered June 7, 1954 (New Jersey v. New York, 347 U.S. 995), established the position of Delaware River Master within the U.S. Geological Survey. In addition, the Decree authorizes the diversion of water from the Delaware River Basin and requires that compensating releases from certain reservoirs owned by New York City be made under the supervision and direction of the River Master. The Decree stipulates that the River Master provide reports to the Court, not less frequently than annually. This report is the 65th annual report of the River Master of the Delaware River. The report covers the 2018 River Master report year, from December 1, 2017, to November 30, 2018.
During the report year, precipitation in the upper Delaware River Basin was 60.39 inches or 136 percent of the long-term average. On December 1, 2017, combined useable storage in the New York City reservoirs in the upper Delaware River Basin was 193.230 billion gallons or 71.3 percent of the combined useable storage capacity of 270.837 billion gallons. The reservoirs had a usable capacity of 99.5 percent on May 31, 2018. Combined storage remained high (above 80 percent combined capacity) and did not decline below 80 percent of combined capacity through November 30, 2018. River Master operations during the year were conducted as stipulated by the Decree and the Flexible Flow Management Program.
Diversions from the Delaware River Basin by New York City and New Jersey fully complied with the Decree. Reservoir releases were made as directed by the River Master at rates designed to meet the flow objective for the Delaware River at Montague, New Jersey, on 42 days during the report year. Interim Excess Release Quantity banks and conservation releases, designed to relieve thermal stress and protect the fishery and aquatic habitat in the tailwaters of the reservoirs, were also made during the report year.
Introduction
An Amended Decree of the Supreme Court of the United States entered June 7, 1954 (New Jersey v. New York, 347 U.S. 995; available at https://webapps.usgs.gov/odrm/about/decree), authorizes diversion of water from the Delaware River Basin and provides for releases of water from three New York City reservoirs—Pepacton, Cannonsville, and Neversink—to the upper Delaware River. The Decree stipulates that these diversions and releases be made under the supervision and direction of the Office of the Delaware River Master (ODRM). The Decree also stipulates that reports on Delaware River operations be made to the Court not less frequently than annually. The reports can be accessed at https://webapps.usgs.gov/odrm/publications/publications.
This report documents operations of the ODRM from December 1, 2017, to November 30, 2018, or the 2018 River Master report year, hereafter referred to as the “report year.” The ODRM operations were guided by a Flexible Flow Management Program (FFMP) signed by all of the Decree Parties by October 23, 2017 (Russell and others, 2024). That FFMP was set to expire on May 31, 2023, or, pending successful execution of some of its various provisions, May 31, 2028. A modification and reissuance of “Appendix A (Operations Plan)” of the FFMP on July 16, 2018 (appendix 1 of this report) added clarification to the text, tables, and graphics, with operations fundamentally unchanged. Changes in the “Agreement and Operation Plans (Appendix A)” of both of those FFMP versions are referred to as the 2017 Flexible Flow Management Program (FFMP2017) in this report (app. 1).
Some hydrologic data presented in this report are records of streamflow for U.S. Geological Survey (USGS) data-collection stations. These records were collected and computed by the offices of the USGS at Troy, New York (N.Y.), and Lawrenceville, New Jersey (N.J.), in cooperation with the States of New York and New Jersey and the City of New York. The locations of major streams, reservoirs, and selected USGS streamgaging stations (streamgages) in the Delaware River Basin are shown in figure 1.
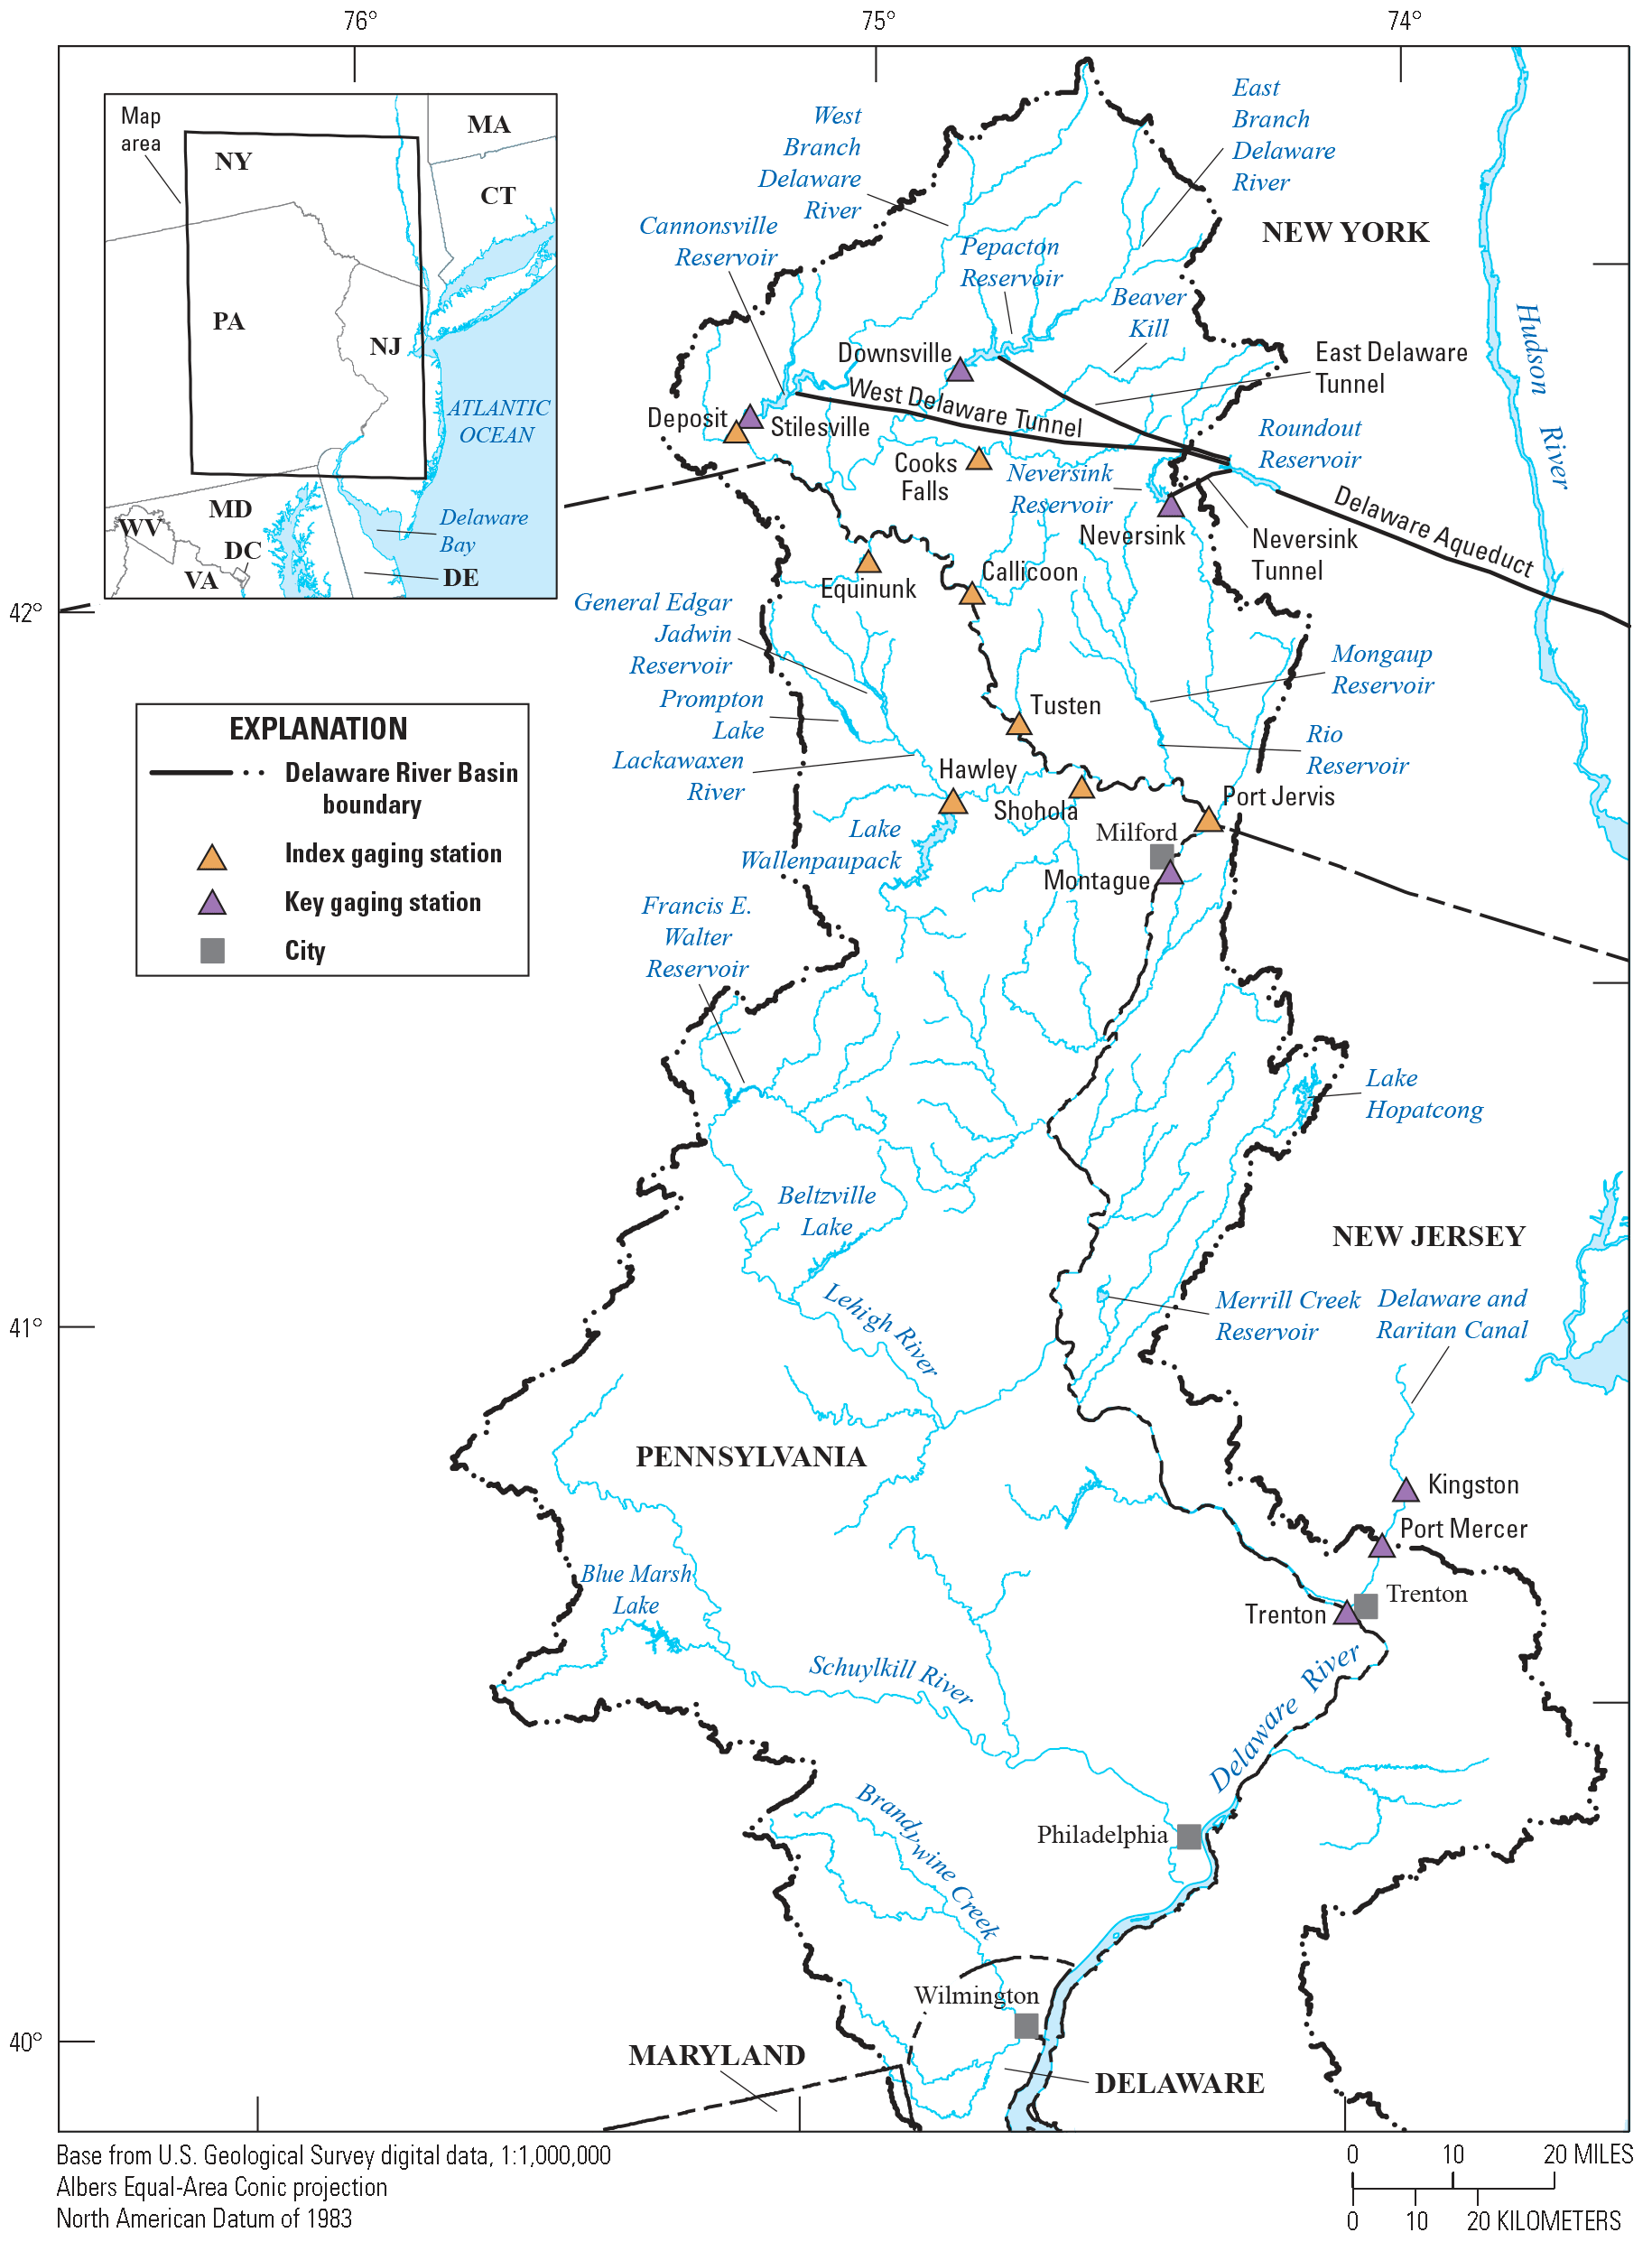
Map showing the Delaware River Basin upstream from Wilmington, Delaware. The Delaware River Basin boundary is shown along with key gaging stations and index gaging stations; refer to the “Glossary” section for definitions.
Method to Determine Directed Releases From New York City Reservoirs
The data and computations of the various streamflow components form the operational record used by the ODRM to carry out responsibilities related to the Montague formula, as specified by the Decree. The operational record has two parts: (1) segregating the streamflow components of the current daily mean discharge at the USGS streamgage at the Delaware River at Montague, N.J. (site number 01438500), referred to as the “Montague site,” to compute the uncontrolled runoff and (2) forecasting the uncontrolled runoff and using forecasted information from other sources to predict the flow at the Montague site with adequate advance time to direct releases. The forecasting process determines whether the ODRM directs New York City reservoir releases to maintain, at a minimum, the flow objective at the Montague site, which is defined in table 1 of appendix 1.
Segregating Streamflow Components
The segregation of streamflow at the Montague site involves determining the flow components, including releases from New York City’s Delaware River Basin reservoirs, releases from Lake Wallenpaupack and Rio Reservoir for generation of hydroelectric power, and uncontrolled runoff. For the segregation of components of daily mean flow at the Montague site, the following data are used:
-
1. controlled releases from the Pepacton, Cannonsville, and Neversink Reservoirs of New York City;
-
2. controlled releases from Lake Wallenpaupack on Wallenpaupack Creek to produce hydroelectric power; and
-
3. controlled releases from Rio Reservoir on the Mongaup River to produce hydroelectric power.
To determine the contributions of each of these releases, the amount of time it takes the water to travel from the release point to the Montague site (traveltime) is required. The traveltimes determine the appropriate time-delayed flow contributions from the controlled releases. The time-adjusted controlled releases are subtracted from the total streamflow measured at the Montague site to determine the uncontrolled runoff (including reservoir spills and groundwater) from the drainage area upstream from the Montague site.
The traveltimes were computed from the reservoir and powerplant operations data and historical streamflow records. The traveltimes are adequate for ODRM operations. Occasionally, however, significant exceptions are observed. For example, during a large increase in directed release from Cannonsville Reservoir, the arrival time of the water at the Montague site can be delayed as long as 1.5 days because a substantial amount of water must first fill the channel before a steady flow arrives at the Montague site. During winter, ice formation and lower streamflow gradually increase the resistance to water flow, resulting in increased traveltimes. Because ice-affected traveltimes increase gradually across several days and releases were not directed to meet the Montague flow objective during periods of ice, no adjustments were made to compensate for these increased traveltimes during the report year. The average traveltimes, in hours, for the effective travel of water from the various sources of controlled supply to the Montague site were used for flow routing during the report year: Pepacton Reservoir, 60; Cannonsville Reservoir, 48; Neversink Reservoir, 33; Lake Wallenpaupack, 24; and Rio Reservoir, 8. The traveltime used for Lake Wallenpaupack controlled releases, in 2016, changed from 16 hours to 24 hours based on data from Brookfield Renewable U.S.
Forecasting Streamflow
The releases from New York City’s reservoirs necessary for meeting the Montague flow objective were computed based on the forecasted streamflow, exclusive of releases from New York City’s Delaware River Basin reservoirs. The flow must be forecast 3 days in advance to account for the longest traveltime needed for the flow to reach the Montague site from the New York City reservoirs.
The electric utilities Brookfield Renewable U.S. and Eagle Creek Renewable Energy, LLC, provided daily forecasts of power generation and releases to the Delaware River Basin from Lake Wallenpaupack and Rio Reservoir, respectively, to the ODRM. Because the hydroelectric powerplants were primarily used for meeting rapidly varying peak power demands, those forecasts were subject to various modifying factors, including the vagaries of weather on electricity demand. In addition, because the power companies are members of regional transmission organizations, demand for power outside the local service area can unexpectedly affect power-generation schedules. Consequently, the actual release of water for power generation can differ from the forecasts used in the design of reservoir releases.
For computational purposes during low-flow periods, estimates of uncontrolled runoff at the Montague site were treated as two components: (1) current runoff and (2) forecasted runoff from precipitation. An estimate of uncontrolled runoff was computed using a recession procedure. A recession curve of uncontrolled inputs was developed using the discharge at the Montague site and is used to forecast the uncontrolled portion of flow at the Montague site 3 days in advance.
Forecasted runoff was determined using data from the National Weather Service office in Binghamton, N.Y., which provided quantitative forecasts of average precipitation and air temperatures for the 3,480-square-mile (mi2) drainage basin upstream from the Montague site. During winter, runoff was estimated based on the status of snow and ice, along with forecasted precipitation and temperature. During other periods, forecasted precipitation was used to estimate runoff.
The forecasted flow at the Montague site, exclusive of releases from New York City’s Delaware River Basin reservoirs, is computed as the sum of forecasted releases from hydroelectric power reservoirs, estimated uncontrolled runoff, including conservation releases from Rio Reservoir, and estimated runoff from predicted rainfall. All of these inputs are adjusted for traveltime. If the computed total flow is less than the flow objective at the Montague site, the deficiency is compensated with releases from New York City’s reservoirs, as directed by the ODRM.
When updated forecasts of precipitation or hydroelectric powerplant releases showed significant changes after a release was directed, the release required from New York City’s reservoirs was recomputed based on the updated forecasts. Commonly, this procedure resulted in a reduced release requirement for the New York City reservoirs that day. Only the final directed release values for New York City reservoirs are presented in this report.
A balancing adjustment is applied to directed releases based on the performance of the flow forecast beginning June 15 of each year. The balancing adjustment calls for more water to be released when previous directed releases (or a lack of releases) were insufficient to meet the Montague flow objective. The adjustment calls for less water to be released when previous directed releases were higher than required to meet the Montague flow objective. The balancing adjustment is computed as 10 percent of the difference between the cumulative directed release and the cumulative directed release required for exact forecasting and is limited to a maximum of 50 cubic feet per second (ft3/s). As part of several studies defined in FFMP2017, it was determined that the “Decree Parties shall study, evaluate, and consider the River Master’s balancing adjustment procedure” (Parties of the 1954 U.S. Supreme Court Decree, 2017).
A cursory review of the balancing adjustment procedure in 2018 resulted in an immediate proposed refinement. New York City reservoir operations include conservation releases unrelated to flow at the Montague site (refer to the “Habitat Protection Program” section). The conservation releases can be greater than releases directed by the ODRM to meet the flow target at the Montague site. In these instances, the accuracy of the directed release does not affect the operations of the reservoirs and the flow target is met, yet the forecast error is still accumulated and applied in the balancing adjustment. The proposed refinement limits the error accumulation, and the applied adjustment occurs only when directed releases are greater than the conservation releases. The change in the procedure was implemented on July 15, 2018, with a more detailed assessment planned for the following years as part of the “FFMP 2017 Balancing Adjustment Study” (Russell and others, 2024).
Hydrologic Conditions
Precipitation
The sum of the monthly average precipitation across the Delaware River Basin upstream of the Montague site was 60.39 inches (in.) during the report year and was 136 percent of the long-term (77-year) average (table 1). Monthly precipitation ranged from 46 percent of the long-term average in December 2017 to 231 percent of the long-term average in August 2018 (table 1; fig. 2). Precipitation data for the report year were computed from records for five geographically distributed stations: the Pepacton, Neversink, and Cannonsville Reservoirs; Hawley, Pennsylvania (Pa.); and Milford, Pa. These stations were operated by the New York City Department of Environmental Protection (NYCDEP) Bureau of Water Supply, the National Weather Service, and the ODRM.
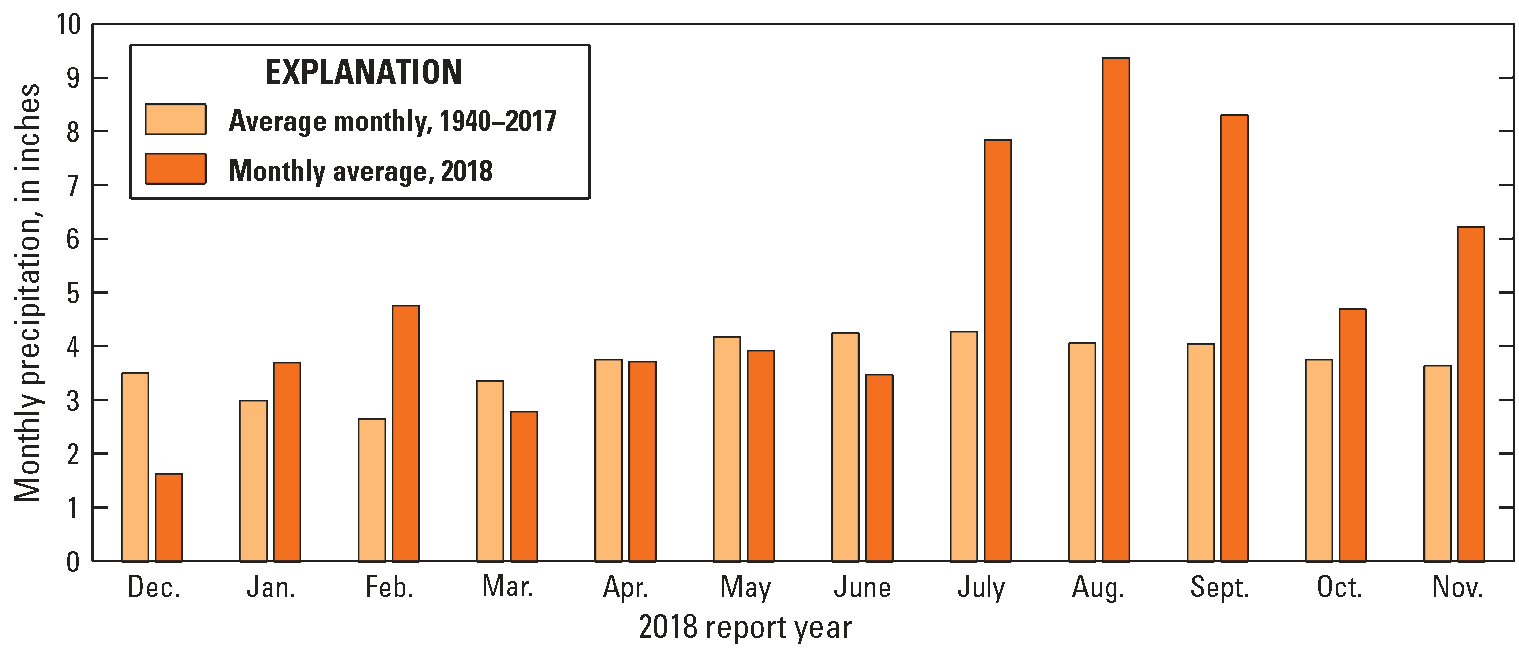
Graph showing monthly precipitation, in inches, in the Delaware River Basin upstream of Montague, New Jersey, for the 2018 report year (December 1, 2017–November 30, 2018) compared with the 1940–2017 monthly average.
The seasonal period from December to May is typically when surface-water and groundwater reservoirs refill. For the 2018 report year, total precipitation was 20.51 in., which is 100 percent of the 77-year long-term average (table 1). During the June–November period, total precipitation was 39.88 in., which is about 166 percent of the 77-year long-term average (table 1).
Reservoir Storage
Pertinent levels and contents of the Pepacton, Cannonsville, and Neversink Reservoirs are shown in table 2. The NYCDEP provided this information.
Table 2.
Elevations and capacities of structures of the Pepacton, Cannonsville, and Neversink Reservoirs.[Sum of all volumes for each reservoir is gross storage, above sill of diversion tunnel is available storage, and at point of maximum depletion is usable storage. Reservoir storage volumes were modified based on a survey conducted by the U.S. Geological Survey for the New York City Department of Environmental Protection (Nystrom, 2018). Updated values for report year used starting June 1, 2018. ft, foot; Mgal, million gallons; —, not applicable]
Daily storage in the Pepacton, Cannonsville, and Neversink Reservoirs above the point of maximum depletion, or minimum full-operating level, is given in tables 3, 4, and 5, respectively, and combined storage during the report year is shown in figure 3. On December 1, 2017, combined useable storage in the three reservoirs was 193.230 billion gallons or 71.35 percent of the combined capacity of 270.837 billion gallons. Combined storage increased to about 100 percent of usable capacity during April 7–May 31, 2018. Combined storage remained high (above 80 percent combined capacity) through November 30, 2018. The lowest combined storage was 181.198 billion gallons (67.7 percent of combined capacity) on January 11, 2018; the maximum combined storage was 274.347 billion gallons on April 19, 2018. The combined storage was 264.292 billion gallons (98.8 percent of combined capacity) on November 30, 2018.
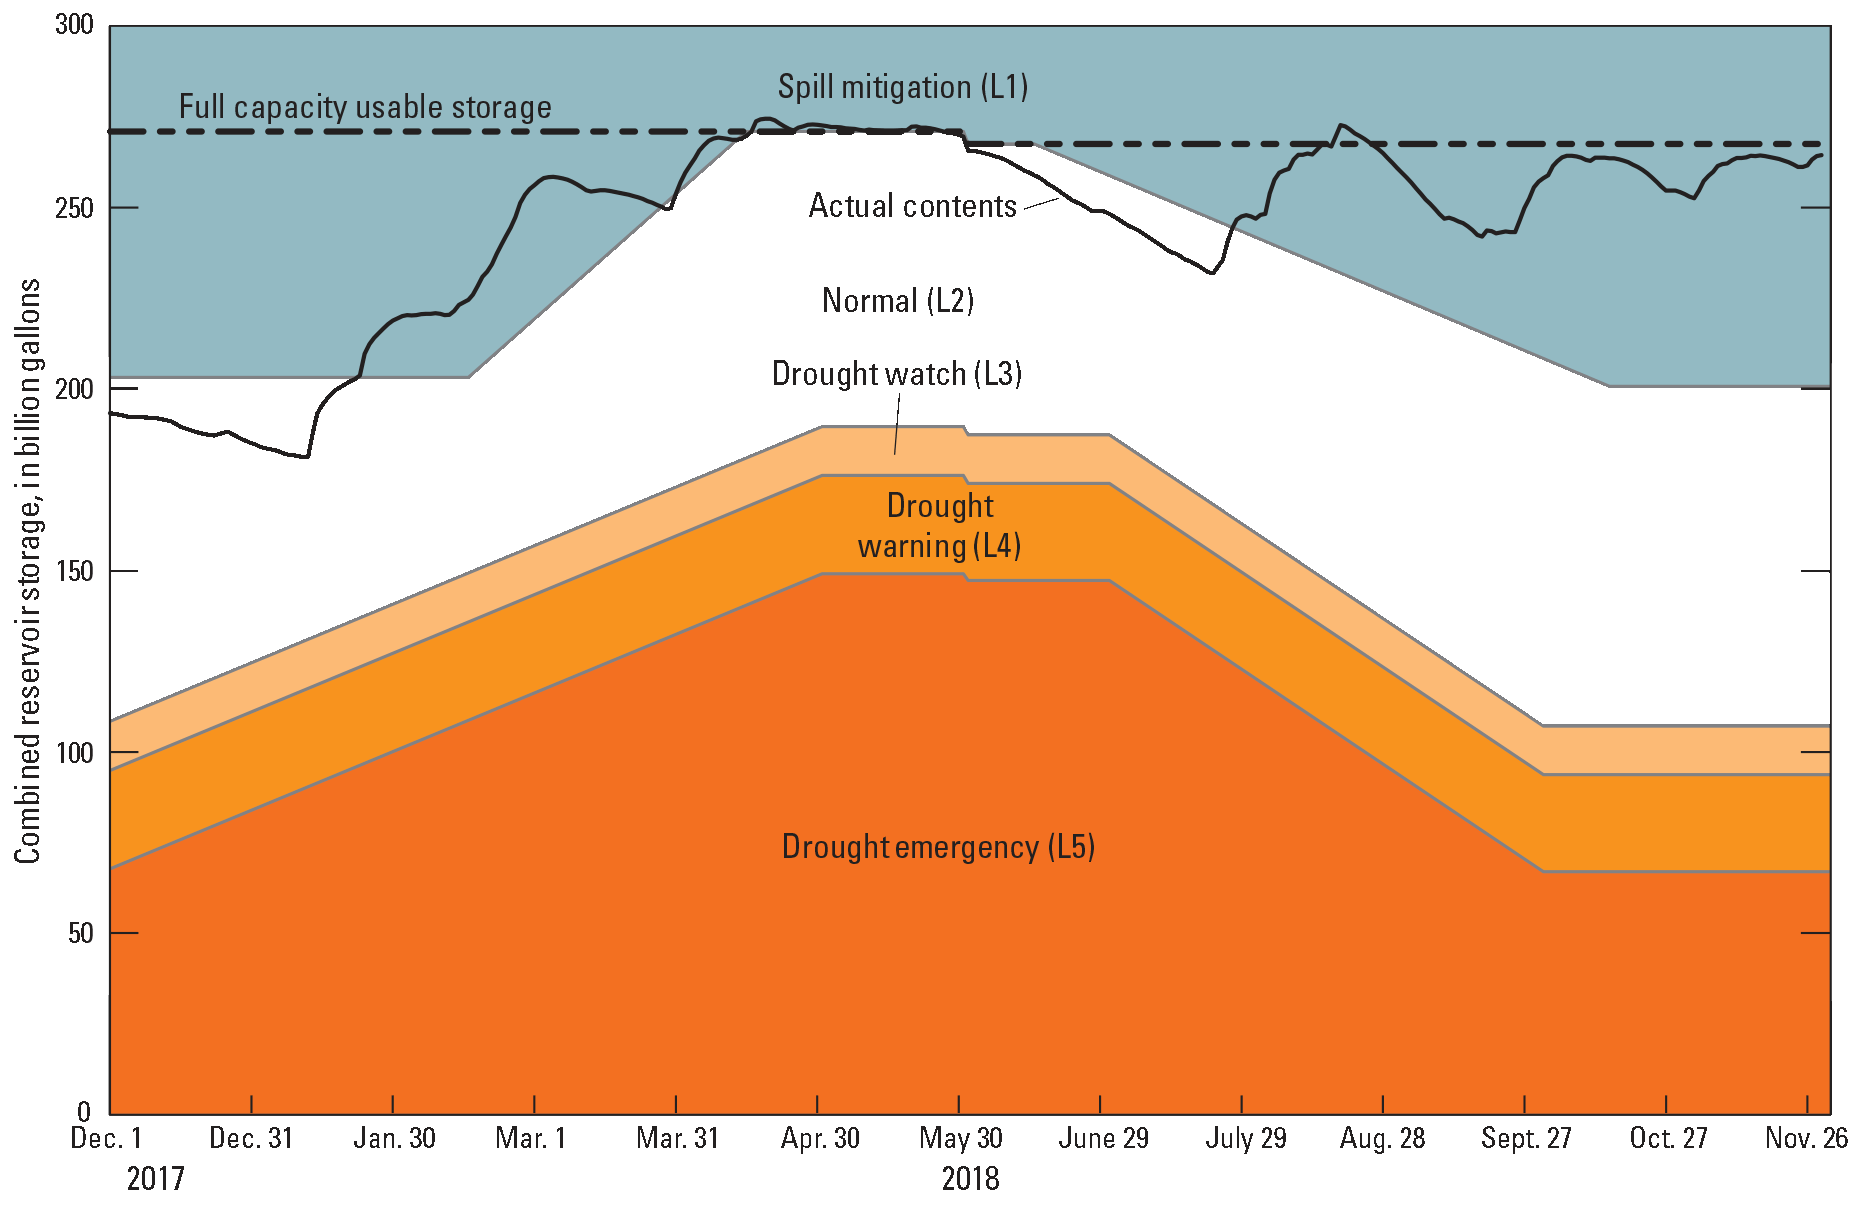
Graph showing rule curves and actual stored water, in billion gallons, for New York City reservoirs in the Delaware River Basin for the report year (December 1, 2017–November 30, 2018). Full capacity usable storage line and the five conservation release rate zones (L1–L5) are shown. The conservation release rate zones are defined in the “conservation release” definition in the “Glossary” section. The total capacities of the Pepacton, Cannonsville and Neversink Reservoirs were updated on June 1, 2018, based on a survey conducted by the U.S. Geological Survey for the New York City Department of Environmental Protection (Nystrom, 2018).
The three reservoirs spilled a total of 80.566 billion gallons during the report year when reservoirs reached maximum capacity. The first spill occurred on February 28, 2017, at Neversink Reservoir. Pepacton Reservoir spilled on 85 days, Cannonsville Reservoir spilled on 64 days, and Neversink Reservoir spilled on 132 days (fig. 4).
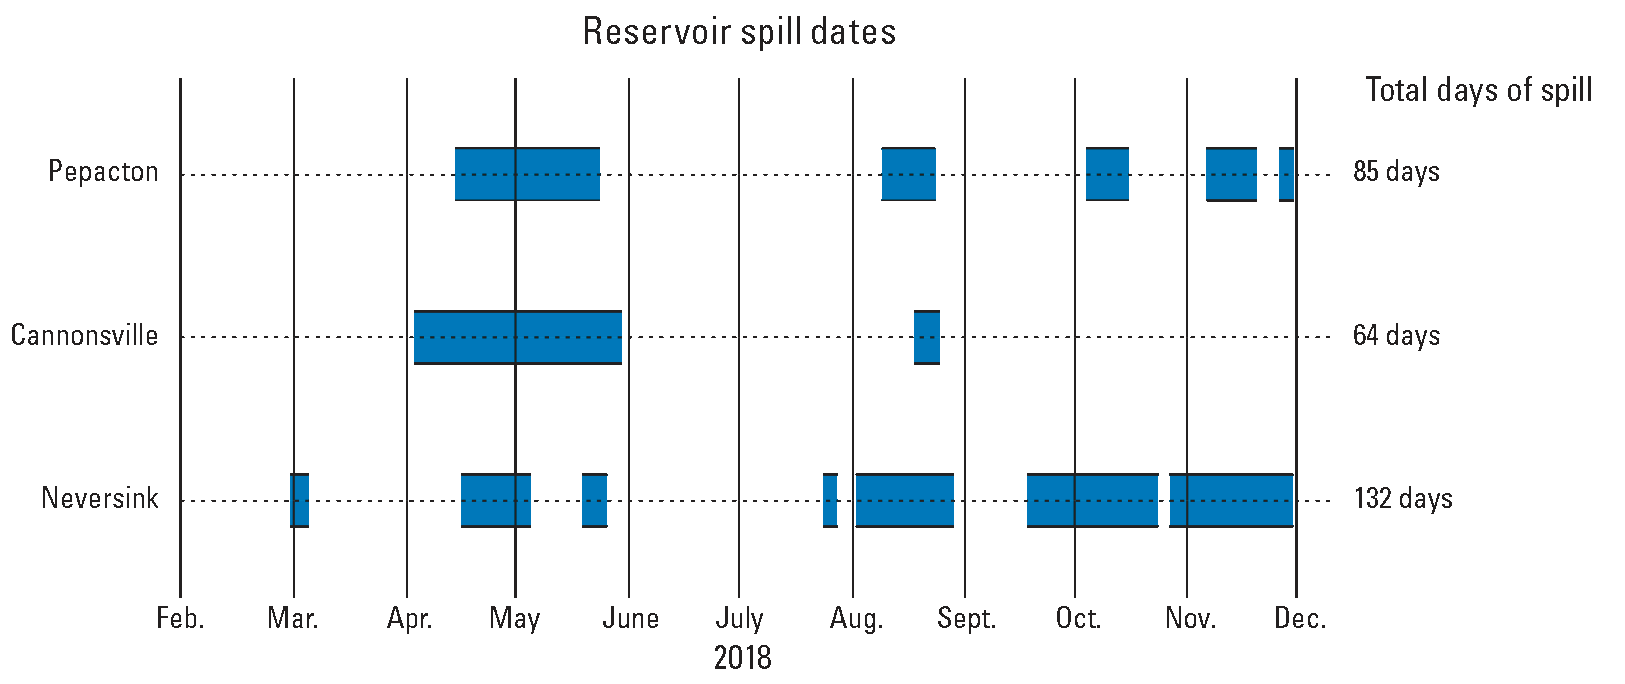
Timeline bar graph showing the reservoir spill dates and total days of spill for when the Pepacton, Cannonsville, and Neversink Reservoirs reached maximum capacity and spilled between February 28 and November 30, 2018.
Operations
Operations from December 1, 2017, through November 30, 2018, were conducted as described by the FFMP2017 (app. 1). The allowable diversion to New York City was 800 million gallons per day (Mgal/d) throughout the year. The Montague flow objective was 1,750 ft3/s. The allowable diversion to New Jersey was a monthly average of 100 Mgal/d, with a daily maximum of 120 Mgal/d. Conservation releases from New York City reservoirs were made at the rates described in FFMP2017 (app. 1; Russell and others, 2024).
Diversions to New York City Water Supply
The 1954 Amended Decree (New Jersey v. New York, 347 U.S. 995) authorizes New York City to divert water from the Delaware River Basin at a rate not to exceed the equivalent of 800 Mgal/d. The Decree specifies that the diversion rate shall be computed as the aggregate total diversion beginning June 1 of each year divided by the total number of days elapsed since the preceding May 31. Under the FFMP2017, New York City diversion limits are reduced during the “drought watch,” “warning,” and “emergency” conditions.
The records of daily diversions through the East Delaware, West Delaware, and Neversink Tunnels (fig. 1) were provided to the ODRM by the NYCDEP. These records were obtained from calibrated instruments belonging to New York City that were connected to Venturi meters installed in the tunnel conduits. The flow measurements were transmitted electronically on a 15-second interval to New York City computers; 5-minute interval release and diversion quantities for the preceding 5-minute period were computed using the instantaneous rate-of-flow data from each instrument. These 5-minute quantities were then summed to compute daily total flows, which were reported daily to the ODRM. Each week, the computed diversion values were checked against the flow-meter totalizer readings by the NYCDEP and corrected when necessary.
For the report year, daily diversions from the Pepacton, Cannonsville, and Neversink Reservoirs to the New York City water-supply system (Rondout Reservoir) are given in table 6 and figure 5. A running account of the average rates of combined diversions from the three reservoirs from June 1, computed as stipulated by the Decree, is also shown in table 6 and figure 5. A total of 166.862 billion gallons of water was diverted to the New York City water-supply system during the report year, with a daily average of 457 million gallons (Mgal), which is below the maximum diversion rate (table 6). The maximum daily diversion from a single reservoir was 511 Mgal on October 26, 2018, from the Pepacton Reservoir (table 6).
The maximum daily combined diversion from all three reservoirs was 1,107 Mgal on December 28, 2017 (table 6). Diversions by New York City did not exceed the limits stipulated by the Decree and FFMP2017. The data on water consumption by the City of New York for each calendar year since 1950, from all sources of supply, are presented in table 7.
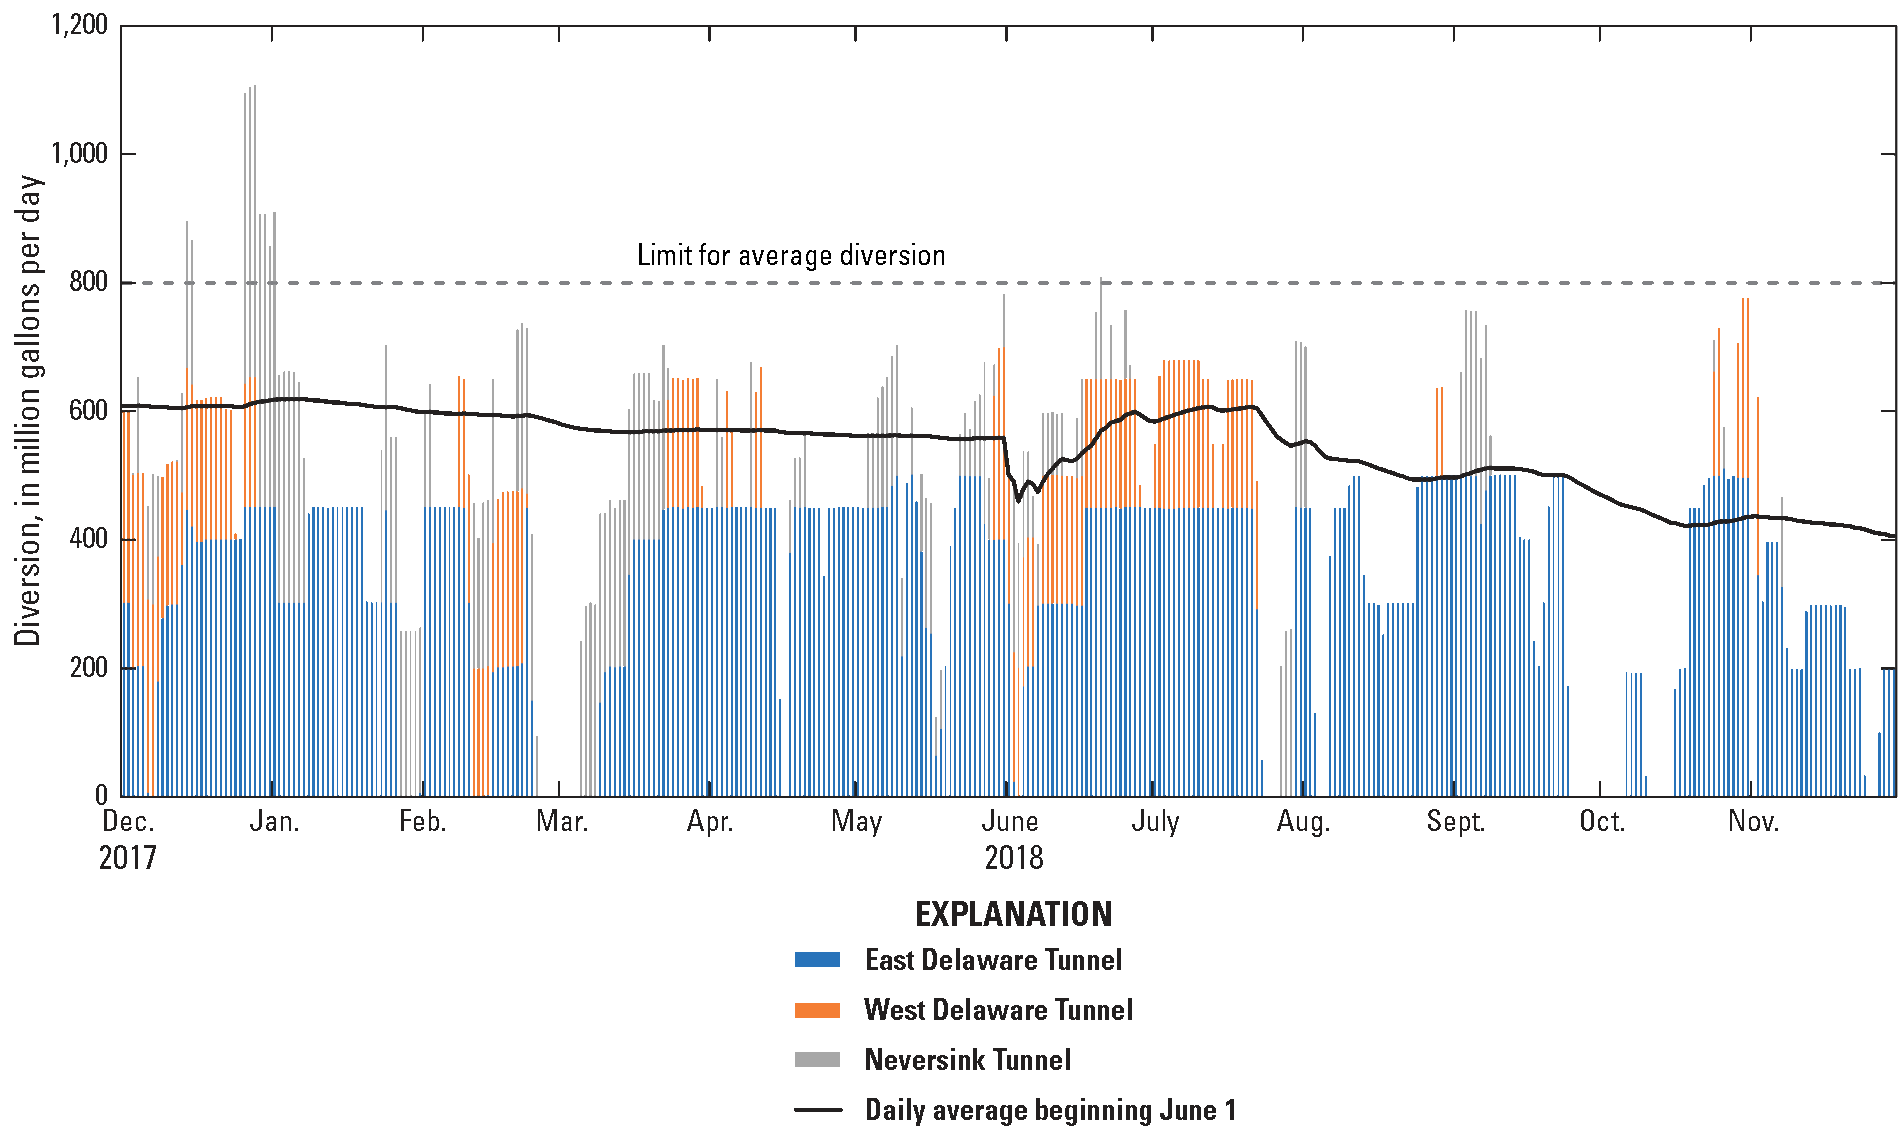
Bar graph showing total daily diversions, in million gallons per day (Mgal/d), from Pepacton, Cannonsville, and Neversink Reservoirs in the Delaware River Basin for New York City water supply and the daily average diversion (computed starting on June 1 of each year) from all three sources for the report year (December 1, 2017–November 30, 2018). The method or combined methods of diversion for each day—East Delaware Tunnel, West Delaware Tunnel, and Neversink Tunnel—are shown. The standard limit for average diversion (800 Mgal/d) is also labeled.
In addition to diversions for water supply by New York City, the diversion tunnels serving as conduits for that water can also leak under varying conditions. Such leakages are not included in diversion numbers. The East Delaware Tunnel is used to divert water from the Pepacton Reservoir to the Rondout Reservoir. The hydroelectric powerplant at the downstream end of the East Delaware Tunnel operated most days of the report year. When the powerplant was not operating, some water leaked through the wicket gates and was not recorded on the totalizer. A current-meter measurement made in 1989 showed that the (assumed constant) leakage rate is about 12.4 ft3/s (8.0 Mgal/d). Because the powerplant was not in operation for the equivalent of 40 days during the report year, the estimated quantity of unmeasured leakage (diverted but not recorded) was about 0.3 billion gallons.
The West Delaware Tunnel is used to divert water from the Cannonsville Reservoir to the Rondout Reservoir. When the valves were closed, inspections of the channel below the outlet revealed negligible leakage. A hydroelectric powerplant uses water diverted through the West Delaware Tunnel, but the plant operates only when diversions are less than 300 Mgal/d. When the powerplant is not operating, the valves on the pipelines to the plant are closed, and there is no leakage through the system.
The Neversink Tunnel is used to divert water from the Neversink Reservoir to the Rondout Reservoir. A hydroelectric powerplant uses water diverted through the Neversink Tunnel. When the powerplant is not operating and the main valve on the diversion tunnel is open, leakage develops that is not recorded on the Venturi meters. One current-meter measurement made in 1999 showed a leakage rate of 16.2 ft3/s (10.5 Mgal/d). The leakage is included in the recorded flow when the powerplant is operating. No leakage occurs when the main valve on the tunnel is closed. During the report year, the powerplant operated part of the day on most days and was not operated for the equivalent of 315 days. About 3.3 billion gallons of water was diverted but not recorded, according to the leakage rate noted above and records of powerplant operation.
Diversions by New Jersey
The Decree authorizes New Jersey to divert water from the Delaware River and its tributaries in New Jersey to areas outside of the Delaware River Basin without compensating releases. The Decree specifies that New Jersey diversions shall not exceed 100 Mgal/d as a monthly average, and the daily diversion shall not exceed 120 Mgal/d. Under the FFMP2017 (app. 1), New Jersey diversion limits are reduced during “drought warning” and “emergency” conditions.
The USGS streamgage on the Delaware and Raritan Canal at Port Mercer, N.J. (site number 01460440; fig. 1) is used as the official control point for measuring the diversions by New Jersey. Based on data collected by the USGS at this site, the maximum monthly average diversion was 97.6 Mgal/d in June 2018 (table 8; fig. 6.) (USGS, 2019e). The maximum daily mean diversions were 101 Mgal/d on June 22, 34, 25, and 27, 2018 (table 8; fig. 6). Negative diversion quantities of –122 and –90 Mgal/d on May 27 and November 25, 2018, respectively, indicate the return of diverted water from the Delaware and Raritan Canal back to the Delaware River (table 8; fig. 6). Diversions by New Jersey did not exceed the limits stipulated by the Decree and the FFMP2017 (app. 1).
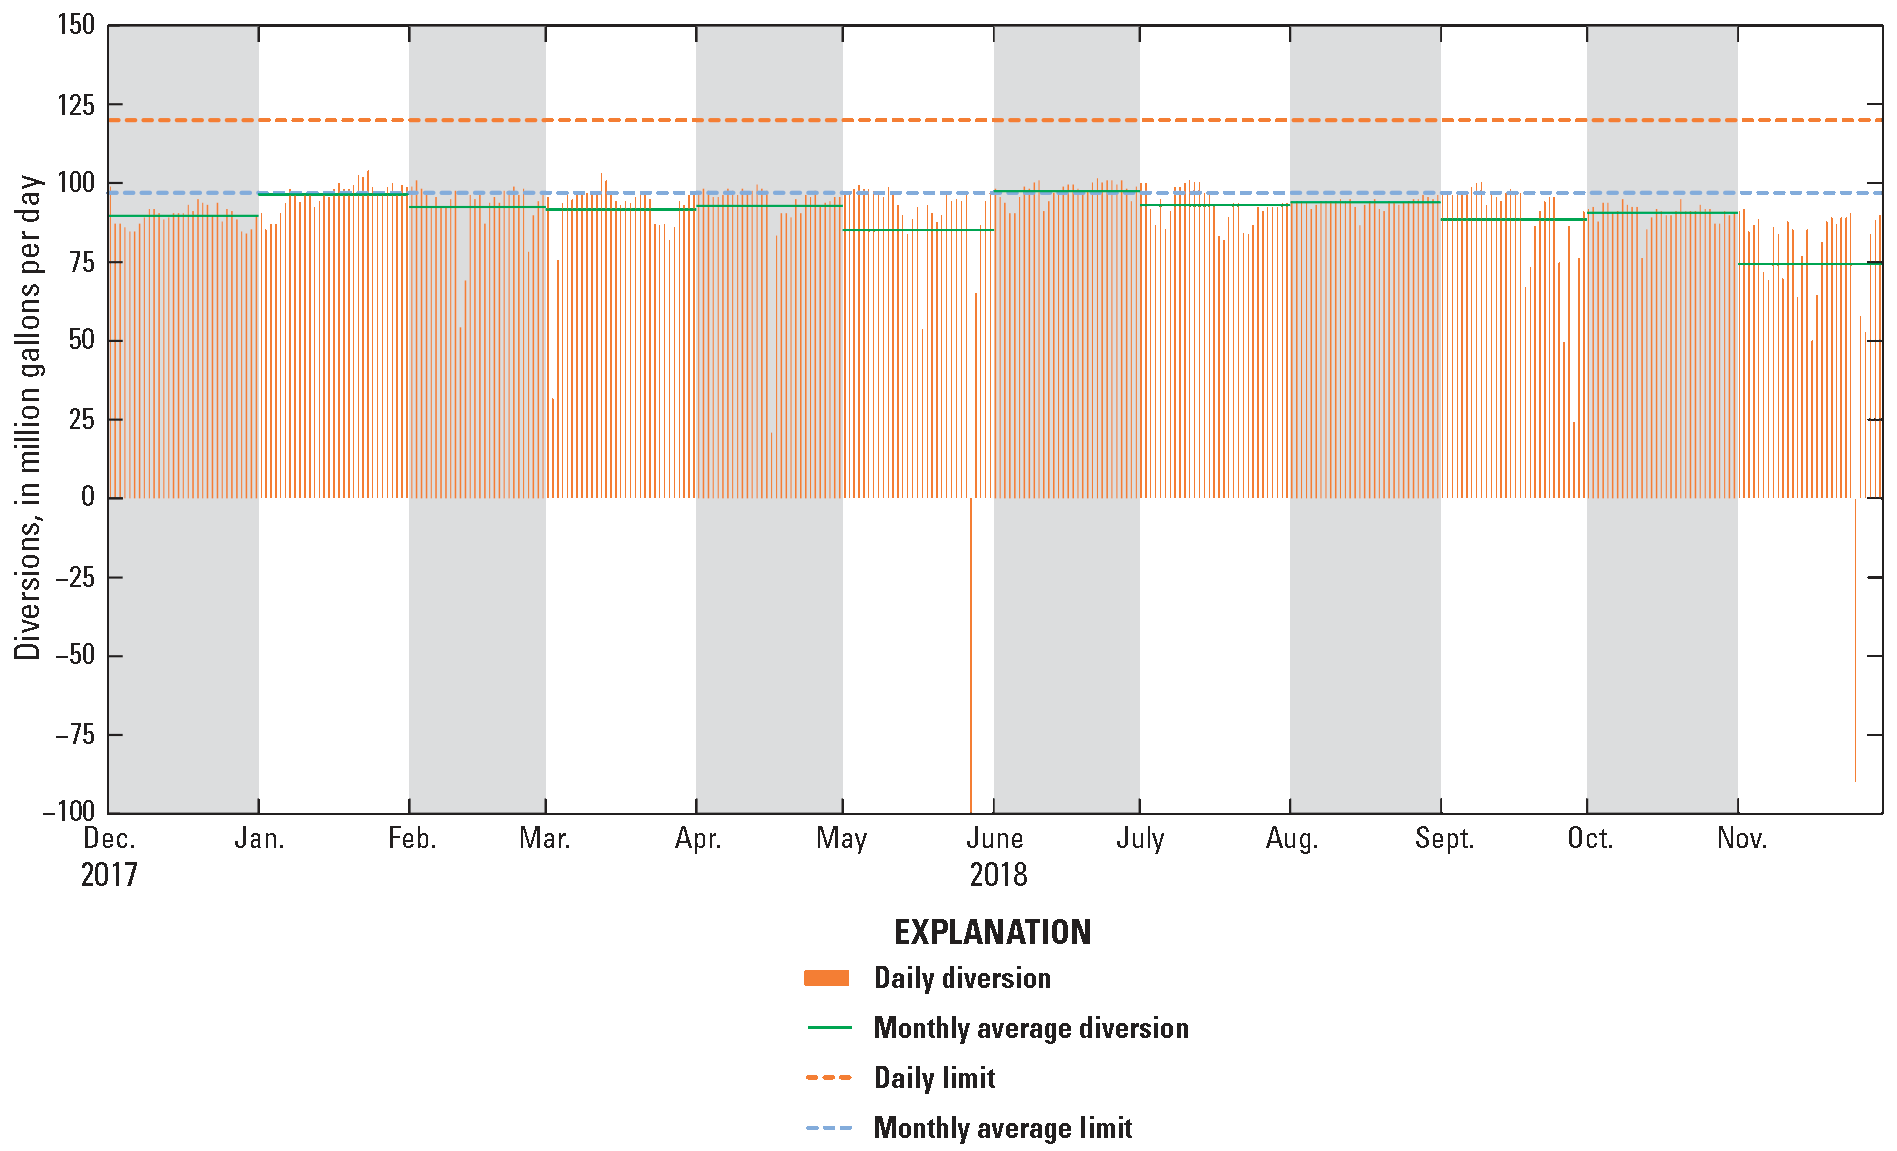
Bar graph showing daily total and monthly average diversions by New Jersey, in million gallons per day, from the Delaware River Basin through the Delaware and Raritan Canal for the report year (December 1, 2017–November 30, 2018). Negative values indicate water returned to the Delaware River. The daily limit and monthly average limit are also shown.
Montague Flow Objective
The components of forecasted flow at the Montague site during low flow—forecasted releases from hydroelectric power reservoirs, estimated uncontrolled runoff (including conservation releases from Rio Reservoir), and forecasted increase in runoff from precipitation—and the sums of flows exclusive of releases from New York City’s reservoirs are given in table 9. If the computed sum of the components is less than the Montague flow objective, then the deficiency is made up by releases from New York City’s reservoirs, as directed by the ODRM. Table 10 presents the ODRM daily operations record of reservoir releases and segregation of the various components contributing to the flow of the Delaware River at the Montague site.
The forecasted flow of the Delaware River at the Montague site, based on provisional data and exclusive of water released from the New York City reservoirs, was less than the flow objective, and directed releases were required for a total of 42 days. On 2 days in December 2017 and 2 days in July 2018, the observed flow was less than the flow objective (table 10, col. 11) (USGS, 2019d)—all four observed flows were within 16 percent of the flow objective.
The components of the total flow observed at the Montague site for December 1, 2017–January 8, 2018, and June 15–July 26, 2018, are segregated into the portion derived from the New York City reservoirs, the portion contributed by the powerplant reservoirs, and the uncontrolled runoff from the drainage area below the reservoirs in figure 7. As previously described, the uncontrolled runoff was computed as the residual of observed flow minus releases and was subject to errors in the observations, transit times, and routings of the various flow components. The conservation release from the Rio Reservoir is included in the power reservoir contribution.
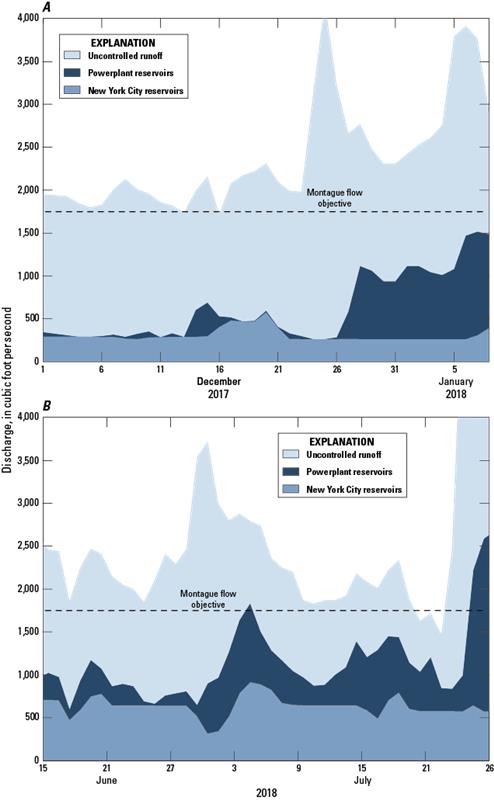
Graphs showing flow components—uncontrolled runoff, powerplant reservoirs, and New York City reservoirs—for the Delaware River at Montague, New Jersey (U.S. Geological Survey, 2019d), from (A) December 1, 2017–January 8, 2018, and (B) June 15–July 26, 2018. The Montague flow objective is also shown.
Excess Release Quantity and Interim Excess Release Quantity
Per sections 4b and 4c of FFMP2017 (app. 1), the Decree Parties agreed to use the Excess Release Quantity, as defined in the Decree, in support of an Interim Excess Release Quantity (IERQ). Four IERQ banks of water were established to be used each year to enhance base releases as needed from the New York City reservoirs. Table 10 shows the daily usage of those banks throughout the report year. All bank usages are reset to zero on June 1 of each year. From June 1, 2017, to May 31, 2018, 634 cubic feet per second accumulated daily ([ft3/s]-d) was released from the rapid flow change mitigation bank (Russell and others, 2024). No other banks were used through May 31, 2018. From June 1, 2018, through the remainder of the report year, the usage for each bank was—
-
1. Trenton Equivalent Flow Objective: No requests were made, and this bank was not used.
-
2. Thermal Mitigation: The NYCDEP requested a total of 1,648 (ft3/s)-d be released to mitigate thermal events affecting fisheries. This amount was released June 17, 2018–July 16, 2018.
-
3. Rapid Flow Change Mitigation: No requests were made, and this bank was not used.
-
4. New Jersey Diversion Amelioration: This bank is reserved for use during drought conditions, which did not occur during the report year.
Habitat Protection Program
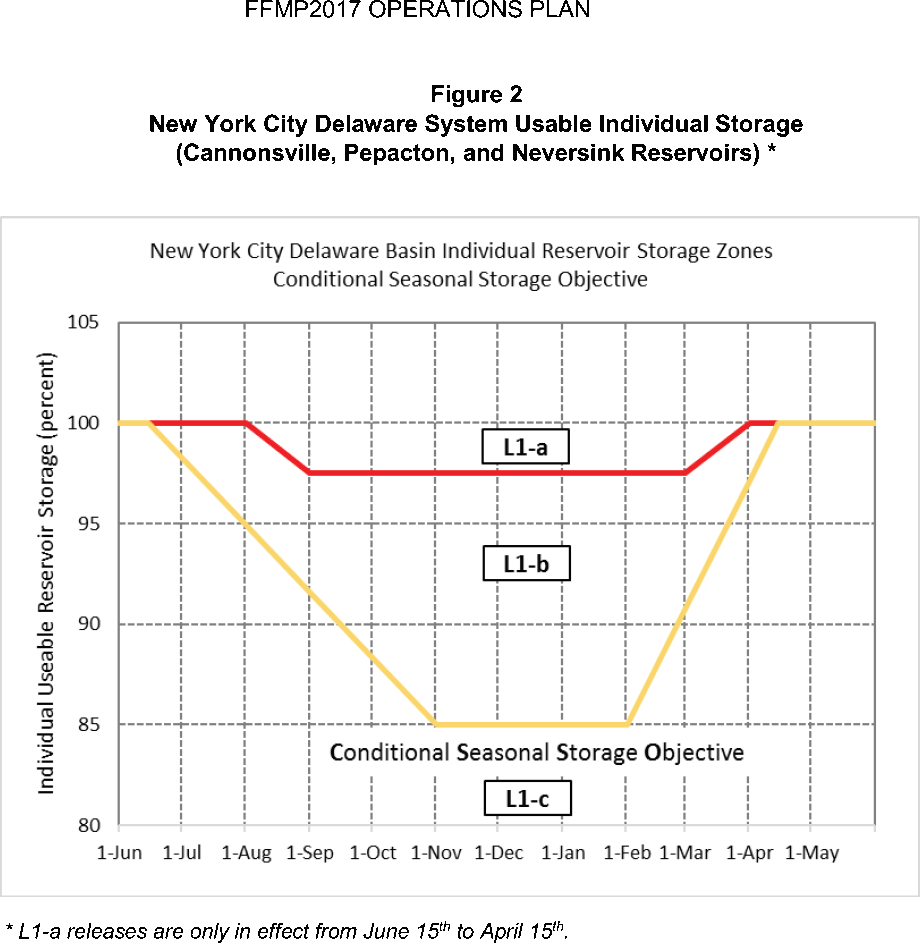
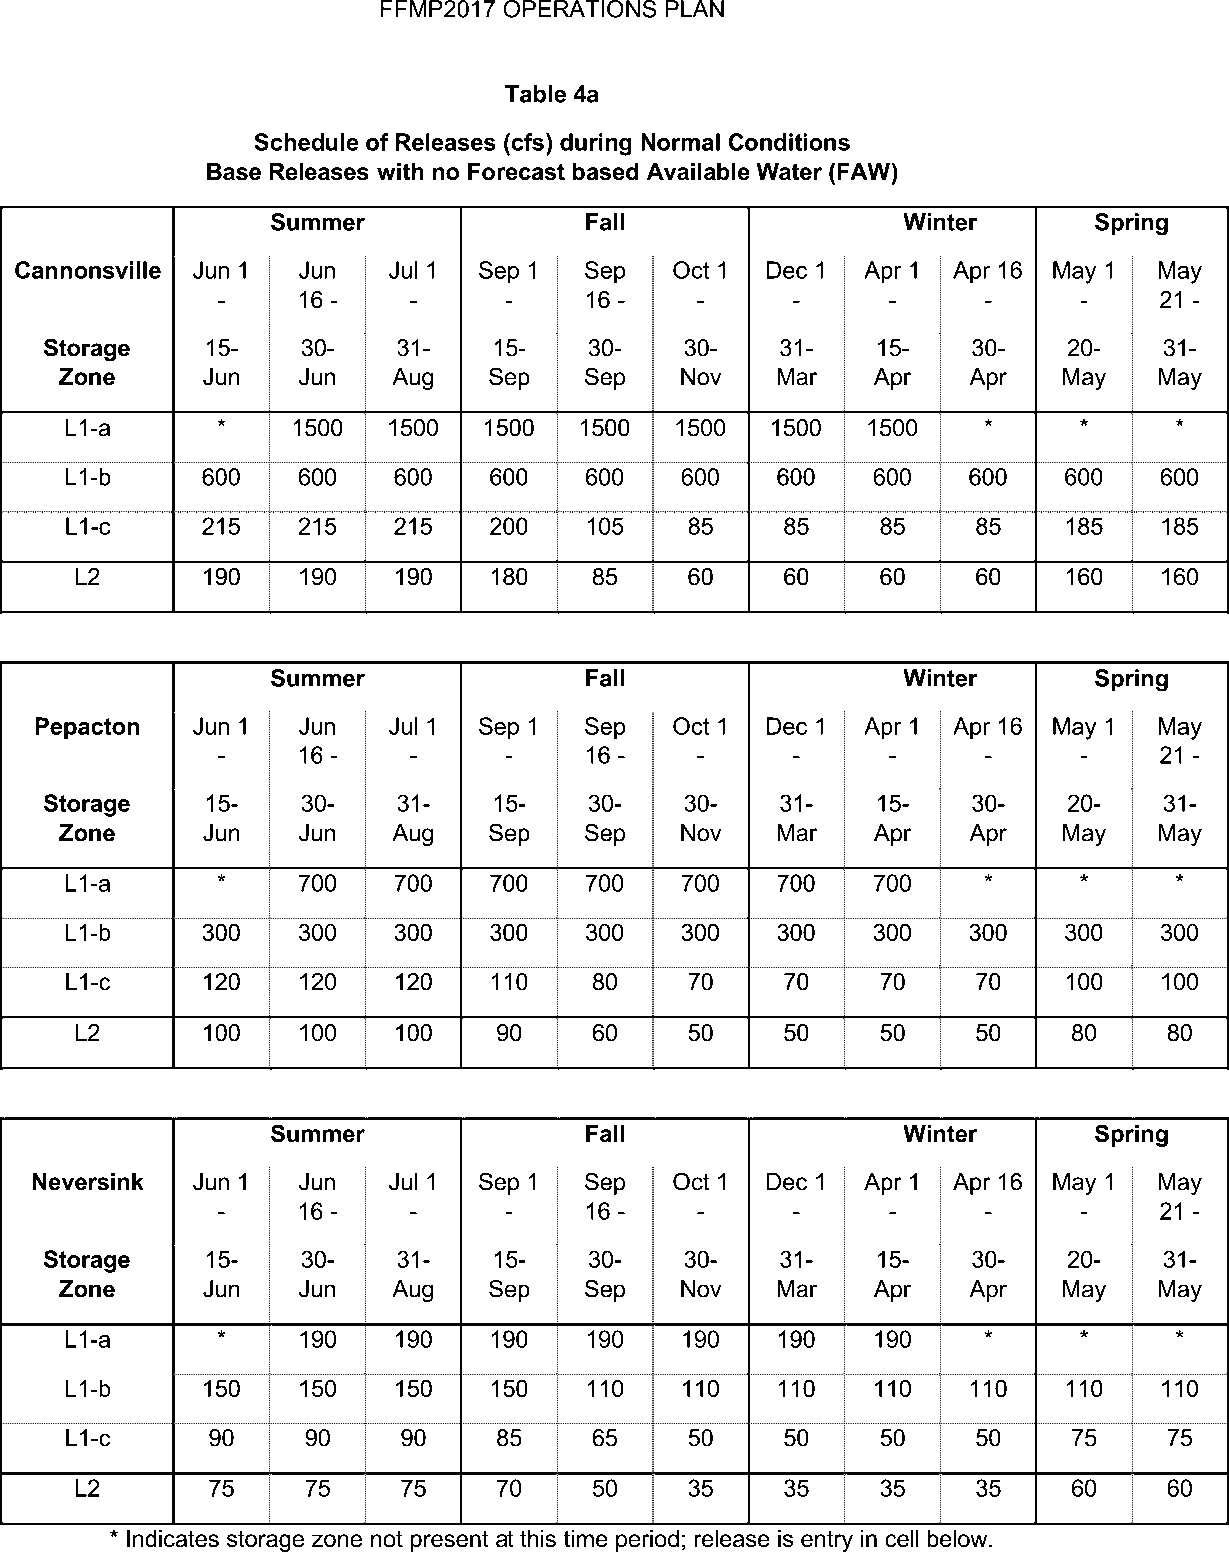
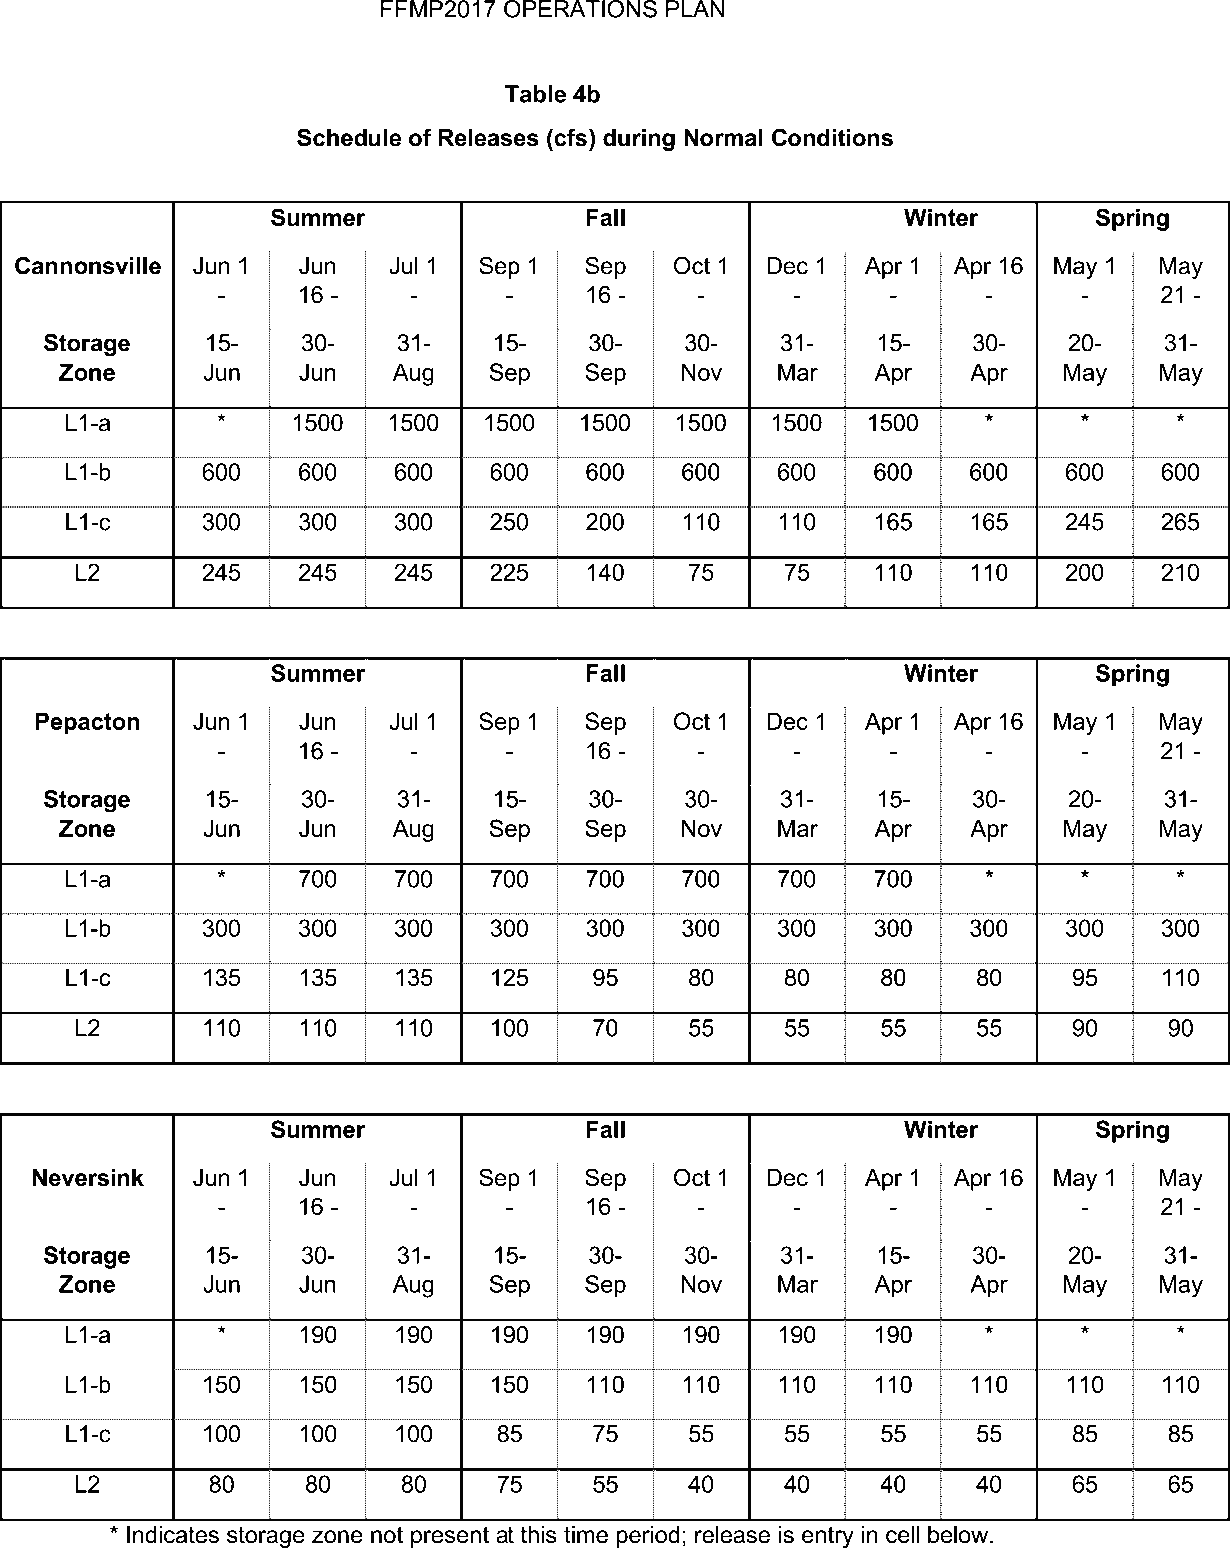
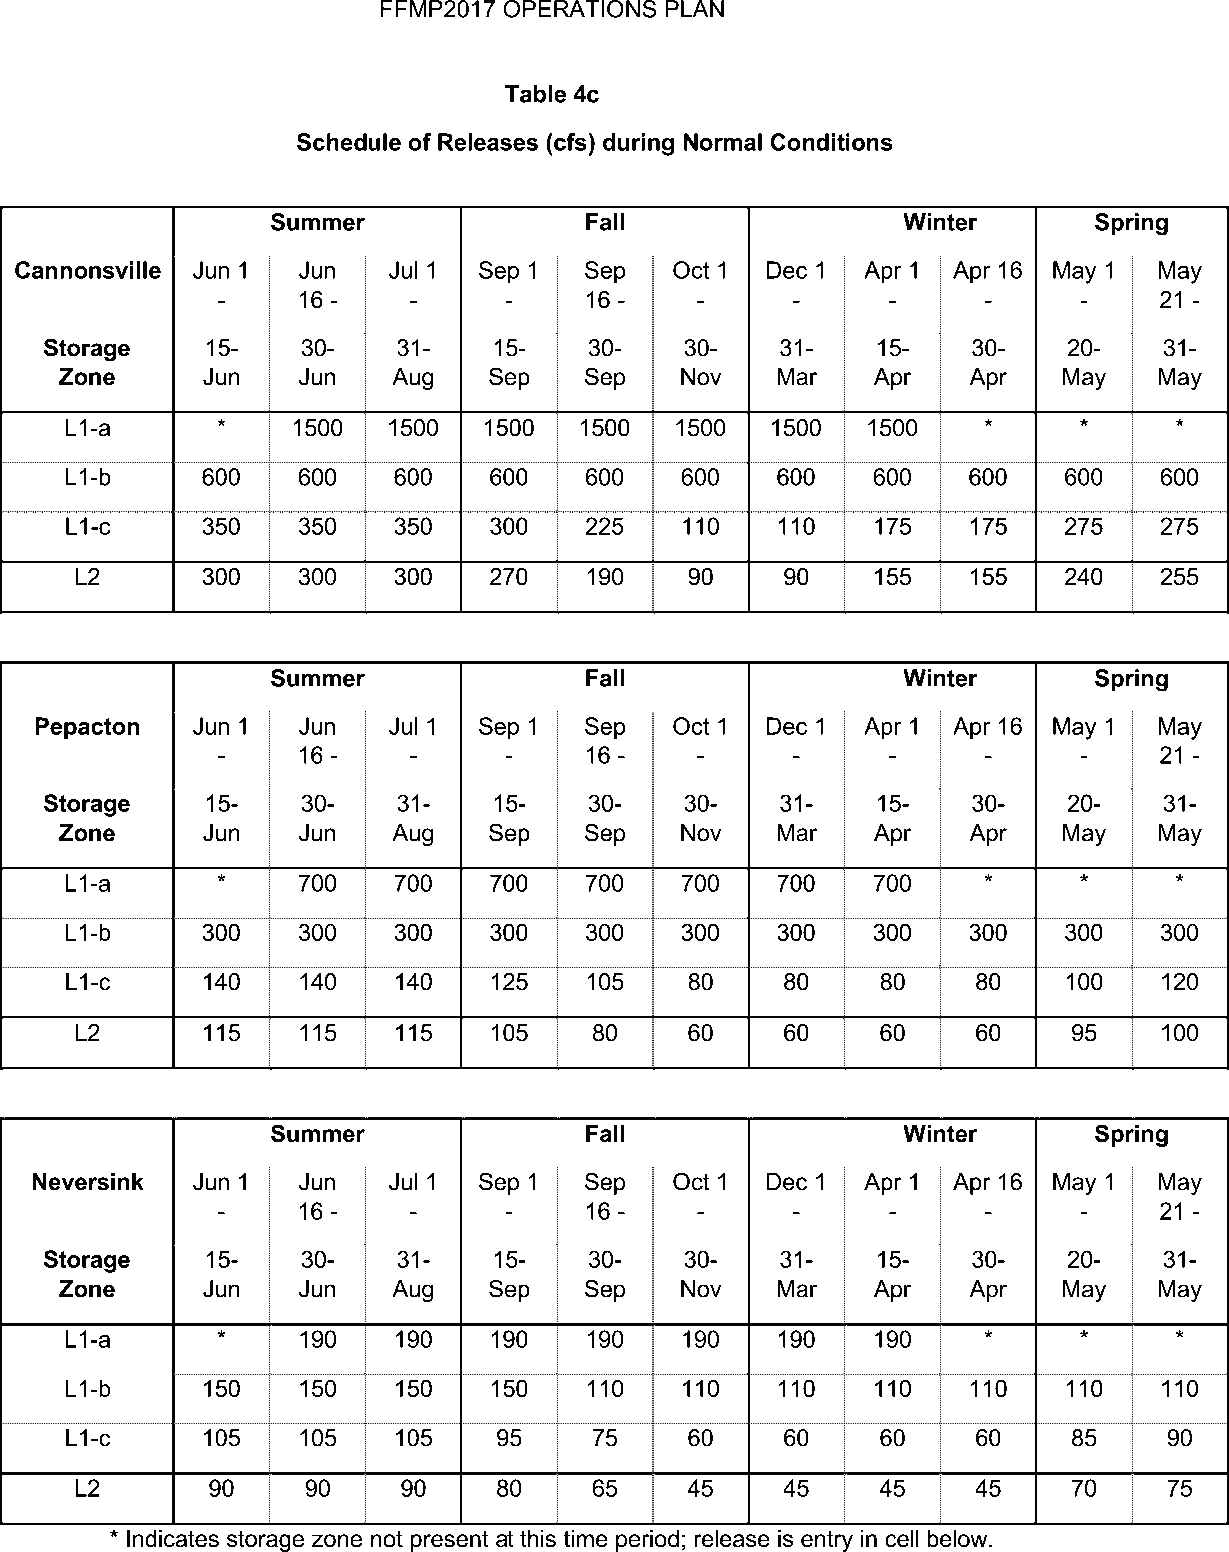
The FFMP2017 (app. 1) established a Habitat Protection Program (HPP) to protect the cold-water fishery in the basin while maintaining aquatic community diversity, structure, and function through improved ecological flow releases. Conservation releases above the base releases given in table 4a (FFMP2017) are made under the HPP when an assessment by New York City, using its Operations Support Tool (OST) as guidance, determines that additional water is available for releases and that any risk to the New York City water supply is acceptable (app. 1; Russell and others, 2024).
Controlled releases were made from New York City’s Delaware River Basin reservoirs in accordance with the FFMP2017. From December 1, 2017, to November 30, 2018, 305.314 billion gallons was released from the New York City Delaware River Basin reservoirs in accordance with the HPP. Release tables 4g, 4f, 4e, and 4d from FFMP2017 (app. 1) were used during the report year as determined by the status of usable reservoir storage and OST guidance (fig. 8; refer to “Archived OST Summary Data” at https://webapps.usgs.gov/odrm/data/data.html).
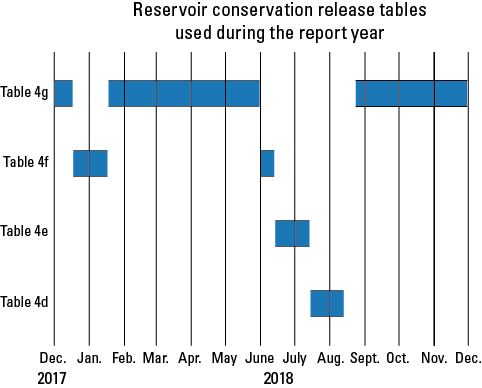
Graphic showing Flexible Flow Management Program 2017 tables used for releases from New York City Delaware River Basin Reservoirs for the report year (December 1, 2017–November 30, 2018) (app.1).
Section 4d of FFMP2017 (app. 1) established the New Jersey Diversion Offset Bank for use during drought conditions. The bank accumulates in increments according to the release table in use—per the FFMP2017 operations plan—not to exceed 2,300 (ft3/s)-d. The bank accumulation reached 2,300 (ft3/s)-d on November 11, 2018; it was not available for use during the report year as drought conditions did not occur.
Comparison of River Master Operations Data With Other Records
The ODRM operations are conducted daily and, by necessity, use preliminary data on streamflow. This section compares forecasted and actual releases for hydroelectric power generation, forecasted versus observed runoff from uncontrolled areas, and records used in the ODRM operations compared with final streamflow data published for selected USGS streamgages. The release data were reported in million gallons per day and converted to cubic feet per second for comparisons.
Analysis of Forecasts
Based on anticipated contributions from the flow components described previously, but excluding releases from New York City reservoirs, forecasted streamflow at the Montague site differed from observed flow on most days. Occasionally, component variations were partially compensating and observed flows are comparable to flows. The forecasted flow of the Delaware River at the Montague site, exclusive of releases from the New York City-reservoirs, was less than the flow objective on 19 days in December 2017, 3 days in January 2018, 10 days in June 2018, and 11 days in July 2018 (table 9).
As described in the “Forecasting Streamflow” section of this report, the forecasted and actual flow releases from hydroelectric power generations can vary due to changes in demand and hydrologic conditions. Forecasted and actual releases from Lake Wallenpaupack and Rio Reservoir can differ considerably on any day. The total actual and forecasted releases from the hydroelectric plants and for the periods when ODRM was directing releases—December 1–26, 2017; January 7–12, 2018; and June 16–July 26, 2018—are shown in table 11. Forecasted releases at Lake Wallenpaupack differed from 1,458 ft3/s less than to 108 ft3/s greater than actual releases. Forecasted releases at Rio Reservoir differed from 603 ft3/s less than to 213 ft3/s greater than actual releases. Forecasted releases from Lake Wallenpaupack and Rio Reservoir averaged 19 and 22 percent less than the actual releases, respectively. Powerplant forecasted releases are calculated from columns 1 and 2 in table 9; powerplant actual releases are calculated from columns 5 and 6 in table 10.
Table 11.
Forecasted and actual release volumes from Lake Wallenpaupack, Rio Reservoir, uncontrolled runoff, and directed releases for December 1–26, 2017; January 7–12, 2018; and June 16–July 26, 2018.[(ft3/s)-d, cubic feet per second accumulated daily]
A comparison of forecasted and computed runoff from the uncontrolled area (table 11 and fig. 9) indicated that the forecasts were generally suitable for use in designing releases from New York City Delaware River Basin reservoirs. Forecasted runoff (columns 3 + 4 in table 9) from the uncontrolled area was 10 percent less than observed runoff (column 10 in table 10). Numerical adjustments to the designs were made when needed to compensate for forecast errors. However, because of traveltimes, the effects of the adjustments on flows at the Montague site were not evident until several days after the design dates.
Based on gaged streamflow at the Montague site, total directed releases from New York City reservoirs during the report year (column 9 in table 9) were about 0.5 percent less than required for exact forecasting (column 11 in table 9).
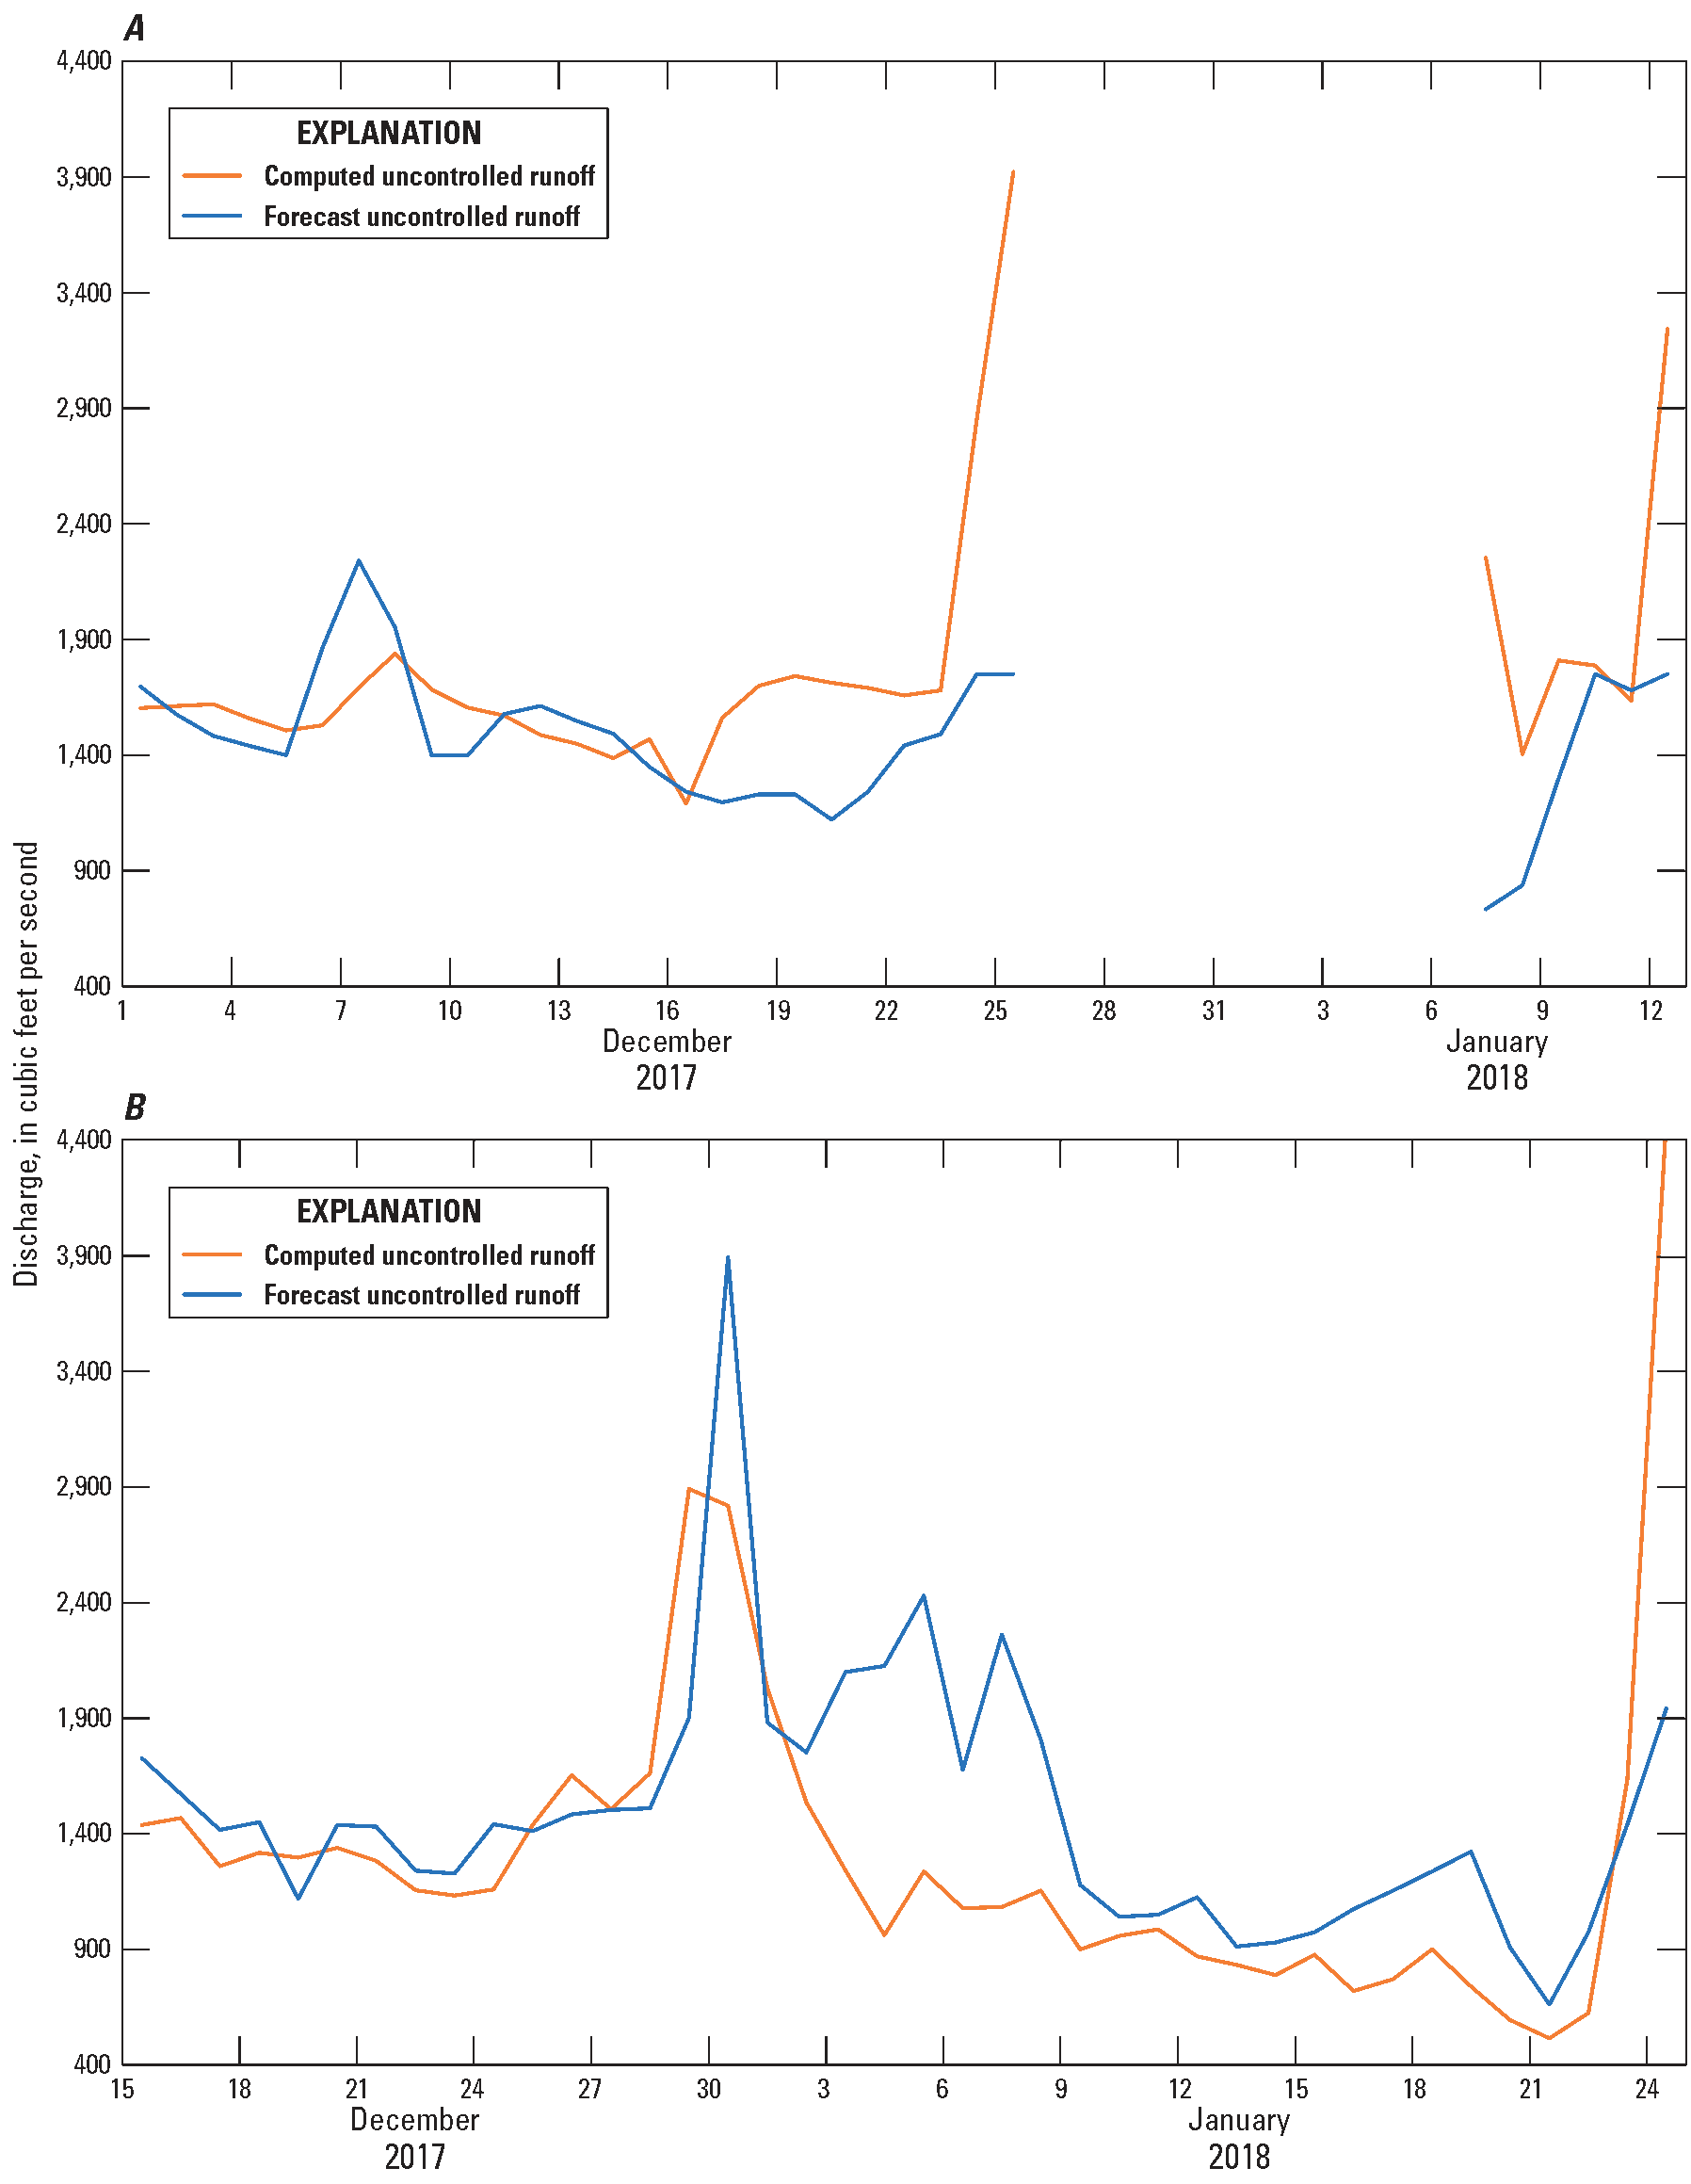
Hydrographs of computed and forecasted uncontrolled runoff components, Delaware River at Montague, New Jersey (U.S. Geological Survey site number 01438500), (A) December 1, 2017–January 12, 2018, and (B) June 15–July 24, 2018. Discharge is shown in cubic feet per second. The forecast uncontrolled runoff was greater than the flow target and not computed December 27, 2017–January 6, 2018.
Releases From New York City Reservoirs
The ODRM operations data of controlled releases from the Pepacton, Cannonsville, and Neversink Reservoirs were provided by the NYCDEP to the ODRM. These data were collected from calibrated instruments connected to Venturi meters installed in the outlet conduits of the reservoirs. In this section, those data are compared with streamflow data observed at three USGS streamflow gaging stations downstream of those reservoirs.
Figure 10 shows the measured flow from the Pepacton, Cannonsville, and Neversink Reservoirs, including spillway, conservation, and directed releases, as reported by New York City, compared with records for the USGS streamgages located downstream of each reservoir (table 11; USGS, 2019a), from December 1, 2017, to November 30, 2018. Table 12 lists the locations of those USGS streamflow gaging stations and descriptions of the discharges measured, upstream drainage areas, records ratings, mean percent differences between New York City and USGS reported daily streamflows, and the 95th percentile of differences between those streamflows.
Table 12.
Characteristics of U.S Geological Survey streamflow gaging stations from which measured streamflow data are compared with Office of the Delaware River Master streamflow data, December 2017–November 2018.[U.S. Geological Survey (USGS) streamflow gaging station records rating of “good” indicates that 95 percent of records are within 10 percent of true discharge, and “fair” indicates that 95 percent of records are within 15 percent of true discharge. %, percent; mi, mile; mi2, square mile]
The mean differences between New York City and USGS reported daily streamflows are 5.7, 5.5, and 9.1 percent; 95 percent of the daily differences between the USGS streamgage readings and New York City records are within 16.2, 16.8, and 31.1 percent, respectively. Large differences rarely occur and can be due to rainfall. Instruments connected to the Venturi meters were recalibrated periodically by New York City to improve the accuracy of the recorded flow data.
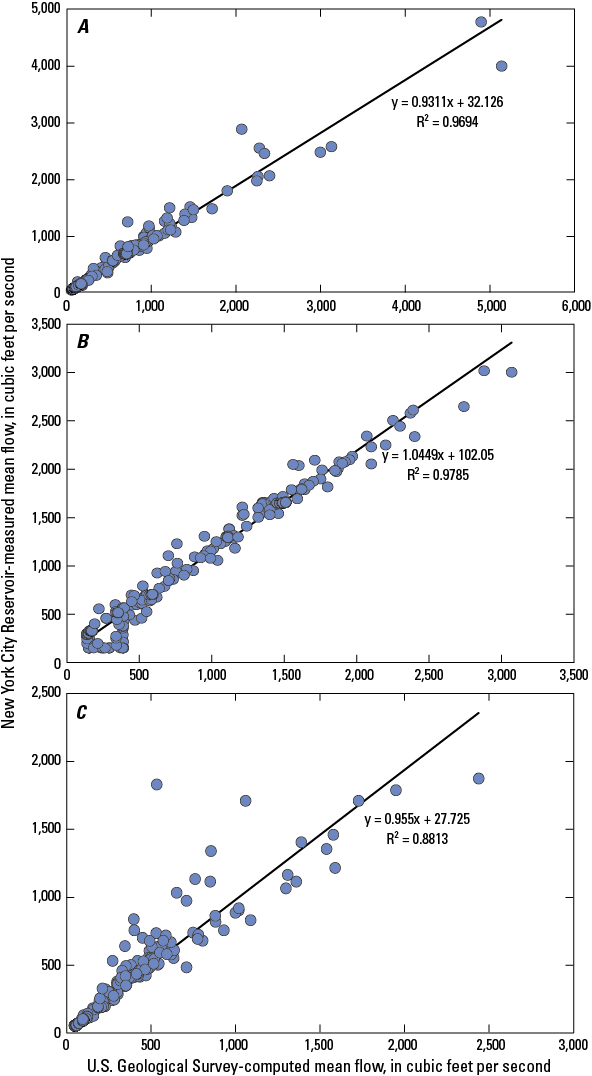
Graphs showing New York City-measured mean flow, in cubic feet per second, compared with computed mean flow records for U.S. Geological Survey (USGS) streamgaging sites downstream from their respective reservoirs: (A) East Branch Delaware River at Downsville, New York (N.Y.) (site number 01417000), downstream from Pepacton Reservoir (data from USGS, 2019a); (B) West Branch Delaware River at Stilesville, N.Y. (site number 01425000), downstream from Cannonsville Reservoir (data from USGS, 2019b); and (C) Neversink River at Neversink, N.Y. (site number 01436000), downstream from Neversink Reservoir (data from USGS, 2019c), December 1, 2017–November 30, 2018.
Delaware River at Montague, New Jersey
The ODRM operations record for the Delaware River at Montague, N.J. (table 10), showed about 0.02 percent more discharge for the report year than the published USGS record for the streamgage (table 13). Daily values for the two records agreed closely, except during ice-affected periods and the summer vegetation-growth season.
Conformance of Operations Under the Amended Decree of the Supreme Court of the United States Entered June 7, 1954
From December 1, 2017, to November 30, 2018, operations of the ODRM were conducted as stipulated by the Decree and the FFMP2017 (app. 1).
The diversions from the Delaware River Basin to the New York City water supply system did not exceed those authorized by the Decree and the FFMP2017. New York City released water from its reservoirs at rates directed by the ODRM to meet the applicable Montague flow objectives. During the report year, New York City complied fully with all directives and requests of the ODRM.
Diversions from the Delaware River Basin by New Jersey were within limits stipulated by the Decree. New Jersey complied fully with all directives and requests of the ODRM.
The Excess Release Quantity was used in support of the IERQ throughout the report year as defined in the FFMP2017 (app. 1; table 10).
Tables 1, 3–10, 13
Table 1.
Precipitation in the Delaware River Basin upstream of Montague, New Jersey.[Data from the National Weather Service, New York City Department of Environmental Protection, and Office of the Delaware River Master. in., inch; —, not applicable]
Table 3.
Storage in Pepacton Reservoir, New York, for year ending November 30, 2018.[Delaware River Master daily operations record; gage reading at 0800 hours; data provided by New York City Department of Environmental Protection. Storage is given in millions of gallons (Mgal) above the elevation of 1,152.00 feet (ft). Add 7,711 Mgal before June 1st or 7,921 Mgal thereafter for total contents above sill of outlet tunnel at the elevation of 1,126.50 ft. Storage at spillway level is 140,190 Mgal before June 1st and 139,320 Mgal on or after June 1st. —, not applicable; Mgal/d, million gallons per day; ft3/s, cubic foot per second]
Change is calculated as the storage on the last day of each month minus the storage on the first day of each month. Net change for the year is +27,775 million gallons; minimum and maximum storage for December– May are 105,478 and 141,894 million gallons, respectively; minimum and maximum storage for June–November are 120,760 and 142,180 million gallons, respectively.
Table 4.
Storage in Cannonsville Reservoir, New York, for year ending November 30, 2018.[Delaware River Master daily operations record; gage reading at 0800 hours; data provided by New York City, Department of Environmental Protection. Storage is given in millions of gallons above the elevation of 1,040.00 feet. Add 2,584 million gallons before June 1st or 2,377 million gallons thereafter for total contents above sill of outlet tunnel at the elevation of 1,020.50 feet. Storage at spillway level is 95,706 before June 1st and 93,448 million gallons on or after June 1st. —, not applicable; Mgal/d, million gallons per day; ft3/s, cubic foot per second]
Change is calculated as the storage on the last day of each month minus the storage on the first day of each month. Net change for the year is +39,630 million gallons; minimum and maximum storage for December through May are 46,780 and 98,088 million gallons, respectively; minimum and maximum storage for June through November are 78,398 and 95,852 million gallons, respectively.
Table 5.
Storage in Neversink Reservoir, New York, for year ending November 30, 2018.[Delaware River Master daily operations record; gage reading at 0800 hours; data provided by New York City, Department of Environmental Protection. Storage is given in millions of gallons above the elevation of 1,319.00 feet. Add 525 million gallons before June 1st or 471 million gallons thereafter for total contents above the sill of outlet tunnel at the elevation of 1,314.00 feet. Storage at spillway level is 34,941 million gallons before June 1st and 34,692 million gallons on or after June 1st. —, not applicable; Mgal/d, million gallons per day; ft3/s, cubic foot per second]
Change is calculated as the storage on the last day of each month minus the storage on the first day of each month. Net change for the year +3,657 million gallons; minimum and maximum storage for December–May are 26,970 35,369 million gallons, respectively; minimum and maximum storage for June–November are 35,529 and 35,386 million gallons, respectively.
Table 6.
Diversions to New York City water-supply system for the year ending November 30, 2018.[Delaware River Master daily operations record; data provided by the New York City Department of Environmental Protection. Diversions are in million gallons per day. For December 1–May 31, the average is computed for June 1, 2017, to the given date. For June 1–November 30, the average is computed beginning June 1, 2018, to the given date. The diversion calculation is computed as authorized by the Decree. —, not applicable]
Table 7.
Consumption of water by New York City, 1950–2018.[Data provided by New York City, Department of Environmental Protection, Bureau of Water Supply. Mgal/d, million gallons per day]
Table 8.
Diversions by New Jersey, daily mean discharge, Delaware and Raritan Canal at Port Mercer, New Jersey (U.S. Geological Survey site number 01460440), for the year ending November 30, 2018.[Data from U.S. Geological Survey (2019e). All values except total are in million gallons per day (Mgal/d). Negative values indicate flow into the Delaware River Basin. Total in million gallons, Mgal; e, estimated; —, not applicable]
Table 9.
New York City reservoir release design data for the year ending November 30, 2018.[Delaware River Master daily operations record. The Montague design rate was 1,750 ft3/s from December 1, 2017, through January 18, 2018. Column (col.) 1 was provided by electric utility Brookfield Renewable Partners, U.S. Col. 2 was provided by electric utility Eagle Creek Renewable Energy. Col. 3 computed from recession method. Col. 4 computed increase in runoff based on quantitative precipitation forecasts. Col. 5 = col. 1 + col. 2 + col. 3 + col. 4. Col. 6 = Design rate – col. 5, when positive; otherwise, col. 6 = 0. Col. 7 = col. 14 (4 days earlier). Col. 8, directed release amount from the Office of the Delaware River Master = col. 6 + col. 7, when positive, otherwise col. 8 = 0. Col. 9 = col. 7 from table 10. Col. 10 = summation of col. 9. Col. 11 = flow objective – (col. 9 + col. 10 from table 10) when positive, otherwise col. 11 = 0. Col. 12 = summation of col. 11. Col. 13 = col. 10 – col. 12. Col. 14 = col. 13 divided by –10, limited to ± 50 ft3/s. Cols. 10 and 12 are accumulated from the previous report year starting June 1, 2017, then reset to zero on June 15, 2018. The balancing adjustment standard operating protocol was revised July 15, 2018, to calculate the balancing adjustment only when directed releases are greater than conservation releases, and col. 13 and 14 were set to zero. ft3/s, cubic feet per second; (ft3/s)-d, cubic feet per second accumulated daily]
Table 10.
Controlled releases from reservoirs in the upper Delaware River Basin and segregation of flow of Delaware River at Montague, New Jersey, for the year ending November 30, 2018.[Delaware River Master daily operations record. All provided measurements are the mean discharge in cubic feet per second (ft3/s) for 24 hours. Column (col.) 1 = Office of the Delaware River Master directed release. Col. 2 = 24 hours beginning 1200 of date shown. Col. 3 = 24 hours ending 2400, 1 day later. Col. 4 = 24 hours beginning 1500, 1 day later. Col 5 = 24 hours beginning 0000 of date shown. Col. 6 = 24 hours beginning 1600 of the date shown. Col. 7 = col. 2 + col. 3 + col. 4 in response to direction (col. 1). Col. 8 = col. 2 + col. 3 + col. 4 – col. 7. Col. 9 = col. 5 + col. 6. Col. 10 = col. 11 – col. 7 – col. 8 – col. 9. Col. 11 = 24 hours of calendar day shown. Col. 12 = Interim Excess Release Quantity (IERQ) bank releases. Th, thermal IERQ bank; —, not applicable]
Table 13.
Daily mean discharge of the Delaware River at Montague, New Jersey (U.S. Geological Survey site number 01438500), for report year ending November 30, 2018.[Data from U.S. Geological Survey (2019d). All values, except for the year’s total discharge volume, are in cubic feet per second (ft3/s). The total discharge volume is given in cubic feet per second accumulated daily ([ft3/s]-d). e, estimated; —, not applicable]
References Cited
Delaware River Basin Commission, 2013, Delaware River Basin Water Code, with amendments through December 4, 2013: Delaware River Basin Commission 18CFR part 410, 175 p., accessed February 18, 2020, at https://www.nj.gov/drbc/library/documents/watercode.pdf.
Nystrom, E.A., 2018, Bathymetry of Ashokan, Cannonsville, Neversink, Pepacton, Rondout, and Schoharie Reservoirs, New York, 2013–15 (ver. 1.2, November 2018): U.S. Geological Survey Scientific Investigations Report 2017–5064, 29, p., accessed January 23, 2019, at https://doi.org/10.3133/sir20175064.
Parties of the 1954 U.S. Supreme Court Decree, 2017, Appendix A—Flexible Flow Management Program in FFMP 2017 operations plan, New Jersey v. New York, 347 U.S. 995: U.S. Geological Survey website, 24 p., accessed August 16, 2024, at https://webapps.usgs.gov/odrm/documents/ffmp/Appendix_A_FFMP-20180716-Final.pdf. [Decree parties are the States of Delaware, New Jersey, New York, and Pennsylvania, and New York City.]
Parties of the 1954 U.S. Supreme Court Decree, 2018, Modification and reissuance of appendix A to the 2017 Agreement for a Flexible Flow Management Program, New Jersey v. New York, 347 U.S. 995: U.S. Geological Survey website, 2 p., accessed August 16, 2024, at https://webapps.usgs.gov/odrm/documents/ffmp/Signed-AppA-Mod-20180716.pdf. [Decree parties are the States of Delaware, New Jersey, New York, and Pennsylvania, and New York City.]
Russell, K.L., Andrews, W.J., DiFrenna, V.J., Norris, J.M., and Mason, R.R., Jr., 2024, Report of the River Master of the Delaware River for the period December 1, 2016–November 30, 2017: U.S. Geological Survey Open-File Report, 2024–1022, 109 p., accessed August 16, 2024, at https://doi.org/10.3133/ofr20241022.
U.S. Geological Survey [USGS], 2019a, USGS 01417000 East Branch Delaware River at Downsville NY: USGS National Water Information System database, accessed January 23, 2019, at https://waterdata.usgs.gov/nwis/dv?cb_00060=on&format=html&site_no=01417000&referred_module=sw&period=&begin_date=2016-12-01&end_date=2017-11-30.
U.S. Geological Survey [USGS], 2019b, USGS 01425000 West Branch Delaware River at Stilesville NY: USGS National Water Information System database, accessed January 23, 2019, at https://nwis.waterdata.usgs.gov/nwis/dv?cb_00060=on&format=html&site_no=01425000&referred_module=sw&period=&begin_date=2016-12-01&end_date=2017-11-30.
U.S. Geological Survey [USGS], 2019c, USGS 01436000 Neversink River at Neversink NY: USGS National Water Information System database, accessed January 23, 2019, at https://nwis.waterdata.usgs.gov/nwis/dv?cb_00060=on&format=html&site_no=01436000&referred_module=sw&period=&begin_date=2016-12-01&end_date=2017-11-30.
U.S. Geological Survey [USGS], 2019d, USGS 01438500 Delaware River at Montague NJ: USGS National Water Information System database, accessed January 23, 2019, at https://nwis.waterdata.usgs.gov/nwis/dv?cb_00060=on&format=html&site_no=01438500&referred_module=sw&period=&begin_date=2016-12-01&end_date=2017-11-30.
U.S. Geological Survey [USGS], 2019e, USGS 01460440 Delaware and Raritan Canal at Port Mercer NJ: USGS National Water Information System database, accessed January 23, 2019, at https://nwis.waterdata.usgs.gov/nwis/dv?cb_00060=on&format=%20html&site_no=01460440&referred_%20module=sw&period=&begin_date=2016-12-01&end_%20date=20 17-11-30.
Glossary
The following definitions apply to various terms and procedures used in the operations documented in this report.
- balancing adjustment
An operating procedure used by the Office of the Delaware River Master to correct for inaccuracies inherent in the design of releases from New York City reservoirs to meet the flow objective at Montague, New Jersey. The balancing adjustment calls for more water to be released when previous directed releases (or lack of releases) were insufficient to meet the Montague flow objective. The balancing adjustment calls for less water to be released when previous directed releases were higher than required to meet the Montague flow objective. The balancing adjustment, based on provisional data, is computed as 10 percent of the difference between the cumulative forecasted directed release and the actual directed release required. The balancing adjustment is applied to the following day’s release design. The maximum daily balancing adjustment is intentionally limited to preclude unacceptably large variations in the adjusted flow objective. Beginning July 15, 2018, the cumulative values and the adjustment are computed only when directed releases are greater than New York City reservoir conservation releases.
- capacity
Total useable volume in a reservoir between the point of maximum depletion and the elevation of the lower crest of the spillway.
- conservation releases
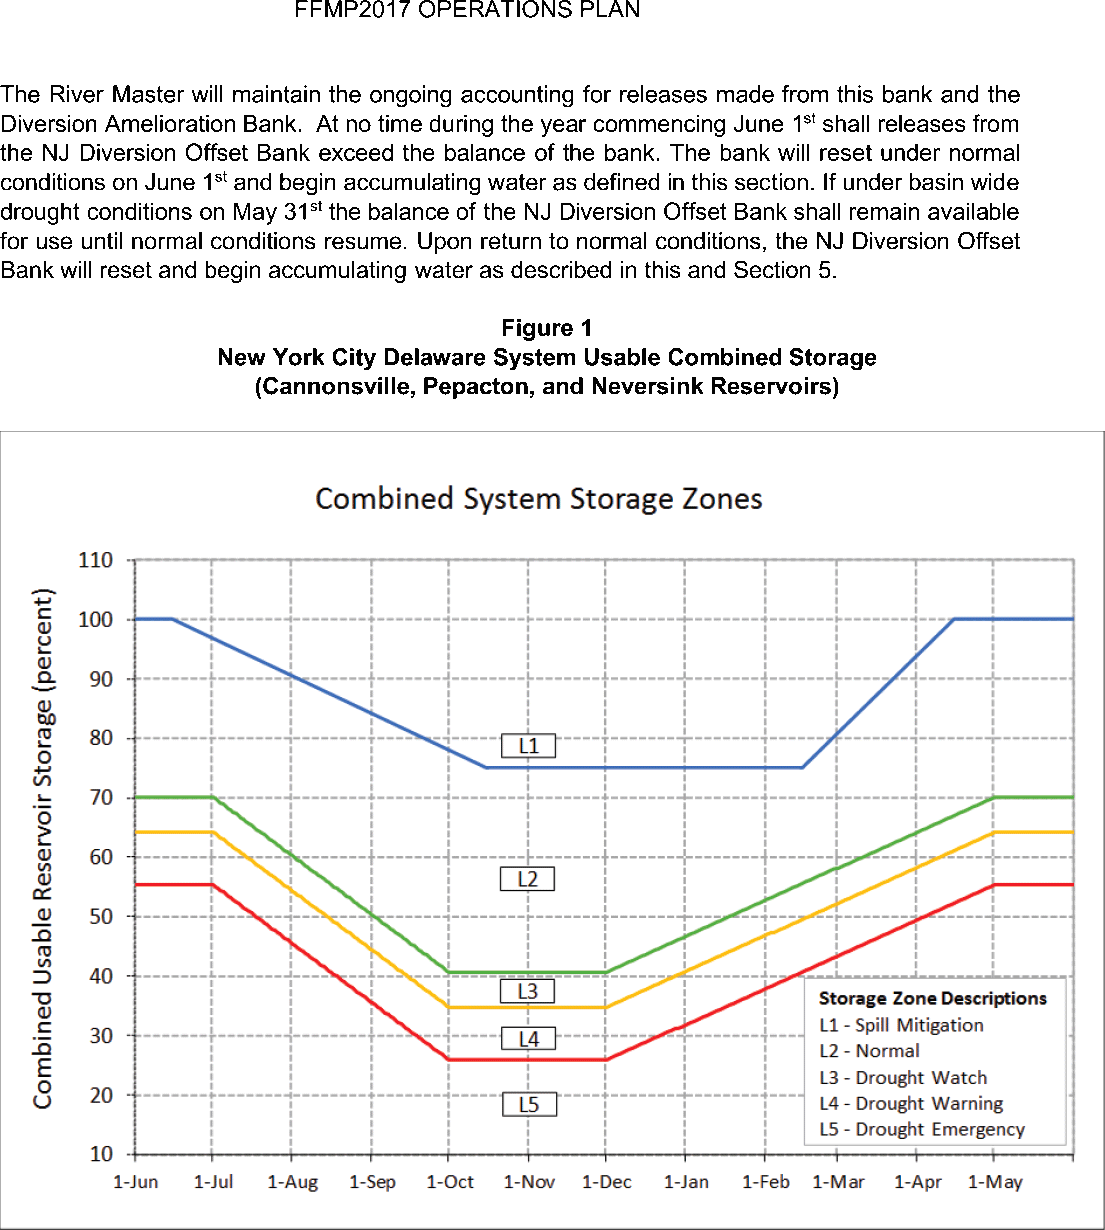
Controlled releases from the Pepacton, Cannonsville, and Neversink Reservoirs designed to maintain specified minimum flows in stream channels immediately below the reservoirs (tailwaters). The following conservation rate zones are defined in the 2017 Flexible Flow Management Program as follows:
L1—Spill mitigation when New York City combined reservoir storage is in the spill mitigation (L1) storage zone.
L2—Conservation releases when New York City combined reservoir storage is in the normal (L2) storage zone.
L3—Conservation releases when New York City combined reservoir storage is in the drought watch (L3) storage zone.
L4—Conservation releases when New York City combined reservoir storage is in the drought warning (L4) storage zone.
L5—Conservation releases when New York City combined reservoir storage is in the drought (L5) storage zone (also referred to as “Drought Emergency”).
- contents
Refer to “Storage.”
- controlled releases
Controlled releases from reservoirs passed through outlet valves in the dams or turbines in powerplants. These releases do not include spillway overflow at the reservoirs.
- directed releases
Controlled releases from New York City reservoirs in the upper Delaware River Basin, designed by the Office of the Delaware River Master to meet the Montague flow objective.
- diversions
The out-of-basin transfer of water by New York City from the Pepacton, Cannonsville, and Neversink Reservoirs of New York State in the upper Delaware River Basin through the East Delaware, West Delaware, and Neversink Tunnels, respectively, to the New York City water-supply system. Also, the out-of-basin transfer of water by New Jersey from the Delaware River through the Delaware and Raritan Canal.
- Excess Release Quantity
As defined by the Decree, the excess release quantity of water is “equal to 83 per cent [sic] of the amount by which the estimated consumption during such year is less than the City’s estimate of the continuous safe yield during such year of all its sources obtainable without pumping.” The excess release quantity shall not exceed 70 billion gallons, and the seasonal period for release of the excess quantity begins on June 15 and concludes on the following March 15.
- Flexible Flow Management Program (FFMP)
A set of rules for the management of storage, diversions, releases, and flow targets relating to the apportioning of water from the Delaware River Basin under the 1954 U.S. Supreme Court Decree and unanimously agreed to by the Decree Parties (Delaware, New Jersey, New York, New York City, and Pennsylvania).
- Interim Excess Release Quantity
An Interim Excess Release Quantity (IERQ) was defined in the 2017 Flexible Flow Management Program (Russell and others, 2024). The IERQ is computed as 83 percent of the difference between the highest year’s consumption of the New York City water-supply system during the period 2002–2006 (1,257 million gallons per day) and New York City’s current estimate of continuous safe yield of the New York City water-supply system of 1,290 million gallons per day, obtainable without pumping. The IERQ resets to 10.0 billion gallons (15,468 cubic feet per second accumulated daily) on June 1st of each year of the Agreement or upon return to normal conditions after drought. The IERQ shall be used as defined below:
Trenton Equivalent Flow Objective: 6.09 billion gallons (9,423 cubic feet per second accumulated daily) of the IERQ, upon request by the Lower Basin States or the Delaware River Basin Commission, New York City shall release from the IERQ water in sufficient quantities to maintain a flow at Trenton of 3,000 cubic feet per second during basinwide normal conditions for the period commencing on June 1 and continuing through May 31. New York City shall make releases from the IERQ as provided above until the aggregate quantity of the IERQ is exhausted.
Thermal Mitigation: 1.62 billion gallons (2,500 cubic feet per second accumulated daily) of the IERQ will be banked and is available during basinwide normal conditions to support mitigation of thermal events that may adversely impact the cold-water fishery below the New York City Delaware River Basin Reservoirs. Use of the water for any single event will be informed by the current and forecasted basin conditions and the thermal mitigation guidance as developed by the Decree Parties. Releases for Thermal Mitigation shall be made at the direction of the New York State Department of Environmental Conservation and administered by the Office of the Delaware River Master (ODRM) and the New York City Department of Environmental Protection (NYCDEP) with notification made to all Decree Parties.
Rapid Flow Change Mitigation: 0.65 billion gallons (1,000 cubic feet per second accumulated daily) of the IERQ will be banked and is available during basinwide normal conditions to mitigate potentially ecologically harmful conditions caused by rapid reductions in the New York City Delaware River Basin reservoir directed releases because of the requirements of the Montague flow objective in Section 2.a. Use of the water for any single event will be informed by the current basin conditions and the guidance for its use as developed by the Decree Parties. Releases to mitigate rapid flow changes shall be made at the direction of the ODRM and NYCDEP, with notification to all Decree Parties.
NJ Diversion Amelioration: 1.65 billion gallons (2,545 cubic feet per second accumulated daily) of the IERQ will be banked and reserved for use during drought conditions (basinwide or lower basin), to supply New Jersey’s increased diversion when the New Jersey Diversion Offset Bank, as described below in Section 4.d., has been exhausted. Once the New York City reservoirs enter into drought watch, the combined storage of the city’s Delaware River Basin reservoirs shall be computed as the actual storage volume minus the New Jersey Diversion Amelioration Bank and New Jersey Diversion Offset Bank volumes for determining storage zones.
Interim Excess Release Quantity Extraordinary Needs Bank: From section 3.d of the 2017 Flexible Flow Management Program (FFMP2017): “In addition to the hydrologic criteria described in Section 2.5.6.A. [sic] of the water code [Delaware River Basin Commission, 2013] and subject to other provisional uses of the Interim Excess Release Quantity (IERQ) as provided herein, the Decree Parties [Delaware, New Jersey, New York, New York City, and Pennsylvania], the DRBC and the River Master may at any time review extraordinary water needs to support such research, aquatic-life, or other water-use activity as may be approved by the DRBC. Upon unanimous agreement, the Decree Parties may bank all or a portion of the IERQ remaining at such time, and such portion shall be placed in an IERQ Extraordinary Needs Bank and used to provide for such extraordinary water needs. Such quantity as may be so banked shall be deducted from the agreed upon IERQ. Any unused Extraordinary Needs Bank water shall be returned to IERQ” (Parties of the 1954 U.S. Supreme Court Decree, 2017).
- key gaging stations
Specific sites on the East Branch Delaware River, West Branch Delaware River, Neversink River, Delaware and Raritan Canal, and mainstem Delaware River where continuous, systematic observations of gage height and discharge are made. Data from these stations are used year-round in Office of the Delaware River Master operations.
- Montague flow objective
In section 2a of the 2017 Flexible Flow Management Program (FFMP2017), “Except with respect to limitations provided herein in Section 5, releases from the City Delaware Basin Reservoirs shall be in quantities designed to maintain, during Normal storage conditions, a minimum basic rate of flow at the gaging station of the U.S. Geological Survey * * * at Montague, N. J. of 1,750 cubic feet per second (cfs), as directed by the River Master in accordance with Section VII. [sic] of the Decree. During Basinwide Drought Watch, Drought Warning, and Drought Emergency, in accordance with Section 5 of this Agreement and Section 2.5.3.B. [sic] and Tables 1 and 2 of the Delaware River Basin Water Code * * *, the Montague flow objective shall vary based upon the time of year and location of the salt front, and minimum compensating releases shall be made by the City of New York from its reservoirs in the upper Delaware Basin” (Parties of the 1954 U.S. Supreme Court Decree, 2017). The Delaware River Basin Water Code can be found in Delaware River Basin Commission (2013).
- point of maximum depletion
The minimum water-surface level or elevation below which a reservoir ceases to continue making delivery of quantities of water for all purposes for which the reservoir was designed. This elevation is referred to as the minimum full-operating level.
- storage
Usable volume of water in a reservoir. Unless otherwise indicated, volume is computed based on the level of the pool above the point of maximum depletion.
- uncontrolled runoff
Streamflow excluding controlled releases. In the context of this report, uncontrolled runoff excludes controlled releases from the Pepacton, Cannonsville, and Neversink Reservoirs; Lake Wallenpaupack; and Rio Reservoir, but include spillway overflow at these dams.
Appendix 1. Modification and Reissuance of Appendix A of the 2017 Agreement for a Flexible Flow Management Program
“Agreement—Effective July 16, 2018—Modification and Reissuance of Appendix A to the 2017 Agreement for a Flexible Flow Management Program.”


“FFMP2017 Operations Plan—Appendix A—Flexible Flow Management Program.”
Conversion Factors
U.S. customary units to International System of Units
Datums
Vertical coordinate information is referenced to the Bureau of Water Supply (BWS) datum, which was established by the New York City Department of Environmental Protection, Bureau of Water Supply.
Horizontal coordinate information is referenced to the North American Datum of 1983 (NAD 83).
Elevation, as used in this report, refers to distance above the vertical datum.
Abbreviations
BWS
Bureau of Water Supply
DRBC
Delaware River Basin Commission
FFMP
Flexible Flow Management Program
FFMP2017
2017 Flexible Flow Management Program
ft
foot
ft3/s
cubic foot per second
(ft3/s)-d
cubic foot per second accumulated daily
HPP
Habitat Protection Program
IERQ
Interim Excess Release Quantity
in.
inch
Mgal
million gallons
Mgal/d
million gallons per day
mi
mile
mi2
square mile
NAD 83
North American Datum of 1983
N.J.
New Jersey
N.Y.
New York
NYCDEP
New York City Department of Environmental Protection
ODRM
Office of the Delaware River Master
OST
Operational Support Tool
Pa.
Pennsylvania
USGS
U.S. Geological Survey
WSC
Water Science Center
For more information about this report, contact:
Delaware River Master, Office of the Delaware River Master,
U.S. Geological Survey.
Visit our website at:
https://webapps.usgs.gov/odrm/
Publishing support provided by the Reston Publishing Service Center
Disclaimers
Any use of trade, firm, or product names is for descriptive purposes only and does not imply endorsement by the U.S. Government.
Although this information product, for the most part, is in the public domain, it also may contain copyrighted materials as noted in the text. Permission to reproduce copyrighted items must be secured from the copyright owner.
Suggested Citation
Russell, K.L., Andrews, W.J., and McHugh, A.R., 2025, Report of the River Master of the Delaware River for the period December 1, 2017–November 30, 2018: U.S. Geological Survey Open-File Report 2025–1051, 79 p., https://doi.org/10.3133/ofr20251051.
ISSN: 2331-1258 (online)
ISSN: 0196-1497 (print)
Study Area
| Publication type | Report |
|---|---|
| Publication Subtype | USGS Numbered Series |
| Title | Report of the River Master of the Delaware River for the period December 1, 2017–November 30, 2018 |
| Series title | Open-File Report |
| Series number | 2025-1051 |
| ISBN | 978-1-4113-4631-4 |
| DOI | 10.3133/ofr20251051 |
| Publication Date | December 01, 2025 |
| Year Published | 2025 |
| Language | English |
| Publisher | U.S. Geological Survey |
| Publisher location | Reston, VA |
| Contributing office(s) | Office of the Associate Director for Water |
| Description | x, 79 p. |
| Country | United States |
| State | Delaware, New Jersey, New York, Pennsylvania |
| Other Geospatial | Delaware River basin |
| Online Only (Y/N) | N |
| Additional Online Files (Y/N) | N |