

Rapid Structured Decision Making for Hypomesus Transpacificus (Delta Smelt) Summer–Fall Freshwater Outflow Management
Links
- Document: Report (1.53 MB pdf) , HTML , XML
- Data Release: USGS data release - Multicriteria decision analysis scores for rapid delta smelt decision analysis
- Download citation as: RIS | Dublin Core
Acknowledgments
The authors greatly appreciate William Smith and Matthew Nobriga (U.S. Fish and Wildlife Service) for their guidance in how to use the individual-based model for delta smelt. Trinh Nguyen (California Department of Fish and Wildlife) provided coding support for optimizing delta smelt individual-based model runs. We also greatly appreciate the advice and guidance provided by Dr. Michael C. Runge, U.S. Geological Survey (USGS), Eastern Ecological Science Center, who served as a senior advisor to the decision analysts. Doctors (Drs.) Michael C. Runge (USGS Eastern Ecological Science Center), Drew Eppehimer (USGS Grand Canyon Monitoring and Research Center), and Michael Colvin (USGS Columbia Environmental Science Center) provided technical peer reviews of workshop materials and presentation slides. Drs. Drew Eppehimer, Michael Colvin, and Matthew Falcy (USGS Idaho Fish and Wildlife Cooperative Research Unit) provided peer reviews and constructive comments that substantially improved our report. The participants in this decision analysis constructively engaged in the structured decision-making process, which was critical to the success of the effort. Participants included Jana Alfonso and Matt Nobriga (U.S. Fish and Wildlife Service); Barbara Byrne and Rachel Alcala (National Marine Fisheries Service); Chandra Chilmakuri, Darcy Austin, Yuan Liu, and Cindy Meyer (State Water Contractors-California); Shawn Acuna and Steve Micko (the Metropolitan Water District of Southern California); Scott Peterson and Deanna Sereno (Federal Water Contractors); David Mooney, Josh Israel, Lilly McCormick, and Alex Vaisvil (Bureau of Reclamation, Bay-Delta Office); Lenny Grimaldo, Brittany Davis, Louise Conrad, Rosemary Hartman, Aaron Miller, and Ian Ueker (California Department of Water Resources); and Ashley Overhouse (Defenders of Wildlife) and Gary Bobker (Friends of the River). The Bureau of Reclamation provided funding for the U.S. Geological Survey and Kearns & West’s support of the analysis. We greatly appreciate the California Department of Water Resources for hosting the workshops and Trisha Madaya, Annie Hoang, and Jackson Gould (Kearns & West) for logistical support. The findings and conclusions in this article are those of the author(s) and do not necessarily represent the views of the Bureau of Reclamation, Metropolitan Water District of Southern California, California Department of Water Resources, or Kearns & West.
Abstract
Managers of the Central Valley Project (CVP) and State Water Projects (SWP) in California are confronted with difficult tradeoffs between water uses and associated values affected by water management decisions. These decisions involve altering the timing and magnitude of water releases from dams and reservoirs, which can affect habitats for economically important and Federally and State-listed endangered fish species, water deliveries for agriculture or municipalities, and water quality. In this report, we describe the results of a rapid structured decision-making process used to assist management agencies in evaluating tradeoffs while gathering input from cooperating agencies, rightsholders, or interested parties (hereafter participants) through facilitated workshops in spring 2025. Consideration of alternative water management actions was initiated by the continued decline of Hypomesus transpacificus (delta smelt) populations and the issuance of a new biological opinion for the CVP and SWP long-term operations on the effects on delta smelt and other Endangered Species Act-listed species in November 2024. An Executive Order was also issued in January 2025, directing the Bureau of Reclamation to maximize water deliveries. Participants, led by the U.S. Geological Survey and cooperating agencies, identified 8 fundamental values (hereafter objectives) and 11 alternative water management scenarios (or “alternative management actions” based on the PrOACT model). Using multicriteria decision analysis, we evaluated performance (or “consequences” based on a consequence table analysis) and analyzed tradeoffs of alternative water management actions to the fundamental objectives. We ranked the alternative water management actions based on four participants’ objective weights and composite utility scores calculated using a linear value function. The three highest ranking alternative water management actions had the poorest performance for delta smelt but performed best for CVP and SWP water exports and objectives related to coldwater pool operations for salmonids. An optimum strategy that could prevent the extinction of delta smelt was not determined for this study. However, insights gained from our rapid decision analysis suggested nonflow scenarios could benefit the delta smelt population, including in drier years, and could be considered to avoid curtailment of water exports.
Plain Language Summary
Decisions on how to store and distribute water in California’s Central Valley are made considering the use of water resources by people, fish and wildlife, and the effects on water quality. Water is stored behind dams throughout the Central Valley for later release into rivers and canals for distribution to meet different water needs. Declining water availability and increasing human demands for water over recent decades have made these decisions increasingly difficult, especially because different uses of water resources often conflict. This report summarizes a facilitated decision-making process, led by the U.S. Geological Survey, involving water, fish, wildlife managers, and those that have an interest in how water is used (interest holders) in the Central Valley. This process provides information for water managers to consider when deciding how to distribute water resources to meet the needs for endangered Hypomesus transpacificus (delta smelt), different runs of Oncorhynchus tshawytscha (Chinook salmon), and Oncorhynchus mykiss (Central Valley steelhead), while maximizing water deliveries for human use and maintaining water quality standards.
Introduction
The Central Valley Project (CVP), which has been operated by the Bureau of Reclamation (Reclamation) since 1951, consists of a vast network of dams, reservoirs, and water conveyance structures throughout the Central Valley of California (Congressional Research Service, 2024). The CVP stores and delivers water from the mountains of northern California to drier agricultural areas, industries, and municipalities in the Central Valley and the southern Central Valley. The CVP also ensures compliance with State and Federal water quality regulations (for example, Public Health and Safety, salinity standards, and others; Revised Water Right Decision–1641), the Endangered Species Act (ESA), and other laws and regulations (Congressional Research Service, 2024). Reclamation uses its authority to mitigate the effects of its operations on ESA-listed species, including the Hypomesus transpacificus (delta smelt), while meeting the needs of water users (Laćan and Resh, 2016). The State of California (“State”) operates the State Water Project (SWP), which includes water infrastructure developed and operated since 1966 for water supply, flood control, and in support of beneficial uses, including hydropower generation, recreation, and environmental stewardship. The CVP and SWP operate water pumping stations in the Sacramento-San Joaquin Delta (“delta”) to provide for these mandated uses, and water operations for both projects are coordinated with water users and environmental and regulatory agencies. The pumping stations supply water through aqueducts and canals to the more arid regions of California. Releases from CVP and SWP reservoirs that store water sourced from the Sierra Nevada Mountains also support compliance with State Water Resources Control Board (SWRCB) salinity standards to ensure water rights are protected, while also maintaining the quality of water exports from the delta (Moyle and others, 2018; Reis and others, 2019).
Since 2008, a September–October release of freshwater was implemented in wet or above normal water year types, designed to maintain the salinity standards of X2 (the location of the low salinity zone as measured in kilometers from the Golden Gate Bridge) at 80 kilometers (km) from the Golden Gate Bridge. This “fall X2” action is meant to benefit delta smelt survival between September and October (U.S. Fish and Wildlife Service [FWS], 2024). The X2 refers to the location of the low salinity zone (2 practical salinity units) in the San Francisco Bay-Sacramento-San Joaquin Delta ecosystem (or delta) ecosystem, as measured in kilometers from the Pacific Ocean at the Golden Gate Bridge inland along the northern axis of the Sacramento-San Joaquin Delta. However, the FWS, in its most recent biological opinion on the long-term operations of the CVP and SWP (FWS, 2024) and given continued declines in delta smelt, the FWS concluded the status quo fall X2 action (X2 at 80 km during fall) was less likely to benefit delta smelt survival compared with other actions. Statistical modeling results indicated more evidence for positive population growth in delta smelt related to elevated freshwater outflows during the summer months of June through August than in September through October (Polansky and others, 2024). In their biological opinion, the FWS noted that a substantial proportion of the available water supply may be required in the summer to achieve positive population growth, depending on the water year type. Uncertainty remains in the mechanistic relations between river and reservoir discharge to the delta, the distribution of prey items and delta smelt, and delta smelt population growth, indicating experimentation or an adaptive management approach may also be beneficial to balance competing water needs and uses.
Water management decisions in California are exceptionally complex and require decision makers to confront tradeoffs between numerous, often conflicting, values. Several State and Federal management agencies and other parties have interests in how the CVP and SWP operate to deliver water to water rights holders and municipalities, meet water quality standards, support recreational and commercial fisheries, and comply with the Federal Endangered Species Act (ESA; P.L. 93–205, 87 Stat. 884, 16 U.S.C. §§1531–1544) and California Endangered Species Act (CESA; California Code of Regulations, title 14, chapter 6, sections 783.0–787.9), among others. In addition to the operations of the CVP and SWP, Reclamation and the California Department of Water Resources (CDWR) are responsible for water storage and release decisions several times per water year. The National Marine Fisheries Service (NMFS) is responsible for the stewardship of marine and anadromous fishes that use the delta and freshwaters for part of their life cycle, and the FWS and NMFS administer Federal ESA compliance for management actions. The California Department of Fish and Wildlife (CDFW) coordinates with other agencies to protect species listed under CESA and administers permits authorizing take of CESA-listed fish and wildlife in California. Water contractors to the CVP and SWP, entities contracted to receive specified amounts of water from these projects, are responsible for further allocating water to their respective service areas and, therefore, have an interest in CVP and SWP operations. Furthermore, wildlife and environmental conservation organizations, and tribal entities, have an interest in ensuring adwete water supplies for their needs. Hereafter, we collectively refer to these agencies, rightsholders, and interested parties as “participants” in the process.
Reliability of the water supply and the ability to meet competing needs for water has also been strained by natural disasters, climate change, and increased demand (Lund, 2016). Given the importance to develop and implement management actions to help offset the decline of the delta smelt and several other ESA-listed species dependent on or affected by water infrastructure and operations (for example, winter-run Oncorhynchus tshawytscha [Chinook salmon]) and the increasing pressures on the available water supply because of drought conditions, CVP and SWP management agencies seek to maximize water delivery while meeting additional mandated beneficial uses.
Purpose and Scope
In this report, we describe a method of rapid decision analysis related to alternative water management scenarios, involving coordinated operations of the SWP and CVP in the Central Valley of California. Structured decision making (SDM), which is synonymous with decision analysis, provides an ideal set of tools to confront tradeoffs because it allows for the decomposition of the decision into more tractable components and puts an emphasis on values-focused thinking (Runge and others, 2020; Hemming and others, 2022). We describe the results of the decision analysis, including the elicitation of inputs from interested parties and State and Federal management agencies involved in water operations in the Central Valley. The goal of the project was to evaluate the performance (termed “consequences” based on a consequence table analysis) of alternative management scenarios considered in this decision context to allow managers to transparently evaluate the tradeoffs among management objectives, while also considering each participant’s values. The decision analysis was done by U.S. Geological Survey scientists, technical staff from the Metropolitan Water District of Southern California, and Reclamation. Meetings and workshops were led by Kearns & West, a facilitation group that was contracted by Reclamation to support the decision analysis.
The timeframe for the decision-making process was accelerated to complete the analysis between mid-February and the end of March 2025. Because of these time constraints, we restricted the time allocated to discuss objectives and alternative management scenarios, and consequence analysis was completed with the use of available predictive models (described in the “Consequences” section below). We describe the details of the process and decision analysis to allow them to be replicated in future years, while recognizing that the analysis to support a one-off decision in 2025 includes elements of risk analysis and dynamic decision problems (refer to Runge, 2020 for more information on types of decisions). Some alternative water management scenarios considered in the analysis could affect facility operations in the future and may be affected by outcomes subject to climate stochasticity. The spatial extent of the project included the Central Valley of California and contributing water reservoirs on the main stem and tributaries of the Sacramento and San Joaquin Rivers, to the delta, and the temporal extent of our analysis included the effects of the alternatives through April 2026.
Legal and Regulatory Context
As part of the reinitiation of consultation for the Central Valley Project, Reclamation submitted a Proposed Action to FWS in 2024 that described a fall X2 component as follows (U.S. Bureau of Reclamation 2024b, p. 3–70): “To increase the amount of low salinity zone habitat for delta smelt, in Wet and Above Normal hydrologic year types, Reclamation and DWR will maintain a 30-day average X2≤80 km for September through October.” Subsequently, the 2024 FWS biological opinion concluded that the fall X2 action, as included in Reclamation’s Proposed Action, was not expected to produce observable effects on delta smelt survival. Specifically, the biological opinion stated: “The fall X2 action is not anticipated to have observable effects on delta smelt survival,” while also acknowledging that “since there may be circumstances when measurable benefits could be achieved with outflow augmentations, adaptive experimentation regarding flow pulses in the summer or fall could be helpful” (FWS 2024, p. 135). Rather than continuing the fall X2 component, Reclamation, along with other governmental agencies involved in the management and regulation of the delta (CDWR, FWS, NMFS, CDFW), seek to evaluate whether targeted summer flow pulses may offer ecological benefits for delta smelt under certain conditions. The modification of fall X2 was also further motivated by the directive in Section 2 of Executive Order 14181, “Emergency Measures to Provide Water Resources in California and Improve Disaster Response in Certain Areas” (January 24, 2025), where it instructed the CVP “to deliver more water and produce additional hydropower, including by increasing storage and conveyance, and jointly operating Federal and State facilities, to high-need communities, notwithstanding any contrary State or local laws.”
Ecological Context
Numerous habitat alterations and other stressors have been linked to the decline of native fishes in the Central Valley of California and the delta (Moyle, 1995). After periods of high abundance during the 1940s–1960s, delta smelt abundance declined because the estuary had substantial ecological change that was driven by extended periods of drought, increased water exports that entrained early life stages of delta smelt at pumping facilities, invasions by several invasive species, contaminants, and expansion of aquatic weeds (Moyle and others, 2018). Dams, water diversions, and conveyance infrastructure have also altered hydrologic, thermal, and sediment transport regimes in rivers after the development of most of the Central Valley’s wetland, riparian, and floodplain habitats for human uses. Riverine spawning habitat for anadromous fishes, including ESA- and CESA-listed winter-run Chinook salmon, Acipenser medirostris (green sturgeon), and Oncorhynchus mykiss (Central Valley steelhead) also became isolated behind many large dams (Yoshiyama and others, 1998; Mora and others, 2009). Winter-run Chinook salmon had spawned in cooler high-elevation tributaries during summer, before the construction of Shasta Dam. Spawning for winter-run Chinook salmon and green sturgeon is now relegated to a fairly limited and artificially cold reach of the main stem of the Sacramento River downstream from Keswick Dam, where temperature requirements for spawning and rearing of these species may conflict (Healy and others, 2024). In addition to the Sacramento River, wild salmonid reproduction now relies on managed flows and temperatures in several rivers, including the Feather River and American River, but populations also persist because of hatchery production.
Current (2024) ecological conditions have resulted in active management of habitat conditions in the Sacramento and San Joaquin Rivers through operations associated with the CVP and SWP’s reservoirs and dams (NMFS, 2024; FWS, 2024). This active management consists of water supply operations intended to meet multiple competing needs for water storage and deliveries, including those for municipal and agricultural use, habitat for salmonids and delta smelt, and for the maintenance of sufficient water quality at CVP and SWP water withdrawal structures in the delta. Freshwater releases meant to maintain water quality in the delta and enhance delta smelt habitat may result in curtailment of water exports, for instance (Moyle and others, 2018). Given the substantial variability in the annual hydrologic conditions related to Sierra Nevada snowpack and snowmelt runoff (Herbold and others, 2022), maintaining operational flexibility to meet habitat needs and water deliveries through reservoir storage can be an important priority for managers. Maximizing storage in reservoirs to protect against drought risk while also managing storage for flood protection may be difficult under uncertain hydrologic conditions.
Methods
This decision framework was developed through discussions with decision makers, primarily Reclamation and CDWR under their respective authorities to manage water as part of the CVP and the SWP, before briefings and invitations to engage in the decision analysis were given to other potential participants in February 2025. However, five agencies also coordinate on water operations, including NMFS, FWS, and CDFW. Reclamation and CDWR chose to use a rapid, structured decision-making process to consider alternative management scenarios in water year 2025 to evaluate and contribute to the recovery of listed species and deliver water to contractors while complying with State and Federal environmental regulations. In the planning stages of the decision analysis, Reclamation and CDWR identified potential interested parties and management agencies to participate in the decision analysis. The interests that would be represented by the invited participants were expected to provide for elicitation of a broad range of objectives linked to water management in the Central Valley. At the direction of Reclamation, our intent was not to seek consensus among invited participants, but to allow each to provide input throughout the process, culminating in a ranking of alternative management scenarios for each participant. Invited participants included State Water Contractors (SWC) that obtain water from the SWP; Federal water contractors that obtain water through the CVP (Central Valley Project water contractors [CVPC]), FWS, NFMS, CDFW, non-governmental organizations (Defenders of Wildlife and Friends of the River); and the CDWR tribal liaison (to engage with local Tribes). We presented a timeline for the decision analysis during initial virtual briefings with invited participants that responded to the invitation. During these briefings, we solicited concerns about the process, which included the short timeframe for the decision analysis, staff availability to participate on short notice, and issues related to potential biases that may be injected into the decision analysis. Representatives from CDFW were invited but chose not to participate in the SDM effort.
The outcome of this dynamic decision analysis (Runge, 2020) is dependent on the forecasted state of the 2025 water year hydrology, as defined by the Sacramento Valley Water Year Hydrologic Classification Index (hereafter “Water Year Index”; California Environmental Protection Agency, 2000), and actions taken in 2025 may affect the state of the water supply in water year 2026. A summer or fall X2 action would only happen if the Water Year Index forecasted on May 1st had “above normal” or “wet” runoff (greater than [>] 7.8 million acre-feet [maf]). Effects to operations in water year 2026 depend on future Water Year Index projections that are directly linked to uncertain fall-winter 2025–26 snowpack and runoff from the Sierra Nevada, which is the primary source for recharging CVP and SWP water supply reservoirs. Above normal or wet years happen with a frequency of 4.3 years out of 10 (data available from the California Data Exchange Center, CDWR; https://cdec.water.ca.gov/). Given the uncertainty in the next water year’s hydrology and beyond, managers may prefer to retain operational flexibility by maximizing water storage in reservoirs at the end of water year 2025 (through September 2025).
The decision to consider alternative water management scenarios was in response to the issuance of a biological opinion in November 2024 (FWS 2024) about the effects of long-term operations of the CVP and SWP on delta smelt and other Endangered Species Act-listed species. In the biological opinion, FWS noted new evidence indicating the fall X2 action may not have anticipated positive effects on delta smelt survival, but an elevated flow in the summer may be more likely to produce positive population growth (Polansky and others, 2024). Reclamation and CDWR intended to use the decision-making process to seek input from cooperating agencies, interested parties, and Tribes to inform a decision concerning actions that can be taken during the summer and fall of 2025 to support delta smelt while considering tradeoffs between competing water needs.
We followed the PrOACT model of decision analysis to guide water management decisions in 2025, which includes developing the problem statement (Pr) to ensure a common understanding of the decision at hand, establishing objectives (or the values of participants [O]), developing alternative management scenarios (or alternative management actions [A]) designed to meet the objectives, predicting the performance (or consequences [C]) of the management alternatives to the objectives, and identifying the tradeoffs (T) between them (fig. 1; Hammond and others, 1999). Through initial briefings with invited participants, and with input from participants, the problem statement for this decision analysis was defined as:
The U.S. Bureau of Reclamation (Reclamation) and California Department of Water Resources (CDWR), under their respective authorities to manage water as part of the Central Valley Project (CVP) and State Water Project, are considering alternative management strategies to improve conditions for listed species and deliver adequate water supplies to contractors, while complying with State and Federal environmental regulations. The decision to consider alternative management strategies was triggered by the issuance of endangered species authorizations for long-term operations (LTO) of the Central Valley Project and State Water Project on delta smelt and other Endangered Species Act-listed species in November 2024. The 2024 LTO of the CVP (U.S. Bureau of Reclamation, 2024a) states that published life cycle models… “support the hypothesis that Delta outflow in the summer has a stronger effect on delta smelt survival than Delta outflow in the fall ” and therefore, indicated that “evaluation of the fall X2 action will occur on a shorter timeframe...” Reclamation and CDWR seek input from cooperating agencies, interested parties, and Tribes to inform a decision concerning actions that can be taken during the summer through fall of 2025 to evaluate tradeoffs among identified objectives.
Constraints were also identified by the decision makers early in the process—these constraints were related to alternative management actions that would not be considered in this decision analysis, including operation of the Suisun Marsh salinity control gates outside of existing operations and allocation of stored water under other agencies’ jurisdictions. Decision makers clarified nonflow actions may be considered in addition to summer or fall flow actions.
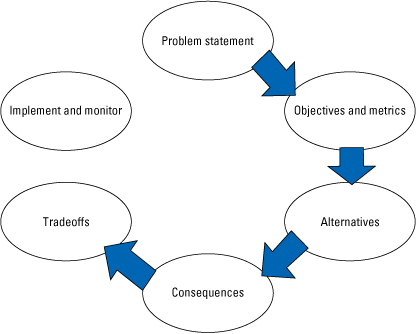
Diagram showing the PrOACT (problem statement, objectives, alternatives, consequences, tradeoffs) model for decision analysis used in this project (adapted from Gregory and others, 2012). Decision analysis follows a directional cycle beginning with the problem statement and ending with implementation and monitoring.
Objectives
A decision is ultimately a direct expression of the values of a decision maker (Keeney, 1992). Consequently, a first step to making an effective decision is to ensure a comprehensive and complete set of values are considered. Fundamental objectives in decision analysis represent values that may be affected by a decision and are what decision makers or the general public are interested in (Gregory and others, 2012; Runge and Walshe, 2014). Other types of objectives, like “means” objectives that are generally only important as intermediate steps or to signify progress toward the fundamental objectives, may distract participants, analysts, and decision makers from addressing objectives important to the decision-making process and lead to poor decisions (Runge and Walshe, 2014; Converse, 2020). Performance metrics, sometimes referred to as measurable attributes, are measures of the performance of consequences of the alternative management scenarios or actions with respect to the fundamental objectives. The fundamental objectives and relative importance of each (objective weights), as defined in this report, are only relevant to this specific decision context and are not meant to be universally applicable or transferrable to other decisions.
To prepare for in-person workshops, we held virtual briefings where individual agency participants were asked to prepare short descriptions of proposed objectives, performance metrics, and alternative management actions that are important to their respective agency or organization to be considered in the decision analysis (app. 1, table 1.1, fig. 1.1). A series of questions were provided to participants to help them identify fundamental objectives, including an example of means versus fundamental objectives. Most participants submitted draft ideas for objectives in writing before the first in-person workshop, including CDWR, NMFS, FWS, SWC, Reclamation, and the CVPC. These objectives were mostly considered means objectives (app. 1), which are a common focus of science-based organizations (for example, an emphasis on ecosystem drivers; Runge and Walshe, 2014). However, incorporating means objectives into a multicriteria decision analysis (MCDA) can lead to a lack of independence between performance metrics and double counting or other violations of analytical assumptions (Gregory and others, 2012; Runge and Walshe, 2014). Means objectives can be incorporated into models that are used to predict consequences. For example, some of the means objectives listed by participants early in the decision analysis related to specific demographic rates such as monthly survival or other linked drivers such as somatic growth, habitat suitability, or food resources for delta smelt (fig. 2). By themselves, the strength of each of these drivers may vary and contribution toward persistence of delta smelt is uncertain. However, when combined into a population model, drivers may be appropriate for predicting the consequences of alternative actions on delta smelt population dynamics (Smith and Nobriga, 2023). Population-level dynamics and persistence are more likely what decision makers ultimately care about (Runge, 2021). Thus, a first step in our analysis was separating means objectives from fundamental objectives and then incorporating them into appropriate predictive models (Runge and Walshe, 2014)—doing this and establishing performance metrics were the focus of our first two workshops.
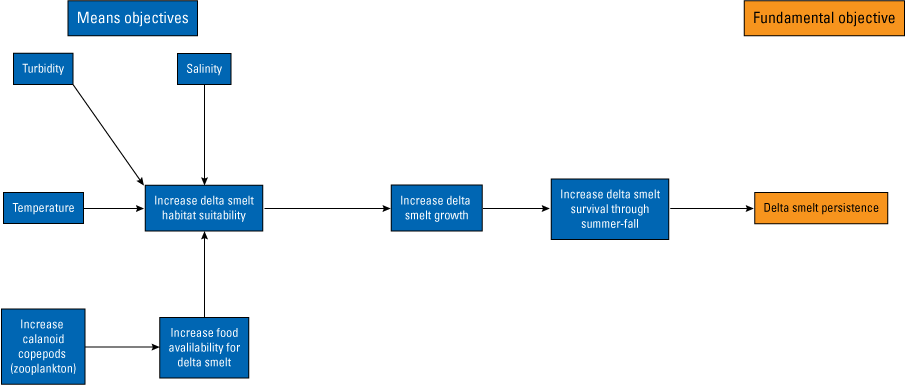
Diagram showing the objectives hierarchy for Hypomesus transpacificus (delta smelt). Means objectives are related to each other and contribute toward the fundamental objective of delta smelt persistence as evaluated in the ProACT model.
The preliminary fundamental objectives and performance metrics were refined in a group setting during in-person or hybrid virtual/in-person workshop sessions on February 13, 20, and 21 and March 11 and 18, 2025, in Sacramento, California. We allowed participants an opportunity to share their objectives and openly discuss their values during these meetings. The participants agreed to population-level objectives for delta smelt, such as persistence or population growth, which represented the group’s fundamental objective. We also narrowed down other fundamental objectives related to water supply for the CVP and SWP, avoiding negative effects to other ESA-listed species, costs of nonflow actions, feasibility for 2025, and water quality and human health. Assuming that water could be delivered by the CVP or SWP, water infrastructure was sufficient to meet outflow habitat goals and serve many different customers, and because the CVP and SWP operate under different authorities, we separated water supply objectives for the CVP and SWP. We later removed feasibility and cost as objectives when the decision makers determined they did not expect that feasibility would be a factor when considering tradeoffs between alternative management actions (all alternatives proposed for analysis could be considered for implementation in 2025) and nonflow action management alternatives relating to costs could not be modeled in time to include in the MCDA composite score calculations at the end of the workshops (March 26, 2025).
The SDM analysis team (including authors BH, CP, BM) further refined objectives to ensure best practices for decision analysis were adhered to, to the extent possible (Gregory and others, 2012; Conroy and Peterson, 2013; Runge and others, 2013), while striving to ensure the objectives and associated performance measures met basic assumptions for MCDA (for example, objectives are clearly defined and preferentially independent; Gregory and others, 2012; Converse, 2020). The SDM analysts met with technical specialists from NMFS, Reclamation, CVPC, and the SWC to further refine objectives and performance metrics for salmonids, water quality and public health, and water supply. During a March 11, 2025, meeting with participants, we presented refinements we had made to the objectives and performance metrics and received additional suggestions for the final set of objectives. Feedback from participants involved the need to address water costs and specific water deliveries by type of contract, additional objectives related to operational flexibility for salmonids, and risks to the water supply in future years because of summer-fall flow actions. Some feedback represented specific values participants placed on reservoir storage that would allow them to meet operational objectives for a single or multiple salmonid species. For water conveyance metrics and water cost performance metrics not specifically addressed in our analysis, Reclamation agreed to provide outputs from the water planning model with parameter estimates to enable participants to interpret how the alternative management actions affected their specific interests. Final objectives involved delta smelt and water supply exports and objectives identified to minimize risk to water operations and minimize negative effects to operations to maintain habitat for State and federally listed salmonids (table 1). We describe each of the finalized fundamental objectives and the final performance metrics in detail in later sections (consequence estimation methods are described in the “Consequences” section below).
Table 1.
Fundamental objectives and performance metrics used in the decision analysis and their descriptions.[The range of values was generated for each fundamental objective using predictive models described in the text. <, less than; ANN EC, Jersey Point Artificial Neural Network conductivity; >, greater than]
Objective 1: Maximize Delta Smelt Persistence
The objective to maximize the persistence of delta smelt involves population viability, including the ability for managers to collect sufficient brood stock (number of mature adult fish) to maintain hatchery supplementation programs that have allowed for the persistence of delta smelt in the wild since about 2021 (FWS, 2024). A hundred wild brood stock that were spawned or grew up in the delta is the goal to be collected annually to limit the risk of deleterious genetic changes, which indicates, based on FWS calculations, 400,000 to 500,000 fish would need to be produced and released from hatchery stock to meet this target (FWS, 2024). However, hatchery capacity may be currently limited in 2024.
Delta Smelt Performance Metric
We evaluated consequences of alternative management actions for 2025 by applying said actions to a simulated historical time series (1995–2014). We assumed that the expected minimum population size, or the smallest population size that would be expected in each above normal or wet year over a simulated 20-year time frame, would provide an appropriate measure of the propensity of delta smelt to decline (McCarthy and Thompson, 2001; Healy and others, 2024). The largest minimum population size would be expected to represent the alternative most likely to support persistence of delta smelt. Minimum abundance predictions taken from the 20-year simulation for each alternative also served as an indicator of whether sufficient brood stock could be collected (for example, less than [<] 400,000 indicates lower likelihood of persistence). The consequences of alternatives are estimated in later sections of this report, but in summary, the performance metric is calculated by taking the minimum population size over the 20-year simulation for each of the simulated population trends (N=330 replicates to balance run time while allowing credible intervals to be estimated) and taking the average of those minimum abundances.
Objective 2: Maximize Central Valley Project Water Supply
California CVP water deliveries are subject to climate variability and can be curtailed in years with dry hydrologic conditions—Reclamation was unable to supply water to most CVP agricultural water service contractors in 4 of the past 11 years due to inadequate water supply in dry years (Congressional Research Service, 2024). Water from two pumping facilities in the delta, Banks and Jones Pumping Plants (U. S. Bureau of Reclamation, 2024a), supports CVP water deliveries through the Cross Valley Canal and through the Delta-Mendota Canal, respectively. Water exported from these facilities serves water service contractors, wildlife refuges, agricultural, and municipal uses in the San Joaquin Valley, and San Benito and Santa Clara counties. Banks Pumping Plant is operated by the SWP, and a share of this water supports CVP water exports and deliveries in the Central Valley.
Central Valley Project Water Supply Performance Metric
The performance metric as the fundamental objective for the CVP water supply was the estimated total annual (contract year) water volume exported (thousand acre-feet [taf]) from the Banks and Jones Pumping Plants that are allocated to CVP water uses in 2025 and 2026. The CVP water contract year was defined as March to February.
Objective 3: Maximize State Water Project Water Supply
The SWP, operated by CDWR, also provides water for municipal and industrial use water contractors as well as agricultural users, but deliveries can also be curtailed during dry years (Congressional Research Service, 2024). About 27 million California residents are served by the SWP, which consists of 29 public agencies and local water districts that are referred to collectively as the “State Water Contractors” (SWC)—additional benefits of SWP water management include power generation, recreation, and environmental stewardship (CDWR, https://water.ca.gov/Programs/State-Water-Project). The SWP diverts and pumps water from the Southern Delta into the California Aqueduct via the Harvey O. Banks (Banks) pumping plant.
Objective 4: Maximize Water Quality and Public Health
Water quality regulations, set by the SWRCB, are meant to maintain desired salinity levels for in-delta water diversions and fish and wildlife. These regulations may affect the amount of water that is pumped and exported from the delta for CVP and SWP water users. The magnitude of restrictions on pumping because of water quality concerns also varies depending on annual hydrology (Congressional Research Service, 2024). Participants noted water quality in the delta affects municipal drinking water treatment operations, and there was a desire to minimize excessive treatment processes.
Water Quality and Public Health Performance Metric
Jersey Point conductivity values estimated from a water planning model (refer to consequences below) were used to assess potential effects on human health in the Sacramento-San Joaquin Delta. Experts from Contra Costa Water District and SWC suggested values below 700 micromhos per centimeter (µmho/cm) represent a range where human health concerns are not likely to happen, and that values above 1,800 µmho/cm are what water operations should try to avoid, when possible, because of human health concerns (Deanna Sereno and Lucinda Shih, Costa Water District, written commun., March 10, 2025). Some municipal and industrial water sources may require additional treatment to avoid human health concerns if between 700 and 1,800 µmho/cm. A constructed scale was used to estimate the consequences of alternative flow management actions in 2025 where the conductivity values at Jersey Point in the 12 months after action years (for example, June to May in “Above Normal” or “Wet” water year types) were converted to the following values and then averaged: <700 µmho/cm=1,700–1,800 µmho/cm=0.5, >1,800 µmho/cm=0.
Objective 5: Minimize Winter-Run Chinook Salmon Redd Dewatering
Endangered winter-run Chinook salmon spawn in the Sacramento River downstream from Keswick Dam, and Shasta and Keswick dams are operated by Reclamation to maintain habitat for spawning and early life stages (NMFS, 2014). Down-ramping of late-summer or fall flows after the summer peak, which coincides with winter-run Chinook salmon redd construction and egg laying (April to mid-August; Dusek-Jennings and Hendrix, 2020), can lead to redd dewatering and complete egg mortality within dewatered redds. However, adult salmon may be enticed to spawn at higher streambed elevations when river flows are higher, but reduced flows during late summer and fall months could dewater redds, depending on the down-ramping timing and rate.
Objective 6: Central Valley Steelhead and Fall-Run Chinook Salmon
Central Valley steelhead, the anadromous form of Oncorhynchus mykiss (rainbow trout) inhabiting the Sacramento and San Joaquin Rivers and tributaries, are listed as threatened under the ESA, and those in the American River have also declined substantially since 2003 (NMFS, 2024). Steelhead and fall-run Chinook salmon spawn downstream from Folsom Dam on the American River. With respect to steelhead, Reclamation’s American River operations and Folsom Lake management are designed to manage water supply and water temperatures and minimize redd dewatering for both species of fishes between January through May (NMFS, 2024). Water stored in Folsom Lake may also be used to maintain delta water quality standards or to implement pulse flows to cue smolting of juvenile salmonids. Uncertainty in winter hydrology requires Reclamation to consider a December forecast (in May of the previous year) of at least 300 taf for Folsom Lake to be sufficient to allow for temperature management for American River salmonids during summer and fall seasons. If the May forecast for December indicates the volume of Folsom Lake would be less than 300 taf, operational adjustments would be needed to maintain suitable temperatures for salmonids and avoid increases in mortality.
Objective 7: Maximize Coldwater Pool and Reservoir Operational Flexibility for the Central Valley Project
Actions that reduce storage in Shasta Lake may cause water temperature goals or other habitat needs for winter-run Chinook salmon to be harder to meet, as well as downstream water uses. The persistence of winter-run Chinook salmon now partly relies on reproduction happening only downstream from Shasta Dam over the summer months (Yates and others, 2008). Shasta Dam operations strive to maintain sufficient coldwater pool volume in Shasta Lake to enable dam discharge temperatures to minimize egg-to-fry mortality. End of April reductions in storage in water year 2026 could result in insufficient coldwater pool that is maintained in Shasta Lake to meet temperatures to maximize egg-to-fry survival for winter-run Chinook salmon in the Sacramento River below Shasta Dam (Healy and others, 2024). Shasta Management Plan goals include making sure that Shasta Lake storage volume exceeds 3.7 maf at the end of April, and end of September storage is at least above 2.4 maf, which signifies hydrologic conditions are adequate to meet water supply demands from Shasta Lake and minimize temperature-dependent, egg-to-fry mortality of winter-run Chinook salmon (NMFS, 2024).
Objective 8: Maximize Coldwater Pool and Reservoir Operational Flexibility for the State Water Project
Participants were concerned that the River Valve Outlet System (RVOS) at Oroville Dam would not be operational in 2025 while it was undergoing maintenance. Without this outlet system, the ability to withdraw cooler water at lower depths in Lake Oroville is severely limited. Therefore, Lake Oroville would need to maintain higher storage throughout the temperature management season (summer) so the functioning outlet facilities (for example, not the RVOS) can withdraw water at low enough temperatures to meet Feather River temperature compliance for salmonids in the summer of 2025, while allowing for flexibility to meet other water deliveries.
Coldwater Pool Operational Flexibility—State Water Project Performance Metric
The performance metric for the SWP coldwater pool operational flexibility objective was defined by participants as the probability of exceeding 1.85 maf of storage in Lake Oroville at the end of September 2025 calculated from selected simulated action years (for example, “wet” or “above normal” water years based on the Sacramento Valley water year index).
Other Proposed Objectives Considered
Multiple participants highlighted the need to avoid or minimize the negative consequences of flow actions to State and Federal ESA-listed fishes and a semiaquatic species, the Thamnophis gigas (giant garter snake). Green sturgeon also spawn and rear in the tailwater downstream from Shasta Dam in the Sacramento River (Poytress and others, 2024). Warmer temperatures in the coldwater pool that result when Shasta Lake is depleted may lead to enhanced population growth for green sturgeon (Healy and others, 2024). In contrast, after wet years when Shasta Lake storage volumes are generally higher, cold-water releases may limit green sturgeon reproduction. During workshop discussions, many of the participants agreed effects to the giant garter snake or green sturgeon may not be important to the decision at hand, and we elected not to carry forward objectives related to these species in the analysis.
Participants were also concerned with the effects of the outflow actions on water allocations and the distribution of water to disadvantaged communities. Although participants recognized the management alternatives considered in this analysis may not differentially affect communities, quantifying and documenting the effects of the actions post hoc was prudent. We discuss the consequences of the alternative water deliveries to disadvantaged communities later in this report.
Alternative Management Actions
The participants largely focused on alternative management actions involving flow alterations because of their interest in having actions that can realistically be implemented in the summer-fall of 2025. The three types of flow actions considered were: (1) one that pertains to a specific target for delta outflow and the amount of freshwater moving from the Sacramento-San Joaquin Delta (delta) downstream into Suisun Bay; (2) one that targets a particular X2 (where near bottom salinity is two practical salinity units measured as kilometer distance from the Golden Gate Bridge in San Francisco, California); and (3) one pertaining to how the Suisun Marsh salinity control gates operates, a tidal gate facility that can bring in freshwater into a brackish tidal marsh region downstream from the delta (for example, Suisun Marsh). A couple of nonflow actions were also brought up during the discussion: treatment or removal of aquatic weeds from parts of the delta and drainage of water from managed tidal wetlands in Suisun Marsh.
Lower salinity and higher outflow conditions in the system can benefit delta smelt in a few ways. First, lower salinity in Suisun Bay and Suisun Marsh may lead to higher numbers of delta smelt in both regions. Suisun Bay and Suisun Marsh are more turbid than the delta, which has experienced major reductions in turbidity affiliated with the proliferation of invasive aquatic plants (Hestir and others, 2016). Turbidity is purported to be an important modulator of delta smelt’s success or failure within the food web (reviewed in Smith and Nobriga, 2023). Suisun Bay is also generally 1–2 °Celsius cooler than the delta, which is often warm enough to limit delta smelt growth. Additionally, for nearly 40 years, a Potamocorbula amurensis (nonnative bivalve, brackish-water corbicula) has depleted the pelagic productivity of low-salinity habitat indexed by X2 (Kimmerer and Thompson, 2014; Kratina and others, 2014), leaving it dependent on zooplankton subsidy from the delta to feed pelagic fishes like delta smelt (Kimmerer and others, 2019). Zooplankton subsidy increases with higher outflow (Hassrick and others, 2023), and thus, may provide added benefit to delta smelt when outflow is increased and/or X2 is lowered.
For flow actions in the summer (June–August), the participants focused on delta outflow targets based on the findings in Polansky and others (2024). The target value of 10,200 cubic feet per second (ft3/s) was chosen based on the 25 million square meters per day summer delta outflow described by Polansky and others (2024) as being associated with a 50 percent probability of population growth. Some alternative summer delta outflow targets used 20,400 ft3/s instead because that value appears to be associated with an about 75 percent probability of population increase (Polansky and others, 2024). Polansky and others’ (2024) life cycle model used overall average summer delta outflow from June to August as a predictor. As such, an evenly distributed flow across the 3 months might not be needed or if the action mimics a more historical flow pattern, where flow in the month of June is higher than flow in the months of July and August. Both types of summer action alternatives were created to evaluate the performance of these two differing hydrologic conditions (table 2).
Actions surrounding delta outflow in the fall months (September–October) followed the “fall X2” action framework, where the water projects would target X2 at a particular location rather than outflow rate. The fall X2 action was originally described in the FWS 2008 Reasonable and Prudent Alternative (FWS, 2008) and was motivated by concerns about abiotic habitat for delta smelt being compressed in the fall months (Feyrer and others, 2011). X2 at 74 km would be roughly aligned with Chipps Island, whereas X2 at 80 km would be about in the confluence between the Sacramento and San Joaquin Rivers. Both locations are downstream from the Sacramento-San Joaquin Delta and are based on the purported mechanism of the flow action, X2 at 74 km may offer more benefit to delta smelt than X2 at 80 km.
Suisun Marsh is one of the largest contiguous tidal marshes in the San Francisco Bay-Delta and thought to be an important rearing area for delta smelt (Hammock and others, 2015). The general seasonal pattern for the Suisun Marsh is for salinity to increase in summer and fall as freshwater inflow decreases. A tidal gate facility towards the upstream end of Suisun Marsh, referred to as Suisun Marsh salinity control gates, is often operated in wintertime to decrease salinity for managed waterfowl habitat. Use of the Suisun Marsh salinity control gates in the summer-fall period may provide delta smelt with access to a more turbid habitat (Sommer and others, 2020). Under current operations, the Suisun Marsh salinity control gates are operated for delta smelt for 60 days from June to October whenever a salinity threshold is exceeded during above normal, below normal, and dry years after wet or above normal years (refer to U.S. Bureau of Reclamation, 2024b). The gates are also operated for 30 days in dry years after below-normal years. The gates can be operated in alternate ways. For example, the gates can be operated continuously for the 60 days, or they can be operated using a 7 days on and 7 days off schedule to extend how long they operate (albeit at the cost of higher salinity overall with this extended period).
For nonflow actions, aquatic weed control may benefit delta smelt by increasing turbidity via the removal of invasive aquatic plants prevalent in the delta (Hestir and others, 2016), though the exact method (for example, mechanical removal versus herbicide treatment) was not discussed or specified by participants during the workshops. Another nonflow action brought forth by participants was the managed wetland flood-and-drain operations in Suisun Marsh, which can promote food export from the managed wetlands to adjacent tidal sloughs. The group of participants had some disagreements about whether these nonflow actions could be implemented in 2025; however, the participants agreed that alternatives, including nonflow actions, should be analyzed and evaluated. We could not fully evaluate the effects of nonflow actions during the workshops because of a lack of information necessary for modeling the consequences of nonflow actions. However, additional data were gathered after the last workshop to allow for a post hoc analysis of the effects of portfolio alternatives with aquatic weed control. We discuss the effects of two nonflow action alternatives in appendix 2. The description of alternatives considered in our decision analysis is displayed in table 2.
Table 2.
Alternative management actions considered in the decision analysis and their characteristics.[X2, the location of the low salinity zone as measured in kilometers from the Golden Gate Bridge; km, kilometer; NA, not applicable; ft3/s, cubic foot per second; ~, approximate]
Consequences
In decision analysis, consequence estimation involves making predictions about how the alternative management actions perform for each objective, so decision makers can later choose a management action that may most likely lead to a desirable future outcome. Consequences can be estimated using expert elicitation, or quantitative models, if available (Hemming and others, 2018). We used available quantitative models to estimate consequences for each of the 8-performance metrics for the objectives. The temporal scale for consequence predictions differed between performance metrics, but we assumed alternative management actions considered in our analysis would be implemented in an above normal or wet year, and the effects of alternatives we considered in our analysis for water year 2025 may affect reservoir operational flexibility and coldwater pool objectives in 2026. Our modeling team consisted of technical experts from Reclamation, with technical support provided by FWS and CDWR technical experts.
We used the California Simulation Model (CalSim; CDWR and Reclamation, 2002; Draper and others, 2004), which is the water operations model used by Reclamation and CDWR for CVP and SWP water operations planning, to analyze alternative water management actions in our study. For our analysis, we used the most recently updated version of CalSim—CalSim 3 (CDWR, 2022). The primary input to CalSim 3 consists of a 100-year (1922–2021) historical sequence of empirical monthly river flows in California’s Central Valley, which can then be adjusted to represent numerous user-defined water demand and management scenarios from which the model generates hydrologic outputs over multiple years (CDWR, 2022). Some of the user-defined input variables include agricultural, urban, and managed wetland water demands, return flows, and groundwater recharge rates. Based on this array of inputs, CalSim 3 calculates river and stream flows, water diversions and return flows, reservoir storage, deliveries to water users, salinity at Suisun Marsh and its corollary (X2), and delta outflow—these outputs, which include reservoir storage volume exceedance probabilities, provided the basis for additional modeling to predict consequences for delta smelt and winter-run Chinook salmon redd dewatering, as we describe below. We used the 2024 set of environmental regulations as a baseline for our analysis of consequences (refer to U.S. Bureau of Reclamation, 2024a). A detailed description of CalSim 3 is available from the CDWR: (https://data.cnra.ca.gov/dataset/calsim-3-0-release).
Uncertainty and Value of Information
Decision makers often contend with uncertainty when predicting and weighing consequences of actions—not knowing the true state of the system (for example, because of limitations of monitoring), limited ability to predict future conditions, or uncertainty in how the ecosystem may respond to management makes decision making more challenging. However, these uncertainties are only important to the decision if the choice of management action would change depending on the true hypothesis explaining system dynamics. Value of information (VOI) tools are used as a sensitivity analysis for decision makers, which allows improvements in management performance to be quantified if a decision maker waits to gather more information to reduce uncertainty before making a decision (Runge and others, 2011; Bolam and others, 2019; Smith, 2020a). VOI is expressed as the expected value of perfect information (EVPI), which reflects how much (as a percentage, in MCDA) performance can be anticipated to improve with respect to the objectives if all uncertainty was eliminated. An EVPI of 0 indicates uncertainty does not have an effect on the decision. If a decision is sensitive to uncertainty, and the uncertainty is reducible through further monitoring or research, formal adaptive management can be used to implement recurrent management actions while monitoring happens (Walters, 1986; Lyons and others, 2008). Alternatively, a decision can be made in the face of uncertainty using a formal risk analysis that also accounts for a decision maker’s risk attitudes (Runge and Converse, 2020). Both adaptive management and risk analysis are outside the scope of our study, but these tools could be used to support future recurrent summer-fall habitat action decisions.
Several sources of uncertainty may affect water management decision making in the Central Valley. Uncertain future hydrological conditions and reservoir inflows related to Sierra Nevada snowpack in water years 2025 and 2026, responses of ecological drivers to management actions, and mechanistic relations between environmental drivers and demographic rates of Central Valley fishes may challenge decision making (Healy and others, 2024). The water year type in 2025, and thus, water availability for habitat actions in that year, would affect whether a flow action could be taken to benefit delta smelt in 2025—an action can only be taken in above normal or wet year types (U.S. Bureau of Reclamation, 2024a; FWS, 2024). The consequences of any flow actions may also differ depending on water year type (system state; Lyons and others, 2008), but the 2025 water year type would not be known with certainty until May 2025 (after our analysis). Decision makers and SDM participants also expressed concern about the risk of negative consequences of actions in 2025 to water management operational flexibility in water year 2026. Winter 2025–26 hydrology, which cannot be predicted with certainty, is expected to have a strong effect on the water availability and operational flexibility of CVP and SWP reservoirs in 2026. Finally, baseline CalSim 3 assumptions for water simulation modeling may affect predicted consequences.
To account for the uncertainty of water year type in 2025, we assumed the water year type was at least above normal, which is the drier of the two expected water year types (as of March 2025). We also estimated the probability of meeting reservoir storage threshold performance metrics in 2025 and 2026 as they are described in later sections of this report. Probabilistic estimation of these storage thresholds based on the 100-year hydrological time-series inputs to CalSim 3 was used to account for the uncertainty of water year type in 2025 and 2026, where appropriate, and noted in later sections of this report. Preliminary review of the initial CalSim 3 simulations using baseline hydrological parameters used by CDWR (CDWR, 2023) and compared with outputs from recent analysis by Reclamation using Reclamation’s median 2022 baseline hydrology (U.S. Bureau of Reclamation, 2024a) suggested potentially important different consequences may be generated by the competing models. There are differences in assumptions between the Reclamation median 2022 hydrology and CDWR baseline hydrology and how they relate to runoff timing and magnitude and the degree that saltwater intrudes into the delta, among other factors. To account for these differences and assess their importance to decision making, we used both alternative baseline hydrologic rulesets (U.S. Bureau of Reclamation, 2022; CDWR, 2023) to estimate consequences. Reclamation and CDWR managers suggested we consider equal weights that represented equal belief in the alternative baseline hydrology models for our analysis. We then used VOI tools and calculated the percentage of EVPI to assess the sensitivity of water management decisions to uncertainty in baseline hydrological conditions (U.S. Bureau of Reclamation, 2022; CDWR, 2023).
Estimation of Consequences for Delta Smelt
Consequences of the alternative management actions to delta smelt minimum abundance were estimated using a published individual-based life cycle model (IBMR, Rose and others, 2013) implemented in R language (R Core Team, 2019). The model output includes an estimate of the population growth rate (λ), which relies on the prior and projected year estimates of delta smelt abundance. To translate hydrologic information into ecological phenomena that could be represented in the IBMR, the CalSim 3 outputs were fed into three submodels, which were used to dynamically adjust (1) the delta smelt spatial distribution, (2) regional salinity, and (3) zooplankton abundance and distribution (fig. 3).
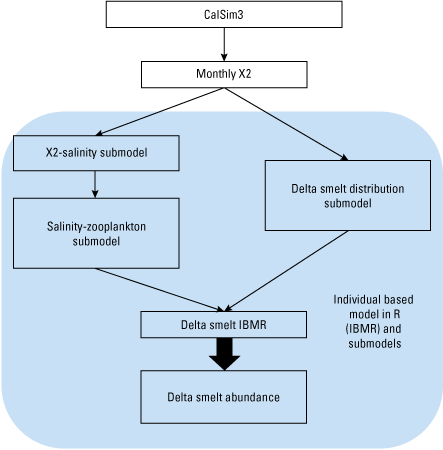
Diagram showing the Hypomesus transpacificus (delta smelt) Individual Based Model in R (IBMR) showing relations between inputs from CalSim 3 (California Department of Water Resources and U.S. Bureau of Reclamation, 2022), submodels, and outputs (indicated by large arrow). IBMR model components and outputs are shown within the gray-shaded box. X2, refers to the location of the low salinity zone (two practical salinity units) in the San Francisco Bay-Sacramento-San Joaquin Delta ecosystem, as measured in kilometers from the Pacific Ocean at the Golden Gate Bridge inland along the northern axis of the Sacramento-San Joaquin Delta.
The delta smelt distribution submodel was used to estimate changes in the species’ distribution based on monthly average X2 predicted by CalSim 3. The delta smelt distribution submodel predicted the proportions of delta smelt in the 12 IBMR regions based on a given X2, using historical fish survey data and a nearest neighbor approach. When a change in X2 was predicted, delta smelt spatial distributions were adjusted by substituting the observed spatial distributions with the historical spatial distribution at X2 closest to the predicted X2. Although we extrapolated changes in the distribution of delta smelt based on X2 for every month, X2 (and therefore distributions) did not vary much between alternatives aside from the summer-fall months.
The second submodel was an X2-salinity submodel—a generalized linear model that predicts the monthly mean salinity at the 12 IBMR regions based on X2 location. Changes in salinity, caused by X2 being manipulated for the alternative water management actions, were only expected to happen in the confluence region and farther downstream; therefore, zooplankton variation as a function of change in salinity was only estimated for the confluence and downstream regions. Salinity information produced from the X2-salinity submodel was then fed into the third submodel, which governs the connection between salinity and zooplankton. The salinity-zooplankton submodel consists of a set of generalized additive models that predict zooplankton density for the downstream IBMR regions based on a given salinity and day of the year. Predictions from the salinity-zooplankton submodel were converted to scalars representing the change in these predicted zooplankton densities from the observed densities and were then applied to the original IBMR prey data for each taxonomic group, alternative management action, downstream IBMR region, and month between 1995 and 2014.
For each alternative, IBMR was run for 330 iterations using the relevant data input (for example, zooplankton scalar values, and X2), while assuming the actions included in each alternative were implemented in above normal or wet years during the 20-year simulation time series. For each 20-year time-series iteration (informed by observed data collected between 1995–2014), the smallest adult cohort size was retrieved and then averaged across the 330 iterations for every alternative management action to provide the minimum population size as a measure of persistence.
Consequences of the alternative management actions to delta smelt minimum abundance ranged widely from about 2,559–2.1 million for the 2022 Reclamation median hydrology to 69,929–1.6 million for the CDWR baseline hydrology (table 3). Only two alternatives— “maximize delta smelt even flow” and “maximize delta smelt historic”—led to minimum abundances that would likely allow for sufficient brood stock collection (for example, those above 400,000).
Table 3.
Consequences of alternative management actions and competing California Simulation Model (version 3 [Calsim 3]) baseline hydrology models on the delta smelt objective of 2025–26.[The columns include delta smelt minimum abundance estimates predicted for 2025–26 using the Individual Based Model in R (IBMR) and inputs generated by the California Simulation Model (version 3 [Calsim 3]) with two alternative baseline hydrology model parameterizations (California Department of Water Resources baseline hydrology [CDWR, 2023] and the U.S. Bureau of Reclamation (2022) median hydrology). Greater values indicate better performance and are indicated by a darker color of green.]
Estimating Consequences for Water Supply Objectives
Rulesets were created to ensure water quality and other regulations were met for each alternative water management action that included a monthly target fall X2 location or target summer delta outflow rate measured as the Net Delta Outflow Index (CDWR, 2016). The model was constrained to avoid violating water quality standards in a way described in the most recent analysis of the CVP and SWP “Long-Term Operations” publication done by Reclamation (U.S. Bureau of Reclamation, 2024a). For exports for the CVP and SWP, in thousand acre-feet (volume), we used the following parameters from CalSim 3: C_CAA003_SWP (SWP pumping at Banks) and C_DMC003+C_CAA003_CVP (pumping at Jones and CVP pumping at Banks). Volumes were converted from monthly cubic feet per second to thousand acre-feet and then summed by water contract year: January to December for SWP and March to February for CVP. To account for potential consequences to the water supply in 2026, which would be driven, in part, by uncertain 2026 hydrology, we included predicted exports for 2 years after an action year. We took a subset of data from the 100-year simulated time series (limited to actions year types [wet and above normal Sacramento Valley water year index type] and years that follow an action year), with each year only counted once. Total annual export volume values were then averaged over the data subsets by contract years for CVP and SWP to quantify total export volumes.
Consequences for the CVP water supply varied across alternatives (range 2,070–2,303 taf; table 1) with the “summer historic,” “June action,” or “maximize water supply” alternatives performing best, depending on the baseline hydrology model (table 4). The two alternatives developed to maximize delta smelt populations had the lowest water exports (about 8–10 percent less than the maximum water exports).
Table 4.
Consequences of alternative management actions and competing California Simulation Model (version 3 [Calsim 3]) baseline hydrology models on the Central Valley water supply objective, 2025–26.[The columns include average water supply export volumes (thousand acre-feet) for 2025–26 predicted using the California Simulation Model (version 3 [Calsim 3]) with two alternative baseline hydrology model parameterizations. Greater values indicate better performance and are indicated by a darker color of green.]
Consequences were similar for the CVP and SWP water export objectives. For the SWP water export performance metric, the two alternatives designed to maximize delta smelt abundance ranked lowest, whereas the two alternatives designed to maximize water supply objectives (10 and 11) ranked highest for both baseline hydrology models (table 5).
Table 5.
Consequence of alternative management actions and competing California Simulation Model (version 3 [Calsim 3]) baseline hydrology models on the State Water Project water supply objective, 2025–26.[The columns include average water supply export volumes (thousand acre-feet) predicted for 2025–26 using the California Simulation Model (version 3, [Calsim 3]) with two alternative baseline hydrology model parameterizations. Greater values indicate better performance and are indicated by a darker color of green.]
Estimating Consequences for Winter-Run Chinook Salmon Redd Dewatering
We estimated the proportion of winter-run Chinook salmon redds dewatered for each alternative management action using predicted summer and fall (June through September) Sacramento River flow below Keswick Dam. Sacramento River flows were predicted using CalSim 3 monthly hydrology data, and we estimated redd dewatering using historical carcass surveys and the “Gard” model (FWS, 2006). This instream flow model predicts the proportion of redds dewatered under varying flow conditions based on a spawning flow (the flow at spawning onset) and a dewater flow (the lowest flow experienced before emergence). Spawning timing was determined from annual carcass surveys, with raw counts being standardized by calculating the monthly proportion of female carcasses. We estimated emergence timing following methods in Beacham and Murray (1990), which relates incubation duration to water temperature. For each alternative management action, we assigned spawning and dewater flows by month to historical spawning proportions and calculated the emergence month by adding incubation days to the spawning month. We derived the spawning flow from the CalSim 3-modeled flows that corresponded to each spawning month, but the dewater flow represented the lowest monthly flow experienced between estimated spawning and emergence. We cross-referenced these flow values with lookup tables from FWS (2006) to estimate the proportion of redds expected to be dewatered under each flow condition. We calculated monthly dewatering by multiplying the proportion of spawners in each month by the estimated proportion of redds dewatered and summed these values across each management action to determine total dewatering for each hydrologic year. Absolute estimates of redd dewatering proportions from this modeling approach are known by managers to be unreliable and biased high (Gosselin and Beer, 2024), and we interpreted these results as relative (across the range of estimates), rather than absolute, differences in redd dewatering proportions across alternatives.
The proportions of redds dewatered ranged from 0.051 to 0.202 (tables 1, 6), which is much higher than values observed in the Sacramento River between 2013–21 (0–0.67 percent, NMFS, 2024). In general, the highest redd dewatering would be expected for the alternatives, including a summer outflow action, and redd dewatering was generally higher under the Reclamation median hydrology of 2022 (table 6).
Table 6.
Consequences of alternative management actions and competing California Simulation Model (version 3, [Calsim 3]) baseline hydrology models for the winter-run Chinook salmon objective, 2025.[The columns include the proportion of redd dewatering predicted for 2025 using the California Simulation Model (version 3, [Calsim 3]) and the U.S. Fish and Wildlife Service (FWS) “Gard” model (FWS, 2006) with two alternative baseline hydrology model parameterizations. Greater values indicate better performance and are indicated by a darker color of green.]
Estimating the Consequences for Central Valley Steelhead or Fall-Run Chinook Salmon
Operations on Folsom Lake and Folsom Dam are designed to minimize negative consequences to downstream fish habitat by maintaining a minimum of 300 taf of storage volume in Folsom Lake in December to minimize operational effects to steelhead in the American River (NMFS, 2024). We calculated the probability 300 taf would be in storage in Folsom Lake in the December after an action year using CalSim 3.
The probability that Folsom Lake volume was >300 taf in December ranged from 0.775–1.0 (table 1), and probabilities for this were lower for the Reclamation median 2022 hydrology compared with the CDWR baseline hydrology (ranging from 0.9–1.0; table 7). The worst performing alternatives maximized delta smelt abundance, and several alternatives had a probability of 1.0 under both baseline hydrology models.
Table 7.
Consequences of alternative management actions and competing California Simulation Model (version 3, [Calsim 3]) baseline hydrology models for the Central Valley steelhead and fall-run Chinook salmon objective, 2025.[The columns include the probability that Folsom Lake water volume is greater than 300-thousand-acre feet in December 2025, predicted using the California Simulation Model (version 3, [Calsim 3]) with two alternative baseline hydrology model parameterizations. Greater values indicate better performance and are indicated by a darker color of green.]
Estimating the Consequences for Water Quality and Human Health
CalSim 3 uses an artificial neural network (ANN) algorithm developed by CDWR (Sandhu and others, 1999) to translate water quality standards into flow equivalents that are to be met through SWP and CVP simulated operations. The ANN constructs flow-salinity relations and provides a rapid transformation of this information into a form usable by CalSim 3 operations. In short, the ANN uses model runs from DSM2, a one-dimensional hydrodynamic and water quality simulation model used to simulate tidal flows, water quality, and particle tracking in the delta (CDWR, 2021). The ANN statistically correlates the salinity results from a particular DSM2 model run to the various peripheral flows (delta inflows, exports, and diversions), delta channel depletions, delta cross channel gate operations, and Suisun Marsh salinity control gates. The ANN is calibrated or trained on DSM2 results that may represent historical or future conditions using a full-circle analysis (Jayasundara and others, 2020). A total of 148 days of values for key parameters are included in the correlation, representing an estimate of the length of memory of antecedent conditions in the delta. The ANN model approximates DSM2 model-generated salinity at the following key locations for the purpose of modeling delta water quality standards: X2, Sacramento River at Emmaton, San Joaquin River at Jersey Point, Sacramento River at Collinsville, and Old River at Rock Slough.
We used Jersey Point conductivity values from CalSim3 to assess potential affects to human health in the Sacramento-San Joaquin Delta in action years (above normal or wet). Based on discussions with experts from Contra Costa Water District and SWC (Deanna Sereno and Lucinda Shih, Contra Costa Water District, written commun., March 10, 2025), all scores for the water quality and public health constructed scale were above 0.5, meaning all alternatives were predicted to result in acceptable scores (table 8).
Table 8.
Consequences of alternative management actions and competing California Simulation Model (version 3, [Calsim 3]) baseline hydrology models for the water quality and public health performance metric, 2025.[The columns include the constructed scale based on Jersey Point artificial neural network model parameters from the California Simulation Model (version 3, [Calsim 3]) for 2025, under two alternative baseline hydrology model parameterizations, where scores less than 0.5 were considered less than acceptable and scores greater than 0.5 to 1 were indicative of acceptable to good water quality. Greater values indicate better performance and are indicated by a darker color of green.]
Estimating the Consequences for Central Valley Project Coldwater Pool Operational Flexibility
Shasta Lake water storage is managed to provide cold water discharge in the summer to the Sacramento River main stem below the Keswick Dam to minimize the egg-to-fry mortality of winter-run Chinook salmon. Shasta Lake must have sufficient storage volume to release cold water for the summer and is managed with an objective of maintaining 3.7 maf in April (Yates and others, 2008; NMFS, 202443; U.S. Bureau of Reclamation, 2024a). Winter hydrology has an important effect on the following April’s coldwater pool volume in Shasta Lake and cannot be predicted the previous year because of environmental stochasticity. However, management during the summer can affect volume the following April (depending on uncertain winter hydrology). To address this uncertainty and the risk of flow actions in one year affecting the following April’s volume, the probability of achieving 3.7 maf or greater in April was predicted using CalSim3 exceedance curve outputs for the Shasta Storage parameter (for all water year types).
The maximum delta smelt alternative management actions (2, 3) had the lowest probability scores for Shasta Lake water volume in April after action years (0.66–0.72; table 9). The other alternatives also had similar scores, which were >0.78 or >0.81 for the Reclamation median of 2022 or the CDWR baseline hydrology models, respectively.
Table 9.
Consequences of alternative management actions and competing California Simulation Model (version 3, [Calsim 3]) baseline hydrology models for coldwater pool operational flexibility for the Central Valley Project for 2026.[The columns include the probability of the estimated Shasta Lake water storage volume being greater than or equal to 3.7 million acre-feet for April after an action year (2026) by the California Simulation Model (version 3, [Calsim 3]) under two alternative baseline hydrology model parameterizations. Greater values indicate better performance and are indicated by a darker color of green.]
Estimating Consequences for State Water Project Coldwater Pool Operational Flexibility
The River Valve Outlet System (RVOS) at Lake Oroville Dam is not currently operating as designed, and limitations related to RVOS operations may persist through 2025 (https://water.ca.gov/News/Blog/2025/Mar-25/Lake-Oroville-Update-3-21-2025). Without this outlet system, the ability to withdraw cooler water from the lower depths of Lake Oroville is severely limited. Based on discussions with participants during workshops, we determined an appropriate Lake Oroville water storage target at the end of September 2025 would need to be at least 1.85 maf so the functioning outlet facilities can withdraw water at low enough temperatures during the summer to meet Feather River temperature compliance. To estimate consequences for the SWP coldwater pool operational flexibility performance metric, we used the probability of 1.85 maf of storage in Lake Oroville at the end of September that was calculated using CalSim3 output action years (for example, “wet” or “above normal” water years based on the Sacramento Valley water year index).
Our analysis showed a broader range of consequences for the Lake Oroville objectives than many of the other objectives for different bodies of water; the probability of sufficient storage for flexibility in operations to meet the needs of downstream salmonids in Lake Oroville ranged from 0.27–0.98 (table 10). Like other water supply or storage-related objectives, performance was worst for the maximize delta smelt alternatives (alternatives 2 and 3).
Table 10.
Consequences of alternative management actions and for competing California Simulation Model (version 3 [Calsim 3]) baseline hydrology models for coldwater pool operational flexibility for the State Water Project, 2025.[The columns include the probability of estimated Lake Oroville water storage volume being greater than or equal to 1.85 million acre-feet in September of action year (2025) by the California Simulation Model (version 3, [Calsim 3]) under two alternative baseline hydrology model parameterizations. Greater values indicate better performance and are indicated by a darker color of green.]
Relations Between Water Supply Cost and Storage Performance Metrics
There was considerable discussion among participants during the workshops about other objectives or metrics we did not carry forward as fundamental objectives. Many of those that we considered and discussed in early workshops represented different water cost or storage metrics. However, some participants were accustomed to considering these metrics during previous water management planning efforts, which they used to interpret the consequences to the fundamental objectives. We assessed the relations between the performance metrics representing the fundamental objectives in our analysis with other potential performance metrics representing water deliveries and water costs using correlation analysis (Pearson’s r statistic) in R (R Core Team, 2019). We considered metrics to be highly correlated if their r statistic was >0.7, and the metrics were highly correlated, as all r statistics were >0.83. We presented correlations between metrics for these means objectives and the metrics we retained in our analysis to represent fundamental objectives in workshop four on March 18, 2025 (fig. 4).
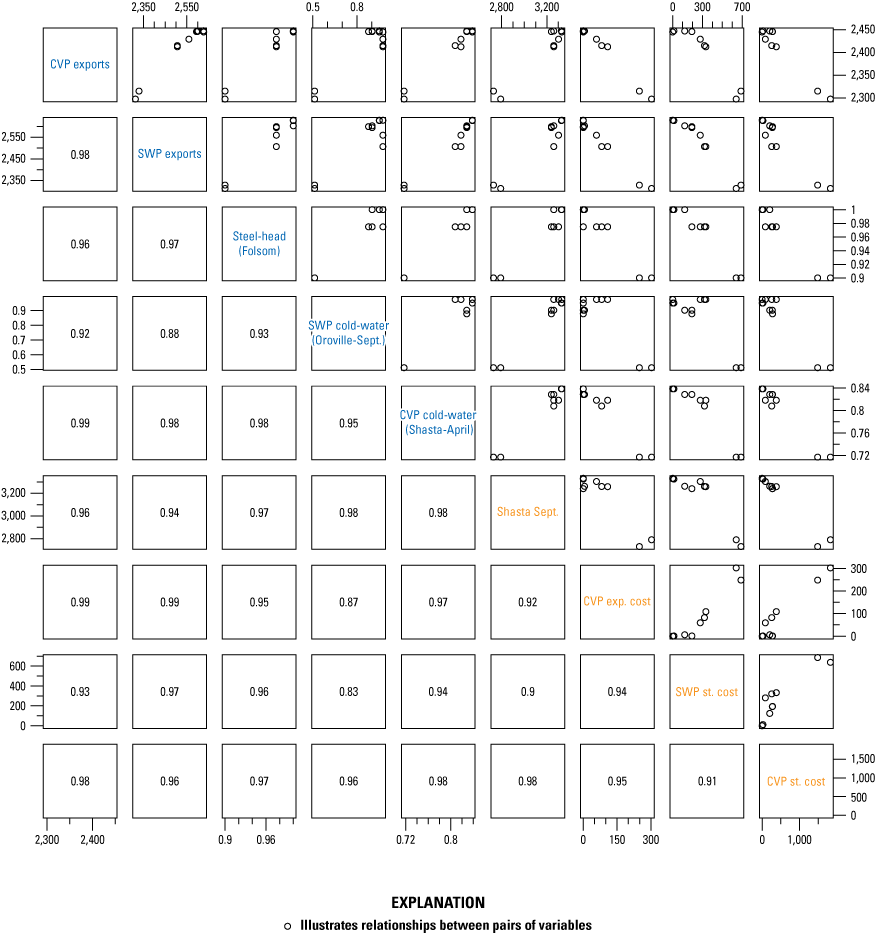
Correlations (Pearson’s r) between selected fundamental (blue text) and means (orange text) objectives for water supply and reservoir coldwater pool storage volumes. Fundamental objectives from top to bottom are Central Valley Project water exports (thousand acre-feet), State Water Project exports (thousand acre-feet), probability of exceeding 300 thousand acre-feet in Folsom Lake in December 2025, probability of exceeding 1.85 million acre-feet in Lake Oroville in September 2025, and probability of exceeding 3.7 million acre-feet in Shasta Lake in 2026. Means objectives from top to bottom are as follows: probability of exceeding 2.4 million acre-feet in Shasta Lake at the end of September, water export reduction for the Central Valley Project (thousand acre-feet), storage withdrawal water cost for the State Water Project (thousand acre-feet), and storage withdrawal water cost for the Central Valley Project (thousand acre-feet). Numbers on the x- and y-axes indicated the numeric scales for each objective. Fundamental (blue text) and means (orange text) objectives are highly correlated. CVP, Central Valley Project; SWP, State Water Project; Sept., September; exp., export; st., storage.
Consequences—Equal Hypothesis Weights
We calculated consequences assuming equal belief in both baseline hydrology models (competing hypotheses, refer to eq. 2) and compiled results in table 11 (Healy and others, 2025). Stark tradeoffs were apparent between delta smelt, water supply, water quality/public health, and salmonid-related objectives. The best-performing alternatives for the delta smelt and water quality/public health objectives were also the worst performing alternatives for all other objectives, except for the winter-run Chinook salmon objective (“maximize delta smelt—historic” was third worst). The “maximize water supply—no Suisun Marsh salinity control gate action” alternative performed worst for the water quality/public health objective.
Table 11.
Full consequence table for all performance metrics, by management alternative, assuming equal weight on the two competing California Simulation Model (version 3 [Calsim 3]) baseline hydrology models.[The columns are the performance metrics for each alternative (in rows), averaged across the two alternative baseline hydrology model parameterizations. Greater values indicate higher performance and are indicated by a darker color of green.]
Decision Analysis
We used multicriteria decision analysis (MCDA) to calculate composite scores (eqs. 1 and 2) for each alternative to allow tradeoffs related to water management decisions to be assessed (Gregory and others, 2012; Converse, 2020). A separate set of composite utility scores was calculated for each participating agency or organization that provided objective weights for the eight objectives included in our analysis, as described in the following sections of this report.
Swing Weighting
We used swing weighting to elicit participants’ objective weights before calculating composite utility scores (Gregory and others, 2012). Swing weighting incorporates the range of consequences across alternative management actions and the fundamental importance of the eight objectives when assigning objective ranks and scores. The SDM analysts presented an overview of (raw) performance metric scores by alternative management action and provided training in swing weighting techniques during workshop 4 on March 18, 2025. During the workshop, we also provided an overview of the interpretation of each performance metric and facilitated discussion to avoid ambiguity in participants’ understanding of the meaning of the metrics before participants completed swing weighting for their agency or organization. For swing weighting, we used the local scale to represent the range of consequences across alternative management actions and hypotheses (assuming equal weights on the hypotheses), which was defined by values for each objective in tables 3–10. A swing weighting form, including the best- and worst-case performance metric scores for each objective, was provided electronically to all participants to elicit objective ranks and weights (fig. 5). To assist in deliberations about the range of performance, the form included hypothetical alternatives consisting of the best-case for one objective, the worst case for all others, and one alternative reflecting the worst-case performance for all objectives. We asked participants to consider if they could “swing” just one objective from worst- to best-case, which would it be? The hypothetical alternative with the best performance for their top-ranked objective would be ranked number one. We then asked them to repeat this ranking for all remaining hypothetical alternatives 2–9 (with the ninth ranked alternative being the worst case for all objectives). Finally, we asked participants to convert their ranks to scores by assigning 100 points to their top-ranked objective and then assigning a score to each subsequent objective according to relative importance. The swing weighting form automatically standardized these scores on a 0–1 scale to represent objective weights for composite score calculations. Participants were given about ~3 days to complete the swing weighting exercise, and the SDM analysts offered to hold one-on-one discussions with each participant, before summarizing results in plenary, to confirm the swing weighting instructions were clear, to minimize ambiguity in performance-metric interpretation, and to ensure results represented the values and expectations of each participating agency or organization.
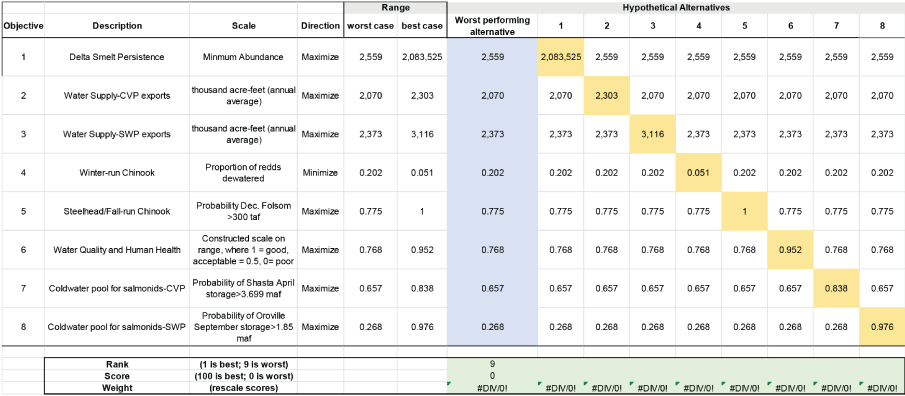
Swing weighting form provided to all participants, including the best- and worst-case performance metric scores across management alternatives. Weights are automatically calculated and rescaled once ranks and scores are entered in this example (divide by zero error is addressed once ranks and scores are entered). Rows used to create hypothetical management alternatives represent the scale, desired direction, and the range of performance for each objective.
We met with five of the eight agencies or organizations invited to participate in the SDM process to discuss their objective weights, and four chose to share their weights and alternative composite scores and rankings. Of these, only Reclamation and CDWR shared their weights publicly, and the others were anonymized. Some participants did not feel qualified to represent their organizations’ values or expressed other concerns about the objective weighting process. Weights assigned to the objectives by the participants differed considerably (fig. 6); regardless of whether participants expressed their objective weights for final MCDA composite score calculations and alternative management action ranking, each discussed their rationale for their objective rankings and weights in plenary. None of the participants ranked delta smelt higher than a two-way tie for second, and one ranked the delta smelt objective seventh, despite the wide swing in consequences for delta smelt abundance relative to the other performance metrics (refer to fig. 5). Some participants were skeptical about the range of delta smelt abundance predictions because the model was calibrated with monitoring data for wild fish, and they questioned if the same population dynamics would be expected for hatchery propagated fish. Another participant stated they were more confident in management outcomes for salmonids than for delta smelt and accordingly placed more weight on salmonid-related objectives. Some participants also viewed tradeoffs between the water quality objective, public health objective, and others as “taboo” (for example, Daw and others, 2015), which caused them to place higher weight on the objective despite the worst-case scores being equivalent to or above “acceptable” levels. At least one participant recognized the acceptable range of water quality and human health scores and put lower weight on the objective as a result, and objective weights on water quality/public health were generally lower than for others (average weight =0.058, range 0–0.12; fig. 6). When assigning weights, other participants considered operational flexibility that was not incorporated in our modeling but could be applied in realtime to mitigate negative consequences to salmonids; winter-run Chinook salmon and steelhead objectives were weighted less in this case. At the same time, the risk for negative consequences appeared high for the SWP coldwater pool objective (71 percent swing between the best- and worst-cases), which was ranked higher by another participant. Discussions by the participants about the rationale of weighting reflected the difficult tradeoffs that had to be considered.
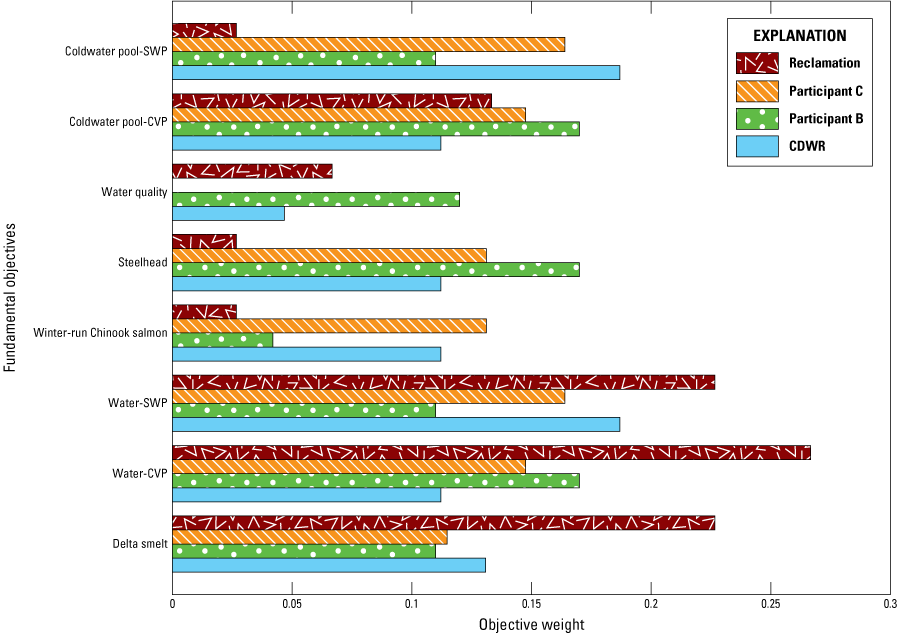
Bar graph showing the swing weighting results for four participants who provided objective weights. CDWR, California Department of Water Resources; SWP, State Water Project; CVP; Central Valley Project.
Multicriteria Decision Analysis
We calculated composite utility scores (V) using objective weights provided by the four participants and normalized performance metric scores for the eight objectives using a linear value model (Gregory and others, 2012; Converse, 2020):
where xi,j,k is the normalized performance measure score on objective i for alternative j under hypothesis k (representing alternative baseline hydrology models) and wi is the weight individual participants place on objective i (where the sum of the objective weights =1; table 12). Given the equal hypothesis weights that were applied to the competing baseline hydrology models, we used the average composite score calculated with performance metric scores under each competing model to rank the alternative management actions (table 13). An advantage of MCDA is its ability to compare the performance of alternatives using performance metrics on different scales; however, before composite scores are calculated, all performance metrics must be normalized on a 0–1 scale, where 1 maps to the maximum or best performance score predicted and 0 to the worst-case or minimum desired score known as local scaling. This local scaling has some drawbacks in that small differences between alternative performance metric scores can be exaggerated leading to nonsensical decisions if participants fail to account for the range of consequences when assigning ranks and scores to objectives (Monat, 2009). To minimize this potential issue, we provided the range of scores on the local scale and articulated how the predicted consequences for each performance metric should be interpreted before swing weighting.
Table 12.
Objective weights provided by four participants and used in the multicriteria composite utility score calculations.[Participants B and C are anonymous participants that provided objective weights. Columns show objective weights, by objective (rows), provided by participants. CDWR, California Department of Water Resources; Reclamation, U.S. Bureau of Reclamation.]
Assuming equal weights on the competing baseline hydrology models and using the objective weights in table 12, we calculated composite utility scores for each alternative, and they are presented in table 13 (Healy and others, 2025). The top-ranked alternative was fairly robust compared to differences in participants’ objective weights. The “maximize water supply with no Suisun Marsh salinity control gate” alternative ranked highest for three of four participants, the “maximize water supply” alternative was the top-ranked alternative using Reclamation’s objective weights, and the “June action” alternative was tied for first for participant B. These three top alternatives for individual participants were also ranked in the top three for all four participants, and differences in composite scores for the top two alternatives were within 0.001–0.002. The lowest ranking alternative was consistent for all four participants (maximize delta smelt-even flow)—the two alternatives designed to maximize delta smelt were dominated by the others in all cases.
Table 13.
Composite utility scores from the multicriteria decision analysis by water management alternative.[Participants B and C are anonymous participants that provided objective weights. Columns show composite utility scores, by management alternative (rows), calculated using objective weights provided by participants and normalized performance metric scores, assuming equal weight on two competing baseline hydrology model parameterizations. Darker green shading in the cells indicate top-ranked alternatives for each participant, and pink shading indicates the lowest ranked alternative. CDWR, California Department of Water Resources; Reclamation, U.S. Bureau of Reclamation]
We assessed the sensitivity of the alternative rankings to the weight placed on the delta smelt objective and the combined weight placed on the two water export objectives. Each participants’ weights on the delta smelt, CVP exports, and SWP export objectives were similar (table 12). However, the water supply consequences are correlated (fig. 4) because the logic for CalSim 3 for determining the State and Federal contributions to a flow action follow the terms of the Coordinated Operations Agreement between CDWR and Reclamation (CDWR, 2022). The high correlation between the two water export fundamental objectives could lead participants to place more weight than intended on those objectives relative to the other objectives. Figure 7 allows assessment of the sensitivity of each participant’s top-ranking alternative to variations in the combined weight they placed on the export’s objectives relative to the delta smelt objective. We varied the combined weight on exports from zero to one, with the combined export weight being made up of the individual participant’s relative weightings on the CVP and SWP export objectives. When the combined exports and delta smelt objective weights summed to less than one, we distributed the remaining weight to the other five objectives proportional to how each participant weighted those objectives against each other. The relative weight of delta smelt tended to be between one-third and one-half of the weight of the combined exports (fig. 7, grey points). The robustness of each participants’ top ranked alternative can be inferred by either increasing the weight on the delta smelt objective (up on the y-axis) to be more like the combined export weight or reducing the weight on the combined exports (left on the x-axis) to be more similar to the delta smelt weight.
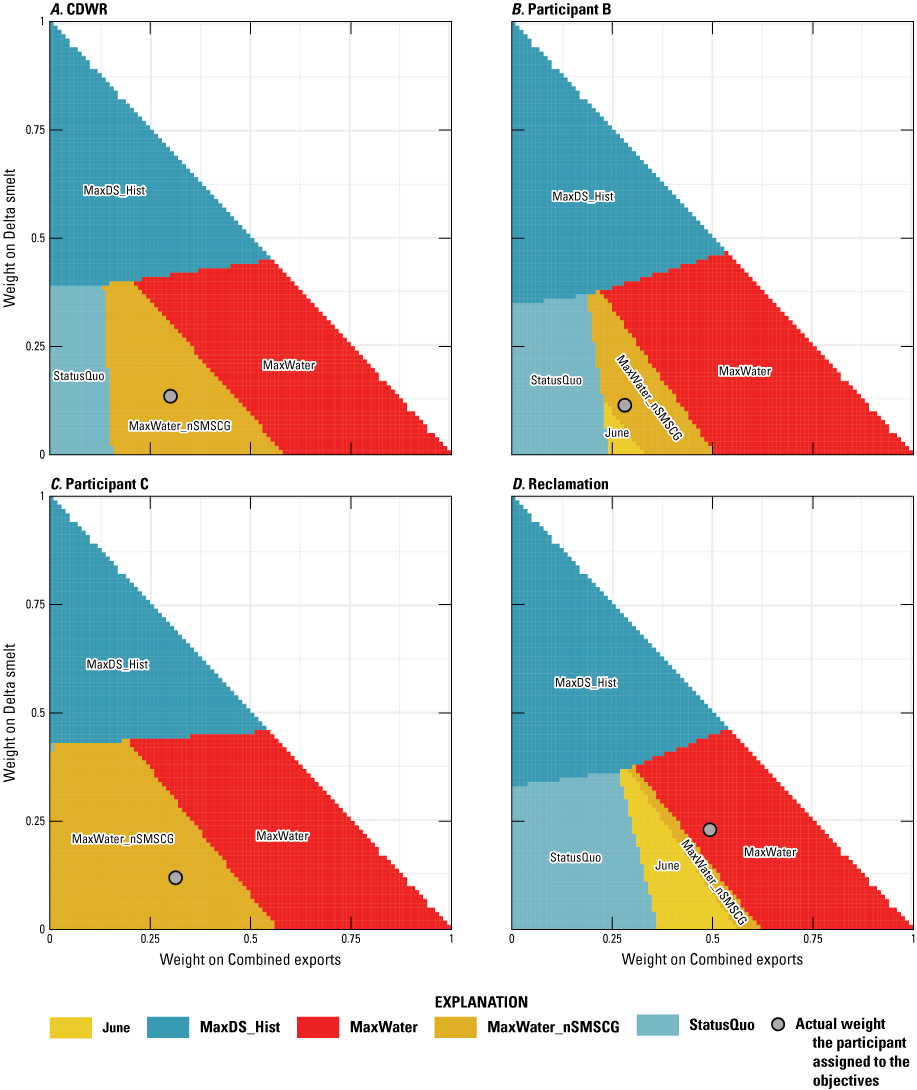
Graphs showing the sensitivity of participants’ ranking of management alternatives to objective weights. The grey point represents the actual weight the participant assigned to the objectives. CDWR, California Department of Water Resources; CE, combined water exports; DS, delta smelt, MaxDS_Hist, Maximize delta smelt historic; MaxWater, Maximize water supply; MaxWater_nSMSCG, Maximize water supply-No Suisun Marsh salinity control gate action; StatusQuo, status quo.
Sensitivity to Baseline Hydrology Models and Value of Information Analysis
We assessed the sensitivity of the alternative rankings to differences in the two baseline hydrology models by using a hypothesis-weighted average score for each alternative (outcome under uncertainty, Vj). Hypothesis weights (probability, p) are the relative belief in each competing hypothesis. The alternative scores are a sum of the product of Vj,k, and the weights applied to the two baseline hydrology hypotheses (pk)
The best performing alternative water management action (under uncertainty) is the one with the maximum value of Vj. We varied hypothesis weights from zero to one based on the 2022 Reclamation median hypothesis (1–0 in the CDWR hydrology) to assess whether the top-ranked alternative changes across these weighting schemes would indicate sensitivity of the decision to the relative belief in the baseline hydrology models.We also calculated the EVPI, which is the difference between the expected management performance after uncertainty has been resolved and the expected performance under uncertainty as:
where the first term represents the maximum performance under perfect information (for example, if we knew which hypothesis was true), and the second term represents the maximum composite performance score of the alternatives under uncertainty (for example, the maximum of Vj). We express the EVPI as the proportional increase in performance relative to the expected maximum performance (composite score from above) under uncertainty (EVPI% = [EVPI÷second term in eq. 3] ×100).The top-ranking management alternative was sensitive to weight on the baseline hydrology hypothesis for all four of the participants’ objective weights (fig. 8). However, no new alternatives were ranked highest—the same three alternatives ranked in the top three compared to when hypothesis weights were considered equal (refer to table 13), including the “maximize water supply” alternative (alternative 10), the “maximize water supply with no Suisun Marsh salinity control gate” action (11), and the “June action” (9).
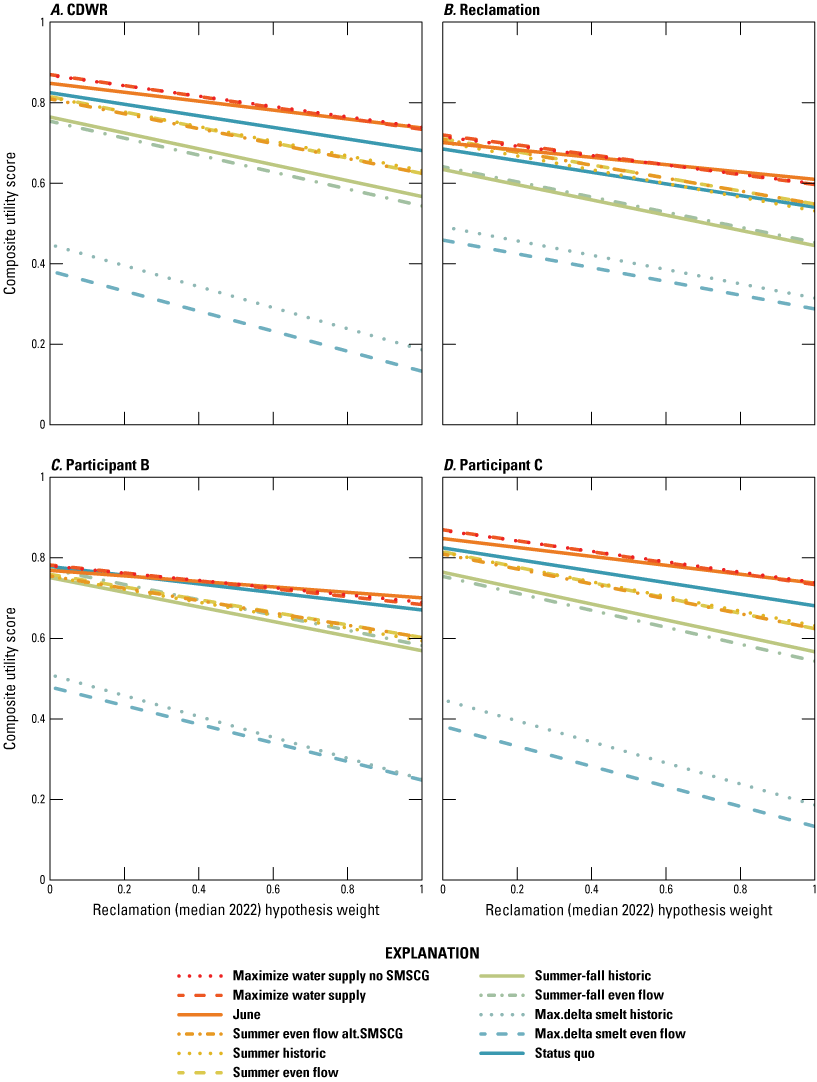
Graphs showing the sensitivity of participants’ ranking of management alternatives (alternative composite scores represented by lines) across a range of weights on the Reclamation median 2022 baseline hydrology model. Composite scores decreased with more belief in the median 2022 hypothesis, and the top ranked alternative depended on hypothesis weights. CDWR, California Department of Water Resources.
Little VOI was associated with reducing the uncertainty between baseline hydrology models. EVPI was <1 percent for all participants’ objective weights, with EVPI ranging from 0.07–0.98 percent (mean=0.511 percent), indicating <1 percent increase in management performance would be achieved if the uncertainty in the true baseline hydrology model was resolved before decision making.
Consequences of Alternatives Including Nonflow Actions
After the final SDM workshops and initial analyses as described in previous sections, the SDM analysts were able to obtain data necessary to do a consequences analysis for two additional alternatives that included nonflow actions meant to improve habitat for delta smelt. Aquatic weed control actions were analyzed in detail in a previous decision analysis, which assumed aquatic weed control would lead to enhanced turbidity and therefore benefits to delta smelt (Crawford and Rudd, 2024). The two nonflow action alternatives we analyzed included aquatic weed control for 3,470 acres, assuming 20 percent efficiency in weed removal, which we combined with actions included in the “maximize water supply” (alternative 10) and “maximize delta smelt-even flow” (alternative 2) alternative management actions (table 2.1). Assuming equal weights on the baseline hydrology models, we discuss the effects of aquatic weed control on delta smelt minimum abundance relative to effects for comparable alternatives without nonflow actions (for more details, refer to app. 2).
Using the IBMR model and population projection methods as described in previous sections, we found higher delta smelt minimum abundance for alternatives that included aquatic weed control compared to the “maximize delta smelt even-flow” and “maximize water supply” alternatives without aquatic weed control. The minimum abundance for delta smelt for the “maximize delta smelt-even flow” alternative was 2.62 million (a 53 percent increase, refer to table 11) and 56,810 (306 percent increase) for the “maximize water supply” alternatives with aquatic weed control. There was also considerable difference in minimum delta smelt abundance between baseline hydrology models. The range of minimum delta smelt abundance between the two baseline hydrology models for the “maximize water supply with aquatic weed control” alternative was 17,216–445,016, indicating sufficient broodstock could be collected under the adjusted historic baseline hydrology model (for example, abundance >400,000). For the “maximize delta smelt-even flow with weed control” alternative management action, the range of minimum delta smelt abundance was 2.24–3.01 million between the two hydrology models.
If alternatives that included aquatic weed control had been included as part of the MCDA with participants that provided objective weights, the “maximize water supply with aquatic weed control” alternative management action would be the highest-ranked alternative for the four participants (CDWR, Reclamation, Participant B, and Participant C) (refer to app. 2, table 2.2). Including aquatic weed control in additional portfolio alternatives may have led to optimized outcomes because the nonflow action from the weed control benefitted delta smelt without the need to curtail water exports or release additional water from reservoirs. However, we did not include the monetary cost associated with this nonflow action in the consideration for this decision problem. How the participants would have weighted objectives (and in turn how the alternative rankings would change) if the financial cost associated with the aquatic weed control action had been included in the MCDA is unclear. Based on information from the California Division of Boating and Waterways that manage aquatic weed control in the delta, 3,470 acres of aquatic weed control could cost anywhere between $31,230,000 to $72,870,000 for the first 3 years of the action (Crawford and Rudd, 2024).
The aquatic weed control action modeled in this study had 20 percent efficiency when removing weeds, which represents an optimistic “best-case” scenario (Crawford and Rudd, 2024). However, the efficacy of aquatic weed removal in the tidal system remains uncertain; a recent study in the delta demonstrated that the widely used herbicide fluridone did not lead to significant reductions in aquatic weed abundance (Rasmussen and others, 2022). Furthermore, participants suggested that aquatic weed removal as proposed would not likely be implementable in 2025 because of regulatory and logistical constraints and that it may take years to develop a successful action.
Summary of Effects to Disadvantaged Communities
The CVP and the SWP provide water to numerous municipalities in California, including community water systems that directly serve households. Some of these communities may be classified as disadvantaged communities (DAC) or severely disadvantaged communities (SDAC). DAC/SDAC status is determined based on a percentage of the statewide annual median household income (MHI). California Water Code (Section 79505.5a of the California State Water Code) defines communities as disadvantaged if their annual MHI is 80 percent of the statewide MHI and as severely disadvantaged if their annual MHI is 60 percent of the statewide MHI, and MHI data are obtained from U.S. Census data. A statewide map of DAC and SDAC communities is available through the State Water Resources Control Board (SWRCB; SWRCB, 2023 fig. 10-1). The CVP and SWP deliver water to communities defined as DAC or SDAC of different estimated population sizes (table 14).
Table 14.
Estimated population sizes of State Water Project and Central Valley Project service areas identified as non-Disadvantaged Community, Disadvantaged Community, and Severely Disadvantaged Community (based on classifications by the California Water Code [Water Code 7905.5a]).[non-DAC, non-disadvantaged community; MHI, median household income; ≥, greater than or equal to; <, less than; DAC, disadvantaged community; SDAC, Severely Disadvantaged Community. Source: State Water Resources Control Board Water Boundary Tool, supplemented with information provided to California Department of Water Resources by the State Water Resources Control Board in August 2021, supplemented in February 2025.]
Because the DAC/SDAC populations sizes differ substantially between SWP and CVP service areas, there may be different effects on these communities between alternative management actions evaluated by the SDM group. For example, if any of the alternative management actions that include flow actions listed in table 2 rely to a greater extent on SWP-supplied water, there could be a greater effect on DAC/SAC populations than if the water for the action is achieved primarily through the CVP.
The dataset for this analysis was shared with CDWR by the SWRCB upon a CDWR request in August 2021 (at the time of publication, data were not publicly available from SWRCB). CDWR staff provided the estimated list of community public water systems that were contractors to the SWP and CVP and requested that the SWRCB staff query their internal version of the database to identify all water systems that purchase or receive water from those contractors. As requested, the SWRCB’s query output from the Safe Drinking Water Information System provided what public water systems purchase or otherwise import water from this set of project contractors. The query output also includes systems that purchase or otherwise import water from those subcontractors, down to five levels of receiving water. This dataset does not indicate how much each system relies on project water, only that the system relies on project water as one of its water supply sources at the time of the data request (August 2021). DAC/SDAC status is based on an analysis run by the State Water Board staff for exploratory use only. Updated data were received by CDWR on February 27, 2025, from the SWRCB.
Effects to DAC/SAC populations are linked and correlated with the CVP and SWP water supply objectives because the effects on DAC/SAC populations are directly related to project deliveries. Therefore, the effects are briefly summarized in this section and not evaluated through a consequence analysis as they were for the fundamental objectives. Alternative management actions 2–5 in tables 4 and 5 (“maximize delta smelt—even flow,” “maximize delta smelt historic,” “summer-fall even flow,” and “summer-fall historic”) present reductions in the water supply for CVP and SWP compared to “status quo” conditions (alternative 1). Alternative 2 (“maximize delta smelt—even flow”) represents the maximum reduction in water deliveries across CVP and SWP projects at 521 taf (tables 4 and 5), and about 70 percent of this reduction is achieved through reductions in the SWP deliveries. For all other scenarios presenting a reduction in deliveries, the proportion of reduction is the same, with about 70 percent coming through the SWP. This disproportionate reduction in deliveries from SWP indicates that DAC/SAC populations are more likely to be affected (for example, vulnerable to felt effects of water supply reductions). However, the modeled delivery amounts for the SWP across all alternative management actions were assumed to be above minimum health and human safety standards (for example, because of constraints in CalSim 3); therefore, the effects on DAC/SDAC populations are not considered instrumental to decision making or alternative management action rankings based on this analysis. In the future, to evaluate flow management alternatives involving reduced exports to DAC/SDAC populations, this analysis suggests that these parameters can be considered to determine relative contributions from SWP and CVP sources because of their disproportionate levels of service to these populations.
Discussion
This report summarizes the results of a multicriteria decision analysis that we used to evaluate California’s Central Valley water management scenarios in the spring of 2025. This decision analysis was initiated to reassess delta outflow management strategies to mitigate declines in endangered Hypomesus transpacificus (delta smelt) abundance (FWS, 2024). Our analysis considered the future risk of water reservoir operational flexibility not meeting the requirements for salmonids and water deliveries for other uses, explored options to maximize water deliveries to municipalities and agricultural users, and considered effects on water quality. Management agencies are faced with a complex set of tradeoffs to consider in the context of water management decisions in the Central Valley; however, the water year hydrology forecast, which was predicted to be above normal or wet during our analysis, provided the flexibility to contemplate summer and fall flow actions that may improve conditions in the delta for delta smelt. A stated goal of Reclamation and the California Department of Water Resources for our decision analysis was to provide an opportunity for other State and Federal agencies and interested parties (water contractors, nongovernmental organizations, and Tribes) to participate in the decision-making process and to express their values (or objectives) to agency decision makers for their consideration (refer to “Methods” section). As a group, we collaboratively identified fundamental objectives important to the invited participants and evaluated the performance (or consequences) of alternative management actions designed to meet water delivery and delta smelt objectives, while seeking to minimize negative consequences to other objectives. However, some groups were unable or unwilling to engage in the workshops, and of the participants, less than half were willing to quantify their objective weights to allow alternative management actions to be ranked using multicriteria decision analysis methods. Therefore, the alternative management actions that performed best for the subset of participants that did provide objective weights may not represent the full range of best performing alternative management actions for all parties involved with Central Valley and delta water management.
Water management alternatives aimed at maximizing water deliveries and allowing for flexibility in reservoir operations performed best for the four participants that expressed their values and quantified objective weights. The three top-ranked alternatives (“maximize water supply” with and without the Suisun Marsh salinity control gate action and the “June action” alternative) outperformed the others because their scores for five of the eight performance metrics were among the top three ranked alternatives. Relative to the status quo alternative, which represented existing water management operations, the top three ranked alternatives’ water exports were predicted to be between 1.6–1.7 percent and 2.7–3.6 percent higher for the Central Valley and State Water Projects, respectively (total additional exports of 144.5 thousand acre-feet, averaged across hydrology models). The alternative management actions that performed well for CVP and SWP water supply exports also performed well for the Oncorhynchus mykiss (Central Valley steelhead) objective and SWP and CVP coldwater pool/operational flexibility objectives. Conversely, these top ranked alternative management actions performed poorly for the delta smelt and water quality/human health objectives, though the worst case for the water quality/public health objective was above acceptable water quality thresholds. We demonstrated the weight on the delta smelt objective would need to be at least about 0.3–0.4 (depending on the participant) before an alternative management action could produce sufficient abundance for hatchery broodstock collection (for example, “maximize delta smelt historic” or “maximize delta smelt even flow”) to be ranked among the top performing alternatives (fig. 7). Composite scores and the rationale for objective weighting patterns provided by the participants reflected the high value associated with meeting water supply objectives and hedging against drought risk. The importance of coordinated operations between the SWP and CVP to meet beneficial uses was also reflected in the composite scores for alternative management actions based on objective weights provided by Reclamation and the California Department of Water Resources. Combined weights for the SWP and CVP water supply objectives for Reclamation and California Department of Water Resources were 0.49 and 0.30, respectively. Nevertheless, across the range of objective weights provided, rankings of alternative water management actions were generally robust to variation in the objective weights provided by four of the participants and uncertainty in baseline hydrology models used in CalSim 3. However, small adjustments in objective weights could have led to different rankings for Reclamation and participant B (refer to fig. 7).
Our analytical approach to addressing uncertainty was somewhat limited by available models and time allocated to complete our analysis. Although we addressed the sensitivity of the decision to alternative baseline hydrology hypotheses and provided probabilistic forecasts to maintain reservoir operational flexibility, some participants also expressed skepticism in delta smelt abundance predictions—we recognize uncertainty in mechanistic relations between flows and food for delta smelt may be important to decision making, but the importance also depends on a decision-maker’s values (Healy and others, 2024). Additional analyses could help address the sensitivity of alternative management action performance to uncertainties in delta smelt responses, and given objective weights provided by participants, unless the uncertainty in predictions strongly affected the way objective weights were allocated, it may be unlikely this uncertainty would have mattered to the rankings. Further, some participants recognized winter-run Oncorhynchus tshawytscha (Chinook salmon) redd dewatering predictions were likely biased high, and the link between redd dewatering and adult population-level effects were not evaluated. Although VOI (quantified as EVPI) is sensitive to weights placed on the objectives (Healy and others, 2024), in this case there was little sensitivity in EVPI across the range of objective weights provide by the four participants. In this multicriteria decision analysis, EVPI is a dimensionless value that reflects the increase in overall utility that may be achieved once all uncertainty is reduced. The desire to do additional research to reduce uncertainty before choosing a water management alternative may depend on whether the agency decision makers believe an improvement in management performance of about 1 percent or less was worthwhile.
Several participants expressed concerns about the short time frame of our analysis. Decision structure prototypes can be tested, revised, and iterated to allow participants to gain insights into the comprehensiveness of their lists of objectives and alternatives and assess how uncertainties might affect outcomes—the testing, iteration, and revision can lead to an improved understanding of the decision problem, optimization of alternatives, and more durable decisions (Gregory and others, 2012; Smith, 2020b). Additional time for analysis could have been beneficial to the process; however, a protracted timeframe could have precluded the consideration of summer flow alternatives. As a result of time constraints, the SDM analysts and facilitation team took some license in defining some aspects of the decision after input by participants, including defining fundamental objectives and performance metrics. The team had the objectives reviewed and approved and made revisions based on feedback from participants during the workshops. However, additional iteration through the PrOACT sequence may have led to new alternatives that better optimized the objectives. For example, with additional time, we may have been able to further explore the effects of operational adjustments to flows released in the summer to enhance delta smelt abundance while minimizing dewatering of winter-run Chinook salmon redds (for example, alternative down ramping of flows). Our inability to evaluate the consequences of nonflow actions and to develop a portfolio of alternative management actions is another shortcoming of our analysis. Our post-hoc analyses indicate that incorporating nonflow actions such as aquatic weed control may offer meaningful benefits to the delta smelt population while also maintain the flexibility in water supply management. The predicted increases in minimum abundance across both hydrologic baselines—along with the dramatic improvement in utility score for the “maximize water supply” alternative—indicate the potential of aquatic weed control to augment habitat conditions in ways that support delta smelt supplementation goals (app. 2). Although uncertainties remain around efficacy and implementation timelines, the development of a feasible aquatic weed removal action may be beneficial.
Despite the short analysis time frame, we were able to host five in-person workshops to gather input from participants on their objectives and alternatives, test the sensitivity of the decision to uncertainty in competing hydrology models, facilitate swing weighting for four participants, and calculate composite scores to inform decision making. Such analyses can provide support for decision making, and the insights gained during our rapid prototype decision analysis could be incorporated into future decision analyses.
Considerations for Future Decision Analysis
Defining fundamental objectives and eliciting participants’ weights on the objectives was an important focus of our analysis. Future analysts could consider more facilitation with participants to define fundamental objectives specific to future decision contexts and population-level performance metrics sensitive to water management alternatives for listed salmonids, including steelhead and winter-run and spring-run Chinook salmon. A decision-support model could be identified or developed to translate the life stage-specific effects (for example, redd dewatering) of the alternatives to population-level consequences such as persistence probabilities or abundance (for example, Peterson and Duarte, 2020), which more closely aligns with Central Valley Project Improvement Act (CVPIA) management goals. This approach may address concerns raised by participants related to difficulties in interpreting effects, such as redd dewatering, on the overall winter-run Chinook salmon population, for instance. Some participants also represented broad interests that made it difficult for them to reach consensus on objective weights within their organizations. Groups could be further subdivided, if necessary, to allow representation of a broader range of organizational values (for example, objective weights). We also used the local scale, involving the best and worst cases predicted in our decision context, for swing weighting and normalizing performance scores; defining global scales, meaning the inherent range a decision maker might associate with an objective (Monat, 2009), for each performance metric before swing weighting might reduce uncertainty some participants faced when being asked to provide appropriate weights on a metric intrinsically important to them but with a very small range of consequences (for example, water quality/human health).
Predictions of the consequences to elements of complex systems, including the delta and its tributary river systems, are fraught with uncertainty (Peterson and Duarte, 2020; Healy and others, 2024)—we addressed the sensitivity of the decision to only a single source of uncertainty (baseline hydrology assumptions). Nevertheless, participants raised multiple concerns about uncertainty in predictive models and how predictions should be interpreted. Future analyses could more thoroughly address the sensitivity of the decision to uncertainty using value of information (VOI) tools and metrics, including the expected value of partial information (EVPXI; refer to Runge and others, 2011). EVPXI is a measure of the importance of different sources of uncertainty, and this knowledge can then be used to prioritize future monitoring or research. Interest in adaptive management and learning was also expressed by some participants—VOI is an important precursor to formal adaptive management and involves understanding whether uncertainty is important (whether the decision changes depending on which hypothesis is true), and this knowledge can then also inform future research, monitoring, and learning from recurrent decisions related to water management. Newly developed methods for rapid VOI analysis using constructed scales (Runge and others, 2023) may also be useful for decisions about water management in the Central Valley. Because of time constraints, we were unable to fully assess the effects of decisions made in this decision context to future decision making. Dynamic programming may also allow for condition-dependent decision making that considers effects to resources across years (Runge, 2020) and uncertainty in hydrology in a risk assessment framework, which may be a better approach over the long term than treating the decision as a one-off, given the dynamic nature of the hydrology and the use of management in light of the risk of multiyear drought conditions.
References Cited
California Department of Water Resources (CDWR, 2021), 2021, DSM2—Delta simulation model II: Sacramento, Calif., California Department of Water Resources, accessed March 2025, at https://water.ca.gov/Library/Modeling-and-Analysis/Bay-Delta-Region-models-and-tools/Delta-Simulation-Model-II.
California Environmental Protection Agency, 2000, Revised water right decision 1641: California Environmental Protection Agency, accessed July 10, 2025, at https://www.waterboards.ca.gov/waterrights/board_decisions/adopted_orders/decisions/d1600_d1649/wrd1641_1999dec29.pdf.
California Environmental Protection Agency, 2000, Revised water right decision 1641: California Environmental Protection Agency, accessed July 10, 2025, at https://www.waterboards.ca.gov/waterrights/board_decisions/adopted_orders/decisions/d1600_d1649/wrd1641_1999dec29.pdf.
Congressional Research Service, 2024, Central Valley Project—Issues and legislation: 38 p., accessed April 4, 2025, at https://crsreports.congress.gov.
Daw, T.M., Coulthard, S., Cheung, W.W.L., Brown, K., Abunge, C., Galafassi, D., Peterson, G.D., McClanahan, T.R., Omukoto, J.O., and Munyi, L., 2015, Evaluating taboo trade-offs in ecosystems services and human well-being: Proceedings of the National Academy of Sciences, v. 112, no. 22, p. 6949–6954. [Also available at https://www.ncbi.nlm.nih.gov/pubmed/26038547.]
Hammock, B.G., Hobbs, J.A., Slater, S.B., Acuna, S., and Teh, S.J., 2015, Contaminant and food limitation stress in an endangered estuarine fish: Science of the Total Environment, v. 532, p. 316–326, accessed September 27, 2023, at https://www.ncbi.nlm.nih.gov/pubmed/26081734.
Healy, B.D., Phillis, C.C., and Mahardja, B., 2025, Multicriteria decision analysis scores for rapid delta smelt decision analysis: U.S. Geological Survey data release, https://www.sciencebase.gov/catalog/item/67d30fb0d34e1acf3979ce70.
Hemming, V., Camaclang, A.E., Adams, M.S., Burgman, M., Carbeck, K., Carwardine, J., Chades, I., Chalifour, L., Converse, S.J., Davidson, L.N.K., Garrard, G.E., Finn, R., Fleri, J.R., Huard, J., Mayfield, H.J., Madden, E.M., Naujokaitis-Lewis, I., Possingham, H.P., Rumpff, L., Runge, M.C., Stewart, D., Tulloch, V.J.D., Walshe, T., and Martin, T.G., 2022, An introduction to decision science for conservation: Conservation Biology, v. 36, no. 1, p. e13868. [Also available at https://www.ncbi.nlm.nih.gov/pubmed/34856010.]
Herbold, B., Bush, E., Castillo, G., Colombano, D., Hartman, R., Lehman, P., Mahardja, B., and Sommer, T., 2022, Climate change impacts on San Francisco Estuary aquatic ecosystems—A review: San Francisco Estuary and Watershed Science, v. 20, no. 2, p. 29, accessed October 13, 2023, at https://escholarship.org/content/qt2xb097t7/qt2xb097t7.pdf?t=re8lph.
National Marine Fisheries Service, 2014, Recovery plan for the evolutionarily significant units of Sacramento River winter-run Chinook salmon and Central Valley spring-run Chinook salmon and the distinct population segment of California Central Valley steelhead: Sacramento, Calif., National Marine Fisheries Service, 407 p.
National Marine Fisheries Service (NMFS), 2024, Endangered Species Act Section 7(a)(2) programmatic biological opinion for the reinitiation of consultation on the long-term operation of the Central Valley Project and State Water Project: National Marine Fisheries Service, Biological Opinion, [variously paged]. [Also available at https://www.fisheries.noaa.gov/resource/document/endangered-species-act-section-7a2-programmatic-biological-opinion-reinitiation.]
R Core Team, 2019, R—A language and environment for statistical computing: The R Foundation web page, accessed January 1, 2025, at https://www.R-project.org/.
Rasmussen, N., Conrad, J.L., Green, H., Khanna, S., Wright, H., Hoffmann, K., Caudill, J., and Gilbert, P., 2022, Efficacy and fate of fluridone applications for control of invasive submersed aquatic vegetation in the estuarine environment of the Sacramento-San Joaquin Delta: Estuaries and Coasts, v. 45, no. 7, p. 1842–1860.
Smith, W.E., and Nobriga, M.L., 2023, A bioenergetics-based index of habitat suitability—Spatial dynamics of foraging constraints and food limitation for a rare estuarine fish: Transactions of the American Fisheries Society, v. 152, no. 5, p. 650–671, September 13, 2023, at https://onlinelibrary.wiley.com/doi/full/10.1002/tafs.10427I.
Sommer, T., Hartman, R., Koller, M., Koohafkan, M., Conrad, J.L., MacWilliams, M., Bever, A., Burdi, C., Hennessy, A., and Beakes, M., 2020, Evaluation of a large-scale flow manipulation to the upper San Francisco Estuary—Response of habitat conditions for an endangered native fish: PLoS One, v. 15, no. 10, p. e0234673, accessed December 23, 2024, at https://www.ncbi.nlm.nih.gov/pubmed/33002006.I.
State Water Resources Control Board, 2023, Economically disadvantaged communities in Draft staff report—Sacramento/Delta update to the Bay-Delta plan: Sacramento, Calif., California State Water Resources Control Board, accessed May 1, 2025, at https://www.waterboards.ca.gov/waterrights/water_issues/programs/bay_delta/docs/2023/staff-report/ch10-dacs.pdf.
U.S. Fish and Wildlife Service (FWS), 2006, Relationships between flow fluctuations and redd dewatering and juvenile stranding for Chinook Salmon and steelhead in the Sacramento River between Keswick Dam and Battle Creek: Sacramento, Calif., Energy Planning and Instream Flow Branch, U.S. Fish and Wildlife Service.
Appendix 1. List of Proposed Objectives Submitted by Participants
Table 1.1.
List of proposed objectives and performance metrics submitted by participants before workshop one in February 2025.[≥, greater than or equal to; SDM, structured decision making; LTO, long term operations; AMP, adaptive management plan; SWP, State Water Project; CVP, Central Valley Project]
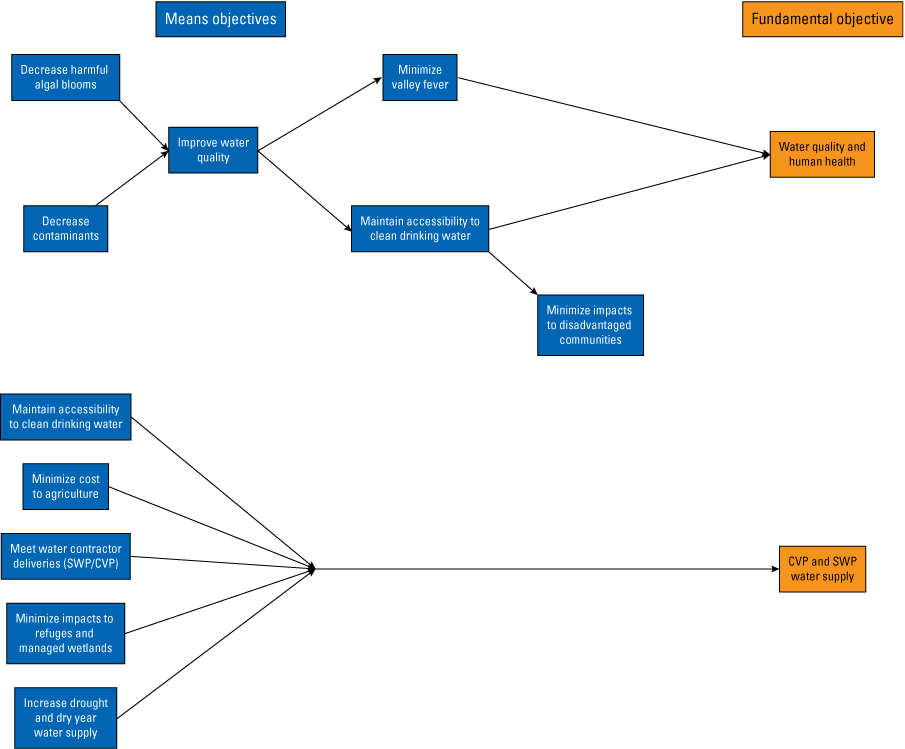
Objectives hierarchy for the water quality/human health objective and the Central Valley Project and State Water Project water supply objectives. Means objectives are related to and lead to fundamental objectives for water quality, public health, and water supply.
Appendix 2. Estimating the Consequences of Aquatic Weed Control Action for Delta Smelt
Table 2.1.
Description of additional alternatives that included aquatic weed removal action that were analyzed post-hoc.[X2 is the location of the low salinity zone as measured in kilometers from the Golden Gate Bridge. ft3/s, cubic foot per second; km, kilometer, NA, not applicable]
Table 2.2.
Composite utility scores by water management alternative from the multicriteria decision analysis, with aquatic weed removal action included.[Columns show composite utility scores, by management alternative (rows), calculated using objective weights provided by participants and normalized performance metric scores, assuming equal weight on two competing baseline hydrology model parameterizations. Darker green shading in the cells indicate top-ranked alternatives for each participant, and pink shading indicates the lowest ranked alternative. CDWR, California Department of Water Resources]
Conversion Factors
Temperature in degrees Celsius (°C) may be converted to degrees Fahrenheit (°F) as follows:
°F = (1.8 × °C) + 32.
Temperature in degrees Fahrenheit (°F) may be converted to degrees Celsius (°C) as follows:
°C = (°F – 32) / 1.8.
Supplemental Information
A water year is the 12-month period from October 1 through September 30 of the following year and is designated by the calendar year in which it ends.
Abbreviations
ANN EC
Jersey Point artificial neural network conductivity
CDFW
California Department of Fish and Wildlife
CDWR
California Department of Water Resources
CESA
California Endangered Species Act
CVP
Central Valley Project
CVPC
Central Valley Project water contractors
DAC
disadvantaged communities
ESA
Endangered Species Act of 1973
EVPI
expected value of perfect information
EVPXI
expected value of partial information
FWS
U.S. Fish and Wildlife Service
IBMR
individual-based model in R
LTO
long-term operations
MCDA
multicriteria decision analysis
MHI
median household income
NMFS
National Marine Fisheries Service
RVOS
River Valve Outlet System
SDAC
severely disadvantaged communities
SDM
structured decision making
SWC
State Water Contractors
SWP
State Water Project
SWRCB
State Water Resources Control Board
taf
thousand acre-feet
USGS
U.S. Geological Survey
VOI
value of information
For more information about the research in this report, contact
Disclaimers
Any use of trade, firm, or product names is for descriptive purposes only and does not imply endorsement by the U.S. Government.
Although this information product, for the most part, is in the public domain, it also may contain copyrighted materials as noted in the text. Permission to reproduce copyrighted items must be secured from the copyright owner.
Suggested Citation
Healy, B.D., Phillis, C.C., Mahardja, B., Koizumi, C., Pien, C., Parker, N., Conrad, J.L., Ekstrom, J., Leimbach, J., Silberblatt, R., Fischer, T., and Ehlo, C., 2025, Rapid structured decision making for Hypomesus transpacificus (delta smelt) summer–fall freshwater outflow management: U.S. Geological Survey Open-File Report 2025–1055, 36 p., https://doi.org/10.3133/ofr20251055.
ISSN: 2331-1258 (online)
| Publication type | Report |
|---|---|
| Publication Subtype | USGS Numbered Series |
| Title | Rapid structured decision making for Hypomesus transpacificus (delta smelt) summer–fall freshwater outflow management |
| Series title | Open-File Report |
| Series number | 2025-1055 |
| DOI | 10.3133/ofr20251055 |
| Publication Date | December 09, 2025 |
| Year Published | 2025 |
| Language | English |
| Publisher | U.S. Geological Survey |
| Publisher location | Reston, VA |
| Contributing office(s) | Southwest Biological Science Center |
| Description | Report: viii, 36 p.; Data Release |
| Online Only (Y/N) | Y |
| Additional Online Files (Y/N) | N |