

Gas Chemistry and Isotope Data for Volcano Monitoring at the Lassen Volcanic Center, Lassen Volcanic National Park
Links
- Document: Report (2.58 MB pdf) , HTML , XML
- Data Release: USGS data release - Chemical and isotopic compositions of gases from volcanic and geothermal areas in California
- Download citation as: RIS | Dublin Core
Acknowledgments
We thank Michael Magnuson, wildlife biologist at Lassen Volcanic National Park, for supporting our work. Without his help, many of the samples reported in this study would not have been collected. We thank Mike Clynne and Patrick Muffler of U.S. Geological Survey for their invaluable advice on historic sample locations. Joel Robinson of U.S. Geological Survey provided the base map used in figure 1. Recent samples from the Lassen Peak hot spot were part of a monitoring effort sustained through the work of Steve Ingebritsen (U.S Geological Survey). Helpful reviews were provided by William Evans and Patrick Muffler.
Abstract
This report presents chemical and isotopic compositions of volcanic gases collected from thermal areas within Lassen Volcanic National Park in northern California from 1974 through 2019. As the southernmost volcano in the Cascade Range and designated a very-high-threat volcano by the U.S. Geological Survey, the Lassen Volcanic Center (LVC) requires consistent monitoring to assess potential volcanic hazards. In 2014, the California Volcano Observatory established a gas geochemical monitoring program at LVC to provide baseline data to evaluate future changes.
Results demonstrate consistent spatial patterns in bulk gas chemistry that support a two-circulation-cell hydrothermal model previously established for LVC. Gas samples from circulation cell 1 thermal areas have higher helium isotope ratios (6.59–7.50 times the air value) than those from circulation cell 2 (5.86–6.52 times the air value), indicating a stronger magmatic signature. The Sulphur Works and Pilot Pinnacle thermal areas within circulation cell 1 consistently emit gases with the highest magmatic helium contents, suggesting gas at these areas best represents conditions in the underlying volcanic system. A slight decrease in helium isotope values since 1974 may indicate progressive dilution of magmatic helium-3 (3He) by radiogenic helium-4 (4He) in the absence of recent magma intrusion. Carbon isotope compositions of carbon dioxide across all thermal areas are relatively uniform (−9.7–−7.3 per mil), falling within the range observed at other Cascade Range volcanoes. Based on gas geochemical characteristics and site accessibility, the Sulphur Works and Pilot Pinnacle thermal areas represent optimal targets for continued monitoring of the LVC magmatic-hydrothermal system. This study includes the most comprehensive helium isotope dataset collected at LVC currently available and establishes critical baseline data for future volcanic monitoring efforts.
Introduction
The 825,000-year-old Lassen Volcanic Center (LVC) in northern California is at the southernmost part of the Cascade Range (fig. 1), where volcanism results from the oceanic Juan de Fuca plate subducting beneath the continental North American plate. The LVC includes an early caldera complex, a composite volcano, and a domefield, and is distributed over approximately 500 square kilometers. The LVC is the youngest of five intermediate-to-silicic volcanic centers in the region that have erupted over the past 3.5 million years and is the only active center (Clynne and Muffler, 2010). The LVC experienced three Holocene eruptions, with the most recent being a series of eruptions at Lassen Peak from 1914 through 1917 (Clynne and others, 2014; Muffler and Clynne, 2015). The Center hosts a long-lived hydrothermal system indicated by thermal areas south of Lassen Peak (fig. 1). Designated a very-high-threat volcano by the U.S. Geological Survey (USGS), LVC threatens the region with a variety of volcanic hazards (Ewert and others, 2005; Clynne and others, 2012; Ewert and others, 2018). As such, the USGS California Volcano Observatory initiated a regular gas geochemical monitoring program at LVC in 2014, designed to provide a baseline of chemical and isotopic data relevant to assessing change in the context of potential unrest.
This report presents the chemical and isotopic compositions of gas samples collected from 1974 to 2019 from LVC’s major thermal areas, with focus on data collected as part of the California Volcano Observatory geochemical monitoring program and available in Lewicki and others (2024a). For completeness, we also include data from two samples collected in 2002 (Janik and Bergfeld, 2010). These data include the most comprehensive helium isotope record ever collected at LVC. We assess these data in the context of earlier work at LVC (Craig and others, 1978; Janik and McLaren, 2010), with a focus on the conceptual model of LVC’s hydrothermal system, temporal variations that could indicate changes in the magma-hydrothermal system, and implications for future monitoring strategies.
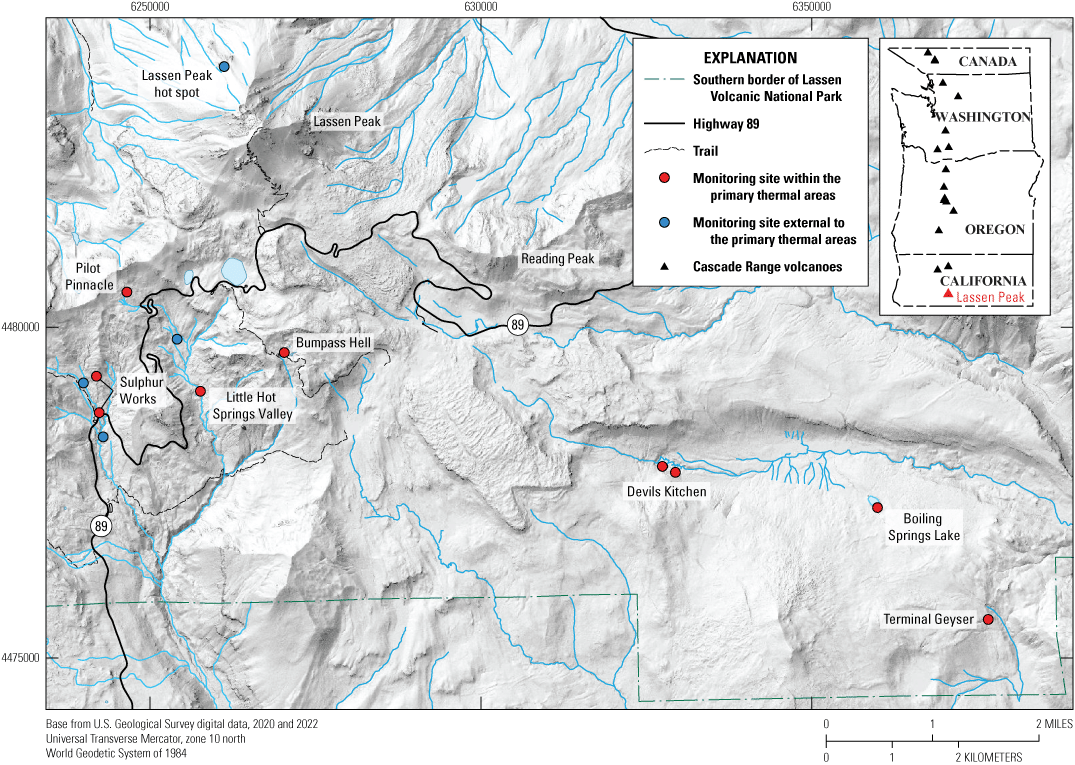
Map showing generalized gas sample locations within Lassen Volcanic National Park and the Lassen Volcanic Center. Red circles are monitoring sites within the primary thermal areas. Blue circles are other gas sample sites, external to the main thermal areas. Thick black line is highway 89, thin black lines are trails, dashed green line is the southern border of the park. Inset shows the location of Lassen Peak relative to other Cascade Range volcanoes (triangles).
Background
Early studies of the LVC’s thermal features were reported by Waring (1915) and Day and Allen (1925). Later advancements in analytical methods enhanced the understanding of noble-gas and stable-isotope systematics within the volcanic system. Deuterium and oxygen isotope data revealed that the thermal fluids originate from locally sourced meteoric water from high elevations, such as Lassen Peak (Janik and others, 1983). Carbon and sulfur isotope data indicated the presence of magmatic and metamorphic contributions to the hydrothermal system (Janik and others, 1983). These data enabled the development of a model describing fluid pathways and temperatures within the hydrothermal system.
An early model of Lassen’s hydrothermal system, detailed by Muffler and others (1982), Janik and others (1983), and Truesdell and others (1983), described a single hydrothermal system recharged by cold meteoric water infiltrating the subsurface. The water, heated conductively by proximity to young silicic intrusions, reaches temperatures of about 235–240 degree Celsius (°C). This buoyant hot water rises and boils, creating a vapor cap above a liquid thermal reservoir. The main upflow of gas and steam occurs at Bumpass Hell with additional steam discharge at acid-sulfate thermal areas: Sulphur Works, Pilot Pinnacle, Little Hot Springs Valley, Devils Kitchen, Boiling Springs Lake, and Terminal Geyser (fig. 1). Low gas-to-steam ratios at Devils Kitchen, Boiling Springs Lake, and Terminal Geyser suggested a west-to-east direction of flow. An outflow plume of neutral-pH, high-chloride water discharges at the lower-elevation Growler and Morgan Hot Springs.
Later work by Janik and McLaren (2010) integrated regional seismic data with isotope and compositional data on gas and steam collected from superheated fumaroles between 1976 and 2000. That research produced a refined model of the hydrothermal system that describes two distinct hydrothermal cells. The hottest circulation cell (circulation cell 1; CC1) is recharged from precipitation on the southwest flank of Lassen Peak and reaches temperatures of 235–270°C. The most vigorous upflow of gas supplies features at Bumpass Hell and Little Hot Springs Valley, whereas cooler, less-boiled gas discharges at Sulphur Works and Pilot Pinnacle. A degassed plume of thermal water from CC1 outflows and discharges at Growler and Morgan Hot Springs. A second circulation cell (circulation cell 2; CC2) is recharged from precipitation on Reading Peak and the southeast side of Lassen Peak. Reservoir temperatures in CC2 are between 220 and 240°C. This second reservoir is the source of gas and steam that discharges at Boiling Springs Lake and Devils Kitchen. The outflow of degassed water from CC2 boils a second time and discharges at Terminal Geyser.
Throughout this report, sampled features are described as fumaroles, frying pans, steaming ground, hot springs, mud pots, and pools. For the purposes of this report fumaroles are vents that have a strong, focused outflow of gas and temperatures greater than or equal to boiling (Bergfeld and others, 2014). Fumaroles are “superheated” when the vent temperature is greater than the local boiling point (Allen and Day, 1935). The term frying pan describes a shallow depression where the gas upflow causes a mixture of steam and water to splash above the ground surface (Clynne and others, 2003). Sites lacking discrete vents such that the gas and steam discharges over a broad area are considered steaming ground. Features where gas discharges through water are referred to as pools if there is no outflow channel, or hot springs otherwise. Mudpots are degassing features where cavities in the underlying rock are filled with muddy water and steam (Clynne and others, 2003).
Our goal in this work was to revisit historical sample locations with a focus on collecting gas from superheated fumaroles to augment earlier research with helium isotope data. Superheated temperatures vary with elevation and exceed 94°C at lower elevations (for example, Boiling Springs Lake and Terminal Geyser) and 92°C at higher elevations (for example, Bumpass Hell and Pilot Pinnacle) because the boiling point of water decreases with decreasing atmospheric pressure at higher elevation. During this investigation, superheated fumaroles were sampled at Bumpass Hell, upper Sulphur Works, Little Hot Springs Valley, and Terminal Geyser. Resampling historical sites proved challenging, because some fumaroles described by Janik and McLaren (2010) were unsafe to access or were no longer present. Due to flooding, we were only able to sample Big Boiler fumarole at Bumpass Hell once, and the upflow was so forceful it repeatedly blew the fumarole tube out of the vent. In addition, an area of thermal ground that developed at Devils Kitchen between 2000 and 2002 is no longer active. We infer that two superheated fumaroles at Pilot Pinnacle and upper Sulphur Works collapsed and now are roiling pools of water.
Field and Laboratory Methods
The primary targets of this study were superheated fumaroles; however, when they were not available, sample sites were selected based on high temperatures and strong gas upflows. When possible, we sampled the same locations on repeat visits, but due to changing surface conditions, this wasn’t always possible. For example, Big Boiler fumarole vents from the bottom of a depression and during most site visits was submerged beneath a violently roiling pool of water. Similarly, the superheated fumarole in Little Hot Springs Valley discharges from the bank of Sulphur Creek and at times was submerged. In addition, after 2007, ground collapse around the fumarole at Terminal Geyser created an enclosed depression that was not safe to enter.
Samples were collected and analyzed using standard field and laboratory methods (Bergfeld and others, 2014). Location coordinates were recorded using a Garmin global positioning system. Temperature was measured using a K-type thermocouple and a digital thermometer. The gas upflow was captured using one of several collection devices: a titanium tube inserted into discrete vents; a Pyrex-lined stainless-steel tube inserted into the ground at sites that lacked a discrete vent; or an inverted plastic funnel placed over gas bubbles at hot springs, pools, frying pans, or areas of steaming ground. Tygon tubing was used to connect the collection devices to preevacuated double-port glass collection bottles, and the entire setup was purged of atmospheric components before gas and steam collection. The same setup was used to collect gas for analysis of helium isotopes and other noble gases. For these samples, the gas was flowed through copper tubing for sufficient time to purge atmospheric gas before the tubing was crimped shut.
Our standard sampling routine to determine bulk chemistry was to collect gas in two types of double-port glass bottles. Giggenbach-type bottles are glass bottles partially filled with a 4-normal sodium hydroxide (herein called caustic) solution (Giggenbach, 1975). The solution is gently heated, and the headspace is evacuated before use. Empty evacuated (EE) bottles, by contrast, contain no solution and are similarly evacuated before use.
Samples collected in Giggenbach-type bottles provide several advantages over those collected in EE bottles. Because hydrogen sulfide dissolves in the caustic solution, this method prevents reaction with any oxygen in the headspace gases and provides the most robust analysis of hydrogen sulfide concentrations. Also, since steam and carbon dioxide dissolve in the caustic solution, the vacuum is retained for a long period of time and permits concentration of trace gas components in the headspace (the gas-filled space above the solution). In addition, we can determine ammonia concentrations in samples collected in a caustic solution.
We collect gas in EE bottles to provide the most accurate analyses of certain components. Carbon monoxide concentrations can be directly measured in samples collected in EE bottles, whereas in Giggenbach bottles, carbon monoxide concentrations must be calculated due to partitioning between the headspace and caustic solution. Carbon dioxide collected in EE bottles is preferred for isotopic analysis to avoid carbon isotope fractionation that can occur when preparing the caustic solution. At sites with low gas upflows, where collection into liquid-filled bottles was impractical, only EE bottles were used.
Bulk gas compositions were determined at the Volcano Hazards gas laboratory at the USGS in Menlo Park, California. Analysis of headspace components was performed using Varian gas chromatographs equipped with thermal conductivity, flame ionization, and pulsed discharge helium ionization detectors using argon and helium carrier gases. Gas concentrations reported for EE samples containing greater than 1 gram of condensed steam were corrected for dissolution using Henry’s law (Henry, 1803).
Concentrations of the absorbed soluble gases in Giggenbach-type bottles were determined by wet-chemical techniques, including ion chromatography using a Dionex ICS–2000 for hydrogen sulfide (after conversion to sulfate), an ion-selective electrode for ammonia, and direct measurement of carbon dioxide on a vacuum extraction line by acidifying an aliquot of the caustic solution. Analysis of caustic blanks provided details on background concentrations of carbon dioxide and sulfate that were used to correct measured values.
Gas-to-steam ratios (Xg), the mole fraction of dry gas relative to gas plus steam, and ammonia concentrations are reported only for caustic samples and are not given for gas collected from hot springs and pools. The carbon monoxide concentrations reported for samples collected in Giggenbach-type bottles are calculated by multiplying the ratio of carbon monoxide to methane (or hydrogen) determined in the EE analysis by the measured methane (or hydrogen) concentration in the caustic analysis, assuming the same ratio is present in both samples. More details on analytical techniques for bulk gas compositions can be found in Bergfeld and others (2014).
Isotope analyses were performed at other USGS laboratories. Stable isotope analysis of carbon dioxide gas was performed using standard mass spectrometry methods at the USGS Reston Stable Isotope Laboratory in Reston, Virginia. The purified carbon dioxide gas was analyzed on a dual inlet isotope ratio mass spectrometer (Coplen, 1973), and results are reported in δ13C notation (δ13C-CO2) expressed as per mil (‰) relative to the Vienna Pee Dee Belemnite (VPDB) standard. Noble gas abundances and isotopic ratios were analyzed by mass spectrometry at the USGS Noble Gas Laboratory in Denver, Colorado. The helium isotope ratios are reported as R/RA values where R is the 3He/4He ratio in the sample and RA is the atmospheric ratio. We also report RC/RA values that are R/RA values corrected for air contamination (if present). Details on noble gas analysis are given in Bergfeld and others (2020).
Results
Bulk Gas Contents
Tables 1 and 2 include field parameters and dry-gas (steam excluded) chemistry for Giggenbach-type and EE-type samples, respectively. Sites where samples were collected using both types of bottles are identified as having a replicate in table 1. The maximum fumarole temperature measured was 136.6°C at Little Hot Springs Valley in 2018. A similarly high temperature of 132.4°C was measured at Bumpass Hell in 2014, the only year we were able to collect gas from Big Boiler fumarole.
Comparison of the gas compositions reveals large differences between the LVC thermal areas. Gas from upper Sulphur Works has high nitrogen to argon (N2/Ar) ratios (110–850) and Xg values (8–15), whereas gas from Terminal Geyser contains substantial steam with low Xg values (less than or equal to 1), and higher concentrations of carbon monoxide, hydrogen sulfide, and ammonia compared to Sulphur Works (table 1). Methane concentrations are relatively low (less than or equal to 0.1 mole percent) at all thermal areas, typical of gas from geothermal systems hosted in volcanic rocks (Goff and Janik, 2002), but are highest in gas associated with the CC2 reservoir (Devil’s Kitchen, Boiling Springs Lake, and Terminal Geyser).
Table 1.
Field parameters and mole percent dry-gas compositions (steam removed) of gas collected in caustic solution from thermal features in Lassen Volcanic National Park, 2002–19.[Gas concentrations reported as volume percent. Samples are grouped by thermal area. Sites not directly related to thermal areas are grouped as “external.” CO concentrations are calculated using gas ratios from the EE-type bottles (see text). DK data from 2002 was previously reported in Janik and Bergfeld (2010). All other compositional data are from Lewicki and others (2024a). Date shown as month/day/year. Replicate, “yes” indicates samples were collected in caustic and EE bottles, otherwise are listed with a “no.” Temp., temperature; °C, degree Celsius; Type = F, fumarole; FP, frying pan; P, pool; SG, steaming ground; WGS 84, World Geodetic System of 1984; m, meters; Xg, mol fraction of dry gas relative to the mol fraction of gas plus steam expressed as %, percent; CO2, carbon dioxide; H2S, hydrogen sulfide; He, helium; H2, hydrogen; Ar, argon; O2, oxygen; N2, nitrogen; NH3, ammonia; CH4, methane; C2H6, ethane; CO, carbon monoxide; C3H8, propane; C4H10, butane; N2/Ar, nitrogen to argon ratio; BH, Bumpass Hell; BSL, Boiling Springs Lake; DK, Devils Kitchen; LHSV; Little Hot Springs Valley; PP, Pilot Pinnacle; SW, Sulphur Works; TG, Terminal Geyser; <, less than; bd, below detection limit; nd, not determined]
Table 2.
Field parameters and mole percent dry-gas compositions (steam removed) of gas collected in empty evacuated bottles from thermal features in Lassen Volcanic National Park, 2004–19.[Data are from Lewicki and others (2024a). Date shown as month/day/year. Temp., temperature; °C, degree Celsius; Type = F, fumarole; FP, frying pan; HS, hot spring; P, pool; SG, steaming ground; WGS 84, World Geodetic System of 1984; m, meters; CO2, carbon dioxide; H2S, hydrogen sulfide; He, helium; H2, hydrogen; Ar, argon; O2, oxygen; N2, nitrogen; CH4, methane; C2H6, ethane; CO, carbon monoxide; C3H8, propane; C4H10, butane; N2/Ar, nitrogen to argon ratio; Steam correlation, “yes” indicates that the measured concentration has been corrected for the dissolved component calculated using Henry’s law (Henry, 1803), otherwise “no.” BH, Bumpass Hell; BSL, Boiling Springs Lake; DK, Devils Kitchen; LHSV; Little Hot Springs Valley; PP, Pilot Pinnacle; SW, Sulphur Works; TG, Terminal Geyser; <, less than; bd, below detection limit; nd, not determined]
Ternary diagrams are used to illustrate differences in gas compositions associated with each thermal area (figs. 2 and 3). For these diagrams, we correct the data for the presence of atmospheric nitrogen (N2) and argon (Ar) by assuming any oxygen (O2) in the bulk gas is derived from air. We then use atmospheric N2/O2 and Ar/O2 ratios to calculate and subtract N2 and Ar associated with the O2. All data plotted on the ternary diagrams are from samples collected in Giggenbach-type bottles, and most are from samples collected at fumaroles, steaming ground, and frying pans. We exclude results from hot springs and pools, with one exception, because some components of the gas may partially dissolve into water, especially at slowly degassing sites. We include gas data from the roiling pool at Pilot Pinnacle because it is the major feature in the thermal area.
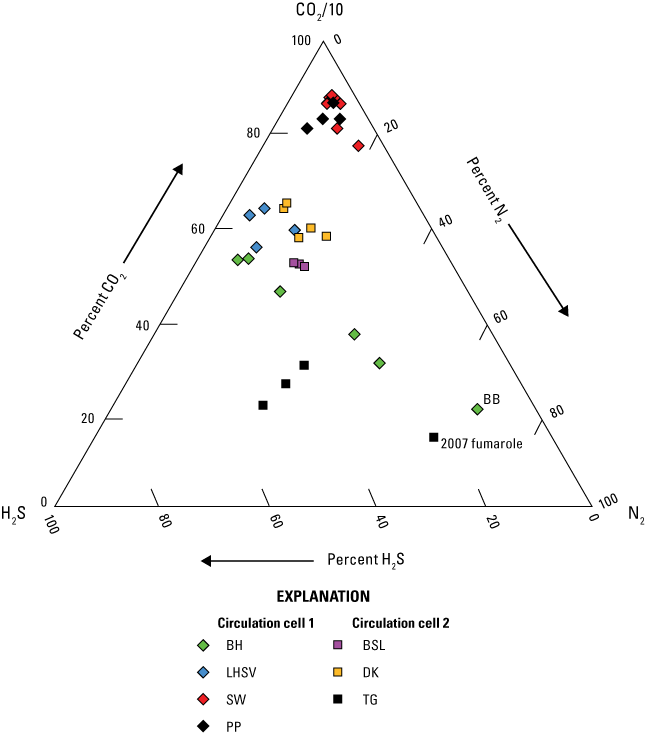
A ternary N2-He-Ar diagram (fig. 2) allows comparison between gases with contributions from shallow meteoric sources (air and air-saturated meteoric water [ASMW]) and those derived from sources rich in helium (mantle or crust) or nitrogen-rich arc-type sources (Giggenbach, 1996). As a whole, LVC gases plot along a mixing trend between shallow meteoric and deep arc-type sources. Samples with the largest component of deeply derived gas were collected from Sulphur Works and Pilot Pinnacle, whereas samples with the largest meteoric components were collected from Terminal Geyser, Bumpass Hell, and Devils Kitchen. Three samples from Sulphur Works indicate mixing with an air endmember. Compared with gas from the steaming ground site, the three samples collected at the roiling pool at Pilot Pinnacle demonstrate a stronger shallow component. Gases from Bumpass Hell have a strong meteoric signature but are varied and distinct. The N2/Ar ratios in three samples are characterized by an air-like source, and three others are more similar to ASMW.

Ternary diagram showing relative concentrations of nitrogen (N2), helium (He), and argon (Ar) for samples collected in Giggenbach-type bottles at Lassen Volcanic National Park between 2002 and 2014. Data from the BH (Bumpass Hell), LHSV (Little Hot Springs Valley), SW (Sulphur Works), and PP (Pilot Pinnacle) thermal areas associated with circulation cell 1 are shown as green, blue, red, and black diamond symbols, respectively. Data from the BSL (Boiling Springs Lake), DK (Devils Kitchen), and TG (Terminal Geyser) thermal areas associated with circulation cell 2 are shown with magenta, orange, and black squares, respectively). BB = Big Boiler fumarole, p indicates gas samples collected from a roiling pool, ASMW = air-saturated meteoric water. Note that gas concentrations have been corrected for the presence of air.
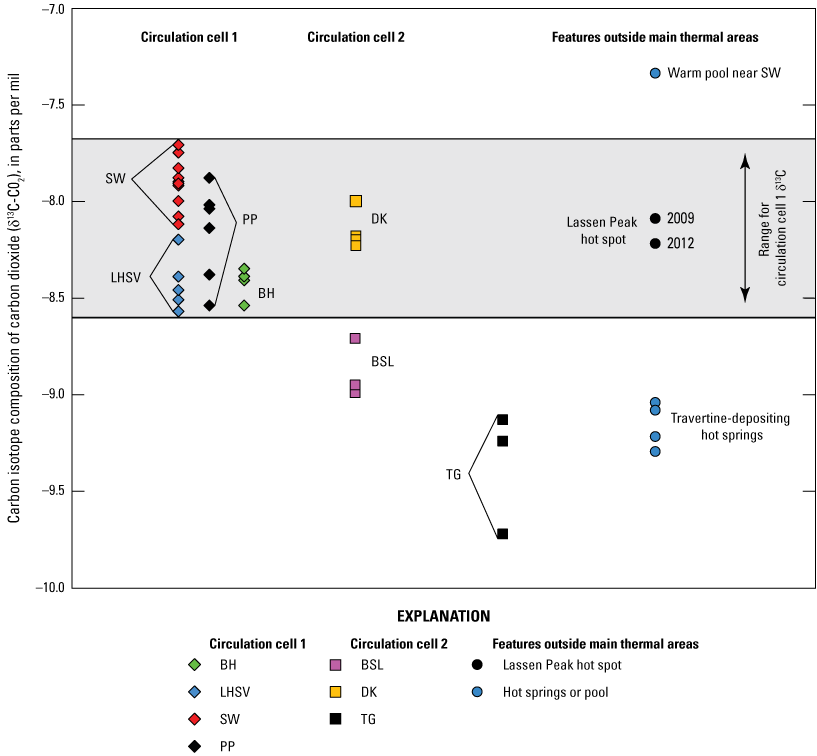
Together, carbon dioxide, hydrogen sulfide, and nitrogen account for more than 95 percent of the total gas in each sample (table 1). A ternary diagram of the relative concentrations of these components reveals three groupings: (1) gases from Sulphur Works and Pilot Pinnacle, dominated by high carbon dioxide and relatively low hydrogen sulfide; (2) gases from Terminal Geyser, characterized by high hydrogen sulfide, and low carbon dioxide; and (3) a group consisting of samples from Little Hot Springs Valley, Devils Kitchen, Boiling Springs Lake, and three Bumpass Hell sites, that contain moderate concentrations of both hydrogen sulfide and carbon dioxide (fig. 3). Three additional Bumpass Hell samples and a sample from Terminal Geyser trend toward the nitrogen vertex of the diagram.
Ternary diagram showing relative concentrations of carbon dioxide (CO2), hydrogen sulfide (H2S), and nitrogen (N2) for samples collected in Giggenbach-type bottles at Lassen Volcanic National Park between 2002 and 2019. Data from the BH (Bumpass Hell), LHSV (Little Hot Springs Valley), SW (Sulphur Works), and PP (Pilot Pinnacle) thermal areas associated with circulation cell 1 (CC1) are shown as green, blue, red, and black diamond symbols, respectively. Data from the BSL (Boiling Springs Lake), DK (Devils Kitchen), and TG (Terminal Geyser) thermal areas associated with circulation cell 2 (CC2) are shown with magenta, orange, and black squares, respectively. Symbols are as in figure 2. BB = Big Boiler fumarole, results from the 2007 fumarole at TG are distinct from TG samples collected in other years. Note that gas concentrations have been corrected for the presence of air.
Carbon and Helium Isotope Compositions
Table 3 presents carbon and helium isotope results for gas collected from within and outside of the main LVC thermal areas. The external areas include the Lassen Peak hot spot (a persistent zone of steaming ground on the north side of Lassen Peak), two small travertine-depositing hot springs, and a warm pool (fig. 1). Most of the carbon dioxide isotope data in table 3 are from gas collected in EE bottles. When samples were not collected in EE bottles, we report results from carbon dioxide extracted from caustic in the Giggenbach bottle in table 3 for completeness but do not discuss further.
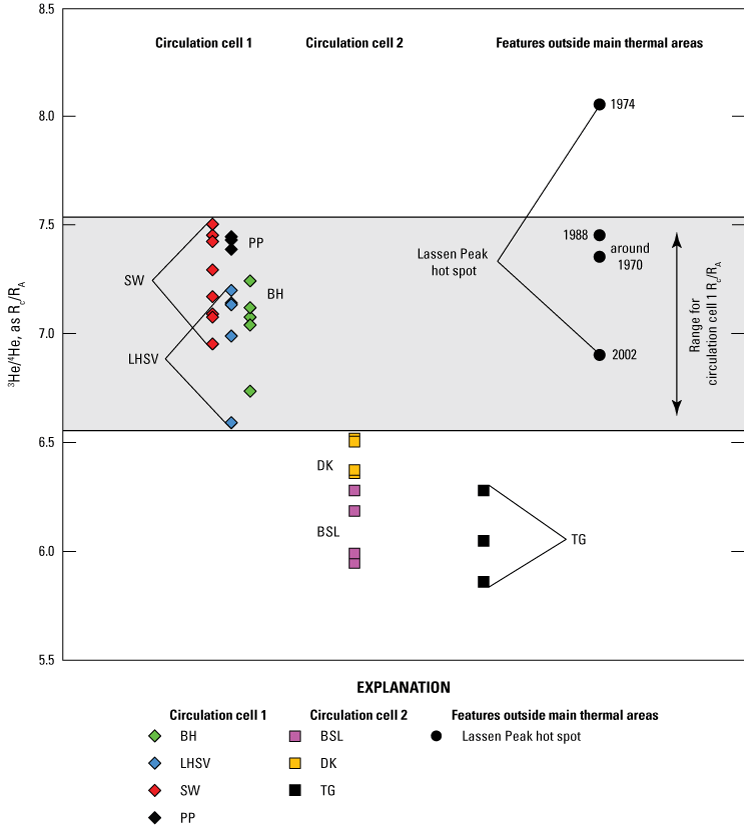
Carbon isotope values of carbon dioxide from all locations in this study are similar, with only a 2.4‰ difference across all the sites (from −9.7 to −7.3‰). Within this range, the outlying values are carbon dioxide from Terminal Geyser (from −9.7 to −9.1‰), the external travertine-depositing hot springs (from −9.3 to −9.0‰), and the warm pool (−7.3‰) (table 3, fig. 4). The δ13C values of carbon dioxide within the major thermal areas vary only by 2‰. Carbon isotope values of gas from all CC1 sites and Devils Kitchen are between −8.6 and −7.7‰, and contrast with slightly lower isotope values for carbon dioxide from Boiling Springs Lake, from −9.0 to −8.7‰, and Terminal Geyser as mentioned above. The carbon isotope compositions of two carbon dioxide samples from the Lassen Peak hot spot (between −8.2 and −8.1‰) are consistent with those from CC1 gases.
Plot showing δ13C-CO2 values for gases collected in EE bottles at Lassen Volcanic National Park between 2004 and 2019. Data from thermal areas associated with circulation cell 1 (CC1), BH (Bumpass Hell), LHSV (Little Hot Springs Valley), SW (Sulphur Works), PP (Pilot Pinnacle) are shown as diamond symbols. Results from thermal areas associated with circulation cell 2 (CC2), BSL (Boiling Springs Lake), DK (Devils Kitchen), and TG (Terminal Geyser) are shown with squares. Data from outside the main thermal areas, the Lassen Peak hot spot, a warm pool near SW, and 4 travertine-depositing hot springs are shown as circles.
Table 3.
Field parameters, helium-3 (3He) to helium-4 (4He) (3He/4He) ratios, and carbon isotope results for gas samples collected from thermal features in Lassen Volcanic National Park, 1974–2019.[Data are from Lewicki and others (2024a). Carbon isotope values are reported as per mil relative to Vienna Pee Dee Belemnite. Date shown as month/day/year. Temp., temperature; °C, degree Celsius; Type = F, fumarole; FP, frying pan; HS, hot spring; P, pool; SG, steaming ground; WGS 84, World Geodetic System of 1984; m, meters; R/RA, 3He/4He ratio in the gas relative to the ratio in air; RC/RA, the R/RA value corrected for air; δ13C-CO2, isotope value of carbon dioxide expressed in per mil, BH, Bumpass Hell; DK, Devils Kitchen; LHSV, Little Hot Springs Valley; PP, Pilot Pinnacle; SW, Sulphur Works; TG, Terminal Geyser; nd, not determined]
Comparison of helium isotope Rc/RA values reveals that gases collected from the CC1 thermal areas have higher values, and thus a stronger magmatic signature, than gas from CC2 (table 3; fig. 5). The Rc/RA values of gas from CC1 locations are between 6.59 and 7.50 with the highest values associated with Sulphur Works and Pilot Pinnacle (fig. 5). By comparison, most Rc/RA values for gas from CC2 sites are between 5.86 and 6.52. Gas from sites at Devils Kitchen has consistently higher Rc/RA values than gas from Boiling Springs Lake and Terminal Geyser. One sample from Terminal Geyser (not plotted) had an anomalous value of 3.11 (table 3), indicating strong dilution by air. Figure 5 includes helium isotope values of gas collected sporadically from the Lassen Peak hot spot, which had a maximum value of 8.05 Rc/RA in 1974. In other years, the Rc/RA values of the hot spot gas are within the range of gas from the CC1 sites.
Plot showing air-corrected helium isotope values for gas collected at Lassen Volcanic National Park between 1974 and 2019. Data from thermal areas associated with circulation cell 1 (CC1), BH (Bumpass Hell), LHSV (Little Hot Springs Valley), SW (Sulphur Works), and PP (Pilot Pinnacle) are shown as diamond symbols. Data from thermal areas associated with circulation cell 2 (CC2), BSL (Boiling Springs Lake), DK (Devils Kitchen), and TG (Terminal Geyser) are shown with squares. Gas from the Lassen Peak hot spot is shown with circles, the R/RA value from about 1970 is from Welhan and others (1988).
Discussion
Sources of Carbon Dioxide and Helium
The δ13C values of carbon dioxide discharging from the main thermal areas at Lassen are slightly lower than carbon derived from a mantle source (from −8 to −3‰; Rollinson, 1993) but fall within the range observed at other Cascade Range volcanoes (from −11.8 to −6.5‰; Evans and others, 2010). A detailed study by Evans and others (2010) found that low δ13C-CO2 values predominate at nearly all the major Cascade Range volcanoes, across many tectonic settings. The authors concluded that the isotopically light carbon originates from parent magmas that incorporated large amounts of subducted, organic-rich sediments.
The carbon isotope composition of carbon dioxide in two samples from the Lassen Peak hot spot falls within the range of δ13C-CO2 values measured at the CC1 sites and Devils Kitchen (table 3; fig. 4). Given the relatively recent volcanic activity at LVC and the similarity in isotopic composition with other Cascade Range volcanoes, the data indicate that carbon dioxide in these thermal areas is ultimately magmatic in origin.
Lower δ13C-CO2 values at Terminal Geyser and Boiling Springs Lake may result from the addition of non-magmatic carbon dioxide or the effect of surficial processes. At Terminal Geyser, lower δ13C values can be explained by isotopic fractionation related to secondary boiling of CC2 fluids (Friedman and O’Neil, 1977). However, the cause of the shift in carbon isotope values at Boiling Springs Lake is less clear. There are no fumaroles at Boiling Springs Lake, and all samples were collected from steaming ground on the south shore of the lake. The shift could be related to carbon dioxide degassing in the lake or from carbon input from microorganisms residing in the thermal ground, but further study is needed to test these possibilities.
The δ13C values of carbon dioxide collected from the small hot springs and pool outside the main LVC thermal areas are varied and likely result from processes unrelated to the magmatic system. Carbon dioxide from the small thermal springs has relatively low δ13C values between −9.3 and −9.0‰, which may result from isotope fractionation between carbon in the gas phase and dissolved in the spring water (Friedman and O’Neil, 1977; Bergfeld and others, 2017). The reason for the relatively heavy composition of the single sample of gas from the warm pool is unclear and would require additional sampling and analysis to understand the processes affecting the carbon isotope composition.
Helium isotope data provide a key geochemical tracer for understanding subsurface conditions in volcanic settings. These data are important in volcano monitoring as increases in 3He/4He ratios may signal the presence of volatiles related to the injection of new magma (Hilton and others, 2002) Helium isotope analyses of LVC gases have been conducted since the 1970s (Craig and others, 1978; Welhan and others, 1988), though existing records are sparse and often lack essential details such as location coordinates, vent temperatures, and feature descriptions. This report presents the most comprehensive dataset available on helium isotope compositions in the LVC’s thermal areas, establishing a baseline of background variability and defining optimal monitoring locations.
The highest helium isotope values recorded at LVC were from samples collected in 1974, with Rc/RA values of 8.1 and 7.7 at Sulphur Works and Bumpass Hell, respectively (Craig and others, 1978), and 8.05 at Lassen Peak hot spot (Lewicki and others (2024a). The maximum Rc/RA value measured in this study was 7.50 at Sulphur Works in 2007 (table 3; fig. 5). Long-term temporal trends in helium isotopic compositions of LVC gases are difficult to discern due to sparse data between 1974 and 2014. However, the lower Rc/RA values observed in this study relative to 1974 likely indicate dilution of magmatic 3He by ingrowth of radiogenic 4He, in the absence of intrusion of new magma beneath the LVC. Regarding spatial patterns in helium isotopic compositions at Lassen, our results indicate that gas from Sulphur Works, Pilot Pinnacle, Little Hot Springs Valley, and Bumpass Hell has a stronger magmatic signature than those from Devils Kitchen or Boiling Springs Lake (fig. 5). These findings provide additional support for the two-circulation-cell model of Janik and McLaren (2010).
Overview of Circulation Cell 1 Gas and Implications for Monitoring
The chemical compositions of gases collected from the CC1 thermal areas in this study are generally consistent with the findings of Janik and McLaren (2010). Gases from Sulphur Works and Pilot Pinnacle are distinct from other CC1 sites, characterized by relatively high carbon dioxide concentrations, gas-to-steam ratios, and N2/Ar ratios, relatively low hydrogen sulfide concentrations, and minimal dilution from shallow sources (air and air-saturated meteoric water) (table 1; figs. 2 and 3). Samples from Little Hot Springs Valley and Bumpass Hell contain carbon dioxide and hydrogen sulfide concentrations and gas-to-steam ratios similar to previous measurements. However, three Bumpass Hell samples from this study differ notably in helium, nitrogen, and argon contents compared to three other Bumpass Hell samples collected in this study and prior data, suggesting increased mixing with air at these sites (fig. 2).
The current model of the Lassen hydrothermal system suggests that Bumpass Hell and Little Hot Springs Valley are above a hotter part of the CC1 reservoir, where upflow of steam is strongest. Gases from these sites have undergone greater degrees of boiling, as demonstrated by lower gas-to-steam ratios and lower carbon dioxide concentrations (Janik and McLaren, 2010). In contrast, gas emitted from the Sulphur Works and Pilot Pinnacle thermal areas is less boiled and considered to be the most representative of conditions in the underlying volcanic system. Helium isotope data from this study further support this interpretation, as gases from Sulphur Works and Pilot Pinnacle have the highest magmatic helium contributions.
Based on gas geochemical characteristics and overall accessibility, the Sulphur Works and Pilot Pinnacle thermal areas are optimal targets for monitoring the Lassen volcanic system. The data presented here provide a baseline to assess future geochemical changes associated with volcanic unrest, should they occur. Implementation of a data collection strategy aligned as proposed for Level 4 volcanoes by Lewicki and others (2024b) should support long-term monitoring and early detection of unrest at Lassen. Following these guidelines, full geochemical analyses, including carbon and helium isotope data, would be collected at 1- to 2-year intervals from superheated fumaroles when available, or other accessible sites when not. If conditions change such that a period of unrest initiates, the monitoring scheme would be modified to increase areal coverage and shorten the interval between sample collections.
Summary
Designated a very-high-threat volcano by the U.S. Geological Survey, the Lassen Volcanic Center (LVC) hosts a long-lived hydrothermal system indicated by thermal areas to the south and southeast of Lassen Peak. This report presents chemical and isotopic compositions of gas collected from LVC's thermal areas from 2014 to 2019 as part of the California Volcano Observatory geochemical monitoring program, supplemented by earlier U.S. Geological Survey datasets. These results represent the most comprehensive helium isotope record compiled for LVC and are assessed in the context of the two-circulation-cell model of LVC's hydrothermal system, temporal geochemical variations, and implications for monitoring strategies.
Consistent with earlier findings, we observed large compositional differences among the main thermal areas. Sulphur Works and Pilot Pinnacle thermal area gases are characterized by high carbon dioxide concentrations, low hydrogen sulfide concentrations, and high gas-to-steam and nitrogen-to-argon ratios. Notably, gas compositions at Sulphur Works have been stable since the 1980s. Bumpass Hell and Little Hot Springs Valley gases have lower carbon dioxide, and gas-to-steam ratios but higher hydrogen sulfide and methane concentrations. Three samples of Bumpass Hell gas have air-like nitrogen-to-argon ratios, suggesting increased subsurface mixing with air. Devils Kitchen and Boiling Springs Lake gases are moderately similar to Bumpass Hell gas, but gas-to-steam ratios at Boiling Springs Lake are notably lower than gas at Devils Kitchen. Gases discharging at Terminal Geyser are unique, with very high concentrations of hydrogen sulfide, ammonia, methane, and carbon monoxide and very low gas-to-steam ratios.
Carbon isotope values of carbon dioxide at the main thermal areas fall within a narrow range (from −9.7 to −7.7 per mil) and are consistent with incorporation of isotopically light carbon from subducted organic sediments into parent magmas, as observed at other Cascade Range volcanoes.
Helium isotope data further support the two-circulation-cell model, with higher Rc/RA values in circulation cell 1 gases (6.59–7.50) than in circulation cell 2 (5.86–6.52), indicating a stronger magmatic signature. The maximum Rc/RA value in this study is lower than three 1974 samples (7.7–8.1), possibly indicating dilution of magmatic 3He by radiogenic 4He over time.
Gases from the Sulphur Works and Pilot Pinnacle thermal areas have the strongest magmatic signatures and are relatively accessible, making them ideal targets for monitoring the Lassen volcanic system. Regular sampling at these locations can enhance the long-term dataset, may improve detection of geochemical changes in the underlying volcanic system, and could strengthen early warning capabilities for potential volcanic unrest.
References Cited
Bergfeld, D., Lowenstern, J.B., Hunt, A.G., Pat Shanks, W.C., III, and Evans, W.C., 2014, Gas and isotope chemistry of thermal features in Yellowstone National Park, Wyoming (ver. 1.1, September 2014): U.S. Geological Survey Scientific Investigations Report 2011–5012, 26 p., accessed December 15, 2022, at https://pubs.usgs.gov/sir/2011/5012/.
Bergfeld, D., Evans, W.C., Spicer, K.R., Hunt, A.G., and Kelly, P.J., 2017, Evidence for degassing of fresh magma during the 2004–2008 eruption of Mount St. Helens—Subtle signals from the hydrothermal system: Journal of Volcanology and Geothermal Research, v. 343, p. 109–121, accessed June 23, 2021, at https://doi.org/10.1016/j.jvolgeores.2017.06.020.
Bergfeld, D., Evans, W.C., Hunt, A.G., Lopez, T., and Schaefer, J.R., 2020, A post-eruption study of gases and thermal waters at Okmok volcano, Alaska: Journal of Volcanology and Geothermal Research, v. 396, p. 106853, accessed July 21, 2021, at https://doi.org/10.1016/j.jvolgeores.2020.106853.
Clynne, M.A., and Muffler, L.J.P., 2010, Geologic map of Lassen Volcanic National Park and vicinity, California: U.S. Geological Survey Scientific Investigations Map 2899, 95 p., scale 1:50,000, accessed December 15, 2022, at https://pubs.usgs.gov/publication/sim2899.
Clynne, M.A., Janik, C.J., and Muffler, L.J.P., 2003, “Hot Water” in Lassen Volcanic National Park—Fumaroles, Steaming Ground, and Boiling Mudpots: U.S. Geological Survey Fact Sheet 101-02, 4 p., accessed May 15, 2021, at https://pubs.usgs.gov/fs/2002/fs101-02/.
Clynne, M.A., Robinson, J.E., Nathenson, M., and Muffler, L.J.P., 2012, Volcano hazards assessment for the Lassen region, northern California, U.S. Geological Survey Scientific Investigations Report 2012–5176–A, 47 p., accessed April 05, 2023 at https://pubs.usgs.gov/sir/2012/5176/a/sir2012-5176-a_text.pdf.
Clynne, M.A., Christiansen, R.L., Stauffer, P.H., Hendley, J.W., II, and Bleick, H., 2014, A sight “fearfully grand”—Eruptions of Lassen Peak, California, 1914 to 1917: U.S. Geological Survey Fact Sheet 2014–3119, 4 p., accessed March 05, 2023 at https://doi.org/10.3133/fs20143119.
Coplen, T.B., 1973, A double-focusing, double-collecting mass spectrometer for light stable isotope ratio analysis: International Journal of Mass Spectrometry and Ion Physics, v. 11, no. 1, p. 37–40, accessed April 06, 2022, https://www.sciencedirect.com/science/article/abs/pii/0020738173800531, at https://doi.org/10.1016/0020-7381(73)80053-1.
Craig, H., Lupton, J.E., Welhan, J.A., and Poreda, R., 1978, Helium isotope ratios in Yellowstone and Lassen Park volcanic gases: Geophysical Research Letters, v. 5, no. 11, p. 897–900, accessed December 30, 2022, https://agupubs.onlinelibrary.wiley.com/doi/10.1029/GL005i011p00897, at https://doi.org/10.1029/GL005i011p00897.
Day, A.L., and Allen, E.T., 1925, The volcanic activity and hot springs of Lassen Peak, publication no. 360: Carnegie Institute of Washington, 175 p., accessed December 30, 2022, at https://doi.org/10.5962/t.165911.
Evans, W.C., Mariner, R.H., Bergfeld, D., Revesz, K.M., and McGeehin, J.P., 2010, Carbon isotope composition of CO2 at Cascade Arc volcanoes, in Birkle, P., and Torres-Alvarado, I.S., eds., Water-Rock Interaction, 13th International Conference on Water-Rock Interaction, Proceedings: Guanajuato, Mexico, August 16–20, 2010, London, CRC Press, p. 195-198, accessed January 05, 2023, at https://www.usgs.gov/publications/carbon-isotope-composition-co2-cascade-arc-volcanoes.
Ewert, J.W., Guffanti, M.C., and Murray, T.L., 2005, An assessment of volcanic threat and monitoring capabilities in the United States—Framework for a National Volcano Early Warning System: U.S. Geological Survey Open-File Report 2005–1164, 62 p., accessed January 05, 2023, at https://pubs.usgs.gov/of/2005/1164/2005-1164.pdf.
Ewert, J.W., Diefenbach, A.K., and Ramsey, D.W., 2018, 2018 update to the U.S. Geological Survey national volcanic threat assessment: U.S. Geological Survey Scientific Investigations Report 2018–5140, 40 p., accessed January 05, 2025, at https://pubs.usgs.gov/publication/sir20185140.
Friedman, I., and O’Neil, J., 1977, Compilation of stable isotope fractionation factors of geochemical interest, in Fleischer, M.K., ed., Data of Geochemistry (6th ed.): U.S. Geological Survey Professional Paper 440–KK, 11 p., accessed January 05, 2023, at https://doi.org/10.3133/pp440KK.
Giggenbach, W.F., 1975, A simple method for the collection and analysis of volcanic gas samples: Bulletin of Volcanology, v. 39, no. 1, p. 132–145, accessed January 10, 2023, at https://doi.org/10.1007/BF02596953.
Giggenbach, W.F., 1996, Chemical composition of volcanic gases, in Scarpa, R., and Tilling, R.I., eds., Monitoring and mitigation of volcano hazards: Berlin, Germany, Springer Verlag, p. 221–256, accessed in January 05, 2023, at https://doi.org/10.1007/978-3-642-80087-0_7.
Goff, F., and Janik, C.J., 2002, Gas geochemistry of the Valles caldera region, New Mexico and comparisons with gases at Yellowstone, Long Valley and other geothermal systems: Journal of Volcanology and Geothermal Research, v. 116, no. 3-4, p. 299–323, accessed January 05, 2023, at https://doi.org/10.1016/S0377-0273(02)00222-6.
Henry, W., 1803, Experiments on the quantity of gases absorbed by water, at different temperatures, and under different pressures: Philosophical Transactions of the Royal Society of London, v. 93, p. 29–43, accessed April 05, 2023, at https://doi.org/10.1098/rstl.1803.0004.
Hilton, D.R., Fischer, T.P., and Marty, B., 2002, Noble gases and volatile recycling at subduction zones: Reviews in Mineralogy and Geochemistry, v. 47, no. 1, p. 319–370, accessed April 05, 2023, at https://doi.org/10.2138/rmg.2002.47.9.
Janik, C.J., and Bergfeld, D., 2010, Analyses of gas, steam and water samples collected in and around Lassen Volcanic National Park, California, 1975–2002: U.S. Geological Survey Open-File Report 2010–1036, 13 p., accessed April 05, 2023, at https://pubs.usgs.gov/of/2010/1036/of2010-1036_text.pdf.
Janik, C.J., and McLaren, M.K., 2010, Seismicity and fluid geochemistry at Lassen Volcanic National Park, California—Evidence for two circulation cells in the hydrothermal system: Journal of Volcanology and Geothermal Research, v. 189, no. 3–4, p. 257–277, accessed April 15, 2023, at https://doi.org/10.1016/j.jvolgeores.2009.11.014.
Janik, C.J., Nehring, N.L., and Truesdell, A.H., 1983, Stable isotope chemistry of thermal fluids from Lassen Volcanic National Park, California: Geothermal Resources Council Transactions, v. 7, p. 295–300, accessed April 15, 2023, at https://www.semanticscholar.org/paper/STABLE-ISOTOPE-GEOCHEMISTRY-OF-THERMAL-FLUIDS-FROM-Janik-Nehring/81fc596c8234c1e256723c04c37b839f64388f63.
Lewicki, J.L., Bergfeld, D., Peek, S., Evans, W.C., Ingebritsen, S.E., Clor, L., and Hunt, A.G., 2024a, Chemical and isotopic compositions of gases from volcanic and geothermal areas in California: U.S. Geological Survey data release, accessed April 05, 2025, at https://doi.org/10.5066/P9W29CON.
Lewicki, J.L., Kern, C., Kelly, P.J., Nadeau, P.A., Elias, T., and Clor, L.E., 2024b, Volcanic gas monitoring, chap. E of Flinders, A.F., Lowenstern, J.B., Coombs, M.L., and Poland, M.P., eds., Recommended capabilities and instrumentation for volcano monitoring in the United States: U.S. Geological Survey Scientific Investigations Report 2024–5062, 124 p., accessed April 05, 2025, at https://doi.org/10.3133/sir20245062.
Muffler, L.J.P., Nehring, N.L., Truesdell, A.H., Janik, C.J., Clynne, M.A., and Thompson, J.M., 1982, The Lassen geothermal system: U.S. Geological Survey Open-File Report 82–926, 9 p., accessed accessed April 02, 2023, at https://pubs.usgs.gov/publication/ofr82926. [Supersedes Geothermal systems of the Cascade Range, in Proceedings of Pacific Geothermal Conference 1982: Auckland, New Zealand, November 8–12].
Muffler, L.J.P., and Clynne, M.A., 2015, Geologic field-trip guide to Lassen Volcanic National Park and vicinity, California: U.S. Geological Survey Scientific Investigations Report 2015–5067, 67 p., accessed March 03, 2021, at https://doi.org/10.3133/sir20155067.
Rollinson, H.R., 1993, Using stable isotope data, in Rollinson, H.R., ed., Using geochemical data—Evaluation, presentation, interpretation., geochemistry series: New York, Longman Scientific and Technical, Wiley, p. 266–315., accessed May 05, 2022, at https://doi.org/10.4324/9781315845548.
Truesdell, A.H., Mazor, E., and Nehring, N.L., 1983, The origin of thermal fluids at Lassen Volcanic National Park—Evidence from noble and reactive gas abundances: Geothermal Resources Council Transactions 7, Geothermal Resources—Energy on Tap! Geothermal Resources Council 1983 Annual Meeting, Portland, Oregon: Davis, Calif., Geothermal Resources Council, p. 343–348.
U.S. Geological Survey, 2022, USGS Topo Map Vector Data for 7.5 x 7.5 minute FileGDB 10.1 (published 20220510)), accessed May 10, 2022 at URL https://apps.nationalmap.gov/downloader/#/.
U.S. Geological Survey, 2020, 3D Elevation Program 1-Meter Resolution Digital Elevation Model (published 20200606), accessed May 10, 2022 at URL https://apps.nationalmap.gov/downloader/#/.
Waring, G.A., 1915, Springs of California: U.S. Geological Survey Water-Supply Paper 338, 410 p., accessed July 07, 2022, at https://doi.org/10.3133/wsp338.
Welhan, J.A., Poreda, R.J., Rison, W., and Craig, H., 1988, Helium isotopes in geothermal and volcanic gases of the western United States I. Regional variability and magmatic origin: Journal of Volcanology and Geothermal Research, v. 34, no. 3–4, p. 185–199, accessed April 02, 2023, https://www.sciencedirect.com/science/article/abs/pii/0377027388900327, at https://doi.org/10.1016/0377-0273(88)90032-7.
Conversion Factors
Datums
Vertical coordinate information is referenced to the World Geodetic System of 1984 (WGS 84).
Horizontal coordinate information is referenced to the World Geodetic System of 1984 (WGS 84).
Elevation, as used in this report, refers to distance above mean sea level.
Abbreviations
ASMW
air-saturated meteoric water
CC1
circulation cell 1
CC2
circulation cell 2
EE
empty evacuated
LVC
Lassen Volcanic Center
nd
not determined
per mil
parts per thousand (‰)
R/RA
measured 3He/4He isotope ratio normalized to the ratio in air
RC/RA
R/RA value corrected for potential air contamination
USGS
U.S. Geological Survey
VPDB
Vienna Pee Dee Belemnite
Xg
mol fraction of dry gas relative to the mol fraction of dry gas plus steam
For more information about this report, contact:
Director, Volcano Disaster Assistance Program
U.S. Geological Survey, Volcano Hazards Program
1300 SE Cardinal Court
Suite 100
Vancouver, WA 98683
or visit our website at
https://www.usgs.gov/programs/VHP/connect
Publishing support provided by the U.S. Geological Survey, Science Publishing Network, Baltimore Publishing Service Center.
Disclaimers
Any use of trade, firm, or product names is for descriptive purposes only and does not imply endorsement by the U.S. Government.
Although this information product, for the most part, is in the public domain, it also may contain copyrighted materials as noted in the text. Permission to reproduce copyrighted items must be secured from the copyright owner.
Suggested Citation
Bergfeld, D., Lewicki, J.L., Peek, S.E., and Hunt, A.G., 2025, Gas chemistry and isotope data for volcano monitoring at the Lassen Volcanic Center, Lassen Volcanic National Park: U.S. Geological Survey Open-File Report 2025–1056, 23 p., https://doi.org/10.3133/ofr20251056.
ISSN: 2331-1258 (online)
| Publication type | Report |
|---|---|
| Publication Subtype | USGS Numbered Series |
| Title | Gas chemistry and isotope data for volcano monitoring at the Lassen Volcanic Center, Lassen Volcanic National Park |
| Series title | Open-File Report |
| Series number | 2025-1056 |
| DOI | 10.3133/ofr20251056 |
| Publication Date | December 10, 2025 |
| Year Published | 2025 |
| Language | English |
| Publisher | U.S. Geological Survey |
| Publisher location | Reston, VA |
| Contributing office(s) | Volcano Science Center |
| Description | ix, 23 p. |
| Online Only (Y/N) | Y |