

Distribution, Abundance, Breeding Activities, and Habitat Use of the Least Bell's Vireo at Marine Corps Base Camp Pendleton, California—2020–24 Summary Report
Links
- Document: Report (13.4 MB pdf) , HTML , XML
- Download citation as: RIS | Dublin Core
Acknowledgments
This work was funded by the Environmental Security Department, Resources Management Division, Marine Corps Base Camp Pendleton, California. Data either are not available or have limited availability owing to restrictions of the funding entity (U.S. Marine Corps). Contact Ryan Besser; [email protected], for more information. The authors thank the biologists who assisted in data collection for this project: Lisa Allen, Annabelle Bernabe, Scarlett Howell, Walter Paul Kessler, Jessica Medina, Maia Nguyen, and Aaron Spiller. Helpful reviews of this report were provided by U.S. Geological Survey scientists Austin Parker and Chris Tong. Parts of this report were written following a previously developed template to maintain consistent presentation of results.
Executive Summary
The purpose of this report is to provide the Marine Corps with a summary of abundance, breeding activity, demography, and habitat use of endangered Least Bell’s Vireos (Vireo bellii pusillus) at Marine Corps Base Camp Pendleton, California (MCBCP or Base). The report presents results of vireo surveys and monitoring in 2024 and summarizes a subset of data collected from 2020 through 2024. Surveys for the Least Bell's Vireo were completed at MCBCP between April 4 and July 9, 2024. Core survey areas and a subset of non-core areas in drainages containing riparian habitat suitable for vireos were surveyed two to four times. We detected 542 territorial male vireos and 17 transient vireos in core survey areas. An additional 102 territorial male vireos and 2 transients were detected in non-core survey areas. Transient vireos were detected on 5 of the 10 drainages/sites surveyed (core and non-core areas). In core survey areas, 87 percent of vireo territories were on the four most populated drainages, with the Santa Margarita River containing 67 percent of all territories in core areas surveyed on Base. In core areas, 77 percent of male vireos were confirmed as paired; 76 percent of male vireos in non-core areas were confirmed as paired.
The number of documented Least Bell’s Vireo territories in core survey areas on MCBCP decreased 3 percent from 2023. In five core survey area drainages, the number of territories increased by at least two, and in two core survey area drainages, the Santa Margarita River and Las Flores Creek, the number of vireo territories decreased by at least nine between 2023 and 2024. The number of vireo territories at Marine Corps Air Station, Camp Pendleton did not change from 2023 to 2024. The proportion of surveys during which Brown-headed Cowbirds (Molothrus ater) were detected decreased to 0.03 from a peak of 0.45 in 2022. Cowbirds were detected in April and June in 2024.
Most core-area vireos (58 percent, including transients) used mixed willow (Salix spp.) riparian habitat. An additional 9 percent of birds occupied willow habitat co-dominated by Western sycamores (Platanus racemosa). Riparian scrub dominated by mule fat (Baccharis salicifolia), sandbar willow (S. exigua), or blue elderberry (Sambucus mexicana) was used by 33 percent of vireos. Habitat dominated by non-native vegetation was used by 1 percent of vireos.
Since 2020, the number of vireos detected in each of the non-core survey groups was greater than expected, based on the change in vireo numbers in core survey areas. Although, the number of vireo territories on Base decreased from 2020–24, from approximately 1,224 to approximately 960, the trend in vireo territory numbers on Base since 2005 has been positive.
In 2019, MCBCP began operating an artificial seep along the Santa Margarita River; then, in 2021, two additional artificial seeps became operational. The artificial seeps pumped water to the surface during daylight hours starting in mid-April and ending in August each year and were designed to increase the amount of surface water to enhance Southwestern Willow Flycatcher (Empidonax traillii extimus) breeding habitat. Although this enhancement was designed to benefit flycatchers, few flycatchers have inhabited MCBCP, including the seep areas, within the past several years; therefore, vireos were selected as a surrogate species to determine effects of the habitat enhancement. This report presents the fifth year of annual monitoring and analyses summarizing all 5 years of vireo and vegetation response to the artificial seeps.
In 2020, we established four study sites along the Santa Margarita River, two surrounding and extending downstream from existing and proposed seep pumps at the Old Treatment Ponds and along Pump Road and two Reference sites in similar habitat downstream from the Seep sites. Seep pumps began operating at the Old Treatment Ponds in 2020 and along Pump Road in 2021. In 2023, seep pumps at the Pump Road Seep site did not function, and we recategorized that study site as Intermediate. We sampled vegetation at Seep, Intermediate, and Reference sites to determine the effects of surface-water enhancement by seep pumps. In 2024, vegetation cover was highest near the ground and decreased with increasing height. Woody vegetation made up most of the cover at all height categories. We determined that Seep and Intermediate sites differed from each other in addition to differing from Reference sites, which likely is, in part, because seep-pump operation at the Intermediate site was inconsistent compared to the Seep site. Soil saturation in 2024 was high at the Intermediate site and was associated with high native herbaceous cover and low non-native herbaceous cover. Sites differed, with the Intermediate site having more upper canopy cover in general, the Seep site having more low woody cover, and the Reference sites having more mid-canopy non-native vegetation cover.
Soil saturation significantly increased from 2020 through 2024 at the Seep site and was significantly higher at Seep and Intermediate sites than at their paired Reference sites in all years. Soil saturation likely was increased by the supplemental surface water at the Seep site. However, soil saturation at the Intermediate site was not clearly associated with seep pumps but likely affected by soil saturation at the site before seep-pump installation and flooding from high precipitation. Canopy height increased at the Intermediate site from 2020 through 2024 and increased with increasing soil saturation at the Intermediate and Reference sites. The canopy at the Seep site was shorter than at the Intermediate and Reference sites and decreased from 2020 through 2024 because tall trees were damaged and killed by shothole borer beetles (Euwallacea spp.).
We used Redundancy Analysis to discover associations among vegetation types, plant species, and other environmental variables (soil saturation, site, precipitation, and seep operation, defined as the site and year seep pumps were operating). These associations explained less than 15 percent of the variability in the vegetation, with the remaining 85 percent of variation unexplained. Generally, as soil saturation increased, understory vegetation increased and non-native cover decreased in the mid- and upper canopy. Non-native herbaceous plant species decreased in wetter soil.
The Seep site was characterized by more understory and less canopy, contrasting with the Intermediate site, which was characterized by less understory and more higher canopy cover. The addition of surface water via seep pumps or precipitation was associated with more vegetation near the ground. Higher early winter precipitation was associated with taller canopy and more woody vegetation in the upper canopy. We also created a Redundancy Analysis model isolating the components of Southwestern Willow Flycatcher habitat, as identified by Howell and others (2018). In this model, increased soil saturation resulted in increased cover of stinging nettle (Urtica dioica) and black willow (Salix gooddingii) below 3 meters (m), total cover 3–6 m, and black willow above 6 m. Cover of poison hemlock (Conium maculatum) and stinging nettle below 3 m was higher at the Seep site and lower at the Intermediate site.
Vireo territory density among the Seep, Intermediate, and Reference sites was similar before the seep pumps were installed. However, vireo territory density at Seep and Intermediate sites combined was significantly higher than at Reference sites after the seep pumps were installed.
We banded and resighted color banded vireos as part of a long-term evaluation of vireo survival, site fidelity, between-year movement, and the effect of surface-water enhancement on vireo return rate and between-year movement. We banded 164 Least Bell's Vireo nestlings during the 2024 season.
In 2024, we resighted 31 Least Bell's Vireos on Base that had been banded before the 2024 breeding season, and we were able to identify 25 of them. Of the 25 that we could identify, 24 were banded on Base and 1 was originally banded on the San Luis Rey River. Adult birds of known age ranged from 1 to 9 years old.
Base-wide survival of vireos was affected by sex, age, and year. Males had significantly higher annual survival than females (60 percent versus 47 percent, respectively). Adults had higher annual survival than first-year vireos (61 percent versus 11 percent, respectively). The return rate of adult vireos to Seep, Intermediate, or Reference sites was not affected by the original banding site (Seep versus Intermediate versus Reference).
Most returning adult vireos, predominantly males, showed strong between-year site fidelity. Of the adults present in 2023, 92 percent (all males) returned in 2024 to within 100 m of their previous territory. The average between-year movement for returning adult vireos was 0.4±0.03 kilometers (km). The average movement of first-year vireos detected in 2024 that fledged from a known nest on MCBCP in 2023 was 2.4±3.1 km.
We monitored 47 Least Bell's Vireo pairs to evaluate the effects of surface-water enhancement on nest success and breeding productivity. Breeding productivity in 2024 was similar among Seep, Intermediate, and Reference sites (2.8, 3.0, and 3.0 young fledged per pair, respectively), and the percentage of pairs that fledged at least one young was not significantly different among sites (83, 91, and 96 percent, respectively). According to the best model, daily nest survival from 2020–24 was not related to site. Other measures of breeding productivity were also similar among Seep, Intermediate, and Reference site pairs.
Between 2020 and 2024, the number of vireo fledglings produced per pair increased with increasing native herbaceous cover under 3 m and decreasing cover of all herbaceous vegetation under 5 m and was not affected by precipitation, site, or seep operation. The number of vireo fledglings produced per egg was lower at the Seep and Intermediate sites than at the Reference sites and increased with decreasing late winter precipitation, cover of poison hemlock, black mustard, non-native vegetation above 2 m, and all vegetation over 2 m. Vireo pairs at Seep and Intermediate sites were less likely to fledge young than vireo pairs at Reference sites. All vireo pairs were more likely to fledge young with less cover of poison hemlock and more cover of poison oak.
From 2020 through 2024, vireos placed their nests in 24 plant species. The most used plants in all years were willows, mostly red (S. laevigata), or arroyo (S. lasiolepis). The fate of a vireo nest (whether it successfully fledged young or not) was not affected by placement in native or non-native vegetation, by site, or by year, but nests were more likely to be successful if they were placed in woody plants than in herbaceous plants. Successful nests were placed higher in the host plant and farther from the outer edge of the nest clump than unsuccessful nests.
Introduction
The purpose of this report is to provide the Marine Corps with an annual summary of abundance, breeding activity, demography, and habitat use of endangered Least Bell’s Vireos (Vireo bellii pusillus) at Marine Corps Base Camp Pendleton (MCBCP or Base). In 2024, we also provide a 5-year summary and discuss potential trends derived from annual results of surveys from 2020 through 2024. The results are intended to provide the Base with biological information during each year to assist with appropriate management of the federally listed Least Bell’s Vireo and maintain compliant actions supporting military training on MCBCP in accordance with the Base Integrated Natural Resources Management Plan and U.S. Fish and Wildlife Service Programmatic Biological Opinion (U.S. Fish and Wildlife Service, 1995).
The Least Bell’s Vireo (hereafter referred to as “vireo”) is a small, migratory songbird that breeds in southern California and northwestern Baja California, Mexico, from April through July. Historically abundant within lowland riparian ecosystems, vireo populations began declining in the late 1900s because of habitat loss and alteration associated with urbanization and conversion of land adjacent to rivers and agriculture (Franzreb, 1989; U.S. Fish and Wildlife Service, 1998; Riparian Habitat Joint Venture, 2004). Additional factors that contributed to the vireo's decline were (1) the expansion in range of the Brown-headed Cowbird (Molothrus ater), a brood parasite, to include the Pacific coast (U.S. Fish and Wildlife Service, 1986; Franzreb, 1989; Kus, 1998, 1999; Kus and others, 2020) and (2) the introduction of invasive non-native plant species, such as giant reed (Arundo donax), into riparian systems. By 1986, the vireo population in California numbered just 300 territorial males (U.S. Fish and Wildlife Service, 1986).
In response to the dramatic reduction in numbers of vireos in California, the California Fish and Game Commission listed the species as endangered in 1980, and the U.S. Fish and Wildlife Service followed suit in 1986. Since listing, the vireo population in southern California has rebounded, largely in response to cowbird control and habitat restoration and preservation (Kus and Whitfield, 2005). As of 2006, the statewide vireo population was estimated to be approximately 2,500 territories (U.S. Fish and Wildlife Service, 2006), roughly a third of which were on MCBCP.
Male vireos arrive on breeding grounds in southern California in mid-March. Male vireos are conspicuous and frequently sing their diagnostic primary song from exposed perches throughout the breeding season (Kus and others, 2020). Females arrive approximately 1–2 weeks after males and are more secretive. Females often are seen early in the season traveling through the habitat with males. The female, with the male's help, builds an open cup nest in dense vegetation approximately 1 meter (m) above the ground. Clutch size for Least Bell's Vireo averages three to four eggs. Typically, the female and male incubate the eggs for 14 days, and young fledge from the nest at 11–12 days of age. It is not unusual for vireos to renest after a failed attempt, provided ample time remains within the breeding season (Kus and others, 2020). Vireos rarely fledge more than one brood in a season, although double-brooding can be more common during years when breeding conditions are favorable (for example, early nest initiation, high early fledging success; Lynn and Kus, 2009, 2010a). Nesting lasts from early April through July, but adults and juvenile birds remain on the breeding grounds into late September or early October before migrating to their wintering grounds in southern Baja California, Mexico.
Vireo pairs hold territories of approximately 0.5–1.0 hectare (ha) and maintain territory boundaries through vocal interactions with neighboring pairs. Territories remain stable throughout the breeding season, although silent males occasionally venture beyond their territory boundaries. Females sometimes leave their original territory to begin a new breeding attempt with a different male after completing an earlier nesting attempt (either successful or failed). Territory boundaries relax near the end of the breeding season as fledglings explore surrounding habitat. Territory fidelity between years is high for males, with typically 70–90 percent of males returning to within 100 m of their previous breeding territory (Rourke and Kus, 2006, 2007, 2008; Lynn and Kus, 2009, 2010a, 2010b, 2011, 2012, 2013, 2024; Lynn and others, 2014, 2015, 2016, 2017, 2018, 2020, 2024a, 2024b, 2024c).
In 2019, MCBCP began operating an artificial seep along the Santa Margarita River as part of a Conjunctive Use Project. Two additional seeps were installed and activated in early 2021. In 2023, one seep that began operating in 2021 failed to operate for the entire season. The artificial seeps pump water to the surface during daylight hours from approximately mid-April to the end of August each year, although maintenance issues prevented consistent operation on exact dates every year. The artificial seep pumps were designed to increase the amount of surface water present to enhance Southwestern Willow Flycatcher (Empidonax traillii extimus) breeding habitat; however, few flycatchers have inhabited MCBCP, including the seep areas, within the past several years (Howell and Kus, 2015, 2016, 2017, 2024a, 2024b, 2024c, 2025a, 2025b; Howell and others, 2018, 2020). However, vireos are abundant in the enhancement areas and were selected as a surrogate species to determine the effects of the habitat enhancement. Vireos frequently co-occur with flycatchers in riparian habitat and have similar habitat requirements, such as the presence of riparian obligate trees (typically willows [Salix spp.] and cottonwoods [Populus spp.]) with a shrubby understory. Vireos and flycatchers have similar territory size and similar territorial behavior (singing from high perches to advertise territory boundaries), and they share some similarities in nest placement. Both species’ nests are placed in the understory vegetation, although vireo nests are usually placed about 1 m above the ground, whereas flycatcher nest heights range from 1 to 3 m (Howell and Kus, 2024c). Although there are some differences in habitat requirements between these two species (flycatchers prefer more mesic conditions that include surface water or elevated soil moisture during at least part of the breeding season; vireos are more tolerant of drier, brushier vegetation sometimes lacking an overstory), vireos were considered sufficiently similar to flycatchers to serve as a surrogate species to evaluate the response of habitat to surface-water enhancement and the effect of these habitat changes on vireo breeding productivity. This report presents 5-year summary analyses of vireo and vegetation response to the artificial seeps, from 2020 through 2024.
Specific goals of this study were to (1) determine the size and composition of the vireo population on Base; (2) characterize habitat used by vireos; (3) band a subset of vireos to facilitate the estimation of vireo annual survival and movement; (4) document the vegetation structure, plant composition, and soil saturation within the areas affected by artificial seeps (Seep or Intermediate sites) compared to similar areas without artificial seeps (Reference sites); and (5) assess the effects of the artificial seeps on vireos by measuring territory density, annual survival, inter-annual movement, nest success, and breeding productivity of vireos in sites surrounding artificial seeps compared to Reference sites in which no artificial surface water was provided.
Data collected from this study are critical to inform natural resource managers about the status of this endangered species at MCBCP and guide modification of land use and management practices as appropriate to ensure the species’ continued existence. All activities were covered under 10(a)1(A) Recovery Permit #ESPER0004080-0.3. This report includes an annual update to surveys that have been performed since 2005 (Rourke and Kus, 2006, 2007, 2008; Lynn and Kus, 2009, 2010a, 2010b, 2011, 2012, 2013, 2024; and Lynn and others, 2014, 2015, 2016, 2017, 2018, 2020, 2024a, 2024b, 2024c). The study background, objectives, and methods were originally presented in Rourke and Kus (2006), revised in Lynn and others (2024a), and are updated in this report.
Study Areas and Methods
Population Size and Distribution
Most of the MCBCP’s major drainages, and several minor ones supporting riparian habitat (fig. 1), were surveyed for vireos between April 4 and July 9, 2024. Field work was completed by U.S. Geological Survey biologists Lisa Allen, Annabelle Bernabe, Alexandra Houston, Scarlett Howell, Walter Paul Kessler, Suellen Lynn, Jessica Medina, Shannon Mendia, Maia Nguyen, and Aaron Spiller.
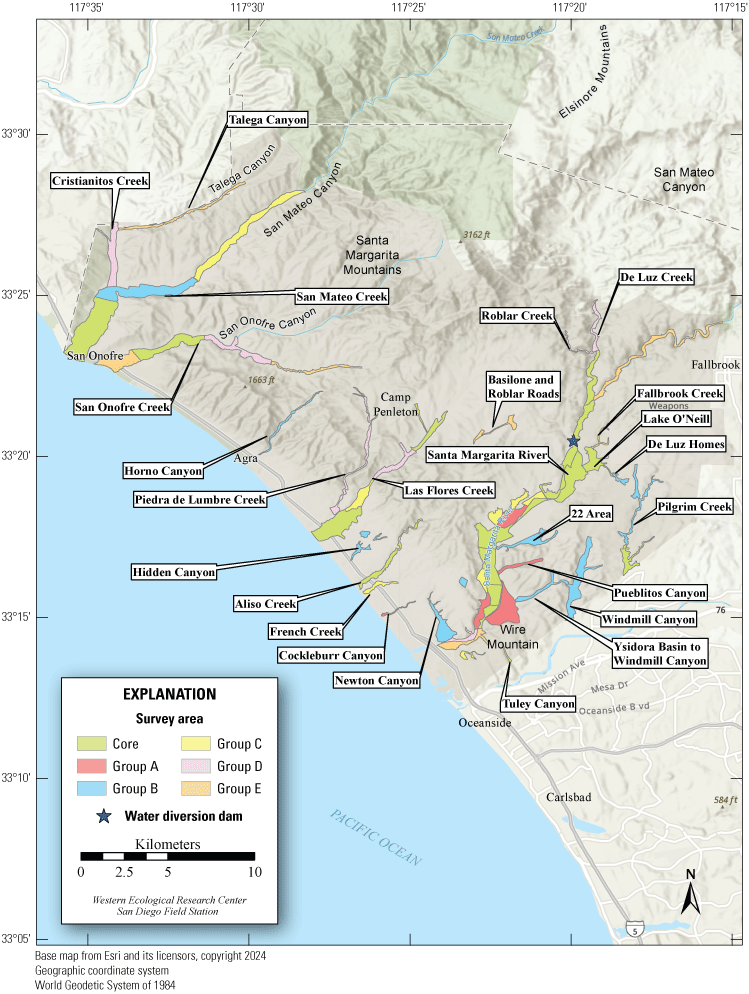
Least Bell's Vireo survey areas at Marine Corps Base Camp Pendleton, California, 2024.
In 2020, we began a new program for surveying for vireos on MCBCP. The new design involved surveying a core area plus a rotating subset of non-core riparian habitat each year rather than surveying the entire Base every year. Selection criteria for surveys within the core area included (1) primary drainages (Santa Margarita River, Las Flores Creek, San Onofre Creek, and San Mateo Creek); (2) historic Southwestern Willow Flycatcher territories; (3) vireo nest monitoring areas from a previous post-fire study (Lynn and others, 2014, 2015, 2016, 2017, 2018, 2020); and (4) the survey unit with the highest average count of flycatchers from 2005 to 2014 in drainages where no historic flycatcher breeding or nest monitoring has occurred (C. Lee, U.S. Marine Corps Base Camp Pendleton, written commun., 2019). Core survey areas were surveyed four times per year, at least 10 days apart every year, with occasional exceptions when range access was denied. Non-core areas were divided into five groups (A–E; fig. 1), each to be surveyed on a rotational schedule once every 5 years. Group E non-core areas were surveyed in 2024. The number of surveys per year in non-core areas varied depending on the amount of suitable habitat, the likelihood of vireo occupation of the area based on previous surveys at MCBCP, and logistical restrictions (for example, denial of range access). All non-core areas were surveyed three times in 2024, except the upper Santa Margarita River, which was surveyed two times, and Stuart Mesa east and lower San Onofre west, each of which was surveyed four times. The specific areas surveyed were as follows:
Core Survey Areas
-
1. De Luz Creek South, between the confluence of the Santa Margarita River and the confluence with Roblar Creek (app. 1, fig. 1.1).
-
2. Santa Margarita River:
-
(a) Air Station East, Effluent Seep, Bell North, and Bell South from Basilone Road to a point approximately 8.5 kilometers (km) downstream on the east side of the Santa Margarita River (app. 1, figs. 1.1, 1.2).
-
(b) Rifle Range, Pump Road (excluding Pump Road monitoring area), from the Rifle Range along Stagecoach Road to a point approximately 2.5 km downstream on the west side of the Santa Margarita River (app. 1, figs. 1.1, 1.2).
-
(c) Above Hospital, Below Hospital East, Below Hospital West, from the confluence with De Luz Creek to Basilone Road (app. 1, fig. 1.1).
-
-
3. Lake O’Neill section of Fallbrook Creek, all riparian habitat surrounding Lake O’Neill (app. 1, fig. 1.1).
-
4. Aliso Creek, between the Pacific Ocean and 0.5 km upstream from the electrical transmission lines (app. 1, fig. 1.2).
-
5. Las Flores Creek (within Las Pulgas Canyon):
-
(a) Lower Las Flores South, between the Pacific Ocean and a point approximately 2 km upstream from Stuart Mesa Road (app. 1, fig. 1.3).
-
(b) Upper Las Flores North, between a point 1.6 km downstream of Basilone Road to the Zulu Impact Area, approximately 0.75 km upstream from Basilone Road (app. 1, fig. 1.3).
-
-
6. San Mateo Creek, Lower San Mateo Bottom, from the Pacific Ocean to a point 3.7 km upstream, including habitat south and east of the abandoned agricultural fields (app. 1, fig. 1.4).
-
7. San Onofre Creek, Lower San Onofre East, from a point 1.5 km upstream from the Pacific Ocean to a point approximately 5 km upstream from the Pacific Ocean (app. 1, figs. 1.3, 1.4).
-
8. Pilgrim Creek, Pilgrim South: between the southern Base boundary and Vandegrift Boulevard, including the two side drainages east of Pilgrim Creek (app. 1, fig. 1.5).
Rotating Non-Core Survey Areas: Group E
-
1. Santa Margarita River:
-
(a) Upper Santa Margarita River, from the confluence with De Luz Creek upstream 1.3 km to the Base boundary with Fallbrook Naval Weapons Station (FNWS), continuing for a 7-km section of shared boundary with FNWS, and continuing upstream 2.3 km to the Base boundary (app. 1, fig. 1.1).
-
(b) Stuart Mesa East, all riparian habitat southeast of the Santa Margarita River from approximately 0.5 km west of Stuart Mesa Road to approximately 1.7 km upstream from Stuart Mesa Road (app. 1, fig. 1.2).
-
-
2. Fallbrook Creek, between Lake O’Neill and the Base boundary with Fallbrook Naval Weapons Station (app. 1, fig. 1.1).
-
3. Basilone and Roblar Roads, two small patches of habitat surrounding the intersection of Basilone and Roblar Roads (app. 1, fig. 1.1).
-
4. San Onofre Creek:
-
5. Talega Canyon, between the confluence with Cristianitos Creek and a point approximately 6.5 km upstream (app. 1, fig. 1.4).
Biologists followed standard survey techniques described in the U.S. Fish and Wildlife Service Least Bell's Vireo survey guidelines (U.S. Fish and Wildlife Service, 2001). Observers moved slowly (1–2 km per hour) through riparian habitat while searching and listening for vireos. Observers walked along the edge(s) of the riparian corridor on the upland or riverside where habitat was narrow enough to detect a bird on the opposite edge. In wider stands, observers traversed the habitat to detect all birds throughout its extent. Surveys typically began at sunrise and were completed by early afternoon, avoiding conditions of high winds and extreme heat that can reduce bird activity and detectability.
All male vireos were detected and confirmed audibly by hearing their diagnostic song. Attempts were made to observe males visually to note banding status, but direct observation was not required to confirm the identity of the species because the song was considered the most diagnostic field characteristic. The presence of a female vireo within a territory was confirmed audibly through the detection of the pair call, a unique call elicited between mated birds, or visually when observed traveling quietly with the male. Alternatively, female presence was inferred by observing a nest, the presence of dependent fledglings, or breeding behavior such as a food carry. For each bird encountered, investigators recorded age (adult or juvenile), sex, breeding status (paired, unpaired, undetermined, or transient), and if the bird was banded. Birds were only considered unpaired if their territories were visited weekly and no female was ever detected (for example, territories in nest monitoring plots). Birds were considered transients if they were detected only once, or if detected more than once, all detections were within a short period of time (maximum of 2 weeks). Vireo locations were mapped using Esri field maps (Esri, 2024) on Samsung Galaxy XCover6 Pro mobile phones that use Android operating systems with a built-in Global Positioning System (GPS) to determine geographic coordinates (World Geodetic System of 1984 [WGS 84]).
Habitat Characteristics
Dominant native and non-native plants were recorded, and percentage cover of non-native vegetation was estimated using cover categories of less than 5, 5–50, 51–95, and greater than 95 percent within the area used by each vireo detected. The overall habitat type within each territory was specified according to the following categories:
-
Mixed willow riparian: Habitat dominated by one or more willow species, including black willow (Salix gooddingii), arroyo willow (S. lasiolepis), and red willow (S. laevigata), with mule fat (Baccharis salicifolia) as a frequent co-dominant.
-
Willow-cottonwood: Willow riparian habitat in which Fremont cottonwood (Populus fremontii) is a co-dominant.
-
Willow-sycamore: Willow riparian habitat in which Western sycamore (Platanus racemosa) is a co-dominant.
-
Sycamore-oak: Woodlands in which sycamore and coast live oak (Quercus agrifolia) occur as co-dominants.
-
Riparian scrub: Dry or sandy habitat dominated by sandbar willow (S. exigua) or mule fat, with few other woody species.
-
Upland scrub: Coastal sage scrub adjacent to riparian habitat.
-
Non-native: Sites vegetated exclusively with non-native species, such as giant reed and salt cedar (Tamarix spp.).
Artificial Seep Study
In April 2019, MCBCP completed construction of a weir system designed to divert water from the Santa Margarita River to Lake O’Neill and several recharging ponds for the Conjunctive Use Project (P. McConnell, Vernadero Group, unpub. data, 2018). The purpose of the Conjunctive Use Project is to provide additional water for MCBCP and the Fallbrook Public Utility District (P. McConnell, Vernadero Group, unpub. data, 2018). In January 2019, MCBCP began operating an artificial seep along the Santa Margarita River to compensate for groundwater withdrawal upstream associated with the weir system (fig. 2; U.S. Fish and Wildlife Service, 2016). Two more artificial seeps were installed in early 2021 for a total of three artificial seeps. We focused on two of the three artificial seeps for this study. One of the pumps installed in 2021 and included in the study design was non-functional for the 2023 field season.
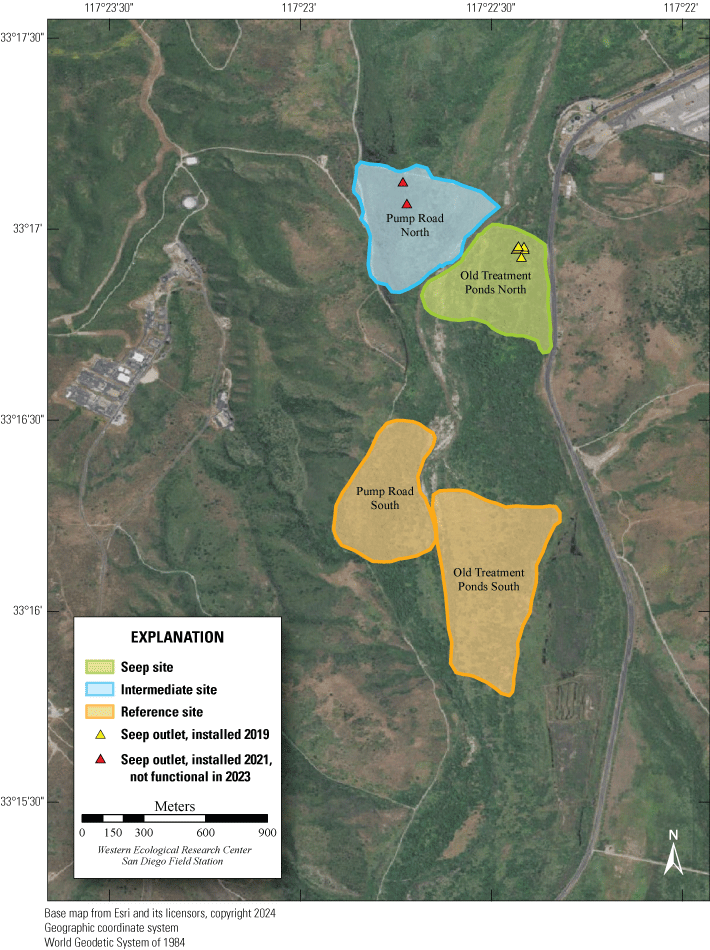
Location of Least Bell’s Vireo Seep, Intermediate, and Reference sites at Marine Corps Base Camp Pendleton, California, 2024.
A low-volume (20–40 liters per minute), shallow groundwater irrigation pumping well was installed at each artificial seep location to draw water to the surface. The pumps were solar-powered and directed water to two outlet pipes at the Pump Road site and six outlet pipes at the Old Treatment Ponds site, arranged within an area of approximately 1,500 square meters (m2). To adjust even distribution of surface water at the Old Treatment Ponds site, two outlet valves were closed for the full operating season in 2020 and 2024, one outlet valve was closed for the full operating season in 2021 and 2022, and one outlet valve was closed for the last month of the operating season in 2023. Water was pumped to the surface when there was sufficient sunlight for solar panels to operate beginning in April and ending in August each year. Shallow pools created by the seep pumps were small (8–44 m2) and limited to the immediate vicinity of the outlet pipes. The purpose of our study was to measure the effects of the artificial seeps on vegetation and vireo breeding, movements, and survival compared to areas where seeps were not operating, beginning in 2020, the first breeding season after the Conjunctive Use Project was implemented. Data collection and analyses were focused on vireo habitat affinities that are shared with Southwestern Willow Flycatchers.
We established two types of study plots: Seep and Reference sites. Later, we added a third category, Intermediate sites, to incorporate unanticipated disruptions to the operation of the seep pumps (fig. 2). Originally, two Seep sites were selected. The Seep sites surrounded and extended downstream from (1) the seep installed in 2019 northwest of the Old Treatment Ponds area and (2) the seep installed in 2021 in the Pump Road area. A Reference site was selected 0.5–0.8 km from each Seep site. Reference sites were on the same side of the Santa Margarita River as their corresponding Seep sites and encompassed similar vegetation as the corresponding Seep site. Because the seep pump at Pump Road was not installed until 2021, and then failed to function in 2023, we redefined that site as Intermediate in 2023. We anticipated that the Seep site, and likely the Intermediate site, would become wetter relative to the Reference sites as the upstream water diversion effects were manifested and surface water was augmented near the seep pumps.
Vegetation Structure and Plant Composition
We sampled vegetation at one Seep site, one Intermediate site, and two Reference sites (fig. 2) to examine the response of riparian habitat to locally augmented surface water. We collected vegetation data at 12 vireo territories at the Seep site, 11 territories at the Intermediate site, and 24 territories at Reference sites, centered on the nest closest to the center of each vireo territory, for a total of 47 vegetation sampling locations (app. 2). Vegetation data were collected using a protocol that combined aspects of flycatcher vegetation sampling in 2001 and 2002 (Rourke and others, 2004) and the stacked cube method developed to characterize canopy architecture in structurally diverse riparian habitat for vireos (Kus, 1998). Each sampling location consisted of a center plot (nest location) and 3 satellite plots (fig. 3), totaling 188 sampling plots. Satellite plots were located 15 m from the center plot at 0, 120, and 240 degrees. We collected a GPS point at the center of each plot.
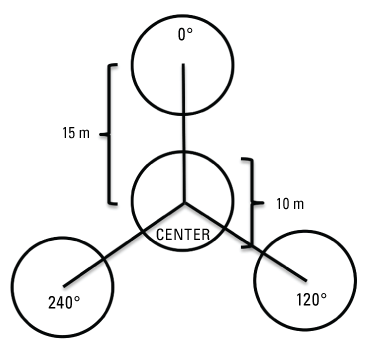
Vegetation sampling plot configuration at Seep, Intermediate, and References sites at Marine Corps Base Camp Pendleton, California, 2020–24. Abbreviation: m, meter.
Vegetation cover within 5 m of the center of the plot was visually estimated at seven height intervals: 0–1, 1–2, 2–3, 3–4, 4–5, 5–6, and greater than 6 m. A 7.5-m-tall fiberglass telescoping pole (Hastings non-conductive fiberglass telescoping measuring rod, model M-25, https://www.hfgp.com, Hastings, Michigan), demarcated in 1-m intervals, was used to determine height class and canopy height. Overall (or total) foliage cover was recorded as the percentage of volume (percent cover) occupied by all foliage in the plot at each height interval, combining all species together. Overall non-native foliage cover was measured as the percent cover of all non-native species (herbaceous and woody) within the plot at each height interval. Overall foliage and non-native cover were estimated using a modified Daubenmire (1959) scale with cover classes: less than 1, 1–10, 11–25, 26–50, 51–75, 76–90, and greater than 90 percent. Cover classes were further refined using “+” and “−“ to indicate if the estimate was in the upper or lower range of the cover class. We described the composition of vegetation at each height by recording the percentage of the overall foliage cover made up by each of the three species (species 1, 2 and 3) contributing the most cover, as well as a fourth category called “All Other” species, with the four cover estimates summing to 100 percent. We also measured canopy height (estimated if above 7.5 m) and recorded soil saturation (percentage of relative saturation) at the center of each plot using a Kelway model HB-2 soil pH and moisture meter (Kel Instruments Co., Inc., https://www.kelinstruments.com/kelway-hb-2, Teaneck, New Jersey).
Vireo Survival, Site Fidelity, and Movements
We began color banding vireos on MCBCP in 1995, and by the end of 2024, more than 1,000 vireos had been color banded. The primary goals of banding vireos were to (1) evaluate adult and first-year annual survival; (2) evaluate vireo site fidelity within a potential source population; (3) investigate natal dispersal on Base and the role vireo young from MCBCP play in potentially supporting vireo populations off Base; and (4) starting in 2020, evaluate how artificial seeps affected vireo site fidelity, dispersal, and annual survival. The regional Least Bell’s Vireo color banding convention designates orange or gold as the color representing MCBCP; therefore, nestlings from monitored nests were banded at 6–7 days of age with a single anodized gold numbered federal band on the left leg. When identification of neighboring territories was in question, adult vireos within Seep, Intermediate, and Reference sites were captured in mist nets and banded with a unique combination of colored plastic and anodized metal bands, including either an anodized gold or orange plastic band or both, depending on the available color combinations (to designate MCBCP as the bird’s site of origin). Returning adults previously banded as nestlings with a single numbered federal band were target netted to determine their identity, and their original band was supplemented with other bands to generate unique color combinations.
Survival Estimates
During surveys and nest monitoring activities, we attempted to resight all vireos to determine if they were banded, and if so, to confirm their identity by reading their unique color-band combination or by recapturing birds with single federal bands. We used resighting and recapture data from core survey areas and nest monitoring areas to calculate annual survival.
Annual survival was calculated for (1) adults Base-wide; (2) first-year vireos that were banded as nestlings or juveniles Base-wide (in other words, first-year survival); (3) adults that were initially detected at Seep, Intermediate, or Reference sites and returned to Seep, Intermediate, or Reference sites; and (4) first-year vireos that were banded as nestlings or juveniles at Seep, Intermediate, or Reference sites and were redetected anywhere that we performed regular surveys. We examined the effects of precipitation, sex, age, and year on annual survival. Precipitation data were collected from Lake O’Neill on MCBCP (Office of Water Resources, 2024) and were grouped into bio-year (July 1 through June 30). Most of the annual precipitation accumulates during the winter months in southern California (fig. 4). Using bio-year to group annual precipitation allows us to examine the effects of the wet season as a whole, rather than breaking up the wet months into separate periods.
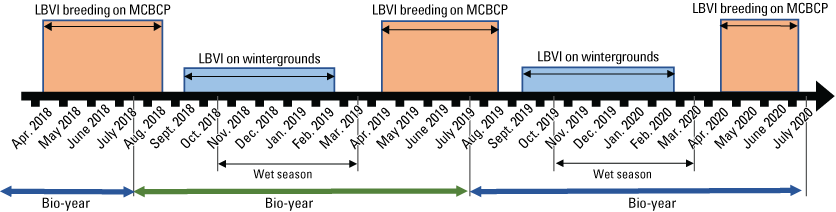
Timeline relating Least Bell’s Vireo (LBVI) life cycle stages, bio-year, and seasonality of annual precipitation (wet season on breeding grounds), represented for April 2018 through July 2020. Abbreviation: MCBCP, Marine Corps Base Camp Pendleton.
Site Fidelity and Movement
Site fidelity and movement of vireos were determined by measuring the distance between the center of a vireo’s breeding or natal territory in 2023 and the center of the same vireo’s breeding territory in 2024. Vireos demonstrated site fidelity if they returned to within 100 m of their 2023 territory (Kus and others, 2020).
Site fidelity and movement were calculated for the same four categories analyzed for annual survival (refer to the “Survival Estimates” section), but we excluded individuals that did not have a known territory location before 2024 (for example, juveniles banded after fledging were excluded because their natal territories could not be confirmed because of their capacity for substantial movement; vireos captured at either of the Monitoring Avian Productivity and Survivorship [MAPS] stations on Base were excluded unless their territory locations were known from surveys).
Nest Success and Breeding Productivity
We monitored vireo nests to evaluate how nest success and productivity were affected by alteration of vireo habitat by the artificial seeps compared to reference sites with no augmented surface water. We monitored vireo nests at one Seep site, one Intermediate site, and two Reference sites to compare measures of nest success and productivity among the groups. Nesting activity was monitored at 12 territories in the Seep site, 11 territories in the Intermediate site, and 24 territories in Reference sites between April 4 and July 31, 2024. Territories were chosen in order of the vireos’ arrival, with priority given to territories occupied by banded vireos or territories that had been monitored in previous years. Vireos were observed for evidence of nesting, and their nests were located. Nests were visited as infrequently as possible to minimize the chances of leading predators or Brown-headed Cowbirds to nest sites; typically, there were three to five visits per nest. The first visit was timed to determine the number of eggs laid, the next few visits to determine hatching and age of young, and the last visit to band nestlings. Fledging was confirmed through detection of young outside the nest, or rarely, the presence of feather dust in the nest. Unsuccessful nests were placed into one of four nest fate categories: (1) “Depredated,” nests that were found empty or destroyed before the estimated fledge date, and the adult vireos were not found tending fledgling(s); (2) “Parasitized,” previously active nests that were subsequently abandoned by adult vireos after one or more Brown-headed Cowbird eggs were laid in the nest or any nests that fledged cowbird young without fledging vireo young; (3) “Other,” nests that failed for reasons such as poor nest construction, the collapse of a host plant that caused a nest’s contents to be dumped onto the ground, the presence of a clutch of infertile eggs, or other causes that were known; and (4) “Unknown,” nests that appeared intact and undisturbed but were abandoned with vireo eggs or nestlings. Characteristics of nests were recorded after abandonment or fledging of young from nests. These characteristics included nest height, host species, host height, the distance nests were placed from the edge of the host plant, and the distance nests were placed from the edge of the vegetation clump in which they were located.
To determine if the artificial seeps affected vireo productivity, we compared vireo breeding productivity among Seep, Intermediate, and Reference sites in 2024 using several metrics. We examined nest success and the proportion of nests that were depredated or parasitized by cowbirds, and the likelihood of renesting after a first nesting attempt (successful or failed), to associate the effects altered habitat may have on the vulnerability of vireo nests to predators and brood parasites. We also examined clutch size (the maximum number of vireo eggs known to be laid in the nest), the proportion of eggs that hatched, the proportion of nestlings that fledged, number of fledglings produced per egg, the proportion of nests that successfully fledged young, the total number of fledglings per pair, and the proportion of pairs that had at least one successful nest. We examined vireo nest placement to explore vireo response to potential differences in vegetation structure among Seep, Intermediate, and Reference sites.
Marine Corps Base Camp Pendleton implements an intensive annual cowbird control program on Base, and parasitism of vireo nests is extremely rare. Nevertheless, when necessary, we followed our standard protocol for manipulating nest contents in the event cowbird eggs or nestlings were detected in vireo nests. In nests with fewer than three vireo eggs, cowbird eggs were removed no sooner than the seventh day of incubation to minimize the possibility of nest abandonment in response to the removal. Cowbird eggs were removed from nests containing three or more vireo eggs as they were found. Cowbird nestlings were removed immediately from nests.
Data Analyses
Population Size and Distribution
Because we began core area surveys plus a rotating non-core survey design in 2020, examination of annual differences in population size have been limited to vireo territories that were within the core survey areas. In this report, we present summaries of vireo territories in non-core survey areas for 2024 (non-core area E) plus a summary of non-core plus core vireo population size from the past 5 years (2020–24). We calculated the expected number of vireo territories within each non-core survey group (A–E) for each year to compare with actual survey results in the year that the non-core survey group was surveyed. The expected number of territories was derived by dividing the number of vireo territories detected in a non-core group for each year from 2005 through 2019 by the number of vireo territories detected in the core survey area during the same year (non-core/core proportion), then calculating the average non-core/core proportion for each non-core group from 2005 through 2019. We multiplied the average proportion of each non-core group by the number of territories in the core survey area for the year of interest and added the actual number of territories in the core group with the expected number of territories in all five of the non-core group for that year to get the expected total population. Results of surveys from each non-core survey area group (A–E) were plotted against the expected survey numbers for the year the non-core group was surveyed and visually examined. Therefore, our calculation of the projected Base-wide vireo population for this report was modified from earlier reports that presented the number of vireo territories in the core areas plus an extrapolation of the average proportion of the total population represented by the non-core territories in years when all areas were surveyed (2005–19).
Vegetation Structure and Plant Composition
At each height category, the estimates of the top three species contributing the most cover and the fourth category representing “All Other” were converted to percent cover values of the sampling plot area (n=188) by dividing the estimate by the overall foliage cover at that height. We then calculated the average percent cover of each plant species, overall cover, cover of non-native plant species, canopy height, and soil saturation across the center and three satellite plots at each sampling location to obtain means for each territory (n=47). For the three top species, we further classified plant species into native herbaceous vegetation, woody vegetation (including both native and non-native species), and all herbaceous vegetation to calculate average percent cover of each of these three groups at each height category and sampling location. We also identified the maximum canopy height among the center and three satellite plots at each sampling location. We used analysis of variance tests (ANOVA) to determine if there were differences among Seep, Intermediate, and Reference sites in (1) average canopy height; (2) maximum canopy height; (3) average soil saturation (log-transformed to fit a normal distribution), and, at each height category; (4) average vegetation volume (percent cover) of all plant species (overall cover); (5) average vegetation volume of woody species; (6) average vegetation volume of all herbaceous species (square-root transformed to fit a normal distribution); (7) average vegetation volume of native herbaceous species (square-root transformed to fit a normal distribution); and (8) average vegetation volume of non-native species (including herbaceous and woody species, square-root transformed to fit a normal distribution). If ANOVA tests indicated differences among sites, we used Tukey’s post-hoc pair-wise tests to determine where differences occurred (Seep versus Intermediate, Intermediate versus Reference, or Seep versus Reference sites). No analyses were made across height categories or among vegetation type categories, so no adjustments were made for multiple comparisons. We used Pearson’s correlation to examine the relationship between soil saturation and the distance of the plot from the seep outlets at the sampling plot scale. We used Spearman’s rank correlation to examine the relationship between soil saturation at all locations and (1) canopy height, (2) percentage of overall foliage cover in the understory (below 3 m), and (3) percentage of herbaceous cover (including non-native herbaceous species) in the understory at the sampling location scale. Although we compared vegetation cover among site types at all height categories, the bulk of the vegetation was below 3 m, which is where vireos and flycatchers typically place their nests. Therefore, our primary focus was evaluation of vegetation cover among sites below 3 m, and then the presentation of differences above 3 m, when significant. Data were analyzed using Program R (R Core Team, 2024). Two-tailed tests were considered significant if P≤0.10. Means are presented with standard deviations.
5-year Summary of Vegetation Structure and Plant Composition
We used Spearman’s rank correlation to determine if soil saturation (log-transformed), canopy height (square-root transformed), and percent cover of vegetation variables at each height category changed at each site type (Seep, Intermediate, and Reference site) during the 5 years of the project. We used paired t-tests to determine if soil saturation and canopy height differed among Seep, Intermediate, and Reference sites across the 5 years of the project. We paired the Old Treatment Ponds Seep site with the Old Treatment Ponds Reference site and the Pump Road Intermediate site with the Pump Road Reference site and used annual averages of soil saturation and canopy height within each site as samples.
Precipitation was variable among years, and we expected it to contribute to soil saturation in addition to the effects of the seep pumps. We considered the ecological effects of early winter accumulation (October through December), late winter accumulation (January through March), and bio-year accumulation (July 1 through June 30), reasoning that precipitation that accumulated at different times of the year would potentially affect soil saturation and other ecological processes in different ways. We used model selection methods to choose which precipitation variable to use as a predictor variable for combined vegetation analyses. First, we generated a null model with no variables affecting the response variable (soil saturation). Then we created models including early winter precipitation, late winter precipitation, the additive effect of early and late winter precipitation, and bio-year precipitation. We selected the precipitation variable(s) that were in the highest ranked models among this model set to include in the subsequent analyses that included other covariates.
We created a set of generalized linear models (GLM) to test the effect of various combinations of predictor variables on soil saturation at the Seep and Intermediate sites. First, we log-transformed soil saturation data to generate values that fit a normal distribution. Then we created 31 linear gaussian models with all possible combinations of (1) distance to the nearest seep outlet (square-root-transformed to fit a normal distribution), (2) the number of years since the seep pumps began operating (time), (3) seep pump operation at a particular site in a particular year, (4) monitoring site, and (5) precipitation. Seep operation was 0 at the Intermediate site in 2020 and 2023 when the seep pumps were not operating and 1 at the Seep site for all years and at the Intermediate site in 2021, 2022, and 2024 when pumps were operating at those sites. We restricted this analysis to Seep and Intermediate sites to isolate the effect of soil saturation in the areas that we predicted would be affected by the seep pumps.
We used an information-theoretic approach (Akaike’s Information Criterion for small sample sizes [AICc]; Burnham and Anderson, 2002) to evaluate support for the models in our GLM model set. We ranked the 31 models from lowest to highest AICc. Models were considered well supported if they were within 2 AICc of the highest-ranked (top) model (difference in AICc [ΔAICc] less than 2). We examined the contributions that covariates made to the well-supported models using the estimates and P-values from the linear model results. We considered a covariate to be a significant contributor to the model if P≤0.10.
We used Redundancy Analysis (RDA) to determine the patterns of variability in vegetation composition and structure across all four sites in all 5 years when constrained by environmental conditions, with the goal of isolating the association of soil saturation with predictor variables. Using function rda in package vegan (Oksanen and others, 2024), in Program R (R Core Team, 2024), we examined the relationship among three groups of variables: (1) vegetation types, summarized into woody, herbaceous, native herbaceous, non-native, and total vegetation cover at each height category; (2) plant species that were identified as one of the three most common species in a plot in at least 20 percent of sampling locations, summarized by height category; and (3) predictor variables (environmental conditions), including soil saturation, site (Old Treatment Ponds Seep site, Old Treatment Ponds Reference site, Pump Road Intermediate site, and Pump Road Reference site), seep operation, and precipitation (early winter and late winter). Our primary goal was to determine if soil saturation significantly affected vegetation types or plant species, with secondary goals to describe the effect of other predictors on the plant community. We did not use logarithmic transformed soil saturation for RDA models because results using non-transformed soil saturation values were virtually identical and easier to interpret. We created two models: (1) vegetation types versus predictors and (2) plant species versus predictors. Before creating models, we tested for collinearity among vegetation types and among plant species. If r>0.85 for any pair of covariates within the same height category, we removed the more general of the pair. For instance, r=0.89 for the correlation between total cover 2–3 m and woody cover 2–3 m; therefore, we removed total cover 2–3 m from the model. If r>0.85 for any pair of covariates for any pair or group within the same vegetation type or plant species, we collapsed them into one height category. For instance, r=0.87 for the correlation between woody cover 0–1 m and woody cover 1–2 m; therefore, we created a new, collapsed variable woody cover 0–2 m which was the average of woody cover 0–1 m and woody cover 1–2 m. In each model, all vegetation types (model 1) or plant species (model 2) at each height category were correlated against all predictor variables. The model was then subjected to stepwise model selection using permutation tests (ordiR2step in package vegan; Oksanen and others, 2024) to remove predictor variables that did not significantly contribute to the variation among vegetation types or plant species. In the resulting, reduced model, the vegetation variables were organized into ranked axes (or eigenvectors). The first axis (RDA1) explained the greatest amount of variation among the vegetation variables when constrained by the predictor variables. The second axis (RDA2) described the greatest amount of variation among the residuals that were not explained by the first axis, and so on. We performed ANOVA on the set of axes and selected the axes (P≤0.10) that were significant and thereby described as much variation as possible in the total set of selected axes. We examined the loading assigned to each vegetation variable in each height category in the selected axis, ranking these loadings from lowest to highest, and identified the extreme loadings (less than −0.35 or greater than +0.35) that had the most effect and, hence, described the axis. Loadings ranged from negative to positive, which indicated the negative or positive association with predictor variables. We then plotted the loadings for the predictors against the selected eigenvectors to visualize positive and negative relationships.
We also used RDA to model the relationship among vegetation variables that were important to flycatchers identified in the Southwestern Willow Flycatcher (SWFL) habitat model built in 2018, based on data collected at MCBCP in 2001, 2002, and 2018 (Howell and others, 2018). The plant species and height categories we used in this model (SWFL model) were poison hemlock (Conium maculatum) 0–3 m, stinging nettle (Urtica dioica) 0–3 m, black willow 0–3 m, total cover 3–6 m, and black willow above 6 m. All other model creation, selection, and visualization methods followed the methods used for RDA models 1 and 2.
Vireo Territory Density at Seep, Intermediate, and Reference Sites
To determine if vireo territory density changed after seep pumps were installed, we counted the total number of vireo territories detected within each monitoring site each year from 2015 to 2024. We chose this time span because it includes the 5 years of monitoring after the first seep pump was installed and an equivalent 5-year period before the first seep was installed. We divided the number of territories by the area (in ha) within the boundaries of each of the four monitoring sites to obtain the territory density within each site. For each year, from 2015 through 2024, we calculated the average territory density within the Reference site boundaries and compared that to the average territory density within the Seep and Intermediate site boundaries (combined because both sites had some surface-water augmentation). We used Student’s t-tests to compare territory density in each site in the 4 years preceding seep-pump installation (2016–19) with the 4 years after seep pumps were installed at both sites (2021–24).
Annual Survival
Base-wide Survival
We analyzed annual survival of banded vireos on MCBCP using the Cormack-Jolly-Seber (CJS) method in Program MARK (White and Burnham, 1999) with the RMark package (Laake, 2013) in Program R (R Core Team, 2024). Imperfect detectability of banded individuals is typical of mark-recapture studies and happens for various reasons (for example, females are more cryptic and may be missed on surveys, birds are detected as banded but their full color combinations [and thus identities] are not obtained; birds with single federal bands are not recaptured and thus their identities not determined). Survival analysis in Program MARK accounts for individuals that were present but not captured (detected) by modeling both survival and detection probabilities. RMark uses program MARK to create models with or without covariates (user-designated) and produces metrics for evaluating the validity of each model or how well the model fits the data relative to the other models. Annual survival models were built for 2005–24 by creating an encounter history matrix of all individual vireos ever detected in MCBCP core survey areas, as well as the Pump Road Monitoring Area, and if they were observed in each year from 2005 to 2024. In the encounter history, a 1 is used if the bird was detected and a 0 if the bird was not detected. We included the Pump Road Monitoring Area because, although it is not a core survey area, we resighted for banded birds there every year during our demographic monitoring activities. Although nest monitoring sites were visited more frequently than core survey areas, we assumed detectability was the same between these two areas because we used broadcasted songs to enhance detectability of vireos. We rarely detected banded birds for the first time after the second survey, indicating that we were able to resight and identify almost all vireos by the end of May, regardless of their location.
Vireos were grouped by sex (female or male) and age: “first-year” (birds that were first detected and banded as nestlings or juveniles) and “adult” (birds that were first detected and banded as adults and any first-year bird that survived to adulthood). Survival was assumed to be constant for adults once they survived their first year. We created two sets of models. In the first set, which included only survival of adults past their first year (n=760), we instructed MARK to use the encounter history containing all birds but excluding the first year interval for any bird first encountered as a juvenile (in other words, we removed the first year to adult time interval). For this adults-only model set, we modeled the effects of sex, year, and precipitation during the bio-year preceding the survival year. For example, precipitation data from July 1, 2004, to June 30, 2005, were used for the 2005–06 survival year (Office of Water Resources, 2024). We allowed detection probability to vary by sex and year. Detection probability accounted for sex because of sex-related behaviors (males are more conspicuous than females) and year because of annual differences in observers, number of surveys, and survey conditions (for example, surveys started late in 2011). When allowing detection probability to vary by year, any model that also includes year as a survival parameter cannot separate the estimate of survival from detection probability for the last time interval (2023–24; Cooch and White, 2022). Therefore, to provide a conservative estimate of survival for the last time interval, we fixed the detection probability to 1 for 2023–24. The survival estimate for this time interval will likely increase in the future with subsequent opportunities to recapture and resight birds. We created six adults-only models: (1) the constant model (no covariates, describing survival when none of our covariates was allowed to account for variability); (2) sex (describing the effect of sex on survival); (3) precipitation (describing the effect of precipitation on survival); (4) year (describing annual differences in survival); (5) sex plus precipitation (describing the additive effects of sex and precipitation); and (6) sex plus year (describing the additive effects of sex and year).
The second set of models included adults and first-year birds (n=2,995) and examined the effect of age, year, and bio-year precipitation on annual survival. We allowed detection probability to vary by year to account for annual differences as described in the first set of models. This model set did not include a sex covariate because we were unable to determine sex of vireos banded as nestlings unless they returned and were recaptured and identified as adults. Therefore, only the nestlings that survived their first winter could be classified retroactively as male or female, which severely biases the estimate of sex-related survival of first-year vireos. As with the adults-only models, we fixed detection probability to 1 for 2023–24. We created six age-related models: (1) the constant model (no covariates, describing survival when none of our covariates was allowed to account for variability); (2) age (describing the difference between first-year and adult survival); (3) precipitation (describing the effect of precipitation on survival); (4) year (describing annual differences in survival); (5) age plus precipitation (describing the additive effects of age group and precipitation); and (6) age plus year (describing the additive effects of age group and year). Survival estimates were derived from the top model. Models created for survival in RMark only included detections from sites at which survey effort has been consistent from 2005 to 2024 (including MCBCP core survey areas and artificial seep study nest monitoring areas). Incidental resights outside of these survey sites were excluded from analysis. Additionally, we did not include detections from MAPS captures because MAPS effort was considered different from survey effort. We excluded adults with unknown sex from our first model set analysis because we were not interested in defining characteristics of this group.
Vireo Survival and Return Rates Associated with Seeps
We used CJS in RMark (White and Burnham, 1999; Laake, 2013) to model the return rate of banded adult vireos to Seep, Intermediate, and Reference sites between 2020 and 2024 (n=58). For the adults-only set of models, we were most interested in potential differences in return rates to Seep, Intermediate, and Reference sites rather than annual survival, so we excluded all detections outside of Seep, Intermediate, and Reference sites. We grouped adult vireos by sex and site type (if they were originally detected at a Seep site, an Intermediate site, or a Reference site) and created a set of models similar to the Base-wide analysis for adults. We held detectability constant because all monitored birds at these sites were identified each year, and there were no sex-related or year-related differences in detectability.
We used CJS in RMark (White and Burnham, 1999; Laake, 2013) to model first-year survival for vireos that had been banded as nestlings at Seep, Intermediate, or Reference sites from 2020 to 2024 (n=651). For first-year vireos, we were interested in survival within and beyond monitoring sites, so calculations included all nestlings from successful nests that were banded in 2020–23 and were re-detected anywhere in monitoring areas and core survey areas on MCBCP from 2021 to 2024 (refer to the “Base-wide Survival” section). After removing all vireos that were banded as adults, we grouped vireos by site type. We created a set of four models including the constant model, site type, year, and site type plus year. We allowed detection probability to vary by year to account for annual differences in survey effort, as described in the Base-wide models.
Model Evaluation
We used AICc (Burnham and Anderson, 2002) to evaluate support for models regarding the effects of sex, age, year, precipitation, and original location at a Seep, Intermediate, or Reference site (site type) on vireo survival and return rates. For the adults-only model sets, we hypothesized that females would have a lower survival and return rate than males and that the return rate would be highest for birds that originated at the Seep site, followed by the Intermediate site, and finally, the Reference sites; although, this difference might not be apparent within the first few years after seep installation. We used logistic regression with a logit link to build and rank the constant model plus five models with combinations of sex, year, and bio-year precipitation (for Base-wide, adults-only survival) and the constant model plus eight models with combinations of sex, year, and site type (for site type, adults-only return rate) by AICc, where the model with the lowest AICc in each model set was the highest ranked model. Models were considered well supported if they were within 2 AICc of the highest-ranked (top) model (difference in AICc [ΔAICc] less than 2). We examined the contributions that covariates made to the well-supported models by calculating the odds ratio for each covariate in the model (the odds that the covariate affected survival such that no effect equaled 1, negative effect was less than 1, positive effect was greater than 1) and then examining the 95-percent and 85-percent confidence intervals of the odds ratio. For example, if the 95-percent confidence interval of the odds ratio was greater than 1 and did not include 1, we had 95-percent confidence that the covariate had a positive effect on survival relative to the reference; therefore, we considered that the covariate significantly contributed to the model. The 85-percent confidence interval is presented to examine covariates that might not have been significant at the traditional p<0.05 level, but their contribution to the model affected the value of AICc (improving the models’ rank; Sutherland and others, 2023). We used the top model to obtain estimates of annual survival for adult females and adult males for Base-wide survival.
For the model sets that included first-year vireos, we hypothesized that first-year survival would be lower than adult survival, and that survival would be highest for first-year vireos that originated at the Seep site, followed by the Intermediate site, and lowest for vireos that hatched from nests at the Reference sites. We used logistic regression with a logit link to build and rank the constant model plus five models with combinations of age, year, and bio-year precipitation (for Base-wide survival) and four models with combinations of year and site type (for site type survival). Then, we ranked these models from lowest to highest AICc. We used the top model to obtain estimates of survival for adults and first-year birds.
Nest Success and Breeding Productivity
We used chi-square or Fisher’s exact tests to determine if there were differences among Seep, Intermediate, and Reference sites in (1) the likelihood of vireos renesting after a first nesting attempt, (2) the likelihood of renesting if the first nesting attempt failed or was successful, (3) the proportion of nests that successfully fledged young, (4) the proportion of nests that were depredated, (5) the proportion of first nesting attempts that were successful, (6) the proportion of eggs that hatched, (7) the proportion of nestlings that fledged, (8) the proportion of eggs that produced fledglings, (9) the proportion of nests that produced fledglings, and (10) the number of pairs that had at least one successful nest in 2024. Chi-square tests were used when sample sizes were sufficient; Fisher’s exact tests were used when one or more categories contained fewer than five samples. We used Poisson regression to determine if there were differences among Seep, Intermediate, and Reference sites in (1) the number of nesting attempts per pair, (2) clutch size, and (3) number of fledglings per pair in 2024. For nest success and breeding productivity analyses, bio-year precipitation was calculated from July 1 of the year before breeding through June 30 of the breeding season year (for example, precipitation from July 1, 2023, to June 30, 2024, was related to breeding parameters in 2024). If nests were parasitized by Brown-headed Cowbirds, rescued by removing the cowbird egg(s) or nestling(s), and subsequently fledged vireo young, all success and productivity calculations were rerun treating successful rescued nests as failed nests to estimate the potential effect(s) of cowbird parasitism on the MCBCP vireo population.
Data were analyzed using Program R (R Core Team, 2024). Two-tailed tests were considered significant if P≤0.10. Means are presented with standard deviations. All data from the MCBCP from 2005 to 2023 used in comparisons with data collected for this report can be found in Rourke and Kus (2006, 2007, 2008), Lynn and Kus (2009, 2010a, 2010b, 2011, 2012, 2013, 2024), and Lynn and others (2014, 2015, 2016, 2017, 2018, 2020, 2024a, 2024b, 2024c). Data from before 2005 were extracted from unpublished reports by Griffith Wildlife Biology (J.C. Griffith and J.T. Griffith, Griffith Wildlife Biology, unpub. data, 2004).
5-year Summary of Vireo Nest Success and Breeding Productivity
We used principal components analysis (PCA) to determine patterns of variability in vegetation composition and structure across all four monitoring sites in all 5 years. Using function principal with varimax rotation in the psych package (Revelle, 2024) in Program R (R Core Team, 2024), we generated five principal components for each of the two different sets of vegetation data used for RDA. The first set of data included in the PCA were canopy height, average total cover, woody cover, herbaceous cover, native herbaceous cover, and non-native cover at each height category and at each nest location in each year. The second set of data were the cover of plant species that were recorded as one the three most common in at least 20 percent of sampling locations. We then examined patterns among vegetation types and plant species that loaded similarly on PCA axes (app. 3). We combined height categories (average cover among combined heights) that consistently loaded together on PCA axes across years as follows: (1) total cover 0–2 m, (2) total cover 2–6 m, (3) all herbaceous cover 0–5 m, (4) native herbaceous cover 0–3 m, (5) non-native cover 0–2 m, and (6) non-native cover 2–6 m. We excluded woody cover from this analysis because it was tightly correlated with total cover at all height categories. We also combined all height categories up to 6 m for each plant species to create a single variable per species with the average cover among its height categories after observing that plant species consistently loaded together on the same PCA axes across years. We used stepwise AICc (stepAIC function in the MASS package; Venables and Ripley, 2002) to evaluate the significance of all combined vegetation type and plant species variables, canopy height, site, early winter precipitation, late winter precipitation, and seep operation as predictors of vireo breeding productivity (number of fledglings produced per pair, number of fledglings produced per egg, and proportion of pairs that successfully produced fledglings). We included precipitation, site, and seep operation as fixed effects in the models to account for variation caused by sources other than the vegetation variables.
Daily Nest Survival
We used mark-recapture analysis to calculate daily survival rate (DSR) of vireo nests, which accounts for the variability in exposure days across nests discovered at different stages of the nesting cycle and allows for the analysis of the effects of covariates on DSR (Dinsmore and others, 2002). We used RMark (Laake, 2013) in Program R (R Core Team, 2024), which calls program MARK (White and Burnham, 1999) to model the effects of the seeps on DSR. Nest survival was calculated across a 32-day cycle length: 2 days for the last day of nest construction and a day of rest before the first egg was laid, 4 days for egg-laying, 14 days for incubation, and 12 days for the nestling period. Age of nests at the time they were discovered was calculated in days by forward- or backward-dating of nests in relation to known dates of nest-building, egg-laying, or hatching. Data compiled for each nest included (1) the Julian dates for when the nest was first found, last active, and last checked; (2) the nest fate (successful or unsuccessful); (3) the age of the nest (in days) when it was initiated, relative to the first nest found that year; (4) site type, which is the location of the nest in a Seep, Intermediate, or Reference site; (5) the number of years since the seep project began (0–4), representing the cumulative effect of multiple years of seep operation; (6) seep operation, which was 1 for years seep pumps were operational at the location and 0 for years there were no seep pumps operating at the location; and (7) bio-year precipitation. We used AICc (refer to the “Annual Survival” section) to evaluate support for nest survival models reflecting a priori hypotheses regarding the effect of seeps on DSR. We hypothesized that DSR would be highest in the Seep site, followed by the Intermediate site, and then the Reference sites; we further hypothesized that the difference in DSR among site types would increase as the soil and habitat at the Seep and Intermediate sites became wetter relative to the Reference sites. In other words, we predicted that DSR would increase with passing years at the Seep and Intermediate sites, but this increase would be greater at the Seep site, which had seep pumps operating all 5 years relative to the Intermediate site, which had seep pumps operating only 3 of the 5 years. We expected bio-year precipitation to have an annual effect on soil saturation in addition to the seep pumps. We used logistic regression with a logit link to build models. First, we generated a constant model to serve as a reference for the effect of site type and seep operation on DSR. We then created models that added combinations of site type, time, seep operation, and bio-year precipitation and evaluated support for the models in relation to the constant survival model. We included bio-year precipitation in all models except the constant model to account for its additive effect on other covariates. We examined the well-supported models further by calculating the odds ratio for each covariate in the model (refer to the “Annual Survival” section). The odds ratio represents the odds that the covariate affected DSR such that no effect equaled 1, a negative effect was less than 1, and a positive effect was greater than 1. If the 95-percent confidence interval of the odds ratio did not include 1, we determined that the covariate significantly contributed to the model.
Nest Characteristics
We summarized the total number of nests that were placed in each host plant species by site type (Seep versus Intermediate versus Reference). For 2024 data, we used ANOVA to determine if there were differences in (1) nest height, (2) host plant height, (3) distance to the outer edge of the host plant, and (4) distance to the outer edge of the vegetation clump in which the nest was located among Seep, Intermediate, and Reference sites. We used Student’s t-tests to determine if there were differences in nest placement characteristics between successful and failed nests within Seep, Intermediate, and Reference sites.
We used stepwise AICc model evaluation with logistic regression to determine if the fate of a vireo nest (successful or unsuccessful) was predicted by whether nest host species was native or non-native, whether the host species was woody or herbaceous, nest placement characteristics (1–4 listed in the previous paragraph), site type, and year. We calculated the square root of the distances to the edge of the host plant and the vegetation clump to meet assumptions of normal distribution.
Results
Population Size and Distribution
Core Survey Areas
We detected 559 male vireos in core survey areas during Base-wide surveys (fig. 5; app. 4). Of these vireos, 542 were territorial males (77 percent of which were confirmed as paired) and 17 were transients (table 1). This total represents a 3-percent decrease in territorial males (19/561) from the same areas surveyed in 2023 (app. 5, table 5.1). Transient vireos were observed on four of the eight drainages and sites surveyed (50 percent; table 1). Most vireo territories (87 percent) were on the four most populated drainages/sites (Santa Margarita River, Las Flores Creek, San Mateo Creek, and Aliso Creek), and 67 percent were along the Santa Margarita River, which is the largest expanse of riparian vegetation on Base (tables 1, 5.1; fig. 6). The remaining 4 drainages and sites each contained fewer than 20 territories.
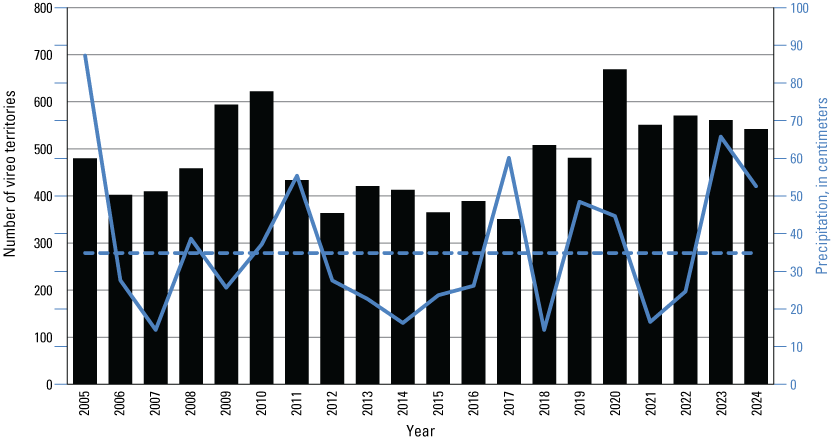
Number of Least Bell’s Vireo territories in core survey areas (black bars) and bio-year precipitation (July 1–June 30, ending in the survey year; solid blue line; Office of Water Resources, 2024) at Marine Corps Base Camp Pendleton, California, 2005–24. Dashed blue line is average bio-year precipitation from 1950 to 2000 at Lake O’Neill.
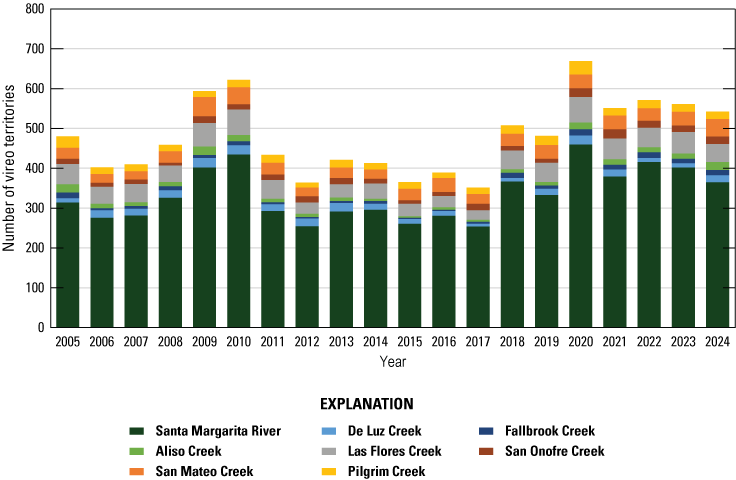
Number of Least Bell’s Vireo territories found in each drainage in core areas on Marine Corps Base Camp Pendleton, California, by year, 2005–24.
Table 1.
Number and distribution of Least Bell’s Vireos in core survey areas at Marine Corps Base Camp Pendleton, California, 2024.[Las Flores Creek was divided into specific sections for reporting in this table as requested by Marine Corps Base Camp Pendleton. Abbreviations: Blvd., boulevard; ha, hectare; Rd., road]
The distribution of vireo territories documented on Base in 2024 was generally similar to 2023 across most core survey areas, with the exception of the Santa Margarita River and Las Flores Creek, which lost 9 and 17 percent of their vireo territories, respectively (fig. 6; app. 5, table 5.1). From 2023 to 2024, the percentage of all vireo territories on Base that were found in the Santa Margarita River decreased by more than 4 percent (fig. 6). The percentage of all vireo territories on Base that were found on Las Flores Creek also decreased (by 1.3 percent). The percentage of vireo territories changed by 1 percent or less in three drainages (Fallbrook Creek, San Onofre Creek, and Pilgrim Creek) and increased by 1–2 percent in three drainages (De Luz Creek, Aliso Creek, and San Mateo Creek). The number of vireo territories increased in five drainages and decreased in three drainages. The Santa Margarita River continued to support the most vireo territories, although it lost 37 territories (app. 5, table 5.1). Las Flores Creek, the second most populated drainage, lost nine territories. The number of territories in San Mateo Creek, De Luz Creek, Aliso Creek, Fallbrook Creek, and San Onofre Creek increased by 12–64 percent (10, 7, 7, 2, and 2 territories, respectively). The number of territories decreased in Pilgrim Creek by 5 percent (one territory).
In 2024, the proportion of surveys in which Brown-headed Cowbirds were detected dropped to 0.03 from a peak of 0.45 in 2022 (table 2). The second highest proportion of surveys where cowbirds were detected was in 2010 (0.37), followed by 2005 (0.23). In 2024, cowbirds were detected only on the Santa Margarita River in April and June.
Table 2.
Proportion of all surveys during which Brown-headed Cowbirds were detected in core survey areas at Marine Corps Base Camp Pendleton, California, by drainage, 2005–24.[Number of survey areas in parentheses=the number of distinct survey units that were surveyed multiple times per year within the drainage. Abbreviation: —, no data]
Non-Core Survey Areas
A total of 104 male vireos, including 102 territorial males and 2 transients, were detected in non-core survey areas in 2024 (table 3). Most of the territorial males (76 percent) were confirmed as paired.
Table 3.
Number and distribution of Least Bell's Vireos in non-core survey areas at Marine Corps Base Camp Pendleton, California, 2024.[ha, hectare]
Habitat Characteristics
Core Survey Areas
Vireos used several habitat types, which ranged from willow-dominated thickets along stream courses to areas of non-native vegetation (table 4). Most vireo locations in core survey areas were in habitat characterized as mixed willow riparian, with 58 percent of males in the study area found in this habitat. An additional 9 percent of birds occupied willow habitat co-dominated by sycamores. Riparian scrub, dominated by mule fat, sandbar willow, or blue elderberry (Sambucus mexicana), was prevalent at 33 percent of vireo territories. One percent of vireos were found in non-native vegetation.
Table 4.
Habitat types used by Least Bell’s Vireos in core survey areas at Marine Corps Base Camp Pendleton, California, 2024.[Habitat types are included for resident and transient Least Bell’s Vireo locations. Abbreviation: >, greater than]
The proportion of vireos documented in non-native vegetation in core survey areas increased slightly from 2023 to 2024 (table 5; app. 6); 10 percent (55/559) of vireos in 2024 were in areas where non-native species comprised at least 50 percent of the habitat. Of territories dominated by non-native vegetation, 43 percent contained predominantly poison hemlock, 10 percent contained predominantly black mustard (Brassica nigra), and 1 percent contained predominantly bladderflower (Araujia sericifera). Six of the eight drainages in 2024 contained territories dominated by non-native vegetation. Two of these drainages (the Santa Margarita River and Las Flores Creek) also contained territories dominated by non-native vegetation every year since 2015. Overall, 2005 remained the year with the highest proportion of territories dominated or co-dominated by non-native vegetation.
Table 5.
Proportion of Least Bell’s Vireo territories, including areas occupied by transients, dominated or co-dominated by non-native vegetation, by drainage, 2005–24.[Proportions are calculated within each drainage. Numbers in parentheses are the number of territories in the drainage]
Non-Core Survey Areas
Most vireo locations in non-core survey areas were in habitat characterized as mixed willow riparian, with 42 percent of males in the study area found in this habitat (table 6). An additional 37 percent of vireos in non-core survey areas occupied willow habitat co-dominated by sycamores or cottonwoods. Habitat characterized by a mix of oak and sycamore was predominant in 11 percent of vireo locations, and 10 percent of vireos were found in riparian scrub. One percent of vireos occupied drier habitat characterized by upland scrub.
Population Size and Distribution 5-Year Summary
Each of the non-core survey groups was surveyed once between 2020 and 2024 (fig. 7). The expected number of vireo territories, based on the average proportion of the non-core/core surveys from 2005 through 2019, was lower than the actual number of territories detected for every non-core survey group (fig. 8). The number of vireo territories detected in non-core survey groups A, B, and C was greater than expected by at least 1 standard deviation and therefore, the actual Base-wide population was likely greater than the estimated population for 2020, 2021, and 2023. Although the number of vireo territories on Base declined from approximately 1,224 to approximately 960 in the past 5 years, the trend in vireo territory numbers on Base since 2005 has been positive.
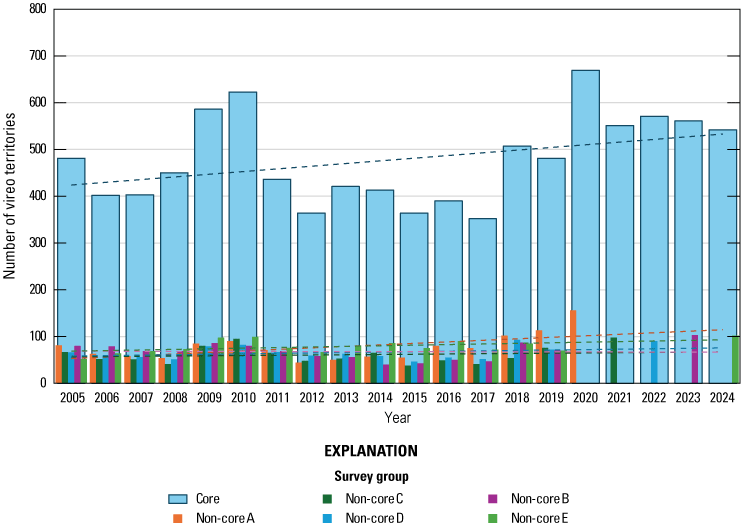
Number of Least Bell’s Vireo territories detected by survey group, on Marine Corps Base Camp Pendleton, California, by year, 2005–24. Colored dashed lines show 20-year trends for each survey group. Non-core groups were not surveyed in alphabetical order.
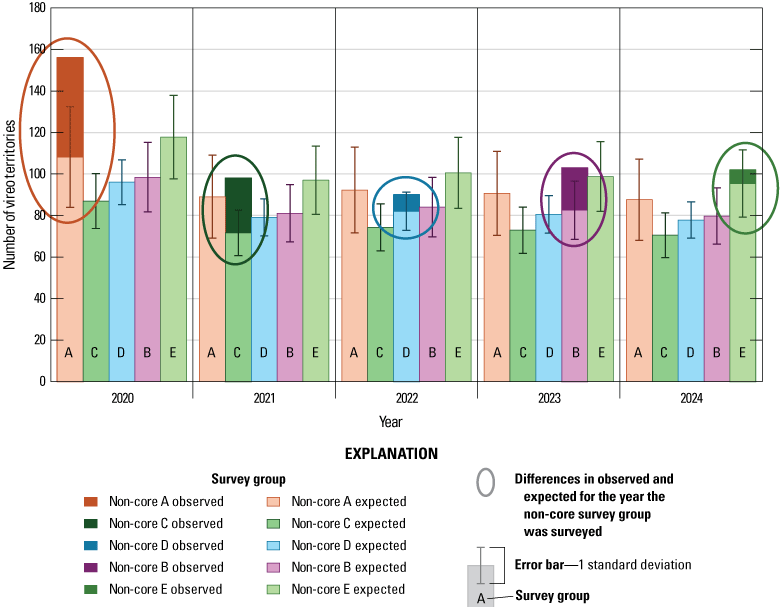
Number of Least Bell’s Vireo territories observed and expected by survey group, on Marine Corps Base Camp Pendleton, California, by year, 2020–24. Error bars are 1 standard deviation. Colored ovals highlight differences in observed and expected for the year the non-core survey group was surveyed. Non-core groups were not surveyed in alphabetical order.
Vireo habitat in core survey areas has remained similar during the past 5 years, from 2020 through 2024. Every year, most of the vireo territories were in mixed willow riparian vegetation (53–70 percent of vireo territories, table 7), with an additional 4–9 percent of territories in willow vegetation mixed with sycamore or cottonwood. Riparian scrub was the second most prevalent vegetation type where vireos were found (18–37 percent of vireo territories). Other vegetation types were used in 1–9 percent of vireo territories. In 2020, 17 percent of all core vireo territories contained more than 50-percent non-native plant species (table 5). The percentage of core area vireo territories containing more than 50-percent non-native plant species dropped to 10 in 2021 and remained steady between 9 and 11 percent through 2024.
Table 7.
Habitat types used by Least Bell’s Vireos in core survey areas at Marine Corps Base Camp Pendleton, California, 2020–24.[Numbers in parentheses are the proportion of all core territories that contained that habitat type in that year. Habitat types are included for resident and transient Least Bell’s Vireo locations. Abbreviations: <, less than; —, none]
Vegetation at Artificial Seep, Intermediate, and Reference Sites
We identified 42 common plant species at nest site vegetation plots throughout all sites. The most common plant species was red or arroyo willow, which was one of the top 3 species at 40 of the 47 sampling locations (85 percent). Other common woody plant species were mule fat (30 locations; 64 percent), black willow (30 locations, 64 percent), and poison oak (Toxicodendron diversilobum; 20 locations, 43 percent). The second most common plant species, and the most common herbaceous species, was stinging nettle (36 locations, 77 percent), followed by poison hemlock (34 locations; 72 percent), and black mustard (16 locations; 34 percent). We determined that 13 plant species were common at 20 percent of locations or more. Of these 13 plant species, 3 were non-native: poison hemlock, black mustard, and perennial pepperweed (Lepidium latifolium).
Overall vegetation cover in 2024 was highest near the ground and decreased with increasing height (fig. 9). Woody vegetation made up most of the cover at all height categories, with cover ranging from 46 percent below 1 m to 7 percent above 6 m. Herbaceous cover (total and native) was concentrated near the ground with very little (less than 3 percent) above 3 m. Non-native vegetation was present at all height categories, tapering from 24 percent below 1 m to 2 percent or less above 3 m.
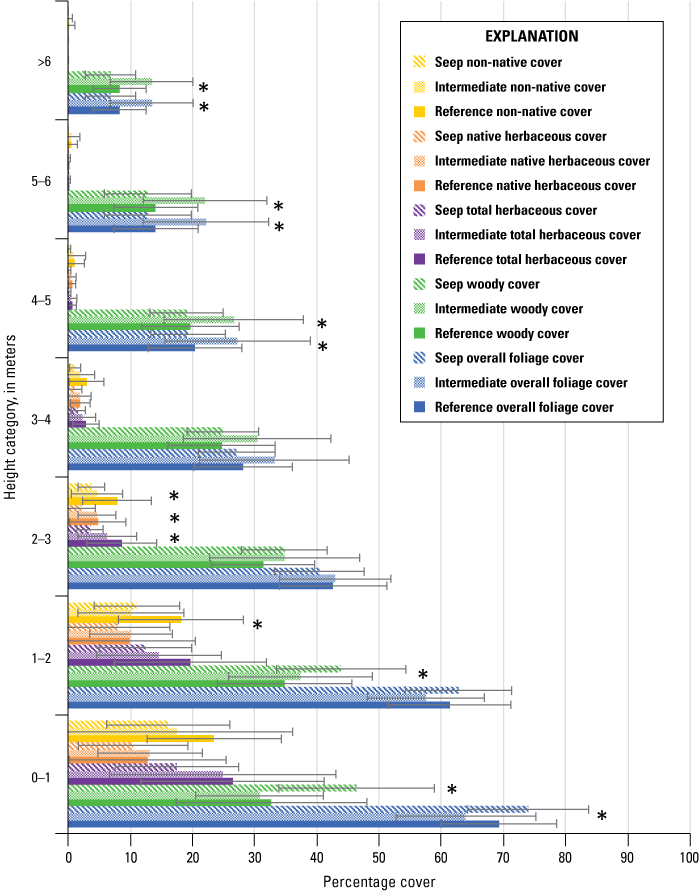
Average total percentage cover at Least Bell’s Vireo nests sites by height class and plant type at Seep, Intermediate, and Reference sites, Santa Margarita River, Marine Corps Base Camp Pendleton, California, 2024. Error bars represent 1 standard deviation. Asterisk (*) indicates a significant difference among sites (analysis of variance, P≤0.10). No analyses were made across height categories or among vegetation type categories; therefore, no adjustments were made for multiple comparisons. Results of Tukey’s post-hoc tests presented in table 9. Abbreviations: ≤, less than or equal to; >, greater than.
In 2024, soil saturation varied across the monitoring sites but was high at many sampling plots in all monitoring sites (figs. 10, 11). Most of the plots in the Old Treatment Ponds Seep site (80 percent) had greater than 50-percent soil saturation, with high saturation plots spread throughout the site (fig. 10). Most of the plots in the Pump Road Intermediate site were 100-percent saturated (70 percent of plots), and almost all plots (95 percent) had at least 50-percent soil saturation (fig. 10). At the Reference sites, 39 percent of plots were 100-percent saturated, although 72 percent of plots had at least 50-percent soil saturation. In the Pump Road Reference site, wet plots were located on the west side, and in the Old Treatment Ponds Reference site, wet plots were prevalent in the northeastern section (farther from the river channel at both sites; fig. 10). Soil saturation was significantly higher at the Intermediate site (92±10 percent) than at Reference sites but did not differ significantly from the Seep site (69±28 percent; F=3.77, P=0.03; Tukey’s post-hoc tests: Seep versus Intermediate P=0.37; Intermediate versus Reference P=0.02; Seep versus Reference P=0.46). We did not find a linear association between soil saturation and distance from the nearest seep outlet at the Seep and Intermediate sites (r=−0.10, P=0.36).
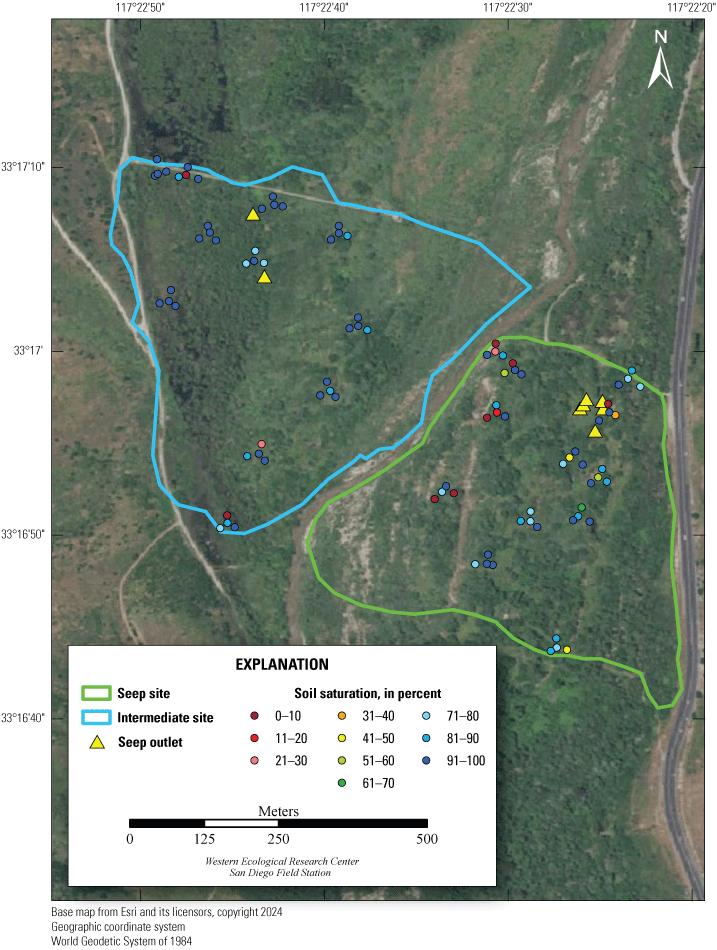
Percentage soil saturation at Seep and Intermediate site vegetation sampling plots, Marine Corps Base Camp Pendleton, California, 2024. Soil saturation was not collected at some plots. Refer to figure 2 for overview map.
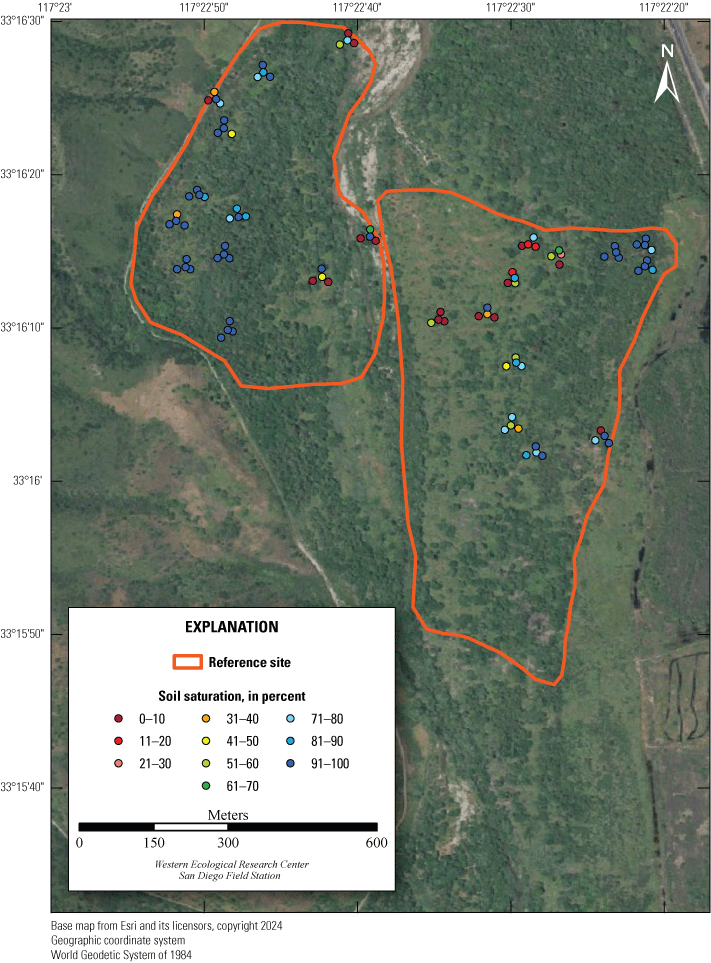
Percentage soil saturation at Reference site vegetation sampling plots, Marine Corps Base Camp Pendleton, California, 2024. Soil saturation was not collected at some plots. Refer to figure 2 for overview map.
In 2024, we determined that the relationships of total cover and woody cover with soil saturation was not statistically significant; however, non-native cover in the lower and mid-story (below 4 m) decreased with increasing soil saturation, and native herbaceous cover below 5 m increased with increasing soil saturation (table 8). Total herbaceous cover also increased with increasing soil saturation between 4 and 5 m, although the amount of herbaceous vegetation at this height was small, and the relationship was not biologically significant. We did not find a significant correlation between soil saturation and canopy height (ρ=0.8, P=0.24).
Table 8.
Spearman’s rank correlations (ρ) and significance of these correlations (P) between soil saturation and vegetation cover by height category, Marine Corps Base Camp Pendleton, California, 2024.[No analyses were made across height categories or among vegetation type categories; therefore, no adjustments were made for multiple comparisons. Abbreviations: m, meter; –, not enough vegetation for analysis; >, greater than]
Total cover was significantly greater below 1 m at the Seep site than at the Intermediate site (fig. 9; table 9). The Intermediate site had greater total cover above 4 m than the Seep site and the Reference sites. Below 2 m, woody cover was greater at the Seep site than at the Reference sites but above 4 m, woody cover was greater at the Intermediate site than both the Seep and Reference sites. Total herbaceous cover between 2 and 3 m was greater at the Reference sites than at the Seep site. Non-native cover between 2 and 3 m was greater at the Reference sites than at the Seep site and was also greater at the Reference sites than at the Intermediate site between 1 and 2 m. We found no significant differences in native herbaceous cover among sites. The average canopy height did not differ significantly among plots at Seep, Intermediate, and Reference sites (6.8±1.3 m versus 8.3±1.7 m versus 8.1±2.8 m, respectively; F=1.71, P=0.19). We did not find a significant difference in maximum canopy height among plots at Seep, Intermediate, and Reference sites (Seep=9.8±2.1 m; Intermediate=10.9±2.2 m; Reference=10.8±4.0 m; F=−0.43, P=0.68).
Table 9.
Results of Tukey’s post-hoc tests (P) examining differences among Seep, Intermediate, and Reference sites at each height category when analysis of variance (ANOVA) test results showed significant differences in foliage cover among site types, Marine Corps Base Camp Pendleton, California, 2024.[F, F-statistic for analysis of variance; m, meter; >, greater than]
5-year Summary of Vegetation Characteristics at Seep, Intermediate, and Reference Sites
From 2020 through 2024, average soil saturation appeared to increase in the monitoring sites (fig. 12). Soil saturation significantly increased at the Seep site (r=0.86, P=0.06), but the annual increase in soil saturation was not significant at the Intermediate site (r=0.45, P=0.45) or at the Reference sites (r=0.30, P=0.62). Soil saturation at the Seep and Intermediate sites was significantly higher than at their paired Reference sites in all years (paired t=2.11, P=0.03).
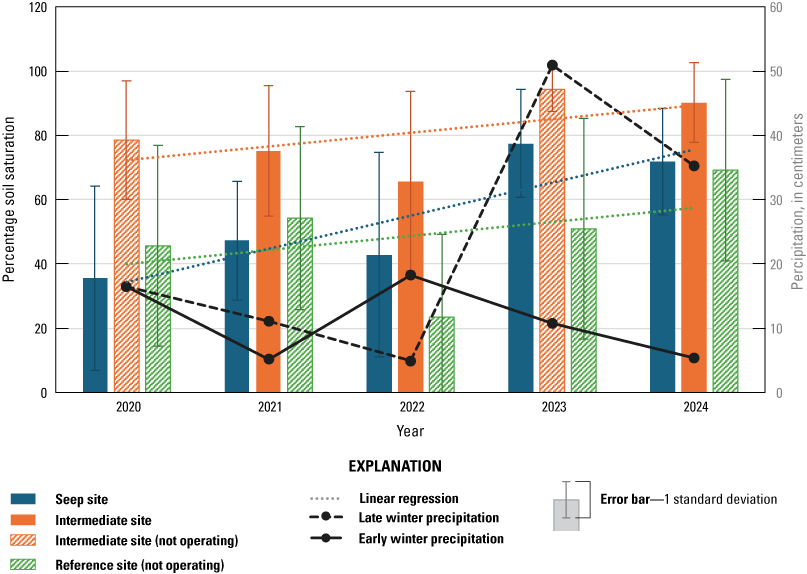
Average percentage soil saturation by monitoring site and by year, with early winter (October–December) and late winter (January–March) precipitation, Marine Corps Base Camp Pendleton, California, 2020–24. Bars are solid when seeps pumps were operating. Bars are hatched when seep pumps were not operating. Error bars represent 1 standard deviation. Colored dotted lines represent the simple linear regression 5-year trend for the site type of the same color, with the following equations: Seep site: y=10.3x+24.1, coefficient of determination (R 2)=0.77; Intermediate site: y=4.3x+68.0, R 2=0.34; Reference sites: y=4.4x+35.6, R 2=0.17.
To examine the spatial effect of the seep pumps, we created models looking at soil saturation within the Seep and Intermediate sites, excluding the Reference sites. We determined that soil saturation models should include the combination of early winter precipitation and late winter precipitation because models that included both early winter precipitation alone and early winter plus late winter precipitation together were well supported compared to models using bio-year precipitation. The top model describing soil saturation included monitoring site (Old Treatment Ponds Seep site versus Pump Road Intermediate site) and time (table 10). There were four other models that were well supported within 2 AICc of the top model. Site and time contributed significantly to all five well-supported models, with soil saturation increasing from 2020 to 2024 and consistently higher at the Intermediate site than at the Seep site. Seep operation, precipitation, and distance to seep outlet were included in at least one of the well-supported models and did not significantly contribute to the second, fourth, and fifth-ranked models. Early winter precipitation and seep operation contributed significantly to the third-ranked model; however, the addition of these variables did not improve upon the top-ranked model and therefore, seep operation, precipitation, and distance to seep outlet had a negligible effect on soil saturation.
Table 10.
Top 5 (of 32) logistic regression models for the effect of site (Seep versus Intermediate site), time, precipitation, and seep operation on soil saturation at 238 plots at Marine Corps Base Camp Pendleton, California, 2020–24.[Models are ranked from best to worst based on Akaike’s Information Criterion for small samples (AICc), change in AICc, (ΔAICc), and Akaike weights. AICc is based on −2xloge likelihood (L) and the number of parameters (K) in the model. Precipitation is the addition of early winter (October–December) and late winter (January–March) precipitation accumulated in the winter before the breeding season. Seep operation is 1 for years and sites when seeps were operating and 0 when seeps were not operating. Abbreviation: +, plus]
Average canopy height started higher at the Seep and Reference sites than at the Intermediate site, then appeared to decrease at Seep and Reference sites from 2020 through 2024, although the relationships were weak and not statistically significant (Seep: ρ=−0.16, P=0.22; Reference: ρ=−0.05, P=0.60; fig. 13). However, average canopy height significantly increased at the Intermediate site (ρ=0.49, P<0.001). We did not find a significant relationship between canopy height and soil saturation at any site (Seep site: ρ=−0.06, P=0.62, Intermediate site: ρ=0.19, P=0.15, Reference sites: ρ=0.15, P=0.11). Canopy height at the Reference sites was significantly greater than at their paired Seep and Intermediate sites across all 5 years of the study (paired t=3.22, P=0.01).
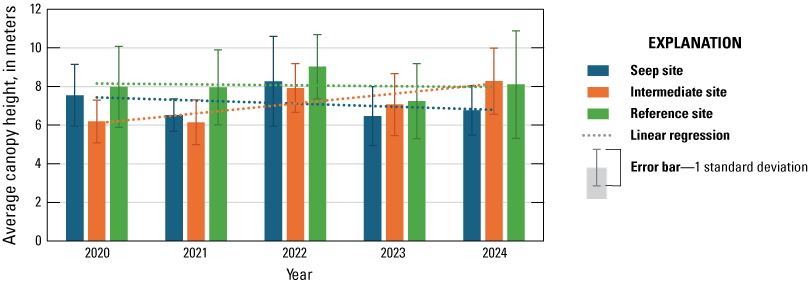
Average canopy height by monitoring site and by year, Marine Corps Base Camp Pendleton, California, 2020–24. Error bars represent 1 standard deviation. Colored dotted lines represent the simple linear regression 5-year trend for the site type of the same color. Seep site: y=−0.2x+7.6, R 2=0.11; Intermediate site: y=0.5x+5.6, R 2=0.68; Reference sites: y=−0.05x+8.2, R 2=0.01.
Total vegetation cover increased at many height categories across all monitoring sites from 2020 through 2024 (fig. 14). This increase was significant in the understory at the Seep and Reference sites (below 2 m at the Seep site, below 3 m at the Reference sites) and in the taller vegetation at the Intermediate site (above 2 m; table 11).
Table 11.
Spearman’s rank correlations (ρ) and the significance of these correlations (P) between total vegetation cover by height category and number of years since the seeps began operating, Marine Corps Base Camp Pendleton, California, 2020–24.[No analyses were made across height categories or among vegetation type categories; therefore, no adjustments were made for multiple comparisons. Abbreviations: m, meter; >, greater than]
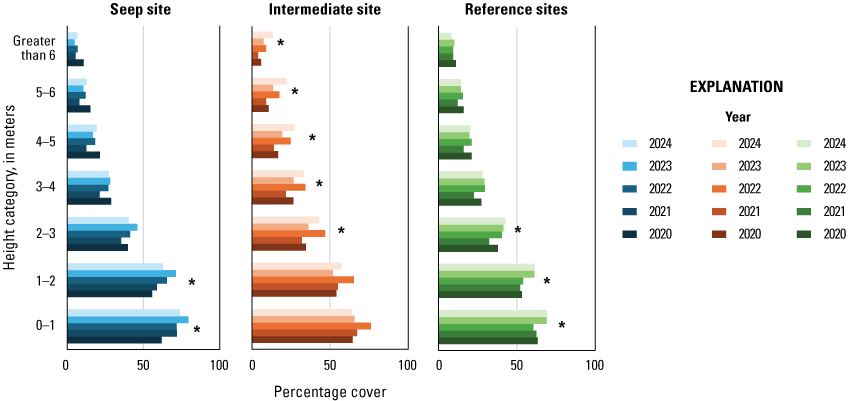
Total vegetation cover by height category and by year at the Seep, Intermediate, and Reference sites, Marine Corps Base Camp Pendleton, California, 2020–24. Asterisks (*) denote significant results of Spearman’s rank correlations (total vegetation cover by year) at each height category (refer to table 11).
In the understory (below 3 m), where vireos and flycatchers typically place their nests, total vegetation cover was greatest in 2023 after 4 years of seep operation at the Seep site, in 2022 after 1 year of seep operation at the Intermediate site, and in 2023 and 2024 at the Reference sites (fig. 14).
Woody vegetation cover increased from 2020 through 2024 below 1 m at the Seep site and above 3 m at the Intermediate site (table 12; fig. 15). At Reference sites, woody vegetation increased from 2–3 m from 2020 through 2024 (table 12; fig. 15), although this likely was not biologically significant.
Table 12.
Spearman’s rank correlations (ρ) and the significance of these correlations (P) between woody vegetation cover by height category and number of years since the seeps began operating, Marine Corps Base Camp Pendleton, California, 2020–24.[No analyses were made across height categories or among vegetation type categories; therefore, no adjustments were made for multiple comparisons. Abbreviations: m, meter; >, greater than]
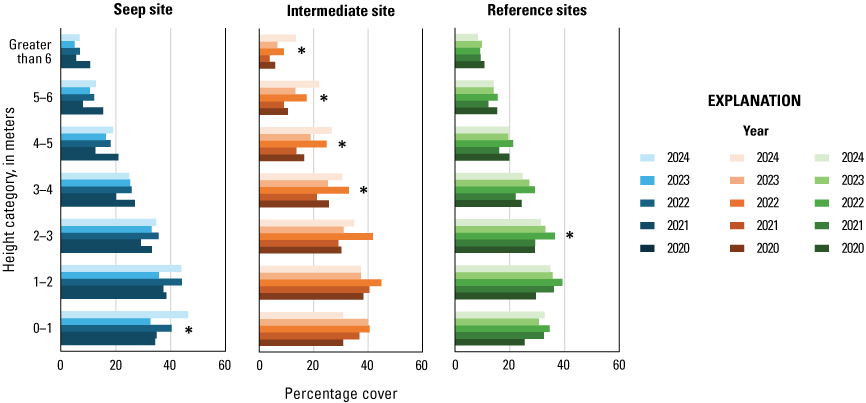
Woody vegetation cover by height category and by year at Seep, Intermediate, and Reference sites, Marine Corps Base Camp Pendleton, California, 2020–24. Asterisks (*) denote significant results of Spearman’s rank correlations (woody vegetation cover by year) at each height category (refer to table 12).
Herbaceous vegetation was most prevalent in the understory throughout all 5 years of the project (fig. 16), and it significantly increased from 2020 through 2024 between 3 and 4 m at the Seep and Reference sites and between 2 and 3 m at the Intermediate and Reference sites, although cover at these heights was low relative to cover below 2 m (table 13). There was not enough herbaceous vegetation above 4 m for meaningful analysis.
Table 13.
Spearman’s rank correlations (ρ) and the significance of these correlations (P) between herbaceous vegetation cover by height category and number of years since the seeps began operating, Marine Corps Base Camp Pendleton, California, 2020–24.[No analyses were made across height categories or among vegetation type categories; therefore, no adjustments were made for multiple comparisons. Abbreviation: m, meter]
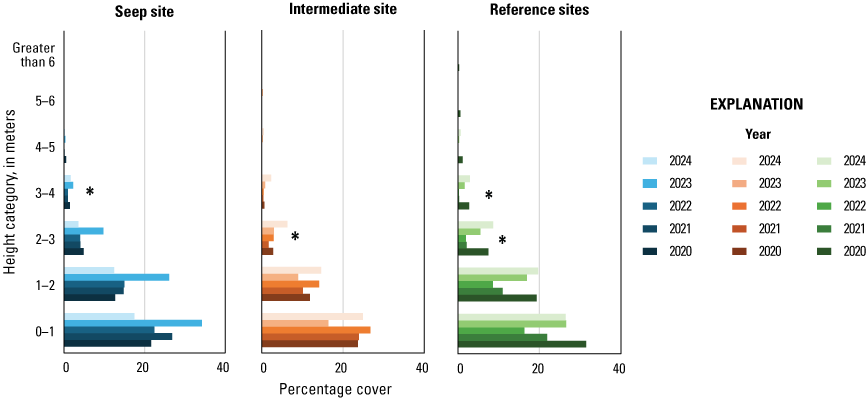
Herbaceous vegetation cover by height category and by year at the Seep, Intermediate, and Reference sites, Marine Corps Base Camp Pendleton, California, 2020–24. Asterisks (*) denote significant results of Spearman’s rank correlations (herbaceous vegetation cover by year) at each height category (refer to table 13).
As with total herbaceous cover, most of the native herbaceous cover was in the understory, below 3 m (fig. 17). Native herbaceous cover significantly increased from 2020 through 2024 at Seep and Intermediate sites between 3 and 4 m (table 14, fig. 17). At the Intermediate and Reference sites, native herbaceous cover increased between 2 and 3 m, and at the Reference sites, native herbaceous cover increased between 1 and 2 m (table 14). There was not enough native herbaceous vegetation above 4 m for meaningful analysis. Native herbaceous cover was greatest at the Seep site in 2023, but it was greatest at the Intermediate and Reference sites in 2024.
Table 14.
Spearman’s rank correlations (ρ) and the significance of these correlations (P) between native herbaceous vegetation cover by height category and number of years since the seeps began operating, Marine Corps Base Camp Pendleton, California, 2020–24.[No analyses were made across height categories or among vegetation type categories; therefore, no adjustments were made for multiple comparisons. Abbreviation: m, meter]
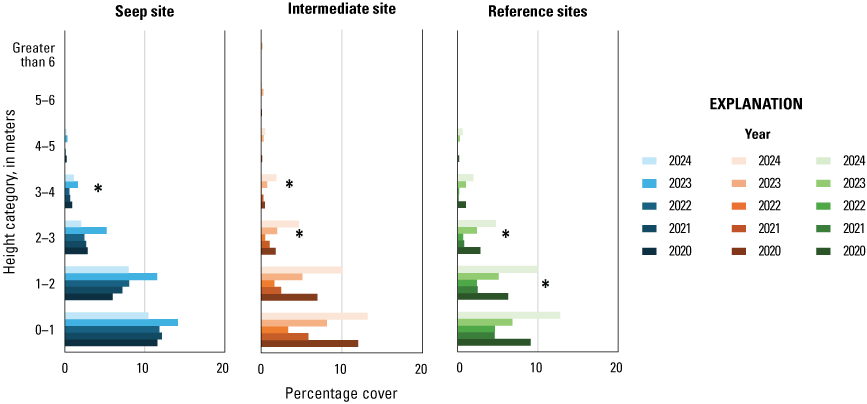
Native herbaceous vegetation cover by height category and by year at the Seep, Intermediate, and Reference sites, Marine Corps Base Camp Pendleton, California, 2020–24. Asterisks (*) denote significant results of Spearman’s rank correlations (native herbaceous vegetation cover by year) at each height category (refer to table 14).
We did not find significant changes in non-native vegetation cover at the Seep and Intermediate sites from 2020 through 2024 (table 15; fig. 18). Non-native vegetation cover increased at the Reference sites between 1 and 3 m from 2020 to 2024. There was not enough non-native vegetation above 4 m for meaningful analysis. Non-native cover was most abundant in 2023 at the Seep and Reference sites but was greatest in 2022 below 2 m at the Intermediate site.
Table 15.
Spearman’s rank correlations (ρ) and the significance of these correlations (P) between non-native vegetation cover by height category and number of years since the seeps began operating, Marine Corps Base Camp Pendleton, California, 2020–24.[No analyses were made across height categories or among vegetation type categories; therefore, no adjustments were made for multiple comparisons. Abbreviation: m, meter]
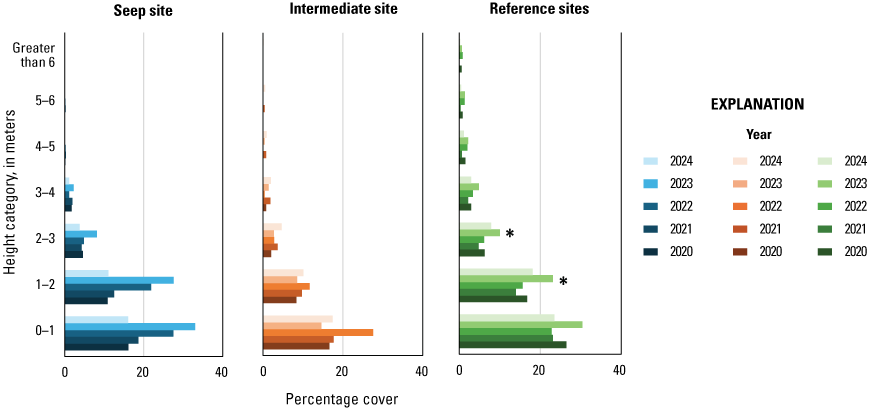
Non-native vegetation cover by height category and by year at the Seep, Intermediate, and Reference sites, Marine Corps Base Camp Pendleton, California, 2020–24. Asterisks (*) denote significant results of Spearman’s rank correlations (non-native vegetation cover by year) at each height category (refer to table 15).
Predictors of Vegetation Type Variation (Model 1)
In the first RDA model, we generated six RDA axes to examine the variation among vegetation types (app. 7). The first two axes (RDA1–RDA2) were significant and together explained 12 percent of the variation in vegetation types and height categories when constrained by site, soil saturation, early and late winter precipitation, and seep operation (table 16). The remaining four axes increased the amount of variation explained to 14 percent, indicating that 86 percent of the variation among vegetation types remained unexplained.
Table 16.
Results of analysis of variance among axes (RDA1–RDA6) for Redundancy Analysis model 1, including vegetation type variables constrained by predictor variables site, soil saturation, early winter precipitation, late winter precipitation, and seep operation, at Marine Corps Base Camp Pendleton, California, 2020–24.[F, F-statistic for analysis of variance; P, probability that the statistical test result was not significant; —, no data; <, less than]
Four of the five predictor variables were retained in the vegetation type model after stepwise regression: site, soil saturation, late winter precipitation, and seep operation (model 1; table 17). The Intermediate site and late winter precipitation loaded heavily on RDA1 in opposite directions (Intermediate site was positive, late winter precipitation was negative; app. 7, table 7.2), which accounted for 56 percent of the explained variation (table 16). RDA1 (and thereby the Intermediate site and late winter precipitation) was associated with total vegetation 1–2 m, herbaceous vegetation 1–4 m, native herbaceous vegetation 1–5 m, and non-native vegetation below 5 m (fig. 19; app. 7, table 7.1).
Table 17.
Results of analysis of variance among predictor variables for Redundancy Analysis model 1, including vegetation type variables constrained by predictor variables, at Marine Corps Base Camp Pendleton, California, 2020–24.[F, F-statistic for analysis of variance; P, probability that the statistical test result was not significant; —, no data]
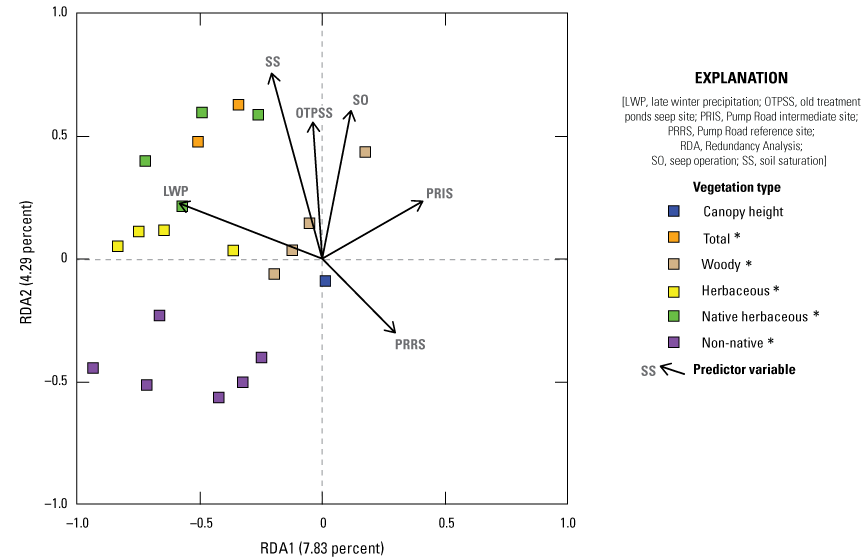
Relationship among vegetation types and predictor variables on the first two Redundancy Analysis axes (RDA1 and RDA2), Marine Corps Base Camp Pendleton, California, 2020–24. Vegetation types are colored boxes, with each box representing a height category (not labeled). The origin represents the Old Treatment Ponds Reference site. Proximity of colored squares to vectors shows relationships between vectors and squares. Distance of colored squares and vector arrowheads from the origin shows strength of the loading on the Redundancy Analysis (RDA) axis. Asterisks (*) indicate strong loading (less than −0.35 or greater than +0.35) of that variable on one or both RDA axes.
Soil saturation, seep operation, and the Seep site loaded positively on RDA2 (app. 7, table 7.2), which accounted for 31 percent of the explained variation (table 16). RDA2 (and thereby soil saturation, seep operation, and the Seep site) was positively associated with total cover 0–2 m, woody cover 0–2 m, and native herbaceous cover 0–4 m, and was negatively related to non-native cover above 2 m (fig. 19; app. 7, table 7.1).
Predictors of Plant Species Variation (Model 2)
In the second RDA model, we generated five axes, four of which were significant and explained 8 percent of the total variation in plant species and height categories when constrained by soil saturation, site, early and late winter precipitation, and seep operation (table 18; app. 8). The addition of the fifth axis did not noticeably increase the explanation of variation among plant species and height categories, leaving 92 percent of the variation unexplained.
Table 18.
Results of analysis of variance among axes (RDA1–RDA5) for Redundancy Analysis model 2, including common plant species constrained by predictor variables site, soil saturation, early winter precipitation, late winter precipitation, and seep operation, at Marine Corps Base Camp Pendleton, California, 2020–24.[F, F-statistic for analysis of variance; P, probability that the statistical test result was not significant; —, no data]
Only three of the five predictor variables were retained in the model after stepwise regression: site, soil saturation, and late winter precipitation (table 19). Soil saturation loaded significantly on RDA1, RDA2, and RDA3. In the reduced model, soil saturation and the Intermediate site loaded positively, and the Seep site loaded negatively on RDA1 (app. 8, table 8.2), which accounted for 39 percent of the variation (table 18). Elderberry below 1 m, poison hemlock below 4 m, and mugwort (Artemisia douglasiana) below 1 m loaded negatively on RDA1, and mule fat below 3 m and black willow 1–6 m loaded positively on RDA1 (fig. 20; app. 8, table 8.1).
Table 19.
Results of analysis of variance among predictor variables for Redundancy Analysis model 2, including common plant species constrained by predictor variables, at Marine Corps Base Camp Pendleton, California, 2020–24.[F, F-statistic for analysis of variance; P, probability that the statistical test result was not significant; —, no data]
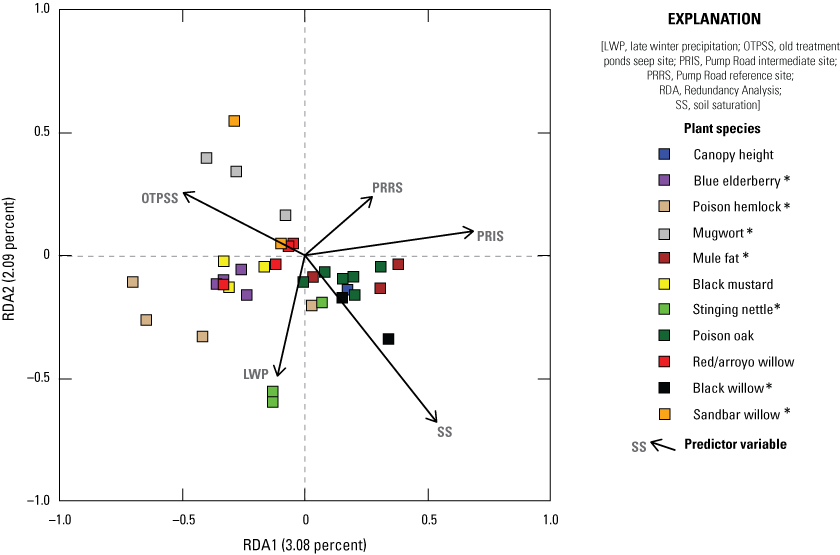
Relationship among plant species and predictor variables on the first two Redundancy Analysis (RDA) axes (RDA1 and RDA2), Marine Corps Base Camp Pendleton, California, 2020–24. Vegetation types are colored boxes, with each box representing a height category (not labeled). The origin represents the Old Treatment Ponds Reference site. Proximity of colored squares to vectors shows relationships between vectors and squares. Distance of colored squares and vector arrowheads from the origin shows strength of the loading on the RDA axis. Asterisks (*) indicate strong loading (less than −0.35 or greater than +0.35) of that variable on one or both RDA axes.
Soil moisture and late winter precipitation loaded negatively on RDA2, (app. 8, table 8.2), which accounted for 26 percent of the explained variation (table 18). Stinging nettle below 5 m and black willow 1–6 m loaded negatively on RDA2, and mugwort below 1 m and sandbar willow below 5 m loaded positively on RDA2 (fig. 21; app. 8, table 8.1).
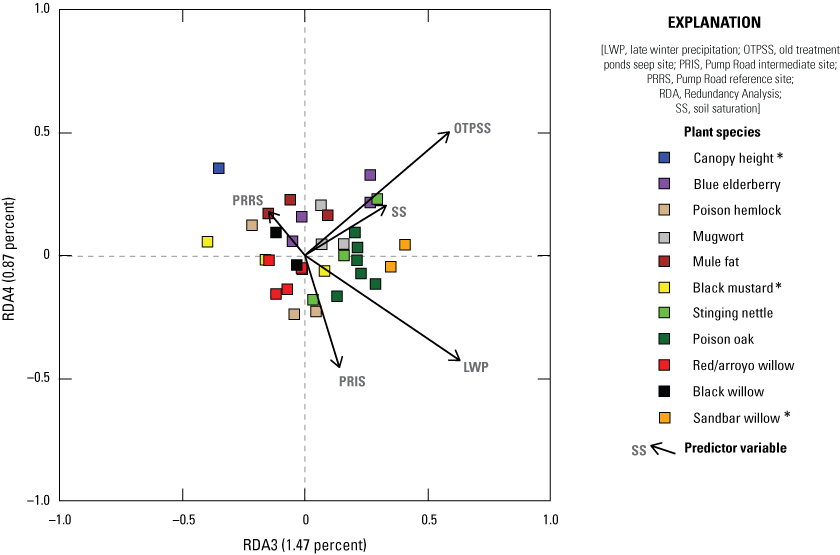
Relationship among plant species and predictor variables on the second two Redundancy Analysis (RDA) axes (RDA3 and RDA4), Marine Corps Base Camp Pendleton, California, 2020–24. Vegetation types are colored boxes, with each box representing a height category (not labeled). The origin represents the Old Treatment Ponds Reference site. Proximity of colored squares to vectors shows relationships between vectors and squares. Distance of colored squares and vector arrowheads from the origin shows strength of the loading on the RDA axis. Asterisks (*) indicate strong loading (less than −0.35 or greater than +0.35) of that variable on one or both RDA axes.
Soil saturation, the Seep site, and late winter precipitation loaded positively on RDA3 (app. 8, table 8.2), which accounted for 18 percent of the explained variation (table 18). RDA3 (and thereby soil saturation, the Seep site, and late winter precipitation) was negatively associated with canopy height and mustard below 1 m and positively associated with sandbar willow below 6 m (fig. 21; app. 8, table 8.1).
The Seep site loaded positively on RDA4, and the Intermediate site and late winter precipitation loaded negatively on RDA4 (app. 8, table 8.2), which accounted for 11 percent of the explained variation (table 18). Canopy height loaded negatively on RDA5 (fig. 21; app. 8, table 8.1).
Predictors of Vegetation Variation for Southwestern Willow Flycatcher Habitat (SWFL Model)
We created four axes for the SWFL habitat RDA model, two of which were significant; together they accounted for 11 percent of the variation among vegetation variables (table 20; app. 9). The addition of the two remaining axes increased the amount of variation explained by less than 1 percent.
Table 20.
Results of analysis of variance among axes (RDA1–RDA4) for the Southwestern Willow Flycatcher habitat Redundancy Analysis, including plant species identified as important in the 2018 flycatcher habitat model (Howell and others, 2018) constrained by predictor variables site, soil saturation, early winter precipitation, late winter precipitation, and seep operation, at Marine Corps Base Camp Pendleton, California, 2020–24.[F, F-statistic for analysis of variance; P, probability that the statistical test result was not significant; —, no data]
Only two of the five predictor variables remained in the model after stepwise regression, leaving site and soil saturation in the reduced SWFL model (table 21). Soil saturation was only significantly associated with RDA1. In the reduced model, soil saturation loaded positively on RDA1 (app. 9, table 9.2), which accounted for 51 percent of the explained variation (table 20). RDA1 (and thereby soil saturation) was positively associated with stinging nettle 0–3 m, black willow 0–3 m, total cover 3–6 m, and black willow above 6 m (fig. 22; app. 9, table 9.1).
Table 21.
Results of analysis of variance among predictors for the Southwestern Willow Flycatcher habitat Redundancy Analysis, including plant species identified as important in the 2018 flycatcher habitat model (Howell and others, 2018) constrained by predictor variables, site, soil saturation, early winter precipitation, late winter precipitation, and seep operation, at Marine Corps Base Camp Pendleton, California, 2020–24.[F, F-statistic for analysis of variance; P, probability that the statistical test result was not significant; —, no data]
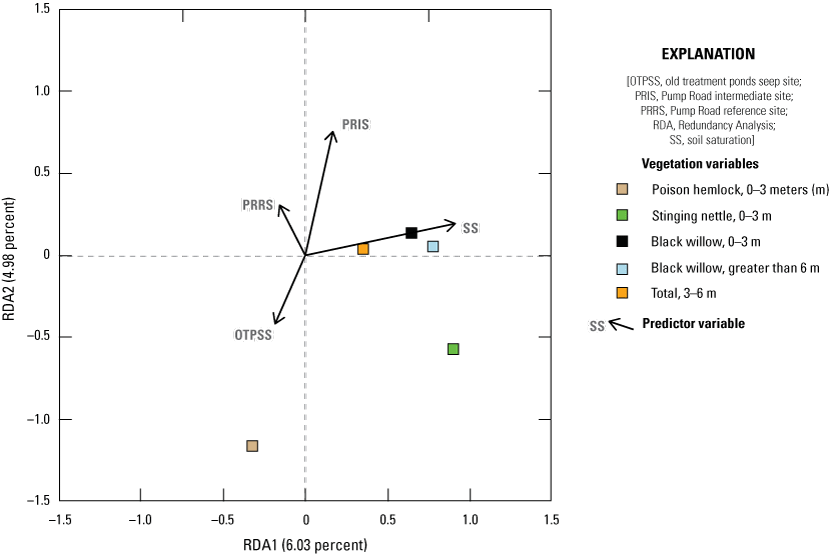
Relationship between Southwestern Willow Flycatcher habitat model vegetation variables, predictor variables, and the first two Redundancy Analysis (RDA) axes (RDA1 and RDA2), Marine Corps Base Camp Pendleton, California, 2020–24. The origin represents the Old Treatment Ponds Reference site. Proximity of colored squares to vectors shows relationships between vectors and squares. Distance of colored squares and vector arrowheads from the origin shows strength of the loading on the RDA axis.
The Seep site loaded negatively, and the Intermediate site loaded positively on RDA2 (app. 9, table 9.2), which accounted for 42 percent of the explained variation (table 20). Poison hemlock 0–3 m and stinging nettle 0–3 loaded negatively on RDA2 (fig. 22; app. 9, table 9.1).
Vireo Territory Density at Seep, Intermediate, and Reference Sites
For the 5 years before seep pumps were installed at Seep and Intermediate sites (2015–19), vireo territory density varied among Seep, Intermediate, and Reference sites, with density higher at the Seep and at Reference sites than at the Intermediate site in 2015, 2016, and 2017 and higher at the Seep site than at the Reference and the Intermediate sites in 2016, 2017, and 2018 (fig. 23). Territory density remained higher at the Seep site than the other sites through 2023, then in 2024, the Old Treatment Ponds Seep and Reference sites had the same territory density, both of which were higher than the Pump Road Intermediate and Reference sites.
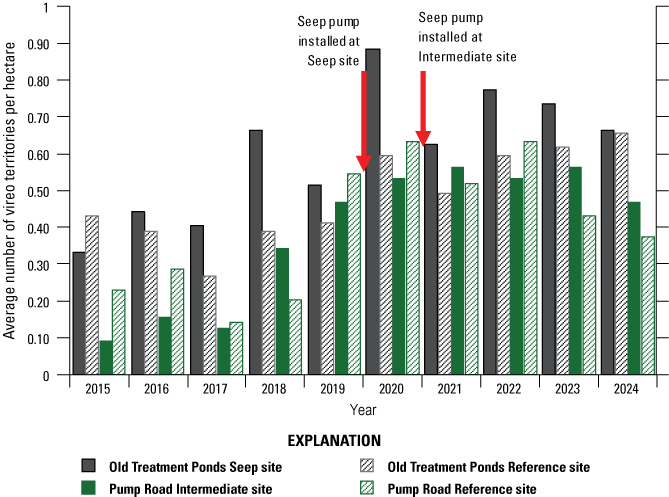
Least Bell’s Vireo territory density (average number of territories per hectare) at Seep, Intermediate, and Reference sites before and after seep pumps were installed, Marine Corps Base Camp Pendleton, California, 2015–24.
We did not find that vireo territory density responded significantly to augmentation of surface water by the seep pumps. At each site, territory density was significantly higher in the years after seep pump installation than before seep pumps were installed (t-tests, range of P=0.002–0.06), including sites where no seep pumps were installed. Territory density was higher at the Seep site than at its corresponding Reference site in the 4 years before and in the 4 years after the seep pumps were installed (paired t-test, t=2.99, P=0.03 for 2016–2019; t=2.94, P=0.03 for 2021–2024). Vireo territory density was similar at the Pump Road Intermediate site and its corresponding Reference site before and after seep pumps were installed (paired t-test, t=−0.35, P=0.37 for 2016–19; t=0.85, P=0.23 for 2021–24).
Vireo Survival, Site Fidelity, and Movements
Returning Banded Birds
We were able to observe 1,037 adult vireos (males: 663/676, 98 percent of all males; females: 374/505, 74 percent of all females) on Base well enough to determine banding status in 2024, although not all banded vireos were observed well enough to conclusively identify the individual. Of the 1,037 vireos, 31 had been banded before the 2024 breeding season, 6 of which could not be identified because they were banded with a single numbered silver metal federal band. Birds with a single silver band were either banded within the past 5 years at local MAPS stations (two stations at MCBCP that were operated in 2020 and 2021 [B. Kus, U.S. Geological Survey, unpub. data, 2020; Mendia and Kus, 2024] and one station in the Tijuana River Valley that was operated from 2019 to 2023 [B. Kus, U.S. Geological Survey, unpub. data, 2023; Lynn and others, 2023]) or were nestlings banded at Marine Corps Air Station, Camp Pendleton (MCAS) from 2018 to 2023 (Ferree and Clark, 2018, 2019, 2020, 2021, 2023; K. Ferree, San Diego Natural History Museum, written commun., 2024). We were unable to determine the year or location where these six birds were banded. In total, we were able to identify 25 vireos that had unique color band combinations on Base in 2024 (table 22; app. 10). Of the 25 identified banded vireos, 24 vireos were originally banded on Base, and 1 vireo was originally banded off Base (on the San Luis Rey River; table 23; app. 10; Houston and others, 2023). Adult birds of known age ranged from 1 to 9 years old. Of the known-age adult banded birds, 20 percent were 1 year old in 2024.
Table 22.
Banding status of Least Bell’s Vireos detected on Marine Corps Base Camp Pendleton (MCBCP), California, and those that emigrated off Base in 2024.[Birds detected on MCBCP include immigrants; natal vireos were originally banded as nestlings with a single numbered federal band]
Table 23.
Number of banded adult Least Bell’s Vireos by original year banded, age, original banding location, and sex at Marine Corps Base Camp Pendleton (MCBCP), California, in 2024.[Year originally banded unknown: Vireos banded with single numbered silver metal federal band, so original year banded (and therefore age), and location was not known. Abbreviations: SLR, San Luis Rey River; yr(s), year(s); ≥, greater than or equal to]
All 10 natal vireos that were resighted on MCBCP in 2024 were captured and given a complete color combination (table 22). One natal male vireo from MCBCP was detected off Base on the Santa Margarita River in 2024. This natal vireo was originally banded as a nestling on MCBCP in 2017.
Newly Banded Birds
A total of 164 vireos were banded for the first time during 2024. These newly banded birds were all nestlings that were banded with a single gold numbered federal band on the left leg.
Adult Survival
The most important variables predicting adult vireo survival were sex and year. The top model, which included sex and year, had more support than any other model (AICc weight=0.97), and no other models had AICc within 2 of the top model (table 24). Sex and year (in particular, 2012–13 with 95-percent confidence and 2006–07, 2007–08, 2017–18, 2018–19, and 2022–23 with 85-percent confidence) significantly contributed to the model (table 25). Although the second-ranked model included precipitation, this model was not strongly supported (AICc weight=0.02), and therefore, precipitation did not appear to be a significant predictor of adult survival. In the top model, male annual survival (60±11 percent) was higher than female annual survival (47±12 percent), and vireo survival was higher from 2012 to 2013 than any other year (tables 25, 26).
Table 24.
All logistic regression models for the effect of sex (male versus female), year, and bio-year precipitation on survival of adult Least Bell’s Vireos (n=760) on Marine Corps Base Camp Pendleton, California, 2005–24.[The effect of sex and year on detection probability was included in all models. Detection probability for 2023–24 was fixed equal to 1. Models are ranked from best to worst based on Akaike’s Information Criterion for small samples (AICc), change in AICc (ΔAICc), and AICc weights. AICc is based on −2xloge likelihood and the number of parameters in the model. Abbreviation: +, plus]
Table 25.
Parameter estimate (β), standard error (SE), odds ratios, and 95-percent and 85-percent confidence intervals (CI) of the odds ratios for the top model explaining annual survival of adult Least Bell’s Vireos on Marine Corps Base Camp Pendleton, California, 2005–24.[Reference represents female survival, 2005–06. All other effects values are the difference between that parameter and the reference. Abbreviation: +, plus]
Table 26.
Annual survival for male and female Least Bell’s Vireos on Marine Corps Base Camp Pendleton, California, 2005–24.[Estimates were calculated from the top model. Abbreviations: SD, standard deviation; ±, plus or minus]
Adult Versus First-Year Vireo Survival
Of the six models we created to examine the effects of age, year, and precipitation on vireo survival, the model that included age and year ranked highest (table 27). The top model with age plus year had an AICc weight of 1.00, which is well above any other model in the model set. No other models had measurable weight. Age was the only factor that significantly contributed to the top model (table 28). Year appeared in the top model because there was 85-percent confidence that the odds ratios for the 2007–08, 2012–13, and 2020–21 time intervals were significantly different than 1 (table 28).
Table 27.
All logistic regression models for the effect of age (first-year versus adult), year, and bio-year precipitation on survival of Least Bell’s Vireos (n=2,995) on Marine Corps Base Camp Pendleton, California, 2005–24.[Bio-year precipitation was calculated from July 1 to June 30 of the year preceding the survival year. The effect of year on detection probability was included in all models. Detection probability for 2023–24 was fixed equal to 1. Models are ranked from best to worst based on Akaike’s Information Criterion for small samples (AICc), change in AICc (ΔAICc), and AICc weights. AICc is based on −2xloge likelihood and the number of parameters in the model. Abbreviation: +, plus]
Table 28.
Parameter estimates (β), standard errors (SE), odds ratios, and 95-percent and 85-percent confidence intervals (CI) of the odds ratios for the top model explaining annual survival of Least Bell’s Vireos on Marine Corps Base Camp Pendleton, California, 2005–24.[Reference represents first-year vireos, 2005–06. All other effects values are the difference between that parameter and the reference. Abbreviation: +, plus]
According to the top model, adults had higher survival than first-year birds during the entire time span (2005–24; table 28). Annual survival of adult vireos averaged 61±11 percent (range 36–76 percent) and annual survival of first-year vireos averaged 11±4 percent (range: 4–19 percent; table 29).
Table 29.
Annual survival for adult and first-year Least Bell’s Vireos on Marine Corps Base Camp Pendleton, California, 2005–24.[Estimates were calculated from the top model. Abbreviations: SD, standard deviation; ±, plus or minus]
Vireo Survival and Return Rates at Seep, Intermediate, and Reference Sites
Artificial seeps did not appear to affect the return rate of adult vireos: site type was not included in the well-supported models describing adult vireo return rate to Seep, Intermediate, and Reference sites (table 30). The most important factors affecting return rate for adult vireos to Seep, Intermediate, and Reference sites were sex and year, although the 95-percent confidence interval of the odds ratio for sex included 1, indicating that sex did not have a significant effect on return rate (table 31). Although the 95-percent confidence interval of the odds ratio for year was less than 1, indicating that year was a significant contributor to the top model with the lowest return rate from 2023 to 2024, we are not confident of its significance given the impossibility of separating return rate from detection probability in this final time interval (table 31). The top two models were well supported, with weights of 0.35 and 0.26, and no other models were within 2 AICc of the top model.
Table 30.
All logistic regression models for the effect of sex (male versus female), year, and site type (Seep versus Intermediate versus Reference site) on return rate of adult Least Bell’s Vireos (n=58) on Marine Corps Base Camp Pendleton, California, 2020–24.[Models are ranked from best to worst based on Akaike’s Information Criterion for small samples (AICc), change in AICc (ΔAICc), and AICc weights. AICc is based on −2xloge likelihood and the number of parameters in the model. Abbreviations: *, interacting with; +, plus]
Table 31.
Parameter estimates (β), standard errors (SE), odds ratios, and 95-percent and 85-percent confidence intervals (CI) of the odds ratios for the top model explaining return rate of Least Bell’s Vireos to Seep, Intermediate, and Reference sites on Marine Corps Base Camp Pendleton, California, 2005–24.[Reference represents female vireos, 2020–21. All other effects values are the difference between that parameter and the reference. Abbreviation: +, plus]
The most well-supported model that describes age-related survival at Seep, Intermediate, and Reference sites only included age (table 32). Age significantly contributed to the top model (95-percent confidence interval of the odds ratio did not include 1). Adult return rate was 62 percent, and first-year survival was 3 percent. Site type did not seem to contribute to first-year survival of vireos because it was not included in well-supported models. The top model was well supported, with a weight of 0.73, and no other models were within 2 AICc of the top model.
Table 32.
All logistic regression models for the effect of age (adults versus first-year birds), year, and site type (Seep versus Intermediate versus Reference site) on return rates of Least Bell’s Vireos (n=652) on Marine Corps Base Camp Pendleton, California, 2020–24.[Models are ranked from best to worst based on Akaike’s Information Criterion for small samples (AICc), change in AICc (ΔAICc), and AICc weights. AICc is based on −2xloge likelihood and the number of parameters in the model. Abbreviations: *, interacting with; +, plus]
Base-wide Site Fidelity and Movement
Resighting banded birds allowed us to identify individuals that either returned to the same territory they used in a previous year (within 100 m) or moved to a different location (app. 11). There were 13 adult vireos (all males) identified at MCBCP in 2023 that were resighted in 2024, all of which occupied known territories both years. Most of the returning adult vireos showed strong between-year site fidelity. Of the 13 returning territorial males, 12 (92 percent of territorial adult males) occupied a breeding site in 2024 that they had defended in 2023. One additional adult male vireo (8 percent of all adult male vireos) returned to a location adjacent to its previous territory (within 300 m). The average distance moved by returning adult vireos was 0.04±0.03 km (range: 0.0–0.1 km).
Five first-year vireos that were banded as nestlings in 2023 on MCBCP were resighted in 2024 and occupied known territories (three males and two females; app. 11). The average distance that first-year vireos moved from their natal territories to their breeding territories was 2.4±3.1 km (range: 0.7–8.0 km; males moved, on average, 1.21±0.4 km, range 0.8–1.6 km; females moved, on average, 4.4±5.1 km, range 0.7–8.0 km). No first-year vireos that were banded as nestlings in 2023 on MCBCP were resighted off Base, and no first-year vireos from off Base were resighted on MCBCP in 2024.
Site Fidelity and Movement at Seep, Intermediate, and Reference Sites
Adult fidelity to Seep, Intermediate, and Reference sites was high. Of adult vireos detected in 2023 and 2024, two male vireos that held territories at the Seep site in 2023 returned to the Seep site in 2024 (100 percent). Similarly, the one vireo identified at the Intermediate site in 2023 returned to the Intermediate site in 2024 (100 percent), and two vireos that held territories at Reference sites in 2023 returned to Reference sites in 2024 (100 percent). In 2024, one first-year vireo that fledged from the Seep site in 2023 returned to a Reference site.
Nest Success and Breeding Productivity
Nesting activity was monitored at 12 of the 20 territories in the Seep site, 11 of the 15 territories in the Intermediate site, and 24 of the 45 territories in Reference sites (table 33; figs. 24–27; app. 12). All 47 territories were occupied by pairs and were fully monitored, meaning that all nests within the territory were detected and documented during the breeding season. The 47 pairs built 99 nests; 10 of these nests were not completed (INC, meaning nest not completed; table 12.1 in app. 12) and have been excluded from calculations of nest success and productivity.
Table 33.
Number of Least Bell’s Vireo territories and nests monitored at Seep, Intermediate, and Reference sites on Marine Corps Base Camp Pendleton, California, 2024.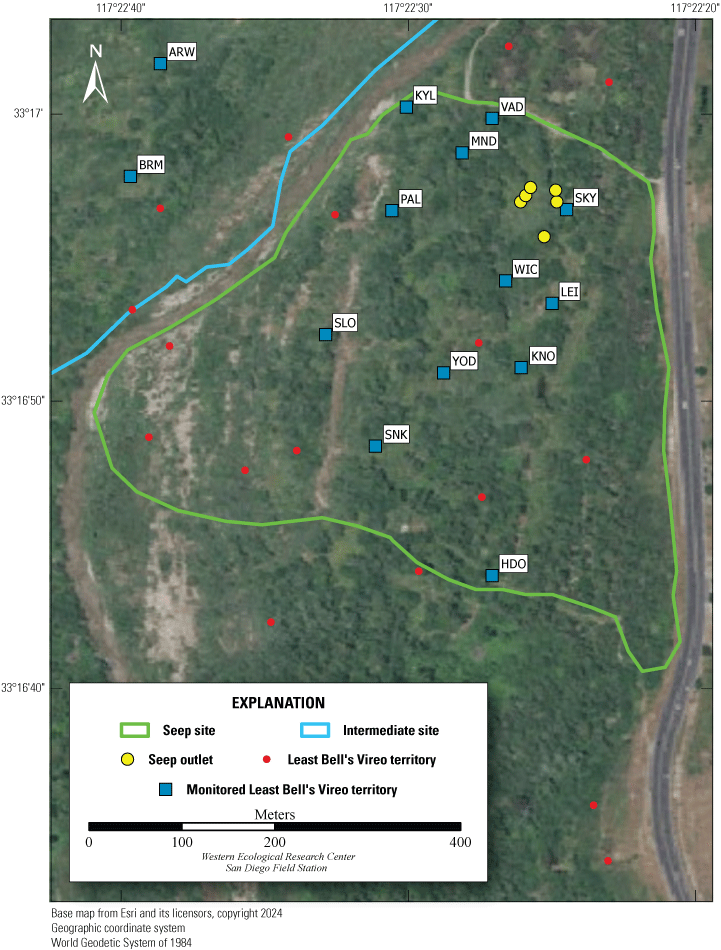
Locations of monitored Least Bell’s Vireo territories at the Old Treatment Ponds Seep site, Marine Corps Base Camp Pendleton, California, 2024.
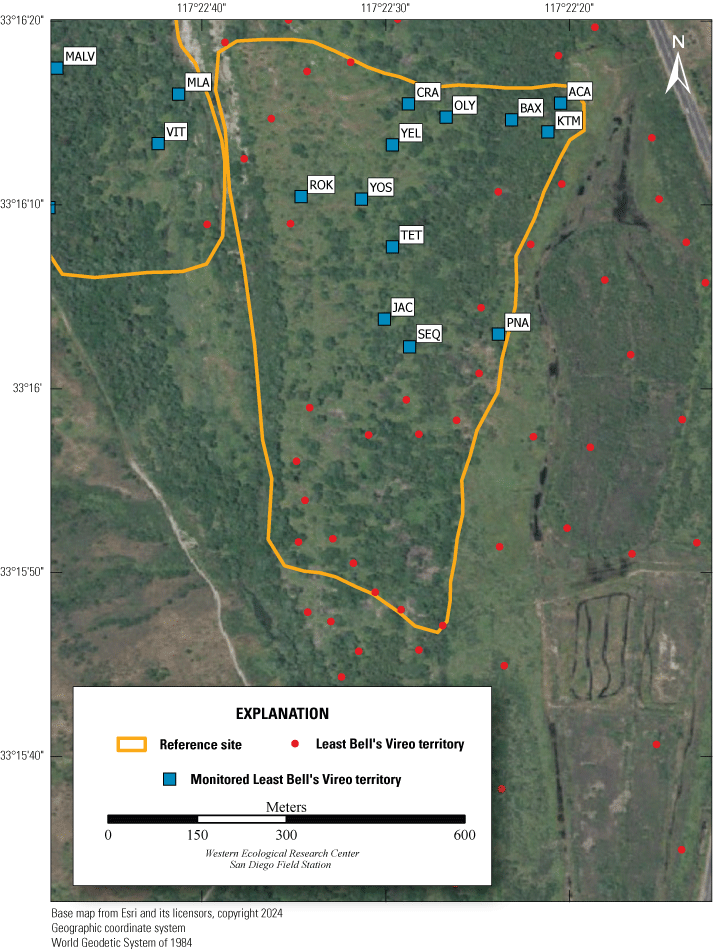
Locations of monitored Least Bell’s Vireo territories at the Old Treatment Ponds Reference site, Marine Corps Base Camp Pendleton, California, 2024.
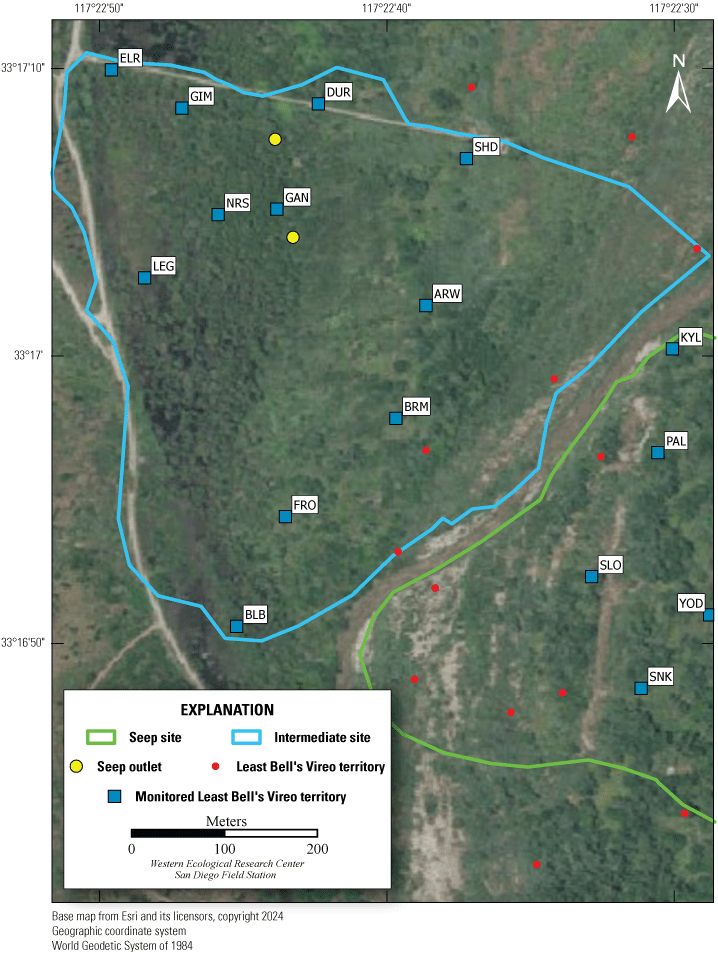
Locations of monitored Least Bell’s Vireo territories at the Pump Road Intermediate site, Marine Corps Base Camp Pendleton, California, 2024.
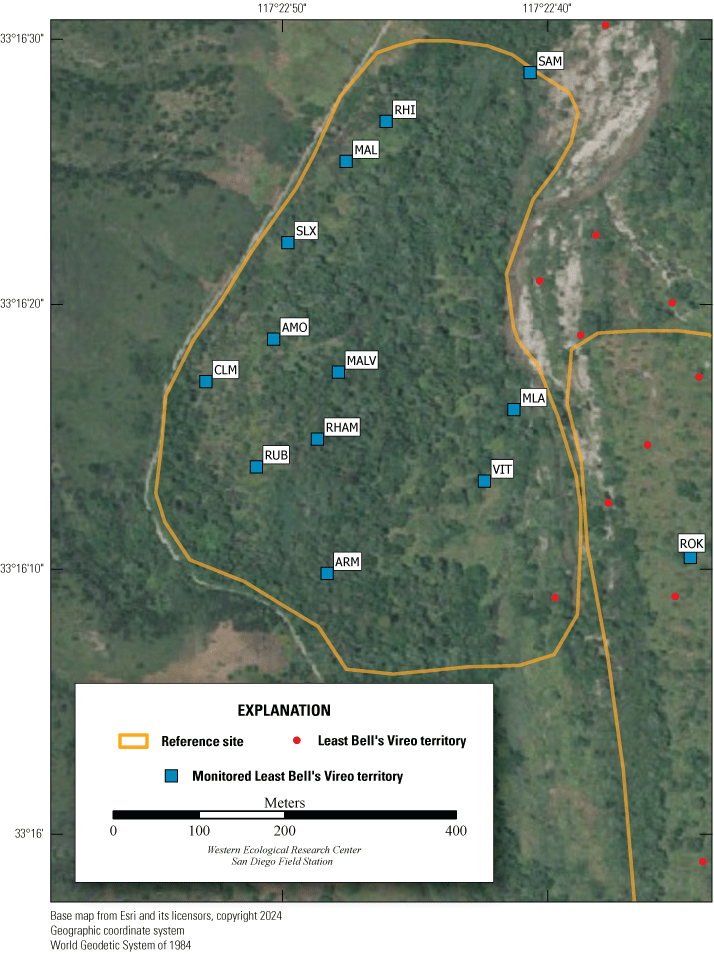
Locations of monitored Least Bell’s Vireo territories at the Pump Road Reference site, Marine Corps Base Camp Pendleton, California, 2024.
Nesting Attempts
We did not find a significant difference in the number of nests built by pairs (including incomplete nests) among the Seep, Intermediate, and Reference sites during the 2024 breeding season (table 34). Pairs at the Seep site (9/12; 75 percent), Intermediate site (10/11; 91 percent), and Reference sites (18/24; 75 percent) were all likely to renest after an initial nesting attempt (Fisher’s Exact test, P=0.64). The number of renests after a failed first nesting attempt did not differ among Seep pairs (8/8; 100 percent), Intermediate pairs (9/9; 100 percent), and Reference pairs (14/15; 93 percent; Fisher’s exact test, P=1.00). Pairs at the Seep site (1/4; 25 percent), Intermediate site (1/2; 50 percent), and Reference sites (4/9; 44 percent) were all less likely to renest after a successful first nesting attempt (Fisher’s exact test, P=1.00). Pairs at the Intermediate site were as likely to renest after a failed first nesting attempt as after a successful first nesting attempt in 2024 (Fisher’s exact test, P=0.18), but pairs at the Seep and Reference sites were more likely to renest after a failed first nesting attempt than after a successful first nesting attempt (Fisher’s exact test, P=0.02 and P=0.01, respectively). When all monitoring site types were combined, pairs were more likely to renest after a failed nesting attempt than they were after a successful nesting attempt in 2024 (Fisher’s exact test, P<0.001). Overall, in 2024, 40 percent (6/15) of vireo pairs attempted to renest after a successful first nesting attempt, and 97 percent (31/32) of pairs attempted to renest after a failed first nesting attempt. In 2024, three pairs at the Seep site, five pairs at the Intermediate site, and five pairs at Reference sites attempted to nest three times, and two pairs at the Intermediate site attempted to nest four times.
Table 34.
Results of Poisson regression testing for the effect site type (Seep, Intermediate, or Reference) on the number of nests per Least Bell’s Vireo pair, Marine Corps Base Camp Pendleton, California, 2024.[The intercept includes the Intermediate site. Abbreviations: P, probability that the statistical test result was not significant; z-value, test statistic; <, less than; m, meters]
Nest Success
Although success of completed nests in the Seep (46 percent; 11/24) and Intermediate sites (44 percent; 11/25) appeared lower than in the Reference sites (63 percent; 25/40), the difference was not statistically significant (chi-square=2.75, P=0.25; table 35). First nesting attempts at all monitoring sites also did not have significantly different success rates (Seep: 33 percent, 4/12; Intermediate: 18 percent, 2/11; Reference: 38 percent, 9/24; Fisher’s exact P=0.65; app. 12). Overall, 53 percent of all nesting attempts were successful, and 32 percent of first nesting attempts were successful in 2024.
Table 35.
Fate of completed Least Bell’s Vireo nests in fully monitored territories at Seep, Intermediate, and Reference sites, Marine Corps Base Camp Pendleton, California, 2024.[Numbers in parentheses are the proportion of all nests]
Causes of failure were similar at all sites. Most nest failures were caused by predation (table 35), although confirmed predation events were not witnessed. Predation accounted for 85 percent (11/13) of nest failures at the Seep site, 79 percent (11/14) of nest failures at the Intermediate site, and 87 percent (13/15) of nest failures at Reference sites. We documented two nests at the Seep site, three nests at the Intermediate site, and two nests at Reference sites that failed for other reasons, known and unknown (app. 12); four nests were abandoned with no eggs ever confirmed, two nests were abandoned with nestlings after rain and colder than normal temperature, and one nest was abandoned with eggs after herbicide was sprayed within 3 m of the nest. Overall, 54 percent, 56 percent, and 38 percent of completed vireo nests at Seep, Intermediate, and Reference sites, respectively, were lost to predation or other causes.
Cowbird Parasitism
None of the monitored vireo nests were parasitized by Brown-headed Cowbirds in 2024.
Productivity
Clutch size did not differ among Seep, Intermediate, and Reference sites (tables 36, 37). Seep, Intermediate, and Reference sites also had similar percentages of eggs that hatched and nests with hatchlings. The percentage of hatchlings that fledged, the percentage of nests with hatchlings that ultimately fledged young, and the number of fledglings per egg did not differ among Seep, Intermediate, and Reference sites. Seep, Intermediate, and Reference pairs fledged similar numbers of young (table 37), and pairs at the three categories of sites had similar likelihood of fledging at least one young. One pair at the Seep site (8 percent), one pair at the Intermediate site (9 percent), and two pairs at Reference sites (8 percent) each successfully fledged two broods in 2024 (app. 12). No pairs successfully fledged three broods. Vireo pairs at Seep, Intermediate, and Reference sites combined fledged an average of three vireo young per pair, and 91 percent of monitored pairs were successful in fledging at least one young in 2024 (table 36).
Table 36.
Reproductive success and productivity of nesting Least Bell’s Vireos at Seep, Intermediate, and Reference sites, Marine Corps Base Camp Pendleton, California, 2024.[F, F-statistic from analysis of variance; P, probability that a difference was not significant; %, percentage; —, no data; ±, plus or minus]
Table 37.
Results of Poisson regression testing for the effect site type (Seep, Intermediate, or Reference) on Least Bell’s Vireo clutch size and number of fledglings produced per pair, Marine Corps Base Camp Pendleton, California, 2024.[The intercept includes the Intermediate site. Abbreviations: m, meters; P, probability that the statistical test result was not significant; z-value, test statistic; <, less than]
In 2024, the number of fledglings produced per egg was negatively correlated with total and woody cover between 2 and 3 m and positively correlated with total herbaceous cover between 2 and 3 m (table 38). The number of fledglings per pair was negatively correlated with woody cover between 2 and 3 m, but positively associated with total and native herbaceous cover between 1 and 2 m, and total herbaceous cover between 2 and 3 m. We did not find any other significant relationships between vireo nest productivity and percentage of foliage cover of any type below 3 m in 2024.
Table 38.
Spearman’s rank correlations (ρ) and the significance of correlations (P) between two measures of Least Bell’s Vireo nest productivity and percentage of foliage cover at height categories below 3 meters (m), Marine Corps Base Camp Pendleton, California, 2024.5-year Summary of Nest Success and Breeding Productivity
During the 5 years of the surface-water augmentation study, we determined that vireo breeding productivity was significantly affected by a few factors. The number of fledglings produced per vireo pair increased with increasing native herbaceous cover under 3 m and decreasing cover of all herbaceous vegetation under 5 m and was not significantly affected by precipitation, site, or seep operation (table 39; fig. 28). The number of vireo fledglings produced per vireo egg was lower at the Seep and Intermediate sites than at the Reference sites, increased with decreasing late winter precipitation, cover of poison hemlock, black mustard, non-native vegetation above 2 m, and all vegetation over 2 m. The number of fledglings per egg increased when seep pumps were operating at the Seep and Intermediate sites and increased with increasing cover of black willow, sandbar willow, poison oak, native herbaceous vegetation under 3 m, and non-native vegetation below 2 m (table 40; fig. 29). The proportion of vireo pairs that produced fledglings was lower at the Seep and Intermediate sites than at the Reference sites, increased with decreasing cover of poison hemlock, and increased with increasing cover of poison oak (table 41; fig. 30).
Table 39.
Best generalized linear model determined by stepwise Akaike’s Information Criterion for small samples (AICc) model evaluation (stepAIC function in the MASS package; Venables and Ripley, 2002) predicting the effect of vegetation and other environmental factors on the number of Least Bell’s Vireo fledglings produced per pair, Marine Corps Base Camp Pendleton, California, 2020–24.[Variables that remained in the model were selected by backward stepwise regression. Abbreviations: m, meters; P, probability that the statistical test result was not significant; t, test statistic; <, less than]
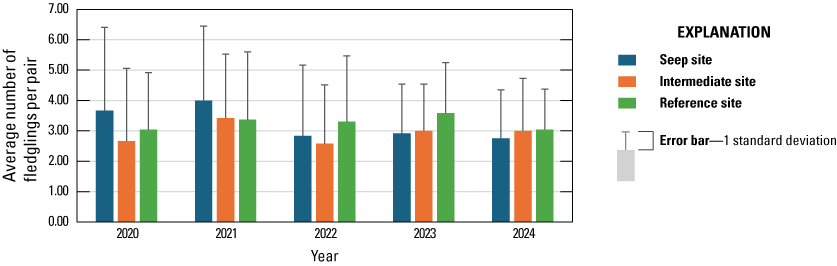
Average number of fledglings per Least Bell’s Vireo pair at Seep, Intermediate, and Reference sites, Marine Corps Base Camp Pendleton, California, 2020–24. Vertical lines represent 1 standard deviation.
Table 40.
Best generalized linear model determined by stepwise Akaike’s Information Criterion for small samples (AICc) model evaluation (stepAIC function in the MASS package; Venables and Ripley, 2002) predicting the effect of vegetation and other environmental factors on the number of Least Bell’s Vireo fledglings produced per egg, Marine Corps Base Camp Pendleton, California, 2020–24.[Variables that remained in the model were selected by backward stepwise regression. The intercept includes the Old Treatment Ponds Reference site. Abbreviations: m, meters; P, probability that the statistical test result was not significant; t-value, test statistic; <, less than; >, greater than]
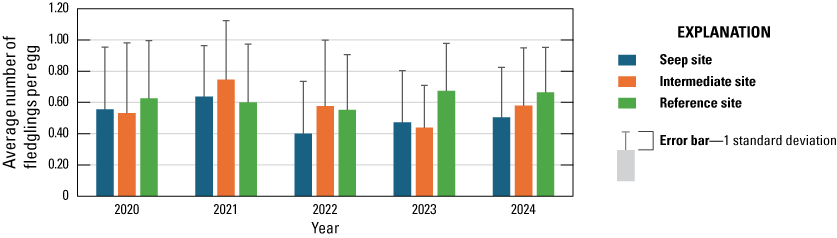
Average number of fledglings per Least Bell’s Vireo egg at Seep, Intermediate, and Reference sites, Marine Corps Base Camp Pendleton, California, 2020–24. Vertical lines represent 1 standard deviation.
Table 41.
Best generalized linear model determined by stepwise Akaike’s Information Criterion for small samples (AICc) model evaluation (stepAIC function in the MASS package; Venables and Ripley, 2002) predicting the effect of vegetation and other environmental factors on the proportion of Least Bell’s Vireo pairs that produced fledglings, Marine Corps Base Camp Pendleton, California, 2020–24.[Variables that remained in the model were selected by backward stepwise regression. The intercept includes the Old Treatment Ponds Reference site. Abbreviations: m, meters; P, probability that the statistical test result was not significant; t-value, test statistic; <, less than]
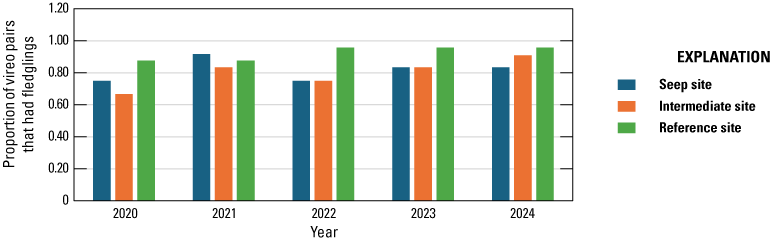
Proportion of Least Bell’s Vireo pairs that produced fledglings at Seep, Intermediate, and Reference sites from 2020 through 2024, Marine Corps Base Camp Pendleton, California.
Daily Nest Survival
Using site type (Seep versus Intermediate versus Reference site), year, seep operation and bio-year precipitation as covariates, we built nine models with potential to predict the probability that a nest would survive from 1 day to the next (table 42). The constant model was generated first and remained the best supported model. The second highest ranked model, which only included bio-year precipitation, was well supported (within 2 AICc of the top model); however, the upper margin of the 95-percent confidence interval for the odds ratio was 1, indicating that bio-year precipitation had a marginal, negative effect on DSR. No other models were within 2 AICc of the top (constant) model.
Table 42.
All logistic regression models for the effect of seeps on Least Bell’s Vireo nest survival (n=443) on Marine Corps Base Camp Pendleton, California, 2020–24.[Models are ranked from best to worst based on Akaike’s Information Criterion for small samples (AICc), change in AICc, (ΔAICc), and Akaike weights. AICc is based on −2xloge likelihood (L) and the number of parameters (K) in the model. Constant is the null model, no covariates included. Bio-year precipitation is the amount of precipitation in the bio-year, July 1–June 30, ending in the nesting year. Seep operation is 1 for years and sites when seeps were operating and 0 when seeps were not operating. Site type is the location of the nest in a Seep, Intermediate, or Reference study site. Abbreviation: +, plus]
Nest Characteristics
Vireos used 15 plant species for nesting at Seep, Intermediate, and Reference sites in 2024, although not all were used within each site category (table 43). Vireos used 9 plant species at the Seep site, 11 species at the Intermediate site, and 8 species at Reference sites. Vireos placed 54 percent of all nests in arroyo or red willow, sandbar willow, or black willow (67 percent at the Seep site, 43 percent at the Intermediate site, and 53 percent at Reference sites). At Seep sites, 19 vireo nests (79 percent) were placed in woody vegetation, and 5 nests (21 percent) were placed in herbaceous vegetation. At Intermediate sites, 25 vireo nests (89 percent) were placed in woody vegetation, and 3 vireo nests (11 percent) were placed in herbaceous vegetation. At Reference sites, 46 vireo nests (98 percent) were placed in woody vegetation, and 1 nest (2 percent) was placed in herbaceous vegetation. Of the nine vireo nests placed in herbaceous vegetation, three were built in non-native plant species (poison hemlock and curly dock [Rumex crispus]).
Table 43.
Host plant species used by Least Bell’s Vireos at Seep, Intermediate, and Reference sites, Marine Corps Base Camp Pendleton, California, 2024.[Numbers in parentheses are proportions of total nests within site types. Abbreviation: —, no nests were found in the plant species]
In 2024, we found that successful nests were placed 0.1 m higher in the host plant than unsuccessful nests at Reference sites, a difference that was statistically significant but not biologically meaningful. Also, successful nests were placed significantly closer to the edge of the host plant (farther from the center) than unsuccessful nests at Reference sites (table 44). Nests were placed significantly higher in the host plant at Reference sites than at the Seep site, and host plants were significantly taller at the Intermediate site than at the Seep site (table 45).
Table 44.
Least Bell’s Vireo nest characteristics and results of Student’s t-tests of successful versus unsuccessful nesting attempts at Seep, Intermediate, and Reference sites, Marine Corps Base Camp Pendleton, California, 2024.[m, meter; n, number of nests in sample (successful, unsuccessful); P, probability that the difference was not significant; t, Student’s t statistic]
Table 45.
Least Bell’s Vireo nest characteristics and results of analysis of variance tests of all nesting attempts among Seep, Intermediate, and Reference sites, Marine Corps Base Camp Pendleton, California, 2024.[F, analysis of variance statistic; m, meter; n, number of nests in sample (Seep, Intermediate, Reference); P, probability that the difference was not significant]
5-year Summary of Vireo Nest Characteristics
Throughout the 5 years of the study, vireos used 24 known plant species for nesting at Seep, Intermediate, and Reference sites. Willows, predominantly red or arroyo, were the most common nest host plant in all sites in all years (57 percent of all nests). Other commonly used plants were mule fat (18 percent of all nests) and elderberry (9 percent of all nests). Ninety-three percent of nests were placed in woody plants (trees, shrubs, or vines), and 3 percent were placed in herbaceous plants. Five percent of nests were placed in non-native plant species, including poison hemlock, salt cedar, curly dock, giant reed, black mustard, and thistle (Cirsium sp.).
We found that the fate of a vireo nest was significantly related to whether the nest host plant was woody or herbaceous, the height of the nest, and the distance from the nest to the outer edge of the vegetation in which the nest was placed (table 46). Successful nests were more likely to be placed in a woody plant than in an herbaceous plant, and successful nests were placed higher and at a greater distance from the edge of the nest clump than unsuccessful nests (table 47).
Table 46.
Best logistic regression model determined by stepwise Akaike’s Information Criterion for small samples (AICc) model evaluation (stepAIC function in the MASS package; Venables and Ripley, 2002) predicting the effect of site type (Seep, Intermediate, or Reference), year, whether the nest host species was native or non-native, whether the nest host species was woody or herbaceous, nest height, host height, distance of the nest from the outer edge of the nest host plant, and distance of the nest from the outer edge of the vegetation clump in which the nest was placed on Least Bell’s Vireo nest fate, Marine Corps Base Camp Pendleton, California, 2020–24.[Non-significant predictors were eliminated in the stepwise process. Abbreviations: P, probability that the difference was not significant; Z-value, test statistic]
Table 47.
Average Least Bell’s Vireo nest height, distance to the outer edge of the vegetation in which the nest was placed, and the proportion of nests placed in woody vegetation by fate of the vireo nest (successful or unsuccessful), Marine Corps Base Camp Pendleton, California, 2020–24.[±, plus or minus]
Discussion
Least Bell’s Vireo numbers have fluctuated throughout the past several years, with relative consistency across several study areas in San Diego County, including MCBCP, the San Luis Rey River, the San Diego River, MCAS, and the Sweetwater Reservoir. The range-wide vireo population gradually increased through the 1980s and 1990s, reaching a peak in 2009–10 before declining to between 50 and 60 percent of this peak by 2017, then increasing in 2018 and again in 2020 to a new peak, then dropping in 2021 and remaining stable through 2024 (B. Jones, independent contractor, unpub. data, 1985; Kus, 1989a, 1989b, 1991a, 1991b, 1993, 1995; Kus and Beck, 1998; Allen and others, 2017, 2018; Ferree and Clark, 2018, 2019, 2020, 2021, 2023; Allen and Kus, 2019, 2020, 2021, 2022; Houston and others, 2021, 2022, 2023, 2024; K. Ferree, San Diego Natural History Museum, written commun., 2024).
Between 2015 and 2018, the population trends at different study areas within the vireo’s range diverged, with vireos increasing on MCBCP from 2015 to 2016 but decreasing on MCAS (likely a result of large-scale vegetation removal in 2014 and 2015, B. Kus, U.S. Geological Survey, unpub. data, 2016) and on the lower San Luis Rey River (also likely a result of habitat modification; Houston and others, 2022), while remaining stable on the middle San Luis Rey River (Allen and others, 2017). In 2017, vireo populations diverged in the opposite direction among sites. By 2018, trends in vireo populations on MCBCP, the lower San Luis Rey River, the middle San Luis Rey (in areas not burned during a December 2017 fire), and at MCAS reconverged with a slight drop in 2019 and then an increase in 2020. Vireo populations in these sites decreased again from 2020 to 2021 (Ferree and Clark, 2021; Allen and Kus, 2022; Houston and others, 2022), then remained relatively stable with small fluctuations through 2023 (Ferree and Clark, 2023; K. Ferree, San Diego Natural History Museum, written commun., 2023; Houston and others, 2023, 2024). The vireo population dropped slightly at MCBCP and remained stable at MCAS in 2024 (K. Ferree, San Diego Natural History Museum, written commun., 2024). Vireos were not monitored on the San Luis Rey River in 2024.
From 2010 to 2017, there was a general decrease in vireo numbers regionwide, which can largely be attributed to drought conditions on the breeding grounds before and during that timeframe. Average bio-year precipitation from 1990 to 1999 at Lake O’Neill was 43 centimeters (cm), the highest 10-year average since measurement began in 1887 (range of 29–43 cm; Office of Water Resources, 2024). From 2000 to 2009, the average precipitation dropped to 34 cm, and from 2010 to 2019, average precipitation dropped again to 33 cm. Several years of low precipitation likely compromised primary productivity, resulting in decreased annual plant and foliage growth. Consequently, foraging substrate and nesting cover for vireos likely decreased in extent and quality, affecting arthropod abundance and ultimately higher trophic level wildlife (vireos) that depend on these resources. Precipitation was 30–92 percent above the 2000–09 average in 2017, 2019, 2020, 2023, and 2024, likely positively affecting breeding productivity in those years. Increases in precipitation in recent years has led to increases in breeding productivity and consequently a generally higher vireo population than during the recent drought years (2011–17).
We expected that precipitation at MCBCP also would affect annual survival of vireos, affecting vireo fitness on the breeding grounds before migration from MCBCP, but this expectation was not supported by our data. Although vireo survival varied significantly by year, other factors that may have affected survival inconsistently across years include habitat degradation (for example, destruction of trees as a result of shothole borer [Euwallacea spp.] infestation) and restoration, wildfire, flooding or other habitat disturbance, and weather events, such as excessive rainfall or temperature extremes on breeding, migratory stop-over, and wintering grounds, disease, parasites, or other factors outside of our knowledge.
After 2 years of lower-than-average accumulation, precipitation in the 2022–23 and 2023–24 bio-years rebounded to well above average. Although all monitoring sites experienced the same level of precipitation, by the end of the breeding season, the Seep and Intermediate sites, which had received varying amounts of supplemental surface water since 2020, had higher soil saturation than the Reference sites. The difference in soil saturation among sites was not observed in 2020 or 2021, but began in 2022, even though 2022 was a drier-than-average year. Seep and Intermediate sites remained wetter than Reference sites through 2024. Cumulative supplementation of surface water at the Seep and Intermediate sites after dry and wet winters likely helped to maintain moist conditions at these sites throughout the year that were not maintained at the Reference sites.
Soil saturation was highest at the Intermediate site, even before seep pumps were installed, and remained highest at the Intermediate site for all 5 years. The Intermediate site was located directly adjacent to and downstream from an area that retained ponded water year-round, except in 2022 when the ponded area was dry by June. Although there was a weak trend in increasing soil saturation from 2020 through 2024 at the Intermediate site, the increase was inconsistent and not significant. Although we expected that an increasing trend in soil saturation at the Intermediate site would have been interrupted by failure of the seep pumps in 2023, soil saturation was higher in 2023 than any other year at the Intermediate site. In 2023 and 2024, most of the precipitation fell in the late winter, and consequently, large areas of the Intermediate and Seep sites were flooded for the better part of the 2023 and 2024 breeding seasons. Flooding had mostly receded by August, when soil saturation data were collected; however, it is likely that high, late winter precipitation swamped the effects of the seep pumps in those years.
Soil saturation significantly increased at the Seep site, where seep pumps were operational for all 5 years of the study. Ultimately, the most well-supported models for soil saturation suggest that precipitation, seep operation, and distance to seep pump were less important than site and time, although it would be premature to discount the effects of these variables in longer-term trends. Assuming that the Seep site was similar to its paired Reference site before seep pumps began operating, conditions at the Seep site support the contention that the seep pumps locally increased soil saturation. If climate conditions continue to become warmer and drier, continued and consistent operation of the seep pumps likely will continue to enhance the desired conditions at the Seep site.
Although we expected that canopy height would increase with increased soil saturation, we did not find this relationship at any site. Similarly, we did not find significant trends in canopy height or vegetation cover above 6 m at the Seep and Reference sites from 2020 through 2024. During the same 5 years, we noticed evidence of shothole borer beetles, including dead and dying willows and cottonwoods along the Santa Margarita River. Beginning in 2022, we encountered an increasing number of fallen riparian trees each year, damaged or killed by beetles, throughout the monitoring sites. Increased shothole borer damage has been linked to wet and nutrient-rich soil (Boland, 2016), conditions that are to be expected near water sources such as the seep pumps. In a related study, MCBCP biologists detected a particularly high density of shothole borer beetles in traps in the southern section of the Seep site (R. Besser, U.S. Marine Corps Base Camp Pendleton, written commun., 2025). In the Tijuana River valley, where shothole borer beetles have caused significant alteration of the riparian vegetation structure in the past 10 years (Boland, 2016), vireos responded with a temporary population decline but then recovered within 1–2 years (Howell and Kus, 2025b). However, Willow Flycatchers are more dependent on vegetation cover in the upper canopy than vireos (Howell and others, 2018), and therefore the loss of taller riparian trees may be more harmful to flycatchers than vireos.
We detected statistically significant differences in vegetation structure associated with soil saturation among the monitoring sites, although less than 15 percent of the variation in vegetation structure was explained by the combination of predictor variables that we selected (soil saturation, site, seep operation, or precipitation). Conversely, greater than 85 percent of the variation in vegetation at the monitoring sites could not be described by our chosen predictors, indicating that there were other ecological processes (including processes that are impossible to quantify) driving most of the variation among the sites. However, the small percent of variation in vegetation that was explained by the predictors described patterns that make sense. Cover of total, woody, and native vegetation in lower height categories increased when the soil was wetter. Vireo breeding productivity increased with increasing vegetation cover near the ground (native and non-native) and cover of native woody species (poison oak, black willow, and sandbar willow). Cover of poison hemlock and black mustard in lower height categories decreased with increasing soil saturation, likely out-competed by native annual plants such as nettle when the soil was wetter. We detected a negative relationship between vireo breeding productivity and taller non-native vegetation, including poison hemlock and black mustard. Cover of sandbar willow and mugwort, typically found on drier margins of riparian corridors, decreased with increasing soil saturation, and cover of black willow, typically found in the interior of riparian corridors, increased with increasing soil saturation. Cover of native woody species (poison oak, black willow, and sandbar willow) were positively associated with vireo breeding productivity.
We also detected differences in vireo breeding productivity and nest site selection among Seep, Intermediate, and Reference sites. Pairs at Seep and Intermediate sites produced fewer fledglings per egg and were less likely to successfully fledge young than pairs at the Reference sites; however, the number of vireo fledglings produced per pair was similar among sites, indicating that Seep and Intermediate pairs expended more effort to produce fledglings than pairs at Reference sites. Nests at Seep sites were placed lower and were in shorter host plants than nests at Intermediate and Reference sites, likely resulting from the Seep site having overall lower tree height than the Intermediate and Reference sites. However, daily nest survival was not significantly different among Seep, Intermediate, and Reference sites, and survival of adults and first-year vireos and adult site fidelity were similar among sites.
The Willow Flycatcher habitat models developed on MCBCP from vegetation data collected in 2001 and 2002 predicted that flycatchers would occupy areas with high total vegetation cover between 3 and 6 m and high poison hemlock and black willow cover below 3 m (Howell and others, 2018). Stinging nettle below 3 m and black willow above 6 m were considered noteworthy, although less important, components of the habitat models (Howell and others, 2018). We determined that soil saturation, site, and early winter precipitation explained a small proportion of the variation in vegetation identified in the flycatcher habitat model, similar to models that described the variation in all vegetation. Increasing soil saturation increased cover of four of the five important vegetation categories described in the flycatcher model: stinging nettle and black willow below 3 m, total cover between 3 and 6 m, and black willow above 6 m. The analysis also identified higher hemlock and stinging nettle cover below 3 m at the Seep site than other sites, although the cover of these two species was lower at the Intermediate site than other sites. Hence, evidence supports a relationship between augmentation of surface water by seep pumps contributing to increasing soil saturation and an increase in suitable flycatcher habitat characteristics at the Seep site. We did not document flycatchers breeding in any of our study sites; however, flycatchers attempted to breed near the third seep site that was not included in our study design (Howell and Kus, 2025b).
In 2024 and previous years, we determined that survival and movement of vireos differed by sex and age. As in many bird populations, males had higher survival than females, likely related to increased reproductive energy expenditure by females (Székely and others, 2014; Payevsky, 2021). Similarly, adult survival typically is higher than juvenile survival, associated with inexperience and dispersal outside of the study area (Beauchamp, 2022). Males demonstrated higher breeding site fidelity than females, likely related to resource familiarity and defense (Kwon and others, 2022). Juveniles moved farther than adults between years, reducing the risk of inbreeding depression and competition among kin (Kwon and others, 2022). For example, in 2024, we continued to find vireos that originated outside of MCBCP moving onto Base and holding territories. One adult male vireo was detected on MCBCP in 2024 for the first time after it was banded as a nestling on the San Luis Rey River in 2022. We did not regularly survey for vireos outside of MCBCP in 2024; however, one male vireo banded as a nestling in 2017 was discovered and recaptured off Base on the Upper Santa Margarita River. Incidental observations of vireos in areas that typically have not been thoroughly surveyed help to enhance our understanding of movement of both adult and dispersing first-year vireos.
Conclusions
The Least Bell’s vireo (Vireo bellii pusillus) population on Marine Corps Base Camp Pendleton, California (MCBCP or Base), has largely tracked the regional, southern California vireo population, with minor exceptions. Continued surveys of vireos on MCBCP will enhance understanding of movements among populations and regional population trends.
This report summarizes 5 years of our study to determine the effects of increased surface water provided by seep pumps in vireo and flycatcher habitat. We determined that soil saturation was higher at the sites where seep pumps have been operating, and that increased soil saturation was associated with increased foliage in the understory and increased cover of black willow. These vegetation associations were minor and did not have a significant effect on vireo breeding productivity; however, the vegetation changes associated with the seep pumps increased the vegetation components associated with optimal flycatcher habitat, with a caveat that the seep pumps also contribute to conditions that promote shothole borer infestation and damage to mature trees (Boland, 2016). Nevertheless, when operated annually, our analyses indicate that seep pumps have enhanced flycatcher habitat.
Although the initial intent of our 5-year study was to compare sites with and without surface-water augmentation over time, many confounding factors arose that introduced complexity, hampering our ability to identify strong patterns. Seep pump operation was not consistent at both sites where seep pumps were installed. One Seep site was changed to an Intermediate site because seep pumps were installed 1 year later than at the other Seep site and because the pumps failed to operate in 2023. Site selection likely also confounded discrimination between sites with and without augmented surface water. The Intermediate site contained substantial areas of ponded water near the seep pump outlets for most of the year, even before seep pumps were installed, and therefore likely only benefited from augmentation of surface water in dry years. Fine-scale soil differences and micro-topography also may have affected soil saturation. Available soil type and topographic data were coarse and could not identify fine-scale features, such as small swales and depressions that collected organic debris or barren sandy berms sculpted by annual water flow that were observed by surveyors. Additionally, vegetation sampling plots were centered on vireo nest locations each year rather than distributed evenly throughout the monitoring sites, and locations changed each year depending on where vireos placed their nests. We found Redundancy Analysis useful in defining relationships among many of these factors; however, some of the unanticipated complexities would be mitigated with some adjustments. Future steps that would help reveal more nuanced relationships associated with surface-water augmentation include obtaining detailed soil and topographic maps, regular maintenance of the seep pumps to ensure their consistent operation, establishing permanent vegetation sampling locations in a systematic design (plans for which have already been adopted), and considering selection of a new, drier seep pump location as an alternative to the naturally wet Intermediate site.
Direct human effects on vireo habitat were documented in 2024, with the implementation of non-native pepperweed (Lepidium latifolium) control in vireo habitat. Vireo biologists were unaware that herbicide was being used until they encountered personnel wearing hazardous material protection actively spraying along our flagged and maintained trails. This situation raises two concerns: (1) the health and safety of field personnel who encounter unexpected and unknown chemical toxins and (2) the effect on endangered birds during breeding season, when they are especially vulnerable to disturbance and contact with toxins. Communication among field personnel and entities within the natural resources management office would reduce the instances of human-related effects on personnel, vireos, and occupied vireo habitat by allowing all participants to understand needs and flexibilities and adjust their activities accordingly. Improved understanding of factors affecting vireos and vireo habitat will provide managers with the tools necessary to maintain a balance between the sometimes-competing land uses on Base, including military activities, recreation, habitat protection, and endangered species management.
References Cited
Allen, L.D., Howell, S.L., and Kus, B.E., 2017, Distribution and abundance of Least Bell’s Vireos (Vireo bellii pusillus) and Southwestern Willow Flycatchers (Empidonax traillii extimus) on the middle San Luis Rey River, San Diego, southern California—2016 data summary: U.S. Geological Survey Data Series 1065, 11 p., accessed January 21, 2025, at https://doi.org/10.3133/ds1065.
Allen, L.D., Howell, S.L., and Kus, B.E., 2018, Distribution and abundance of Least Bell’s Vireos (Vireo bellii pusillus) and Southwestern Willow Flycatchers (Empidonax traillii extimus) on the middle San Luis Rey River, San Diego County, southern California—2017 data summary: U.S. Geological Survey Data Series 1082, 12 p., accessed January 21, 2025, at https://doi.org/10.3133/ds1082.
Allen, L.D., and Kus, B.E., 2019, Distribution and abundance of Least Bell’s Vireos (Vireo bellii pusillus) and Southwestern Willow Flycatchers (Empidonax traillii extimus) on the middle San Luis Rey River, San Diego County, southern California—2018 data summary: U.S. Geological Survey Data Series 1109, 12 p., accessed January 21, 2025, at https://doi.org/10.3133/ds1109.
Allen, L.D., and Kus, B.E., 2020, Distribution and abundance of Least Bell’s Vireos (Vireo bellii pusillus) and Southwestern Willow Flycatchers (Empidonax traillii extimus) on the middle San Luis Rey River, San Diego County, southern California—2019 data summary: U.S. Geological Survey Data Series 1122, 11 p., accessed January 21, 2025, at https://doi.org/10.3133/ds1122.
Allen, L.D., and Kus, B.E., 2021, Distribution and abundance of Least Bell’s Vireos (Vireo bellii pusillus) and Southwestern Willow Flycatchers (Empidonax traillii extimus) on the middle San Luis Rey River, San Diego County, southern California—2020 data summary: U.S. Geological Survey Data Series 1134, 11 p., accessed January 21, 2025, at https://doi.org/10.3133/ds1134.
Allen, L.D., and Kus, B.E., 2022, Distribution and abundance of Least Bell’s Vireos (Vireo bellii pusillus) and Southwestern Willow Flycatchers (Empidonax traillii extimus) on the middle San Luis Rey River, San Diego County, southern California—2021 data summary: U.S. Geological Survey Data Report 1147, 12 p., accessed January 21, 2025, at https://doi.org/10.3133/dr1147.
Beauchamp, G., 2022, Annual apparent survival across species is lower in juvenile than adult birds but has similar ecological correlates: Ibis, v. 165, no. 2, p. 448–457, accessed March 13, 2025, at https://doi.org/10.1111/ibi.13167.
Boland, J.M., 2016, The impact of an invasive ambrosia beetle on the riparian habitats of the Tijuana River Valley, California: PeerJ, v. 4, article e2141, accessed March 24, 2025, at https://doi.org/10.7717/peerj.2141.
Burnham, K.P., and Anderson, D.R., 2002, Model selection and multimodel inference—A practical information-theoretic approach (2d ed.): New York, N.Y., Springer-Verlag, 488 p., accessed January 21, 2025, at https://doi.org/10.1007/b97636.
Cooch, E.G., and White, G.C., eds., 2022, Program MARK—A gentle introduction (22d ed.): Program MARK website, accessed January 21, 2025, at http://www.phidot.org/software/mark/docs/book/.
Dinsmore, S.J., White, G.C., and Knopf, F.L., 2002, Advanced techniques for modeling avian nest survival: Ecology, v. 83, no. 12, p. 3476–3488, accessed January 21, 2025, at https://doi.org/10.1890/0012-9658(2002)083[3476:ATFMAN]2.0.CO;2.
Esri, 2024, ArcGIS field maps release 24.2.2: Redlands, Calif., Esri web page, accessed January 21, 2025, at https://www.esri.com/en-us/arcgis/products/arcgis-field-maps/overview.
Franzreb, K.E., 1989, Ecology and conservation of the endangered Least Bell’s Vireo: U.S. Fish and Wildlife Service, Biological Report, v. 89, no. 1, 17 p., accessed January 21, 2025, at https://apps.dtic.mil/sti/tr/pdf/ADA322886.pdf.
Houston, A., Allen, L.D., Pottinger, R.E., and Kus, B.E., 2021, Least Bell's Vireos and Southwestern Willow Flycatchers at the San Luis Rey flood risk management project area in San Diego County, California—Breeding activities and habitat use—2020 annual report: U.S. Geological Survey Open-File Report 2021–1053, 67 p., accessed January 21, 2025, at https://doi.org/10.3133/ofr20211053.
Houston, A., Allen, L.D., Pottinger, R.E., and Kus, B.E., 2022, Least Bell's Vireos and Southwestern Willow Flycatchers at the San Luis Rey flood risk management project area in San Diego County, California—Breeding activities and habitat use—2021 annual report: U.S. Geological Survey Open-File Report 2022–1012, 79 p., accessed January 21, 2025, at https://doi.org/10.3133/ofr20221012.
Houston, A., Allen, L.D., Mendia, S.M., and Kus, B.E., 2023, Least Bell's Vireos and Southwestern Willow Flycatchers at the San Luis Rey flood risk management project area in San Diego County, California—Breeding activities and habitat use—2022 annual report: U.S. Geological Survey Open-File Report 2023–1040, 74 p., accessed January 21, 2025, at https://doi.org/10.3133/ofr20231040.
Houston, A., Allen, L.D., Mendia, S.M., and Kus, B.E., 2024, Least Bell's Vireos and Southwestern Willow Flycatchers at the San Luis Rey flood risk management project area in San Diego County, California—Breeding activities and habitat use—2023 annual report: U.S. Geological Survey Open-File Report 2024–1040, 77 p., accessed January 21, 2025, at https://doi.org/10.3133/ofr20241040.
Howell, S.L., and Kus, B.E., 2015, Distribution, abundance, and breeding activities of the Southwestern Willow Flycatcher at Marine Corps Base Camp Pendleton, California—2015 annual data summary: Prepared for Assistant Chief of Staff, Environmental Security, U.S. Marine Corps Base Camp Pendleton, U.S. Geological Survey Annual Data Summary, 89 p., accessed January 21, 2025, at https://sdmmp.com/view_article.php?cid=SDMMP_CID_187_659c377866e97.
Howell, S.L., and Kus, B.E., 2016, Distribution, abundance, and breeding activities of the Southwestern Willow Flycatcher at Marine Corps Base Camp Pendleton, California—2016 annual data summary: Prepared for Assistant Chief of Staff, Environmental Security, U.S. Marine Corps Base Camp Pendleton, U.S. Geological Survey Annual Data Summary, 87 p., accessed January 21, 2025, at https://sdmmp.com/view_article.php?cid=SDMMP_CID_187_659c42972d23a.
Howell, S.L., and Kus, B.E., 2017, Distribution, abundance, and breeding activities of the Southwestern Willow Flycatcher at Marine Corps Base Camp Pendleton, California—2017 annual data summary: Prepared for Assistant Chief of Staff, Environmental Security, U.S. Marine Corps Base Camp Pendleton, U.S. Geological Survey Annual Data Summary, 73 p., accessed January 21, 2025, at https://sdmmp.com/view_article.php?cid=SDMMP_CID_187_659c45704d6fb.
Howell, S.L., and Kus, B.E., 2024a, Distribution, abundance, and breeding activities of the Southwestern Willow Flycatcher at Marine Corps Base Camp Pendleton, California—2020 annual report: U.S. Geological Survey Open-File Report 2024–1005, 35 p., accessed January 21, 2025, at https://doi.org/10.3133/ofr20241005.
Howell, S.L., and Kus, B.E., 2024b, Distribution, abundance, and breeding activities of the Southwestern Willow Flycatcher at Marine Corps Base Camp Pendleton, California—2021 annual report: U.S. Geological Survey Open-File Report 2024–1039, 35 p., accessed January 21, 2025, at https://doi.org/10.3133/ofr20241039.
Howell, S.L., and Kus, B.E., 2024c, Distribution, abundance, and breeding activities of the Southwestern Willow Flycatcher at Marine Corps Base Camp Pendleton, California—2022 annual report: U.S. Geological Survey Open-File Report 2023–1080, 27 p., accessed January 21, 2025, at https://doi.org/10.3133/ofr20231080.
Howell, S.L., and Kus, B.E., 2025a, Distribution, abundance, and breeding activities of the Southwestern Willow Flycatcher at Marine Corps Base Camp Pendleton, California—2023 annual report: U.S. Geological Survey Open-File Report 2025–1001, 33 p., accessed June 23, 2025, at https://doi.org/10.3133/ofr20251001.
Howell, S.L., and Kus, B.E., 2025b, Distribution, abundance, and breeding activities of the Southwestern Willow Flycatcher at Marine Corps Base Camp Pendleton, California—2024 annual report: U.S. Geological Survey Open-File Report 2025–1023, 26 p. [Available at https://doi.org/10.3133/ofr20251023.]
Howell, S.L., Lynn, S., and Kus, B.E., 2018, Distribution, abundance, and breeding activities of the Southwestern Willow Flycatcher at Marine Corps Base Camp Pendleton, California—2018 annual data summary: Prepared for Assistant Chief of Staff, Environmental Security, U.S. Marine Corps Base Camp Pendleton, U.S. Geological Survey Restricted File Federal Interagency Report, 106 p.
Howell, S.L., Lynn, S., and Kus, B.E., 2020, Distribution, abundance, and breeding activities of the Southwestern Willow Flycatcher at Marine Corps Base Camp Pendleton, California—2019 annual data summary: Prepared for Assistant Chief of Staff, Environmental Security, U.S. Marine Corps Base Camp Pendleton, U.S. Geological Survey Restricted File Federal Interagency Report.
Kus, B.E., 1989a, Status and management of the Least Bell’s Vireo at the San Luis Rey River, San Diego County, California, 1988: Prepared for the State of California Department of Transportation, District 11, U.S. Geological Survey report, 32 p., accessed January 21, 2025, at https://pubs.usgs.gov/publication/96319.
Kus, B.E., 1989b, Status of the Least Bell’s Vireo at the San Luis Rey River, San Diego County, California, 1989: Prepared for the State of California Department of Transportation, District 11, U.S. Geological Survey report, 15 p., accessed January 21, 2025, at https://pubs.usgs.gov/publication/96327.
Kus, B.E., 1991a, Status of the Least Bell’s Vireo at the San Luis Rey River, San Diego County, California, 1990: Prepared for the State of California Department of Transportation, District 11, U.S. Geological Survey Report, 10 p., accessed January 21, 2025, at https://pubs.usgs.gov/publication/96803.
Kus, B.E., 1991b, Distribution and breeding status of the Least Bell’s Vireo at the San Luis Rey River, San Diego County, California, 1991: Prepared for the State of California Department of Transportation, District 11, U.S. Geological Survey report, 15 p., accessed January 21, 2025, at https://pubs.usgs.gov/publication/96802.
Kus, B.E., 1993, Distribution and breeding status of the Least Bell’s Vireo at the San Luis Rey River, San Diego County, California, 1992–1993: Prepared for the State of California Department of Transportation, District 11, U.S. Geological Survey report, 29 p., accessed January 21, 2025, at https://pubs.usgs.gov/publication/96644.
Kus, B.E., 1995, Distribution and breeding status of the Least Bell’s Vireo at the San Luis Rey River, San Diego County, California, 1994: Prepared for the State of California Department of Transportation, District 11, U.S. Geological Survey report, 25 p., accessed January 21, 2025, at https://pubs.usgs.gov/publication/96591.
Kus, B.E., 1998, Use of restored riparian habitat by the endangered Least Bell’s Vireo (Vireo bellii pusillus): Restoration Ecology, v. 6, no. 1, p. 75–82, accessed January 21, 2025, at https://doi.org/10.1046/j.1526-100x.1998.06110.x.
Kus, B.E., 1999, Impacts of Brown-headed Cowbird parasitism on productivity of the endangered Least Bell’s Vireo: Studies in Avian Biology, no. 18, p. 160–166, accessed January 21, 2025, at https://www.researchgate.net/publication/260363840_Impacts_of_Brown-headed_Cowbird_parasitism_on_productivity_of_the_endangered_Least_Bell's_Vireo.
Kus, B.E., and Beck, P.P., 1998, Distribution and abundance of the Least Bell’s Vireo (Vireo bellii pusillus) and the Southwestern Willow Flycatcher (Empidonax traillii extimus) at selected southern California sites in 1997: Prepared for the California Department of Fish and Game, Sacramento, Calif., U.S. Geological Survey Report, 69 p., accessed January 21, 2025, at https://www.researchgate.net/publication/260364086.
Kus, B.E., and Whitfield, M.J., 2005, Parasitism, productivity, and population growth—Response of Least Bell’s Vireos (Vireo bellii pusillus) and Southwestern Willow Flycatchers (Empidonax traillii extimus) to Cowbird (Molothrus spp.) control, chap. 2 of Ortega, C.P., Chace, J.F., and Peer, B.D., eds., Ornithological Monographs—Management of Cowbirds and their hosts—Balancing science, ethics, and mandates: Washington, DC, American Ornithologists’ Union, no. 57, p. 16–27, accessed January 21, 2025, at https://doi.org/10.2307/40166811.
Kus, B.E., Hopp, S.L., Johnson, R.R., and Brown, B.T., 2020, Bell's Vireo (Vireo bellii), in Poole, A.F., ed., Birds of the World: Ithaca, N.Y., Cornell Lab of Ornithology, accessed January 21, 2025, at https://doi.org/10.2173/bow.belvir.01.
Kwon, E., Valcu, M., Cragnolini, M., Bulla, M., Lyon, B., and Kempenaers, B., 2022, Breeding site fidelity is lower in polygamous shorebirds and male-biased in monogamous species: Behavioral Ecology, v. 33, no. 3, p. 592–605, accessed March 13, 2025, at https://doi.org/10.1093/beheco/arac014.
Laake, J.L., 2013, RMark—An R interface for analysis of capture-recapture data with MARK: Seattle, Wash., National Oceanic and Atmospheric Administration, National Marine Fisheries Service, Alaska Fisheries Science Center, Processed Report 2013-01, 25 p., accessed January 21, 2025, at https://www.researchgate.net/publication/267509042_RMark_an_R_Interface_for_analysis_of_capture-recapture_data_with_MARK.
Lynn, S., Allen, L.D., and Kus, B.E., 2014, Distribution, abundance, and breeding activities of the Least Bell’s Vireo at Marine Corps Base Camp Pendleton, California—2014 annual data summary: Prepared for Assistant Chief of Staff, Environmental Security, U.S. Marine Corps Base Camp Pendleton, U.S. Geological Survey Annual Data Summary, 118 p., accessed January 21, 2025, at https://sdmmp.com/view_article.php?cid=SDMMP_CID_187_659c77c0ba635.
Lynn, S., Allen, L.D., and Kus, B.E., 2015, Distribution, abundance, and breeding activities of the Least Bell’s Vireo at Marine Corps Base Camp Pendleton, California—2015 annual data summary: Prepared for Assistant Chief of Staff, Environmental Security, U.S. Marine Corps Base Camp Pendleton, U.S. Geological Survey Annual Data Summary, 105 p., accessed January 21, 2025, at https://sdmmp.com/view_article.php?cid=SDMMP_CID_187_659c7a6f10976.
Lynn, S., Allen, L.D., and Kus, B.E., 2016, Distribution, abundance, and breeding activities of the Least Bell’s Vireo at Marine Corps Base Camp Pendleton, California—2016 annual data summary: Prepared for Assistant Chief of Staff, Environmental Security, U.S. Marine Corps Base Camp Pendleton, U.S. Geological Survey Annual Data Summary, 107 p., accessed January 21, 2025, at https://sdmmp.com/view_article.php?cid=SDMMP_CID_187_659c7c771dd08.
Lynn, S., Allen, L.D., and Kus, B.E., 2017, Distribution, abundance, and breeding activities of the Least Bell’s Vireo at Marine Corps Base Camp Pendleton, California—2017 annual data summary: Prepared for Assistant Chief of Staff, Environmental Security, U.S. Marine Corps Base Camp Pendleton, U.S. Geological Survey Annual Data Summary, 110 p., accessed January 21, 2025, at https://sdmmp.com/view_article.php?cid=SDMMP_CID_187_659c7fc35fb5d.
Lynn, S., Allen, L.D., and Kus, B.E., 2018, Distribution, abundance, and breeding activities of the Least Bell’s Vireo at Marine Corps Base Camp Pendleton, California—2018 annual data summary: Prepared for Assistant Chief of Staff, Environmental Security, U.S. Marine Corps Base Camp Pendleton, U.S. Geological Survey Restricted File Federal Interagency Report.
Lynn, S., Allen, L.D., and Kus, B.E., 2020, Distribution, abundance, and breeding activities of the Least Bell’s Vireo at Marine Corps Base Camp Pendleton, California—2019 annual data summary: Prepared for Assistant Chief of Staff, Environmental Security, U.S. Marine Corps Base Camp Pendleton, U.S. Geological Survey Restricted File Federal Interagency Report.
Lynn, S., and Kus, B.E., 2010b, Distribution, abundance, and breeding activities of the Least Bell’s Vireo at Marine Corps Base Camp Pendleton, California—2010 annual data summary: Prepared for Assistant Chief of Staff, Environmental Security, U.S. Marine Corps Base Camp Pendleton, U.S. Geological Survey Annual Data Summary, 100 p., accessed January 21, 2025, at https://sdmmp.com/view_article.php?cid=SDMMP_CID_187_659c64ceb460c.
Lynn, S., and Kus, B.E., 2011, Distribution, abundance, and breeding activities of the Least Bell’s Vireo at Marine Corps Base Camp Pendleton, California—2011 annual data summary: Prepared for Assistant Chief of Staff, Environmental Security, U.S. Marine Corps Base Camp Pendleton, U.S. Geological Survey Annual Data Summary, 78 p., accessed January 21, 2025, at https://sdmmp.com/view_article.php?cid=SDMMP_CID_187_659c66c5958a6.
Lynn, S., and Kus, B.E., 2012, Distribution, abundance, and breeding activities of the Least Bell’s Vireo at Marine Corps Base Camp Pendleton, California—2012 annual data summary: Prepared for Assistant Chief of Staff, Environmental Security, U.S. Marine Corps Base Camp Pendleton, U.S. Geological Survey Annual Data Summary, 84 p., accessed January 21, 2025, at https://sdmmp.com/view_article.php?cid=SDMMP_CID_187_659c693778eeb.
Lynn, S., and Kus, B.E., 2013, Distribution, abundance, and breeding activities of the Least Bell’s Vireo at Marine Corps Base Camp Pendleton, California—2013 annual data summary: Prepared for Assistant Chief of Staff, Environmental Security, U.S. Marine Corps Base Camp Pendleton, U.S. Geological Survey Annual Data Summary, 88 p., accessed January 21, 2025, at https://sdmmp.com/view_article.php?cid=SDMMP_CID_187_659c6d80ea94f.
Lynn, S., and Kus, B.E., 2024, Distribution, abundance, breeding activities, and habitat use of the Least Bell's Vireo at Marine Corps Base Camp Pendleton, California—2023 annual report: U.S. Geological Survey Open-File Report 2024–1065, 84 p., accessed January 21, 2025, at https://doi.org/10.3133/ofr20241065.
Lynn, S., Mendia, S., and Kus, B.E., 2023, Monitoring avian productivity and survivorship (MAPS) 6-year summary, Naval Outlying Landing Field, Imperial Beach, southwestern San Diego County, California, 2014–20: U.S. Geological Survey Open-File Report 2023–1055, 68 p., accessed January 21, 2025, at https://doi.org/10.3133/ofr20231055.
Lynn, S., Treadwell, M., and Kus, B.E., 2024a, Distribution, abundance, and breeding activities of the Least Bell’s Vireo at Marine Corps Base Camp Pendleton, California—2020 annual report: U.S. Geological Survey Open-File Report 2024–1009, 66 p., accessed January 21, 2025, at https://doi.org/10.3133/ofr20241009.
Lynn, S., Treadwell, M., and Kus, B.E., 2024b, Distribution, abundance, and breeding activities of the Least Bell’s Vireo at Marine Corps Base Camp Pendleton, California—2021 annual report: U.S. Geological Survey Open-File Report 2023–1096, 68 p., accessed January 21, 2025, at https://doi.org/10.3133/ofr20231096.
Lynn, S., Treadwell, M., and Kus, B.E., 2024c, Distribution, abundance, and breeding activities of the Least Bell’s Vireo at Marine Corps Base Camp Pendleton, California—2022 annual report: U.S. Geological Survey Open-File Report 2024–1006, 82 p., accessed January 21, 2025, at https://doi.org/10.3133/ofr20241006.
Mendia, S.M., and Kus, B.E., 2024, Neotropical migratory bird monitoring study at Marine Corps Base Camp Pendleton, California—2021 annual data summary: U.S. Geological Survey Open-File Report 2024–1024, 69 p., accessed January 21, 2025, at https://doi.org/10.3133/ofr20241024.
Oksanen, J., Simpson, G., Blanchet, F., Kindt, R., Legendre, P., Minchin, P., O’Hara, R., Solymos, P., Stevens, M., Szoecs, E., Wagner, H., Barbour, M., Bedward, M., Bolker, B., Borcard, D., Carvalho, G., Chirico, M., De Caceres, M., Durand, S., Evangelista, H., FitzJohn, R., Friendly, M., Furneaux, B., Hannigan, G., Hill, M., Lahti, L., McGlinn, D., Ouellette, M., Ribeiro Cunha, E., Smith, T., Stier, A., Ter Braak, C., and Weedon, J., 2024, vegan—Community Ecology Package: R package version 2.7-1, accessed August 11, 2025, at https://CRAN.R-project.org/package=vegan.
Payevsky, V.A., 2021, Sex ratio and sex-specific survival in avian populations–A review: Biology Bulletin Reviews, v. 11, no. 3, p. 317–327, accessed March 13, 2025, at https://doi.org/10.1134/S2079086421030099.
R Core Team, 2024, R—A language and environment for statistical computing: Vienna, Austria, R Foundation for Statistical Computing, accessed January 21, 2025, at http://www.R-project.org.
Revelle, W., 2024, psych—Procedures for psychological, psychometric, and personality research: Evanston, Illinois, Northwestern University, R package version 2.4.6, accessed January 21, 2025, at https://CRAN.R-project.org/package=psych.
Riparian Habitat Joint Venture, 2004, The riparian bird conservation plan—A strategy for reversing the decline of riparian associated birds in California: California Partners in Flight, 156 p., accessed January 21, 2025, at http://www.elkhornsloughctp.org/uploads/files/1381276129Riparain%20Joint%20Venture%202004%20Riparian_Bird_Conservation_Plan.pdf.
Rourke, J.W., and Kus, B.E., 2006, Distribution, abundance, and breeding activities of the Least Bell’s Vireo at Marine Corps Base Camp Pendleton, California—2005 annual report: Prepared for Assistant Chief of Staff, Environmental Security, U.S. Marine Corps Base Camp Pendleton, U.S. Geological Survey Annual Report, 66 p.
Rourke, J.W., and Kus, B.E., 2007, Distribution, abundance, and breeding activities of the Least Bell’s Vireo at Marine Corps Base Camp Pendleton, California—2006 annual data summary: Prepared for Assistant Chief of Staff, Environmental Security, U.S. Marine Corps Base Camp Pendleton, U.S. Geological Survey Annual Report, 50 p.
Rourke, J.W., and Kus, B.E., 2008, Distribution, abundance, and breeding activities of the Least Bell’s Vireo at Marine Corps Base Camp Pendleton, California—2007 annual data summary: Prepared for Assistant Chief of Staff, Environmental Security, U.S. Marine Corps Base Camp Pendleton, U.S. Geological Survey Annual Data Summary, 68 p., accessed January 21, 2025, at https://sdmmp.com/view_article.php?cid=CID_ctamanah%40usgs.gov_5751c384040a9.
Rourke, J.W., Kus, B.E., and Whitfield, M.J., 2004, Distribution and abundance of the Southwestern Willow Flycatcher at selected southern California sites in 2001: Sacramento, Calif., Prepared for the California Department of Fish and Game, Species Conservation and Recovery Program Report 2004–05, U.S. Geological Survey Final Report, 60 p., accessed January 21, 2025, at https://www.researchgate.net/publication/311067108.
Sutherland, C., Hare, D., Johnson, P.J., Linden, D.W., Montgomery, R.A., and Droge, E., 2023, Practical advice on variable selection and reporting using Akaike information criterion: Proceedings of the Royal Society B, v. 290, no. 2007, accessed March 19, 2025, at https://doi.org/10.1098/rspb.2023.1261.
Székely, T., Liker, A., Freckleton, R.P., Fichtel, C., and Kappeler, P.M., 2014, Sex-biased survival predicts adult sex ratio variation in wild birds: Proceedings of the Royal Society B, v. 281, no. 1788, accessed March 13, 2025, at https://doi.org/10.1098/rspb.2014.0342.
U.S. Fish and Wildlife Service, 1986, Endangered and threatened wildlife and plants—Determination of endangered status for the Least Bell’s Vireo: Federal Register, v. 51, no. 85, p. 16474–16482. [Available at https://www.govinfo.gov/app/details/FR-1986-05-02.]
U.S. Fish and Wildlife Service, 1998, Draft recovery plan for the Least Bell’s Vireo (Vireo bellii pusillus): Portland, Oreg., U.S. Fish and Wildlife Service, 139 p. [Available at https://ecos.fws.gov/docs/recovery_plan/980506.pdf.]
U.S. Fish and Wildlife Service, 2001, Least Bell’s Vireo survey guidelines: Carlsbad, Calif., U.S. Fish and Wildlife Service, Internal memorandum, 3 p., accessed January 21, 2025, at https://www.fws.gov/media/survey-guidelines-least-bells-vireo.
Venables, W.N., and Ripley, B.D., 2002, Modern applied statistics with S, fourth edition: New York, Springer, 495 p., accessed June 23, 2025, at https://doi.org/10.1007/978-0-387-21706-2.
White, G.C., and Burnham, K.P., 1999, Program MARK—Survival estimation from populations of marked animals: Bird Study, v. 46, no. S1, Supplement, p. S120–S139, accessed January 21, 2025, at https://doi.org/10.1080/00063659909477239.
Appendix 1. Least Bell’s Vireo Survey Areas at Marine Corps Base Camp Pendleton, 2024
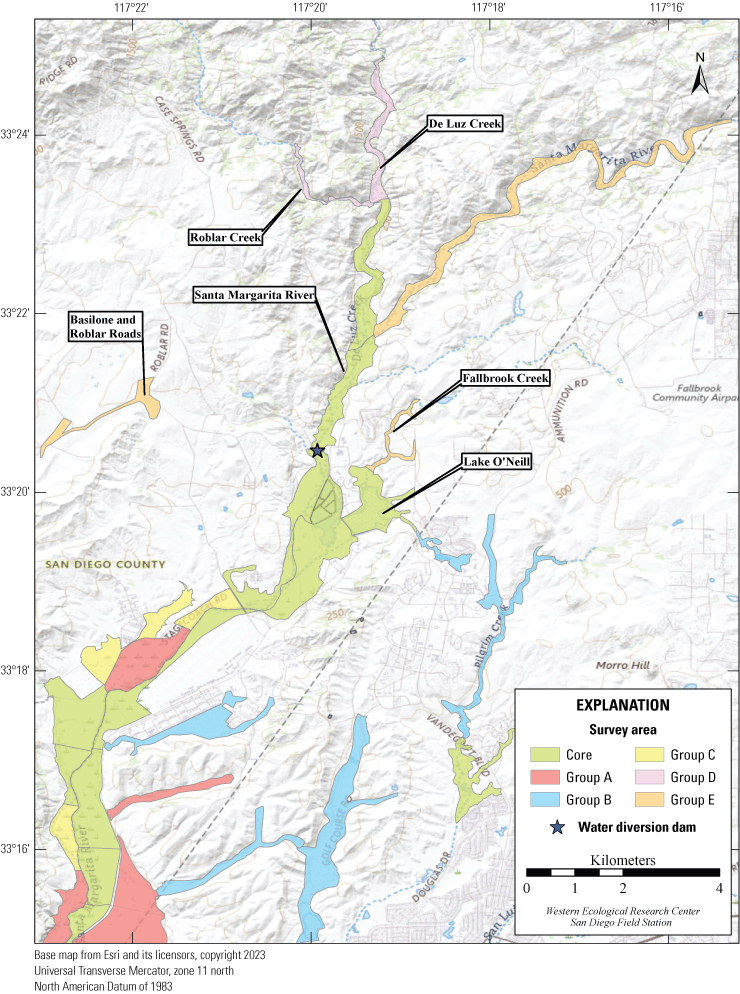
Least Bell’s Vireo survey areas at Marine Corps Base Camp Pendleton, California, 2024: upper Santa Margarita River, Fallbrook Creek, Lake O’Neill, De Luz Creek, Roblar Creek, and Basilone and Roblar Roads. Core areas and Group E areas were surveyed in 2024.
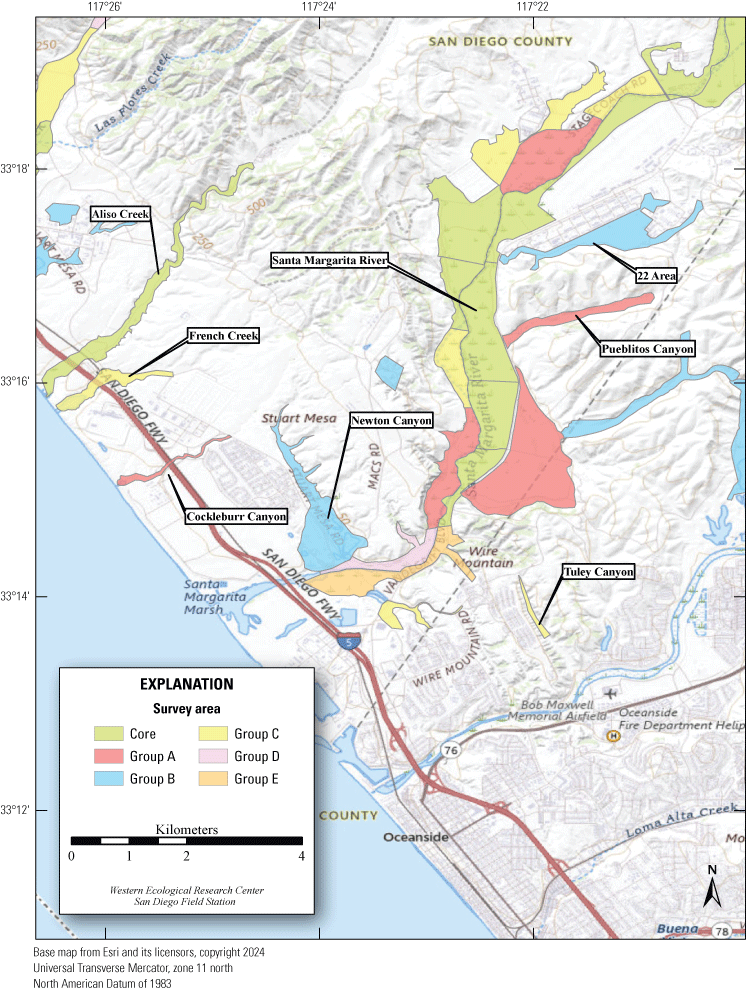
Least Bell’s Vireo survey areas at Marine Corps Base Camp Pendleton, California, 2024: lower Santa Margarita River, 22 Area, Pueblitos Canyon, Tuley Canyon, Newton Canyon, Cockleburr Canyon, French Creek, and Aliso Creek.
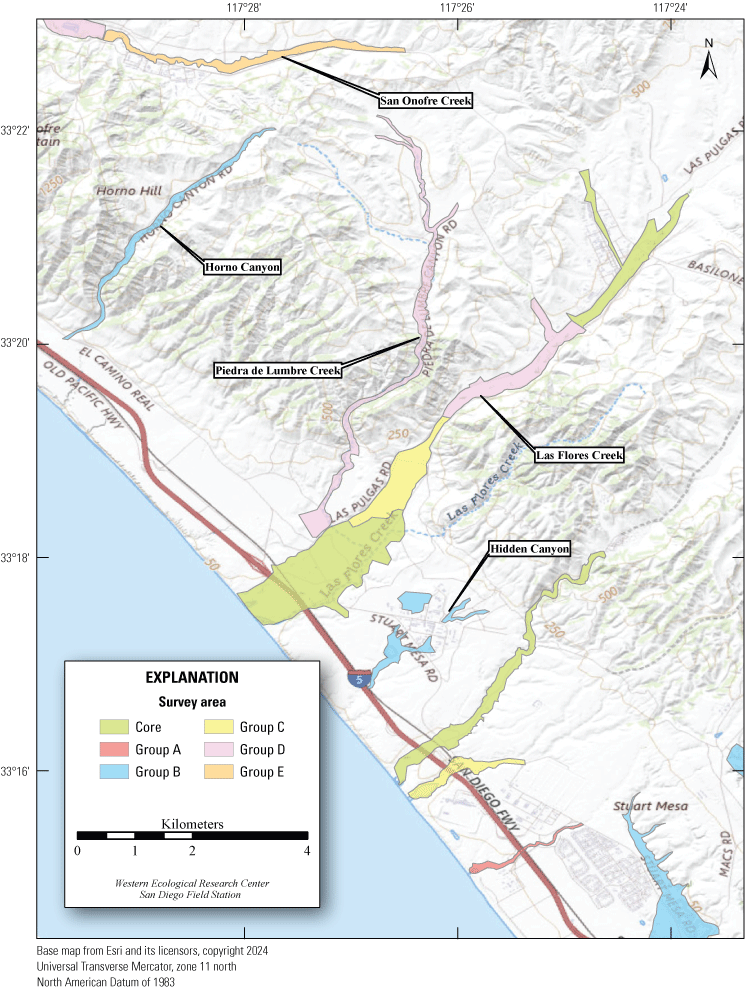
Least Bell’s Vireo survey areas at Marine Corps Base Camp Pendleton, California, 2024: San Onofre Creek South Fork, Horno Canyon, Piedra de Lumbre Creek, Las Flores Creek, and Hidden Canyon.
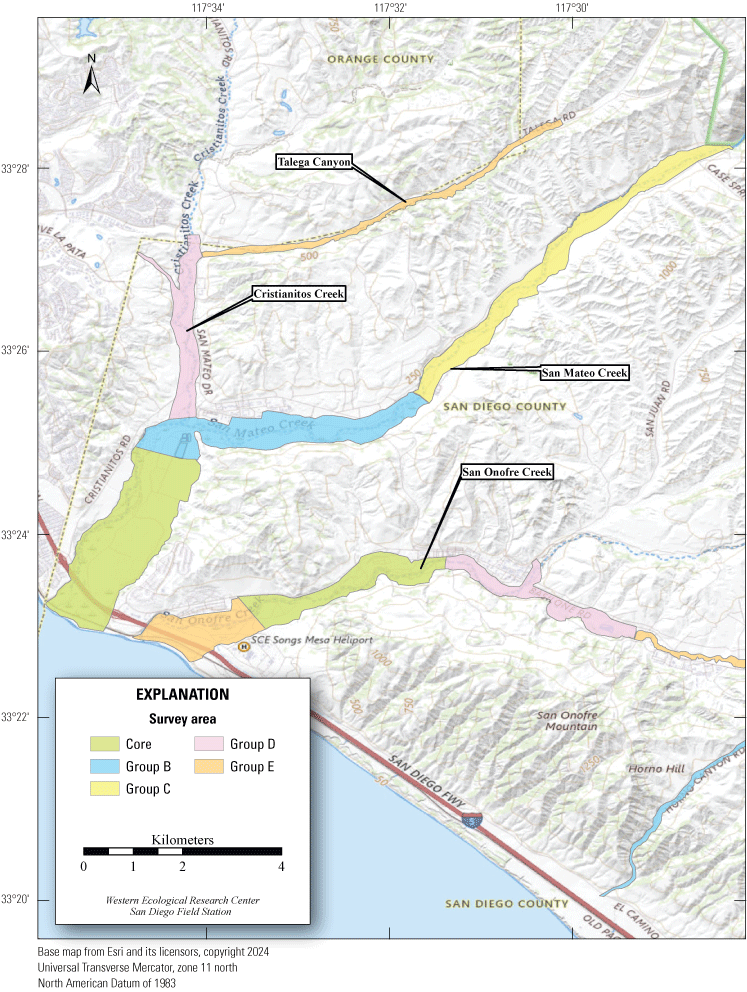
Least Bell’s Vireo survey areas at Marine Corps Base Camp Pendleton, California, 2024: Talega Canyon, Cristianitos Creek, San Mateo Creek, and San Onofre Creek.
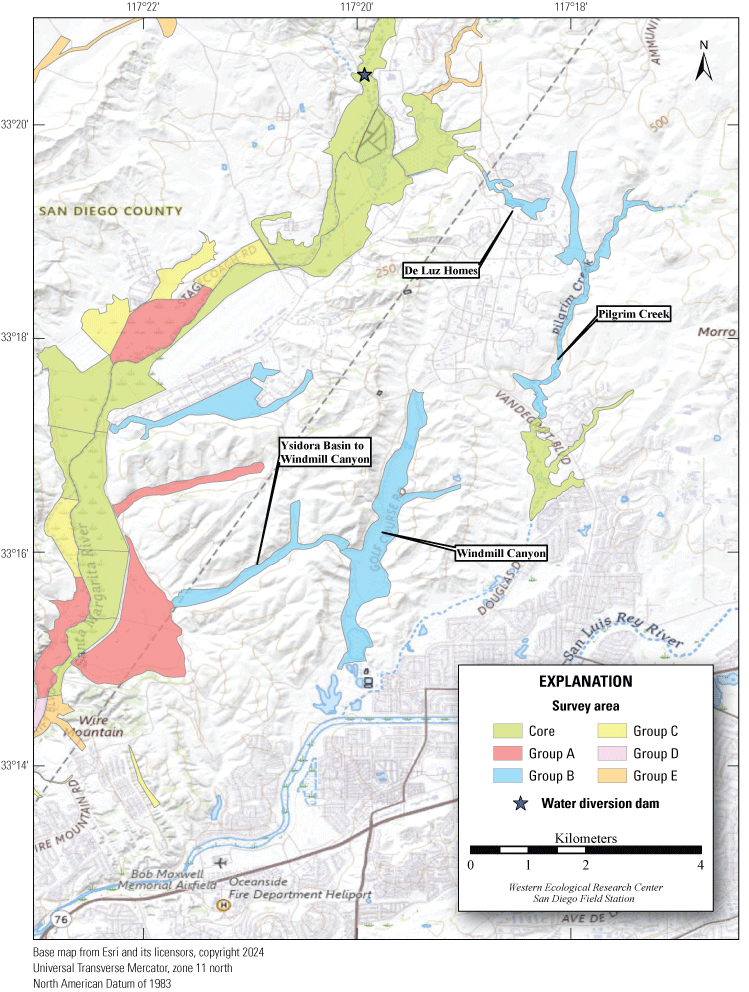
Least Bell’s Vireo survey areas at Marine Corps Base Camp Pendleton, California, 2024: Windmill Canyon, Ysidora Basin to Windmill Canyon, Pilgrim Creek, and De Luz Homes Habitat.
Appendix 2. Vegetation Sampling Locations and Vegetation Sampling Data Sheet, Marine Corps Base Camp Pendleton, California, 2024
Table 2.1.
Vegetation sampling locations, Marine Corps Base Camp Pendleton, California, 2024.[WGS, World Geodetic System of 1984]
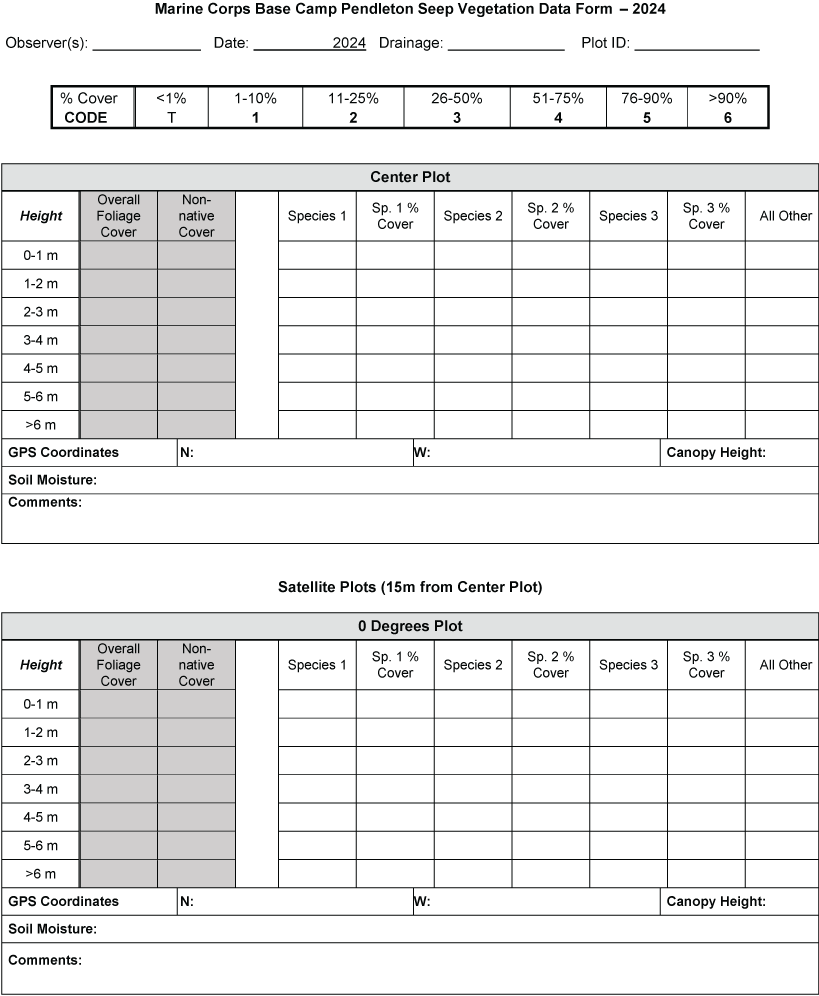
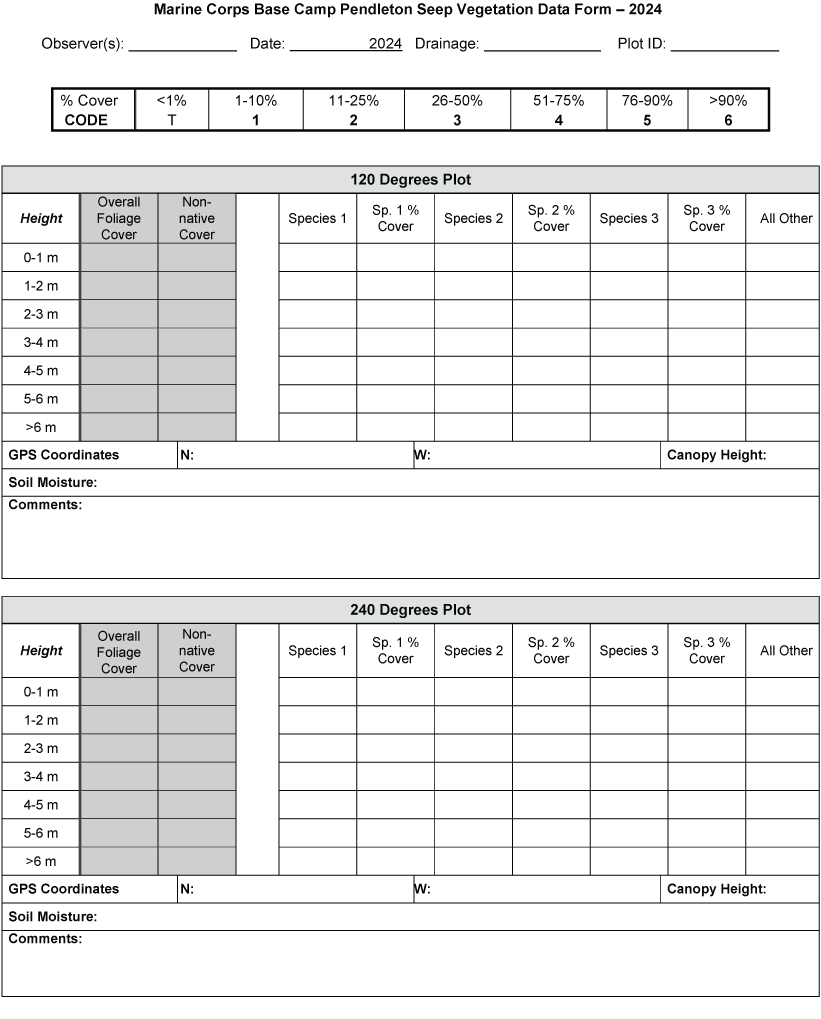
Marine Corps Base Camp Pendleton Seep Vegetation Data Form, 2024.
Appendix 3. Principal Components Analysis Loadings for Vegetation Types and Plant Species at all Height Categories, 2020 through 2024
Table 3.1.
Principal components analysis (PCA) loadings for vegetation variables in 2020.[com, complexity of the component loadings for that variable; h2, communality, or the proportion of each variable’s variance that is shared with other variables; m, meter; u2, uniqueness of the variable’s variance that is not shared with other variables; >, greater than]
Table 3.2.
Principal components analysis (PCA) loadings for vegetation variables in 2021.[com, complexity of the component loadings for that variable; h2, communality, or the proportion of each variable’s variance that is shared with other variables; m, meters; u2, uniqueness of the variable’s variance that is not shared with other variables; >, greater than]
Table 3.3.
Principal components analysis (PCA) loadings for vegetation variables in 2022.[com, complexity of the component loadings for that variable; h2, communality, or the proportion of each variable’s variance that is shared with other variables; m, meters; u2, uniqueness of the variable’s variance that is not shared with other variables; >, greater than;]
Table 3.4.
Principal components analysis (PCA) loadings for vegetation variables in 2023.[com, complexity of the component loadings for that variable; h2, communality, or the proportion of each variable’s variance that is shared with other variables; m, meters; u2, uniqueness of the variable’s variance that is not shared with other variables; >, greater than]
Table 3.5.
Principal components analysis (PCA) loadings for vegetation variables in 2024.[com, complexity of the component loadings for that variable; h2, communality, or the proportion of each variable’s variance that is shared with other variables; m, meters; u2, uniqueness of the variable’s variance that is not shared with other variables; >, greater than]
Table 3.6.
Principal components analysis (PCA) loadings for plant species variables in 2020.[com, complexity of the component loadings for that variable; h2, communality, or the proportion of each variable’s variance that is shared with other variables; m, meters; u2, uniqueness of the variable’s variance that is not shared with other variables; >, greater than]
Table 3.7.
Principal components analysis (PCA) loadings for plant species variables in 2021.[com, complexity of the component loadings for that variable; h2, communality, or the proportion of each variable’s variance that is shared with other variables; m, meters; u2, uniqueness of the variable’s variance that is not shared with other variables; >, greater than]
Table 3.8.
Principal components analysis (PCA) loadings for plant species variables in 2022.[com, complexity of the component loadings for that variable; h2, communality, or the proportion of each variable’s variance that is shared with other variables; m, meters; u2, uniqueness of the variable’s variance that is not shared with other variables; >, greater than]
Table 3.9.
Principal components analysis (PCA) loadings for plant species variables in 2023.[com, complexity of the component loadings for that variable; h2, communality, or the proportion of each variable’s variance that is shared with other variables; m, meters; u2, uniqueness of the variable’s variance that is not shared with other variables; >, greater than]
Table 3.10.
Principal components analysis (PCA) loadings for plant species variables in 2024.[com, complexity of the component loadings for that variable; h2, communality, or the proportion of each variable’s variance that is shared with other variables; m, meters; u2, uniqueness of the variable’s variance that is not shared with other variables; >, greater than]
Appendix 4. Locations of Least Bell’s Vireos at Marine Corps Base Camp Pendleton, California, 2024
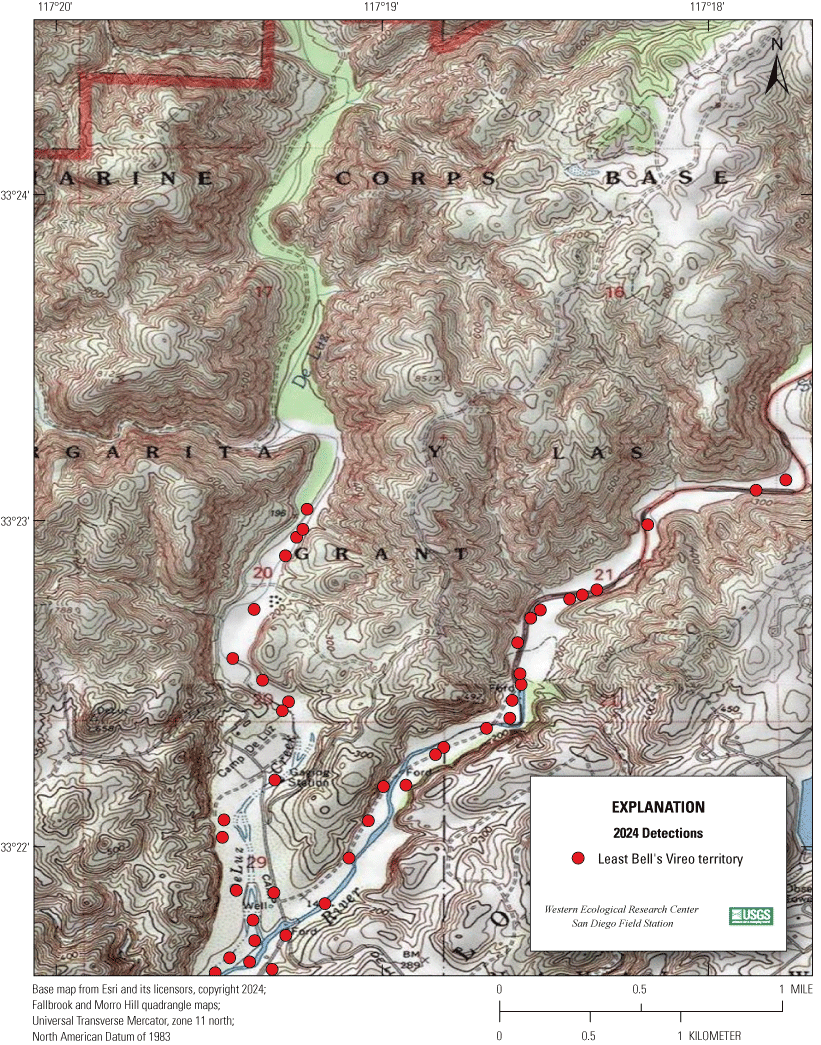
Locations of Least Bell’s Vireos at Marine Corps Base Camp Pendleton, California, 2024: De Luz Creek and Upper Margarita River.
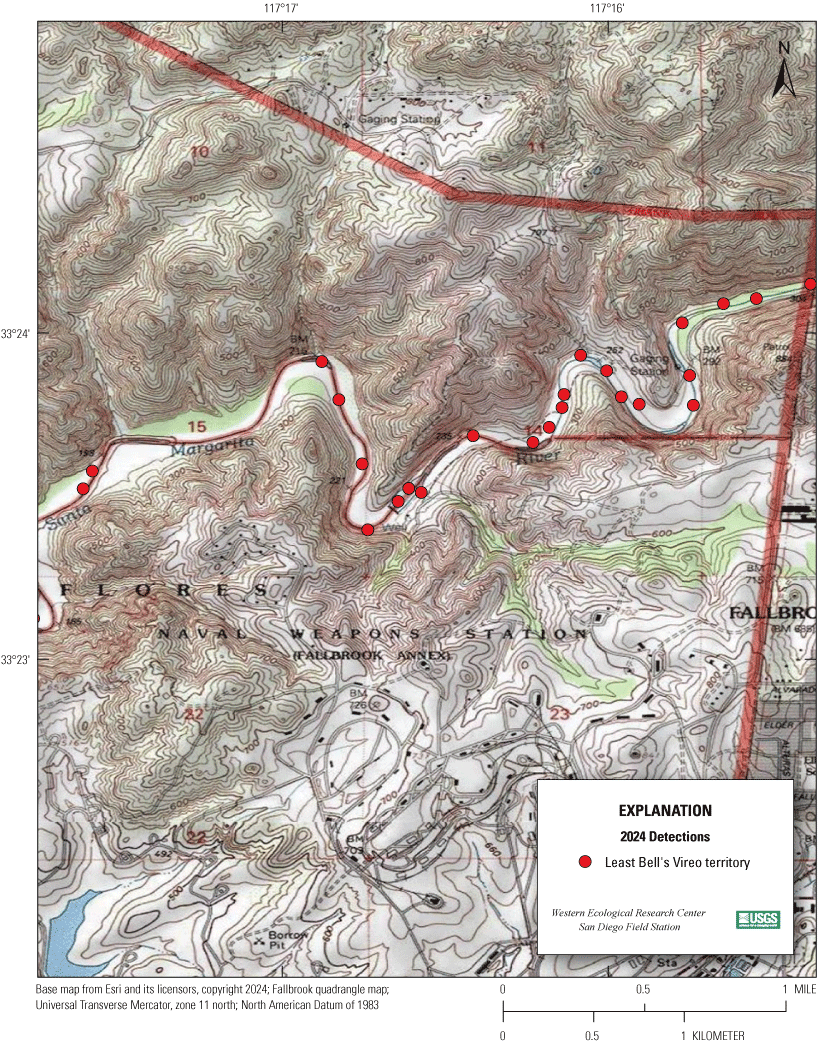
Locations of Least Bell’s Vireos at Marine Corps Base Camp Pendleton, California, 2024: upper Santa Margarita River.
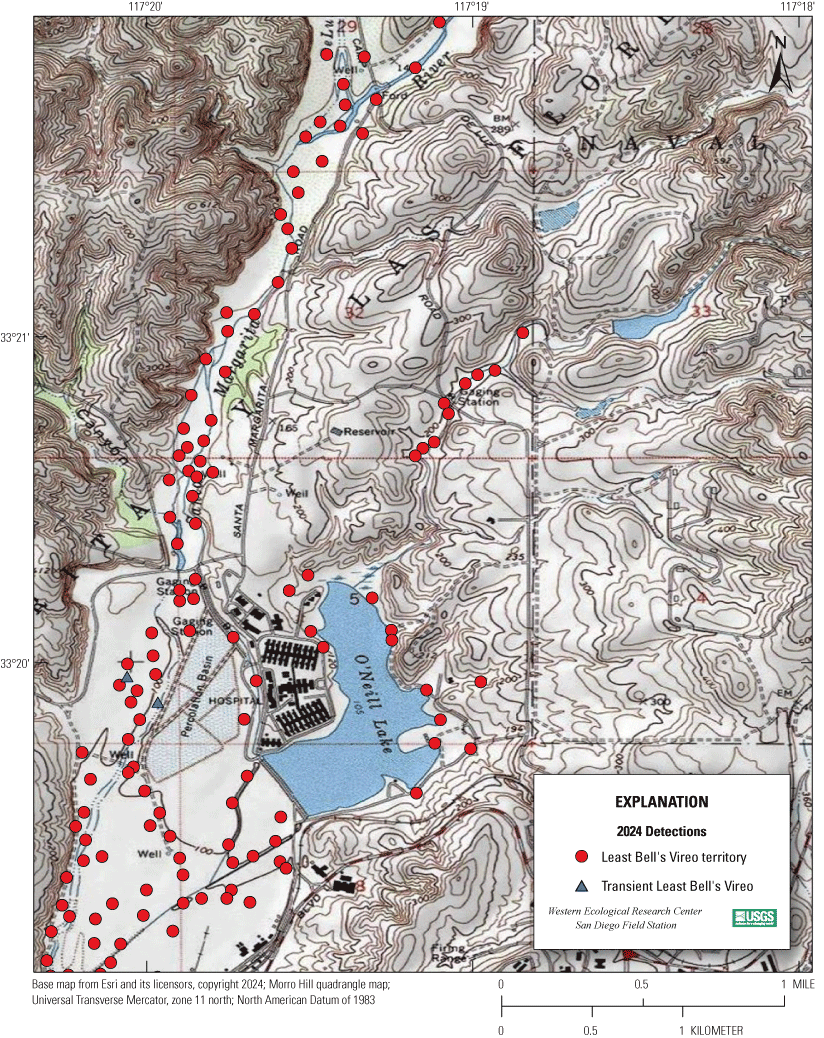
Locations of Least Bell’s Vireos at Marine Corps Base Camp Pendleton, California, 2024: Santa Margarita River, Lake O’Neill, and Fallbrook Creek.
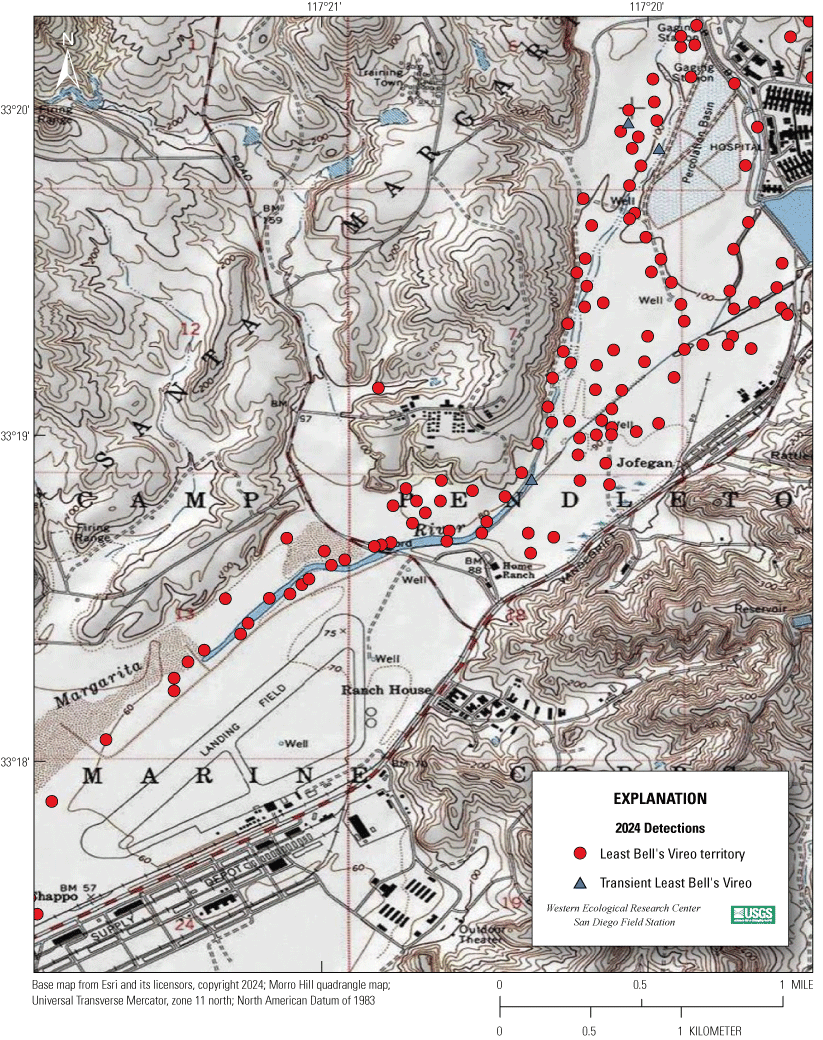
Locations of Least Bell’s Vireos at Marine Corps Base Camp Pendleton, California, 2024: Santa Margarita River.
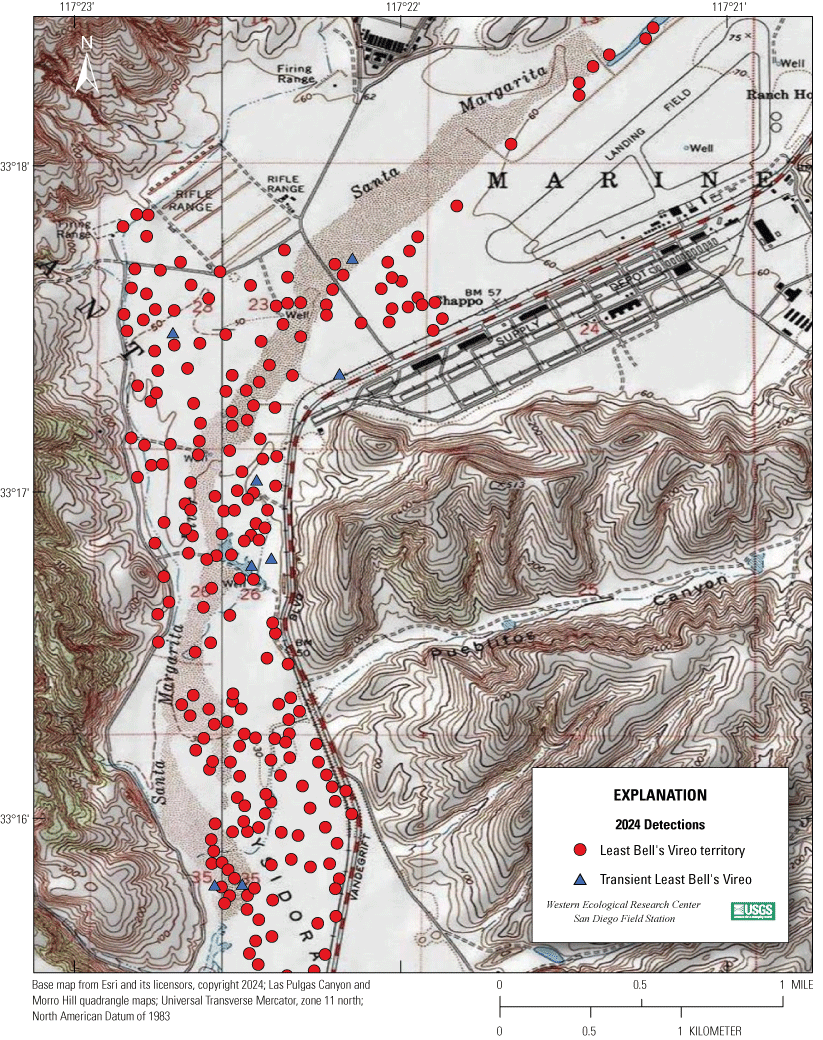
Locations of Least Bell’s Vireos at Marine Corps Base Camp Pendleton, California, 2024: Santa Margarita River.
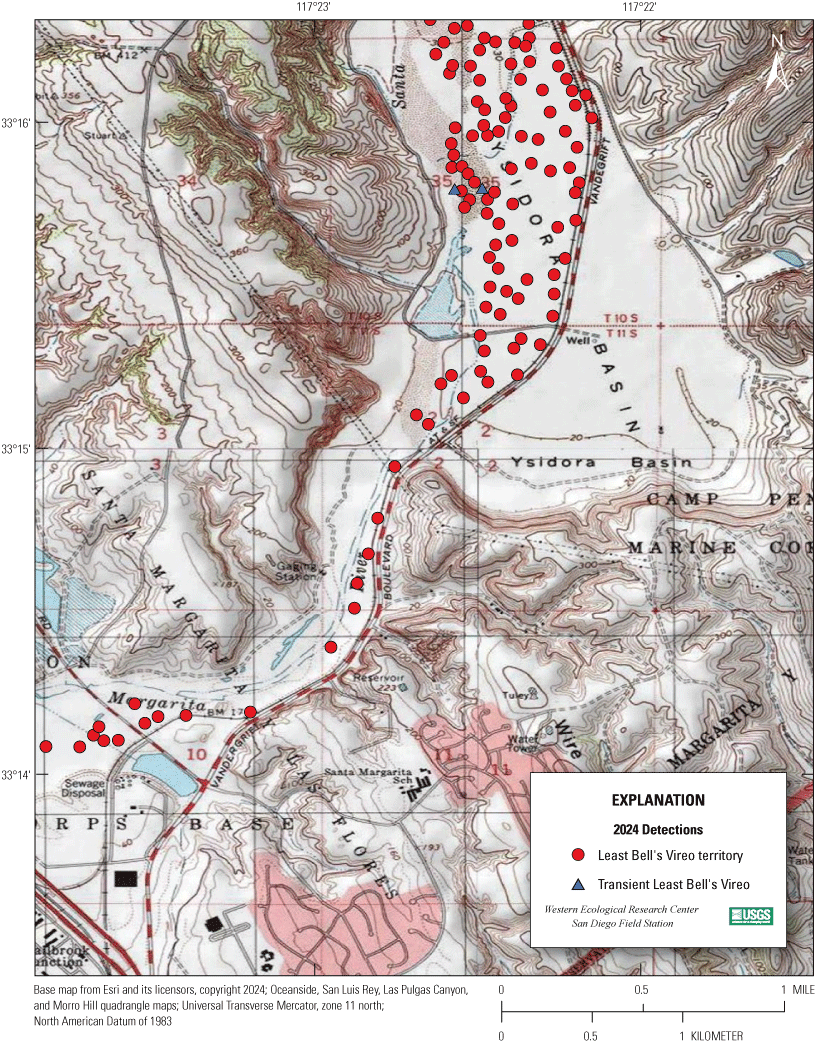
Locations of Least Bell’s Vireos at Marine Corps Base Camp Pendleton, California, 2024: Santa Margarita River.
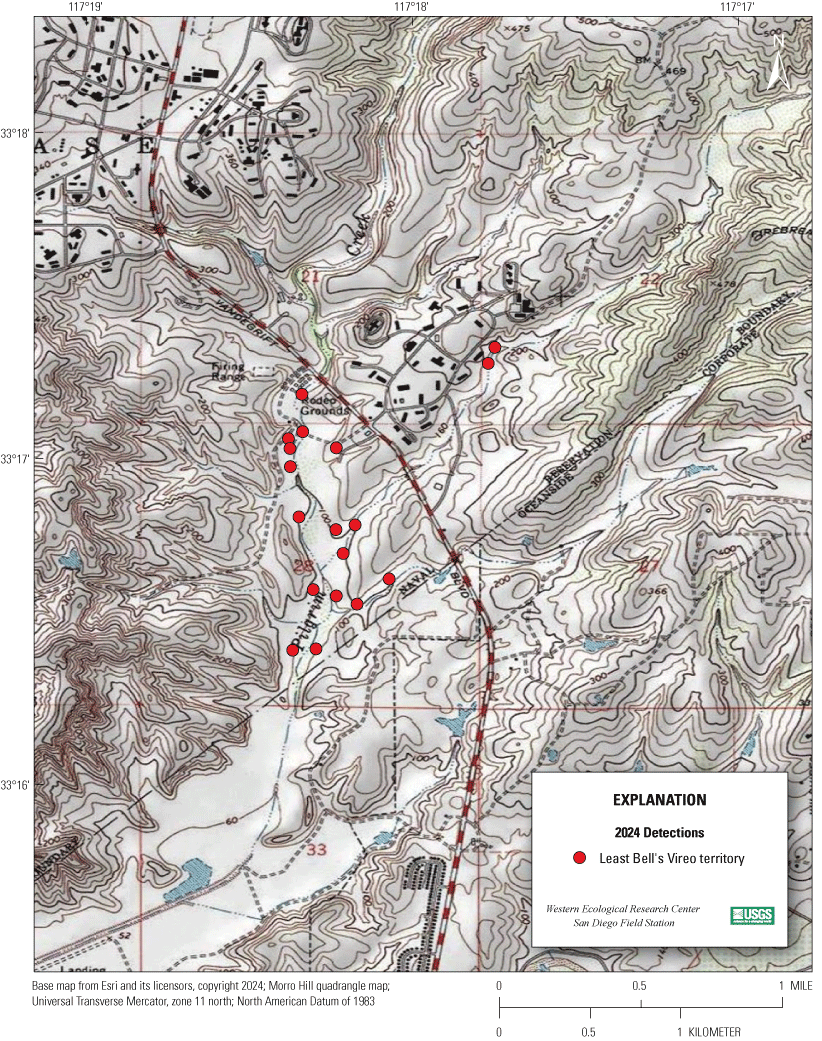
Locations of Least Bell’s Vireos at Marine Corps Base Camp Pendleton, California, 2024: lower Pilgrim Creek.
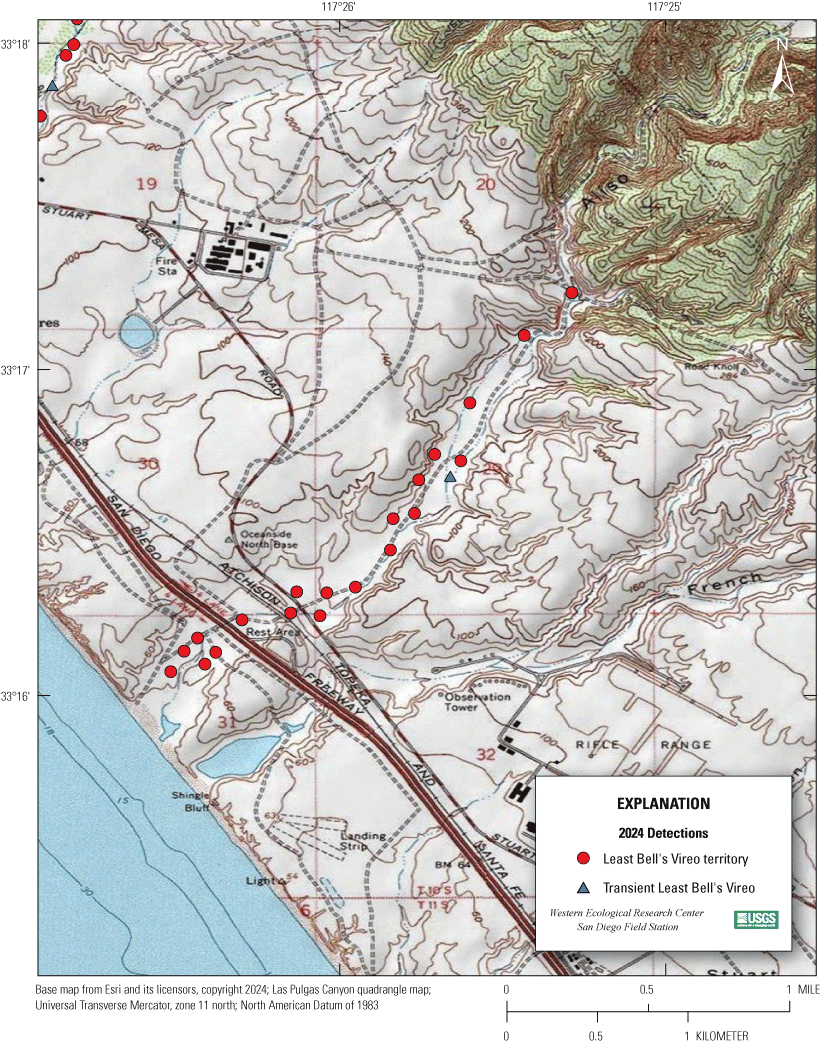
Locations of Least Bell’s Vireos at Marine Corps Base Camp Pendleton, California, 2024: Aliso Creek.
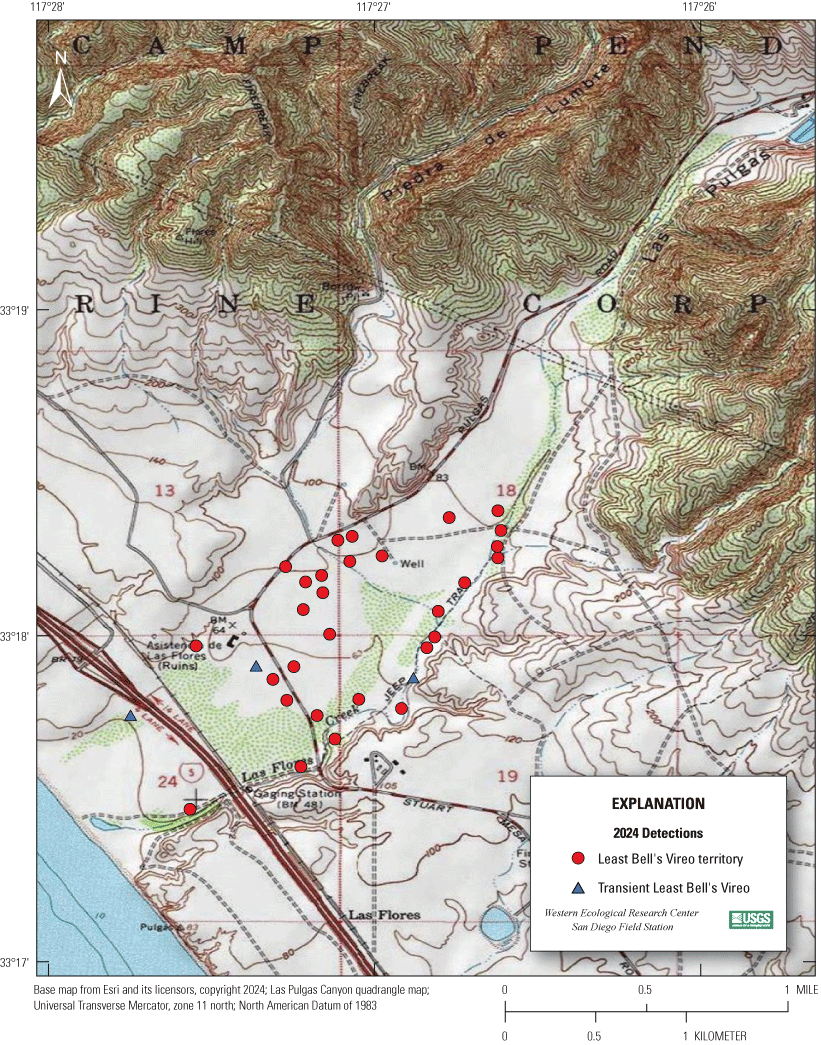
Locations of Least Bell’s Vireos at Marine Corps Base Camp Pendleton, California, 2024: lower Las Flores Creek.
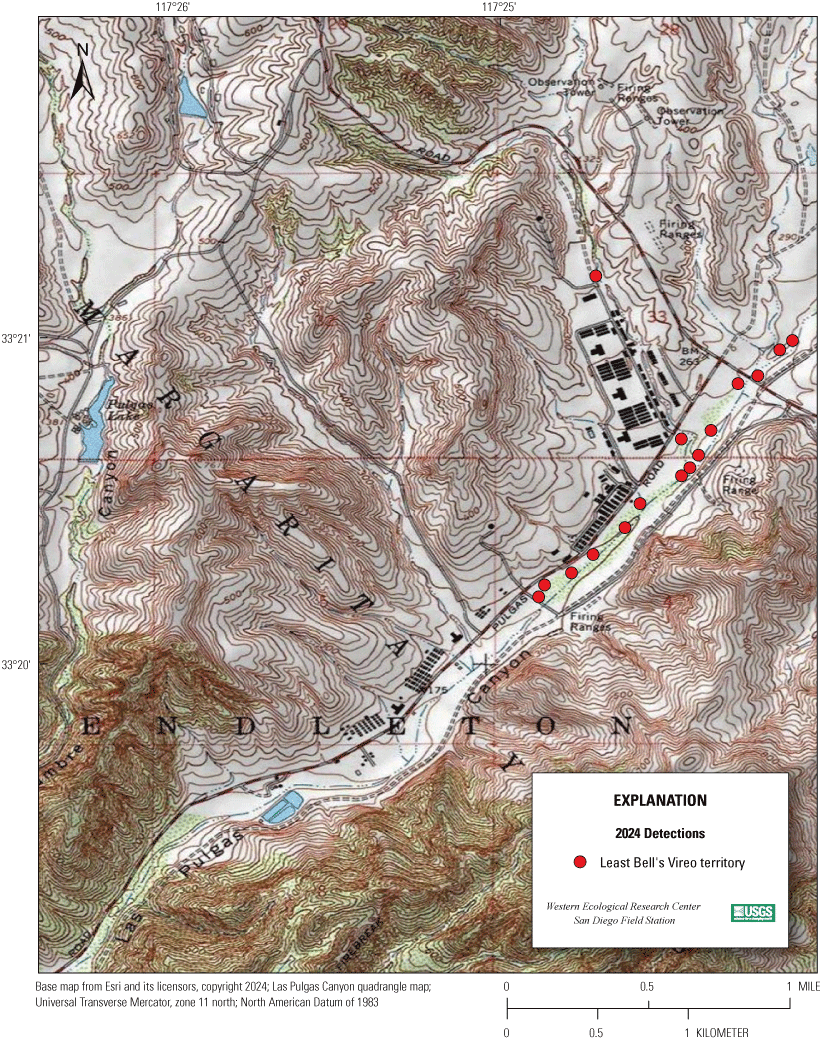
Locations of Least Bell’s Vireos at Marine Corps Base Camp Pendleton, California, 2024: upper Las Flores Creek.
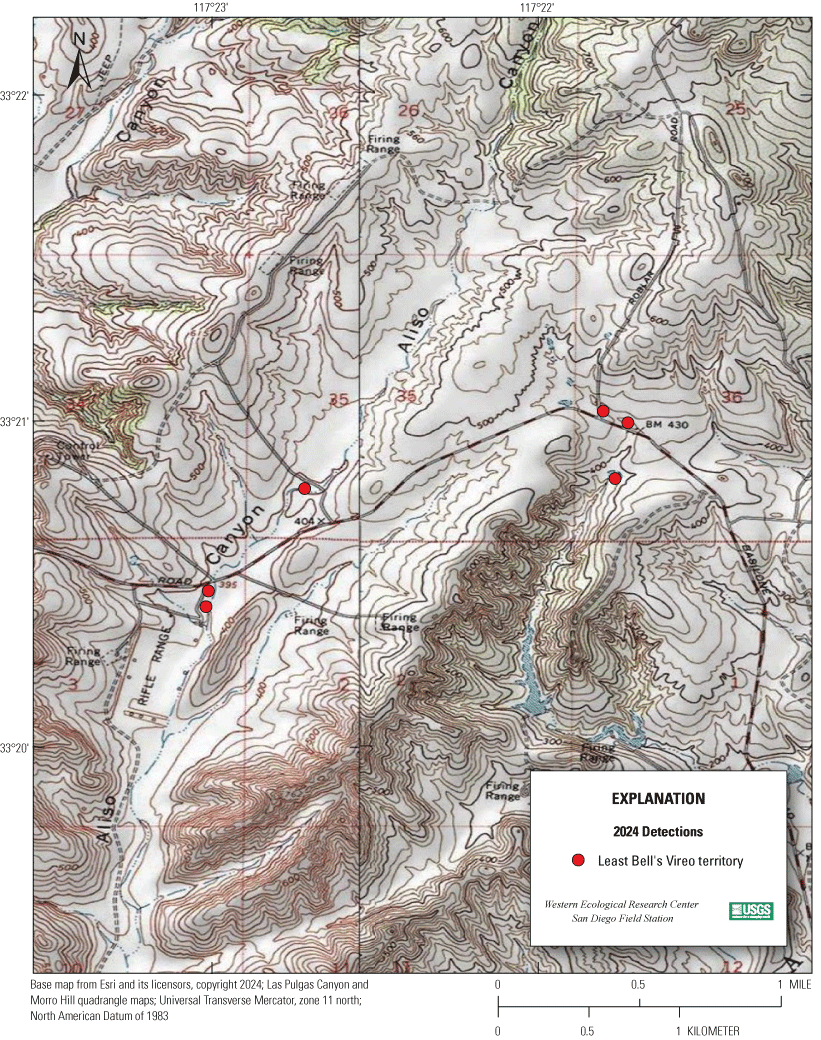
Locations of Least Bell’s Vireos at Marine Corps Base Camp Pendleton, California, 2024: Basilone and Roblar Roads.
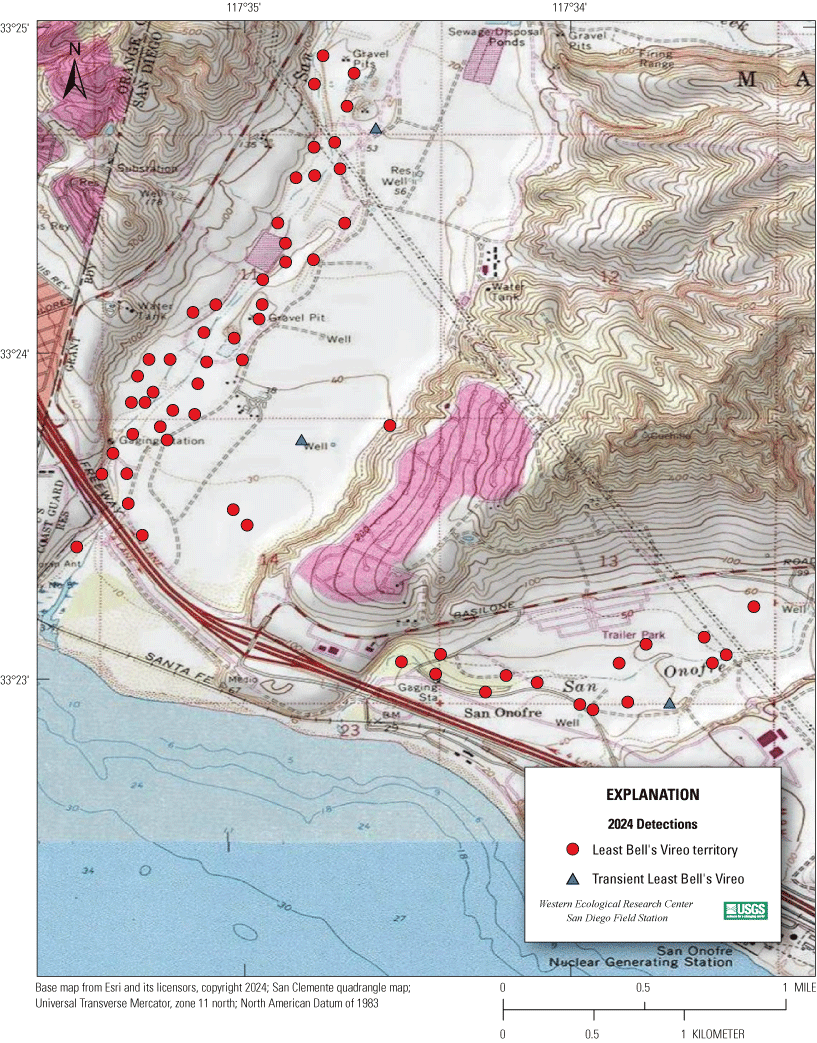
Locations of Least Bell’s Vireos at Marine Corps Base Camp Pendleton, California, 2024: lower San Mateo Creek and lower San Onofre Creek.
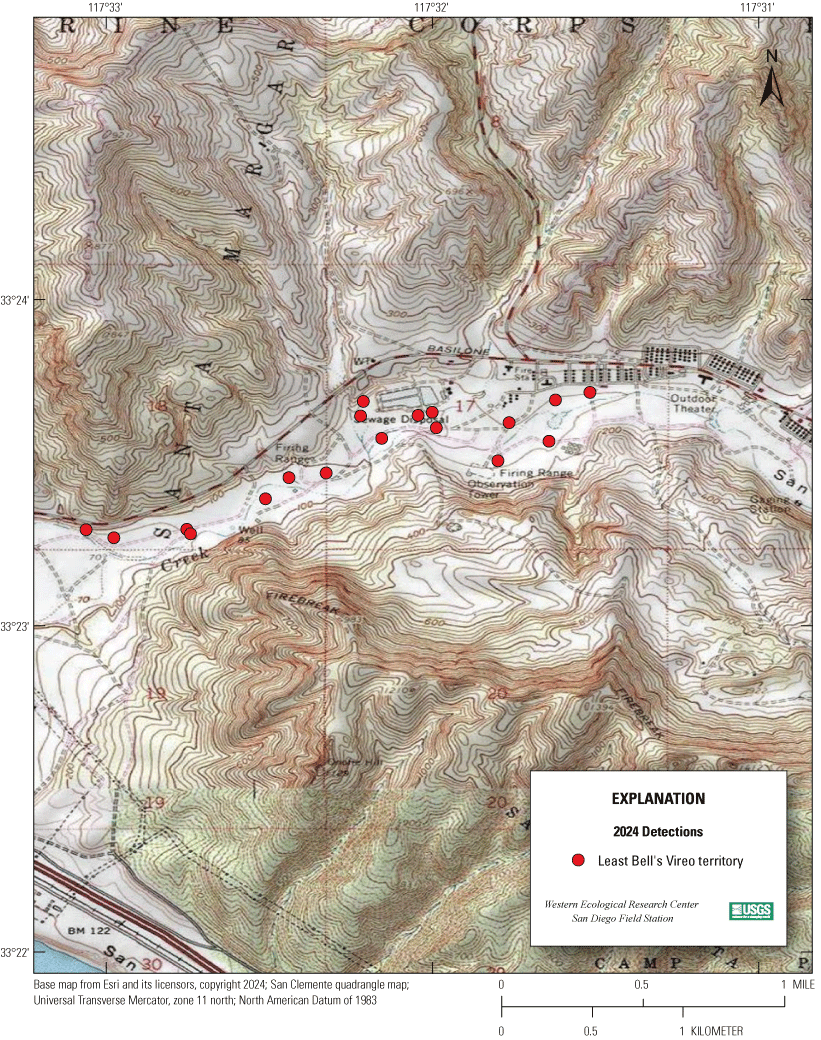
Locations of Least Bell’s Vireos at Marine Corps Base Camp Pendleton, California, 2024: San Onofre Creek (West).
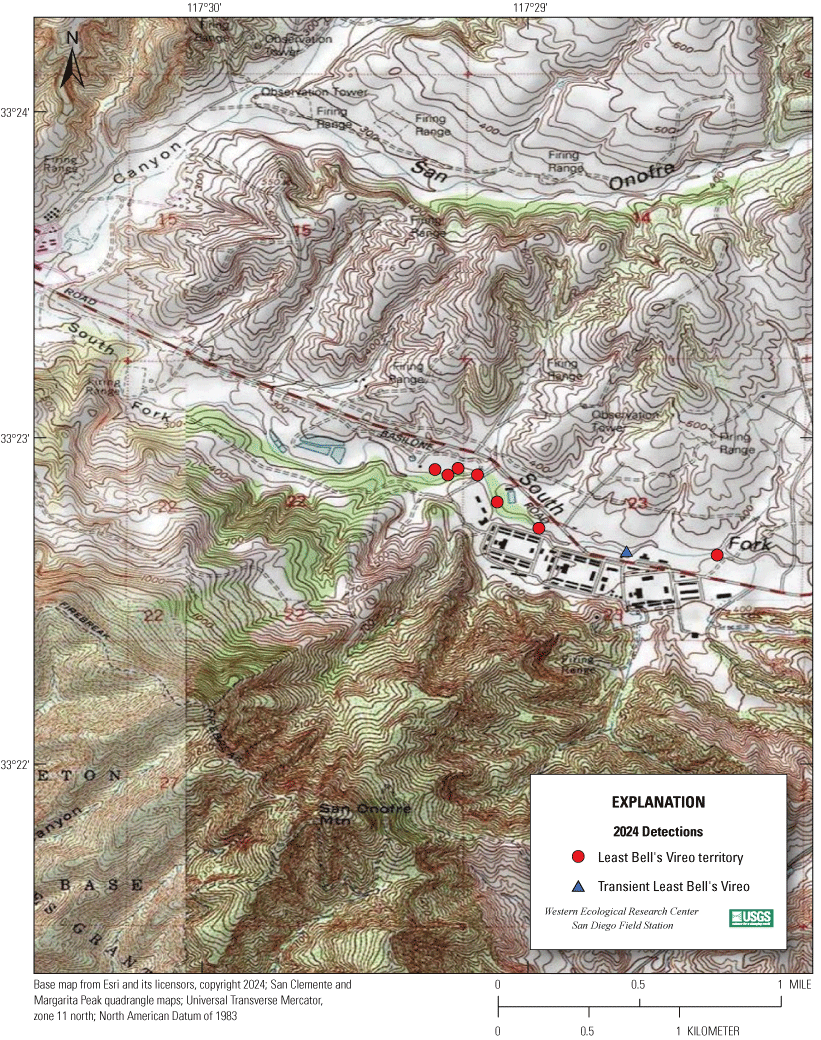
Locations of Least Bell’s Vireos at Marine Corps Base Camp Pendleton, California, 2024: San Onofre Creek.
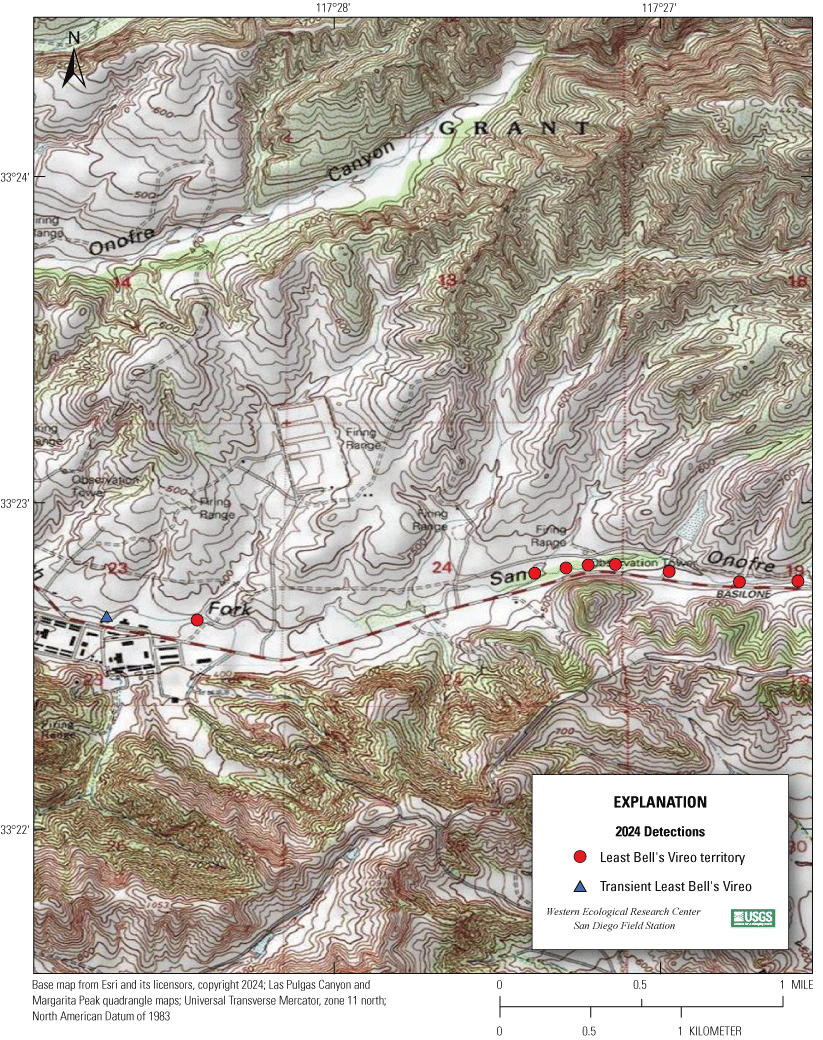
Locations of Least Bell’s Vireos at Marine Corps Base Camp Pendleton, California, 2024: San Onofre Creek (East).
Appendix 5. Number of Territorial Male Least Bell Vireos in Core Survey Areas at Marine Corps Base Camp Pendleton, California, by Drainage, 2005–24
Table 5.1.
Number of territorial male Least Bell’s Vireos in core survey areas at Marine Corps Base Camp Pendleton, California, by drainage, 2005–24.[Number includes only singing males determined to hold territories. Numeric change is the positive or negative change in the number of vireo territories between 2023 and 2024. Percent change is the positive or negative percent change in vireo territories within that drainage from 2023 to 2024]
Appendix 6. Proportion of Lease Bell’s Vireo Territories, Including Areas Occupied by Transients, Dominated or Co-Dominated by Non-Native Vegetation, by Drainage, 2005–24
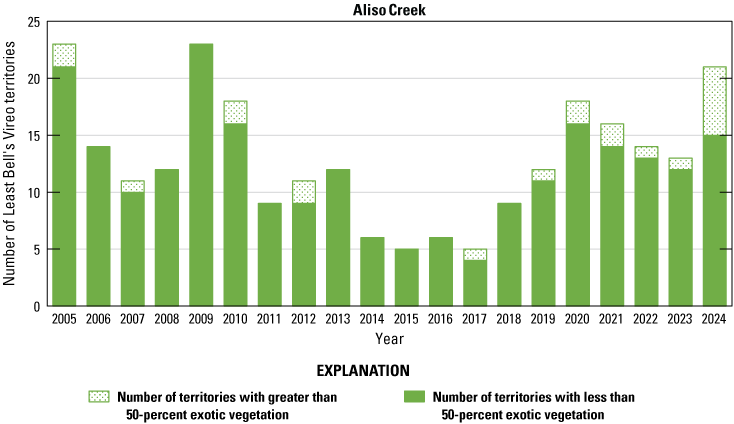
Number of Least Bell’s Vireo territories, including areas occupied by transients, dominated or co-dominated by non-native vegetation at Aliso Creek, 2005–24.
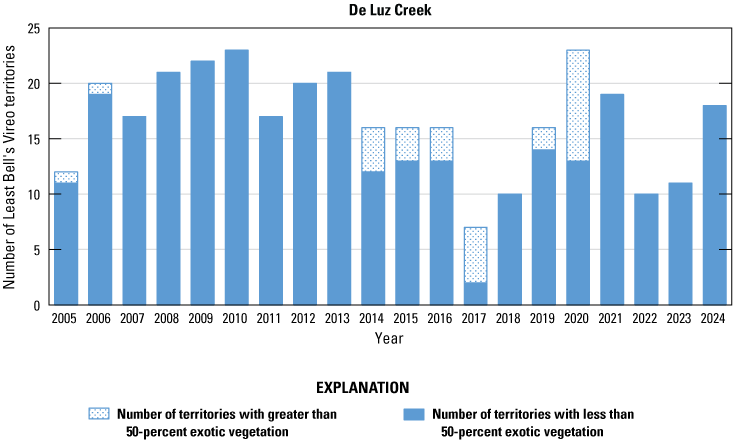
Number of Least Bell’s Vireo territories, including areas occupied by transients, dominated or co-dominated by non-native vegetation at De Luz Creek, 2005–24.
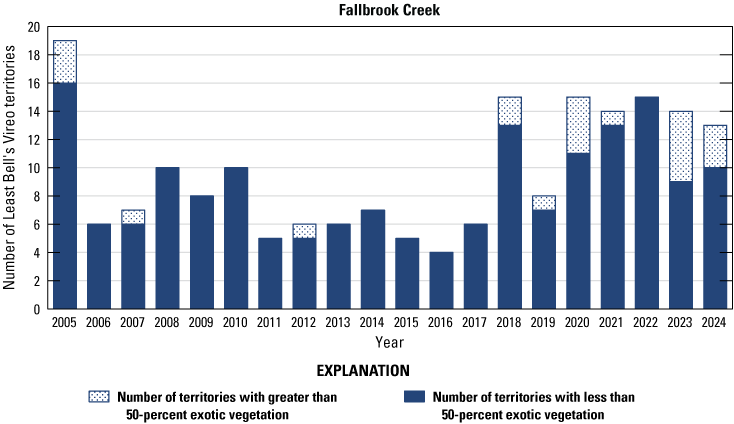
Number of Least Bell’s Vireo territories, including areas occupied by transients, dominated or co-dominated by non-native vegetation at Fallbrook Creek, 2005–24.
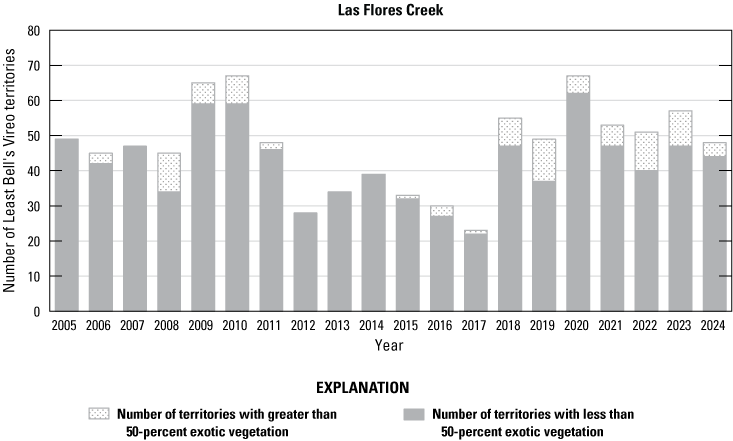
Number of Least Bell’s Vireo territories, including areas occupied by transients, dominated or co-dominated by non-native vegetation at Las Flores Creek, 2005–24.
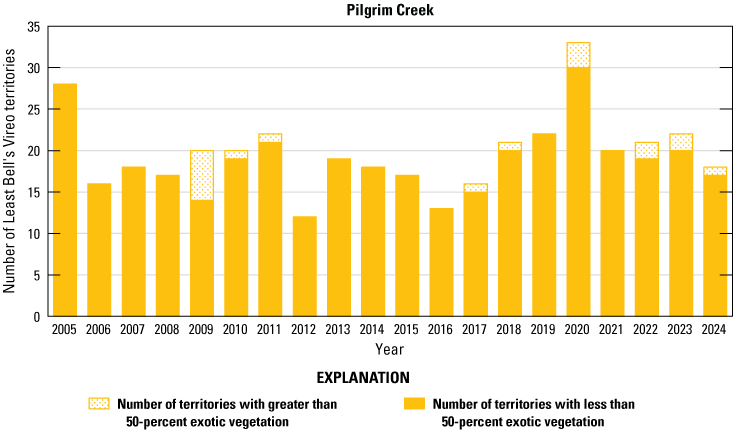
Number of Least Bell’s Vireo territories, including areas occupied by transients, dominated or co-dominated by non-native vegetation at Pilgrim Creek, 2005–24.
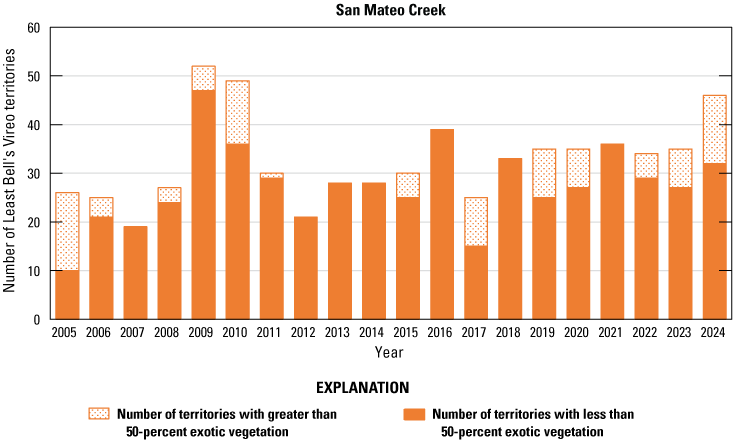
Number of Least Bell’s Vireo territories, including areas occupied by transients, dominated or co-dominated by non-native vegetation at San Mateo Creek, 2005–24.
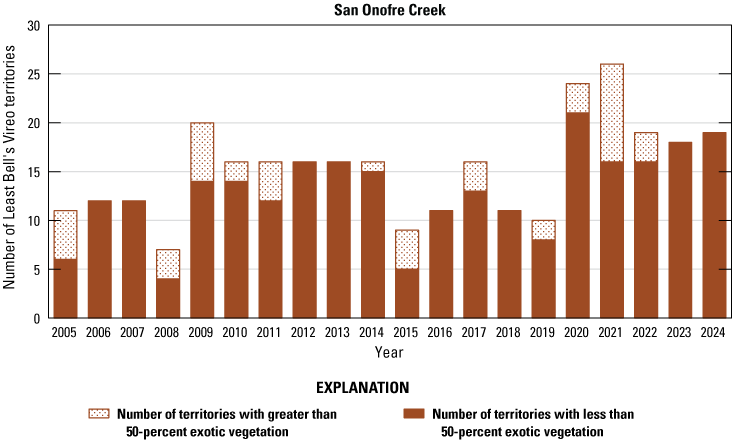
Number of Least Bell’s Vireo territories, including areas occupied by transients, dominated or co-dominated by non-native vegetation at San Onofre Creek, 2005–24.
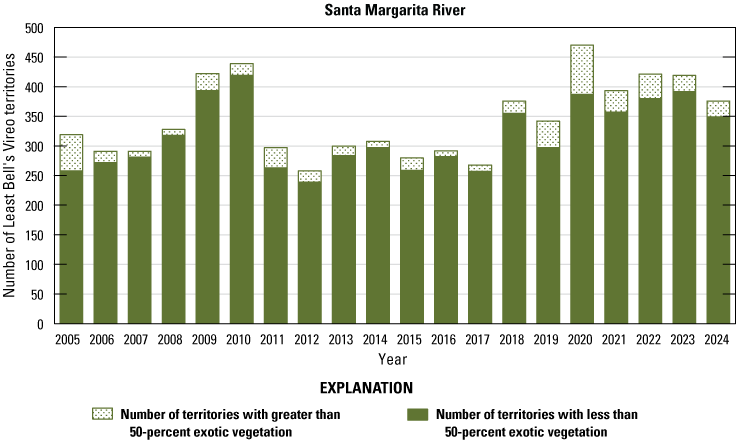
Number of Least Bell’s Vireo territories, including areas occupied by transients, dominated or co-dominated by non-native vegetation at the Santa Margarita River, 2005–24.
Appendix 7. Redundancy Analysis Loadings for Model 1, Vegetation Type Variation
Table 7.1.
Redundancy Analysis (RDA) loadings for vegetation variables on RDA axes 1 through 6.[m, meters; >, greater than]
Table 7.2.
Redundancy Analysis (RDA) loadings for predictor variables on RDA axes 1 through 6.Appendix 8. Redundancy Analysis Loadings for Model 2, Plant Species Variation
Table 8.1.
Redundancy Analysis (RDA) loadings for plant species variables on RDA axes 1 through 5.[m, meters; >, greater than]
Appendix 9. Redundancy Analysis Loadings for Vegetation Variation for Southwestern Willow Flycatcher Habitat
Appendix 10. Banded Least Bell’s Vireos at Marine Corps Base Camp Pendleton, California, 2024
Table 10.1.
Banded Least Bell’s Vireos at Marine Corps Base Camp Pendleton, California, 2024.[Band colors: BKBK, plastic black; BKYE, plastic black-yellow split; BPST, plastic black-pink striped; BYST, plastic black-yellow striped; DGOR, plastic dark green-orange split; DPDP, plastic dark pink; DPWH, plastic dark pink-white split; Mdb, dark blue numbered federal band; Mgo, gold numbered federal band; Msi, silver numbered federal band; ORDG, plastic orange-dark green split; OROR, plastic orange; PUOR, plastic purple-orange split; Pupu, metal purple; PUPU, plastic purple; PUWH, plastic purple-white split; PUYE, plastic purple-yellow split; WHDP, plastic white-dark pink split; WHPU, plastic white-purple split; WHWH, plastic white; YEBK, plastic yellow-black split; YEYE, plastic yellow. Location codes in comments: MAPS, De Luz or Santa Margarita MAPS station; MCAS, Marine Corps Air Station, Camp Pendleton; MCBCP, Marine Corps Base Camp Pendleton; SLR, San Luis Rey River. Abbreviations: —, no bands; ≥, greater than or equal to]
Appendix 11. Between-Year Movement of Adult and Juvenile Least Bell’s Vireos Detected at Marine Corps Base Camp Pendleton, California, 2024
Table 11.1.
Between-year movement of adult and juvenile Least Bell’s Vireos detected at Marine Corps Base Camp Pendleton, California, 2024.[Drainage codes: AL, Aliso Canyon; DL, De Luz Creek; SLR, San Luis Rey River; SMR, Santa Margarita River. Abbreviations: km, kilometer; ≥; greater than or equal to]
Appendix 12. Status and Nesting Activities of Least Bell’s Vireos at Marine Corps Base Camp Pendleton, California, 2024
Table 12.1.
Status and Nesting Activities of Least Bell's Vireos at Marine Corps Base Camp Pendleton, California, 2024.[All territories were fully monitored. Nest Fate: INC, nest not completed; OTH, nest failed with known cause other than predation or parasitism; PRE, nest failure caused by predation; SUC, fledged at least one Least Bell’s Vireo young; UNK, reason for nest failure/abandonment unknown. Abbreviation: —, no data]
Datums
Horizontal coordinate information in text is referenced to the World Geodetic System of 1984 (WGS 84).
Horizontal coordinate information in mapped figures is referenced to the North American Datum of 1983 (NAD 83).
Abbreviations
AICc
Akaike’s Information Criterion for small sample sizes
ANOVA
analysis of variance
DSR
daily survival rate
GLM
generalized linear model
GPS
global positioning system
MAPS
monitoring avian productivity and survivorship
MCAS
Marine Corps Air Station, Camp Pendleton
MCBCP
Marine Corps Base Camp Pendleton
PCA
principal components analysis
RDA
Redundancy Analysis
SWFL
Southwestern Willow Flycatcher
R 2
coefficient of determination in linear regression
ρ
Spearman’s rank correlations
For more information concerning the research in this report, contact the
Director, Western Ecological Research Center
U.S. Geological Survey
3020 State University Drive East
Sacramento, California 95819
https://www.usgs.gov/centers/werc
Publishing support provided by the Science Publishing Network,
Sacramento Publishing Service Center
Disclaimers
Any use of trade, firm, or product names is for descriptive purposes only and does not imply endorsement by the U.S. Government.
Although this information product, for the most part, is in the public domain, it also may contain copyrighted materials as noted in the text. Permission to reproduce copyrighted items must be secured from the copyright owner.
Suggested Citation
Lynn, S., Houston, A., Kus, B.E., and Mendia, S.M., 2026, Distribution, abundance, breeding activities, and habitat use of the Least Bell's Vireo at Marine Corps Base Camp Pendleton, California—2020–24 summary report: U.S. Geological Survey Open-File Report 2025–1057, 128 p., https://doi.org/10.3133/ofr20251057.
ISSN: 2331-1258 (online)
Study Area
| Publication type | Report |
|---|---|
| Publication Subtype | USGS Numbered Series |
| Title | Distribution, abundance, breeding activities, and habitat use of the Least Bell's Vireo at Marine Corps Base Camp Pendleton, California—2020–24 summary report |
| Series title | Open-File Report |
| Series number | 2025-1057 |
| DOI | 10.3133/ofr20251057 |
| Publication Date | January 21, 2026 |
| Year Published | 2026 |
| Language | English |
| Publisher | U.S. Geological Survey |
| Publisher location | Reston, VA |
| Contributing office(s) | Western Ecological Research Center |
| Description | xii, 128 p. |
| Country | United States |
| State | California |
| Other Geospatial | Marine Corps Base Camp Pendleton |
| Online Only (Y/N) | Y |