

Computation of Regional Groundwater Budgets for the Virginia Coastal Plain Aquifer System
Links
- Document: Report (6.3 MB pdf) , HTML , XML
- Data Release: USGS data release - Input and output files from the Zonebudget program used with MODFLOW models to compute regional groundwater budgets for the Virginia Coastal Plain aquifer system
- NGMDB Index Page: National Geologic Map Database Index Page (html)
- Superseded Publications:
- Download citation as: RIS | Dublin Core
Acknowledgments
The authors acknowledge the support and assistance of Brian J. Campbell, Dallin S. Walker, and Wesley B. Myers of the Virginia Department of Environmental Quality for their input, discussion of technical material, and review comments, all of which contributed to the successful completion of this project and report. The authors thank Wesley O. Zell and Alex R. Fiore of the U.S. Geological Survey for providing technical reviews of the report contents, and Trisha R. Zalesak for assistance in preparing the report illustrations.
Abstract
Computation of detailed groundwater flow budgets for subdivisions of the Virginia Coastal Plain aquifer system has enabled quantification and more thorough understanding of groundwater flow within this important water resource. A zone budget analysis based on previously published groundwater models of the Virginia Coastal Plain and Virginia Eastern Shore indicates that groundwater conditions vary substantially throughout the Coastal Plain aquifer system because of local variations in hydrogeology and historical and ongoing variations in groundwater use and management. Decades of substantial groundwater withdrawal from the Coastal Plain aquifer system have altered groundwater flow from predevelopment conditions. Rates of sustainable withdrawal are limited because the downward groundwater flow rate into confined aquifers is a relatively small part of the total groundwater budget for the aquifer system compared to the rate of recharge at the land surface.
Analyses of groundwater budgets from the Virginia Coastal Plain model indicate that groundwater flow is generally outward from the surficial aquifer to rivers and coastal waterbodies and downward through a series of underlying aquifers and confining units to the Potomac aquifer, which is the deepest aquifer and the source of most groundwater withdrawals. Downward flow into the Potomac aquifer is estimated to be only 7 percent of total net precipitation-derived net recharge at the land surface but makes up about 66 percent of inflow to the aquifer in Virginia, with much of the remaining inflow occurring laterally from outside of defined groundwater budget regions in Virginia. For several decades prior to 2010, high rates of withdrawal from the Potomac aquifer resulted in substantial decline in groundwater storage in the aquifer and in most overlying aquifers and confining units. From 2010 to 2023, rates of withdrawal substantially lower than the historical maximum resulted in small net increases in groundwater storage in the confined aquifer system for most regions of the Virginia Coastal Plain. Nevertheless, for the same period, groundwater storage for the entire model domain continues to incrementally decline, indicating that storage recovery in Virginia is offset by a continued decrease in storage in areas beneath the Chesapeake Bay or adjacent areas of Maryland and North Carolina. Withdrawals from the Potomac aquifer have induced substantial downward flow which is a large part of groundwater budgets for confined aquifers such as the Potomac. For the most recent simulated conditions (2023) downward groundwater flow continues, but because vertical flow rates are a function of the difference between water pressure in the upper surficial systems and lower confined units, rates of downward flow are lower than those in earlier decades as the confined water levels partially recover from larger groundwater withdrawals in the past. Geographically, groundwater flow is generally inward from perimeter regions of the Virginia Coastal Plain toward central regions with the largest withdrawal rates. Groundwater inflow from coastal regions could be contributing to saltwater intrusion, even though that was not measured in this study.
Analyses of groundwater budgets from the Virginia Eastern Shore peninsula, a geographic region of the Virginia Coastal Plain, indicate that groundwater flow for that isolated aquifer system is generally outward from the surficial aquifer to coastal water bodies and downward into the confined Yorktown-Eastover aquifer system, which is the source of most withdrawals. Downward groundwater flow into the confined Yorktown-Eastover aquifer system is estimated to be less than 2 percent of total recharge and less than 9 percent of net recharge at the water table but makes up more than 93 percent of all inflow to the confined aquifer system. Decades of substantial but relatively consistent groundwater withdrawals have induced greater downward flow rates into the confined aquifer system but also have resulted in loss of groundwater from storage. For the most recent simulated period (2023), estimated storage loss accounts for slightly under 7 percent of withdrawals from the confined aquifer system. The reported withdrawal rate for this period from the confined Yorktown-Eastover system is near the highest reported rate for the Virginia Eastern Shore, which means that the storage depletion is expected to continue, even though groundwater levels appear to be relatively stable. Estimated groundwater flow rates upward from the confining unit underlying the Yorktown-Eastover system and low rates of inflow from coastal water bodies underscore ongoing concerns about up-coning and lateral intrusion of salty groundwater.
Introduction
Groundwater in the Virginia Coastal Plain aquifer system is a critical, high-quality resource in a part of the state (fig. 1) where the supply of fresh surface water often is limited (McFarland and Bruce, 2006). For more than a century, groundwater withdrawals from Coastal Plain aquifers have supported a variety of uses, including domestic and municipal water supplies, commerce, agriculture, and industry (Heywood and Pope, 2009). Because of population growth and expansion of industrial and agricultural water use, groundwater was pumped at increasingly higher rates throughout the second half of the 20th century (fig. 2).
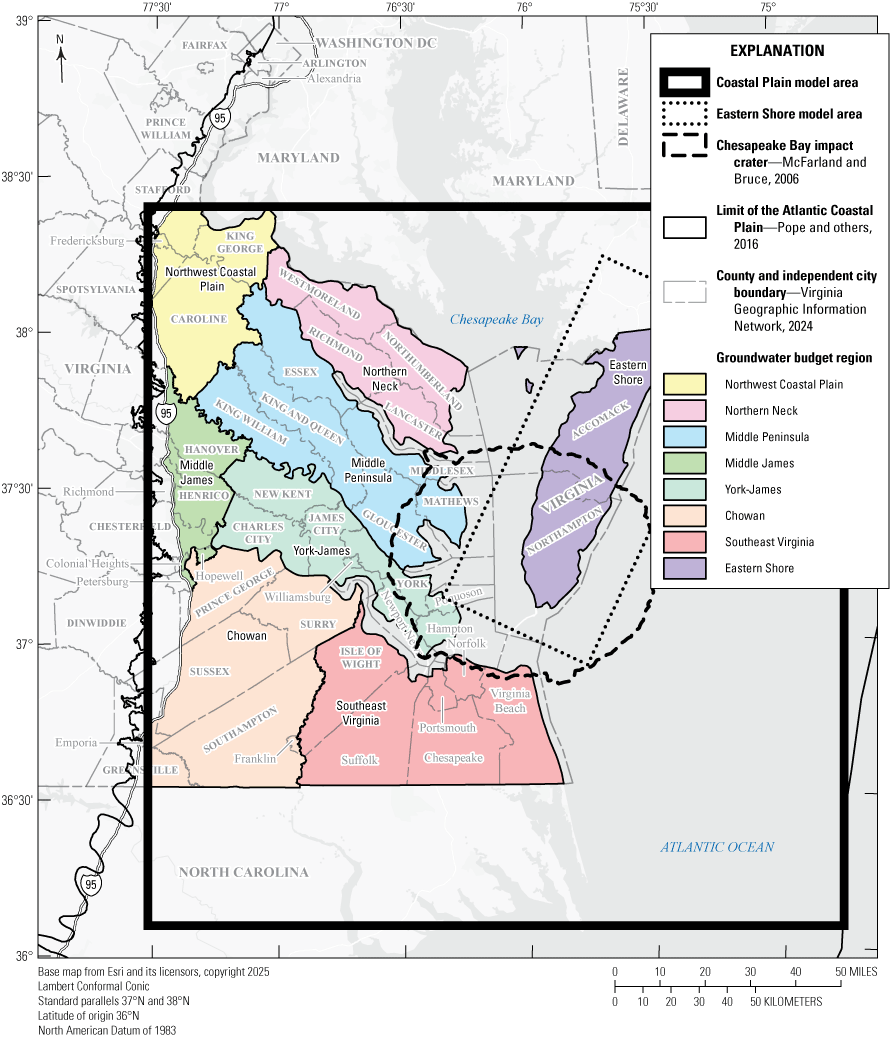
Map of the Virginia Coastal Plain, including geographic and geologic boundaries, groundwater model areas, and groundwater budget regions. Groundwater budget regions from Brian J. Campbell, Virginia Department of Environmental Quality, written commun., 2025.
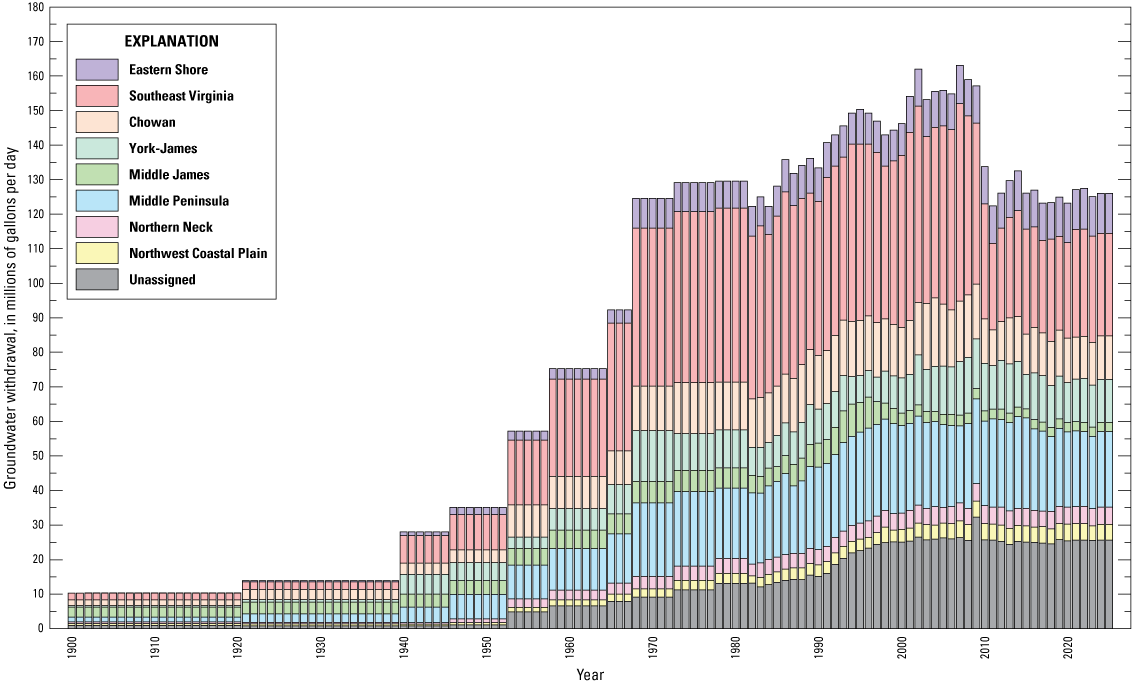
Graph showing simulated yearly combined groundwater withdrawals, in total and by budget region, for the Virginia Coastal Plain and Eastern Shore groundwater models. Withdrawal rates from Gordon and others (2025). Unassigned region includes areas simulated by the groundwater flow model but not delineated as a budget region for this report in figure 1.
Groundwater levels in deep wells screened in confined Coastal Plain aquifers once commonly flowed naturally at the land surface (Cederstrom, 1957), but by the start of the 21st century, extraction of groundwater from those aquifers had depressurized the system such that water levels in some wells had fallen to more than 200 feet (ft) below the land surface (Heywood and Pope, 2009). The widespread decline in groundwater levels and storage in confined Coastal Plain aquifers changed groundwater conditions substantially from historical conditions, altering directions of groundwater flow, inducing saltwater intrusion into aquifers in some coastal areas, and causing aquifer-system compaction, land subsidence, and increasing rates of relative sea-level rise (Heywood and Pope, 2009; Eggleston and Pope, 2013). All these factors led to increased concerns about the availability and sustainability of groundwater resources in the Virginia Coastal Plain aquifer system (Eggleston and Pope, 2013).
In 1973 and 1992, Virginia passed legislation allowing for the regulation of groundwater extraction, which led to the designation of groundwater management areas (GMAs) and a requirement that groundwater users withdrawing more than 300,000 gallons per month apply for a permit (Virginia General Assembly, 1973, 1992). In 2010, a large regional reduction in groundwater extraction occurred when a paper mill in southeastern Virginia closed and was later repurposed for a less groundwater-intensive manufacturing process (fig. 2). In 2014, the Eastern Virginia GMA expanded from southern parts of the Virginia Coastal Plain to include the Middle Peninsula, the Northern Neck, and parts of northern Virginia east of Interstate 95 (I–95) (fig. 1; Virginia State Water Control Board, 2014). Also in 2014, the Eastern Shore GMA was established for Accomack and Northampton Counties, though groundwater had been managed there under other laws and regulations for several decades prior (fig. 1; Virginia State Water Control Board, 2014). In 2016 and 2017, the Virginia Department of Environmental Quality (DEQ) negotiated lower allocations and reissued permits for the top 14 groundwater users in the Eastern Virginia GMA (Brian Campbell, Virginia Department of Environmental Quality, written commun., 2024). Consequently, overall pumping, which reached a historical high in 2007, has remained relatively constant since 2010 at a much lower rate (fig. 2).
As a result of these reduced withdrawal rates, groundwater levels in large parts of the Virginia Coastal Plain have stabilized in the decade ending in 2025, but public concerns remain about storage depletion, saltwater intrusion, and land subsidence even at these lower withdrawal rates. Also, new uses for groundwater resources, such as cooling and generation of electricity for data centers, would require additional groundwater withdrawals. Most large users of groundwater are currently (2023) pumping at rates well below their permitted limits, which means that withdrawal rates could increase substantially even under recent management practices (Virginia Department of Environmental Quality, 2024a; 2024b). Pumping increases have the potential to threaten groundwater resources by further depleting aquifer storage for current and future water users. Spatial changes in withdrawal rates could result in unexpected consequences by altering expected patterns of groundwater flow. Quantifying changes in the volume of groundwater movement and storage resulting from the previous century of extensive pumping can increase understanding of the combined effects of withdrawals from many water users and help manage future water availability.
Starting in the early 1990s, the U.S. Geological Survey (USGS) developed groundwater models to characterize Virginia Coastal Plain hydrogeology and groundwater flow. These models were subsequently used by Virginia Department of Environmental Quality (DEQ) to inform management and permitting of large withdrawals of groundwater by predicting future effects of withdrawals, for both the entire Virginia Coastal Plain and for the local aquifer system of the Eastern Shore peninsula. A separate model is used for the Eastern Shore because of the local need for more detailed characterization and simulation of the freshwater-saltwater interface on that peninsula. These groundwater models are data-intensive, mathematical representations of the groundwater system that include reported and estimated histories of groundwater extraction as inputs and are calibrated against extensive histories of water level observations. Because water levels can be measured, model development and evaluation focus on the model’s ability to reproduce observed histories of water levels in wells. The models then enable groundwater flow rates through the aquifer system to be quantified and the effects of pumping on groundwater levels (hydraulic heads) and storage to be evaluated and predicted.
The Virginia Coastal Plain groundwater model (Heywood and Pope, 2009) was developed to simulate groundwater flow across the entire Coastal Plain aquifer system in eastern Virginia and adjacent parts of Maryland and North Carolina, excluding the Eastern Shore peninsula. The Virginia Eastern Shore groundwater model (Sanford and others, 2009) was developed to simulate groundwater flow and salinity for the Eastern Shore peninsula of Virginia in greater detail than the Virginia Coastal Plain model. The Eastern Shore model focuses on the part of the local aquifer system containing fresh groundwater, including the unconfined surficial aquifer and the confined Yorktown-Eastover aquifer system, which is locally subdivided into upper, middle, and lower aquifers separated by individual confining units. Both groundwater models use SEAWAT–2000 software (Guo and Langevin, 2002; Langevin and others, 2003), which enables simulation of variable-density groundwater flow and solute transport using the MODFLOW finite-difference groundwater flow model (Harbaugh and others, 2000).
Water budgets are often used to characterize the effects of changing hydrogeologic conditions on a groundwater system, such as changes in withdrawal rates and patterns. Quantification of inflow and outflow in an aquifer system, or among various parts of the system, enables the determination of whether groundwater is being gained or lost and at what rate. This facilitates planning and management by providing an understanding of the relative sustainability of past, current, or possible future practices. The groundwater and surface water resources of the Virginia Coastal Plain are all part of a single interconnected resource, which means that activities that affect groundwater in one location may affect use of the resource elsewhere (Winter and others, 1998). For example, drawdown in deeper aquifers caused by extensive pumping may affect groundwater flow in overlying aquifers or hydrogeologic units. Similarly, pumping from the surficial aquifer may result in declines in groundwater discharge to streams (base flow). Detailed regional groundwater budgets provide the information to assess these spatially variable causes and effects.
For the Virginia Coastal Plain, the availability of up-to-date groundwater models enables detailed water budget quantifications for any part of the aquifer system. Subdivision of the models into zones allows derivation of water budgets from the regional groundwater flow model for individual hydrogeologic units, geographic regions, or any combinations of both. The groundwater budget for each zone includes flow in and out from and to adjacent zones, which enables computation of rates of groundwater flow from place to place. Assessment and comparison of groundwater flow between hydrogeologic units and spatially across parts of the Virginia Coastal Plain under current pumping conditions is the baseline for comparing water budgets under past, current, and predicted future pumping conditions. This assessment potentially enables the optimization of future groundwater management, or at the least, understanding of the current and future effects of any ongoing or potential practices.
Purpose and Scope
This report computes regional groundwater budgets for hydrogeologic and geographic divisions of the Northern Atlantic Coastal Plain aquifer system in Virginia to characterize spatial and temporal variability in groundwater flow and water supply. The groundwater budgets are derived from updated, calibrated, operational versions of the Virginia Coastal Plain and Eastern Shore models and decomposed to regional budgets using geographic zones delineated by DEQ. These regional budgets enable detailed evaluation of groundwater flow across individual aquifers and confining units and across relevant geographic subdivisions of the Virginia Coastal Plain. Groundwater budgets were evaluated for all model periods, from the historical past through a 50-year future projection, with emphasis on the most recent simulated conditions (end of 2023), compared to simulated conditions at the end of 2000 and 2073. These periods were chosen to characterize changes in groundwater conditions resulting from a major historical reduction in groundwater withdrawals in the study area that occurred during 2008–10.
For the part of the Virginia Coastal Plain west of Chesapeake Bay, groundwater budgets were computed for many zones resulting from the combination of 19 regional aquifers and confining units represented in the Virginia Coastal Plain groundwater model, subdivided geographically into 7 groundwater budget regions. The zonation of hydrogeologic units was further simplified to 3 combined hydrogeologic units in the same 7 budget regions to evaluate and highlight the importance of the Potomac aquifer, and this simplified zonation is the primary focus of the analysis in this report. The Eastern Shore peninsula was evaluated separately as a single groundwater budget region using the Virginia Eastern Shore groundwater model, which provides a detailed simulation of groundwater conditions for the peninsula. Water budgets were computed for the 8 aquifers and confining units delineated in the Eastern Shore groundwater model, which were subsequently grouped into 4 simplified zones to evaluate and highlight the significance of the Yorktown-Eastover aquifer system in relation to other hydrogeologic units. This simplified zonation is the primary focus of the water budget discussion for the Eastern Shore region. Complete output from the ZONEBUDGET application to both groundwater models for both the detailed hydrogeologic units and simplified hydrogeologic unit zones is published in a digital data release accompanying this report (Gordon and others, 2025).
Description of Study Area
The Virginia Coastal Plain occupies the entire eastern part of Virginia between approximately longitude 77°30′ W and the Atlantic Ocean, including the Virginia Eastern Shore peninsula between the Chesapeake Bay and the Atlantic Ocean (fig. 1). The area is bordered by Maryland and North Carolina to the north and south, respectively. The entire Virginia Coastal Plain is described here, but the focus for this report is on the 8 groundwater budget regions within the areas of the Virginia Coastal Plain and Eastern Shore that are simulated in the groundwater models (fig. 1).
Geography, Water Use, and Management in the Virginia Coastal Plain
Fifty Virginia counties and independent cities, henceforth referred to as “localities,” lie entirely or partially within the Virginia Coastal Plain. Population is concentrated in large urban areas, including the northern Virginia metropolitan area near Washington, D.C.; the Cities of Fredericksburg, Richmond, and Petersburg along the western boundary of the Coastal Plain; and the Cities of Chesapeake, Hampton, Norfolk, Portsmouth, and Virginia Beach in the southeast near the mouth of the Chesapeake Bay (fig. 1; U.S. Census Bureau, 2021). The remainder of the Virginia Coastal Plain is more sparsely populated and includes small towns and outlying rural areas of forest, agriculture, and wetland. The climate of the Virginia Coastal Plain is humid and temperate, with an annual mean precipitation of approximately 45 inches (National Oceanic and Atmospheric Administration, 2024). The topography of the Virginia Coastal Plain is characterized by rolling terrain with deeply incised stream valleys in the northwest and gently rolling to level terrain with broad stream valleys in the east and south. Land-surface elevations generally decline seaward, from more than 300 ft in the western Virginia Coastal Plain to 0 ft (sea-level) along the Atlantic coast. Several major rivers drain eastward into the Chesapeake Bay, creating three prominent peninsulas. From north to south, these peninsulas are referred to as the Northern Neck (between the Potomac and Rappahannock Rivers), the Middle Peninsula (between the Rappahannock and York Rivers), and the York-James Peninsula (between the York and James Rivers; McFarland and Bruce, 2006). These major rivers become brackish as they enter estuarine areas of the Coastal Plain. Consequently, the Virginia Coastal Plain is heavily reliant upon groundwater resources (Pope and others, 2008).
The Virginia Eastern Shore is the narrow southernmost end of the Delmarva Peninsula, bordered on the west by the Chesapeake Bay and on the east by the Atlantic Ocean. This area has very little topographic relief, with land-surface elevations ranging from only about 50 ft along the center ridge of the peninsula to 0 ft (sea-level) along the shorelines. The two counties of the peninsula in Virginia, Accomack and Northampton Counties, are primarily rural, with population centers in several small towns along Route 13, which generally follows the center of the peninsula in a north to south direction. Other residential and resort communities are along the Atlantic coast and Chesapeake Bay. Land use is primarily agricultural, including the production of corn, soybeans, poultry, fruit, vegetables, and timber (McFarland and Beach, 2019). Two poultry processing plants in Accomack County are the only large industrial operations. The largest town is Chincoteague, on the Atlantic Ocean at the northern end of Accomack County. Because fresh surface water is scarce in this coastal environment, nearly all freshwater supplies for the Virginia Eastern Shore are obtained from a relatively shallow fresh groundwater system overlying salty groundwater and surrounded by salty water bodies (McFarland and Beach, 2019).
Most of the Virginia Coastal Plain is included within the two State-designated GMAs: Eastern Virginia and Eastern Shore. The Eastern Virginia GMA covers much of the Coastal Plain except the Eastern Shore and, for this report, is subdivided into groundwater budget regions: Northwest Coastal Plain, Northern Neck, Middle Peninsula, Middle James, York-James, Chowan, and Southeast Virginia (fig. 1). The Eastern Shore GMA includes all of Accomack and Northampton Counties on the Eastern Shore peninsula of Virginia, which is also delineated as a separate groundwater budget region.
A small part of the Virginia Coastal Plain, west of U.S. Interstate 95 (I–95) north of City of Fredericksburg and south of Washington, D.C., is not included in a GMA and is not part of any groundwater budget region (fig. 1). Notably, the small part of the Coastal Plain in this area is not covered in the Virginia Coastal Plain groundwater model because it was not included in the Virginia regulations prior to the development of the model. Groundwater use in this region is more limited than for the rest of the Virginia Coastal Plain, because it is served by municipal water supplies from the Potomac and Occoquan Rivers, but further hydrologic investigations are underway to enable a better understanding of groundwater conditions there. Another small area in the Fall Zone on the far western edge of the Virginia Coastal Plain is included in the groundwater model but is not part of any groundwater budget region specified for this report, because it is outside of any GMA. This includes parts of Stafford, Spotsylvania, Caroline, Hanover, Henrico, Chesterfield, Prince George, Dinwiddie, and Greensville Counties within the Coastal Plain model area but outside of any designated groundwater budget region (fig. 1).
In the GMAs, large groundwater withdrawals are regulated by the DEQ, which generally requires well owners to obtain permits to withdraw 300,000 or more gallons per month. Under the conditions of these permits, well owners collect various information, including well construction details, withdrawal amounts, and water-level and water-quality data. This information is reported to the DEQ to support greater understanding of the effect large withdrawals have on the aquifers of the Virginia Coastal Plain (Brian J. Campbell, Virginia Department of Environmental Quality, written commun., 2025). The same withdrawal threshold requires reporting of groundwater withdrawals both inside and outside of GMAs, with a higher threshold of a million gallons per month applied to withdrawals for agricultural production. As a result, substantial withdrawals of groundwater are measured and reported monthly, and monthly withdrawal rates have now been quantified for more than two decades. Furthermore, estimates of large withdrawals have been compiled for more than 100 years from historical information, enabling the simulation of their effects in groundwater models (Heywood and Pope, 2009; Sanford and others, 2009).
Less is known about withdrawals for domestic use from private wells, but spatial distribution and rates of withdrawal have been estimated for the Virginia Coastal Plain using population and land-cover data. Well characteristics have been evaluated from analysis of available well-construction records and population data analysis. Estimates of withdrawal for domestic use in the models included in this report were developed as described by Pope and others (2008) and were recently improved and updated by Kearns and Pope (2025). Withdrawals from private, domestic wells are estimated to account for at least 25 percent of total groundwater withdrawals in the Virginia Coastal Plain in 2023, and over 75 percent of private wells are estimated to be screened in confined aquifers. Consequently, including these withdrawals is necessary because they represent a substantial portion of total groundwater use and significantly influence water-level changes in the confined aquifers.
Withdrawals of groundwater in the study area are quantified from groundwater-model files and therefore include withdrawals from areas in the models, including areas in the Fall Zone in Virginia and parts of Maryland and North Carolina outside of GMAs or groundwater budget regions. The Eastern Shore model is the source of withdrawal information for that groundwater budget region, whereas the Virginia Coastal Plain model is the source for the withdrawal information for the 7 groundwater budget regions it includes (fig. 2). Reported and estimated groundwater withdrawals in 2023 for the combined simulated areas in both models total approximately 125 million gallons per day (Mgal/day) (fig. 2; table 1). Withdrawals in Virginia from the 8 groundwater budget regions shown in figure 1 were approximately 98 Mgal/day (table 1). Groundwater withdrawals included in the model classified as “unassigned” include withdrawals in adjacent parts of Maryland and North Carolina, and a small amount of withdrawal in the Virginia Coastal Plain to the west of defined groundwater budget regions. Simulated withdrawals in the Eastern Shore model in 2023 included about 2.6 Mgal/d from adjacent parts of Maryland, consisting of about 1.6 Mgal/d of reported withdrawals and 1 Mgal/d of estimated domestic withdrawals.
Table 1.
Estimated withdrawals of groundwater in 2023 by groundwater budget region in the Virginia Coastal Plain and adjacent parts of Maryland and North Carolina.[Values in millions of gallons per day]
Current (2023) withdrawals are about 77 percent of the historical high withdrawal rates from the early 2000s. Overall, about 72 percent of the withdrawal total is from reported or regulated wells, and 28 percent is estimated from private, domestic wells. Withdrawals by aquifer are spatially variable because of variable geographic, geologic, and demographic factors. Overall, withdrawals from the Potomac aquifer comprise about 61 percent of the total. Withdrawals from the Yorktown-Eastover aquifer account for 14.5 percent of the total, with about two-thirds of those withdrawals from the Eastern Shore. The unconfined surficial aquifer supplies just over 8 percent of the withdrawal total, and the Piney Point and Aquia aquifers supply about 5 percent each. Withdrawals from all other hydrogeologic units are about 6 percent of the total.
Groundwater withdrawals are spatially variable across the Virginia Coastal Plain. Aquifer thickness, and therefore groundwater availability, in the mainland part of the Coastal Plain generally increases in an eastward direction as the thickness of aquifers increases, but the presence of saline groundwater near the coast restricts availability there. Otherwise, groundwater withdrawals are higher in areas of greater population density and around some major industrial facilities. Withdrawals for private domestic, industrial, and municipal use make up about 93 percent of all withdrawals, with most of the remainder for irrigation or other agricultural purposes, which are locally important particularly for the Eastern Shore (Virginia Department of Environmental Quality, 2025).
Withdrawals are temporally variable as well. The time-series plot of groundwater withdrawals by groundwater budget region in figure 2 combines reported and estimated withdrawals from the Virginia Coastal Plain and Eastern Shore groundwater models (Heywood and Pope, 2009; Sanford and others, 2009). For the Virginia Coastal Plain in general, withdrawals increased substantially from the 1940s through the 1970s, with the rate of increase leveling out in the 1980s and 1990s. After peaking in 2007 at more than 130 Mgal/d in Virginia, withdrawals decreased sharply after 2009 because of a substantial change from a major industrial groundwater user (fig. 2). Since then, withdrawal rates have remained relatively steady. For the Eastern Shore, withdrawal rates have remained relatively steady since the 1970s. However, the largest withdrawal rates have occurred over the decade prior to 2024, with a reported high in 2022.
Geology and Hydrogeology of the Virginia Coastal Plain
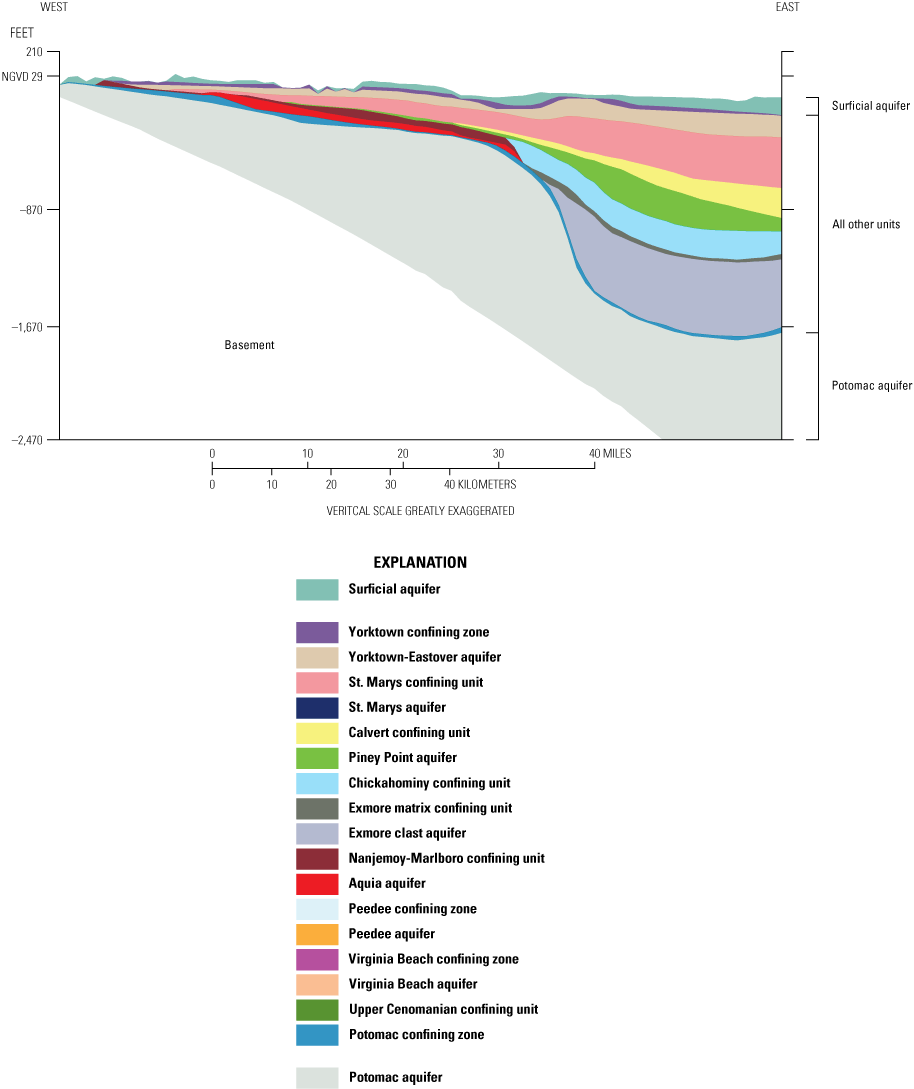
The Virginia Coastal Plain aquifer system is a part of the more extensive Northern Atlantic Coastal Plain aquifer system. The geology of this region consists of a seaward-thickening wedge of eastward-dipping strata of unconsolidated to partly consolidated Cretaceous, Tertiary, and Quaternary sediments that overlie a basement of consolidated bedrock (fig. 3; McFarland and Bruce, 2006). This sediment wedge thins to the west and terminates in the Fall Zone, where crystalline rock of the Piedmont Physiographic Province outcrops. Along the Atlantic Coast of Virginia, the total thickness of Virginia Coastal Plain sediments is greater than 6,000 ft (McFarland and Bruce, 2006).
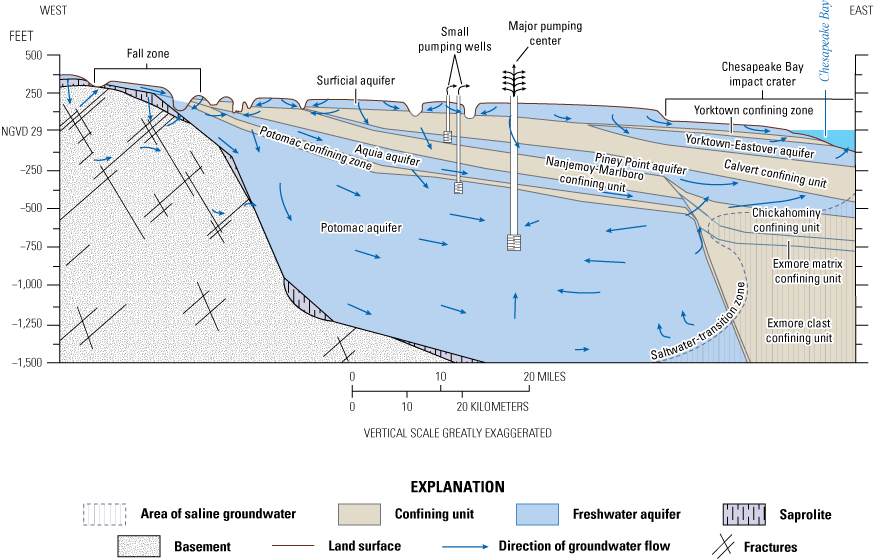
Generalized west-to-east hydrogeologic cross section of the Virginia Coastal Plain, from the Fall Zone to the Chesapeake Bay, including the buried Chesapeake Bay impact crater. Modified from Foster and others (2024). NGVD 29, National Geodetic Vertical Datum of 1929.
Virginia Coastal Plain sediments form a stratigraphic series of hydrogeologic units, largely as the result of variable composition and permeability (fig. 3; McFarland and Bruce, 2006). Groundwater exists in pores between sediment grains. Permeable sediments, through which most groundwater flows readily, are known as aquifers, whereas less permeable sediments that restrict flow are known as confining units. Precipitation that infiltrates the land surface and reaches the water table either flows relatively short distances and discharges to nearby streams or leaks downward to recharge deeper, confined aquifers.
Groundwater within the Virginia Coastal Plain primarily originates from precipitation that infiltrates the surficial, water table aquifer and then flows laterally to discharge in nearby streams or downward to recharge deeper confined aquifers (Pope and others, 2008). In Virginia, the Coastal Plain aquifer system has been divided into 19 identified aquifers and confining units, from the surficial aquifer at the land surface to the bedrock defining the base of the aquifer system (McFarland and Bruce, 2006). The freshwater portions of these aquifers and confining units are bounded to the east by a transition zone in which salinity gradually increases to seawater concentrations. The complex and dynamic freshwater-saltwater interface was characterized by McFarland (2010) and simulated in three dimensions by Heywood and Pope (2009). Under natural conditions, groundwater flow in most aquifers was generally thought to be eastward toward the coast, but for the past several decades, extensive groundwater withdrawals have induced groundwater flow inward toward major pumping centers and downward, particularly in the deepest aquifer, the Potomac aquifer (Heywood and Pope, 2009). On the Eastern Shore peninsula, fresh groundwater is present in just the unconfined surficial aquifer and the uppermost confined aquifer, the Yorktown-Eastover, with a lateral transition to more saline water beneath the Chesapeake Bay and Atlantic Ocean and an increase in salinity with depth in underlying units (Sanford and others, 2009). Groundwater flow for the Virginia Eastern Shore is generally laterally outward from the axis of the peninsula toward the bay and ocean and inward toward major pumping locations in the Yorktown-Eastover aquifer system (fig. 4).
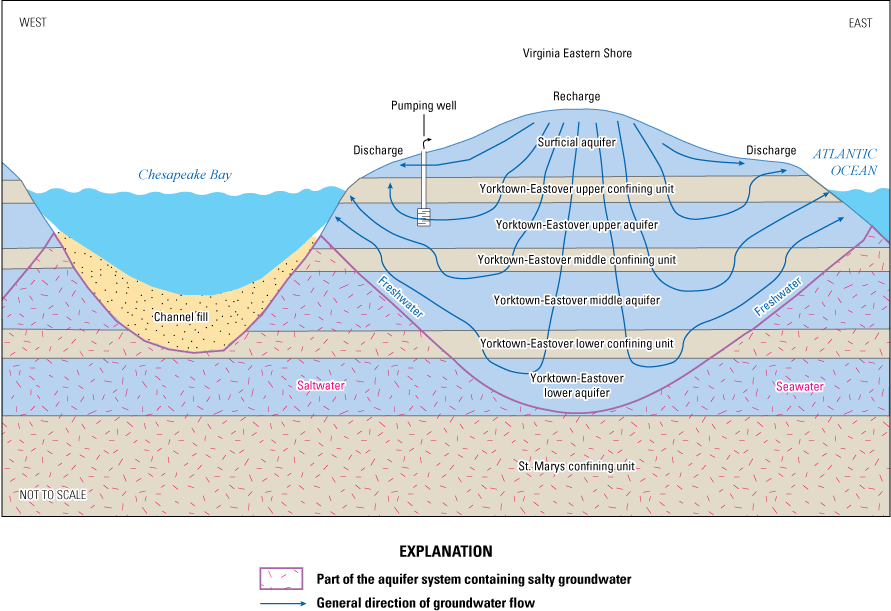
Generalized west-to-east hydrogeologic cross section of the Virginia Eastern Shore peninsula, from the Chesapeake Bay to the Atlantic Ocean. Modified from Sanford and others (2009).
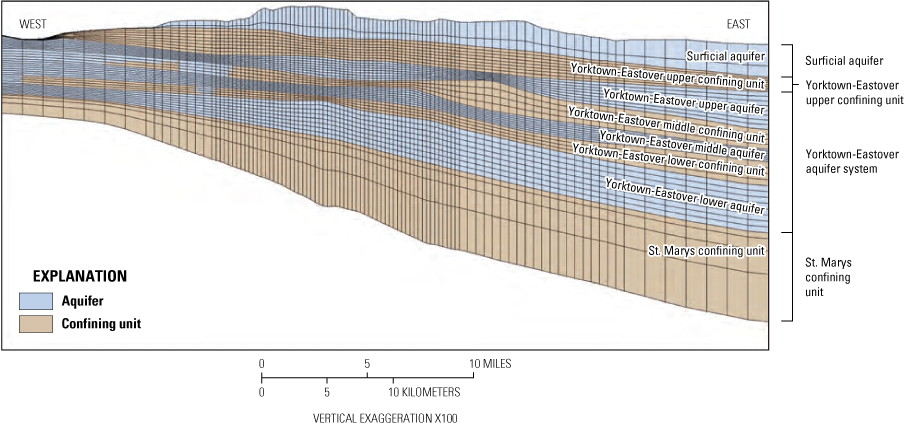
A comprehensive report by McFarland and Bruce (2006) details all hydrogeologic units of the Virginia Coastal Plain, whereas a report by McFarland and Beach (2019) details subdivisions of the aquifer system that are important for the Virginia Eastern Shore. A report by Pope and others (2016) relates the hydrogeologic units of the Virginia Coastal Plain within the larger context of the Northern Atlantic Coastal Plain aquifer system, which is continuous along the Atlantic Coast from New York to North Carolina. Virginia Coastal Plain hydrogeologic units are shown in cross section in figure 5, with a full list in table 2. Hydrogeologic units and subdivisions for the Virginia Eastern Shore are illustrated in figure 6, with a list in table 3. The following brief descriptions of selected aquifers highlight only the most important hydrogeologic units in the context of a discussion of water-supply and groundwater budgets.
Cross section of the Virginia Coastal Plain groundwater model illustrating individual hydrogeologic units and the simplified grouping of hydrogeologic units. Modified from Heywood and Pope (2009). NGVD 29, National Geodetic Vertical Datum of 1929.
Cross section of the Virginia Eastern Shore groundwater model illustrating individual hydrogeologic units and the simplified grouping of hydrogeologic units. Modified from Sanford and others (2009).
Table 2.
Hydrogeologic units and corresponding simplified hydrogeologic units used for computing groundwater budgets with the Virginia Coastal Plain model.Table 3.
Hydrogeologic units and corresponding simplified hydrogeologic units used for computing groundwater budgets with the Virginia Eastern Shore model.Surficial Aquifer
The surficial aquifer is composed of a series of primarily fluvial-deltaic and estuarine quartz sands and gravels of variable texture with interbedded silts and clays and covers the entire Coastal Plain (McFarland and Bruce, 2006). The top of the surficial aquifer is at land surface. It is typically tens of feet thick, but the thickness ranges from over 100 feet in some areas to just a few feet in others. Thickness is highly variable but generally decreases from west to east and from higher to lower land-surface elevations. Most of the surficial aquifer is underlain by various confining units or zones. However, near the Fall Zone or along major rivers, the surficial aquifer directly overlies and may be connected to deeper aquifers. Because it is shallow and most readily accessed, the surficial aquifer historically has been an important water supply, but drought and concern about water quality in recent years have caused users in some locations to abandon wells in the surficial aquifer in search of more dependable water supplies in deeper aquifers (Pope and others, 2008). Most direct groundwater recharge enters the Virginia Coastal Plain aquifer system through the surficial aquifer, with some of that water infiltrating downward to deeper units.
Yorktown-Eastover Aquifer
The Yorktown-Eastover aquifer extends across most of the Virginia Coastal Plain except for several of the northwestern counties. The upper part of the Yorktown-Eastover aquifer consists of estuarine to marine, variably textured, glauconitic, phosphatic, and fossiliferous quartz sands and interbedded silts and clays; the lower part consists of abundantly fossiliferous sands (McFarland and Bruce, 2006). The Yorktown-Eastover aquifer is overlain across most of its extent by the Yorktown confining zone however, in locally incised areas along rivers where it outcrops on steep slopes, the Yorktown-Eastover aquifer usually is covered by sediments of the surficial aquifer.
The Yorktown-Eastover aquifer is hydraulically continuous on a regional scale but can exhibit local discontinuities as the result of interbedded fine-grained sediments. The “Yorktown-Eastover aquifer system” of the Virginia Eastern Shore has been subdivided to include separate upper, middle, and lower confined aquifers that are each overlain by corresponding confining units (Sanford and others, 2009; McFarland and Beach, 2019). Furthermore, sediments in buried paleochannels cutting through the Yorktown-Eastover aquifer system have been designated recently as “upper paleochannel aquifer” and “lower paleochannel aquifer” separated by a paleochannel confining unit (McFarland and Beach, 2019). Subdivisions of the Yorktown-Eastover aquifer system or the associated paleochannel aquifers are generically classified with the Yorktown-Eastover aquifer for better comparison across the Virginia Coastal Plain, even though these subdivisions are briefly discussed further in the section of this report on groundwater budgets for the Eastern Shore groundwater model.
Because it is a shallow aquifer with high-quality water, the Yorktown-Eastover aquifer is a major source for private-domestic water supplies, especially in the eastern part of the Virginia Coastal Plain (Pope and others, 2008). The Yorktown-Eastover aquifer system is important for the Virginia Eastern Shore as the only confined aquifer containing freshwater and provides most of the groundwater supply there. There is public concern about depletion of groundwater storage and saltwater intrusion in this aquifer system on the Eastern Shore, and the groundwater model for the Eastern Shore exists primarily for management and regulation of this aquifer system by DEQ. The Yorktown-Eastover aquifer system of the Eastern Shore is mostly isolated from the rest of the Virginia Coastal Plain by the Chesapeake Bay and by salty groundwater in underlying hydrogeologic units.
Piney Point Aquifer
The Piney Point aquifer extends across most of the Virginia Coastal Plain, except in the southern part near the Fall Zone. The Piney Point aquifer is composed of a closely associated group of several geologic formations, consisting generally of marine, medium- to coarse-grained, glauconitic, phosphatic, variably calcified, and fossiliferous quartz sands up to 150 ft thick (McFarland and Bruce, 2006). The Piney Point aquifer is a moderately used groundwater resource in the central sections of the Northern Neck Peninsula, Middle Peninsula, and York-James Peninsula, where withdrawals are primarily from a section of the aquifer identified by McFarland (2017) as consolidated limestone. The Piney Point aquifer is not considered a productive aquifer south of the James River (Pope and others, 2008).
Aquia Aquifer
The Aquia aquifer extends across much of the Virginia Coastal Plain except in the most eastern and southern areas (fig. 3). The Aquia aquifer consists of marine, medium- to coarse-grained, glauconitic, and fossiliferous quartz sands and is generally no more than 50 ft thick (McFarland and Bruce, 2006). The Aquia is a minor water-supply resource, possibly because it is very thin relative to other aquifers, and it is used most heavily in the northern and central part of the Virginia Coastal Plain (Pope and others, 2008).
Potomac Aquifer
The Potomac aquifer overlies the basement and occupies the lowermost position in the hydrogeologic system (fig. 3). This aquifer extends across nearly the entire Virginia Coastal Plain, except for where it was disrupted by the Chesapeake Bay impact crater, and is overlain by the Potomac confining zone across most of its extent, except for incised areas along major river channels and near the Fall Zone. In these incised areas, the Potomac aquifer may outcrop but is usually covered by sediments of the surficial aquifer, providing direct hydraulic connections between the confined and unconfined systems (Pope and others, 2008).
The Potomac aquifer is the thickest aquifer in the Virginia Coastal Plain aquifer system and ranges in thickness from a thin edge of just a few feet or less near the Fall Zone to several thousand feet at the coast. The Potomac aquifer consists primarily of fluvial-deltaic coarse-grained quartz and feldspar sands and gravels (McFarland and Bruce, 2006). The Potomac aquifer is hydraulically continuous on a regional scale, including multiple states, but its composition is heterogeneous, and fine-grained clay interbeds may impede groundwater flow locally (Pope and others, 2008).
The Potomac aquifer is the largest and most heavily used source of groundwater in the Virginia Coastal Plain, providing more than 60 percent of total groundwater withdrawals in recent years (approximately 2010 through 2023) and an even larger proportion of groundwater for large industries and municipalities. Decreasing water levels in Potomac aquifer wells from the 1940s to about 2008 have caused concern about additional withdrawals from this aquifer in areas where it is heavily used, especially in growing metropolitan areas of the southeastern Virginia Coastal Plain; however, withdrawals and groundwater levels have stabilized since about 2010 after a substantial decrease in industrial groundwater withdrawals.
Groundwater Levels
Groundwater levels are not discussed in detail in this report, but references to long-term historical variations in all Virginia Coastal Plain aquifers are documented in various reports, including the documentation of the Virginia Coastal Plain groundwater model (Heywood and Pope, 2009) and the Virginia Eastern Shore groundwater model (Sanford and others, 2009). More recent groundwater levels measured regularly in hundreds of wells can be obtained and viewed using groundwater-monitoring web applications for the Virginia Coastal Plain (U.S. Geological Survey, 2023b) and the Virginia Eastern Shore (U.S. Geological Survey, 2023a).
Application of ZONEBUDGET Software to Groundwater Models
For these analyses, regional groundwater budgets were computed using the ZONEBUDGET program (Harbaugh, 2009) applied to the two previously described groundwater models of the Virginia Coastal Plain. Since the publication of the Virginia Coastal Plain and Eastern Shore groundwater models by the USGS, the DEQ has used these models to inform water-supply planning, management, and regulation. For this purpose, DEQ updates the models annually with current groundwater withdrawals and other input data. The updated, operational models of the Virginia Coastal Plain and Eastern Shore, maintained and used by DEQ, are known as the VAHydroGW-VCP and VAHydroGW-VAES models, respectively. In 2019, the VAHydroGW-VCP model was also recalibrated by consulting firm Aquaveo for DEQ to improve the match between simulated and measured groundwater levels. Both models simulate historical groundwater flow from approximately 1900 to the present and project groundwater conditions 50 years into the future, assuming the continuation of current (2023) pumping and environmental conditions. The models used for this report simulate “current” groundwater conditions through the end of 2023 and project conditions through 2073.
The documentation of the Virginia Coastal Plain model recalibration is available online from the DEQ (Virginia Department of Environmental Quality, 2020). The groundwater model digital files can be obtained from the Office of Water Withdrawal Permitting for DEQ. DEQ has published reports for simulations through 2023 for both the Virginia Coastal Plain groundwater model (Virginia Department of Environmental Quality, 2024a) and the Eastern Shore groundwater model (Virginia Department of Environmental Quality, 2024b).
Zone Budget Software
A water budget is an accounting of the total volume of water flowing into and out of a defined volume (zone) over time. For the Virginia Coastal Plain and Eastern Shore groundwater models, the specific budget components include recharge (precipitation that makes its way to the water table) to the surficial aquifer; evapotranspiration (water taken up by plants from the saturated zone); reported and regulated withdrawals from wells and estimated withdrawals from private domestic wells; groundwater leakage into or from rivers; groundwater leakage into or from the coastal water bodies; groundwater flow in from lateral model boundaries; vertical or lateral outflow into or from overlying, underlying, or adjacent zones; and changes in groundwater storage. While some budget components like recharge are generally sources (inflows), and others like well withdrawals or evapotranspiration are generally sinks (outflows), many of the budget components can be either sources or sinks. Sinks such as lateral flow, vertical flow, or leakage from one zone may be sources to other zones.
The ZONEBUDGET program (version 3; Harbaugh, 1990; Harbaugh, 2009) enables computation of water budgets for subdivisions of a MODFLOW groundwater model by assigning user-specified zone numbers to individual model cells. Because groundwater budget terms can be written as MODFLOW output for each model cell for every simulation period, detailed groundwater budgets can be computed from user-specified aggregations (zones) of model cell-by-cell budgets, including the components of flow between adjacent zones. In ZONEBUDGET, positive budget values indicate an inflow of water to a designated zone, and negative values indicate an outflow. Budget components were computed as net values for a zone, such as the difference in inflows and outflows for each specific budget component in a zone. Because MODFLOW maintains mass balance, inflows equal outflows for each model cell and therefore for each aggregated zone. Because the Virginia Coastal Plain and Virginia Eastern Shore groundwater models use mostly yearly simulation time steps, the ZONEBUDGET analyses provide annual average groundwater-flow rates between designated model zones. All groundwater budget components were evaluated for each of the specified model zones, as described in the following section of this report, which are combinations of hydrogeologic units (aquifers and confining units) and designated geographic regions.
Zonation of Groundwater Models
For this analysis, model zones were specified based on a combination of identified hydrogeologic units and designated geographic regions, referred to hereafter as “groundwater budget regions.” This approach enabled tracking of groundwater flow through the many zones created by the combination of all hydrogeologic units with all groundwater budget regions. For each zone, the previously described groundwater budget components are tracked, along with groundwater flow to and from every adjacent zone, including hydrogeologic units above or below, as well as laterally adjacent groundwater budget regions. Zonation of the Virginia Coastal Plain model was used for groundwater budgets for the 7 groundwater budget regions west of the Chesapeake Bay, whereas zonation of the Virginia Eastern Shore model was used for the Eastern Shore groundwater budget region (fig. 1). Any parts of the Virginia Coastal Plain model not assigned to a groundwater budget region were classified together in an “unassigned” region. No geographic subdivision was done for the Eastern Shore model, so budget components computed for the Eastern Shore include Accomack and Northampton Counties in Virginia and an adjacent part of Maryland within the model area.
Groundwater Budget Regions
The groundwater budget regions were identified by the DEQ for the purpose of evaluating groundwater resources in the Coastal Plain of Virginia (fig. 1) (Brian J. Campbell, Virginia Department of Environmental Quality, written commun., 2025). The land area east of I–95 was divided into 8 groundwater budget regions. The regional groupings were based on a consideration of the Drought Evaluation Regions established by the “Virginia Drought Assessment and Response Plan” of 2003 (Virginia Department of Environmental Quality, 2003), as well as geographic divisions, major geomorphologic features, groundwater model domains, and groundwater resource demands. Regional boundaries were chosen to correspond with local government boundaries, and I–95 where applicable, to simplify discussion and analysis. While these regional boundaries are arbitrary, they generally correspond to regions of the Coastal Plain that share similar groundwater conditions. These regions are shown in figure 1 and described in detail below.
-
• Northwest Coastal Plain: King George County; the parts of Caroline County, Spotsylvania County, and the City of Fredericksburg east of I–95; and the part of Stafford County east of I–95 and within the domain of the Virginia Coastal Plain groundwater flow model (Heywood and Pope, 2009).
-
• Northern Neck: Lancaster, Northumberland, Westmoreland, and Richmond Counties.
-
• Middle Peninsula: Essex, Gloucester, King and Queen, King William, Mathews, and Middlesex Counties.
-
• Middle James: The City of Hopewell; the parts of Chesterfield, Hanover, and Henrico Counties east of I–95; and the parts of the Cities of Colonial Heights, Petersburg, and Richmond east of I–95.
-
• York-James: Charles City, James City, New Kent, and York Counties and the Cities of Hampton, Newport News, Poquoson, and Williamsburg.
-
• Chowan: Southampton and Surry Counties, the City of Franklin; the areas of Prince George and Sussex Counties east of I–95; and the areas of Greensville County and the City of Emporia east of I–95 and within the domain of the Virginia Coastal Plain groundwater flow model.
-
• Southeast Virginia: Isle of Wight County and the Cities of Chesapeake, Portsmouth, Norfolk, Suffolk, and Virginia Beach.
-
• Northern Neck: Lancaster, Northumberland, Westmoreland, and Richmond Counties.
-
• Eastern Shore: Accomack and Northampton Counties.
Hydrogeologic Unit Zonation
For the Virginia Coastal Plain model, each of the 19 hydrogeologic units simulated in the groundwater flow model and listed in table 2 was initially assigned to an individual zone (fig. 5). Similarly, for the Eastern Shore model, each of the 8 hydrogeologic units simulated in the groundwater flow model and listed in table 3 was initially assigned to an individual zone (fig. 6). For the Eastern Shore, hydrogeologic unit names are revised to reference the most recent hydrogeologic framework report for the Virginia Eastern Shore (McFarland and Beach, 2019) rather than those published in the original model report by Sanford and others (2009). While the published hydrogeologic framework (McFarland and Beach, 2019) also identifies additional hydrogeologic units from paleochannel deposits cutting through the Yorktown-Eastover aquifers and confining units, these additional units are simulated as part of the Yorktown-Eastover aquifer system in the published groundwater model (Sanford and others, 2009) and are therefore not assigned to separate zones.
In the Virginia Coastal Plain model, hydrogeologic units are specified with the Hydrogeologic-Unit Flow package (Anderman and Hill, 2000; 2003; Anderman and others, 2002). The Hydrogeologic-Unit Flow package allows model cells to belong to multiple hydrogeologic units. Therefore, the hydrogeologic unit with the largest volume or thickness within a cell was used to determine the correct zone for each cell. Conversely, each model cell in the Virginia Eastern Shore groundwater model is assigned to a single hydrologic unit and was readily assigned to a single zone.
Groundwater budgets were initially computed for all combinations of hydrogeologic units and groundwater budget regions for both models. Not every hydrogeologic unit is present in every groundwater budget region, but the combination of all hydrogeologic units with all groundwater budget regions results in many zones for tracking groundwater flow components. These detailed zone budget simulation results can be used for further in-depth investigations and are available in a digital data release (Gordon and others, 2025), while the larger scale groundwater-flow conditions most relevant to management can be better understood with a simpler zonation scheme. Consequently, the original hydrogeologic units were grouped into combined and simplified units, selected to highlight the most relevant aspects of groundwater flow in the aquifer systems, including primary water-supply aquifers.
Simplified Hydrogeologic Unit Zonation
The 19 hydrogeologic units in the Virginia Coastal Plain model were grouped into 3 simplified hydrogeologic units: (1) the unconfined surficial aquifer, (2) a zone composed of all other units below the surficial aquifer and above the Potomac aquifer, and (3) the Potomac aquifer (table 2; fig. 5). The 8 hydrogeologic units in the Eastern Shore model were grouped into 4 simplified units: (1) the unconfined surficial aquifer, (2) the Yorktown-Eastover upper confining unit, (3) the confined Yorktown-Eastover aquifer system, and (4) the underlying St. Marys confining unit (table 3; fig. 6). The St. Marys confining unit is designated separately because this unit primarily contains saline groundwater underlying the freshwater system, and a zone for this unit enables tracking vertical flow between fresh and salty parts of the aquifer system (fig. 4).
For both models, the simplification of hydrogeologic units supports a more generalized picture of groundwater-flow conditions in the study area. These include groundwater flow and storage for the primary water-supply aquifers: the Potomac aquifer for most of the Virginia Coastal Plain, and the Yorktown-Eastover aquifer system for the Eastern Shore peninsula.
Groundwater Budgets for the Virginia Coastal Plain
Evaluation of individual groundwater budget components for subdivisions of the simulated study area is a useful way of representing groundwater flow model outputs and understanding groundwater flow through the hydrogeologic system. These subdivisions, or zones, may be hydrogeologic units or combinations of units. The zones may be geographic divisions, such as groundwater budget regions, or combinations of hydrogeologic units and groundwater budget regions. Groundwater budget values are provided in tables and graphs in units of cubic feet per day (ft3/d), even though budget components can also be considered in terms of their proportional contribution to the overall budget total, as a percentage.
Individual components of the groundwater budget are listed and described below. Not all budget components may be present in every zone, and the magnitude of some budget components in a given zone may be small enough that they are not visible on some graphs. Budget components of recharge and evapotranspiration are provided in tables, but the difference between recharge and evapotranspiration, called net recharge in this report, is generally discussed and plotted throughout this report in place of the two separate inflow and outflow terms.
Explanation of Groundwater Budget Terms
-
• Recharge: precipitation that reaches the water table and becomes groundwater.
-
• Evapotranspiration: water removed from the groundwater system by evaporation from the soil or transpiration from vegetation. Note that ET from the saturated groundwater system is the sole simulated ET and is not identical to total actual ET from the landscape, which includes ET from unsaturated root zones.
-
• Net recharge: the net difference between recharge and evapotranspiration.
-
• Flow to or from streams and rivers: the net exchange of groundwater with rivers. In most cases, this is flow out to rivers as base flow.
-
• Flow to or from coastal water bodies: the net groundwater flow to or from bays, estuaries, or the ocean.
-
• Withdrawals from domestic wells: estimated withdrawals from private household wells for domestic water supply.
-
• Withdrawals from reported wells: reported withdrawals from major commercial, industrial, and agricultural facilities larger than the specified threshold withdrawal rates.
-
• Storage change: the net change (decreased or increase) in groundwater storage. A decrease in storage is represented with a positive sign because this represents a source of water to the budget of the saturated groundwater system, while a storage increase is represented with a negative sign.
-
• Flow from lateral boundaries: modeled boundary inflows at edges of model domain.
-
• Flow to or from other hydrogeologic units (within a budget region): net flow of groundwater within a geographic region from one hydrogeologic unit into or out of other hydrogeologic units.
-
• Flow to or from other budget regions: the net flow in or out of a specified groundwater budget region from other adjacent specified budget regions.
-
• Flow to or from unspecified budget region: the net flow in or out of a specified budget region to model areas not specified as a groundwater budget region in Virginia.
Groundwater in these subsurface reservoirs accumulated over extremely long periods. Because of overlying confining units (layers of low permeability) that restricted upward flow, and because of increasing overburden as sediments continued to accumulate on the land surface, the water that continued to flow from the land surface down into the confined aquifers became highly pressurized and even minimally compressed. When groundwater is extracted from units like these, it is not immediately replaced, and the groundwater that remains—while still completely filling the subsurface reservoir—is depressurized and decompressed. In other words, the aquifer is still saturated, but there is less water in the aquifer. We call this removal of groundwater a removal from or reduction in storage. Conversely, an addition of water into these aquifers, as is the objective with artificial recharge or injection, that is not immediately balanced by flow out of the subsurface reservoir would increase storage, which would be indicated by an increase in groundwater pressures (measured hydraulic head or water level). Note that groundwater storage in the surficial aquifer can similarly increase and decrease, but because the surficial aquifer is open to the atmosphere (unconfined), the governing physical dynamics are different. Note also that the mathematical representation of groundwater storage changes in a numerical simulation of groundwater levels and flows creates a slightly awkward sign convention that is discussed in more detail later in this section.
A conceptual hydrogeologic diagram (fig. 7) illustrates many of the components of the groundwater budget described above. If the illustrated block diagram shown in figure 7 is considered to be a budget region, flow to or from other regions can be visualized as lateral flow in or out along the edges of the block diagram.
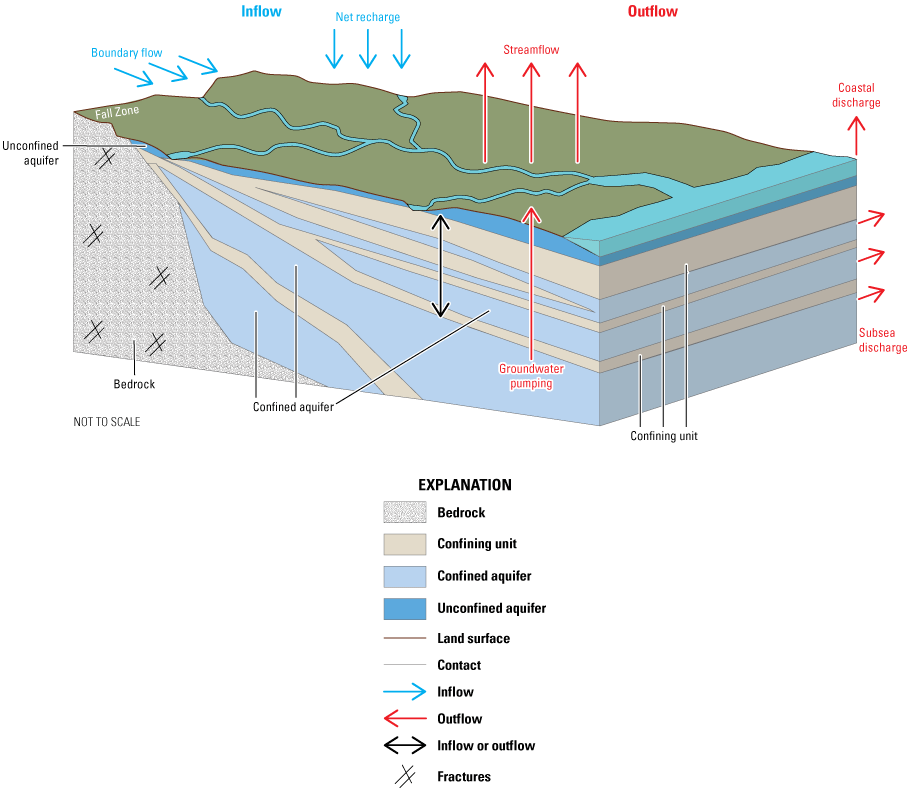
Conceptual hydrogeologic diagram illustrating components of the groundwater flow budget for the Virginia Coastal Plain. Modified from Masterson and others (2016).
Budget components and totals for specified zones are summarized in tables, time-series bar charts, and pie charts of specific simulated periods. The focus of the discussion will be on the annual budgets for 2000 and 2023 to provide a comparison of current (2023) groundwater conditions with a period (2000) in which withdrawal rates were much higher (fig. 2). Comparisons are also made to the start of model simulations, when withdrawal rates were very small compared to current (2023) conditions. Groundwater budget inflows (positive values) and outflows (negative values) sum to approximately zero, neglecting model numerical error of less than 2 percent. This means that positive budget components are balanced by negative budget terms in tables, bar charts, and pie charts. For pie charts, net inflows are shown on one side of each pie, with net outflows on the other side.
Groundwater Budgets for Entire Models with All Hydrogeologic Units
Evaluation of groundwater budgets for the entire Virginia Coastal Plain and Eastern Shore groundwater models for every hydrogeologic unit (aquifer, confining unit, or confining zone) was done to provide a fundamental summary of simulated groundwater flow through this complex hydrogeologic system. This overall summary will support a more detailed discussion of groundwater flow within the designated groundwater budget regions in Virginia in the following section of this report. The Virginia Coastal Plain model results provide the budget values for the Coastal Plain in Virginia and adjacent parts of Maryland and North Carolina, whereas the Eastern Shore model provides the budget values separately for the Eastern Shore peninsula in Virginia and an adjacent part of Maryland.
Total Groundwater Budget for the Virginia Coastal Plain Model
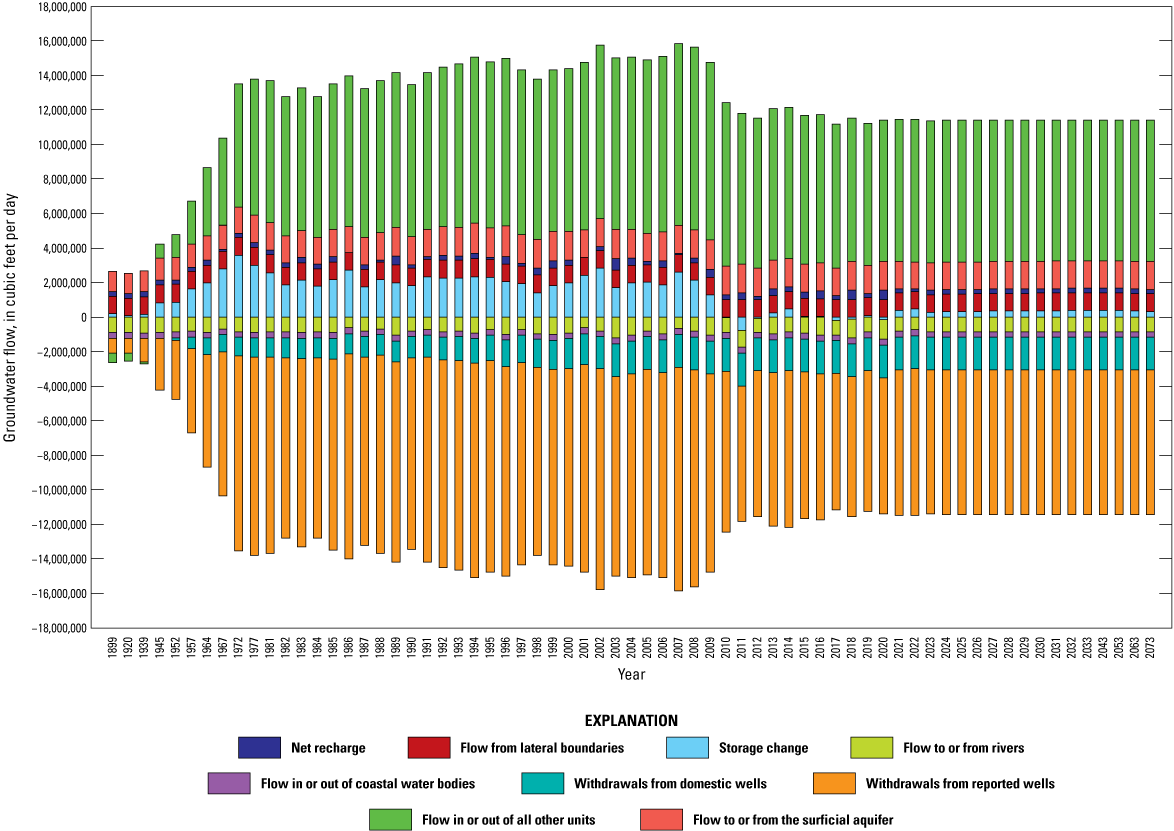
The overall groundwater budget for the Virginia Coastal Plain model includes the Coastal Plain of Virginia and adjacent parts of Maryland and North Carolina. A time-series plot of the total groundwater budget for the model, divided by budget component, is shown in figure 8. Computed budget terms for individual hydrogeologic units are listed in table 4 for four simulated times of interest for comparison. These selected times represent groundwater budgets at a time of small withdrawal rates (1899), at a time with sustained rates near historical highs (2000), at a recent time after a sustained reduction in withdrawals (2023), and at a time 50 years in the future (2073) under projected rates of withdrawal similar to 2023 rates. The 2000 and 2023 budget years are of particular interest in comparison of water budgets because of the large changes induced by reductions in pumping in between those years, and pie charts in figure 9 show the relative magnitudes of the budget components for those time periods for the entire model. To highlight temporal changes in the confined Potomac aquifer, the source of most groundwater withdrawals, figure 10 shows a plot of groundwater budget components for that aquifer for the entire model area for all periods.
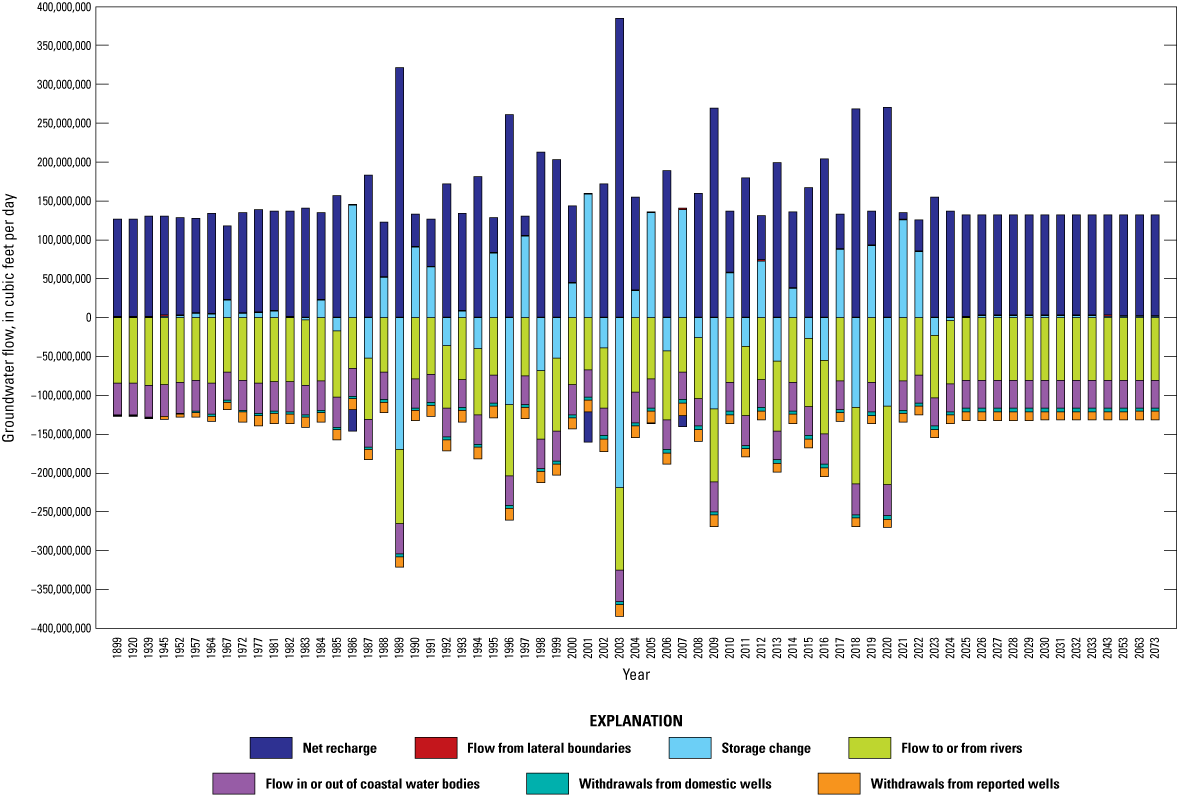
Graph showing simulated groundwater budgets for the entire Virginia Coastal Plain model area for all model periods, illustrating budget components. Flow rates from Gordon and others (2025). Historical and future periods are multiple years in length.
Table 4.
Simulated groundwater budgets for the entire Virginia Coastal Plain model for all hydrogeologic units in 1899, 2000, 2023, and 2073.[Values in millions of cubic feet per day. Data may not add to column totals shown because of independent rounding. Values shown as “0.000” or “−0.000” are nonzero values rounded to three decimal places. These are distinct from true zero (“0”) and indicate values with absolute magnitude less than 0.0005. ET, evapotranspiration; NA, not applicable.]
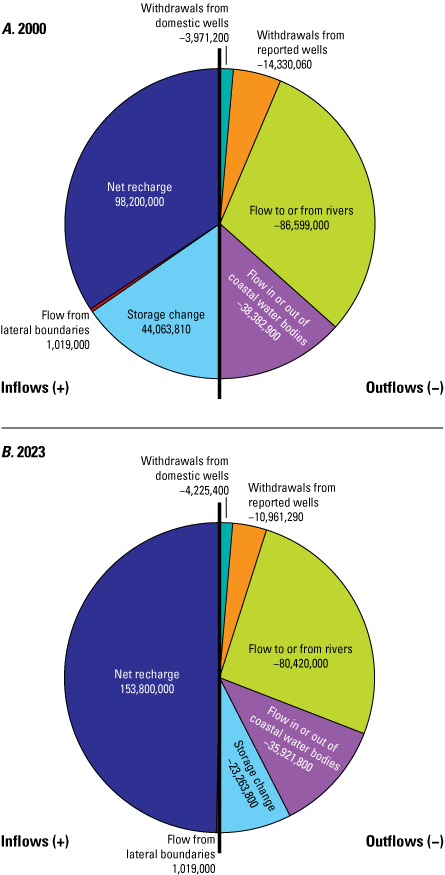
Pie charts showing simulated yearly groundwater budgets for the entire Virginia Coastal Plain model area for A, 2000, and B, 2023. Flow rates from Gordon and others (2025). Rates are in cubic feet per day.
Graph showing simulated groundwater budgets for the entire Virginia Coastal Plain model area for all model periods for the Potomac aquifer in the Virginia Coastal Plain model. Flow rates from Gordon and others (2025). Historical and future periods are multiple years in length.
Regardless of the period, the groundwater budget is dominated by inflow to the aquifer system from net recharge and outflow to rivers and coastal water bodies, with years for which precipitation and recharge were high as indicated by substantially higher rates of both inflow and outflow in figure 8. For 2023, inflow and outflow through the aquifer system were about 1.45 billion ft3/d. Considering net recharge rather than recharge and evapotranspiration separately, groundwater flow into the system was about 158 million ft3/d. Comparison of budget totals and values for individual hydrogeologic units reveal some important information about groundwater flow under current (2023) conditions in comparison to other periods. Negative values of stream leakage, both for the total and for all individual units, indicate generally gaining streamflow conditions. While there could be small, local cases of flow from streams into the groundwater system, the dominant condition is net groundwater loss as base flow to streams. Similarly, groundwater flow is outward to coastal water bodies, though this component of flow is smaller in magnitude than flow to streams. The component of groundwater flow to or from all other units indicates that groundwater flow in this system is generally downward, with a large component of flow out of the surficial aquifer to underlying units. Notably, the Yorktown-Eastover, Piney Point, Aquia, and Potomac aquifers all exhibit substantial net inflows from other adjacent hydrogeologic units. Important changes over time in groundwater flow and storage are further highlighted in a budget diagram for the Potomac aquifer alone (fig. 10).
Comparison of groundwater budget components for recent conditions, such as 2000 or 2023, with the early model period before 1900, illustrates the degree to which modern, large-scale withdrawals from confined aquifers such as the Potomac aquifer have altered the groundwater flow system. For example, in the early period, estimated storage depletion was negligible because the system was effectively in equilibrium, groundwater flow to surface water bodies was about 5–6 percent higher than in recent years, and there was flow from the highly pressurized Potomac aquifer to some overlying hydrogeologic units. For more recent times, comparison of conditions in 2000 and 2023 (figs. 8 and 9) illustrate important differences in groundwater budgets between a period with withdrawals near historical highs and after years of sustained lower withdrawal rates.
Even considering the large components of net recharge and coastal and river outflows, the loss of groundwater from storage in 2000 (positive value of 44,063,810 ft3/d) is a notable part of the budget. In contrast, one feature of the 2023 budget is the net storage gain (negative value of 23,263,800 ft3/d) in the system, though most of that gain is in the surficial aquifer and is just a temporary, short-term response to a year with slightly higher than average precipitation. In the confined system, most hydrogeologic units (table 2) experienced a decline in storage, including the Piney Point, Aquia, and Potomac aquifers and most adjacent confining units. This storage decline in the confined aquifers indicates that groundwater is being removed more quickly than it can be replaced. However, this storage depletion was much smaller for 2023 than for 2000, because of a smaller withdrawal rate in recent years (2010–2023). For the entire Virginia Coastal Plain model, withdrawals in 2023 at the rate of a little over 15 million ft3/d (114 Mgal/d) were about 83 percent of the 2000 rate of over 18 million ft3/d (137 Mgal/d).
The decline in the groundwater withdrawal rate that occurred after about 2008 is indicated by the difference in the storage term in the groundwater budget between 2000 and 2023 (figs. 9 and 10). Excluding the unconfined surficial aquifer, storage depletion totaled more than 10 million ft3/d in 2000, while the same units experienced a small storage gain in 2023.
Groundwater storage change can be considered as a percentage of the groundwater withdrawal rate. In 2000, for the confined part of the groundwater system, excluding the surficial aquifer, storage depletion was more than 60 percent of the groundwater withdrawal rate. In 2023, storage depletion in the confined part of the aquifer system was negligible. Storage depletion continued in the deeper confined aquifers in 2023, accounting for more than 6 percent of the withdrawal rate for the Piney Point, Aquia, and Potomac aquifers together, but storage depletion was more than 21 percent of the withdrawal rate in 2000. For the Potomac aquifer alone, storage depletion was about 2.5 percent of the withdrawal rate in 2023, compared to 15 percent in 2000.
Some of the change in the rate of storage depletion is the result of relatively higher net recharge in 2023 compared to 2000 (table 4). Many aquifers and confining units outcrop in the Fall Zone and in major river valleys and receive limited direct recharge, but this is still an appreciable part of the groundwater budget. However, some of the deeper individual hydrogeologic units, such as the Potomac confining zone and the Upper Cenomanian confining unit (fig. 5), receive negligible recharge yet have groundwater flow out to the Potomac aquifer in both 2000 and 2023 (table 4). Likely the result of the reduction in withdrawals from the Potomac aquifer over this period, outflow from overlying confining units to the aquifer is lower in 2023, and the rate of decline in storage is also lower. For example, overall storage decline for the Upper Cenomanian confining unit was about 1.45 million ft3/d in 2000, but 0.45 million ft3/d in 2023. For the Potomac confining zone, storage decline of 0.3 million ft3/d had changed to an increase (negative sign) of 0.01 ft3/d. Even so, storage in several aquifers and confining units overlying the Potomac aquifer continued to decline in 2023, and together, storage decline in overlying units was of a greater magnitude than in the Potomac aquifer (table 4).
In addition to groundwater budget components listed in table 2 and illustrated in figures 8 and 9, groundwater budgets for all periods can be obtained from the data release accompanying this report (Gordon and others, 2025).
Total Groundwater Budget for the Virginia Eastern Shore Groundwater Model
The Eastern Shore peninsula overall groundwater budget includes Accomack and Northampton Counties in Virginia, and adjacent areas of Maryland. Budget components are shown for every model period in figure 11 and listed for the four periods of interest in table 5 (aquifer system total values). The flow budget is largely characterized by a large amount of recharge offset by flows out to coastal water bodies of about 90 percent of the total recharge rate. Groundwater withdrawals, largely from the confined aquifers, are partially offset by downward flow from the surficial aquifer, but under current (2023) pumping conditions, positive storage values for most hydrogeologic units indicate that storage is declining. There also is simulated flow from the St. Marys confining unit into the Yorktown-Eastover lower aquifer, which is important because the St. Marys confining unit is known to contain salty groundwater. As illustrated in figure 2, groundwater withdrawal rates have been relatively consistent for several decades, but withdrawals in recent years have been among the highest rates reported.
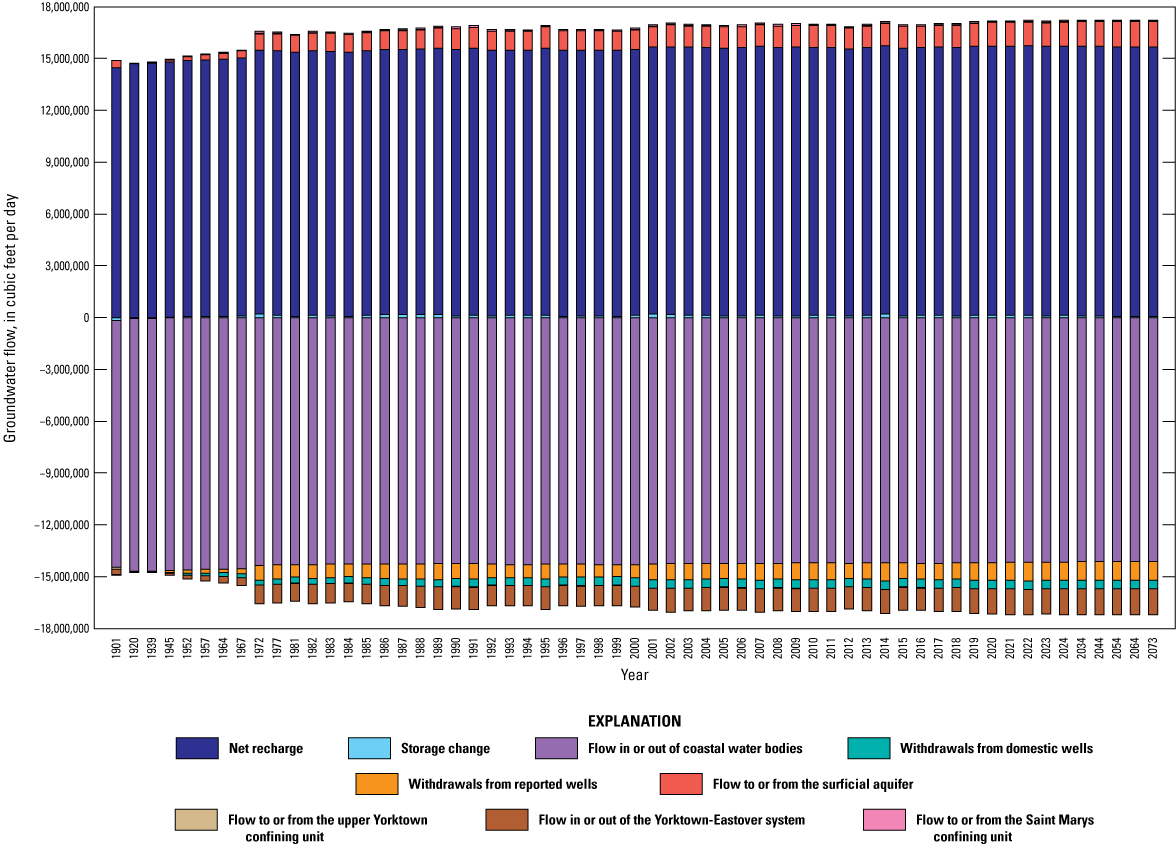
Graph showing simulated groundwater budgets for the entire Virginia Eastern Shore model area for all model periods. Flow rates from Gordon and others (2025). Historical and future periods are multiple years in length.
Table 5.
Simulated groundwater budgets from the Eastern Shore model for simplified hydrogeologic units in 1901, 2000, 2023, and 2073.[Values in millions of cubic feet per day. Data may not add to column totals shown because of independent rounding. Values shown as “0.000” or “−0.000” are nonzero values rounded to three decimal places. These are distinct from true zero (“0”) and indicate values with absolute magnitude less than 0.0005. ET, Evapotranspiration. SA, surficial aquifer; Y-E upper, Yorktown-Eastover upper confining unit; Y-E system, Yorktown-Eastover aquifer system; St. Marys, St. Marys confining unit; NA, not applicable.]
Because withdrawal rates have been relatively steady for many years, only marginal differences were observed in Eastern Shore groundwater budgets for 2023 and 2000 (fig. 11). Total simulated groundwater withdrawals in 2023 were more than 1.5 million ft3/d (about 11.2 Mgal/d), of which about 1.25 ft3/d (about 9.4 Mgal/d) were from Virginia. In detail, about 40 percent of withdrawals are from the Yorktown-Eastover middle aquifer, about 35 percent are from the Yorktown-Eastover upper aquifer, about 22 percent are from the Yorktown-Eastover lower aquifer—totaling 97 percent from the Yorktown-Eastover system—and about 3 percent are from the surficial aquifer. Withdrawals of groundwater are a relatively small part of the entire water budget, at about 9 percent of all outflows, but withdrawals are an important part of the water budget for the confined part of the groundwater system, which includes all hydrogeologic units below the surficial aquifer.
Net recharge into the aquifer system is about 15.6 million ft3/d, but downward flow from the surficial aquifer into the confined system is about 1.4 million ft3/d, or just under 9 percent of the net recharge rate (table 5). Groundwater withdrawals from the confined part of the aquifer system total about 1.49 million ft3/d, so downward flow from the surficial aquifer accounts for about 93 percent of the withdrawal total. The difference between withdrawals from and inflows to the surficial aquifer is made up by a reduction in storage, flow upwards from the underlying St. Marys confining unit, and likely inward lateral flow along the saltwater interface. Storage reduction of just under 100,000 ft3/d in 2023 in the confined system accounted for about 6.7 percent of the withdrawal total. Ninety percent of the net storage loss was from the St. Marys confining unit, 7 percent was from the Yorktown-Eastover lower confining unit, and 3 percent was from the Yorktown-Eastover middle confining unit. The confined aquifers either had slight storage losses or storage gain because of flow into the aquifers from the overlying and underlying confining units.
Because the freshwater and saltwater portions of the aquifer system were not divided laterally into separate zones, the amount of inflow along the saltwater interface could not be quantified with this analysis. Observations of increased salinity in wells near the coasts of both the Chesapeake Bay and Atlantic Ocean, particularly near withdrawals for municipal water supply, suggest some lateral saltwater intrusion. The upward flow into the Yorktown-Eastover lower aquifer from the St. Marys confining unit is about 90,000 ft3/d, or about 6 percent of the withdrawal rate from the confined part of the system. This is consistent with observations of increases in salinity in wells in the Yorktown-Eastover lower aquifer reported by McFarland and Beach (2019). Small computed rates of inflow to all confined aquifers from coastal water bodies also would suggest inward lateral saltwater movement. While the storage decline is relatively small, groundwater depletion is expected to continue at current (2023) rates of withdrawal.
Groundwater Budgets for Simplified Hydrogeologic Units
Simplification of the zonation of hydrogeologic units as described in the section of this report titled “Zonation of Groundwater Models” was used to clarify understanding of vertical groundwater flow through the Virginia Coastal Plain and Eastern Shore aquifer systems, with emphasis on the primary hydrogeologic units of interest. The Potomac aquifer was the primary focus of the Virginia Coastal Plain model evaluation, while the combined Yorktown-Eastover aquifer system was the primary focus of the Eastern Shore model evaluation. For the Potomac aquifer and the combined Yorktown-Eastover system on the Eastern Shore, an important element of understanding the groundwater budgets is the quantification of the downward flow of water from overlying units.
For the Virginia Coastal Plain model, the simplified hydrogeologic units combined from the 19 original units are listed in table 2 and illustrated in cross section in figure 5. The surficial aquifer was not combined with other units in the simplified analysis because it is the hydrogeologic unit through which most water enters the system as net recharge (recharge minus groundwater evapotranspiration) and leaves as base flow to rivers and discharge to coastal water bodies. It also provides a large source of water to the underlying units through downward flow or leakage. The Potomac aquifer was evaluated separately because it is the source of the largest component of groundwater withdrawals and is by far the thickest part of the aquifer system. All the remaining hydrogeologic units between the surficial aquifer and the Potomac aquifer were combined into a single hydrogeologic unit to quantify the overall vertical flow of groundwater in the aquifer system between the unconfined surficial aquifer and the Potomac aquifer which is the primary water supply.
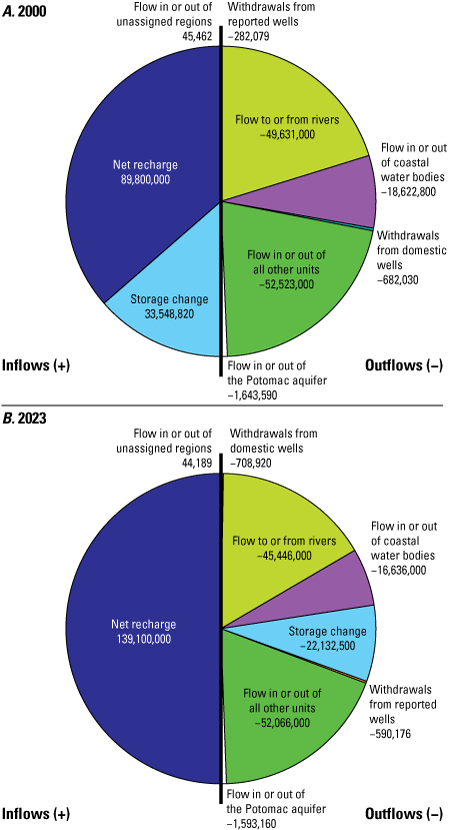
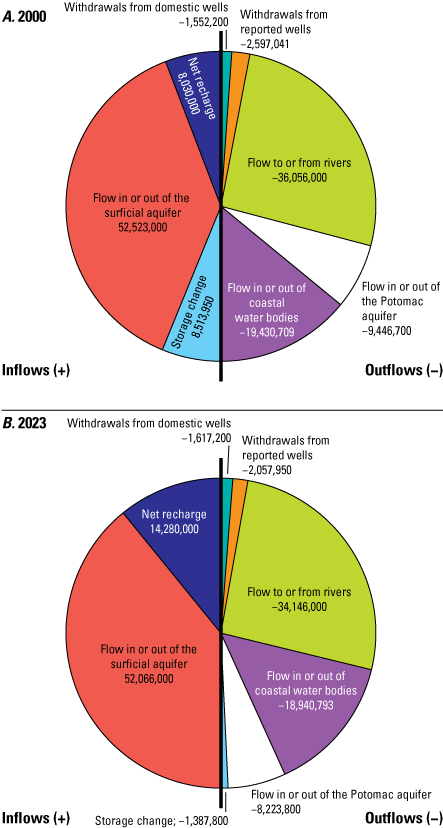
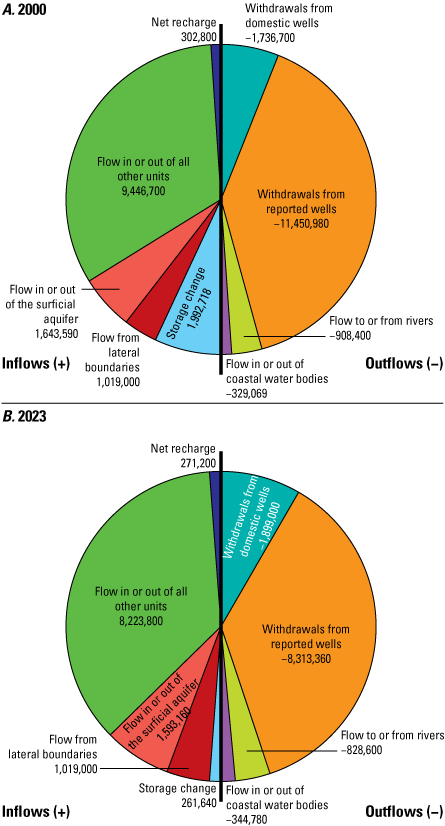
Groundwater budget components were computed for the three simplified hydrogeologic units for the entire groundwater model area. For the years 2000 and 2023, groundwater budget components for the surficial aquifer are illustrated in figure 12, budget components for all other units are illustrated in figure 13, and budget components for the Potomac aquifer are illustrated in figure 14. These pie charts allow ready comparison of budget components among hydrogeologic units and of budget components for each simplified hydrogeologic unit for the two years of interest.
Pie charts showing simulated yearly groundwater budgets within designated Virginia groundwater budget regions for the unconfined surficial aquifer in the Virginia Coastal Plain model for A, 2000, and B, 2023. Flow rates from Gordon and others (2025). Rates are in cubic feet per day.
Pie charts simulated yearly groundwater budgets within designated Virginia groundwater budget regions for all other units, not including the surficial and Potomac aquifers, in the Virginia Coastal Plain model for A, 2000, and B, 2023. Flow rates from Gordon and others (2025). Rates are in cubic feet per day.
Pie charts simulated yearly groundwater budgets within designated Virginia groundwater budget regions for the Potomac aquifer in the Virginia Coastal Plain model for A, 2000, and B, 2023. Flow rates from Gordon and others (2025). Rates are in cubic feet per day.
It should be noted that the overall magnitudes of the groundwater budgets for the three simplified hydrogeologic units are substantially different, which is not immediately apparent from the comparison of the pie charts, which are all the same size. Total flow into the surficial aquifer, balanced by outflow (fig. 12), is approximately 140 million ft3/d for 2023. Total flow through all other units (fig. 13) between the surficial aquifer and the Potomac aquifer is approximately half the magnitude of flow through the surficial aquifer, at slightly under 70 million ft3/d. Total flow through the Potomac aquifer (fig. 14) of less than 12 million ft3/d in 2023 is only a small fraction of the flows through the surficial aquifer and all other units. This is particularly notable when the relative magnitudes of inflows and outflows are considered relative to the volumes of the hydrogeologic units, as illustrated in figure 5. For the surficial aquifer (fig. 12), most of the net recharge is partly balanced by flow out to rivers and coastal water bodies, with less than half flowing downward to other hydrogeologic units. For all other units (fig. 13) not including the Potomac aquifer, flow in from the surficial aquifer above is also partly balanced by relatively large flows out to rivers and coastal water bodies. Withdrawals from wells are small outflows, and flow downward to the Potomac aquifer is also a relatively small portion of the groundwater budget for this simplified hydrogeologic unit. For the Potomac aquifer (fig. 14), however, groundwater flow downward from the surficial aquifer and all other units provide most of the inflow, with only a small amount flowing in from lateral boundaries and some flow out of storage in the aquifer. A small portion of the outflow is to rivers and coastal boundaries, while most of the outflow from the aquifer is to groundwater withdrawal wells. Other details of the groundwater flow budgets for the simplified units are further discussed in the following section of this report, which also incorporates regional geographic subdivisions.
Virginia Coastal Plain Groundwater Model within Groundwater Budget Regions
Groundwater budgets for the simplified hydrogeologic units described previously were computed for 7 designated groundwater budget regions in the Virginia Coastal Plain, not including the Eastern Shore (fig. 1). These regional budgets are listed in table 6 for the four previously described periods of interest. Individual budgets for each region are listed by simplified hydrogeologic unit and summarized by unit in tabular subtotals. In addition to the previously discussed budget components, additional columns in table 6 list computed net lateral flows to and from each groundwater budget region and to or from the area of the model not assigned to a budget region. Overall totals for all hydrogeologic units and all budget regions for each period of interest are also tabulated. Groundwater flow between the three simplified hydrogeologic units and among budget regions, as listed in table 6, is illustrated conceptually in figure 15. Groundwater budgets computed for all simulated years, for all hydrogeologic units, and for all designated groundwater budget regions are provided in a data release accompanying this report (Gordon and others, 2025).
Table 6.
Simulated groundwater budgets from the Virginia Coastal Plain model by region for simplified hydrogeologic units in 1899, 2000, 2023, and 2073.[Values in millions of cubic feet per day. Data may not add to column totals shown because of independent rounding. Values shown as “0.000” or “−0.000” are nonzero values rounded to three decimal places. These are distinct from true zero (“0”) and indicate values with absolute magnitude less than 0.0005. GBR, groundwater budget region; ET, evapotranspiration; NCP, Northwest Coastal Plain; NN, Northern Neck; MP, Middle Peninsula; MJ, Middle James; YJP, York-James Peninsula; C, Chowan; SV, Southeast Virginia; NA, not applicable.]
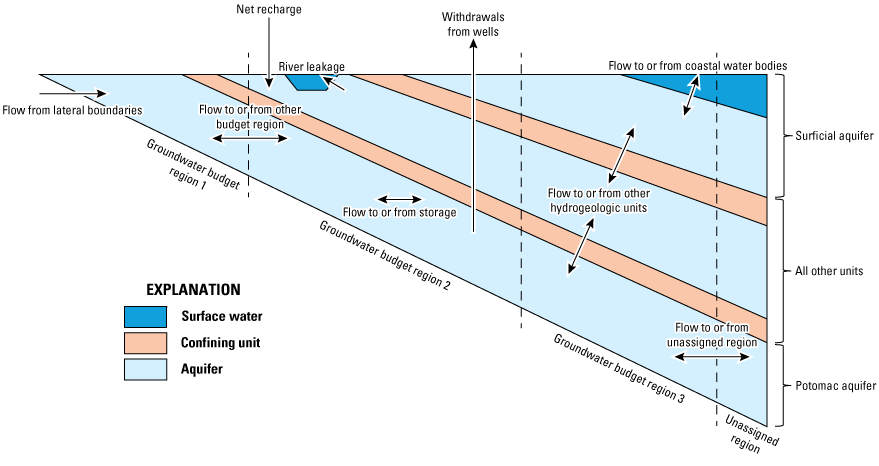
Schematic representation of budget terms used to describe flow through the simplified hydrogeologic units used for computation of groundwater budgets in the Virginia Coastal Plain groundwater model. Modified from Gordon (2007).
Most of the budget discussion for the simplified hydrogeologic units in this report focuses on the part of the area within the Virginia Coastal Plain model that is within the groundwater budget regions depicted on the map in figure 1. This does not include the Eastern Shore region, and it does not include any of the Coastal Plain model domain not assigned to a groundwater budget region. The unassigned area includes parts of the Coastal Plain aquifer system in adjacent parts of Maryland and North Carolina, the area beneath the Chesapeake Bay and tidal rivers, and a small part of the Virginia Coastal Plain west of the designated eastern Virginia GMA and west of the designated groundwater budget regions. As a result, the budget tables and plots presented here for the simplified hydrogeologic units will not match the budget numbers and plots for all simplified units for the entire model, as illustrated in figures 12, 13, and 14. The difference in these budgets is the budget for the model area not assigned to a budget region. In time-series bar plots of groundwater budgets, model periods prior to 1982 and projected future periods are of variable length longer than one year, resulting in compression of those periods on these plots. However, most of the focus in this discussion is on recent times for which model simulation periods are consistently one year in length.
In 2023, total simulated groundwater withdrawals within designated groundwater budget regions in the Virginia Coastal Plain (not including the Eastern Shore) were estimated at about 11.8 million ft3/d (about 88 Mgal/d; table 1). Of this total, more than 75 percent of withdrawals were from the Potomac aquifer, more than 7 percent were from the surficial aquifer, and more than 17 percent were from all other units, which include locally important aquifers such as the Yorktown-Eastover, the Piney Point, and the Aquia. Together, the Potomac aquifer and “all other units” compose the confined aquifer system, underlying the surficial aquifer, and in 2023, the confined aquifer system supplied about 93 percent of withdrawals within the specified groundwater budget regions. However, both the Potomac and all other units do occur at the land surface in some locations, mostly in the Fall Zone and along river incisions, and a relatively smaller component of net recharge (recharge minus evapotranspiration) is listed in the groundwater budgets. For the area within the groundwater budget regions, groundwater budgets are listed in table 6. Again, the totals for each of the simplified hydrogeologic units are slightly different from those illustrated in figures 12, 13, and 14, because the tabular totals do not include the model areas not assigned to a Virginia budget region.
Groundwater budget trends previously discussed for the entire model area are similar for the simplified hydrogeologic units within the assigned budget regions. However, the simplified grouping helps to illustrate some of the flow terms more clearly. For example, 2000 and 2023 budget totals for flow to all other units (table 6) show that groundwater flow is downward from the surficial aquifer to all other units and the Potomac aquifer, and flow is also downward to the Potomac aquifer from all other units, even though the net flow to all other units is positive because of flow downward from the surficial aquifer.
One of the most substantial changes in the groundwater budget between 2000 and 2023 is the groundwater storage in the Virginia Coastal Plain and in individual budget regions, particularly for the confined hydrogeologic units beneath the surficial aquifer. Storage terms in the groundwater budgets from table 6 are presented in condensed form in table 7, which lists the yearly rates of flow into (negative sign) and out of (positive sign) the Potomac aquifer, all other units than the Potomac and surficial aquifers, and the total for all confined units underlying the surficial aquifer, for 2000 and 2023. Within the designated groundwater budget regions in Virginia, primarily negative values in 2023 for storage change in table 7 indicate net storage gains for both the Potomac aquifer and all other units. A total of about 2.25 ft3/d in storage increase in the confined system (all other units and Potomac aquifer), and over 93 percent of that storage increase is in all other units, while under 7 percent of the increase is in the Potomac aquifer. The small amount of storage depletion in the Potomac aquifer computed previously for the entire model area must be occurring in areas outside of the Virginia budget regions. This could include adjacent parts in Maryland and North Carolina or beneath Chesapeake Bay. So, at the 2023 withdrawal rate of 8.9 million ft3/d (about 57 Mgal/d) for the Potomac aquifer, downward flow from overlying units combined with inward flow from lateral areas unassigned to a budget region and net recharge was enough to account for all the groundwater withdrawn and even a small amount of storage increase within the groundwater budget regions. It is important to recognize that flow into the Potomac aquifer in Virginia from overlying hydrogeologic units is a large portion (about 66 percent) of all inflow. However, this is only about 7 percent of net recharge to the entire aquifer system, which indicates that a relatively small portion of groundwater recharge reaches the Potomac aquifer.
Table 7.
Simulated groundwater storage changes in the confined groundwater system, including the Potomac aquifer and all other units not including the surficial aquifer, for 2000, and 2023.[Values in cubic feet per day; positive values indicate loss of storage and negative values indicate gain in storage.]
In 2000, storage loss from the combined confined system, including both the Potomac aquifer and all other units, totaled about 5.7 million ft3/d (table 7), with 86 percent of the storage loss from all other units, and 14 percent from the Potomac aquifer. For the entire confined part of the aquifer system, storage loss accounted for about 40 percent of the withdrawal total, and for the Potomac aquifer, storage loss accounted for just under 7 percent of the withdrawal total. Downward flow into the Potomac aquifer was also higher in 2000 than in 2023, induced by higher pumping rates in the Potomac aquifer in 2000. Downward flow from the surficial aquifer and all other units to the Potomac aquifer accounted for about 64 percent of the withdrawal total. Flow inward from outside the designated budget regions accounted for about 28 percent of the withdrawal total.
Comparison of groundwater budgets in 2000 with budgets from the early model period (ending in 1899) indicates how much decades of substantial withdrawal from confined aquifers had altered flow conditions in the Virginia Coastal Plain. Coastal Plain withdrawals in Virginia budget regions totaled just over 1.2 million ft3/d (under 10 Mgal/d) for the early period ending in 1900 but had risen to more than 16 million ft3/d (about 120 Mgal/d) in 2000 (fig. 2). As a result, storage depletion in 2000 from the confined part of the aquifer system (Potomac aquifer and all other units) was 20 times higher than in the early period (table 4). Similarly, downward flow into the confined part of the aquifer system increased by about 36 percent, and downward flow into the Potomac aquifer increased to about 17 times that of the early period. So, with rates of groundwater withdrawal in the range observed prior to 2009–10, groundwater flow in the confined aquifer system was largely downward through overlying units toward the Potomac aquifer, and the rate of storage depletion was a variable but substantial portion of the groundwater withdrawal rate.
Groundwater Budgets by Region with Simplified Hydrogeologic Units for the Virginia Coastal Plain
For comparison of groundwater budgets between geographic regions, totals from simplified units in table 6 were aggregated in table 8 for the same four selected periods of interest (1899, 2000, 2023, and 2073). As in the analysis of the entire Virginia Coastal Plain model, groundwater budgets for individual budget regions are dominated by net recharge to the water table and outflow to rivers and coastal water bodies. This lateral flow through the surficial aquifer is not indicative of regional water-supply conditions and is mostly proportional to the land area of the region. Furthermore, large year-to-year changes in storage in the surficial aquifer indicate fluctuations in precipitation and climate that are not related to long-term trends in the confined aquifer system that supplies most extracted groundwater. Therefore, this analysis of groundwater budgets will focus on flow through the confined part of the aquifer system, including the Potomac aquifer and all other units not including the surficial aquifer.
Table 8.
Simulated total regional groundwater budgets in the Virginia Coastal Plain model in 1899, 2000, 2023, and 2073.[Values in millions of cubic feet per day. Data may not add to column totals shown because of independent rounding. Values shown as “0.000” or “−0.000” are nonzero values rounded to three decimal places. These are distinct from true zero (“0”) and indicate values with absolute magnitude less than 0.0005. GBR, groundwater budget region; ET, evapotranspiration; NCP, Northwest Coastal Plain; NN, Northern Neck; MP, Middle Peninsula; MJ, Middle James; YJP, York-James Peninsula; C, Chowan; SV, Southeast Virginia; ES, Eastern Shore.]
The rates and magnitudes of groundwater flow in and out of storage in the confined aquifer system, including the Potomac aquifer and all other units, vary substantially by budget region for both the 2000 and 2023 periods (table 7). In 2000 (table 7), simulated storage decline was estimated for all other units in all regions, for the Potomac aquifer in all but one region, and for the entire confined aquifer system for all regions. The largest declines in storage were estimated for regions with the largest withdrawal rates, such as Southeast Virginia and the Middle Peninsula, as well as regions adjacent to regions with the largest withdrawal rates, such as Northwest Coastal Plain, Northern Neck, and Chowan. Most of the storage decline in the confined aquifer system in 2000 occurred not in the Potomac aquifer but in all other confined units overlying the Potomac (table 7). For most groundwater budget regions, the proportion of the storage decline from the Potomac aquifer was less than 20 percent of the total in the confined system, though about 37 percent of the storage decline for the Northern Neck was from the Potomac aquifer. The decline in storage in all regions in all other units in 2000 was partly the result of downward groundwater flow into the Potomac aquifer, in response to Potomac withdrawals, though groundwater withdrawals from all other units were also higher in 2000.
By 2023, years of reduced withdrawal rates that began in about 2010 had resulted in computed increases in storage in the confined aquifer system for most groundwater budget regions (table 7). Only Southeast Virginia and the Northern Neck exhibited net rates of storage decline in the confined system in 2023, and the rates of decline were much smaller than in 2000. Only Southeast Virginia experienced storage decline in all other units, and only the Northern Neck experienced storage decline in the Potomac aquifer. Other regions, including Northwest Coastal Plain, Middle Peninsula, Middle James, York-James Peninsula, and Chowan, showed small to moderate increases in storage in the confined aquifer system in 2023 (table 7). Notably, about 60 percent of the total increase in storage computed for 2023 occurred in the Chowan region. This is likely the result of lower withdrawal rates from the Chowan region, but also substantially lower withdrawal rates from the adjacent Southeast Virginia region.
For most groundwater budget regions, the magnitude of the yearly storage change in both 2000 and 2023 is higher for all other units than for the Potomac aquifer (table 6). The temporal change in storage between 2000 and 2023 is generally larger for the groundwater budget regions with the largest changes in withdrawals, such as Southeast Virginia and the Middle Peninsula. However, changes in flow in and out of storage for the Chowan and Northwest Coastal Plain regions between are notable because they may be the result of changes in groundwater withdrawals in adjacent regions rather than large changes in withdrawals in those regions.
For the Potomac aquifer, the changes in groundwater storage magnitude and direction between 2000 and 2023 are illustrated in figure 16. Negative values, to the right of zero in this case, represent increases in storage, and positive values represent decreases in storage. All but 1 groundwater budget region, the Middle James, were experiencing storage decline in 2000, at varying rates. By 2023, the only region with continued decline in storage was the Northern Neck, and the rate of decline was about 20 percent of the 2023 rate. For the other 6 groundwater budget regions, flow into storage increased in 2023. Similar rates of storage change are projected to continue in the future under similar withdrawal conditions, indicating a continued net increase in total storage within all budget regions together. However, evaluation of the budgets for the entire model area earlier in the report (fig. 14; table 4) indicates relatively small rates of continued net storage decline in the Potomac aquifer, which, in addition to the Northern Neck, must be occurring in areas parts outside the Virginia groundwater budget regions.
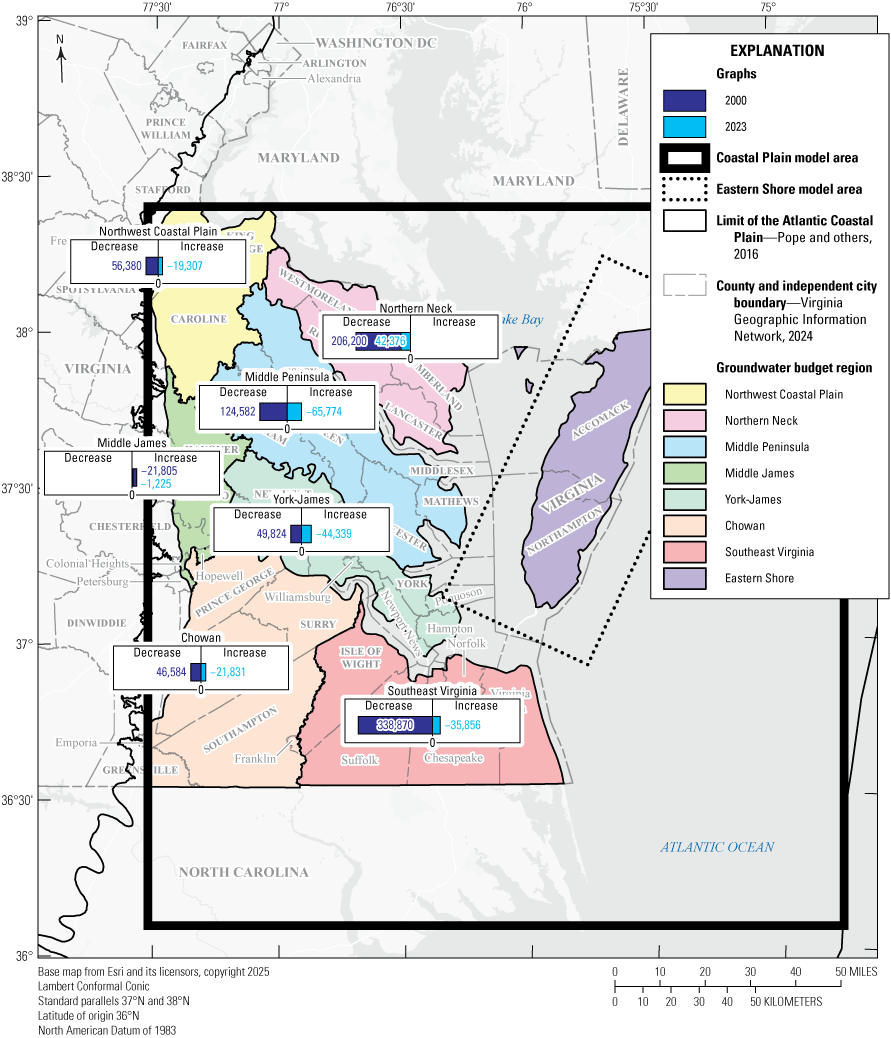
Map showing the comparison of groundwater storage rates in 2000 and 2023 in the Potomac aquifer for groundwater budget regions in the Virginia Coastal Plain model. Flow rates are in cubic feet per day. Positive values indicate storage decrease, and negative values indicate storage increase. Groundwater budget regions from Brian J. Campbell, Virginia Department of Environmental Quality, written commun., 2025.
In the confined part of the aquifer system below the surficial aquifer, groundwater flow laterally across regions of the Virginia Coastal Plain exhibited similar patterns under modern withdrawal conditions, including in 2000 and 2023. However, lateral flows to and from other regions were slightly smaller in 2023 than in 2000 (table 6), likely resulting from lower withdrawal rates. To further simplify the lateral flow rates presented by budget region and simplified hydrogeologic unit in table 6, subtotals for the entire confined part of the aquifer system were computed by combining the values for all other units and the Potomac aquifer in table 9. This enables the evaluation of lateral flow to from other designated groundwater budget regions, as well as flow to or from the undesignated region under approximately current conditions (2023).
Table 9.
Simulated net lateral flow of groundwater among budget regions and groundwater withdrawals for 2023 in the confined groundwater system, including the Potomac aquifer and all other units not including the surficial aquifer.[Values in cubic feet per day. Negative values indicate outflow, positive values indicate inflow.]
In the confined part of the aquifer system, 4 of the groundwater budget regions in 2023 were receiving flow from the area unassigned to a budget region, including the Middle Peninsula, Middle James, York-James Peninsula, and Southeast Virginia. Three budget regions had outflow of groundwater from the confined aquifer system to the unassigned region, including the Northwest Coastal Plain, Northern Neck, and Chowan. These are regions adjacent to neighboring states, indicating that flow is outward from these regions to those states. The signs and magnitude of the net lateral flow for the entire confined aquifer system are indicative of lateral gain or loss from each budget region, regardless of where the flow occurs. Three of the budget regions were experiencing net inward lateral flow in the confined portion of the aquifer system in 2023, including the Middle Peninsula, the York-James Peninsula, and Southeast Virginia. These are the regions with generally larger groundwater withdrawals and historically some of the largest groundwater-level declines.
Four of the budget regions were experiencing net outward lateral flow in 2023, including the Northwest Coastal Plain, the Northern Neck, the Middle James, and the Chowan. Visual examination indicates that outward and inward lateral flows corresponded with major withdrawals within budget regions. In simple terms, budget regions around the perimeter of the large withdrawal areas are experiencing outward lateral flow either out of the Virginia Coastal Plain or inward toward the budget regions with the larger withdrawals, including the Middle Peninsula, the York-James Peninsula, and Southeast Virginia. For the 3 groundwater budget regions experiencing net lateral inflow in the confined part of the aquifer system, these inflows accounted for about 40 percent or more of groundwater withdrawal, even in 2023. For several of the budget regions experiencing net lateral outflow, including the Northwest Coastal Plain, the Middle James, and the Chowan, lateral outward flow was substantially higher than groundwater withdrawal rates. Only the Northern Neck had groundwater withdrawal rates larger than the lateral flow out of the region.
The well field for large industrial withdrawals from the Potomac aquifer in the Southeast Virginia region at Franklin is close to the border with the Chowan region, and the well field for large industrial withdrawals from the Potomac aquifer in the Middle Peninsula region at West Point is close to the border with the York-James region. These well fields, combined with other Coastal Plain withdrawals, have caused extensive areas of groundwater-level decline that are inducing inward flow toward the areas of largest withdrawals, and have been doing so for decades (Heywood and Pope, 2009). While groundwater levels in the Potomac aquifer have risen substantially because of the large change in withdrawal rates after 2009, flow directions do not appear to have changed substantially despite substantial changes in flow magnitudes. For the Potomac aquifer in 2000, budget regions with outflow to other regions included the Northwest Coastal Plain, Middle James, the York-James, and the Chowan (table 6). By 2023, outflow was from the same four regions, but it totaled only about 75 percent of the outflow in 2000. On the other hand, flow outward increased from 2000 to 2023, by a total of about 13 percent, for all other units (not including the surficial aquifer) in the Northwest Coastal Plain, the Middle James, the Chowan, and Southeast Virginia. However, outward flow from the Potomac aquifer to unassigned regions was occurring only from the Northwest Virginia and Northern Neck regions for both 2000 and 2023, indicating groundwater flow toward Maryland and areas beneath Chesapeake Bay.
In 2023, the only part of the confined aquifer system experiencing storage depletion was the Potomac aquifer in the Northern Neck and all other units in Southeast Virginia, resulting in net storage depletion in the entire confined aquifer system for these two regions (table 7). All other combinations of hydrogeologic units and budget regions experienced moderate increases in storage in 2023. In 2000, by comparison, almost all regions were experiencing net storage loss from the confined part of the aquifer system (all other units and the Potomac aquifer). About 33 percent of the storage decline in 2000 was from the Chowan region, about 27 percent was from the Southeast Virginia region, and storage declines in other regions were around 10 percent of the total or lower. Reduced withdrawals and recovery in water levels in recent years for most parts of the confined system have entirely changed groundwater storage conditions in the aquifer system in the Virginia budget regions. However, the net flow inward to most regions from the unassigned region indicates that lateral areas outside of defined budget regions are supplying groundwater to the Virginia budget regions. At least some of this lateral flow seems to be coming from coastal areas beneath Chesapeake Bay and the Eastern Shore which contain salty groundwater. This suggests continued inward flow of salty groundwater even at the partly recovered conditions observed in 2023.
Focusing specifically on the Potomac aquifer, differences between 2000 and 2023 are illustrated in groundwater budgets for individual regions in 2000 and 2023 (figs. 17, 18, 19, 20, 21, 22, and 23). Of particular note are differences in the storage changes, flows in from other overlying hydrogeologic units, and flows in from or out to other budget regions.
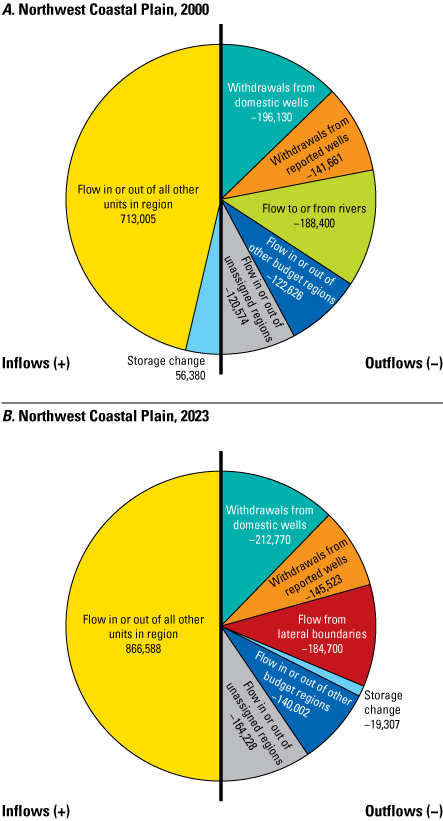
Pie charts showing simulated yearly groundwater budgets for the Potomac aquifer in the Northwest Coastal Plain region of the Virginia Coastal Plain for the years A, 2000, and B, 2023. Flow rates from Gordon and others (2025). Rates are in cubic feet per day.
Pie charts showing simulated yearly groundwater budgets for the Potomac aquifer in the Northern Neck region of the Virginia Coastal Plain for the years A, 2000, and B, 2023. Flow rates from Gordon and others (2025). Rates are in cubic feet per day.
Pie charts showing simulated yearly groundwater budgets for the Potomac aquifer in the Middle Peninsula region of the Virginia Coastal Plain for the years A, 2000, and B, 2023. Flow rates from Gordon and others (2025). Rates are in cubic feet per day.
Pie charts showing Simulated yearly groundwater budgets for the Potomac aquifer in the Middle James region of the Virginia Coastal Plain for the years A, 2000, and B, 2023. Flow rates from Gordon and others (2025). Rates are in cubic feet per day.
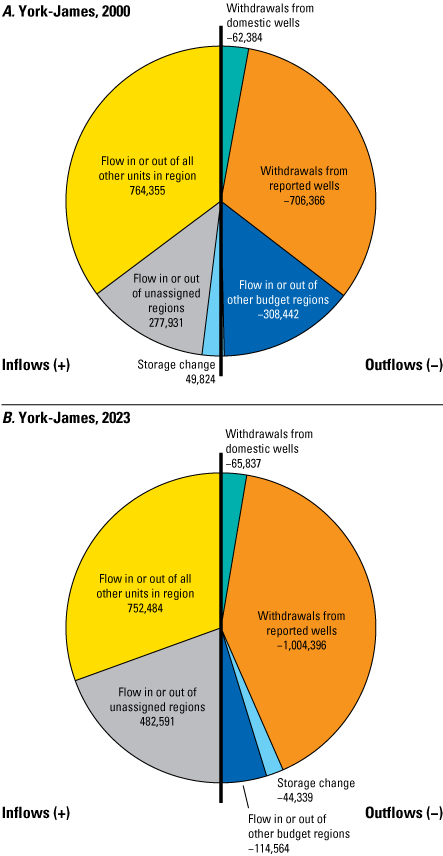
Pie charts showing simulated yearly groundwater budgets for the Potomac aquifer in the York-James region of the Virginia Coastal Plain for the years A, 2000, and B, 2023. Flow rates from Gordon and others (2025). Rates are in cubic feet per day.
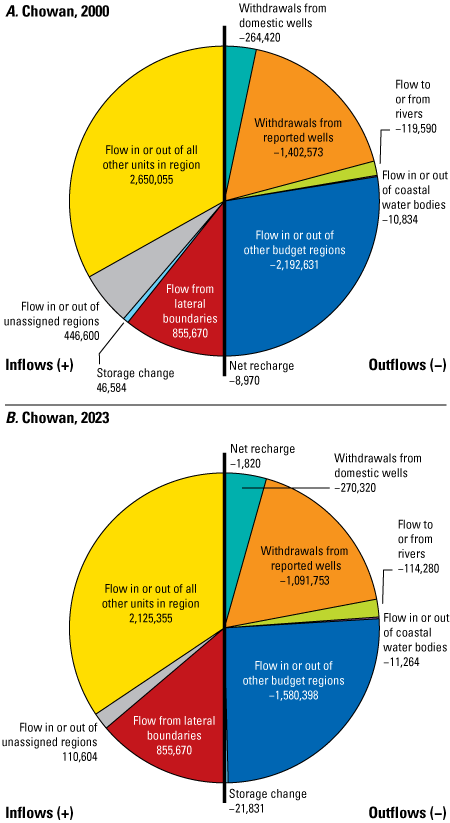
Pie charts showing Simulated yearly groundwater budgets for the Potomac aquifer in the Chowan region of the Virginia Coastal Plain for the years A, 2000, and B, 2023. Flow rates from Gordon and others (2025). Rates are in cubic feet per day.
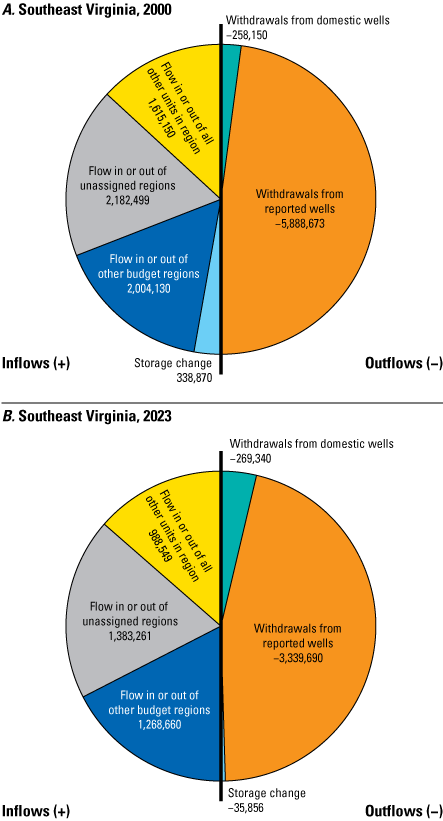
Pie charts showing simulated yearly groundwater budgets for the Potomac aquifer in the Southeast Virginia region of the Virginia Coastal Plain for the years A, 2000, and B, 2023. Flow rates from Gordon and others (2025). Rates are in cubic feet per day.
For the budget regions with the largest withdrawals, such as the Middle Peninsula and Southeast Virginia (figs. 19 and 23), differences between 2000 and 2023 mostly represent the lower magnitudes of flow rates for all flow components, rather than large changes in proportions among flow components, even though the change in storage from substantial storage loss to small storage increase is notable. For Southeast Virginia, the substantial reduction in withdrawals between 2000 and 2023 resulted in similar rates of groundwater inflow from adjacent regions and from overlying hydrogeologic units, in addition to the change in storage.
Differences in groundwater budget in the Potomac aquifer between 2000 and 2023 for regions with lateral outflows greater than withdrawals, such as the Northwest Coastal Plain (fig. 17), show a different pattern. Generally, storage loss in 2000 changed to storage increase in 2023, as previously discussed. However, downward flow from overlying units increased over time, and lateral flow to other regions and to the unassigned region increased in magnitude and in portion of the groundwater budget. Other nuances in regional budgets in the Potomac aquifer detailed in figures 17, 18, 19, 20, 21, 22, and 23 and in table 6 are not discussed further here.
Groundwater Budgets with Simplified Hydrogeologic Units for the Virginia Eastern Shore Model
For the purposes of this analysis, the Eastern Shore budget region is effectively isolated from the budget regions on the west side of the Chesapeake Bay. Flows in or out of the Eastern Shore budget region are to or from coastal water bodies or the saline groundwater interface, as discussed previously. Because this local aquifer system is simulated with a separate local model, the groundwater budget for this region is presented separately here. In terms of net recharge, the Eastern Shore is the fourth largest of the defined budget regions, with about 14 percent of the overall total for the Virginia Coastal Plain in 2023. However, with fresh groundwater only in the surficial and Yorktown-Eastover aquifer system, total storage of fresh groundwater in this system is more limited than for most other regions of the Coastal Plain.
As with the Virginia Coastal Plain west of the Chesapeake Bay, groundwater flow budgets for the Virginia Eastern Shore are dominated by net recharge to the water table, and flow outward to coastal water bodies (fig. 24; table 5). Because the Eastern Shore aquifer system is mostly horizontally layered (figs. 4 and 6), there is no simulated recharge to units other than the surficial aquifer. Furthermore, uniform simulated recharge rates over time mean simulated net recharge changes little over the simulated periods. Much more detail can be observed in the groundwater budgets for the simplified hydrogeologic units: the surficial aquifer (fig. 25), the Yorktown-Eastover upper confining unit (fig. 26), the combined Yorktown-Eastover aquifer system (figs. 27 and 28), and the St. Marys confining unit (fig. 29).
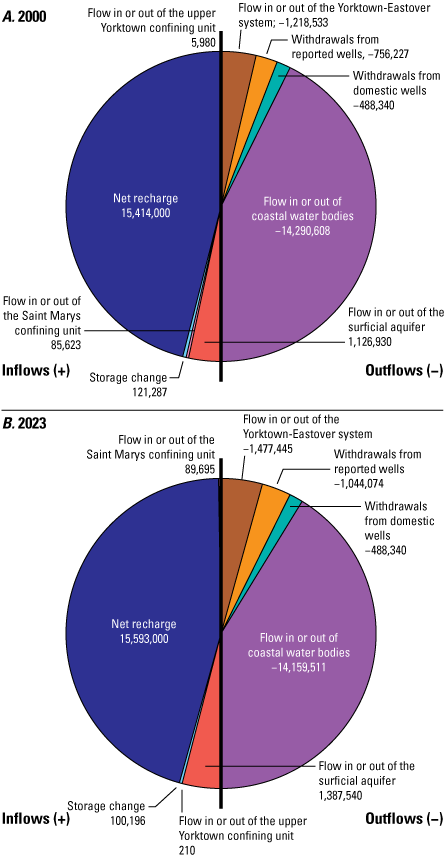
Pie charts showing simulated yearly groundwater budgets for the entire Virginia Eastern Shore model area for A, 2000, and B, 2023. Flow rates from Gordon and others (2025). Rates are in cubic feet per day.
Pie charts showing simulated yearly groundwater budgets for the unconfined surficial aquifer in the Virginia Eastern Shore model for A, 2000, and B, 2023. Flow rates from Gordon and others (2025). Rates are in cubic feet per day.
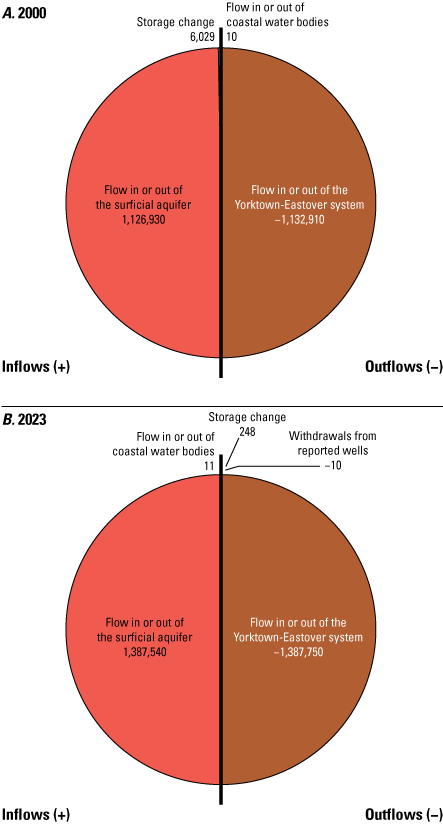
Pie charts showing simulated yearly groundwater budgets for the Yorktown-Eastover upper confining unit in the Virginia Eastern Shore model for A, 2000, and B, 2023. Flow rates from Gordon and others (2025). Rates are in cubic feet per day.
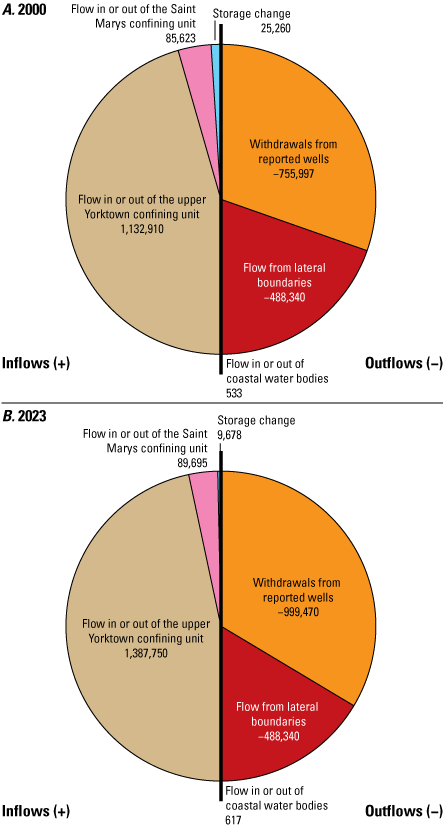
Pie charts showing simulated yearly groundwater budgets for the combined Yorktown-Eastover aquifer system in the Virginia Eastern Shore model for A, 2000, and B, 2023. Flow rates from Gordon and others (2025). Rates are in cubic feet per day.
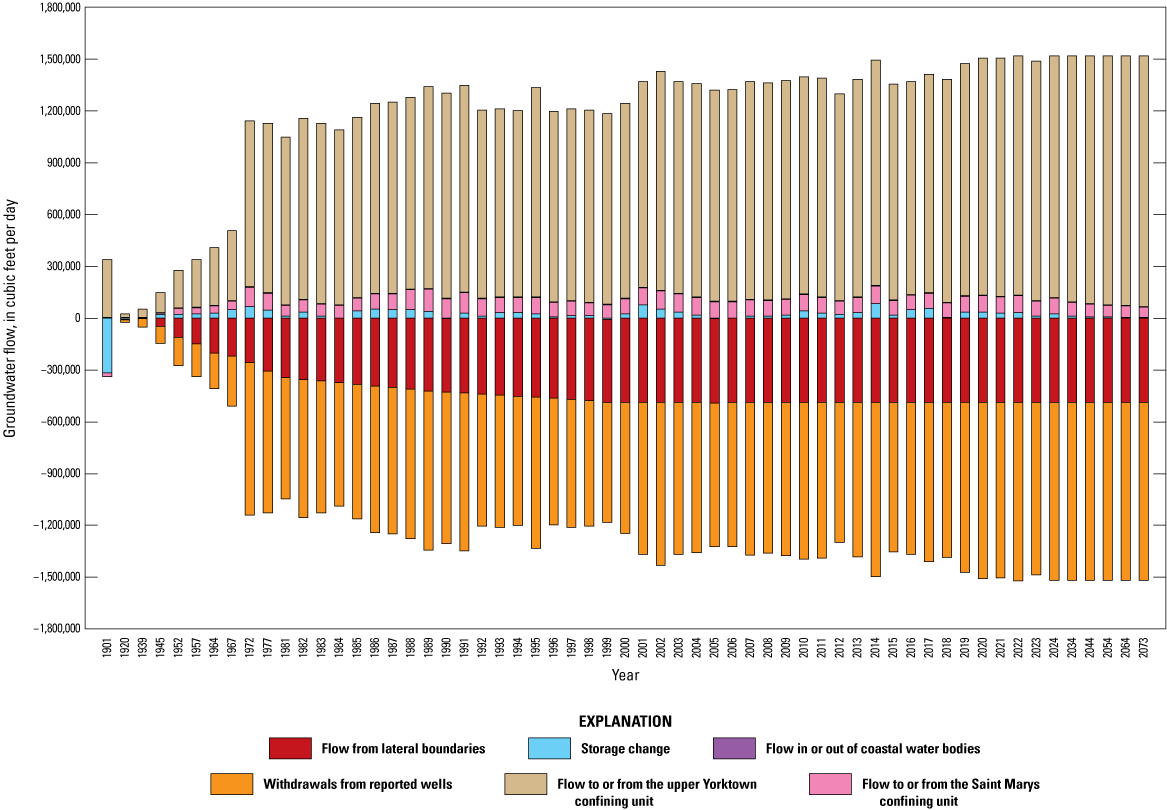
Graph showing simulated groundwater budgets for the combined Yorktown-Eastover aquifer system in the Virginia Eastern Shore model for all model time periods. Flow rates from Gordon and others (2025). Time periods for historical and future periods are multiple years in length.
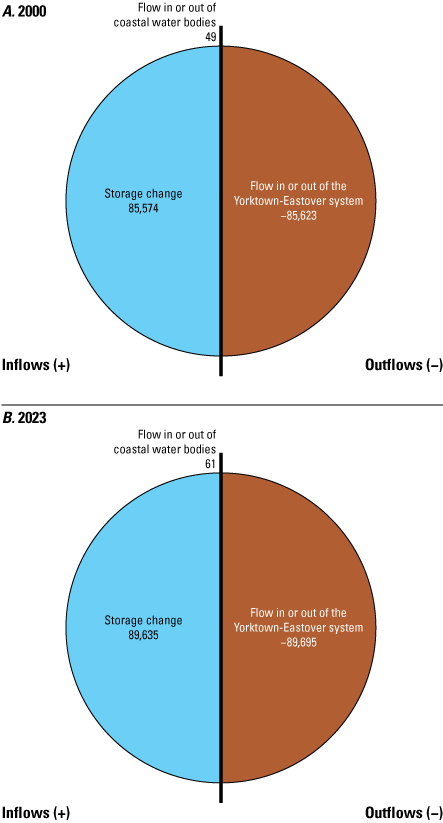
Pie charts showing simulated yearly groundwater budgets for the St. Marys confining unit in the Virginia Eastern Shore model for A, 2000, and B, 2023. Flow rates from Gordon and others (2025). Rates are in cubic feet per day.
In evaluation of long-term groundwater resources, important components of the simulated groundwater budget—such as withdrawals of water from the aquifer system, groundwater flow to other adjacent hydrogeologic units, and changes in groundwater storage—can be better evaluated once the surficial recharge component is removed. Consequently, the surficial budget components are not discussed here in further detail, other than noting that groundwater budget components in the confined hydrogeologic units are only a small fraction of net recharge. Also, because annual variations in groundwater budgets in the confined part of the Eastern Shore aquifer system are quite small (fig. 28), they are not discussed here in detail, though charts are included in parallel with the analysis for the other budget regions.
In the early model period ending in 1901, simulated storage was increasing (negative sign) in the confined units, because flow was downward and outward from the center of the peninsula (Sanford and others, 2009), and withdrawals were zero or close to zero. For most of the time since then, storage decreased (positive sign) in all units as withdrawals increased gradually then leveled off near current (2023) rates (fig. 28). Simulated groundwater withdrawal in 2023 was more than 20 percent higher than in 2000 entirely from the Yorktown-Eastover aquifer system, resulting in an increase in groundwater flow through the system of close to 20 percent greater.
The large proportion of the total storage decline in the St. Marys aquifer rather than in the combined Yorktown-Eastover system (table 5) demonstrates where most recent changes in the system are occurring. With water levels relatively stable in the combined Yorktown-Eastover aquifer system in recent years, more water is flowing into the aquifer from the St. Marys confining unit below, and this is the unit undergoing the greatest storage depletion. Overall, storage depletion in 2023 of more than 100,000 ft3/d was substantially less than the 2000 total of 121,000 ft3/d. However, storage depletion from the combined Yorktown-Eastover aquifer system in 2023 of approximately 10,000 ft3/d was less than half of the rate of 25,000 ft3/d in 2000. Conversely, storage loss from the St. Marys confining unit in 2023 of about 90,000 ft3/d represented about a 4,000 ft3/d increase. Framing the storage change in terms of the withdrawal rate, storage loss in 2023 from the entire confined aquifer system below the surficial aquifer accounted for about 6.5 percent of total withdrawals. Storage loss from the combined Yorktown-Eastover aquifer system accounted for less than 1 percent of withdrawals from the aquifer system, but only because these withdrawals are causing storage loss elsewhere in the confined system. This is important because the St. Marys confining unit is known to contain salty water, so the storage change in the St. Marys confining unit is indicative of a moving saltwater interface.
Consequently, another notable pattern resulting from long-term groundwater withdrawal was observed in the flow to the Yorktown-Eastover aquifer system from other hydrogeologic units. Groundwater flow into the Yorktown-Eastover aquifer system in 2000 of about 1,200 ft3/d was almost 4 times the rate of inflow during the 1901 model period (table 5). The rate of inflow in 2023 of nearly 1,500 ft3/d was approximately another 20 percent higher than in 2000 (table 5; fig. 27). This indicates that small recent increases in withdrawals, along with continued equilibration of the Yorktown-Eastover aquifer system, are resulting in increased flow into the aquifer system, mostly from the overlying confining unit. The simulated net inflow rate in 2023 for the Yorktown-Eastover aquifer system was only slightly less than the withdrawal rate, indicating inflows from other units account for almost all current withdrawals. About 94 percent of the flow into the Yorktown-Eastover aquifer system in 2023 was downward through the overlying confining unit, while the remaining 6 percent was from the underlying St. Marys confining unit. Incidentally, the proportional contribution from the St. Marys confining unit accounted for about 91 percent of the withdrawal total in 2000, but the rate of flow from the St. Marys was slightly smaller. In 2023, the inflow into the combined Yorktown-Eastover aquifer system from the overlying unit of about 1.4 million ft3/d was 8.9 percent of net recharge to the water table, up from 7.3 percent in 2000. This is 93 percent of all flow into the Yorktown-Eastover aquifer system, but only 2 percent of total recharge at the water table. Small increases to this proportion are predicted for the future.
If withdrawal rates in the future remain similar to present rates, predicted incremental changes in the groundwater budget for this aquifer system are proportionally small. While overall storage loss from the system is predicted to decrease in the future, the proportion of storage loss contributed by the St. Marys confining unit is predicted to grow. Another predicted future result of groundwater pumping near current rates is increased flow into the combined Yorktown-Eastover aquifer system at rates higher than the present (2023).
Sustainability of Groundwater Resources in the Virginia Coastal Plain Aquifer System
The results of the water budgets quantify the total volume of flow to the primary aquifers, including the Potomac aquifer for the Virginia Coastal Plain and the Yorktown-Eastover aquifer system on the Eastern Shore; however, estimation of a sustainable pumping rate for the confined aquifers is a complex problem. According to Alley and others (1999), resource sustainability has proved to be an elusive concept to define in a precise manner and with universal applicability, and the concept of groundwater sustainability and its application to real situations is multifaceted and complex. Groundwater sustainability has been defined by the USGS as the use of groundwater in a manner that can be maintained for an indefinite period without causing unacceptable environmental, economic, or social consequences (Alley and others, 1999). The definition of “unacceptable consequences” is largely subjective and may involve many criteria. Devlin and Sophocleous (2005) and Zhou (2009) make a distinction between safe yield and sustainability, where sustainability is the amount of water that can be withdrawn without depleting an aquifer and safe yield also involves concerns for ecological thresholds and water quality. Romano and Preziosi (2010) demonstrated that the relationship between pumping and recharge at the local scale is important. Local hydraulic properties, such as transmissivity and storativity, determine the amount of drawdown that occurs from pumping a well. At the local scale, aquifer properties and recharge can affect the sustainable pumping rate for the aquifer; however, because surface-water and groundwater systems are connected, pumping can result in reductions in discharge to streams, which may affect ecological systems and cause resource management issues (Bredehoeft, 2002; Barlow and Leake, 2012).
In river ecosystems, reductions in streamflow are linked to reductions in macroinvertebrates (Kennen and others, 2014) and fish (Bain and others, 1988; Bradford and Heinonen, 2008); during some seasons, groundwater discharge (base flow) is typically the primary source of streamflow for gaining stream systems like those in the Mid-Atlantic region. In addition, wetlands are also affected by decreases in groundwater discharge. Wetlands cover approximately 4 percent of the state of Virginia (Dahl, 1990), and these wetlands occur in both tidal and nontidal environments. Tidal wetlands (marshes) are the second largest category of wetlands in the state. Previous studies indicated that tidal marshes are predominantly affected by surface-water inundation from tidal oscillations, but Guimond and others (2025) suggest that the benefits of marshes, such as nutrient removal and accretion of organic matter, are influenced by groundwater discharge. In this study, water budgets that indicated a small decline in river leakage coincided with a large loss in storage, which suggests that a return to pumping rates prior to 2010, when pumping rates were reduced, could result in reduced groundwater discharge to streams.
The largest fluctuation in groundwater storage is driven by the difference between recharge and evapotranspiration in the surficial aquifer. Therefore, future water supply could be affected by changes in net recharge. In this study, recharge was assumed to be constant for future years. However, a change in the recharge rates could alter the sustainability of future groundwater extraction. Predicting future recharge is dependent on the type of climate model used, and few studies have estimated future recharge in Virginia. The water budgets for the Potomac aquifer indicate there was substantial storage decline between the 1950s and 2008, and the rate of storage decline subsided as pumping reductions occurred in the early 2000s. Additional pumping, beyond current (2023) rates, likely will cause additional storage decline and negatively affect the long-term sustainability of groundwater supply, particularly for the confined aquifers that currently provide most of the withdrawn water.
Assumptions and Limitations of Groundwater Budget Analyses
Some underlying limitations of the groundwater budget analyses in this report contribute to uncertainty in the results. Model accuracy is limited because of simplifications of the hydrogeologic model layering or boundary conditions represented in the Virginia Coastal Plain and Eastern Shore models, respectively (Heywood and Pope, 2009; Sanford and others, 2009), and this can affect the resulting water budget. Hydrogeologic units were identified by correlating hundreds of borehole records over approximately 13,000 square miles (McFarland and Bruce, 2006), so there are uncertainties related to the thickness of each unit across the model. The size of the model grid cells introduces spatial discretization limitations. Because of the coarse grid resolution used in the Virginia Coastal Plain model (1 square mile per grid cell), surface-water features such as rivers and streams are not well represented which results in river discharge values that may be higher or lower than observed groundwater discharge to surface water. The Hydrogeologic-Unit Flow package used in the Virginia Coastal Plain model allows cells to belong to more than one hydrogeologic unit, so a simplification was made in which the unit with most of the cell was assigned to the intersected hydrogeologic unit. In addition to the limitations introduced by the modeling assumptions, model calibration contributes to uncertainty in the results. Inverse groundwater modeling produces non-unique solutions; therefore, more than one set of aquifer properties can provide the same fit with the data. Generally, the groundwater flow direction would not be expected to change with different aquifer parameters, but changes in properties such as hydraulic conductivity, storage, and porosity distribution could alter the volumetric flow rates and produce differences in the budget. Even so, both groundwater models have performed reasonably well with matching flows and hydraulic heads to historical measurements at the intended regional scale, and numerical errors in yearly flow budgets were well below 2 percent of the budget totals for simulated periods.
This report does not assess the affect of new pumping on water availability in the Virginia coastal plain model because that analysis would require a robust definition of management priorities to optimize, and additional model runs to assess different future pumping scenarios. The Virginia Coastal Plain model was spatially discretized as a regional model, so evaluations at that scale are most appropriate. A finer grid cell size would likely be needed to assess the connection between the surficial aquifer and streams to quantify changes in groundwater discharge from the surficial aquifer resulting from pumping. The model is more appropriate for simulation of the confined part of the aquifer system, which was the primary reason for its design.
The extent of potential saltwater intrusion is not possible to predict accurately from water budget analyses. The location of the interface in the deeper aquifers is uncertain and likely has been responding to changes in sea level over glacial-cycle timescales (Paldor and others, 2022). Estimating salinity distributions is a challenge in isolating the mechanisms and measuring heterogeneous offshore discharge and is further affected by the representation of geologic heterogeneity (Yu and Michael, 2022). Sanford and Pope (2010) demonstrated that the prediction of salinization is difficult to achieve because the salinity distribution is affected by previous sea-level fluctuations. Additional research to better parameterize aquifer heterogeneity in the Virginia Coastal Plain would improve predictions of saltwater intrusion. The results of this study suggest there is potential for ongoing and future intrusion of salty groundwater, particularly for the Eastern Shore, but this is not well quantified in the budget analyses in this report.
Summary and Conclusions
The widespread decline in groundwater levels in confined Coastal Plain aquifers has changed groundwater conditions substantially from historical conditions, reducing the quantity of groundwater in storage, altering directions of groundwater flow, inducing saltwater intrusion in aquifers in some coastal areas, and causing aquifer-system compaction and land subsidence, leading to increasing rates of relative sea-level rise. All these factors led to increased public concerns about the availability and sustainability of groundwater resources in the Virginia Coastal Plain aquifer system.
Groundwater models for the Virginia Coastal Plain and Virginia Eastern Shore, developed by the U.S. Geological Survey in cooperation with Virginia Department of Environmental Quality, have been used to help evaluate and predict groundwater flow through the aquifer systems. The application of detailed zone budget evaluations to these models has enabled more detailed evaluation and greater understanding of both vertical flow through aquifers and confining units and lateral flow across geographic regions. Decades of substantial groundwater withdrawal from the aquifer system have altered groundwater flow from prior conditions, as demonstrated with both the Virginia Coastal Plain and Eastern Shore groundwater models.
To quantify spatial variation in groundwater flow through the aquifer system, the Coastal Plain of Virginia was divided geographically into 8 groundwater budget regions. Groundwater budgets for the 7 budget regions west of the Chesapeake Bay were computed using the Virginia Coastal Plain groundwater model, and budgets for the Eastern Shore were computed with a separate groundwater model developed for that peninsula. Within groundwater budget regions, the aquifer system was subdivided by hydrogeologic unit, with subsequent simplified grouping of hydrogeologic units to highlight flow into the primary aquifers of interest. For the Virginia Coastal Plain as a whole, the primary aquifer of interest is the Potomac aquifer, which supplies the largest portion of groundwater withdrawal, especially for larger users. For the Eastern Shore peninsula, the primary aquifer of interest is the Yorktown-Eastover aquifer system, which supplies most of the groundwater withdrawal and is the only source of fresh groundwater beneath the thin, unconfined surficial aquifer.
For Virginia groundwater budget regions other than the Eastern Shore, withdrawal rates in recent years (2010–2023) that are well below historical reported maximum have enabled simulated moderate recovery in groundwater storage in some parts of the aquifer system, particularly the Potomac aquifer, from which most water is withdrawn. Conversely, for the Eastern Shore region, withdrawal rates in several years prior to the present (2023) have been near reported historical maximums, leading to continued depletion of storage in the aquifer system and indicators of continued upward and lateral saltwater intrusion into the confined Yorktown-Eastover aquifer system.
Groundwater budgets for the Virginia Coastal Plain demonstrate that groundwater flow is generally outward from the surficial aquifer to rivers and coastal water bodies and downward through a series of underlying aquifers and confining units to the Potomac aquifer, which is the deepest aquifer and the source of most groundwater withdrawals. Downward flow reaching the Potomac aquifer currently (2023) is estimated to be only 7 percent of the total net recharge at the water table but makes up about 66 percent of inflows to the aquifer in Virginia. Lateral flows inward to defined groundwater budget zones in Virginia provide most of the remaining inflow to the Potomac aquifer. For several decades prior to 2010, high rates of withdrawal from the Potomac aquifer resulted in substantial decline in groundwater storage in the aquifer and in most overlying confined units. In the years since 2010, through the present (2023), rates of withdrawal substantially lower than the reported maximum have resulted in small net increases in groundwater storage in the confined aquifer system for most regions of the Coastal Plain in Virginia. However, a relatively small rate of storage decline continues in the Potomac aquifer in areas outside of Virginia groundwater budget regions and in several of the hydrogeologic units overlying the Potomac aquifer. Under conditions when withdrawal rates were near historical maximums, close to 40 percent of total withdrawal from confined aquifers below the surficial were supplied by storage decline in the confined system, with about 86 percent of the storage decline from confined units other than the Potomac aquifer. Downward flow into the confined aquifer system has been influenced by pumping rates, with increased downward flow occurring during periods of higher withdrawal, such as the decade from about 1999 to 2009. Downward flow continues under current (2023) conditions, but flow rates are lower than in earlier decades with larger withdrawals. Even now, the downward flow induced by pumping is a large and important portion of groundwater budgets for confined aquifers, including the Potomac aquifer.
Geographically, groundwater flow in the confined part of the Virginia Coastal Plain is generally inward from perimeter regions of the Virginia Coastal Plain toward central regions with the largest withdrawal rates, including the Middle Peninsula, the Middle James, the York-James, and Southeast Virginia. Overall, small rates of ongoing storage depletion in the entire groundwater model, including areas outside of defined budget regions in Virginia, indicate loss of storage in the area beneath the Chesapeake Bay. This could mean inward movement of the salty groundwater interface, though that is not well quantified with the model zonation chosen for this study.
Groundwater budgets from the Virginia Eastern Shore model indicate that groundwater flow for the isolated aquifer system of that peninsula is generally outward from the surficial aquifer to coastal water bodies and downward into the confined Yorktown-Eastover aquifer system, which is the source of most withdrawals. Downward flow into the confined Yorktown-Eastover aquifer system is estimated to be about 2 percent of total recharge and less than 9 percent of net recharge but makes up more than 93 percent of all inflows to the aquifer. Decades of substantial but relatively consistent groundwater withdrawals have induced greater downward flow rates into the confined aquifer system and have resulted in loss of groundwater from storage. Currently (2023), estimated storage loss accounts for slightly under 7 percent of withdrawals from the confined aquifer system. The current (2023) withdrawal rate from the confined Yorktown-Eastover aquifer system is near the highest reported rate for the Eastern Shore, which means that storage depletion is expected to continue at or near the current rate, even though groundwater levels seem to be relatively stable, with only slight declines in recent years. Estimated groundwater flow rates upward from the confining unit underlying the Yorktown-Eastover aquifer system and small rates of inflow from coastal water bodies underscore ongoing concerns about intrusion of salty groundwater.
Continued depletion of groundwater storage, even at small rates, and apparent inward groundwater flow from coastal regions contribute to continued public concerns about sustainability of groundwater resources for the Virginia Coastal Plain. Higher simulated rates of storage depletion for the Eastern Shore indicate that part of the aquifer system is at higher risk, with a smaller amount of total groundwater storage, a smaller rate of downward flow from overlying units into the confined system, and indicators of intrusion of salty groundwater near the coast. Aside from the Eastern Shore, recent recovery in storage and relatively steady groundwater levels over the past 10 to 15 years for the Virginia Coastal Plain have alleviated some previous concerns about the effects of unsustainable rates of groundwater withdrawal. However, groundwater budgets from the period of highest historical withdrawal rates highlight the potential problems associated with a return to those higher rates of withdrawal. The continued viability of groundwater supply from the Viriginia Coastal Plain aquifer system will likely depend on continued careful use of this resource, which can be partly informed by models that enable quantification of groundwater budgets and estimation of future effects of current practices.
References Cited
Alley, W.M., Reilly, T.E., and Franke, O.L., 1999, Sustainability of ground-water resources: U.S. Geological Survey Circular 1186, 79 p. [Also available at https://doi.org/10.3133/cir1186.]
Anderman, E.R., and Hill, M.C., 2000, MODFLOW-2000, the U.S. Geological Survey modular ground-water model—Documentation of the hydrogeologic-unit flow (HUF) package: U.S. Geological Survey Open-File Report 00–342, 89 p., accessed January 6, 2025 at https://doi.org/10.3133/ofr00342.
Anderman, E.R., Kipp, K.L., Hill, M.C., Valstar, J., and Neupauer, R.M., 2002, MODFLOW-2000, the U.S. Geological Survey modular ground-water model—Documentation of the model-layer variable-direction horizontal anisotropy capability of the hydrogeologic-unit flow package: U.S. Geological Survey Open-File Report 02–409, 61 p., accessed January 6, 2025 at https://doi.org/10.3133/ofr02409.
Anderman, E.R., and Hill, M.C., 2003, MODFLOW-2000, the U.S. Geological Survey modular ground-water model – Three additions to the Hydrogeologic-Unit Flow (HUF) Package—Alternative storage for the uppermost active cells, Flows in hydrogeologic units, and the Hydraulic-conductivity depth-dependence (KDEP) capability: U.S. Geological Survey Open-File Report 03–347, 36 p., accessed January 6, 2025 at https://doi.org/10.3133/ofr03347.
Bain, M.B., Finn, J.T., and Booke, H.E., 1988, Streamflow Regulation and Fish Community Structure: Ecology, v. 69, no. 2, p. 382–392. [Also available at https://doi.org/10.2307/1940436.]
Barlow, P.M., and Leake, S.A., 2012, Streamflow depletion by wells—Understanding and managing the effects of groundwater pumping on streamflow: U.S. Geological Survey Circular 1376, 84 p., accessed February 10, 2025 at https://pubs.usgs.gov/circ/1376/.
Bradford, M.J., and Heinonen, J.S., 2008, Low Flows, Instream Flow Needs and Fish Ecology in Small Streams: Canadian Water Resources Journal, v. 33, no. 2, p. 165–180, at https://doi.org/10.4296/cwrj3302165.
Bredehoeft, J.D., 2002, The Water Budget Myth Revisited—Why Hydrogeologists Model: Ground Water, v. 40, no. 4, p. 340–345, accessed February 10, 2025, at https://doi.org/10.1111/j.1745-6584.2002.tb02511.x.
Cederstrom, D.J., 1957, Geology and ground-water resources of the York-James Peninsula, Virginia: U.S. Geological Survey Water-Supply Paper 1361, 237 p. [Also available at https://pubs.usgs.gov/wsp/1361/report.pdf.]
Dahl, T.E., 1990, Wetlands losses in the United States 1780’s to 1980’s: Washington, D.C.: U.S. Department of the Interior, Fish and Wildlife Service, 13 p., accessed April 18, 2025, at https://digital.library.unt.edu/ark:/67531/metadc948667/.
Devlin, J.F., and Sophocleous, M., 2005, The persistence of the water budget myth and its relationship to sustainability: Hydrogeology Journal, v. 13, no. 4, p. 549–554, accessed February 10, 2025, at https://doi.org/10.1007/s10040-004-0354-0.
Eggleston, J.R., and Pope, J.P., 2013, Land subsidence and relative sea-level rise in the southern Chesapeake Bay region: U.S. Geological Survey Circular 1392, 24 p. [Also available at https://doi.org/10.3133/cir1392.]
Foster, B.M., Lopez, R., Crawford, E.R., Cook, W., Krigsvold, J., Langston, J.H., Langston, T., Miles, G., Moore, K., Garman, G.C., Rice, K.C., and Jastram, J.D., 2024, Characterization of the water resources of the Pamunkey River watershed in Virginia—A review of water science, management, and traditional ecological knowledge: U.S. Geological Survey Scientific Investigations Report 2024–5024, 64 p., accessed August 4, 2025 at https://doi.org/10.3133/sir20245024.
Gordon, A., 2007, Simulated effects of projected 2010 withdrawals on ground-water flow and water levels in the New Jersey coastal plain—A task of the New Jersey Water Supply Plan, 2006 revision: U.S. Geological Survey Scientific Investigations Report 2007–5134, 116 p. [Also available at https://doi.org/10.3133/sir20075134.]
Gordon, A.D., Fredericks, R.S., and Pope, J.P., 2025, Input and output files from the Zonebudget program used with MODFLOW models to compute regional groundwater budgets for the Virginia Coastal Plain aquifer system: U.S. Geological Survey data release, https://doi.org/10.5066/P13GJEYW.
Guimond, J.A., Grande, E., Michael, H.A., Pratt, D., Herndon, E., Noyce, G.L., Ward, N.D., Forbrich, I., Regier, P., Berens, M.J., and Arora, B., 2025, The hidden influence of terrestrial groundwater on salt marsh function and resilience: Nature Water, v. 3, no. 2, p. 157–166. [Also available at https://doi.org/10.1038/s44221-024-00384-6.]
Guo, W., and Langevin, C.D., 2002, User's guide to SEAWAT—A computer program for simulation of three-dimensional variable-density ground-water flow: U.S. Geological Survey Techniques of Water-Resources Investigations, book 6, chap. A7, 77 p. [Also available at https://doi.org/10.3133/twri06A7.]
Harbaugh, A.W., 1990, A computer program for calculating subregional water budgets using results from the U.S. Geological Survey modular three-dimensional finite-difference ground-water flow model: U.S. Geological Survey Open-File Report 90–392, 46 p., accessed January 6, 2025 at https://doi.org/10.3133/ofr90392.
Harbaugh, A.W., Banta, E.R., Hill, M.C., and McDonald, M.G., 2000, MODFLOW-2000, the U.S. Geological Survey modular ground-water model—User guide to modularization concepts and the ground-water flow process: U.S. Geological Survey Open-File Report 00–92, 121 p., accessed January 6, 2025 at https://doi.org/10.3133/ofr200092.
Harbaugh, A.W., 2009, ZONEBUDGET—A program for computing subregional water budgets for MODFLOW groundwater flow models (ver. 3.01, December 2009): U.S. Geological Survey software release, accessed January 6, 2025 at https://www.usgs.gov/software/zonebudget-program-computing-subregional-water-budgets-modflow-groundwater-flow-models.
Heywood, C.E., and Pope, J.P., 2009, Simulation of groundwater flow in the Coastal Plain Aquifer System of Virginia: U.S. Geological Survey Scientific Investigations Report 2009–5039, 115 p. [Also available at https://doi.org/10.3133/sir20095039.]
Kearns, M.R., and Pope, J.P., 2025, Estimated hydrogeologic, spatial, and temporal distribution of self-supplied domestic groundwater withdrawals for aquifers of the Virginia Coastal Plain: U.S. Geological Survey Scientific Investigations Report 2025–5051, 45 p., accessed June 17, 2025 at https://doi.org/10.3133/sir20255051.
Kennen, J.G., Riskin, M.L., and Charles, E.G., 2014, Effects of streamflow reductions on aquatic macroinvertebrates—Linking groundwater withdrawals and assemblage response in southern New Jersey streams, USA: Hydrological Sciences Journal, v. 59, no. 3-4, p. 545–561, accessed February 10, 2025, at https://doi.org/10.1080/02626667.2013.877139.
Langevin, C.D., Shoemaker, W.B., and Guo, W., 2003, MODFLOW-2000, the U.S. Geological Survey modular ground-water model—Documentation of the SEAWAT-2000 version with the variable-density flow process and the integrated MT3DMS transport process: U.S. Geological Survey Open-File Report 03–426, 43 p., accessed January 6, 2025 at https://doi.org/10.3133/ofr03426.
Masterson, J.P., Pope, J.P., Fienen, M.N., Monti, J., Jr., Nardi, M.R., and Finkelstein, J.S., 2016, Assessment of groundwater availability in the Northern Atlantic Coastal Plain aquifer system from Long Island, New York, to North Carolina: U.S. Geological Survey Professional Paper 1829, 76 p. [Also available at https://doi.org/10.3133/pp1829.]
McFarland, E.R., and Bruce, T.S., 2006, The Virginia Coastal Plain hydrogeologic framework: U.S. Geological Survey Professional Paper 1731, 118 p., 25 pls. [Also available at https://pubs.usgs.gov/pp/2006/1731/.]
McFarland, E.R., 2010, Groundwater-quality data and regional trends in the Virginia Coastal Plain, 1906–2007: U.S. Geological Survey Professional Paper 1772, 86 p., 14 pls., accessed March 31, 2015, at https://pubs.usgs.gov/pp/1772.
McFarland, E.R., 2017, Hydrogeologic framework and hydrologic conditions of the Piney Point aquifer in Virginia: U.S. Geological Survey Scientific Investigations Report 2017–5041, 63 p., 2 pls., and CD-ROM.[Also available at https://doi.org/10.3133/sir20175041.]
McFarland, E.R., and Beach, T.A., 2019, Hydrogeologic framework of the Virginia Eastern Shore: U.S. Geological Survey Scientific Investigations Report 2019–5093, 26 p., 13 pls. [Also available at https://doi.org/10.3133/sir20195093.]
National Oceanic and Atmospheric Administration, 2024, Climate at a glance—Divisional time series: National Oceanic and Atmospheric Administration National Centers for Environmental Information database, accessed July 18, 2024, at https://www.ncei.noaa.gov/access/monitoring/climate-at-a-glance/divisional/time-series/4401/pcp/1/0/1900-2023.
Paldor, A., Frederiks, R.S., and Michael, H.A., 2022, Dynamic Steady State in Coastal Aquifers Is Driven by Multi‐Scale Cyclical Processes, Controlled by Aquifer Storativity: Geophysical Research Letters, v. 49, no. 11, article e2022GL098599, accessed February 10, 2025, at https://doi.org/10.1029/2022GL098599.
Pope, J.P., McFarland, E.R., and Banks, R.B., 2008, Private domestic-well characteristics and the distribution of domestic withdrawals among aquifers in the Virginia Coastal Plain: U.S. Geological Survey Scientific Investigations Report 2007–5250, 47 p. [Also available at https://doi.org/10.3133/sir20075250.]
Pope, J.P., Andreasen, D.C., McFarland, E.R., and Watt, M.K., 2016, Digital elevations and extents of regional hydrogeologic units in the Northern Atlantic Coastal Plain aquifer system from Long Island, New York, to North Carolina (ver. 1.1, January 2021): U.S. Geological Survey data release, https://doi.org/10.3133/ds996.
Romano, E., and Preziosi, E., 2010, The Sustainable Pumping Rate Concept—Lessons from a Case Study in Central Italy: Ground Water, v. 48, no. 2, p. 217–226. [Also available at https://doi.org/10.1111/j.1745-6584.2009.00628.x.]
Sanford, W.E., and Pope, J.P., 2010, Current challenges using models to forecast seawater intrusion—Lessons from the Eastern Shore of Virginia, USA: Hydrogeology Journal, v. 18, no. 1, p. 73–93. [Also available at https://doi.org/10.1007/s10040-009-0513-4.]
Sanford, W.E., Pope, J.P., and Nelms, D.L., 2009, Simulation of groundwater-level and salinity changes in the Eastern Shore, Virginia: U.S. Geological Survey Scientific Investigations Report 2009–5066, 125 p. [Also available at https://pubs.er.usgs.gov/publication/sir20095066.]
U.S. Census Bureau, 2021, TIGER 2020 tabulated census block shapefile: U.S. Census Bureau, accessed September 26, 2022, at https://www2.census.gov/geo/tiger/TIGER2020/.
U.S. Geological Survey, 2023a, Monitoring Virginia Eastern Shore groundwater conditions, U.S. Geological Survey web page, accessed August 10, 2025 at https://va.water.usgs.gov/webmap/groundwater-wells-es/.
U.S. Geological Survey, 2023b, Virginia and West Virginia groundwater levels and trends, U.S. Geological Survey web page, accessed August 10, 2025, at https://rconnect.usgs.gov/vawv-groundwater.
Virginia Department of Environmental Quality, 2020, 2019 update and recalibration of the VAHydroGW-VCPM: Virginia Department of Environmental Quality report, 86 p., accessed September 5, 2025, at https://www.deq.virginia.gov/home/showpublisheddocument/27220/638701940153300000.
Virginia Department of Environmental Quality, 2003, Virginia Drought Assessment and Response Plan: Virginia Department of Environmental Quality report, 23 p., accessed January 2, 2006 at https://www.deq.virginia.gov/home/showpublisheddocument/5115/637490843054630000.
Virginia Department of Environmental Quality, 2024a, Virginia Coastal Plain model (VAHydroGW-VCPM) 2023-2024 annual simulation of potentiometric groundwater surface elevations of reported and total permitted use: Virginia Department of Environmental Quality report, 53 p., accessed September 5, 2025, at https://www.deq.virginia.gov/home/showpublisheddocument/27226/638702936855630000.
Virginia Department of Environmental Quality, 2024b, Virginia Eastern Shore model (VAHydroGW-ES) 2023-2024 annual simulation of reported use and total permitted groundwater levels: Virginia Department of Environmental Quality report, 32 p., accessed September 5, 2025, at https://www.deq.virginia.gov/home/showpublisheddocument/27228/638702936863430000.
Virginia Department of Environmental Quality, 2025, Annual water resources report—Status of Virginia’s water resources and management activities: Virginia Department of Environmental Quality report, 58 p., accessed January 2, 2026 at https://www.deq.virginia.gov/home/showpublisheddocument/32729/639026074417130000.
Virginia General Assembly, 1973, The Groundwater Act of 1973 [Repealed]—Code of Virginia Title 62.1, Chapter 3.4, Section 62.1-44.83 through 62.1-44.87: Virginia General Assembly. [Also available at https://babel.hathitrust.org/cgi/pt?id=umn.31951d02280241r&seq=677.]
Virginia General Assembly, 1992, Ground Water Management Act of 1992—Code of Virginia Title 62.1, Chapter 25: Virginia General Assembly, accessed September 1, 2025, at https://law.lis.virginia.gov/vacode/title62.1/chapter25/.
Virginia Geographic Information Network, 2024, Virginia Administrative Boundaries geographic information system shapefiles 2024 Annual Download: Virginia Department of Emergency Management web page, accessed June 19, 2024, at https://vgin.vdem.virginia.gov/datasets/777890ecdb634d18a02eec604db522c6/about.
Virginia State Water Control Board, 2014, Designated Groundwater Management Areas—Virginia Administrative Code Title 9, Agency 25, Chapter 600: Virginia Department of Environmental Quality, accessed September 1, 2025, at https://law.lis.virginia.gov/admincode/title9/agency25/chapter600/.
Winter, T.C., Harvey, J.W., Franke, O.L., and Alley, W.M., 1998, Ground water and surface water—A single resource: U.S. Geological Survey Circular 1139, 79 p. [Also available at https://doi.org/10.3133/cir1139.]
Yu, X., and Michael, H.A., 2022, Impacts of the Scale of Representation of Heterogeneity on Simulated Salinity and Saltwater Circulation in Coastal Aquifers: Water Resources Research, v. 58, no. 1, p. e2020WR029523, accessed February 10, 2025, at https://doi.org/10.1029/2020WR029523.
Zhou, Y., 2009, A critical review of groundwater budget myth, safe yield and sustainability: Journal of Hydrology, v. 370, no. 1-4, p. 207–213, accessed February 10, 2025, at https://doi.org/10.1016/j.jhydrol.2009.03.009.
Conversion Factors
U.S. customary units to International System of Units
International System of Units to U.S. customary units
Datums
Vertical coordinate information is referenced to the National Geodetic Vertical Datum of 1929 (NGVD 29).
Horizontal coordinate information is referenced to the North American Datum of 1983 (NAD 83).
Altitude, as used in this report, refers to distance above the vertical datum.
For additional information contact:
Director, Virginia and West Virginia Water Science Center
U.S. Geological Survey
1730 East Parham Road
Richmond, Virginia 23228
or visit our website at
https://www.usgs.gov/centers/virginia-and-west-virginia-water-science-center
Publishing support provided by the U.S. Geological Survey, Science Publishing Network, Baltimore Publishing Service Center
Disclaimers
Any use of trade, firm, or product names is for descriptive purposes only and does not imply endorsement by the U.S. Government.
Although this information product, for the most part, is in the public domain, it also may contain copyrighted materials as noted in the text. Permission to reproduce copyrighted items must be secured from the copyright owner.
Suggested Citation
Pope, J.P., Gordon, A.D., and Frederiks, R.S., 2026, Computation of regional groundwater budgets for the Virginia Coastal Plain aquifer system: U.S. Geological Survey Open-File Report 2026–1002, 48 p., https://doi.org/10.3133/ofr20261002. [Supersedes USGS Preprint https://doi.org/10.31223/X5HB5D.]
ISSN: 2331-1258 (online)
Study Area
| Publication type | Report |
|---|---|
| Publication Subtype | USGS Numbered Series |
| Title | Computation of regional groundwater budgets for the Virginia Coastal Plain aquifer system |
| Series title | Open-File Report |
| Series number | 2026-1002 |
| DOI | 10.3133/ofr20261002 |
| Publication Date | April 16, 2026 |
| Year Published | 2026 |
| Language | English |
| Publisher | U.S. Geological Survey |
| Publisher location | Reston, VA |
| Contributing office(s) | Virginia and West Virginia Water Science Center |
| Description | Report: viii, 48 p.; Data Release |
| Country | United States |
| State | Virginia |
| Other Geospatial | Virginia Coastal Plain |
| Online Only (Y/N) | Y |
| Additional Online Files (Y/N) | N |