

Natomas Basin Giant Gartersnake Annual Monitoring Report 2024
Links
- Document: Report (6.7 MB pdf) , HTML , XML
- Download citation as: RIS | Dublin Core
Acknowledgments
We thank the Natomas Basin Conservancy for its funding, support, and cooperation on this project. We thank Kim Bollens, Lisa Parker, and Leanne Stewart for administrative assistance and many biological technicians for their hard work on this project. Snakes were handled in accordance with U.S. Geological Survey Animal Care and Use Protocol WERC-2014-01 and as stipulated in U.S. Fish and Wildlife Service Recovery Permit TE-157216-5 and California Department of Fish and Wildlife Scientific Collecting Permit SC-10779. Data for the Giant Gartersnake Annual Monitoring Report 2024 either are not available or have limited availability owing to restrictions of the funding entity (Natomas Basin Conservancy). Please contact John Roberts at the Natomas Basin Conservancy for more information.
Abstract
The giant gartersnake (Thamnophis gigas) is a semi aquatic snake endemic to the Central Valley of California. After losing 95 percent of its historic wetland habitat (Frayer and others, 1989), giant gartersnakes became state and federally listed as a threatened species (California Fish and Game Commission, 1971; U.S. Fish and Wildlife Service 1993, 1999). Continued monitoring of current populations and implementation of suggested management actions is necessary to recover the species. The Natomas basin in Sacramento, California, supports a population of giant gartersnakes persisting in restored marshes and rice agriculture. This annual report summarizes the giant gartersnake monitoring project for 2024, focusing on the apparent survival, abundance, density, and distribution of the giant gartersnakes and the connectivity of habitat throughout the Natomas basin. In 2024, 131 giant gartersnakes were captured 216 times at 44 sites by hand or trap. The catch-per-unit effort decreased from 2023 to 2024 but was similar to other years of the study. Estimates of occupancy increased between 2023 and 2024, although the trend of occupancy from 2011 through 2024 is still decreasing overall at a mean annual rate of 3 percent per year. Apparent survival was much higher at Betts-Kismat-Silva from 2018 to 2019 and from 2021 to 2022 than in other years, but this may be partly attributed to different sampling efforts over the years. Trapping effort was more consistent in the Sills tract, and apparent survival was slightly higher in later years (2022–23 and 2023–24). Giant gartersnake populations appeared to remain stable in 2024, but abundance, density, survival, and distribution is highly variable across different sites and years of the study. Continued monitoring of the populations would allow for better trend estimates over time and assessment of the effects of management activities. Giant gartersnake populations throughout the basin and on reserve lands would likely benefit from the following: (1) creating more managed marsh; (2) increasing the amount of emergent tule vegetation in existing marshes (for example, Cummings, Natomas Farms, and Lucich South); (3) continuing to flood existing marshes in early spring; (4) maintaining rice agriculture; and (5) continuing research into conservation actions that target the giant gartersnake, such as habitat and water management and translocation.
Introduction
Giant gartersnakes (Thamnophis gigas; fig. 1) are a large aquatic snake endemic to wetlands in California’s Central Valley. The giant gartersnake is the longest species of gartersnake (Rossman and others, 1996). Like many Thamnophis spp., giant gartersnakes are sexually dimorphic for size, and females are larger (Wylie and others, 2010). Giant gartersnakes are highly aquatic and historically occurred in marshes, sloughs, and other habitats with slow-moving, relatively warm water and emergent vegetation, especially tules (hardstem bulrush [Schoenoplectus acutus]). The draining of wetlands and subsequent urban and agricultural development have contributed to the loss of over 95 percent of giant gartersnakes’ original habitat (Frayer and others, 1989), and much of the remaining wetland habitat is fragmented. These factors precipitated the listing of giant gartersnakes by the State of California (California Fish and Game Commission, 1971) and later by the U.S. Fish and Wildlife Service as a threatened species with a recovery priority designation of 2C: full species, high degree of threat, and high recovery potential (U.S. Fish and Wildlife Service, 1993, 1999, 2017).
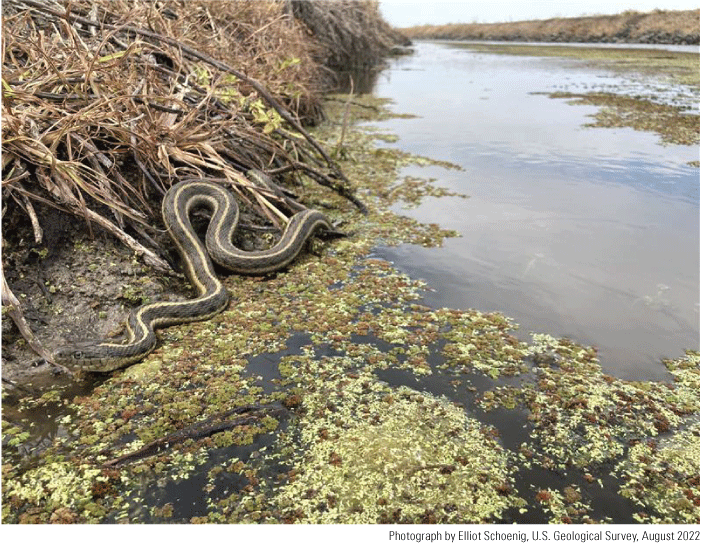
An adult giant gartersnake (Thamnophis gigas) slithering along the bank of the Nestor East trapline in Sacramento, California.
Although conversion of freshwater wetlands to agriculture nearly has extirpated giant gartersnakes from the San Joaquin Valley, this species persists in rice fields and nearby agricultural canals in the Sacramento Valley (Halstead and others, 2010). Rice fields and their canals can provide marsh-like habitat conditions throughout the giant gartersnake’s active season from late March to early October (Wylie and others, 2009). Like natural or managed wetlands, the fields and irrigation canals associated with rice agriculture also can support populations of aquatic prey species that giant gartersnakes feed on, including mosquitofish (Gambusia affinis), small cyprinid and centrarchid fishes, and frogs and tadpoles of American bullfrogs (Lithobates catesbeianus) and Sierran treefrogs (Pseudacris sierra; Rossman and others, 1996; Ersan and others, 2020a, 2020b). Giant gartersnakes generally select frogs and tadpoles as prey (Ersan and others, 2020a, 2020b).
The quality of rice habitats relative to natural or restored marshes and the effects of these habitat types on snake survival, occupancy, and abundance is an area of active research. Overall, survival is greatest at sites with a relatively large network of restored marshes. The daily risk of mortality is also lower in two-dimensional habitats like natural wetlands than in simple linear canals (Halstead and others, 2012). Another study found that giant gartersnake abundances and densities were greatest at a natural wetland but lower at a natural wetland modified for agricultural use (including rice agriculture); abundances and densities were lowest in seasonal marshes managed for waterfowl, which involved moist soil management in summer and flooded conditions in winter (Wylie and others, 2010). Habitats that most closely resemble the function of historic natural marshes are therefore the most likely to support dense populations of giant gartersnakes. However, in the modern landscape, it is likely that marshes and rice agriculture are both important habitats for giant gartersnake persistence. Recent work has shown that although giant gartersnakes do not spend much time in rice fields compared to irrigation canals, snakes have higher survival when inhabiting areas with more active rice fields surrounding them (Halstead and others, 2019), suggesting that rice agriculture is more beneficial than other kinds of agriculture for giant gartersnakes. Vegetation characteristics and other habitat features of the site are also important for giant gartersnake survival and persistence. Individuals are at 2.6 (1.1–11.1) times greater daily risk of mortality when in aquatic habitats than in terrestrial habitats (Halstead and others, 2012), likely because most terrestrial locations consist of subterranean refuges. Additionally, a recent capture-mark-recapture (CMR) study found a positive relationship between snake survival and the cover of emergent vegetation at a site (up to approximately 40-percent emergent vegetation cover; Rose and others, 2018b).
The modern landscape of the Natomas basin is a mosaic of restored marsh complexes, rice agriculture, and more developed urban areas. Developing and maintaining habitat near urbanized areas can be challenging, especially considering the complex dynamics of water supply to Natomas basin properties. Nevertheless, rice agriculture and ongoing management of restored marsh areas in the Natomas basin currently support a population of giant gartersnakes. The Natomas Basin Habitat Conservation Plan (NBHCP; City of Sacramento and others, 2003) and its implementing agreement require an annual assessment of giant gartersnake populations within the Natomas basin (Chapter VI, Section E [2][a][2] of the 2003 NBHCP). The NBHCP also requires an assessment of habitat connectivity for giant gartersnakes within and between reserves. This report addresses these requirements.
Studies from 2001 through 2003 focused on the distribution of giant gartersnakes in the Natomas basin (Wylie and others, 2003). Subsequent surveys attempted to assess population trends across a broad array of habitats and geographic areas, but detection probabilities were too low and the range of environmental conditions too variable to allow for estimation of abundance that accounted for variable detection probabilities. In 2011, the study was redesigned to increase sample sizes and account for the detection and capture process in a more statistically rigorous and defensible manner. In 2018, the study design was further revised to take advantage of advances in the analytical methods for wildlife populations and knowledge gained about giant gartersnakes since 2011. The 2018 revision allows for estimation of giant gartersnake occupancy, abundance, and demographic parameters from a larger sample of sites throughout the Natomas basin and increases the efficiency of sampling and the ability to estimate the effects of management actions on giant gartersnakes. The recovery of giant gartersnakes will require the restoration and protection of marsh habitats, a reliable supply of water to these habitats throughout the year, and further research into the most effective conservation practices for this species (U.S. Fish and Wildlife Service, 2017).
Purpose and Scope
Giant gartersnake monitoring for this project was conducted by the U.S. Geological Survey in cooperation with the Natomas Basin Conservancy. Monitoring protocol revisions implemented in 2011 were designed to assess progress toward achieving the goals of the NBHCP. In particular, the revised protocol was designed to meet the following objectives.
-
1. Examine the demography of giant gartersnake populations at a larger sample of locations within the Natomas basin, with an emphasis on measuring abundance and estimating survival, recruitment, and population growth rate.
-
2. Quantify the effects of management practices on giant gartersnake demography to promote positive population growth.
-
3. Examine the distribution of giant gartersnakes on The Natomas Basin Conservancy (TNBC) reserves, with an emphasis on evaluating evidence for trends in the proportion of reserves occupied, and quantify environmental variables associated with the occurrence of giant gartersnakes.
The 2018 revisions to the study were designed to better meet the objectives outlined above. Changes included removing the demography traplines and implementing an occupancy and abundance sampling approach throughout the basin. The sampling period at each sampling site also was extended to 21–29 days (modified in 2020 due to the COVID-19 pandemic and resumed in 2021, as described below in the “Trapping Giant Gartersnakes” section). In many cases, this extension allowed for enough recaptures to estimate abundance and demographic rates at more sites throughout the basin. In cases where adjacent or nearly adjacent wetland units or rice canals are sampled, the information from those traplines can be combined, resulting in more precise estimates of abundance and demographic rates and increasing the probability of recapture because of a larger sample area. By increasing sample sizes, the new design also permitted better inferences about the effects of habitat and management actions on giant gartersnakes.
The purpose of monitoring giant gartersnake demography is to determine the abundance, apparent survival (the probability of surviving and remaining in the sampled area from one year to the next), recruitment (the rate at which individuals are born in the sampled area [and survive their first year] or migrate to the sampled area), and population growth rate of giant gartersnakes at occupied sites in the Natomas basin. The management goal with respect to demography is to maintain stable or positive population growth.
Methods
To evaluate giant gartersnake demography, distribution, and overall population stability, giant gartersnakes were captured using trap transects at wetland and rice agriculture sites throughout the Natomas Basin Reserve. A capture-mark-recapture (CMR) study design was utilized and is described in more detail below in the “Trapping Giant Gartersnakes” section. Results from the trapping effort were then analyzed using a Bayesian analytical framework, explained further in the “Analytical Methods” section.
Trapping Giant Gartersnakes
All aspects of the giant gartersnake monitoring effort involved using trap transects composed of floating galvanized minnow traps (Casazza and others, 2000) for capture. Beginning in 2012, traps were modified to contain one-way valves constructed from cable ties placed in the small opening of the funnels. Beginning in 2013, traps also were modified to include two pieces of hardware cloth attached to each end of the funnel using zip ties (Halstead and others, 2013a). These modifications helped to direct snakes moving along the edge of a habitat into the trap and keep the snake within the trap, thus increasing capture probability.
Giant gartersnake occurrence and demography were monitored at 60 sites in 2018 and 2019, 40 sites in 2020 and 2023, 45 sites in 2021, 41 sites in 2022, and 44 sites in 2024. Between 2020 and 2022, we dealt with substantial challenges caused by the COVID-19 pandemic. In 2022, we faced additional obstacles, such as heat waves and drought that caused low water levels and high water temperatures. In 2023, there were unprecedented rainstorms and flooding that resulted in inaccessible roads and delays in setting certain traplines. Like the previous 3 years, in 2024, we were able to continue the 21-day sampling periods as opposed to the 14-day period in 2020. We selected which sites to sample using a Generalized Random Tessellation stratified approach to ensure a random, spatially dispersed sample (table 1; fig. 2). Random selection of sites allowed inference for TNBC reserves as a whole. To ensure adequate representation of each reserve, sampled sites consisted of individual wetland units (defined as being contained within water control structures) and canals adjacent to rice, and the selection of sampled sites was stratified by reserve area (23 sites in the North Basin reserve, 12 sites in the Central Basin reserve, and 9 sites in the Fisherman’s Lake reserve). Most sites in the Fisherman’s Lake reserve were wetland sites (7 of 9), whereas sites were nearly evenly divided between the two types in the Central Basin reserve (5 of 12 were wetlands) and in the North Basin reserve (13 of 23 sites were wetlands). At each site, one transect of 50 traps was deployed, with traps spaced approximately 10–20 meters (m) apart. In 2024, trap transects were deployed for approximately 11–21 days each, from as early as possible in the active season, beginning May 13, 2024, until September 13, 2024. Sampling did not take place on Memorial Day, Juneteenth, Independence Day, or Labor Day. Trap transects were positioned along the banks, at the edges of emergent vegetation in wetlands, or along the edges of canals because giant gartersnakes forage along habitat edges. Habitat edges also act as natural drift fences that direct snake movement to traps. Traps were checked daily while deployed.
Table 1.
Summary of giant gartersnake captures and sampling efforts at Natomas Basin Conservancy reserves, 2024.[BKS, Betts-Kismat-Silva; SAFCA, Sacramento Area Flood Agency; TNBC, The Natomas Basin Conservancy]
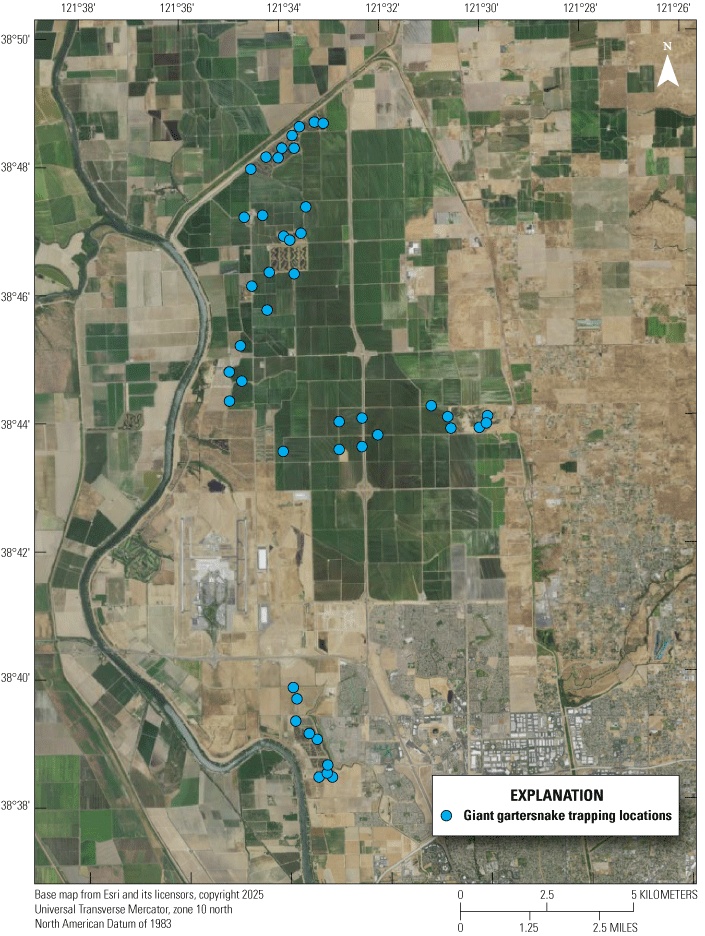
Areas sampled for giant gartersnakes in the Natomas basin in Sacramento, California, in 2024.
For sites that were sampled as occupancy traplines before 2018, transects generally were placed in the same location in 2024; this approach maintains the same extent of sampling to provide inference about giant gartersnake occurrence in the same areas. These original occupancy traplines continued to be trapped in similar numbers after 2018; however, at the five demography sites on the Betts-Kismat-Silva (BKS), Lucich North, Lucich South, Natomas Farms, and Sills tracts, sampling after 2018 differed from the areas sampled from 2011 to 2017. Previously, three transects were sampled at each demography site each year, but we modified our study to allow for better inference of both occupancy and abundance through the Natomas basin. In 2018 and 2019 at the BKS tract, all three old demography traplines were sampled, and beginning in 2020 and continuing until 2024, only two old demography traplines were sampled (BKS 2 and 3). At both Lucich North and Lucich South, only one of the three old demography traplines (Lucich North 4 and Lucich South 3, respectively) has been sampled during the past 7 years. At the Natomas Farms tract, one old demography trapline (Natomas Farms 1) was sampled in 2018, 2019, 2020, and 2023, three old demography traplines (Natomas Farms 1, 2, and 3) were sampled in 2021, and two old demography traplines (Natomas Farms 1 and 2) were sampled in 2022 and 2024. At the Sills tract, two old demography traplines (Sills 2 and 3) were sampled in 2018 and 2019, whereas no old demography traplines were sampled from 2020 to 2023, and one old demography trapline (Sills 3) was sampled in 2024. These changes made to our study’s sampling methods allowed us to survey a broader area at most of the old demography sites (except in 2020 when the study was truncated due to the COVID-19 pandemic); however, they also meant that some areas that were sampled from 2011 to 2017 were not covered by trap arrays from 2018 to 2024. As noted above, these changes present ramifications for modeling giant gartersnake demography and interpreting changes in abundance estimates, as described below in the “Analytical Methods” section.
Environmental conditions relevant to giant gartersnake behavior were monitored daily at each trap transect, including water temperatures, air temperatures, and fluctuations in water level. To obtain a measure of the relative abundance and diversity of potential local aquatic prey, the contents of every fifth trap were recorded, and then, all contents were removed. All other traps were monitored, but prey items, such as fish, tadpoles, and small frogs, were left in the traps so that they became naturally baited over time. In some instances, large fluctuations in water level (draining of wetlands, canals, or ditches) necessitated opening traps temporarily or relocating transects to a suitable nearby location within the selected site.
Universal Transverse Mercator (UTM) coordinates of all trap locations were recorded, and vegetation and habitat surveys were undertaken at points within and adjacent to each trap transect. Percentage cover of habitat types (water, submerged aquatic vegetation, floating aquatic vegetation, emergent vegetation, terrestrial vegetation, rock, or bare ground) and vegetative composition (species or higher taxonomic category) was estimated within a 1-m radius of every fifth trap. Associated with each habitat and vegetation survey along the transect, a point was selected toward the terrestrial-side (odd-numbered traps) or the aquatic-side (even-numbered traps) of the transect at a random perpendicular distance of 2–5 m, and percentage cover of habitats and vegetative composition was estimated within a 1-m radius of this point to better characterize habitat surrounding the traps.
Each captured giant gartersnake was measured, sexed, and uniquely marked. Scale measurements in Rossman and others (1996) were used to verify the species of each captured gartersnake. Individual snout-vent lengths (SVL) and tail-vent lengths (TVL) were measured to the nearest millimeter (mm), and each individual was weighed to the nearest gram (g). The sex of each individual was determined by probing the cloaca to detect the presence or absence of hemipenes, indicative of male snakes. After examination, each individual that showed no sign of previous capture was given a unique brand on its ventral scutes (Winne and others, 2006) and, if large enough (greater than 35 g), implanted with a passive integrated transponder (PIT) tag. PIT tags were implanted using syringe injector needles swabbed with alcohol before each use, and the injection site on the snake was swabbed with alcohol before tag insertion. The tag was injected subcutaneously, approximately one-third of the SVL anterior to the cloaca. After insertion of the tag, cyanoacrylate glue was applied to the insertion site to seal the dermis and prevent tag loss. Most individuals were processed in the field within a few minutes of their capture. If snakes were held for more than a few minutes, they were kept in the shade in cooled and insulated containers to prevent overheating until they could be examined and released. Each individual was released at its location of capture immediately after processing.
Starting in 2024, as many as 10 gravid females were collected from the BKS Wetland complex as part of a captive-rearing project in coordination with the Larry Ellison Conservation Center for Wildlife Care (hereafter, Ellison Center). Females were brought into captivity to the U.S. Geological Survey (USGS) Dixon Field Station and held temporarily until the females, or neonates produced by the females, were transferred to the Ellison Center. All females were returned to their sites of capture after giving birth. Any neonates produced by the females will be reared at the Ellison Center for 1–2 years before they are transferred back to the Dixon Field Station and then released back into the BKS Wetland Complex.
Analytical Methods
Most analyses were done in a Bayesian analytical framework. In Bayesian analyses, the probabilities are interpreted slightly differently from traditional frequentist statistical analyses. The posterior probability is the probability of a random event or uncertain proposition given the data at hand and is how most people intuitively think about probability (for example, how people interpret a weather forecast). Bayesian analyses also require specification of a prior probability distribution, which allows for the inclusion of information obtained through other sources into the analysis. The prior can be an informative prior (in other words, a distribution based on previously collected data or a hypothesis about the probability distribution of interest) or an uninformative prior (meaning, a probability distribution that will have negligible effect on the outcome of the analysis). Unless otherwise noted, for all parameter estimates, posterior distributions are summarized as medians with equal-tailed 95-percent credible intervals in parentheses.
Distribution of Giant Gartersnakes on Reserve Lands
The probability of occurrence of giant gartersnakes on TNBC reserves in 2024 was estimated using Bayesian analysis of single-season occupancy models (Royle and Dorazio, 2008; Kéry, 2010). The probability of occurrence was modeled as a linear function of selected habitat variables and allowed to vary among reserve areas (North Basin, Central Basin, and Fisherman’s Lake). The habitat variables included effects of wetland or rice habitat and the percentage cover of emergent vegetation, floating aquatic vegetation, open water, and terrestrial vegetation on the probability of occurrence of giant gartersnakes. Priors (distributions representing existing information or ideas about values of parameters before data were collected) for the occupancy component of each model were chosen to be uninformative. All continuous variables were standardized to improve behavior of the Markov chain Monte Carlo (MCMC) algorithm and to allow direct comparison of model coefficients. The posterior probability of each subset of the full model was calculated using indicator variables on model parameters (Kuo and Mallick, 1998; Royle and Dorazio, 2008). The single-season occupancy model was run on three independent chains of 44,000 iterations each after a burn-in of 2,000; each chain was thinned by a factor of 5, resulting in a final total of 132,000 samples for inference after pooling chains. Each model was analyzed by calling Just Another Gibbs Sampler (JAGS) 4.3.1 (Plummer, 2003) from R programming environment 4.3.2 (R Core Team, 2024) using the package runjags (Denwood, 2016). Posterior distributions were summarized with the posterior median and 95-percent symmetrical credible interval.
In addition to the single-season occupancy models evaluated above, a Bayesian state-space dynamic occupancy model (MacKenzie and others, 2006; Royle and Kéry, 2007; Kéry and Schaub, 2012) was evaluated to identify evidence for changes in the probability of occurrence of giant gartersnakes on TNBC reserves over time from 2011 to 2024. Occurrence of giant gartersnakes among various wetland units can change between years due to colonization of sites that were unoccupied previously and extirpation at sites that were occupied previously. Accordingly, the dynamic occupancy models account for these changes and are used to estimate the rates at which these changes occur and the annually varying colonization and extirpation probabilities. All probabilities were given U(0,1) priors. The dynamic occupancy model was run on 5 independent chains of 950,000 iterations each after a burn-in of 20,000; each chain was thinned by a factor of 400, resulting in 10,000 samples for inference. Each model was analyzed by calling JAGS 4.3.0 (Plummer, 2003) from R 4.4.0 (R Core Team, 2024) using the package R2jags (Su and Yajima, 2015). Posterior distributions were summarized with the posterior median and 95-percent symmetrical credible interval (2.5-percent and 97.5-percent quantiles of the posterior distribution). The effects of the same habitat variables that were evaluated using static occupancy models were evaluated to determine if they were related to extirpation and colonization probabilities, and uninformative priors were used for the parameters related to occurrence, site-survival (1—site extirpation), site-colonization, and detection components of the model. In 2024, we ran two iterations of the dynamic occupancy model, one that included all sites within the Natomas basin and a second that was a subset of sites including only Natomas Basin Conservancy-managed marsh sites within the Northern and Central sub-basins. We ran the reduced version of the model because we were interested in the occupancy, colonization, and extirpation probabilities in the northern and central Natomas Basin Conservancy-managed marsh sites that historically supported larger populations of giant gartersnakes and are not as heavily affected by urbanization as the southern basin sites. We focused on the managed marsh sites in these areas because they are specifically managed for giant gartersnakes. Examining this subset of sites allows us to better understand occupancy, colonization, and extirpation of giant gartersnakes in areas specifically managed for the species.
Abundance of giant gartersnakes was estimated at each site they were detected using Bayesian analysis of closed CMR population models with data augmentation (Royle and Dorazio, 2008; Kéry and Royle, 2016). Data augmentation is an approach to CMR analysis in which a large number of all-zero capture histories is appended to the observed capture histories. This approach is much more flexible than other approaches to estimation of demographic rates and allows a unified framework for analysis of detection-nondetection and CMR data (Royle and Dorazio, 2008). In contrast to occurrence, where site was defined as the area between two water control structures, site refers to clusters of transects that snakes could likely move between for the purposes of this analysis (see below). Closed population models are those that assume no births, no deaths, and no migration in or out of the population of interest over the sampling period (in this case, the 11–21 days during which a site was sampled). These models are used to estimate abundance using simplifying assumptions. A single model was used to estimate abundance for all sites, and information on capture probability was shared among sites, which resulted in more precise estimates of abundance at each site. To estimate abundance accurately, the probability of capturing a giant gartersnake also must be estimated. Investigators fit a single multinomial N-mixture model (Kéry and Royle, 2016) using capture data from all eight demographic cluster sites, with random effects of site, date, and individual on capture probability. This type of joint model has the advantage of sharing information on capture probability among sites, which allows for more precise estimates of capture probability and abundance at each site. This model has proven effective at estimating abundance of giant gartersnakes (Rose and others, 2018c). The capture histories of trapped individuals were augmented with enough all-zero capture histories to give a total pool of 1,207 individual snakes. The number of pseudo-individuals was deemed adequate because the posterior density for abundance fell far below the number of augmented individuals. Uninformative priors were used for all parameters of all models: Uniform(0,1) for probabilities, N(0,1.648) for regression coefficients, and half-Cauchy (0,1) for standard deviations. The closed population model was run on four independent chains of 25,000 iterations after a burn-in of 10,000; each chain was thinned by a factor of 10 to give a final output of 10,000 samples for inference. The model was analyzed by calling JAGS 4.3.0 (Plummer, 2003) from R 4.4.1 (R Core Team, 2024) using the package runjags (Denwood, 2016). Posterior distributions were summarized with the posterior median and 95-percent credible interval (2.5-percent and 97.5-percent quantiles of the posterior distribution). The effects of water temperature, snake SVL, snake sex, and a behavioral response on capture probabilities were tested. Models also included temporal variation in capture probability (in other words, variation in capture probability among days of sampling) and individual heterogeneity in capture probability (or the variation in capture probability among individual snakes).
Because some traplines were proximate to one another, seven snakes were caught in multiple traplines, and it is likely that other individuals moved between traplines as well. To account for demographic linkage between nearby traplines, captures of snakes were grouped into eight demographic clusters, and abundance was estimated for each cluster. Clustering traplines avoided duplicate counting of snakes captured at more than one trapline and provided abundance estimates relevant to larger reserve areas rather than a single section of a canal or wetland. Because larger areas were sampled at BKS, Lucich North, and Sills in 2018 and 2019 compared to 2011–17, less area was sampled overall in 2020 due to the COVID-19 pandemic, and because not all of the old demography traplines were sampled from 2018 to 2024, abundance estimates for these tracts from 2018 to 2024 are not directly comparable to previous years.
In addition to abundance estimates from closed population models, we estimated the density of giant gartersnakes (in snakes per hectare [ha] of habitat) in all tracts sampled from 2018 to 2024 using spatially explicit capture-recapture (SECR) models. SECR models use the spatial locations where animals are captured or observed to estimate their activity centers as a measure of their use of space. Importantly, SECR models account for both the location of traps and the period during which each trap was active and therefore able to capture an animal. We fit a separate SECR model for each year from 2018 to 2024 in which capture probability and movement scale parameters differed between wetland and canal traplines and allowed snake density (D) to vary among tracts. If a tract included both wetland and canal traplines (for example, at BKS, we trapped in one canal and three wetland units), we estimated separate snake density values for the canals and wetlands. We defined giant gartersnake habitat by creating polylines corresponding to canal habitat in ArcGIS Pro version 3.4.0 (Esri, 2024). For habitat in wetlands, we digitized the wetland edge as a line feature and calculated density as the number of snakes per kilometer (snakes/km) of edge habitat. This process enabled all data to be fit in the same model, and all density estimates are in units of snakes/km. The most prudent comparison of snake densities from these models is within the same habitat type among tracts (in other words, canals compared to canals, wetlands compared to wetlands). We fit SECR models using the “secr” R package version 4.6.4 (Efford, 2023) and report the mean, standard error, and 95-percent confidence interval of the density of snakes.
Since the revision of our study design implemented in 2018, we have collected six annual intervals of mark-recapture data, which allowed us to start estimating apparent survival using open population models. Although there is overlap between the areas sampled from 2011 to 2017 and the areas sampled from 2018 to 2024, the change in spatial coverage could lead to biased estimates of these vital rates. For example, individual giant gartersnakes with home ranges overlapping trapping arrays in 2016 and 2017 that were not captured in subsequent years could be treated as mortalities by the open-population CMR model, when in reality, they survived this time interval but were unlikely to be caught in traps based on the new trapping locations from 2018 to 2024. Therefore, our estimates of apparent survival, annual recapture probability, and availability for capture (in other words, presence on site) are only based on capture data from 2018 to 2024.
We calculated estimates of apparent survival using CMR data each year from 2018 to 2024 at four tracts (BKS, Lucich North, Lucich South, and Sills) that had more than 20 giant gartersnakes captured over this period and more than one giant gartersnake recaptured subsequent to its first year of capture. All other tracts had fewer than 20 individuals captured over the period from 2018 to 2024. We estimated apparent survival (ϕ) using a robust-design CMR model designed to give unbiased estimates of survival by accounting for availability of individuals for capture (γ) in addition to recapture probability (Riecke and others, 2018). We estimated separate survival rates for female and male giant gartersnakes, and the apparent survival estimate also varied by site and year according to random effects of each. We estimated a single shared recapture probability parameter (p) for the two sexes because preliminary model runs and analyses from previous years indicated no difference in recapture probability between female and male giant gartersnakes. The robust-design model used uninformative Beta(1,1) prior distributions for the probabilities of apparent survival (ϕ), recapture (p), and availability on site during sampling (γ). All random effects parameters were drawn from normal distributions centered on zero with a standard deviation estimated from the data. Standard deviation parameters had Exponential (1) priors to shrink values toward zero if variation among sites and years was minimal but allow for larger values if warranted by the data. The model included random effects of year and site on ϕ, p, and γ. The robust-design model was fit using JAGS 4.3.0 (Plummer, 2003) from R 4.4.1 (R Core Team, 2024) using the R package runjags (Denwood, 2016). The model was fit using 5 independent chains of 20,000 iterations each after a burn-in of 10,000 iterations. Each chain was thinned by a factor of 10, resulting in a final posterior sample of 10,000 iterations.
Sex ratios and size distributions were calculated using data from all captured individuals, regardless of method of capture or date of capture. Bayesian analytical methods were used to estimate sex ratios with binomial tests of proportions for all sampling locations within the basin. The binomial model assumes sampling with replacement (Skalski and others, 2005); accordingly, counts of captures rather than individuals were used for analysis. Bayesian methods also were used to describe the mean SVL and mass of giant gartersnakes of each sex from all sampling locations within the basin. Lognormal models were fit for each size measurement (mass and SVL), and the goodness of fit of each model was examined with a Bayesian p-value. Normal models fit well to the mass and SVL data, with Bayesian p-values of 0.645 and 0.544 for mass and SVL, respectively. Sexual size dimorphism in SVL and mass was examined throughout the basin using separate means and variances for males and females. These tests are equivalent to t-tests with unequal variances (Kéry, 2010). Each model was run on 3 independent chains of 22,000 iterations after a burn-in of 2,000; each chain was thinned by a factor of 5. Each model was analyzed by calling JAGS 4.3.1 (Plummer, 2003) from R 4.4.0 (R Core Team, 2024) using the R package jagsUI (Kellner, 2016). Posterior distributions were summarized with the posterior median and 95-percent credible interval. Sexual size dimorphism, sex ratios, and mean SVL and mass were not examined at individual sites because of the great uncertainty in estimating means with small sample sizes.
Habitat Connectivity
Connectivity among and between tracts and reserves was assessed by examining habitat variables along the major linear water conveyance features based on a qualitative assessment in the field and aerial imagery available from Google Earth. All culverts crossing major roadways were examined during field checks. Assessments were made by field technicians trained to evaluate the landscape while considering giant gartersnake movement ecology.
Results
Overall, 131 individual giant gartersnakes were captured 216 times by hand or trap at 44 sites on TNBC reserve tracts over the course of 43,018 trap days in 2024 (table 1; fig. 2). Over the course of 41,179 trap days in 2023, 166 individual giant gartersnakes were captured 271 times by hand or trap at 40 sites on TNBC reserve tracts (table 1; fig. 2). The 2024 monitoring year had a similar number of trap days to 2023 and 2022 (42,997). The catch-per-unit effort (snakes captured per trap-night) across the Natomas basin was 0.0050 in 2024, which is slightly above the average catch-per-unit effort of 0.0044 from 2011 to 2024. The catch-per-unit effort was highest in 2020 at 0.0068 and lowest in 2015 at 0.0017 (table 1.1). Additional results on the trapping effort, giant gartersnake captures and catch-per-unit effort for previous years of the study can be found in appendix 1.
Distribution of Giant Gartersnake on Reserve Lands
Giant gartersnakes were detected at 20 of 44 sites sampled in 2024 (fig. 2). Of the 40 sites surveyed in both 2023 and 2024, giant gartersnakes were detected at four sites in 2023 where no giant gartersnakes were detected in 2024. There were five detections of giant gartersnakes in 2024 at sites where they were not detected in 2023. Of the four sites that were surveyed in 2024 but not surveyed in 2023, giant gartersnakes were detected at two sites. Of all the sites monitored in 2024, 21 (20–24) were estimated to be occupied (fig. 3).
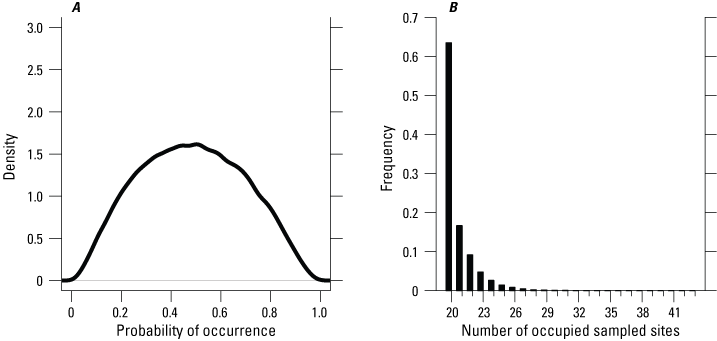
A, Probability of occurrence on reserve sites and B, number of occupied sites based on static occupancy models for the Natomas basin, 2024.
The effects of habitat variables on the probability of occurrence were not supported in 2024 (table 2). The effect of water temperature and date of sampling on daily detection probability was not supported (table 3; fig. 4). Daily detection probabilities for giant gartersnake in 2024 at an occupied site on a day with average conditions (for example, average water temperature) were 0.27 (0.13–0.44). Over 21 days of trapping, this corresponded to a cumulative probability of detecting giant gartersnake at least once, given they occurred at a site in 2024, of 0.99 (0.94 to greater than 0.99).
Table 2.
Posterior model probabilities for probability of occurrence of the giant gartersnake based on habitat on Natomas Basin Conservancy reserves, 2024.[“1” indicates that the variable was included in the model. “0” indicates that the variable was left out of the model. Only those models with posterior probability greater than 0.05 and the null model are presented in the table]
Table 3.
Model-averaged posterior distributions for parameters of single-season occupancy habitat models for the giant gartersnake on Natomas Basin Conservancy reserves, 2024.[Posterior distributions are represented by the posterior median and symmetric 95-percent credible interval (95% CI). Abbreviations: μp; average probability of detection for one day of sampling at an occupied site; p*, cumulative probability that snakes are detected given 21 days of sampling and that snakes are actually present at the site; α0, the logit-scale intercept for the probability of detection; αtemp, logit-scale coefficient for the effect of water temperature on the probability of detection; αdate, logit-scale coefficient for the effect of date on the probability of detection; σsite, standard deviation describing random effects of site on the probability of detection; ψcluster, probability of occurrence at each cluster of sites (North wetlands, Central wetlands, Fisherman's Lake wetlands; βcluster, coefficient describing the effect of the cluster of sites (North wetlands, Central wetlands, Fisherman's Lake wetlands) on probability of occurrence; βrice, coefficient describing the effect of rice on probability of occurrence; ψall, probability of occurrence across all sites; Nocc, estimated number of occupied sites; >, greater than]
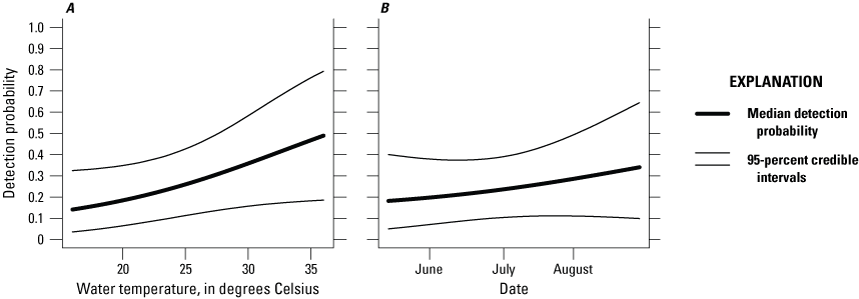
Effects of A, water temperature and B, date on the detection probability of the giant gartersnake in the Natomas basin, 2024. Thick lines represent the median detection probability; thin lines represent the 95-percent credible intervals.
The probability of occurrence of giant gartersnakes varied by reserve (in other words, North Basin, Central Basin, and Fisherman’s Lake). The probability of occurrence in wetlands in the North Basin reserve was 0.38 (0.18–0.69), the probability of occurrence in wetlands in the Central Basin reserve was 0.957 (0.74 to greater than 0.99), and the probability of occurrence in wetlands in the Fisherman’s Lake reserve was 0.05 (0.01–0.4).
The dynamic occupancy model including all sites in the Natomas basin indicated evidence for a slight decrease in the probability that sites on TNBC reserves were occupied by giant gartersnakes from 2011 to 2013, followed by a period of stability from 2013 to 2018, an increase from 2018 to 2019, a decrease from 2019 to 2021, and an increase in 2022 that remained stable through 2024 (fig. 5). The number of occupied sampled sites followed a similar pattern, with a decrease from 2019 to 2021 and an increase in 2022 that was stable in 2023 and increased again in 2024 (fig. 6). Both occupancy parameters were estimated with much greater precision in 2018 and 2019 compared to previous years when the number of sites increased to 60 as part of the revised sampling design. Conversely, precision of these parameters was much lower between 2020 and 2024 compared to 2018 and 2019 because of the decreased number of sites to 40 (2020), 45 (2021), 41 (2022), 40 (2023), and 44 (2024) due to the COVID-19 pandemic and stochastic weather patterns. The annual probability that occupied sites would become unoccupied (site extirpation) was generally low and stable between 2011 and 2019. Although it was higher from 2020 to 2023 compared to previous years, site-extirpation probability consistently declined after 2020, and in 2024, site extirpation was back down to levels seen previously (fig. 5). The annual probability that unoccupied sites were colonized was generally low and stable from 2011 to 2024 (fig. 5). The mean intrinsic growth rate of occupancy from 2011 through 2024 was −0.032 (−0.059 to −0.003; fig. 7), indicating a small but substantial decline in occupancy over time. From 2011 to 2024, the posterior probability that occupancy declined was 0.982 on average. Occupancy growth was most negative between 2019 and 2020, potentially because of the reduced number of sampled sites, and although it has rebounded slightly since the 2020–21 period, the trend over time remains negative (fig. 7). There was no support for effects of habitat on occupancy dynamics (table 4).
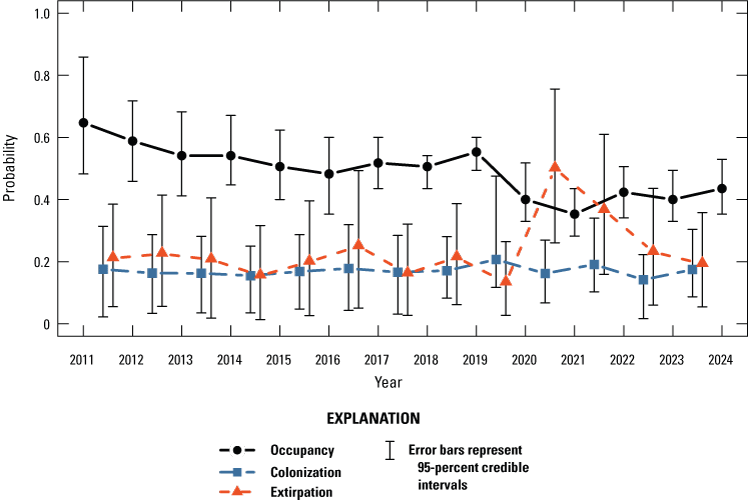
Annual probability of giant gartersnake occurrence on Natomas Basin Conservancy reserves based on the dynamic occupancy model. Points represent posterior modes (occurrence) or posterior medians (colonization and extirpation). Error bars represent 95-percent credible intervals.
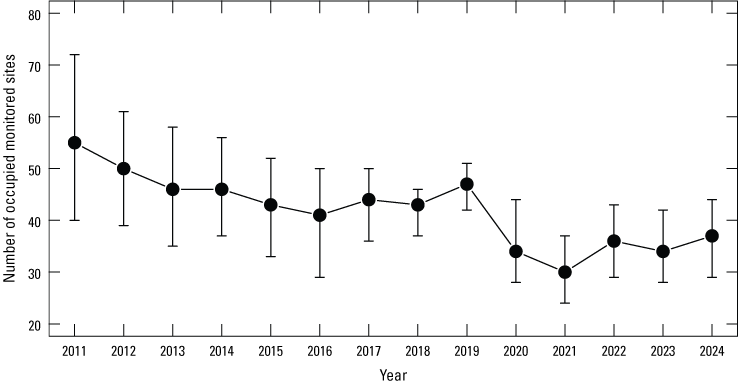
Estimated number of monitored Natomas Basin Conservancy reserve sites occupied by giant gartersnakes. Points represent posterior modes. Error bars represent 95-percent credible intervals. Note that 44 sites were sampled in 2024, and a total of 83 unique sites were sampled for giant gartersnake occurrence in at least 1 year from 2011 to 2024.
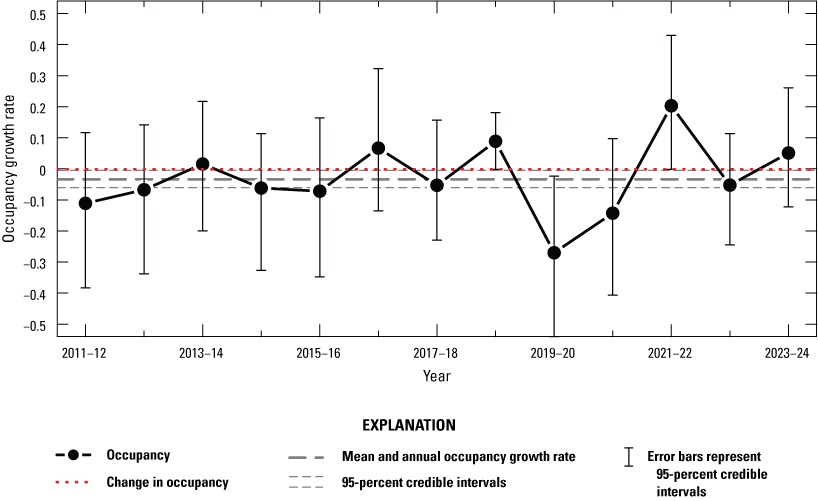
Annual intrinsic occupancy growth rate for giant gartersnakes in reserves, 2011–24. Points represent posterior modes. Error bars represent 95-percent credible intervals. The red dotted line at 0 indicates no change in occupancy. The mean and annual occupancy growth rate from 2011 to 2024 is indicated by the thick dashed line (mode) and thin dashed lines (95-percent credible interval).
Table 4.
Posterior model probabilities for effects of habitat on dynamic occupancy of the giant gartersnake on Natomas Basin Conservancy reserves, 2011–24.[“1” indicates that the variable was included in the model. “0” indicates that the variable was left out of the model. Only those models with posterior probability greater than 0.05 and the null model are presented in the table]
The dynamic occupancy model including only northern and central marsh sites managed by TNBC indicated evidence of a general decrease in the probability that managed marsh sites on northern and central TNBC reserves were occupied by giant gartersnakes from 2011 to 2018, followed by a general increase until 2022, and a plateau from then until 2024 (fig. 8). The number of occupied TNBC-managed marsh sites in the northern and central basin followed a similar pattern, with an overall decrease from 2011 to 2018 and an overall increase in 2019 that continued through 2024 (fig. 9). The annual probability that occupied managed marsh sites in the northern and central basin would become unoccupied (site extirpation) was generally low and stable with little annual variation at around 0.25 each year (fig. 8). The annual probability that unoccupied TNBC-managed marsh sites in the northern and central basin were colonized also was generally low and stable, though more variable than extirpation probabilities. Colonization probability was particularly low in 2015 and 2018, and higher than average in 2020, 2022, and 2024 (fig. 8). The mean intrinsic growth rate of occupancy for Natomas Basin Conservancy northern and central managed marsh sites from 2011 through 2024 was −0.021 (−0.053 to 0.011; fig. 10), indicating a 2-percent annual decline in occupancy over time. The posterior probability that occupancy of these sites declined from 2011 to 2024 was 0.878 on average. There was little evidence (Bayes factor=2.79 when compared to the null model) that terrestrial vegetation had a positive effect on occupancy and occupancy dynamics at managed marsh sites in the northern and central Natomas basin (table 5). The model including terrestrial vegetation was the top model selected, although the posterior probability for this model was small (table 5).
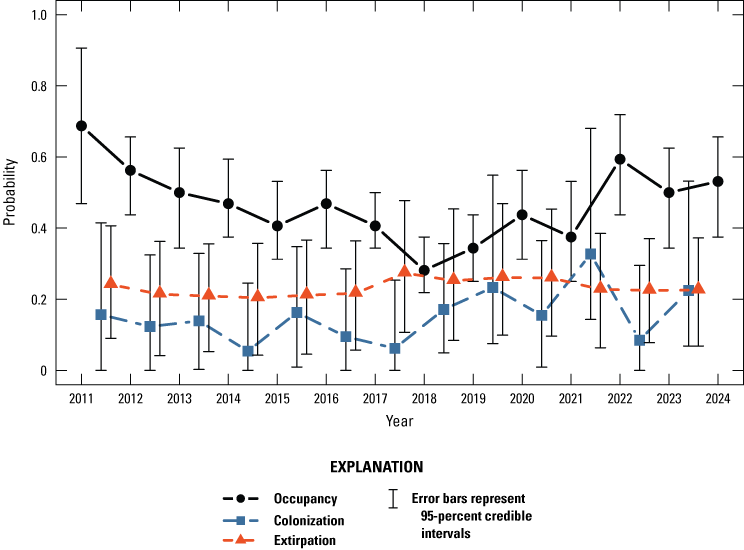
Annual probability of giant gartersnake occurrence on north and central marsh reserves managed by The Natomas Basin Conservancy based on the dynamic occupancy model. Points represent posterior modes (occupancy) or posterior medians (colonization and extirpation). Error bars represent 95-percent credible intervals.
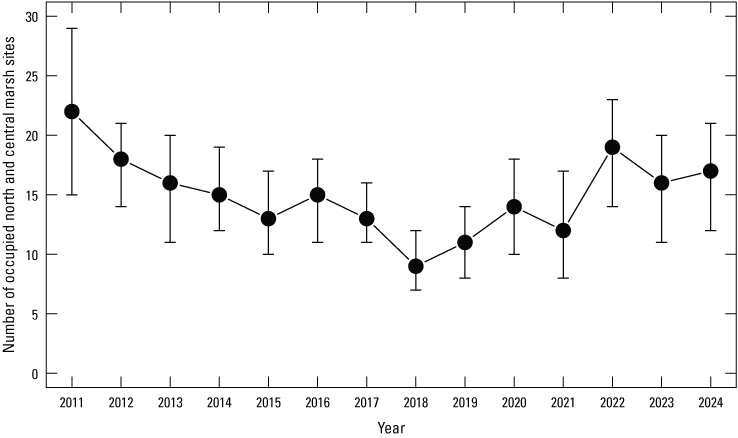
Estimated number of sampled north and central marsh reserve sites managed by the Natomas Basin Conservancy occupied by giant gartersnakes. Points represent posterior modes. Error bars represent 95-percent credible intervals.
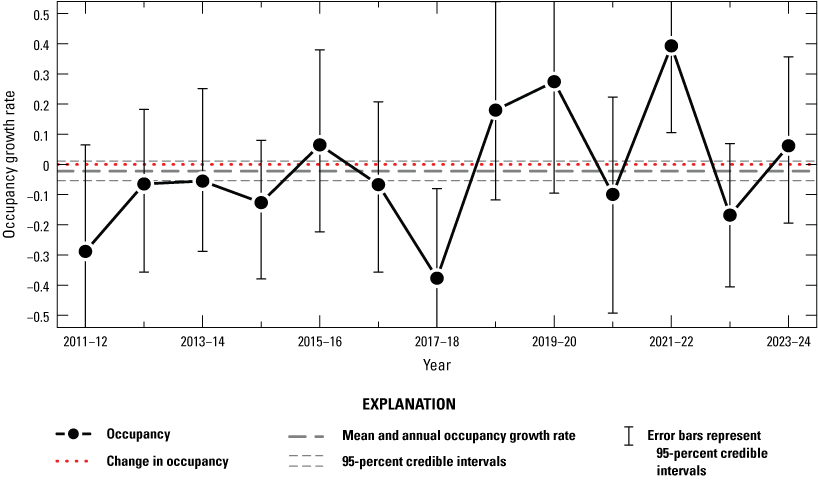
Annual intrinsic occupancy growth rate for giant gartersnakes in north and central marsh reserves managed by the Natomas Basin Conservancy, 2011–24. Points represent posterior modes. Error bars represent 95-percent credible intervals. The red dotted line at 0 indicates no change in occupancy. The mean and annual occupancy growth rate from 2011 to 2024 is indicated by the thick dashed line (mode) and thin dashed lines (95-percent credible interval).
Table 5.
Posterior model probabilities for effects of habitat on dynamic occupancy of the giant gartersnake at wetland sites in the northern and central areas of Natomas Basin Conservancy reserves, 2011–24.[“1” indicates that the variable was included in the model. “0” indicates that the variable was left out of the model. Only those models with posterior probability greater than 0.05 and the null model are presented in the table]
Demography
In addition to analyzing the occupancy and overall distribution of giant gartersnakes at the Natomas Basin Conservancy reserves, several metrics of giant gartersnake demography were also analyzed. The following sections detail giant gartersnake abundance estimated from closed population models, density estimates from spatially explicit capture-recapture models, and the sex ratio, size distribution, and survival estimates of giant gartersnakes in Natomas Basin Conservancy reserves.
Estimates of Abundance Using Closed Population Models
Capture probability averaged over all sites was 0.003 (0.001–0.007). The standard deviation of capture probability among sites was similar to the standard deviation of capture probability among days, and both were less than the variation among individuals (table 6). There was evidence for a positive ephemeral behavioral response to capture, and for a positive effect of water temperature on capture probability (fig. 11; table 6).
Table 6.
Posterior distributions for capture parameters of the closed abundance model of giant gartersnakes in the Natomas basin, 2024.[CI, confidence level; %, percent; p0, daily capture probability; αtemp, logit-scale coefficient describing the effect of water temperature on capture probability; αSVL, logit-scale coefficient describing the effect of snake snout-vent-length (SVL) on capture probability; αsex, logit-scale coefficient describing the effect of snake sex on capture probability; αbehav, logit-scale coefficient describing the effect of snake behavior in response to capture on capture probability, describes whether a snake is more likely to be captured again if they were captured the day before; σvariable, standard deviation describing random effects of site, individual, or day on capture probability, respectively]
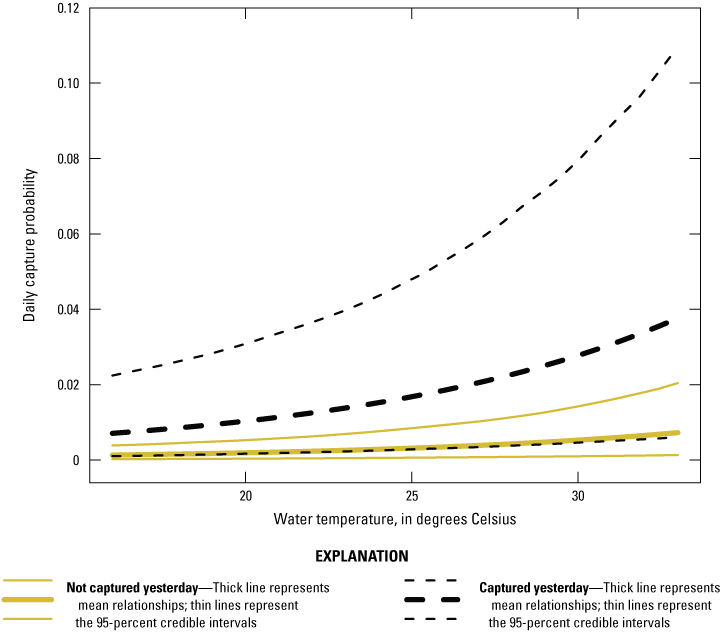
Effect of an ephemeral behavioral response of water temperature on giant gartersnake capture probability in the Natomas basin in 2024. Solid lines represent a snake that was not captured the previous day; dashed lines represent a snake that was captured the previous day. Thick lines represent mean relationships; thin lines represent the 95-percent credible intervals.
Seven instances of giant gartersnakes moving between traplines were detected in 2024. Two snakes were captured in multiple traplines within the Sills tract, three snakes were detected moving between a trapline in the BKS tract to a trapline in the Frazer South tract, and two snakes moved between traplines within the BKS tract. Traplines in close enough proximity that giant gartersnakes did or would be expected to move between traplines were grouped together and treated as a single site for this analysis (for example, all traplines in the Lucich North wetland complex were grouped together; and one trapline in the Frazer South tract was grouped with traplines in the BKS tract), resulting in eight demographic clusters. Estimates of abundance at each of the seven demographic clusters where giant gartersnakes were captured are summarized in table 7.
Table 7.
Summary of giant gartersnake captures and abundance estimates, 2024.[BKS, Betts-Kismat-Silva; N, estimated abundance]
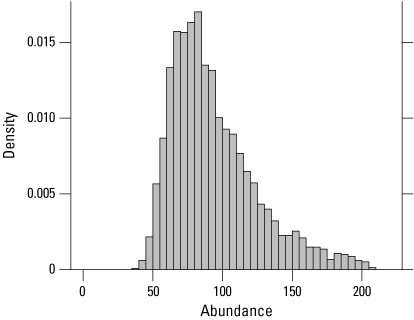
At the six traplines within the BKS cluster (including one trapline from Frazer South), 70 individuals were captured 129 times over 6,340 trap days in 2024 (table 7). Nine of the individuals that were captured in 2023 were recaptured in 2024. Three snakes captured at BKS in 2022 were recaptured in 2024, three snakes captured in 2021 were recaptured in 2024, and no snakes captured before 2021 were recaptured at BKS in 2024. The estimated abundance in sampled areas at BKS in 2024 was 222 (136–454) individuals (fig. 12; table 7). The number of individuals captured and estimated abundance in 2024 was higher than in 2023 but not as high as in 2022 or 2020 (table 1.2).
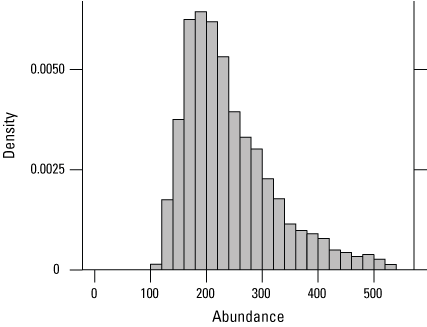
Posterior density of estimated giant gartersnake abundance in the sampled area at Betts-Kismat-Silva (BKS) based on closed population models in 2024.
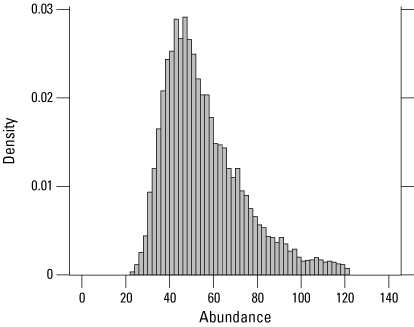
At five traplines within the Sills cluster (including one trapline in the Tufts tract), 27 individuals were captured 41 times over 4,988 trap days in 2024 (table 7). Of the 27 individuals captured at Sills in 2024, 7 were recaptured in 2023. Two snakes captured at Sills in 2022 were recaptured in 2024, one snake captured at Sills in 2021 was recaptured in 2024, and one snake captured at Sills in 2020 was recaptured in 2024. The estimated abundance at Sills in 2024 was 87 (53–175; fig. 13; table 7). The number of individuals captured and the estimated abundance at Sills in 2024 was comparable to 2023 and 2021 but lower than in 2022 and 2020 (table 1.2).
Posterior density of estimated giant gartersnake abundance in the sampled area at Sills based on closed population models in 2024.
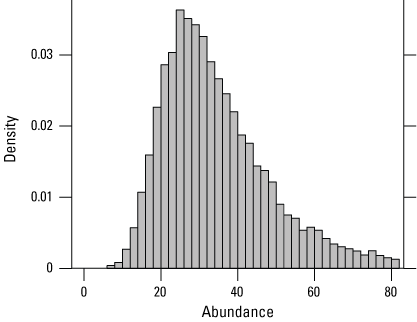
At 10 traplines in the Lucich North cluster (including two traplines in the Frazer North tract and one in the Nestor tract), 16 individuals were captured a total of 19 times over 9,644 trap days in 2024 (table 7). Of the 19 individuals captured at Lucich North in 2023, two were recaptured in 2024. No snakes captured at Lucich North in 2024 were captured previously before 2023. The estimated abundance at Lucich North in 2024 was 52 (31–105) individuals (fig. 14; table 7). The estimated abundance in 2024 was higher than it had been in the previous four years, with the exception of 2020 (table 1.2).
Posterior density of estimated giant gartersnake abundance in the sampled area at Lucich North based on closed population models in 2024.
At three traplines within the Lucich South demographic cluster, two individuals were captured four times over 3,100 trap days in 2024 (table 7). The two individuals captured at Lucich South were new to our study and had not been captured in previous years. The estimated abundance at Lucich South in 2024 was 32 (15–70) individuals (fig. 15; table 7). The number of captures and estimated abundance in 2024 was similar to the previous 4 years (table 1.2).
Posterior density of estimated giant gartersnake abundance in the sampled area at Lucich South based on closed population models in 2024.
In the Fisherman’s Lake reserve area, no giant gartersnakes were captured at nine traplines in the Cummings, Natomas Farms, and Rosa tracts over 7,945 trap days in 2024. Likewise, in 2023, 2022, 2021, and 2020, no giant gartersnakes were captured at the three tracts (Cummings, Natomas Farms, and Rosa; table 1.2). In 2019, one giant gartersnake was captured at two traplines, whereas in 2018, no giant gartersnakes were captured at either trapline in the Fisherman’s Lake reserve area.
The other traplines at which snakes were captured were in the Bennett North, Bennett South, and Bianchi West tracts. At Bennett North, six individuals were captured a total of 12 times, and the median estimated abundance was 34 (17–73) snakes (table 7). At Bennett South, one individual was captured once, and the median estimated abundance was 33 (17–69) snakes (table 7). At Bianchi West, nine individuals were captured a total of ten times, and the median estimated abundance was 38 (22–76) snakes (table 7).
Estimates of Density Using SECR Models
Based on SECR analysis of 2024 capture data, the capture probability for giant gartersnake was similar in canals (mean=0.0020, 95-percent confidence interval [CI]=0.0015–0.0027) and wetlands (mean=0.0018, 95-percent CI=0.0011–0.0029). The 2024 SECR analysis showed the scale of giant gartersnake movement was greater in canals than wetlands, indicating snakes moved longer distances along shorelines within canals than wetlands. Density estimates in 2024 were lower than in 2023 for most sites (table 8). The highest density of giant gartersnake in the Natomas basin in 2024 was in a canal in the Frazer South tract near BKS, with a mean estimate of 17.3 snakes/km (10.9–27.3 snakes/km). The BKS wetlands had the highest density of giant gartersnake each year from 2018 to 2023, but much lower density in 2024, with a mean estimate of 5.2 snakes/km (3.6–7.5; table 8). Density estimates may differ between canal and wetland habitat based on the different structure of the two habitat types, use caution when interpreting results among different habitat types. Snake density was also lower in 2024 in wetlands at Lucich South, with a mean density estimate of 2.4 snakes/km (0.6–8.9 snakes/km) compared to 23.4 snakes/km (11.5–47.6) at Lucich South in 2023. The Lucich North and Bennett North wetlands had very low density estimates of less than 1.2 snakes/km (table 8), with few captures of giant gartersnake in 2024 despite substantial trapping effort. Canals in the Bianchi West (9.9 snakes/km, 4.6–21.4), Nestor East (6.9 snakes/km, 3.9–12.3), and Sills (5.6 snakes/km, 3.5–8.9), tracts had the next highest densities of giant gartersnake after Frazer South (table 8). Density estimates in occupied canals were very low at one canal in the BKS tract adjacent to wetlands (0.4 snakes/km, 0–50.5), at one canal in the Tufts tract (0.9 snakes/km, 0.2–5.4), and in a canal at the Bennett South tract (0.9 snakes/km, 0.2–4.5; table 8).
Table 8.
Density estimates of Giant Gartersnake by site and habitat type, 2018–24.[Values are mean estimates followed by 95-percent confidence intervals in parentheses. For three entries, the model could not estimate the 95-percent confidence interval, and only the mean is presented. Abbreviations: BKS, Betts-Kismat-Silva; NACONN, Natomas Connectivity Canal; SAFCA, Sacramento Area Flood Control Agency; —, site was not trapped; <, less than]
Size Distribution and Sex Ratio
The overall sex ratio of captured snakes in the Natomas basin was slightly female-biased. The sex ratio was 0.84 (0.59–1.15) males per female for all sites in the basin combined. Basin-wide mean SVL was 597 mm (575–619 mm), and basin-wide mean mass was 125.05 g (110.49–139.91 g). Mean female SVL (640 mm [607–673 mm]) was 97 mm (59–134 mm) greater than mean male SVL (543 mm [524–563 mm]) and mean female mass (128.53 g [108.27–152.27 g]) was 96.94 g (59.09–134.49 g) greater than mean male mass 75.13 g (67.37–83.84 g; fig. 16).
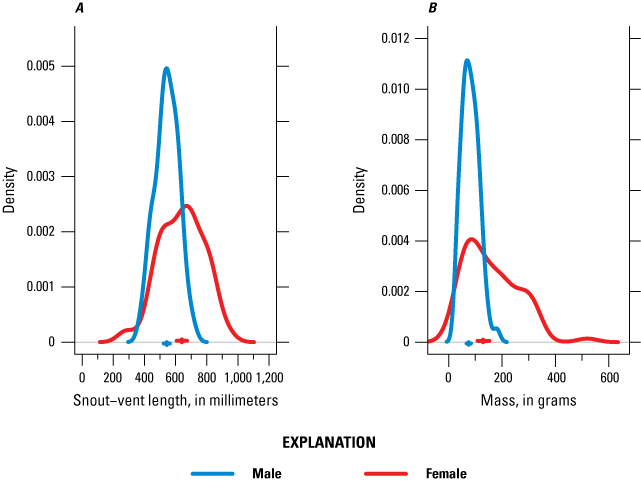
Distribution of male and female A, snout-vent length and B, mass in the Natomas basin, 2024. Vertical and horizontal lines near the x-axis indicate the median and 95-percent credible interval of the mean snout-vent length and mass for each sex.
Survival Estimates from 2018 to 2024
Average annual recapture probabilities, given 21 days of sampling at a site, were 0.16 (0.11–0.27). There was no support for a difference in apparent survival rate between female and male giant gartersnake. Apparent survival varied among years and sites. At BKS, apparent survival was highest from 2021 to 2022 and lowest from 2023 to 2024 (fig. 17). At Lucich North, apparent survival was similar over each of the year-long intervals (fig. 18). At Lucich South, apparent survival was also similar for each interval (fig. 19). At the Sills tract, apparent survival estimates were highest for the intervals from 2022 to 2023 and 2023 to 2024 (fig. 20). The probability a snake was available on site for capture (γ) was slightly higher for female than male giant gartersnake (table 9). As with the closed CMR model, there was a positive relationship between capture probability and water temperature (table 9).
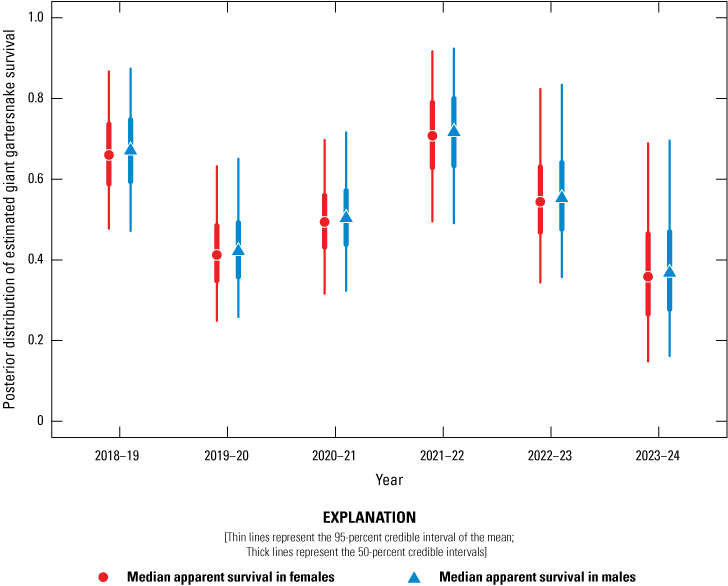
Posterior distribution of estimated giant gartersnake survival (Φ) in the sampled area at Betts-Kismat-Silva (BKS) based on spatially explicit capture-recapture models, 2018–24. Circles represent the median apparent survival in females, and triangles represent the median apparent survival in males. Thin lines represent the 95-percent credible interval of the mean; thick lines represent the 50-percent credible intervals.
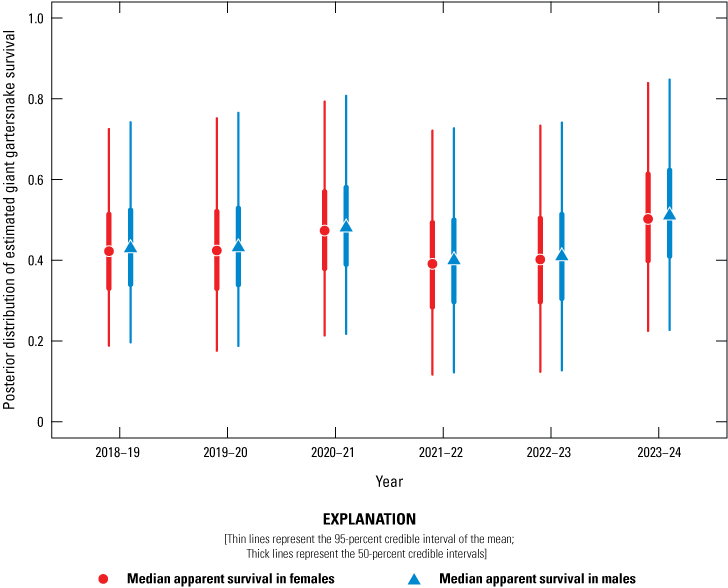
Posterior distribution of estimated giant gartersnake survival (Φ) in the sampled area at Lucich North based on spatially explicit capture-recapture models, 2018–24. Circles represent the median apparent survival in females, and triangles represent the median apparent survival in males. Thin lines represent the 95-percent credible interval of the mean; thick lines represent the 50-percent credible intervals.
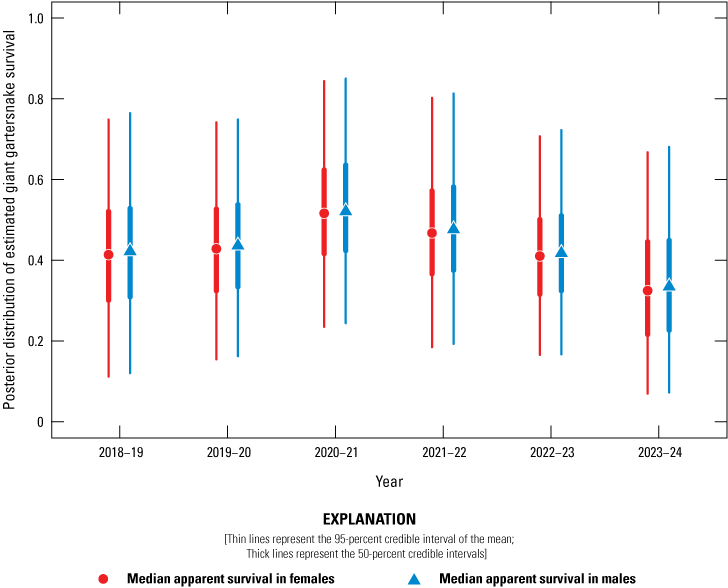
Posterior distribution of estimated giant gartersnake survival (Φ) in the sampled area at Lucich South based on spatially explicit capture-recapture models, 2018–24. Circles represent the median apparent survival in females, and triangles represent the median apparent survival in males. Thin lines represent the 95-percent credible interval of the mean; thick lines represent the 50-percent credible intervals.
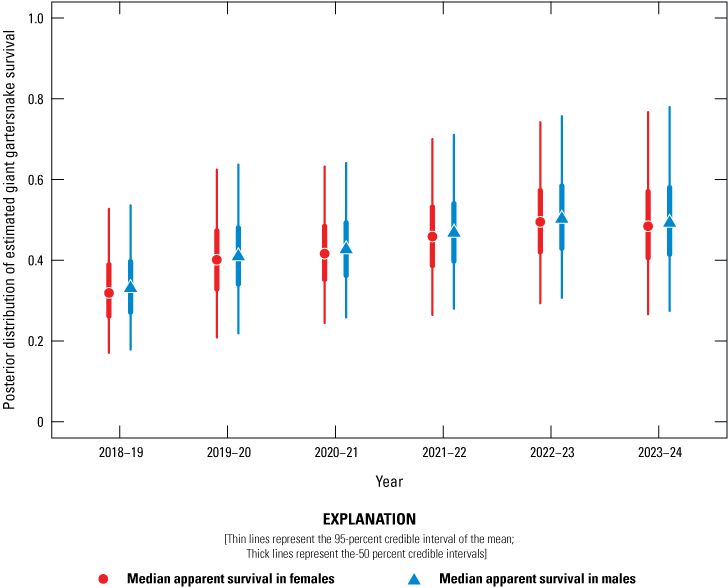
Posterior distribution of estimated giant gartersnake survival (Φ) in the sampled area at Sills based on spatially explicit capture-recapture models, 2018–24. Circles represent the median apparent survival in females, and triangles represent the median apparent survival in males. Thin lines represent the 95-percent credible interval of the mean; thick lines represent the 50-percent credible intervals.
Table 9.
Posterior summaries for parameters from the robust-design capture-mark-recapture model, 2018–24.[CI, confidence level; %, percent; p, daily recapture probability; βwt, coefficient for the effect of water temperature on capture probability; σsite, standard deviation describing the random effect of site on capture probability; σyear, standard deviation describing the random effect of year on capture probability; φfemale, apparent survival of females; φmale, apparent survival of males; σφ, standard deviation describing variation in apparent survival among sites and years; γfemale, availability on site of females; γmale, availability on site of males; σγ, standard deviation describing variation in availability among sites and years]
Habitat Connectivity
An assessment of habitat connectivity is incomplete without addressing the different means by which animal populations are connected. Connectivity generally occurs via the dispersal of individuals across the landscape. Little is known about reptile dispersal, but radio-telemetry studies suggest that most giant gartersnakes have small home ranges with an average core area of 3–20 ha using fixed kernel methods (Valcarcel, 2011) and 2.2 ha in another study using 95-percent adaptive local convex hulls (Nguyen and others, 2024), although individuals can move several kilometers (km) through appropriate habitat if necessary (Reyes and others, 2017; Nguyen and others, 2024). Two distinct forms of connectivity must also be considered. Demographic connectivity refers to the movement of individuals among (sub)populations to the extent that migration plays a role in population dynamics, potentially rescuing local populations from extirpation through migration into them from a source population (Mills, 2007). Genetic connectivity is the dispersal of enough individuals among populations to prevent genetic differentiation among them. A one-migrant-per-generation rule is often considered an adequate amount of connectivity to avoid the negative effects of inbreeding (Mills, 2007). In general, demographic connectivity requires the exchange of far more individuals than genetic connectivity. Both forms of connectivity are addressed in the following discussion.
Although portions of TNBC’s reserve system are well-connected, some notable exceptions exist. In particular, although surface water connects the Fisherman’s Lake reserve with other reserve areas, the northernmost suitable Fisherman’s Lake reserve tract (Natomas Farms), is approximately 15 km (by canal) south of the nearest suitable Central Basin reserve tract known to be occupied by giant gartersnake (Elsie). Giant gartersnakes have small home ranges and typically move relatively short distances (Valcarcel, 2011; Reyes and others, 2017; Nguyen and others, 2024) but nonetheless can move up to 5 km over multiple days (U.S. Geological Survey, unpub. data, 2019). Given the stretches of marginal habitat in canals that connect tracts, the surrounding land uses inhospitable to giant gartersnakes, potential fragmentation caused by Interstate 5 (I–5), and the distance between tracts of the Central Basin reserve and the Fisherman’s Lake reserve, it is unlikely that the Fisherman’s Lake reserve is currently demographically connected to the other reserves. Connectivity between the Fisherman’s Lake reserve and other habitats north of I–5 may have improved with the completion of the Giant Gartersnake Drainage Canal, constructed as mitigation for the Natomas Levee Improvement project that connects the North Drainage Canal just south of the Sacramento/Sutter County line with the West Drainage Canal just north of I–5. Most of this new canal appears to be suitable habitat for giant gartersnake and connects to the Fisherman’s Lake reserve through the West Drainage Canal, which is also suitable habitat. Within the Fisherman’s Lake reserve, three of the suitable tracts (Natomas Farms, Anne Rudin Preserve, and Cummings) are connected by approximately 3.5 km of canal habitats that compose Fisherman’s Lake, and by the intervening Sacramento Area Flood Control Agency (SAFCA) wetlands. The eastern boundary of the fourth suitable tract, Souza, is adjacent to the northernmost wetlands of the Natomas Farms and SAFCA tracts. The creation of the SAFCA wetlands provides much greater continuity of habitat within the Fisherman’s Lake area than was previously present. Movement data from radio-tagged snakes translocated to the SAFCA wetlands between 2019 and 2021 showed individual snakes moved between the Natomas Farms, SAFCA, and Cummings wetlands, but did not show signs of migration out of the Fisherman’s Lake reserve (Nguyen and others, 2024).
In contrast to the tracts of the Fisherman’s Lake reserve, the tracts of the Central Basin reserve are near those of the North Basin reserve, and these two areas are linked by a dense network of canals. The eastern edge of Ruby Ranch tract in the North Basin reserve is only approximately 3 km (by canal) from the Sills and Tufts tracts of the Central Basin reserve. Within the Central Basin reserve, tracts are nearly contiguous, with the exception of a 0.8-km gap between Bianchi West and Frazer South tracts. The intervening tract consists of rice agriculture and a canal with marginal habitat, so demographic connectivity among these tracts is likely and genetic connectivity is nearly certain. Perhaps a greater barrier to connectivity among Central Basin tracts is State Route 99 (SR 99), which lies between the Bianchi West and Sills tracts. Although this highway is a formidable barrier, it is possible for giant gartersnakes to cross it. A female giant gartersnake initially marked in 2010 at Bianchi West (east of SR 99) was captured at Sills (west of SR 99) three times in 2011. This individual almost certainly crossed through the 132-m-long single box culvert under SR 99, providing strong evidence for genetic connectivity across SR 99 in the Natomas basin (Halstead and others, 2013b). No such movements have been detected since, however. Given that the Sills tract and BKS tract contain the two most abundant populations of giant gartersnakes in the Central Basin reserve, connectivity across SR 99 could increase the probability of persistence of giant gartersnakes in this region as a whole.
Like the tracts of the Central Basin reserve, the tracts of the North Basin reserve are well-connected. No major highways fragment the North Basin tracts, and the only discontinuity between tracts containing suitable habitat is 1 km between the Lucich North and Nestor tracts. This gap occurs along the North Drain; however, we captured a snake in the Nestor tract in 2018 that was originally marked in the Lucich North tract in 2012, demonstrating at least some connectivity between these two areas. It is highly likely that all tracts in the North Basin reserve are genetically connected, and nearly all tracts are demographically connected with at least one other tract as well.
Overall, it is very likely that populations in all Central Basin and North Basin reserve tracts are genetically connected and that these tracts are also demographically connected to at least one other tract. These conditions help to promote genetic diversity, limit the effects of genetic drift and inbreeding depression, and may rescue small populations on some reserves by the migration of individual giant gartersnakes from neighboring reserves. In the future, maintaining this connectivity and its benefits to giant gartersnakes would include the continued availability of suitable habitat in canals that link wetland reserves. In contrast to the North and Central Basin reserves, connectivity between the Fisherman’s Lake reserve and the other reserves is far more tenuous. Although snakes in Natomas Farms and Cummings are almost certainly genetically connected and possibly demographically connected, the very small population in this area and isolation of these reserves from demographic rescue and genetic input from other, more abundant giant gartersnake populations to the north leaves them at risk for founder effects, inbreeding depression, and fixation of deleterious alleles through genetic drift, and it renders them very sensitive to both demographic and environmental stochasticity (random variation in birth/death rates or climatic conditions). When examining the posterior probability of occurrence at traplines within the Fisherman’s Lake area, we found it was mostly likely that none of the sampled traplines were occupied (posterior probability of 0.89). The establishment of these reserves and the additional marsh habitat created by SAFCA can provide the conditions that will allow this population to recover, but detailed demographic study of this population would ascertain whether more intensive management strategies (such as augmentation of the population with genetically distinct individuals to increase genetic diversity [Madsen and others, 1996, 2004]) would be beneficial in the Fisherman’s Lake area. The radio-telemetry study that began in 2018 is an important first step to determine the potential effectiveness of translocation of individuals from more abundant and presumably more genetically diverse populations, as a means to increase the abundance of snakes and the genetic diversity in sparse populations in the Fisherman’s Lake reserve. Individuals from the Central Basin reserve were translocated to the SAFCA wetlands in the Fisherman’s Lake reserve in 2019 and 2020 and tracked using radio-telemetry through 2021. Survival was much lower for these translocated individuals (8 percent of adult snakes survived >801 days) when compared to resident snakes (39 percent of adult snakes survived >1,154 days); however, juvenile snakes raised in captivity and released into the SAFCA wetlands had a relatively high survival rate of 60 percent during the 4-month period in which they were monitored (Nguyen and others, 2023).
These results indicate that captive rearing is a potential method for supplementing populations within the Fisherman’s Lake reserve. Further research would clarify the potential benefits and risks associated with this approach, including how supplemented individuals could influence the genetic makeup of the local population.
As seen in previous years, the habitat dynamics of canals with respect to giant gartersnakes can both improve or degrade from year to year based on annual fluctuations in water availability and growth of emergent vegetation. Monitoring these changes over time will be important to determine if any long-term trends exist and whether those trends are positive or negative for giant gartersnake persistence.
Discussion
The following sections provide more context on the results of the analysis of giant gartersnake demography and distribution in the Natomas Basin Conservancy reserves. The results of the monitoring effort help to inform management on the effectiveness of the Natomas Basin Conservancy reserves at providing habitat that promotes healthy populations of giant gartersnakes. The results of this study as well as results from previous studies and existing literature were used to provide a summary of management options that likely benefit giant gartersnakes.
Distribution of Giant Gartersnake on Reserve Lands
The occupancy analysis for 2024 indicated that giant gartersnakes are expected to occur in approximately 47 percent of wetland and rice units on reserve lands, with occupancy highest in the Central Basin reserve. The probability of occurrence of giant gartersnakes in canals adjacent to rice fields did not differ from that of wetland sites, after accounting for variation in occupancy rates among the three reserve areas, in 2024. This, however, does not minimize the importance of rice agriculture as a supplemental wetland habitat for this conservation-reliant species (Halstead and others, 2019). It also should be noted that the Central Basin has historically had the highest proportion of sites occupied and the highest proportion of sites that are considered rice agriculture; these patterns remained evident in 2024. Because the Central Basin is dominated by rice and the Fisherman’s Lake reserve is dominated by wetlands, it is difficult to fully disentangle the effects of rice from geographic variation in probability of occurrence.
The lack of a strong effect of emergent vegetation on occurrence was notable in 2024. However, this likely does not necessarily mean that emergent vegetation is not important for giant gartersnakes; rather, given the model selection results, there could be additional benefits of rice agriculture, not measured in the current analysis, that affect giant gartersnake occurrence. Emergent vegetation is likely an important habitat component for giant gartersnakes, providing cover from predators and higher prey concentrations. Radio-telemetry study of giant gartersnake movement and habitat selection has shown that giant gartersnake preferentially select tules over other vegetation types (Halstead and others, 2016). Because tule marsh is historical habitat for giant gartersnakes, management for emergent vegetation, particularly tules, within a mosaic of other wetland vegetation is important.
The probability of occupancy was greatest in the Central Basin reserve, moderate in the North Basin reserve, and lowest in the Fisherman’s Lake reserve. Both the North Basin reserve and Central Basin reserve have a mix of rice and wetland habitat, whereas the Fisherman’s Lake reserve is primarily composed of recently created freshwater marsh.
Based on the dynamic occupancy model of all Natomas basin sites, the proportion of occupied wetland units on reserve lands decreased an average of 3 percent annually from 2011 through 2024. Relative to previous years, the probability that occupied sites became unoccupied (site extirpation) declined from 2023 to 2024 but was higher than in 2019. The probability that unoccupied sites became occupied (site colonization) in 2024 was higher than in 2023 and was similar to the average of all years of the study. The average 3-percent decline in occurrence was not steady, with some increases and decreases in the number of sites estimated to be occupied by giant gartersnake. The decline in the number of occupied sites was especially notable from 2011 to 2013 and from 2019 to 2021. Although apparently small in magnitude, if the long-term average decline in giant gartersnake occupancy continues, it would result in only 17 (6–53) occupied sites by 2050, assuming 60 occupied sites in 2011.
The dynamic occupancy model containing only TNBC-managed marsh sites in the northern and central basin had similar results to the model run on all sites but did show a smaller rate of decline in occupancy. The proportion of occupied TNBC-managed marshes within the northern and central basin decreased an average of 2 percent annually from 2011 through 2024. The probability that occupied sites within the northern and central managed marshes were extirpated has remained relatively low and stable from 2011 through 2024, and in comparison with the basin as a whole, site extirpation in the northern and central managed marshes is more stable than extirpation across all sites. This is encouraging given that most of the giant gartersnake population in the Natomas basin occurs in the northern and central regions. The probability that unoccupied sites became occupied (site colonization) was higher in 2024 than 2023; colonization of sites in the Northern and Central basins is more stochastic than colonization in the Natomas basin as a whole but seems to have a slight upward trend overall since 2018. The average 2-percent decline in occurrence fluctuated depending on the specific year but showed an overall downward trend in the number of North and Central managed marsh sites occupied from 2011 to 2018 and an overall increase in occupied North and Central managed marsh sites from 2019 through 2024, although still below the number originally occupied in 2011.
One potential mechanism leading to a decrease in the proportion of sites occupied across the Natomas basin is the extreme drought conditions from 2012 to 2015 and from 2021 to 2022. According to the California Department of Water Resources, California experienced the second driest water year (October 2020–September 2021) in 2021. Although water remained on TNBC reserves during the drought, it is unknown to what extent the source of water (surface water versus groundwater) affects giant gartersnake occupancy or demography, and precipitation may affect the productivity of lower trophic levels including giant gartersnake prey. Thus far, occupancy does not appear to have completely rebounded to earlier levels (for example, 2011), but 2022 showed a clear increase after 2 years of decline in 2020 and 2021 and appears to continue to increase in 2024. This was comparable to 2019, which showed a clear increase after 4 years of stability from 2015 to 2018. The rebound in occupancy in 2019 follows 3 out of 4 years of normal to above-average rainfall (2016, 2017, and 2019). Three years of favorable rainfall in a 4-year period might not be long enough for giant gartersnakes to recolonize every site from which they were extirpated during the drought, but 2019 showed some positive signs of recolonization.
Demography
In addition to monitoring where giant gartersnakes were distributed on Natomas Basin Conservancy reserves, another main objective was to provide information on the giant gartersnake populations within these sites. The following sections provide more context on the results of the demography analysis, including the abundance, density, survival, size distribution, and sex ratio of giant gartersnake populations in the Natomas basin.
Abundance and Density
Abundance varied substantially among sites. In the Bennett South tract, a single snake was captured, and abundance was estimated to be approximately 17–69 individuals. Similar abundance estimates were obtained for Bennett North and Bianchi West, at which only six and nine individuals were captured in 2024, respectively. For two sites with more than 25 individuals captured, abundance was estimated to be much greater, with more than 50 individuals (Sills), or over 130 individuals (BKS). The daily capture probability of giant gartersnakes in 2024 was lower than in 2023 and the abundance estimates consequently were generally higher and had wider credible intervals in 2024 compared to 2023. There was an average of 1.65 captures per individual in 2024. Capture probabilities varied substantially in space and time, with similar variance attributable to variation among sites and days. The random variation in capture probability among days likely reflects day-to-day changes in the weather that affect the behavior of giant gartersnake. On cool, cloudy days, snakes are less likely to go foraging in the water and thus are less likely to be captured in traps than on hot days when they spend more time foraging. Capture probability might differ among sites due to differences in habitat that affect the effectiveness of traps—for example, how well traps are able to fit flush to the canal or wetland bank to funnel foraging snakes into the trap. The ability to share information about capture probabilities among sites is valuable because it allows for more precise estimates of abundance, as well as the effect of habitat covariates on capture probability. Heterogeneity in capture probability among individual giant gartersnakes could result from differences in behavior, with some individuals foraging along habitat edges more frequently or learning to forage in traps because they contain concentrations of prey. Heterogeneity can also result from spatial overlap between individual home ranges and traplines. Snakes with home ranges centered in the middle of a trapline would be expected to be captured more frequently than snakes with a home range that only partially overlaps one end of a trapline. This variation in individual home ranges is addressed explicitly in the SECR models used to estimate snake density.
SECR models explicitly account for the spatial locations of traps and where snakes are captured, which enables them to estimate the density of snakes within a defined area. Density estimates from SECR models are more suitable for comparisons among sites because they account for differences in the area sampled at each site. When grouped with a canal in the Frazer South tract for estimating abundance, BKS had the greatest estimated abundance of giant gartersnake in 2024, as it has each year from 2018 to 2023. Unlike from 2018 to 2023, however, density was lower at BKS wetlands than other sites, because more captures occurred at the Frazer South tract than in the BKS wetlands. The decrease in snake captures in BKS wetlands could be attributable to movement of water in the BKS tract in the summer of 2024 that caused more snakes to move into adjacent canal habitat. The higher density of snakes at the canal in the Frazer South tract continues a pattern observed since 2022. The estimated density of giant gartersnakes in the Lucich South wetlands in 2024 was much lower than in 2022 and 2023, because only two snakes were captured in these wetlands in 2024. In the future, adding landscape-level covariates on snake density could help inform what habitat management actions are most likely to support dense, healthy giant gartersnake populations.
In contrast to 2018–21, there was support for an effect of water temperature on capture probabilities in 2022–24. The effect of water temperature on snake behavior is likely more important in the spring, when cooler weather may prevent snakes from reaching a high enough body temperature to forage in cool water. In 2022 and 2023, trapping began a week earlier in May than in 2021, which could partially explain the greater importance of water temperature to snake capture probability in 2022 and 2023. In 2024, trapping started a week later than 2022 and 2023, but water temperatures were lower in late May 2024 before increasing during the summer months. As in each year from 2018 to 2023, there was evidence of a positive ephemeral behavioral response to capture (“trap-happiness”) in 2024. This pattern is likely observed simply because the individuals were in the vicinity of the trap array immediately after release and happened to enter another trap, or because individual snakes might forage for several consecutive days within a relatively small area, then shelter in burrows to digest their meals or shed. The behavioral response could also be caused by individuals that entered traps being rewarded with an easy meal; these individuals were therefore more likely to search for prey within traps the next day—and be trapped—than individuals that had not been trapped the previous day. This effect of behavioral response is a common theme across all years of monitoring. In 2024, there was little support for an effect of giant gartersnake sex or SVL on capture probability, which matches our findings in 2022 and 2023.
Size Distribution and Sex Ratio
The sex ratio of giant gartersnake in the Natomas basin in 2024 was slightly lower than one male per female and similar to the ratio in 2023 (0.84 in 2024 and 0.89 in 2023). The credible interval overlapped 1 substantially in 2024, indicating no strong sex bias. Regardless, a female-biased sex ratio should not limit the reproductive potential of the species because both females and males can mate with multiple partners (Schwartz and others, 1989; Shine and others, 2001). The slightly biased sex ratio is largely a result of a low proportion of males among the snakes captured at two sites: Lucich North (12 females and 5 males) and Bianchi West (six females and three males). Trapping within Lucich North in which moderately more female giant gartersnakes were captured in 2024 occurred later in the summer (late June to late August). During this time of year, females are likely to be foraging after giving birth (parturition) to improve their body condition. It is likely that large adult females foraging after reproduction in part drove the sex-bias in captures. This likelihood is further supported because the average SVL and mass of captured females were higher in 2018–24 than in 2017. In addition, the size distribution of females shifted toward longer and heavier individuals between 2018 and 2024 (with the revised sampling design) than in 2017, when greater trapping effort occurred earlier in the active season. In 2024, we also targeted sampling efforts to capture gravid females at BKS, which could further have increased the average length and mass of captured females. Continued monitoring of giant gartersnake sex ratios would be helpful, but differences in seasonal activity patterns between the sexes must be considered when interpreting the sex ratio of captured individuals. Although managing unharvested populations for sex ratio is not generally feasible, continued monitoring of sex ratios on TNBC reserves could warn of sex-biased mortality factors (assuming an equal sex ratio at birth [Halstead and others, 2011a; Rose and others, 2018a]).
Size distributions of giant gartersnakes on TNBC reserves indicated the presence of a mixed-age population. Size distributions indicated the presence of both younger, smaller snakes and larger, older individuals in the population. Small yearling snakes were caught in spring 2024 that were likely born in summer 2023, and neonate snakes likely born in summer 2024 were captured in August 2024. The evidence of recruitment of young individuals provided by size distributions is important supplemental information to determine if recruitment is occurring (at least in part) through in situ reproduction. It should be noted, however, that inferring the health of a population (or the population growth rate) from size (or age) distributions alone is a risky proposition (Caughley, 1974).
Survival Rate of Giant Gartersnake
With the additional year of sampling in 2024, we were able to obtain more precise estimates of apparent survival (the probability of surviving and remaining available on site for capture) for giant gartersnakes. Although survival varied over time at most sites, there was no single clear pattern in survival that applied to all sites. One clear result from the survival estimates was that apparent survival was much higher at BKS from 2018 to 2019 and from 2021 to 2022 than in other years. The higher sampling effort in 2018 and 2019 led to a higher recapture rate of snakes in 2019 compared to subsequent years. Therefore, it is possible that some of the snakes that were first captured and marked in 2018 and 2019 survived until later years, but either (1) they were not available for capture in the more limited area sampled from 2020 to 2024, or (2) they evaded capture during the shorter sampling period in 2020. Sampling effort declined from nine traplines in 2018 and 2019 to five traplines in 2020 initially due to the COVID-19 pandemic and has remained at five to six traplines per year in subsequent years. Despite the reduction in traplines, apparent survival was still high at BKS from 2021 to 2022, indicating that variation in trapping effort (and its effect on recapture probability) does not explain all temporal variation in apparent survival. Trapping effort was more consistent in the Sills tract where we usually trap fewer lines to begin with, and apparent survival was slightly higher in later years (2022–23 and 2023–24) compared to 2018–19. Survival was highest from 2020 to 2021 at Lucich South despite lower trapping effort in 2020 and 2021 compared to all other years in this study. Estimates of apparent survival at Lucich South and Lucich North were more uncertain than estimates from Sills and BKS, likely because of lower sample sizes at the former sites. Trapping effort at Lucich North in 2022 and 2023 was higher and comparable to 2018 and 2019. Despite fluctuations in trapping effort at Lucich North, annual survival was consistent each year from 2018 to 2024. There was no support for a difference in survival among male and female giant gartersnakes. There was weak support for a higher availability for capture for female giant gartersnakes than male giant gartersnakes, however. One potential explanation for higher availability of capture for female giant gartersnakes is that male giant gartersnakes disperse farther in search of mates and are more likely to emigrate from trapped areas.
Informing Effectiveness
Our study can inform the effectiveness of the NBHCP for conserving giant gartersnakes. The NBHCP is assessed based upon the acquisition of reserve lands; changes in the abundance or, preferably, demographic rates of giant gartersnakes; and land management activities to increase the distribution and health of giant gartersnakes in the Natomas basin (NBHCP; City of Sacramento and others, 2003).
The primary issue affecting giant gartersnakes throughout their range is habitat, and the Natomas basin is no different in this regard. Marshes that approximate natural tule marshes provide the best habitat for giant gartersnakes, promoting both higher densities and greater body condition than other habitats (Wylie and others, 2010). For example, a recent, long-term study of giant gartersnakes throughout the Sacramento Valley found that survival was positively related to the percentage cover of emergent vegetation at a site, though we note the maximum percentage cover of emergent vegetation in that study was 80 percent (Rose and others, 2018b); it is unlikely that further increases in emergent vegetation cover would increase giant gartersnake survival. Although giant gartersnakes have persisted in the rice agricultural landscape of the Sacramento Valley, the limited duration of rice fields as appropriate habitat (mid-May through August), the restriction of giant gartersnakes to structurally simple linear canals during the other 4 months of the active season, and the rice fallowing because of drought or late spring rains in recent years likely reduce the carrying capacity of agricultural habitats relative to natural or created marshes managed for giant gartersnakes. Nevertheless, rice agricultural habitats are likely the only agricultural habitats in which giant gartersnakes can persist (Halstead and others, 2010), and they provide connectivity between other patches of suitable habitat. Also, the survival rate of radio-tracked giant gartersnakes positively correlates to the area of rice agriculture surrounding their home range (Halstead and others, 2019). The Frazer South, Bianchi West, and Nestor tracts had the highest, second highest, and third highest density estimates, respectively, of giant gartersnakes in 2024, illustrating the importance of rice agricultural habitats in the Natomas basin, particularly in the central basin reserve. The change in density estimates from 2018 to 2023 (when the BKS wetlands had the highest density estimates) to 2024 (when density was highest in the Frazer South tract) also shows the importance of the surrounding rice as surrogate habitat for wetlands. As mentioned earlier, maintenance work on two wetlands in the BKS wetland complex occurred in 2024, resulting in the temporary draining of two wetlands and lowering water levels in two others. The subsequent increase in density in the Frazer South tract suggests that snakes from BKS likely moved to the Frazer South canal in response to the maintenance activities. Giant gartersnake density in the Lucich North cluster of sites, which is dominated by created marsh, was lower than many rice sites and remained lower than the giant gartersnake density at BKS despite wetland maintenance there. In 2022, there were low water levels at this location, with extensive areas of mudflat or shallow and hot water between emergent vegetation and deeper water. These conditions were likely caused by drought, which in turn resulted in only 18 percent of the normal contracted water allotment being provided to the Natomas basin in 2022. Although water levels in the Lucich North cluster improved dramatically in 2023 and 2024 with increased water allotments, there may have been a lag effect from 2022 that contributed to lower giant gartersnake densities at this cluster. Additional years of monitoring could be used to see if giant gartersnake densities, abundance, and survival at the BKS wetlands and the Lucich North Wetlands rebound after the water level changes at these sites in 2024 and 2022, respectively. Continued communication about management activities at these sites and others throughout the basin have been valuable in interpreting these results. TNBC has created managed marsh habitats and provides for the continuation of rice agriculture in the Natomas basin. It is beneficial to giant gartersnakes to maximize water levels in created marsh habitats, as in 2023 (all wetlands) and 2024 (all wetlands except those under construction and immediately adjacent in BKS).
Habitat for giant gartersnakes is only effective insofar as adequate water is supplied. The persistence of water adjacent to cover on the landscape throughout the active season is important for giant gartersnakes, and increased water availability is related to higher rates of survival for adult female giant gartersnakes (Reyes and others, 2017; Halstead and others, 2019). Drying of marshes, fallowing of rice fields in areas with high densities of snakes for more than a year, cultivation of alternative crops (especially if accompanied by lack of water in canals), and low or fluctuating water levels in marshes reduce the availability and quality of habitat for giant gartersnakes. Reducing the amount of rice grown in an area has the potential to negatively affect the survival of adult giant gartersnakes (Halstead and others, 2019). Our study found that managed marsh habitats within TNBC’s lands provided persistent aquatic habitat throughout the year and generally provided aquatic foraging and escape habitat adjacent to and below basking sites.
Another important component of giant gartersnake habitat is refuge from predators and environmental extremes. Mammal burrows and lodges and crayfish burrows offer important refuge for giant gartersnakes; maintaining these structures in association with marshes and canals likely benefits giant gartersnakes unless burrows threaten the integrity of the berms and levees, or they present a major hazard to humans or livestock. Muskrats (Ondatra zibethicus), California ground squirrels (Otospermophilus beecheyi), North American beavers (Castor canadensis), and crayfish likely improve habitat quality for giant gartersnakes by providing refugia in the form of burrows; muskrats and beavers further enhance habitat suitability by constructing piles of vegetation in and near water and reducing the density of cattails (thereby promoting the emergent vegetation/open water interface) through their foraging activity. Similar to muskrat lodges, tule thatch that accumulates naturally in mature tule marshes (like BKS) may also serve as important refuge from predators and temperature extremes and likely benefits giant gartersnakes. Giant gartersnakes actively select tule over other microhabitats available in their environment (Halstead and others, 2016).
Overall, giant gartersnake populations in the central basin reserves appear healthy. Fewer individuals were captured in the north basin reserves, and no giant gartersnakes were captured in the Fisherman’s Lake reserves. Our initial results indicate that conversion of additional habitats to created marshes and continuing to maintain high water levels in the marshes would benefit giant gartersnakes in the long term. Maintenance of rice agriculture also would help achieve connectivity, prey production, high adult survival in canals adjacent to rice fields, and other conservation goals. Minimizing ground disturbance, ensuring aquatic habitat is available in the spring for foraging upon emergence from winter refuges (Halstead and others, 2019), and maintaining stable and high water levels throughout the active season enhances habitat quality for giant gartersnakes. Lowering water levels in the early fall also may help to concentrate prey before hibernation, though further investigation would help ascertain the effectiveness of this practice.
Summary of Management Options that Likely Benefit Giant Gartersnakes
Based on the results of our study in the Natomas basin, the results of previous giant gartersnake studies, and existing literature on the species, management practices that are likely to benefit giant gartersnake populations involve maximizing the cover-open water interface, the availability of water from April through September, and maintaining hibernation habitat. Management practices would benefit from minimizing disturbance and certain types of vegetation. The following specific management options support these principles:
-
● Maintaining emergent vegetation (primarily tule) in wetlands and canals at levels that provide both cover and some amount of open water (Halstead and others, 2016; Rose and others, 2018b).
-
● Maximizing the open water/emergent vegetation interface that increases the probability of occurrence of giant gartersnakes and is positively selected by individual snakes (Valcarcel, 2011). It is also important to maintain emergent vegetation at wetland edges, clumps of vegetation in open water, and pockets of open water in stands of emergent vegetation to ensure that snakes can bask and forage in and near emergent vegetation and escape from predators into the water.
-
● Promoting tules in preference to other emergent aquatic vegetation. Giant gartersnake selection for tules is stronger than selection of other aquatic vegetation (Halstead and others, 2016).
-
● Considering rice agriculture as an important supplemental habitat to tule marshes (Halstead and others, 2019).
-
● Controlling mosquito fern and other floating aquatic vegetation where possible. Giant gartersnakes tend to avoid mosquito fern and other floating aquatic vegetation when they occur at high densities (Brian Halstead, U.S. Geological Survey, written commun., 2016), despite apparent positive selection at low densities (Halstead and others, 2016). Apparent selection of floating aquatic vegetation at low densities is likely an artifact of these vegetation types accumulating along the edges of water where giant gartersnakes forage (Halstead and others, 2016). Floating aquatic vegetation likely alters vegetative and prey communities and water characteristics.
-
● Maintaining herbaceous terrestrial bankside vegetation to provide cover for giant gartersnakes when in terrestrial habitats (Halstead and others, 2016). It is beneficial to minimize mowing during the active season near the edge of marshes to the extent practical, thus providing tall grasses for snakes to hide in when moving between aquatic and terrestrial habitats.
-
● Avoiding rapid changes in water levels to the extent possible during the giant gartersnake’s inactive season (October through March) to avoid disturbance to hibernating individuals and restricting changes in water levels to the minimum number of fluctuations possible (Halstead and others, 2015; U.S. Fish and Wildlife Service, 2017).
-
● Maintaining as many muskrat burrows, crayfish burrows, and burrows of California ground squirrels and other small mammals as feasible to provide giant gartersnakes abundant summer refuges and winter hibernacula (Halstead and others, 2015). Muskrat lodges also provide potential hibernation, basking, and shelter sites.
-
● Ensuring aquatic habitat is available in wetlands and canals early in spring when giant gartersnakes emerge from burrows and begin foraging. Snake body condition (body mass relative to length) is low at this critical point in the year (Coates and others, 2009) when individuals’ energy reserves are depleted from a long period of overwintering. Likely because of poor body condition, risk of mortality is high for giant gartersnakes during this time of year (Halstead and others, 2019). Having aquatic habitat available for giant gartersnake foraging during the early spring would likely lead to higher survival rates.
-
● Minimizing management activities in marsh habitats to the extent practical to minimize disturbance (U.S. Fish and Wildlife Service, 2017). When wetlands must be drained during the giant gartersnake active season, do so slowly in the late summer (August or September) to more nearly approximate the historical drying cycle of natural wetlands in the Central Valley. Doing so may provide giant gartersnakes with an abundance of stranded prey and an important source of energy reserves for hibernation. Reflood wetlands as soon as possible and maintain stable water levels throughout the hibernation period.
-
● Maintaining substantial aquatic habitat adjacent to marsh units drained for maintenance to ensure adequate habitat is available to giant gartersnakes that might be affected by marsh maintenance activities (U.S. Fish and Wildlife Service, 2017; Halstead and others, 2021).
-
● Ensuring that slopes are not too steep for snakes that become entrapped in excavated channels to free themselves when excavating marshes during maintenance activities. If slopes must be steep, provide periodic (every 50 meters) shallower slopes that allow entrapped snakes to exit the channel (U.S. Fish and Wildlife Service, 2017; Halstead and others, 2021).
-
● Minimizing channel clearing activities to the extent practical. Clearing water conveyance channels temporarily degrades giant gartersnake foraging habitat (U.S. Fish and Wildlife Service, 2017).
References Cited
California Fish and Game Commission, 1971, Animals of California declared to be endangered or threatened: California Code of Regulations Title 14, division 1, subdivision 3, chap. 3, § 670.5. [Available at https://www.law.cornell.edu/regulations/california/14-CCR-670.5.]
Casazza, M.L., Wylie, G.D., and Gregory, C.J., 2000, A funnel trap modification for surface collection of aquatic amphibians and reptiles: Herpetological Review, v. 31, no. 2, p. 91–92. [Available at https://pubs.usgs.gov/publication/1008340.]
Caughley, G., 1974, Interpretation of age ratios: The Journal of Wildlife Management, v. 38, no. 3, p. 557–562, accessed August 7, 2025, at https://doi.org/10.2307/3800890.
City of Sacramento, Sutter County, and Natomas Basin Conservancy, 2003, Implementation agreement for the Natomas basin habitat conservation plan: Sacramento, Calif., Sacramento and Sutter Counties, 44 p. [Available at https://natomasbasin.org/wp-content/uploads/natomas-basin-habitat-conservation-plan/Final-IA-with-all-signatures_a11y.pdf.]
Coates, P.S., Wylie, G.D., Halstead, B.J., and Casazza, M.L., 2009, Using time-dependent models to investigate body condition and growth rate of the giant gartersnake: Journal of Zoology, v. 279, no. 3, p. 285–293, accessed August 7, 2025, at https://doi.org/10.1111/j.1469-7998.2009.00617.x.
Denwood, M.J., 2016, runjags—An R package providing interface utilities, model templates, parallel computing methods and additional distributions for MCMC models in JAGS: Journal of Statistical Software, v. 71, no. 9, p. 1–25. [Available at https://doi.org/10.18637/jss.v071.i09.]
Efford, M., 2023, SECR—Spatially explicit capture-recapture models: R package version 4.6.4: Search.r-project.org web page. [Available at https://search.r-project.org/CRAN/refmans/secr/html/secr-package.html.]
Ersan, J.S.M., Halstead, B.J., Wildy, E.L., Casazza, M.L., and Wylie, G.D., 2020a, Giant gartersnakes (Thamnophis gigas) exploit abundant nonnative prey while maintaining their appetite for native anurans: Herpetologica, v. 76, no. 3, p. 290–296, accessed August 7, 2025, at https://doi.org/10.1655/Herpetologica-D-18-00026.1.
Ersan, J.S.M., Halstead, B.J., Wildy, E.L., Casazza, M.L., and Wylie, G.D., 2020b, Intrinsic prey preference of the giant gartersnake—A threatened predator in a nonnative prey-dominated community: Journal of Fish and Wildlife Management, v. 11, no. 1, p. 164–173, accessed August 7, 2025, at https://doi.org/10.3996/062019-JFWM-051.
Esri, 2024, ArcGIS Pro version 3.4.0: Redlands, Calif., Esri software release: ArcGIS Pro web page, accessed September 9, 2025, at https://pro.arcgis.com/en/pro-app/3.4/get-started/release-notes.htm.
Frayer, W.E., Peters, D.D., and Pywell, H.R., 1989, Wetlands of the California Central Valley—Status and Trends—1939 to mid-1980’s: Portland, Oreg., U.S. Fish and Wildlife Service, Region 1, 27 p. [Available at https://nrm.dfg.ca.gov/FileHandler.ashx?DocumentID=7702.]
Halstead, B.J., Valcarcel, P., Kim, R., Jordan, A.C., Rose, J.P., Skalos, S.M., Reyes, G.A., Ersan, J.S., Casazza, M.L., Essert, A.M., and Fulton, A.M., 2021, A tale of two valleys—Endangered species policy and the fate of the giant gartersnake: California Fish and Wildlife Special CESA Issue, p. 264–283, accessed February 25, 2026, at https://doi.org/10.51492/cfwj.cesasi.16.
Halstead, B.J., Wylie, G.D., and Casazza, M.L., 2010, Habitat suitability and conservation of the giant gartersnake (Thamnophis gigas) in the Sacramento Valley of California: Copeia, v. 4, p. 591–599, accessed August 7, 2025, at https://doi.org/10.1643/CE-09-199.
Halstead, B.J., Wylie, G.D., Casazza, M.L., and Coates, P.S., 2011a, Temporal and maternal effects on reproductive ecology of the giant gartersnake (Thamnophis gigas): The Southwestern Naturalist, v. 56, no. 1, p. 29–34, accessed August 7, 2025, at https://doi.org/10.1894/GC-205.1.
Halstead, B.J., Wylie, G.D., Coates, P.S., Valcarcel, P., and Casazza, M.L., 2012, Bayesian shared frailty models for regional inference about wildlife survival: Animal Conservation, v. 15, no. 2, p. 117–124, accessed August 7, 2025, at https://doi.org/10.1111/j.1469-1795.2011.00495.x.
Halstead, B.J., Rose, J.P., Reyes, G.A., Wylie, G.D., and Casazza, M.L., 2019, Conservation reliance of a threatened snake on rice agriculture: Global Ecology and Conservation, v. 19, article e00681, 11 p., accessed August 7, 2025, at https://doi.org/10.1016/j.gecco.2019.e00681.
Halstead, B.J., Skalos, S.M., Wylie, G.D., and Casazza, M.L., 2015, Terrestrial ecology of semi-aquatic giant gartersnakes (Thamnophis gigas): Herpetological Conservation and Biology, v. 10, no. 2, p. 633–644. [Available at https://www.herpconbio.org/Volume_10/Issue_2/Halstead_etal_2015.pdf.]
Halstead, B.J., Valcarcel, P., Wylie, G.D., Coates, P.S., Casazza, M.L., and Rosenberg, D.K., 2016, Active season microhabitat and vegetation selection by giant gartersnakes associated with a restored marsh in California: Journal of Fish and Wildlife Management, v. 7, no. 2, p. 397–407, accessed August 7, 2025, at https://doi.org/10.3996/042016-JFWM-029.
Halstead, B.J., Wylie, G.D., and Casazza, M.L., 2013a, Efficacy of trap modifications for increasing capture rates of aquatic snakes in floating aquatic funnel traps: Herpetological Conservation and Biology, v. 8, no. 1, p. 65–74. [Available at https://herpconbio.org/Volume_8/Issue_1/Halstead_etal_2013.pdf.]
Kellner, K., 2016, jagsUI—A wrapper around ‘rjags’ to streamline ‘JAGS’ analyses: The Comprehensive R Archive Network web page, accessed August 7, 2025, at https://cran.r-project.org/web/packages/jagsUI/index.html.
Kéry, M., 2010, Introduction to WinBUGS for ecologists—A Bayesian approach to regression, Anova, mixed models, and related analyses: Burlington, Mass., Academic Press, 302 p. [Available at https://doi.org/10.1016/C2009-0-30639-X.]
Kéry, M., and Royle, J.A., 2016, Applied hierarchical modeling in ecology—Analysis of distribution, abundance and species richness in R and BUGS, volume 1—Prelude and static models: San Diego, Calif., Academic Press. [Available at https://www.sciencedirect.com/book/monograph/9780128013786/applied-hierarchical-modeling-in-ecology.]
Kéry, M., and Schaub, M., 2012, Bayesian population analysis using WinBUGS—A hierarchical perspective: Waltham, Mass., Academic Press, 537 p. [Available at https://doi.org/10.1016/C2010-0-68368-4.]
Kuo, L., and Mallick, B., 1998, Variable selection for regression models: Sankhyā—The Indian Journal of Statistics, v. 60, series B, pt. 1 (special issue on Bayesian analyses), p. 65–81. [Available at https://www.jstor.org/stable/25053023.]
MacKenzie, D.I., Nichols, J.D., Royle, J.A., Pollock, K.H., Bailey, L.L., and Hines, J.E., 2006, Occupancy estimation and modeling—Inferring patterns and dynamics of species occurrence (2d ed.): Amsterdam, The Netherlands, Academic Press, 641 p. [Available at https://doi.org/10.1016/C2012-0-01164-7.]
Madsen, T., Stille, B., and Shine, R., 1996, Inbreeding depression in an isolated population of Adders Vipera berus: Biological Conservation, v. 75, no. 2, p. 113–118, accessed August 7, 2025, at https://doi.org/10.1016/0006-3207(95)00067-4.
Madsen, T., Ujvari, B., and Olsson, M., 2004, Novel genes continue to enhance population growth in Adders (Vipera berus): Biological Conservation, v. 120, no. 1, p. 145–147, accessed August 7, 2025, at https://doi.org/10.1016/j.biocon.2004.01.022.
Nguyen, A.M., Halstead, B.J., and Todd, B.D., 2024, Effect of translocation on home range and movements of giant gartersnakes: Global Ecology and Conservation, v. 49, article e02789, 14 p., accessed August 7, 2025, at https://doi.org/10.1016/j.gecco.2023.e02789.
Nguyen, A.M., Todd, B.D., and Halstead, B.J., 2023, Survival and establishment of captive-reared and translocated giant gartersnakes after release: The Journal of Wildlife Management, v. 87, no. 3, 17 p., accessed August 7, 2025, at https://doi.org/10.1002/jwmg.22374.
Plummer, M., 2003, JAGS—A program for analysis of Bayesian graphical models using Gibbs sampling: Proceedings of the 3rd International Workshop on Distributed Statistical Computing, Vienna, Austria, March 20–22, 2003, 10 p. [Available at https://www.r-project.org/conferences/DSC-2003/Proceedings/Plummer.pdf.]
R Core Team, 2024, R—A language and environment for statistical computing, version 4.4.1 (Race for Your Life): R Foundation for Statistical Computing software release, accessed August 7, 2025, at https://www.R-project.org/.
Reyes, G.A., Halstead, B.J., Rose, J.P., Ersan, J.S.M., Jordan, A.C., Essert, A.M., Fouts, K.J., Fulton, A.M., Gustafson, K.B., Wack, R.F., Wylie, G.D., and Casazza, M.L., 2017, Behavioral response of giant gartersnakes (Thamnophis gigas) to the relative availability of aquatic habitat on the landscape: U.S. Geological Survey Open-File Report 2017–1141, 134 p., accessed August 7, 2025, at https://doi.org/10.3133/ofr20171141.
Riecke, T.V., Leach, A.G., Gibson, D., and Sedinger, J.S., 2018, Parameterizing the robust design in the BUGS language—Lifetime carry-over effects of environmental conditions during growth on a long-lived bird: Methods in Ecology and Evolution, v. 9, no. 11, p. 2294–2305, accessed August 7, 2025, at https://doi.org/10.1111/2041-210X.13065.
Rose, J.P., Ersan, J.S.M., Wylie, G.D., Casazza, M.L., and Halstead, B.J., 2018a, Reproductive frequency and size-dependence of fecundity in the giant gartersnake (Thamnophis gigas): Herpetological Conservation and Biology, v. 13, no. 1, p. 80–90. [Available at https://www.herpconbio.org/Volume_13/Issue_1/Rose_etal_2018.pdf.]
Rose, J.P., Wylie, G.D., Casazza, M.L., and Halstead, B.J., 2018b, Integrating growth and capture–mark–recapture models reveals size-dependent survival in an elusive species: Ecosphere, v. 9, no. 8, article e02384, 18 p., accessed August 7, 2025, at https://doi.org/10.1002/ecs2.2384.
Rose, J.P., Ersan, J.S.M., Reyes, G.A., Gustafson, K.B., Fulton, A.M., Fouts, K.J., Wack, R.F., Wylie, G.D., Casazza, M.L., and Halstead, B.J., 2018c, Findings from a preliminary investigation of the effects of aquatic habitat (water) availability on giant gartersnake (Thamnophis gigas) demography in the Sacramento Valley, California, 2014–17: U.S. Geological Survey Open-File Report 2018–1114, 48 p., accessed August 7, 2025, at https://doi.org/10.3133/ofr20181114.
Royle, J.A., and Dorazio, R.M., 2008, Hierarchical modeling and inference in ecology—The analysis of data from populations, metapopulations and communities (1st ed.): London, Academic Press, 444 p. [Available at https://doi.org/10.1016/B978-0-12-374097-7.X0001-4.]
Royle, J.A., and Kéry, M., 2007, A Bayesian state-space formulation of dynamic occupancy models: Ecology, v. 88, no. 7, p. 1813–1823, accessed August 7, 2025, at https://doi.org/10.1890/06-0669.1.
Schwartz, J.M., McCracken, G.F., and Burghardt, G.M., 1989, Multiple paternity in wild populations of the garter snake, Thamnophis sirtalis: Behavioral Ecology and Sociobiology, v. 25, no. 4, p. 269–273. [Available at https://doi.org/10.1007/BF00300053.]
Shine, R., O’Connor, D., Lemaster, M.P., and Mason, R.T., 2001, Pick on someone your own size—Ontogenetic shifts in mate choice by male garter snakes result in size-assortative mating: Animal Behaviour, v. 61, no. 6, p. 1133–1141, accessed August 7, 2025, at https://doi.org/10.1006/anbe.2001.1712.
Skalski, J.R., Ryding, K.E., and Millspaugh, J.J., 2005, Wildlife demography—Analysis of sex, age, and count data: Burlington, Mass., Academic Press, 636 p. [Available at https://doi.org/10.1016/B978-0-12-088773-6.X5000-7.]
Su, Y.-S., and Yajima, M., 2015, Using R to run ‘JAGS’, R package version 0.05-01: The Comprehensive R Archive Network web page, 13 p. [Available at https://cran.r-project.org/web/packages/R2jags/R2jags.pdf.]
U.S. Fish and Wildlife Service, 1993, Endangered and threatened wildlife and plants—Determination of threatened status for the giant garter snake: Federal Register, v. 58, no. 201, p. 54053–54066. [Available at https://archives.federalregister.gov/issue_slice/1993/10/20/54044-54070.pdf#page=10.]
U.S. Fish and Wildlife Service, 2017, Recovery plan for the giant garter snake (Thamnophis gigas): Sacramento, Calif., U.S. Fish and Wildlife Service, Pacific Southwest Region [variously paged; 79 p.] [Available at https://ecos.fws.gov/docs/recovery_plan/20170928_Signed%20Final_GGS_Recovery_Plan.pdf.]
Valcarcel, P.M., 2011, Giant gartersnake spatial ecology in agricultural and constructed wetlands: Corvallis, Oreg., Oregon State University, M.S. Thesis, 58 p. [Available at https://ir.library.oregonstate.edu/concern/graduate_thesis_or_dissertations/gh93h237h.]
Winne, C.T., Willson, J.D., Andrews, K.M., and Reed, R.N., 2006, Efficacy of marking snakes with disposable medical cautery units: Herpetological Review, v. 37, no. 1, p. 52–54. [Available at https://www.researchgate.net/publication/242446448_Efficacy_of_Marking_Snakes_with_Disposable_Medical_Cautery_Units.]
Wylie, G.D., Casazza, M.L., Halstead, B.J., and Gregory, C.J., 2009, Sex, season, and time of day interact to affect body temperatures of the giant gartersnake: Journal of Thermal Biology, v. 34, no. 4, p. 183–189, accessed August 7, 2025, at https://doi.org/10.1016/j.jtherbio.2009.01.006.
Wylie, G.D., Casazza, M.L., Gregory, C.J., and Halstead, B.J., 2010, Abundance and sexual size dimorphism of the giant gartersnake (Thamnophis gigas) in the Sacramento Valley of California: Journal of Herpetology, v. 44, no. 1, p. 94–103, accessed August 7, 2025, at https://doi.org/10.1670/08-337.1.
Appendix 1. Supplemental Information
Table 1.1.
Giant gartersnake captures and catch-per-unit effort (CPUE) across all study sites in the Natomas basin for each year from 2011 through 2024.Table 1.2.
Summary of giant gartersnake captures, abundance, and trapping efforts.[Data come from the old demography traplines at Betts-Kismat-Silva (BKS), Lucich North, Lucich South, Sills, and Fisherman’s Lake reserve and other traplines within the same reserve areas from 2020 to 2024. Note that there were no captures in the Fisherman’s Lake reserve during this time period, so there are no abundance estimates for this site. Abbreviation: N, estimated abundance]
Conversion Factors
Supplemental Information
A water year is the 12-month period from October 1 through September 30 of the following year and is designated by the calendar year in which it ends.
Abbreviations
Φ
apparent survival
p
recapture probability parameter
γ
availability on site
Basin
The Natomas basin
BKS
Betts-Kismat-Silva
CMR
capture-mark-recapture
COVID-19
Coronavirus Disease 2019
I–5
Interstate 5
JAGS
Just Another Gibbs Sampler
MCMC
Markov chain Monte Carlo
NBHCP
Natomas Basin Habitat Conservation Plan
PIT
passive integrative transponder
SAFCA
Sacramento Area Flood Control Agency
SECR
spatially explicit capture-recapture
SR 99
State Route 99
SVL
snout-vent length
TVL
tail-vent length
TNBC
The Natomas Basin Conservancy
USGS
U.S. Geological Survey
UTM
Universal Transverse Mercator
For more information concerning the research in this report, contact the
Director, Western Ecological Research Center
U.S. Geological Survey
3020 State University Drive East
Sacramento, California 95819
https://www.usgs.gov/centers/werc
Publishing support provided by the USGS Science Publishing Network,
Sacramento Publishing Service Center
Disclaimers
Any use of trade, firm, or product names is for descriptive purposes only and does not imply endorsement by the U.S. Government.
Although this information product, for the most part, is in the public domain, it also may contain copyrighted materials as noted in the text. Permission to reproduce copyrighted items must be secured from the copyright owner.
Suggested Citation
Nguyen, A.M., Rose, J.P., Jordan, A.C., Napolitano, G.R., Macias, D., Schoenig, E.J., Reyes, G.A., and Halstead, B.J., 2026, Natomas basin giant gartersnake annual monitoring report 2024: U.S. Geological Survey Open-File Report 2026–1009, 40 p., https://doi.org/10.3133/ofr20261009.
ISSN: 2331-1258 (online)
Study Area
| Publication type | Report |
|---|---|
| Publication Subtype | USGS Numbered Series |
| Title | Natomas basin giant gartersnake annual monitoring report 2024 |
| Series title | Open-File Report |
| Series number | 2026-1009 |
| DOI | 10.3133/ofr20261009 |
| Publication Date | May 06, 2026 |
| Year Published | 2026 |
| Language | English |
| Publisher | U.S. Geological Survey |
| Publisher location | Reston, VA |
| Contributing office(s) | Western Ecological Research Center |
| Description | viii, 40 p. |
| Country | United States |
| State | California |
| Other Geospatial | Natomas Basin |
| Online Only (Y/N) | Y |
| Additional Online Files (Y/N) | N |