

Continuous Stream Discharge, Salinity, and Associated Data Collected in the Lower St. Johns River and Its Tributaries, Florida, 2023
Links
- Document: Report (3.69 MB pdf) , HTML , XML
- Dataset: USGS water data for the Nation
- NGMDB Index Page: National Geologic Map Database Index Page (html)
- Download citation as: RIS | Dublin Core
Acknowledgments
The authors thank the data collection personnel from the U.S. Geological Survey for their help collecting and analyzing the streamflow and water-quality data.
Abstract
The U.S. Army Corps of Engineers, Jacksonville District, deepened the St. Johns River channel in Jacksonville, Florida, to accommodate larger, fully loaded cargo vessels. The U.S. Geological Survey (USGS), in cooperation with the U.S. Army Corps of Engineers, monitored stage, discharge, and (or) water temperature and salinity at 26 continuous data collection sites in the St. Johns River and its tributaries.
This report contains information collected during the 2023 water year, from October 2022 to September 2023. Data at each site were compared for the length of the project, 8 years so far, and on a yearly basis to show the annual variability of discharge and salinity.
The countywide annual rainfall for the 2023 water year was below the average yearly rainfall in four of the five counties. Annual mean discharge at 9 of the 10 tributary monitoring sites was lower for the 2023 water year than for the 2022 water year, and the annual mean flow at Broward River below Biscayne Boulevard near Jacksonville, Florida (USGS site number 02246751), was the lowest recorded at that site for the 8 years of data collection. The annual mean discharge for each of the main-stem sites was higher for the 2023 water year than for the 2022 water year and was above the average for the 8 years of data collected so far.
Among the tributary sites, annual mean salinity was highest at Clapboard Creek above Buckhorn Bluff near Jacksonville, Fla. (USGS site number 302657081312400), the site closest to the Atlantic Ocean, and was lowest at Durbin Creek near Fruit Cove, Fla. (USGS site number 022462002), the site farthest from the ocean, for all years. Annual mean salinity data from the main-stem sites indicate that salinity decreased with distance upstream from the ocean, which was expected. Annual mean salinity for the 2023 water year was higher than or equal to that of the 2022 water year for all main-stem and tributary sites, except at St. Johns River at Dancy Point near Spuds, Fla. (USGS site number 294213081345300), which was lower. Three main-stem monitoring stations (USGS site numbers 295856081372301, 02245340, and 301057081414800) and six tributary monitoring stations (USGS site numbers 300803081354500, 022462002, 301204081434900, 02246459, 02246518, and 02246804) either had the highest annual mean salinities or tied with the highest annual mean salinities at their respective sites since data collection began.
Introduction
The St. Johns River flows 310 miles (mi) northward through the eastern half of Florida, through Jacksonville, and into the Atlantic Ocean (fig. 1). The river consists of lakes, marshes, and seagrass beds, as well as the main river channel (herein referred to as the “main stem”) that, near its mouth, can accommodate cruise ships and cargo vessels with access to the Atlantic Ocean. Prior to May 2022, the mouth of the St. Johns River in Jacksonville could only accommodate small cargo vessels or large cargo vessels loaded below maximum capacity because of the authorized channel depth of 40 feet (ft). An additional 7 ft was dredged out of the channel to allow the port to accommodate larger, fully loaded vessels. Beginning at the mouth, the U.S. Army Corps of Engineers (USACE) deepened the first 13 river miles (USACE, 2014). Dredging construction began February 2018 (Jacksonville Port Authority [JAXPORT], 2018) and was completed in May 2022 (USACE, 2022).
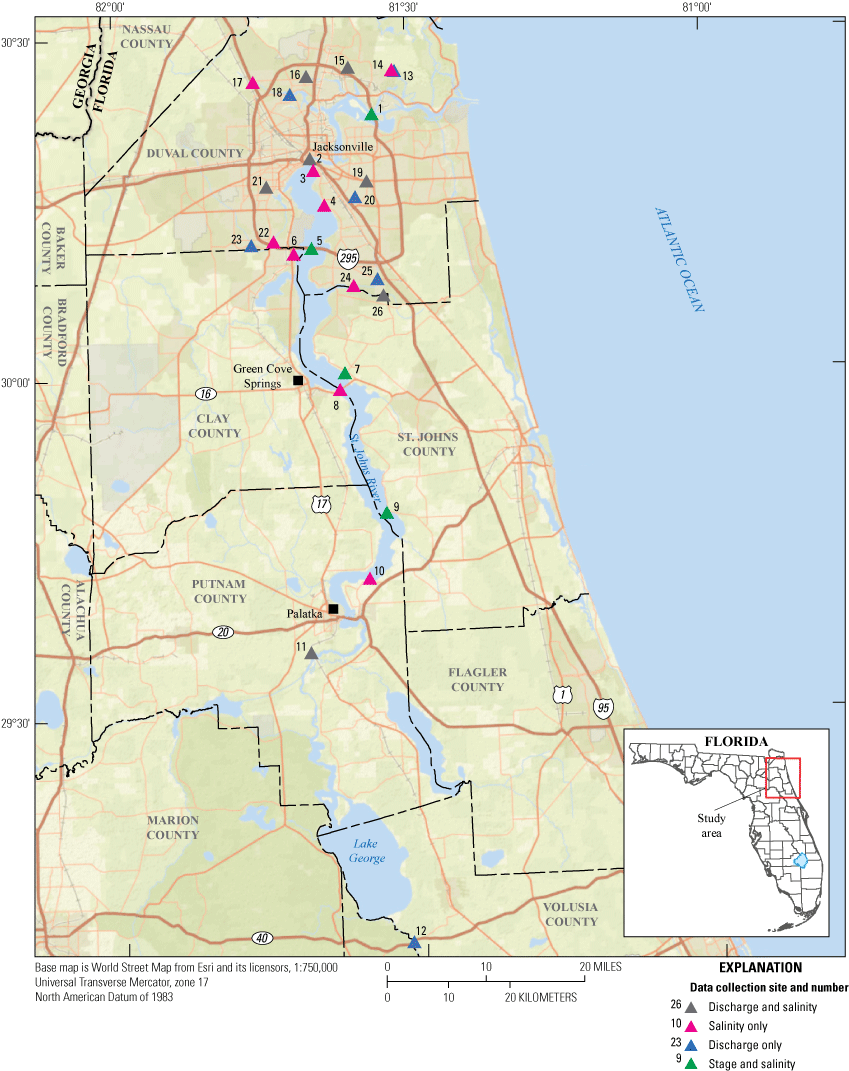
U.S. Geological Survey data collection sites on the St. Johns River and its tributaries. Map image is the intellectual property of Esri and is used herein under license. Copyright 2021 Esri and its licensors. All rights reserved.
Salinity models indicate that the harbor deepening may alter salinity in part of the study area, potentially causing (1) salinity stress in some wetlands and submerged aquatic vegetation and (2) changes in some fish and macroinvertebrate distributions (USACE, 2014). Surface-water monitoring, required by permit, includes the collection of water temperature, salinity, and (or) stage, velocity, and streamflow data for at least 6 months prior to dredging, continuously throughout dredging, and for 10 years following dredging (Florida Department of Environmental Protection, 2016). The U.S. Geological Survey (USGS), in cooperation with the USACE, is responsible for monitoring all required parameters at the gage locations listed in the permit that were not already being monitored by other entities as of January 2016, the beginning of the initial data collection period (Florida Department of Environmental Protection, 2016). The streamflow and water-quality monitoring network was used to collect baseline data in the St. Johns River and its tributaries prior to dredging and can be used to discern changes, if any, during and after dredging.
This report provides an overview of the data collected from October 2022 to September 2023 at 26 surface-water and water-quality sites along the St. Johns River and its tributaries (figs. 1 and 2). This period of data collection was after the completion of river dredging, which was initiated in February 2018 and concluded in May 2022 by the USACE as part of the project to deepen the first 13 river miles of the St. Johns River. Data collection began in the 2016 water year, and this is the seventh annual report of the study. The report documents the data collection sites, methods used to compute discharge and salinity, and parameters monitored at each site. The first 7 years of the study are described in Ryan (2018, 2019, 2020a, b, 2022, 2023) and Carson and Benacquisto (2025). The study description, introduction, and methods were originally presented in Ryan (2018) and are summarized herein.
The data collected during this study are available from the USGS National Water Information System database (USGS, 2025).
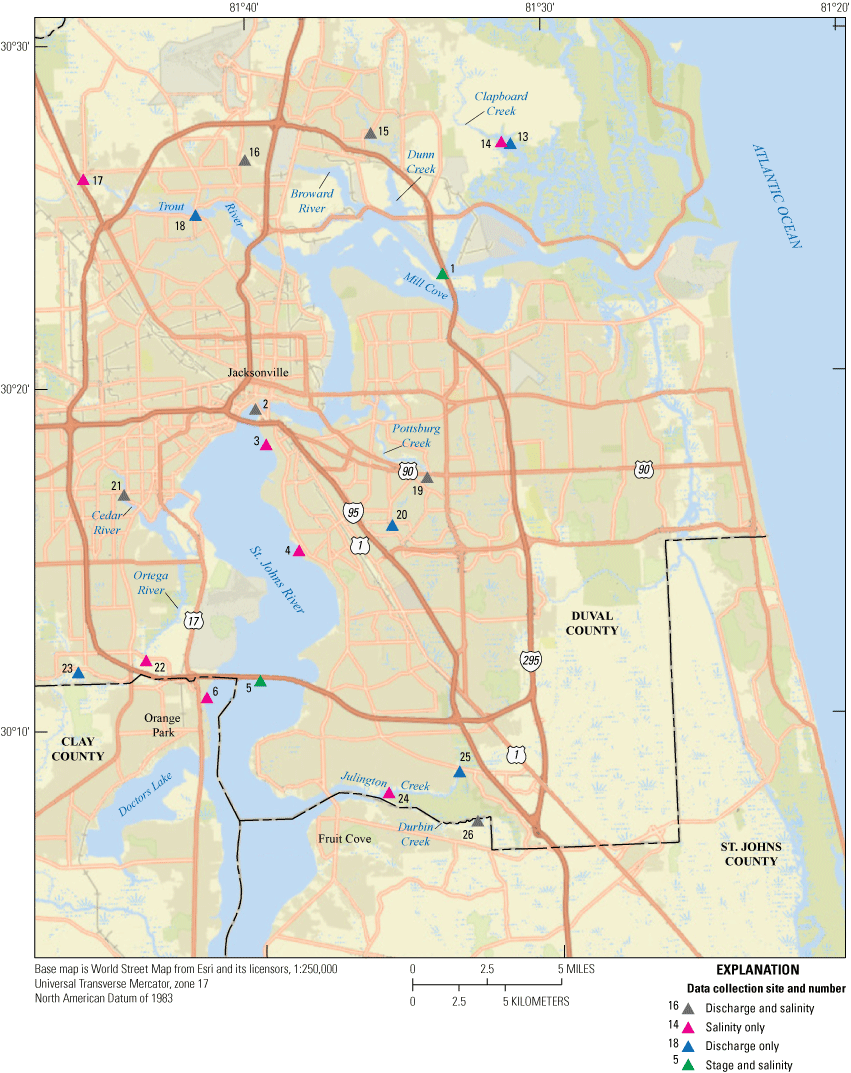
U.S. Geological Survey data collection sites in Clay, Duval, and St. Johns Counties, Florida. Map image is the intellectual property of Esri and is used herein under license. Copyright 2021 Esri and its licensors. All rights reserved.
Methods
The methods of data collection and processing, as well as the sites used for data collection, are described in the following sections. The descriptions of data collection sites are separated into those along the St. Johns River, henceforth described as main-stem sites, and those along its tributaries (table 1).
Table 1.
U.S. Geological Survey data collection sites on the main stem of the St. Johns River and its tributaries and parameters published during the 2023 water year.[USGS, U.S. Geological Survey; Fla., Florida; NA, not applicable; x, parameter measured; --, parameter not measured]
Data Collection and Processing
Stage data (gage height, in feet, referenced to the North American Vertical Datum of 1988) were collected at 15-minute intervals using various types of equipment, depending on location requirements, in accordance with USGS standards (Sauer and Turnipseed, 2010a). Discharge was routinely measured by using various types of equipment, depending on depth, velocity, and environmental conditions, in accordance with USGS standards (Sauer and Turnipseed, 2010b). As a result of tidal and (or) wind effects, discharge was computed, in cubic feet per second, using the index-velocity method at most sites, in accordance with USGS techniques and methods (Levesque and Oberg, 2012). Discharge was computed using a stage-discharge relation at a few sites where tidal influence was not substantial (Rantz and others, 1982). Where applicable, discharge data were filtered by using the Godin low-pass filter to remove principal tidal frequencies from unit values (Godin, 1972). By convention, the USGS designates ebb (seaward) flow as positive flow and flood (landward) flow as negative flow. The residuals are not total freshwater flows, but instead, a combination of seaward freshwater flows from the watershed and landward saltwater flows from the marine environment, along with storm surges from hurricanes or tropical storms.
Water temperature, in degrees Celsius, and specific conductance, in microsiemens per centimeter at 25 degrees Celsius, were measured at intervals of 1 hour or less in accordance with USGS techniques and methods (Wagner and others, 2006). Water-quality meters were installed in situ at sites in freshwater environments. A pump and intake system was installed at sites in elevated saltwater environments to reduce fouling. The depth of the meter or pump intake is chosen to be representative of the channel in accordance with USGS techniques and methods (Wagner and others, 2006) but may vary between sites. This setup consisted of a meter housed inside a polyvinyl chloride chamber in a shelter. In this case, water was pumped into the chamber for 1–2 minutes before each measurement and drained from the chamber between measurements. The recording interval was reduced to one measurement per hour because of the power requirements for the pump setup. Because the chamber drains between measurements, water-quality parameters can be measured at multiple levels with one meter, if necessary. A rating table was used to convert specific conductance, in microsiemens per centimeter, to salinity, in parts per thousand (Wagner and others, 2006). Salinity was calculated for every site where water temperature and specific conductance were measured.
Missing discharge data can usually be attributed to equipment malfunctions, either with the stage sensor or velocity meter (if the index-velocity method is used). For tidally filtered discharge calculation, the Godin low-pass filter requires 35 hours of continuous data before and after each data point (Godin, 1972). A data gap greater than 2 hours, therefore, results in a data gap of 3 days in the tidally filtered discharge record. For sites that include a pump setup, missing water-quality data are usually a consequence of power or pump failure, which prevents water from filling the chamber where the meter is housed. Biological fouling is a more common problem with meters installed in situ, where algal growth and crustaceans can affect the conductance measurement port or the temperature probe, both of which provide data used to calculate salinity. In either case, the affected values are not used, creating gaps in the final record.
Rainfall data for Duval, Clay, St. Johns, Putnam, and Volusia Counties in 2023 were obtained from the St. Johns River Water Management District (SJRWMD), which provides details about how average monthly rainfall data are compiled for counties in their district (SJRWMD, 2024). The period of record rainfall data to determine a long-term countywide average were compiled using National Oceanic and Atmospheric Administration rain gages in central and north Florida through 2009. The first 13 river miles of the St. Johns River and all monitoring sites included in this study are located within Duval County, except St. Johns River at Astor, Florida (USGS site number 02236125, map number 12) in Volusia County; St. Johns River at Dancy Point near Spuds, Fla. (USGS site number 294213081345300, map number 10) and St. Johns River at Buffalo Bluff near Satsuma, Fla. (USGS site number 02244040, map number 11) in Putnam County; St. Johns River at Racy Point near Hastings, Fla. (USGS site number 02245290, map number 9) and St. Johns River Shands Bridge near Green Cove Springs, Fla. (USGS site number 295856081372301, map number 8) in St. Johns County; and St. Johns River above Buckman Bridge at Jacksonville, Fla. (USGS site number 301057081414800, map number 6) near the left bank in Clay County (fig. 1; table 1).
Quantile plots were created to show percentiles for annual discharge data collected at monitoring sites that have at least 10 years of record and a full contemporary year of data. The quantile plots group the annual peak discharges by water year. For this report, the 2023 water year includes data from October 1, 2022, to September 30, 2023. The resulting plots show how the 2023 water year discharge at a given site compares with that of previous water years. For discharges affected by tidal fluctuations, annual mean tidally filtered discharge was used to construct the plot.
Boxplots were created to provide a visual reference of median, interquartile range, and other useful statistics for salinity. These boxplots were constructed using all approved unit values of salinity and show salinity differences between water years.
Description of St. Johns River Main-Stem Sites
All sites on the main stem of the St. Johns River have substantive tidal influence, and therefore, the calculated discharge is tidally filtered. No changes were made to the monitoring network during this year of the study.
The farthest upstream discharge monitoring site is St. Johns River at Astor, Fla. (USGS site number 02236125, map number 12) (table 1; river mile 127). Approximately 37 mi downstream, discharge is also calculated for the monitoring site St. Johns River at Buffalo Bluff, near Satsuma, Fla. (USGS site number 02244040, map number 11) (river mile 90). Tidally filtered discharge values have been computed since 1994 at both of these sites. Water temperature and specific conductance are measured at St. Johns River at Buffalo Bluff near Satsuma, Fla. (USGS site number 02244040, map number 11) (river mile 90) at an approximate depth of 6 ft below the average high-tide level. Another water-quality monitoring site is St. Johns River at Dancy Point near Spuds, Fla. (USGS site number 294213081345300, map number 10) (river mile 71), where water temperature and specific conductance are measured at an approximate depth of 11.5 ft below the average high-tide level. Stage, water temperature, and specific conductance are monitored farther downstream near the right bank of the St. Johns River at the monitoring site Racy Point near Hastings, Fla. (USGS site number 02245290, map number 9) (river mile 64). The water-quality parameters are measured at an approximate depth of 2.5 ft below the average high-tide level. Water temperature and specific conductance are collected near the channel of the St. Johns River at the monitoring site St. Johns River Shands Bridge near Green Cove Springs, Fla. (USGS site number 295856081372301, map number 8) (river mile 50). This location was historically monitored from April 1995 to September 2001 at multiple depths and from April 2008 to September 2009 at the middle depth. The meter was reinstalled in May 2018 at the middle-depth location of 10 ft below the average high-tide level. Just downstream near the right bank, stage, water temperature, and specific conductance are measured at an approximate depth of 8.5 ft below the average high-tide level at the monitoring site St. Johns River below Shands Bridge near Green Cove Springs, Fla. (USGS site number 02245340, map number 7) (river mile 49).
A monitoring site is located near the left bank of the St. Johns River just upstream from Buckman Bridge. Water temperature and specific conductance are measured at an approximate depth of 4 ft below the average high-tide level at this site, St. Johns River above Buckman Bridge at Jacksonville, Fla. (USGS site number 301057081414800, map number 6) (river mile 35). The monitoring site St. Johns River Buckman Bridge at Jacksonville, Fla. (USGS site number 301124081395901, map number 5) (river mile 34) near the main channel measures stage, water temperature, and specific conductance. The water-quality parameters are measured with separate pump setups and intakes at two different depths to document possible stratification. One water-quality meter is used in the chamber and monitors both water properties at each depth. All water-quality parameters are monitored at approximate depths of 8 ft (top) and 16 ft (bottom) below the average high-tide level. The water-quality monitoring sites St. Johns River at Christopher Point near Jacksonville, Fla. (USGS site number 301510081383500, map number 4) (river mile 29) and St. Johns River below Marco Lake at Jacksonville, Fla. (USGS site number 301817081393600, map number 3) (river mile 25) measure water temperature and specific conductance at an approximate depth of 4 ft below the average high-tide level at each location. These sites are characterized by relatively shallow water having an average depth of less than 6 ft and represent river conditions in nearshore seagrass beds.
The St. Johns River at Jacksonville, Fla., data collection site (USGS site number 02246500, map number 2), located near downtown Jacksonville (river mile 23), is the farthest downstream gage that calculates discharge. Stage and discharge were previously monitored before the dredging study began, but water temperature and specific conductance data collection began in October 2015 at an approximate depth of 11 ft below the average high-tide level. The monitoring equipment was moved to the center of the channel in April 2018 because of fender construction, and the intake was installed at a new depth of 17 ft below the average high-tide level. Velocity and streamflow direction data collection were added in October 2017. Tidally filtered discharge values have been computed since 1996. The monitoring site St. Johns River Dames Point Bridge at Jacksonville, Fla. (USGS site number 302309081333001, map number 1) (river mile 10) measures stage, velocity, water temperature, and specific conductance; calculation of salinity began in October 2016. All water-quality data are collected at approximate depths of 15 ft (top) and 22 ft (bottom) below the average high-tide level by using one water-quality meter and pump setup with separate intakes, similar to those used at the site St. Johns River Buckman Bridge at Jacksonville, Fla. (USGS site number 301124081395901, map number 5) to measure possible stratification. At monitoring site St. Johns River Dames Point Bridge at Jacksonville, Fla. (USGS site number 302309081333001, map number 1), the collection of stage data began in October 2017, and the collection of velocity and streamflow direction data began in May 2018.
Description of Tributary Sites
No changes to the tributary monitoring network occurred during this year of the study. The monitoring site Julington Creek at Old St. Augustine Road near Bayard, Fla. (USGS site number 02246160, map number 25) calculates discharge 6.7 mi upstream from the confluence of Julington Creek with the St. Johns River (table 1). A nearby water-quality monitoring site measures water temperature and specific conductance at an approximate depth of 3.5 ft below the average high-tide level and is located on Julington Creek at Hood Landing near Bayard, Fla. (USGS site number 300803081354500, map number 24).
The site Durbin Creek near Fruit Cove, Fla. (USGS site number 022462002, map number 26) monitors stage, discharge, water temperature, specific conductance, and salinity 6.8 mi upstream from the confluence of Durbin Creek with the St. Johns River. The water-quality parameters are measured at an approximate depth of 3 ft below the average high-tide level. These locations are all tidally influenced, but large amounts of rainfall, resulting in increased discharge, can obscure the tidal signal.
The site Ortega River at Kirwin Road near Jacksonville, Fla. (USGS site number 02246318, map number 23) monitors stage and discharge 11 mi upstream from the confluence of the Ortega River and St. Johns River. Discharge has been computed intermittently at this location since 2002, and a stage-discharge rating was used for discharge computation during the study period, as no tidal influence is apparent in the stage data. A water-quality monitoring site, Ortega River salinity at Jacksonville, Fla. (USGS site number 301204081434900, map number 22), measures water temperature and specific conductance at an approximate depth of 6.5 ft below the average high-tide level and is located approximately 3 mi downstream from Ortega River at Kirwin Road near Jacksonville, Fla. (USGS site number 02246318, map number 23). Tidal influence is evident in the salinity data during times of low flow or increased stage in the St. Johns River.
The monitoring site Cedar River at San Juan Avenue at Jacksonville, Fla. (USGS site number 02246459, map number 21) measures stage, water temperature, and specific conductance 1.5 mi upstream from the confluence of the Cedar and St. Johns Rivers. The water-quality parameters are monitored at an approximate depth of 6 ft below the average high-tide level. Historical tidally filtered discharge values have been computed intermittently since 2002. Wind, tide, and rainfall all substantively affect flow and salinity at Cedar River at San Juan Avenue at Jacksonville, Fla. (USGS site number 02246459, map number 21), and vertically stratified, bidirectional flow is commonly measured when strong winds occur opposite the direction of flow.
The site Pottsburg Creek near South Jacksonville, Fla. (USGS site number 02246515, map number 20) measures stage 7.3 mi upstream from the confluence of Pottsburg Creek with the St. Johns River. A stage-discharge rating was used for discharge computation during the study period. The data indicate tidal influence when stage is low in the creek and elevated in the St. Johns River, but discharge measurements confirm the validity of the stage-discharge relation. The site Pottsburg Creek at U.S. 90 near South Jacksonville, Fla. (USGS site number 02246518, map number 19) monitors stage, discharge, water temperature, specific conductance, and salinity 5.2 mi upstream from the confluence of Pottsburg Creek with the St. Johns River. The water-quality parameters are monitored at an approximate depth of 4 ft below the average high-tide level. This location has a more pronounced tidal signal than the upstream location at Pottsburg Creek near South Jacksonville, Fla. (USGS site number 02246515, map number 20), and discharge and salinity are affected primarily by rainfall and elevated stage in the river.
The monitoring site Trout River near Jacksonville, Fla. (USGS site number 02246621, map number 18) calculates discharge 5 mi upstream from the confluence of Trout River with the St. Johns River. Water temperature and specific conductance are measured at Trout River below U.S. 1 at Dinsmore, Fla. (USGS site number 302609081453300, map number 17) 9.3 mi upstream from the confluence of Trout River with the St. Johns River at an approximate depth of 6 ft below the average high-tide level. The site Broward River below Biscayne Boulevard near Jacksonville, Fla. (USGS site number 02246751, map number 16) monitors stage, discharge, water temperature, specific conductance, and salinity 6.3 mi upstream from the confluence of the Broward River and St. Johns River. The water-quality parameters are monitored at an approximate depth of 4.5 ft below the average high-tide level. Discharge and salinity at these sites have a pronounced tidal signal, even when stage is elevated.
The site Dunn Creek at Dunn Creek Road near Eastport, Fla. (USGS site number 02246804, map number 15) monitors stage, discharge, water temperature, specific conductance, and salinity 5.3 mi upstream from the confluence of Dunn Creek with the St. Johns River. The monitoring site for Clapboard Creek near Jacksonville, Fla. (USGS site number 02246825, map number 13) calculates discharge 4.5 mi upstream from the confluence of Clapboard Creek with the St. Johns River. Water temperature and specific conductance are measured at Clapboard Creek above Buckhorn Bluff near Jacksonville, Fla. (USGS site number 302657081312400, map number 14) 0.5 mi upstream of the discharge monitoring site. The water-quality parameters are monitored at approximate depths of 5.5 and 6.5 ft below the average high-tide level. Discharge and salinity fluctuations at these sites are dependent on rainfall in the relatively small drainage area and on wind effects from the St. Johns River, owing to the proximity of the sites to the river and Atlantic Ocean.
Results
Discharge and salinity varied widely during the 2023 water year because of the large study area and diversity of sites. As expected, salinities were lowest at the tributary sites farthest from the ocean and highest during periods of low flow in the St. Johns River. Discharge also increased at both the tributary and main-stem sites during periods of increased rainfall.
Data at each site were compared for the length of the project and on a yearly basis to show the annual variability of discharge and salinity in the project area. Rainfall, daily discharge, and salinity plots for the 2023 water year (October 2022–September 2023) are presented in the following sections where applicable. A year refers to a water year in these sections unless otherwise noted. Daily discharge is tidally filtered at sites where substantive tidal fluctuations occur. Salinity values are not filtered and include daily maximum, minimum, and mean values. Instantaneous values can be accessed via the USGS National Water Information System database (USGS, 2025). Annual mean discharges are calculated only for sites having at least an entire year of discharge record. The annual mean is not calculated for partial years of record when sites were installed. Quantile plots are only available for sites having a minimum of 10 years of streamflow record.
Rainfall
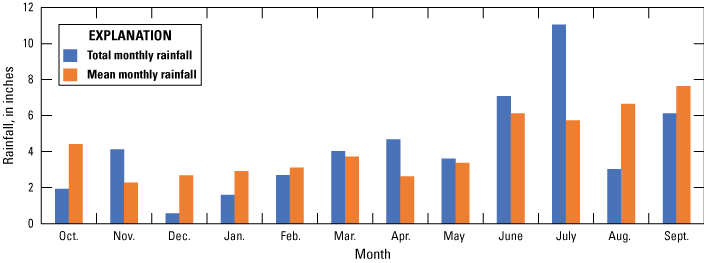
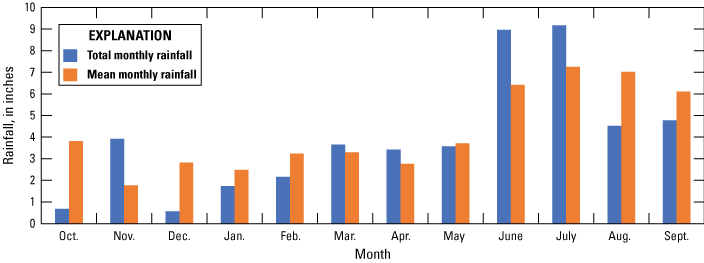
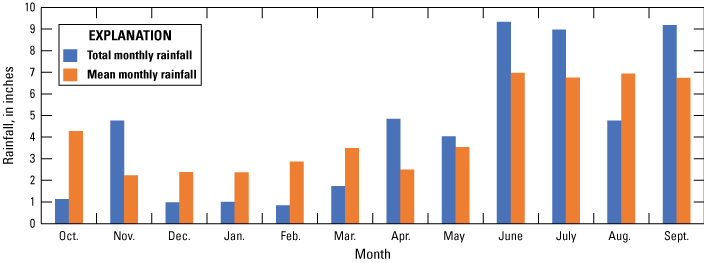
Duval County rainfall for the 2023 water year (October 2022–September 2023) was 7.2 inches (in.) below the long-term average (SJRWMD, 2024). Monthly total rainfall ranged from 3.7 in. below average in August to 2.0 in. above average in June (fig. 3). Duval County annual rainfall ranked fifth compared to the cumulative long-term average of the five counties included in this study (SJRWMD, 2024). Annual rainfall averaged 1.2 and 0.7 in. below average for Clay and St. Johns Counties, respectively (SJRWMD, 2024). The highest monthly rainfall total for Clay County occurred in November and was 3.1 in. above average, and the highest positive monthly departure for St. Johns County, 5.3 in. above average, occurred in July (figs. 4 and 5). The lowest monthly rainfall totals for the two counties occurred in August and were 3.1 in. below average for Clay County and 3.6 in. below average for St. Johns County (figs. 4 and 5). Of the five counties compared for this study, Clay County ranked third, and St. Johns County ranked second for rainfall totals in the 2023 water year (SJRWMD, 2024).
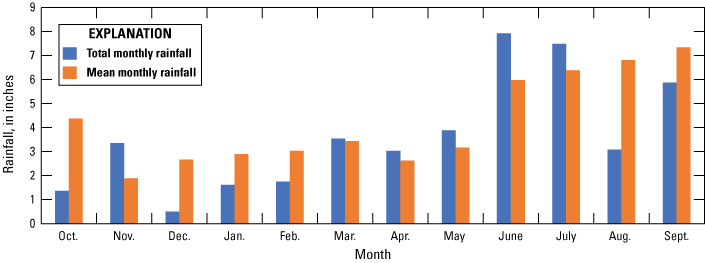
Graph showing 2023 water year monthly rainfall and mean monthly rainfall for Duval County (SJRWMD, 2024).
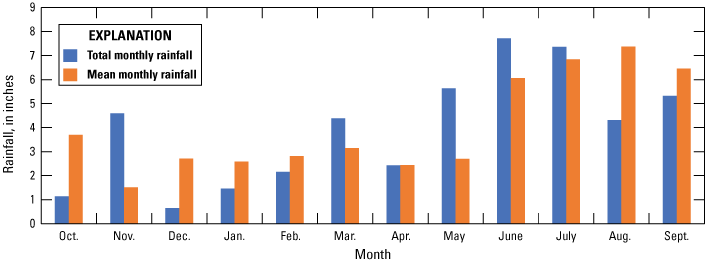
Graph showing 2023 water year monthly rainfall and mean monthly rainfall for Clay County (SJRWMD, 2024).
Graph showing 2023 water year monthly rainfall and mean monthly rainfall for St. Johns County (SJRWMD, 2024).
Annual rainfall for Putnam County was 3.6 in. below the average yearly total, while Volusia County was 0.5 in. above the average yearly total (SJRWMD, 2024). Rainfall for Putnam County ranged from 2.5 in. above average in June to 3.1 in. below average in October (fig. 6). Rainfall for Volusia County ranged from 2.5 in. above average in November to 3.1 in. below average in October (fig. 7). Of the five counties compared for this study, Putnam County ranked fourth, and Volusia County ranked first for rainfall totals in the 2023 water year. Rainfall for each of the five counties was below the average monthly total from December to February.
Graph showing 2023 water year monthly rainfall and mean monthly rainfall for Putnam County (SJRWMD, 2024).
Graph showing 2023 water year monthly rainfall and mean monthly rainfall for Volusia County (SJRWMD, 2024).
Main-Stem Sites
The parameters measured on the main stem of the St. Johns River are affected by many factors, including tidal influence, rainfall, and wind. Heavy rainfall typically increases discharge and decreases salinity, and the tidal influence introduces more fluctuations than a nontidal system. Strong northerly or easterly winds can increase salinity in the St. Johns River as ocean water having higher salinity is pushed upstream and these winds can lower or even produce negative discharge for multiple days. When the wind calms or changes direction, discharge typically increases sharply as this ocean water and other tributary inflows exit the river.
St. Johns River at Astor, Florida.—Daily tidally filtered discharge at St. Johns River at Astor, Fla. (USGS site number 02236125, map number 12) ranged from −4,770 to 17,000 cubic feet per second (ft3/s) during the 2023 water year (fig. 8), with an annual mean of 4,750 ft3/s (fig. 9). A comparison of historical annual mean tidally filtered flows indicated that 2023 streamflow ranked in the 91st percentile for the 29 years of record; the median tidally filtered annual mean flow for the period of record was 2,870 ft3/s (fig. 9). The high percentile for the 2023 water year mostly was due to rainfall from Hurricane Ian. The peak for the year occurred in October 2022 after Hurricane Ian passed through at the end of September 2022 (fig. 8). This peak was the highest daily mean tidally filtered peak on record. Discharge data were estimated for 10 days in October and 4 days in November because of equipment malfunctions.
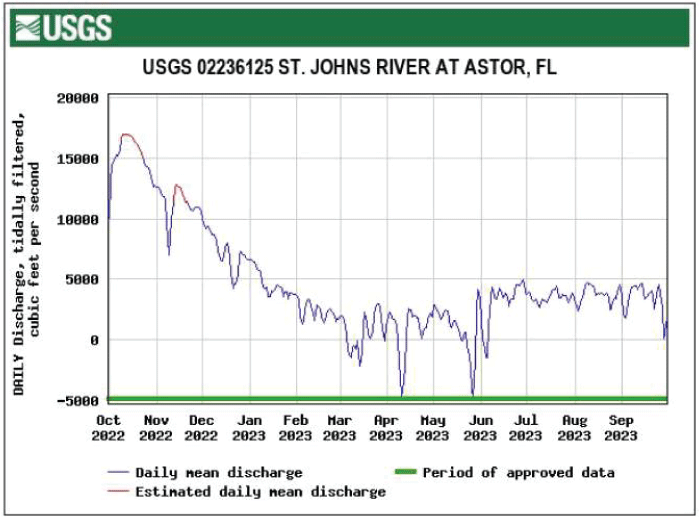
Daily mean tidally filtered discharge for St. Johns River at Astor, Florida.
Annual mean tidally filtered streamflow data for St. Johns River at Astor, Florida.
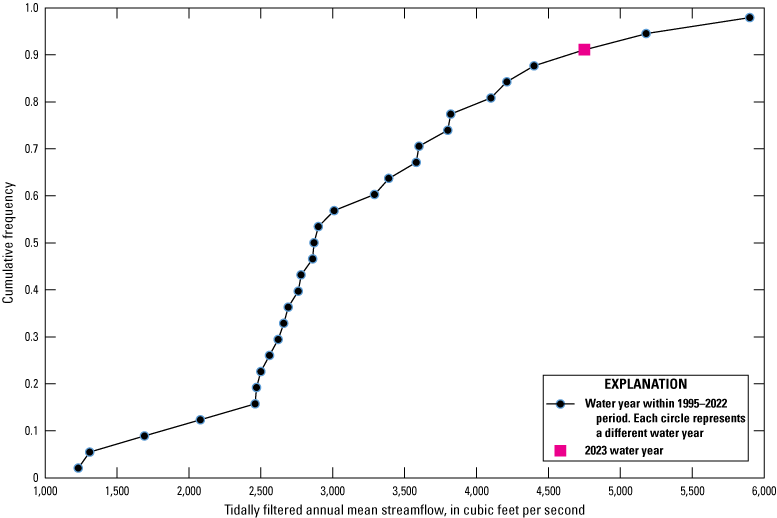
St. Johns River at Buffalo Bluff near Satsuma, Florida.—Daily tidally filtered discharge at St. Johns River at Buffalo Bluff near Satsuma, Fla. (USGS site number 02244040, map number 11) ranged from −19,400 to 24,400 ft3/s during the 2023 water year, with an annual mean of 6,570 ft3/s (figs. 10 and 11). Salinity ranged from 0.2 to 0.6 parts per thousand (ppt) over this same period (fig. 12), with a median and mean of 0.4 ppt (fig. 13). A comparison of historical annual mean tidally filtered flows indicated that 2023 streamflow ranked in the 81st percentile for the 30 years of record; the median tidally filtered flow for the period of record was 4,700 ft3/s (fig. 11). The above-average percentile for the 2023 water year mostly was due to rainfall from Hurricanes Ian and Nicole. The daily mean tidally filtered peaks after these hurricanes were the second highest peaks on record, only exceeded by peaks from Hurricane Irma in 2017. The annual mean and median salinity only have a 0.2-ppt range (0.3–0.5 ppt) for each of the 7 years that salinity was calculated in the study (fig. 13).
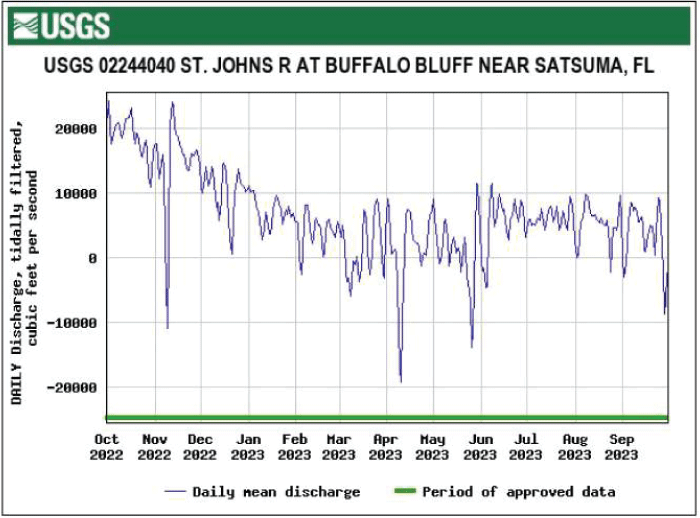
Daily mean tidally filtered discharge for St. Johns River at Buffalo Bluff near Satsuma, Florida.
Annual mean tidally filtered streamflow data for St. Johns River at Buffalo Bluff near Satsuma, Florida.
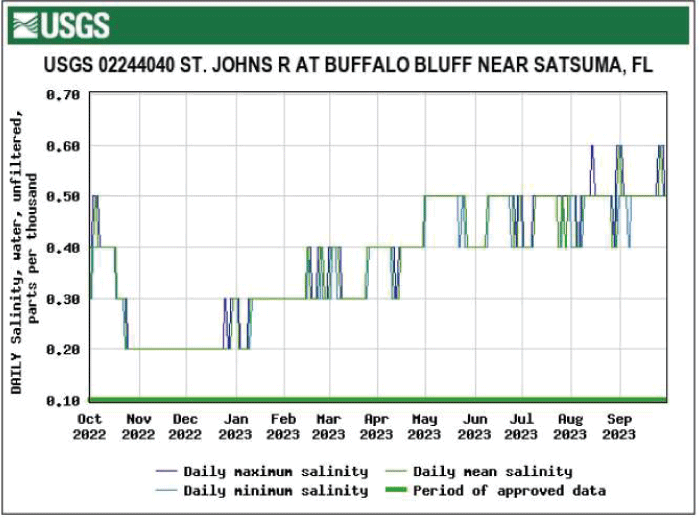
Daily maximum, minimum, and mean salinity for St. Johns River at Buffalo Bluff near Satsuma, Florida.
Salinity data for St. Johns River at Buffalo Bluff near Satsuma, Florida.
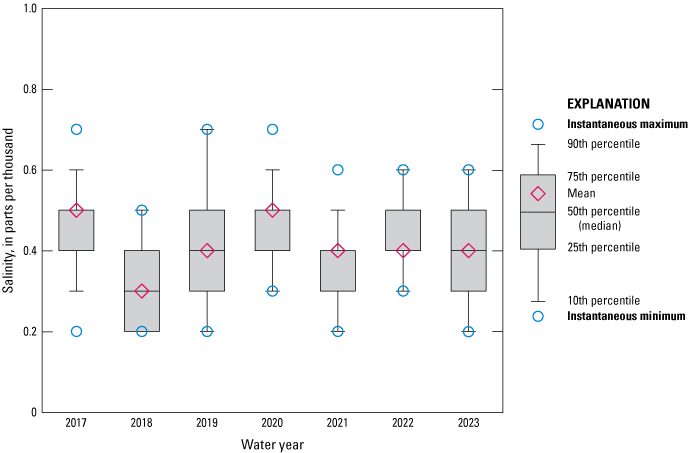
St. Johns River at Dancy Point near Spuds, Florida.—Salinity on the St. Johns River at Dancy Point near Spuds, Fla. (USGS site number 294213081345300, map number 10) ranged from 0.2 to 0.9 ppt during the 2023 water year, with a median and mean of 0.3 ppt (figs. 14 and 15). The salinity data showed fluctuations caused by tidal effects and rainfall. The annual mean and median salinity only have a 0.2-ppt range (0.3–0.5 ppt) for each of the 7 years salinity was calculated in the study (fig. 15).
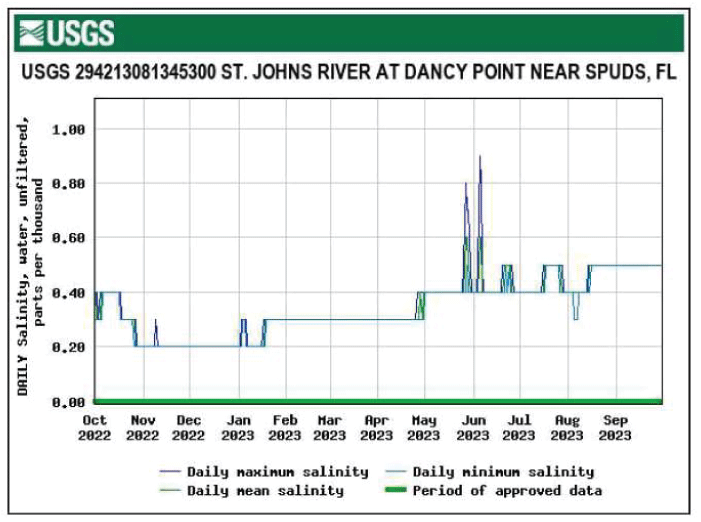
Daily maximum, minimum, and mean salinity for St. Johns River at Dancy Point near Spuds, Florida.
Salinity data for St. Johns River at Dancy Point near Spuds, Florida.
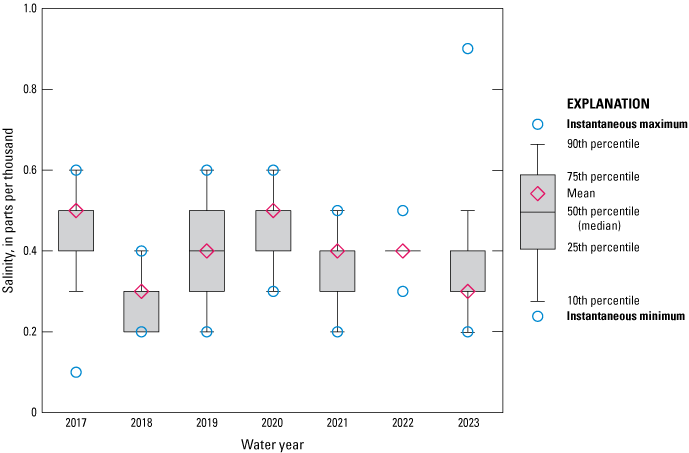
St. Johns River at Racy Point near Hastings, Florida.—Salinity on the St. Johns River at Racy Point near Hastings, Fla. (USGS site number 02245290, map number 9) ranged from 0.2 to 1.5 ppt during the 2023 water year, with a median of 0.3 ppt and a mean of 0.4 ppt (figs. 16 and 17). There were 4 days of missing salinity data in July caused by an equipment malfunction. The salinity at St. Johns River at Racy Point near Hastings, Fla. remained steady the entire year, with peaks in May and June. The annual mean and median salinity only have a 0.2-ppt range (0.3–0.5 ppt) for the 6 years salinity was calculated in the study (fig. 17). The maximum instantaneous salinity of 1.5 ppt for the 2023 water year was the highest recorded at the site for the 6 years of data collection. The next highest instantaneous maximum was 0.6 ppt for multiple years. The new maximum of 1.5 ppt was 0.9 ppt higher than the previous maximum.
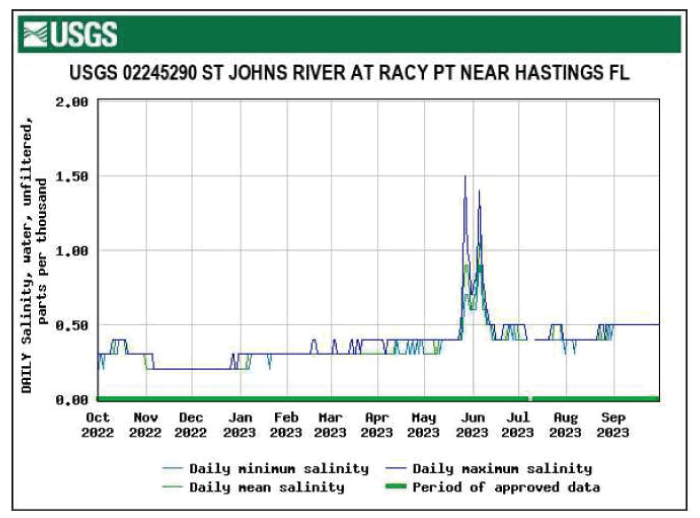
Daily maximum, minimum, and mean salinity for St. Johns River at Racy Point near Hastings, Florida.
Salinity data for St. Johns River at Racy Point near Hastings, Florida.
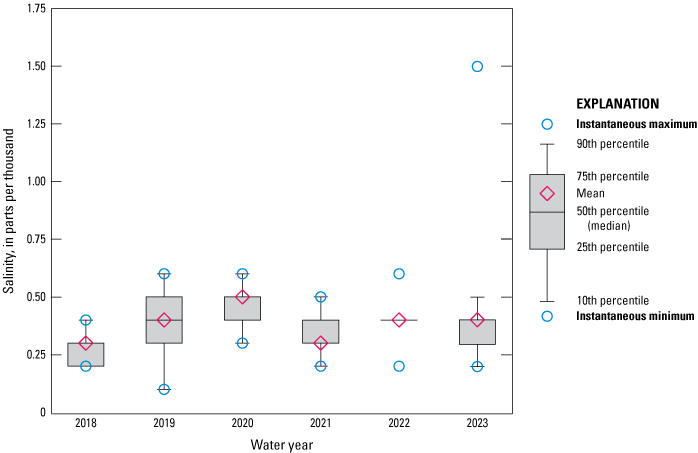
St. Johns River Shands Bridge near Green Cove Springs, Florida.—Salinity on the St. Johns River Shands Bridge near Green Cove Springs, Fla. (USGS site number 295856081372301, map number 8) ranged from 0.2 to 7.7 ppt during the 2023 water year, with a median of 0.4 ppt and a mean of 0.9 ppt (figs. 18 and 19). A boxplot of salinity data for the 6 years of data collection shows the highest mean salinity occurred in 2023 (fig. 19).
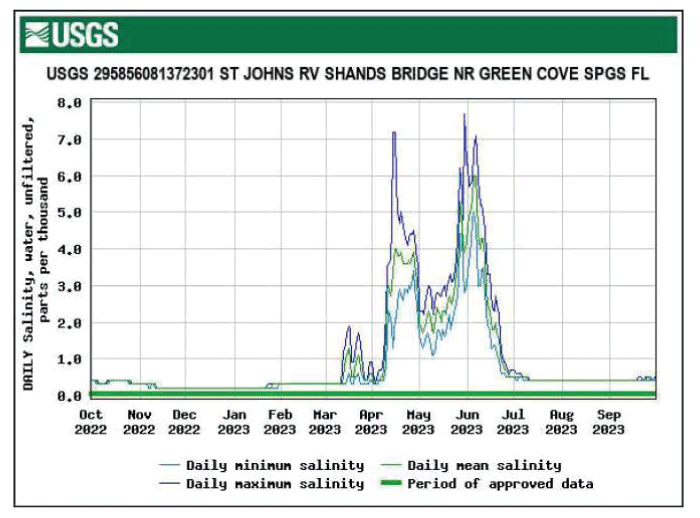
Daily maximum, minimum, and mean salinity for St. Johns River Shands Bridge near Green Cove Springs, Florida.
Salinity data for St. Johns River Shands Bridge near Green Cove Springs, Florida.
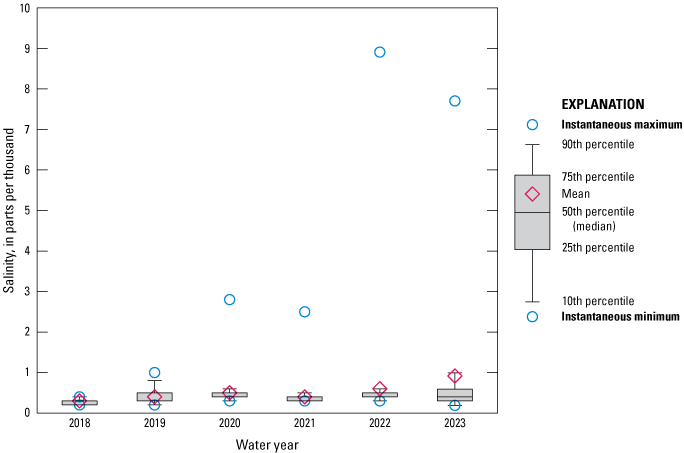
St. Johns River below Shands Bridge near Green Cove Springs, Florida.—Salinity on the St. Johns River below Shands Bridge near Green Cove Springs, Fla. (USGS site number 02245340, map number 7) ranged from 0.2 to 6.6 ppt during the 2023 water year, with a median of 0.4 ppt and a mean of 0.9 ppt (figs. 20 and 21). The 2023 mean and maximum salinity were second highest among those computed for the 7 years of data collection at this site (fig. 21).
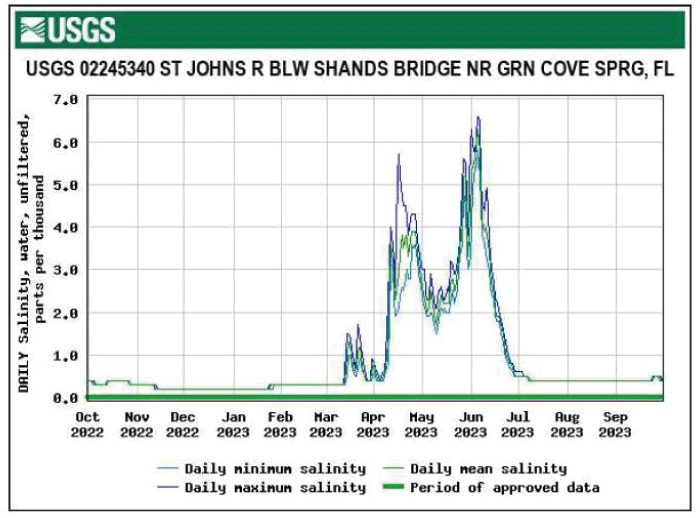
Daily maximum, minimum, and mean salinity for St. Johns River below Shands Bridge near Green Cove Springs, Florida.
Salinity data for St. Johns River below Shands Bridge near Green Cove Springs, Florida.
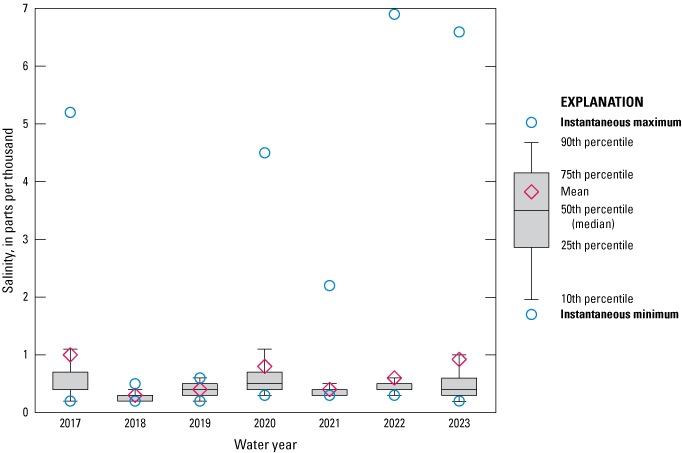
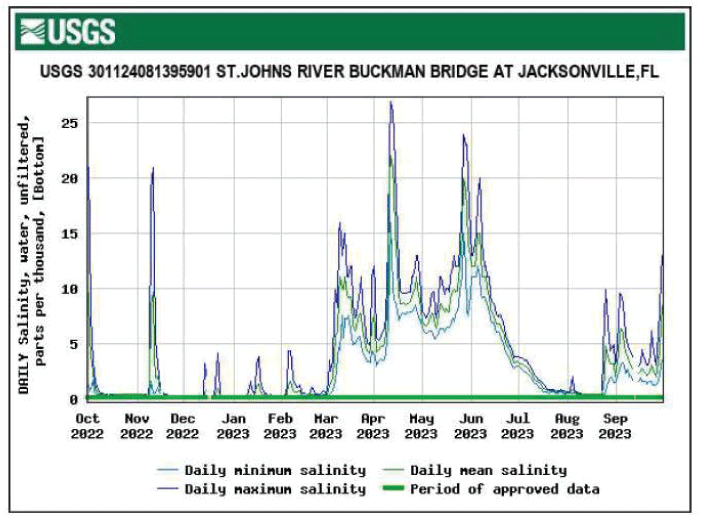
St. Johns River above Buckman Bridge at Jacksonville, Florida.—Salinity on the St. Johns River above Buckman Bridge at Jacksonville, Fla. (USGS site number 301057081414800, map number 6) ranged from 0.2 to 24 ppt during the 2023 water year, with a median of 1.2 ppt and mean of 3.1 ppt (figs. 22 and 23). There were 22 days of missing salinity data in October, 5 days of missing salinity in November, 20 days of missing salinity data in June, and 5 days of missing salinity data in July, all caused by equipment malfunctions and (or) fouling on the meter. Daily maximum salinity peaked above 24 ppt in May, which is the highest value computed over the 6 years of the study. The median salinity was second highest and the mean salinity for 2023 ranked highest among those computed for the 6 years of data collection, although the 2018 record is incomplete because the monitoring site was installed that year (fig. 23).
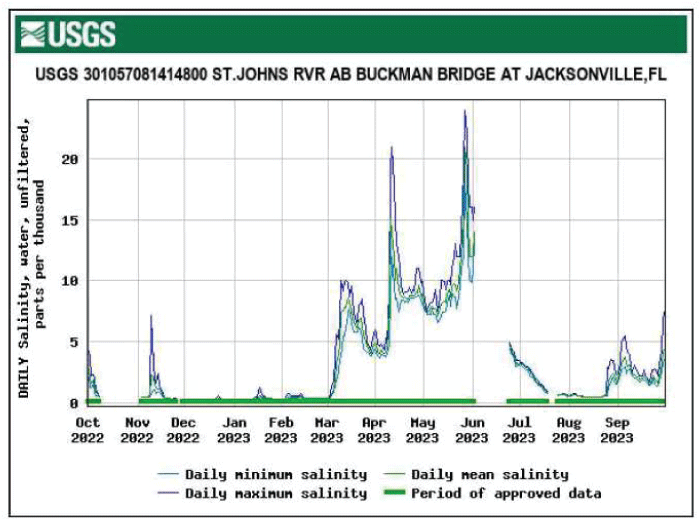
Daily maximum, minimum, and mean salinity for St. Johns River above Buckman Bridge at Jacksonville, Florida.
Salinity data for St. Johns River above Buckman Bridge at Jacksonville, Florida.
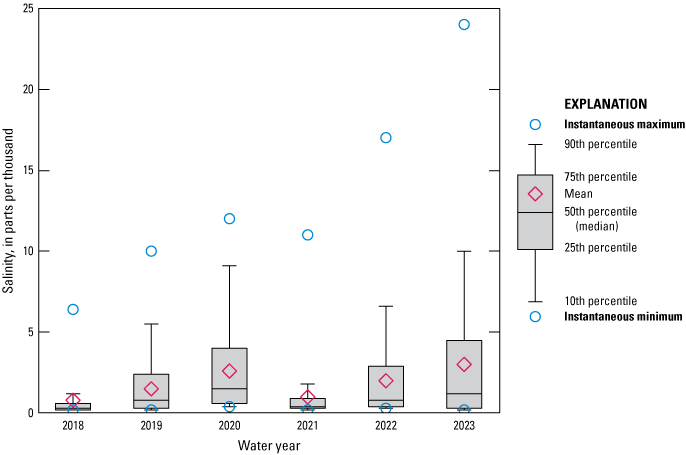
St. Johns River Buckman Bridge at Jacksonville, Florida.—Salinity on the St. Johns River Buckman Bridge at Jacksonville, Fla. (USGS site number 301124081395901, map number 5) ranged from 0.2 to 25 ppt for the top location during the 2023 water year, with a median of 1.0 ppt and mean of 3.1 ppt, and from 0.2 to 27 ppt for the bottom location, with a median of 1.3 ppt and mean of 3.7 ppt (figs. 24–27). The monitoring site did not record water-quality data at the top location for 1 day in November and 2 days in July or at the bottom location for 1 day in November, 2 days in December, 1 day in February, and 2 days in September because of equipment malfunctions. Salinity at both locations peaked in April. This was the highest maximum salinity at both locations for the 7 years of data collection at this site. The 2023 median salinity at the top location tied for fourth highest while the bottom location ranked third highest among those computed for the 7 years of data collection (figs. 26 and 27). The mean salinity at the top and bottom locations were the second highest among those computed for the 7 years of data collection (figs. 26 and 27).
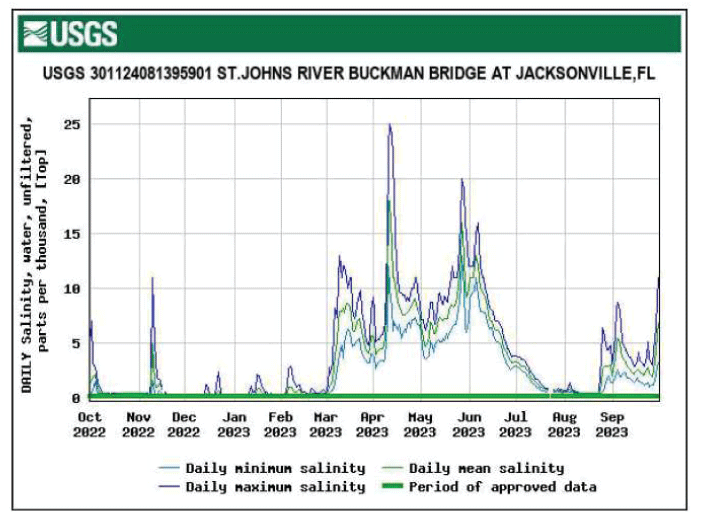
Daily maximum, minimum, and mean salinity for top location of St. Johns River Buckman Bridge at Jacksonville, Florida.
Daily maximum, minimum, and mean salinity for bottom location of St. Johns River Buckman Bridge at Jacksonville, Florida.
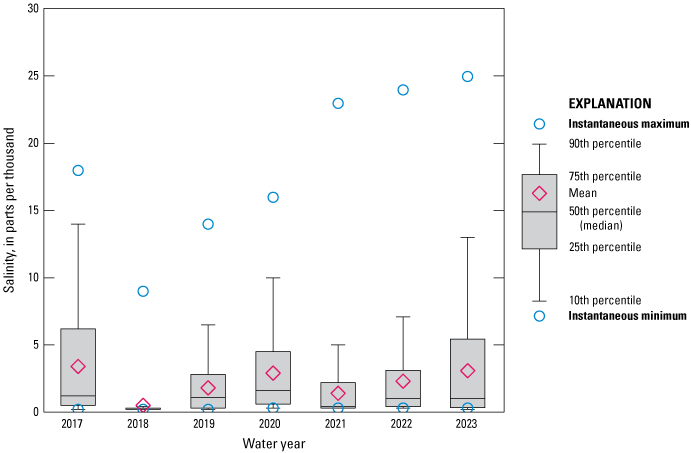
Salinity data for top location of St. Johns River Buckman Bridge at Jacksonville, Florida.
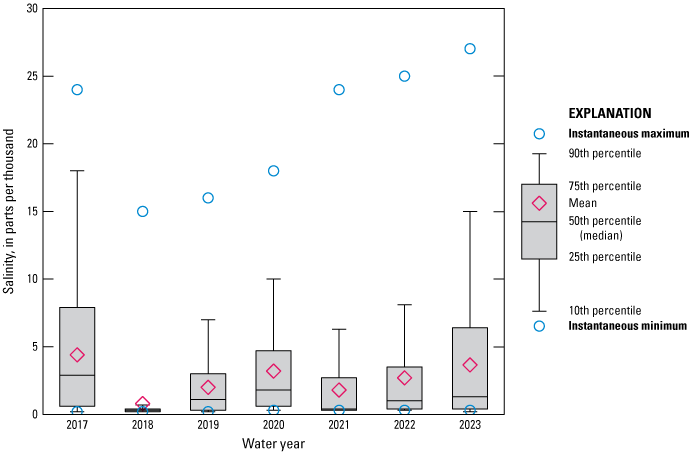
Salinity data for bottom location of St. Johns River Buckman Bridge at Jacksonville, Florida.
St. Johns River at Christopher Point near Jacksonville, Florida.—Salinity at St. Johns River at Christopher Point near Jacksonville, Fla. (USGS site number 301510081383500, map number 4) ranged from 0.2 to 30 ppt during the 2023 water year, with a median of 3.2 ppt and mean of 4.6 ppt (figs. 28 and 29). The monitoring site did not record water-quality data for 5 days in December and 1 day in May because of equipment malfunctions. The 2023 maximum salinity was the highest among those computed for the 8 years of data collection, while the mean salinity ranked second highest and median salinity ranked third highest (fig. 29).
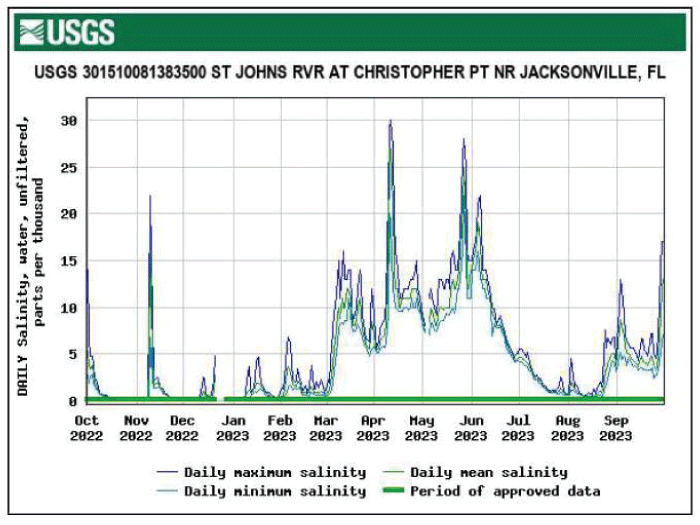
Daily maximum, minimum, and mean salinity for St. Johns River at Christopher Point near Jacksonville, Florida.
Salinity data for St. Johns River at Christopher Point near Jacksonville, Florida.
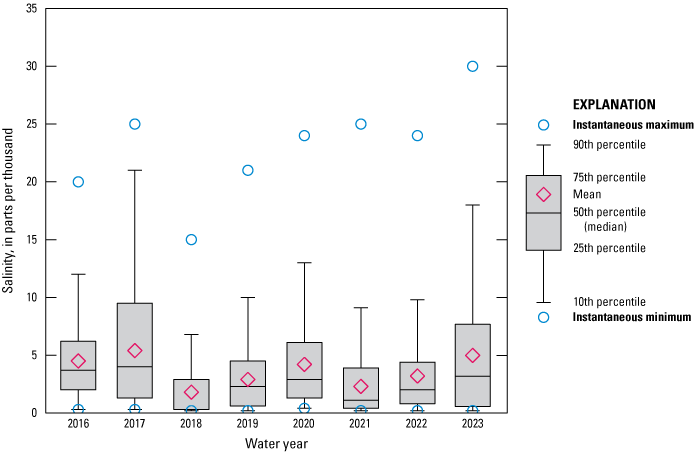
St. Johns River below Marco Lake at Jacksonville, Florida.—Salinity at St. Johns River below Marco Lake at Jacksonville, Fla. (USGS site number 301817081393600, map number 3) ranged from 0.2 to 32 ppt during the 2023 water year, with a median of 4.9 ppt and mean of 6.9 ppt (figs. 30 and 31). Salinity was not computed for 2 days in November, 2 days in May, 5 days in June, 6 days in August, and 7 days in September because of equipment malfunctions. The maximum salinity was tied with 2017 for the highest salinity recorded for the 8 years of data collection. The 2023 median and mean salinity ranked fourth highest among those computed for the 8 years of data collection (fig. 31).
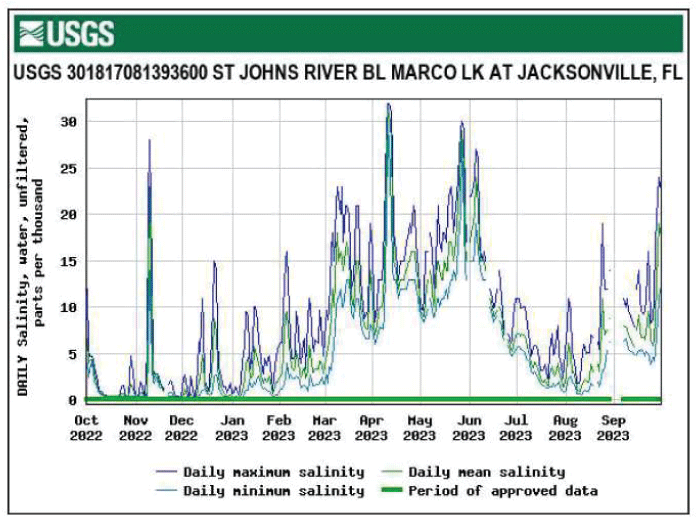
Daily maximum, minimum, and mean salinity for St. Johns River below Marco Lake at Jacksonville, Florida.
Salinity data for St. Johns River below Marco Lake at Jacksonville, Florida.
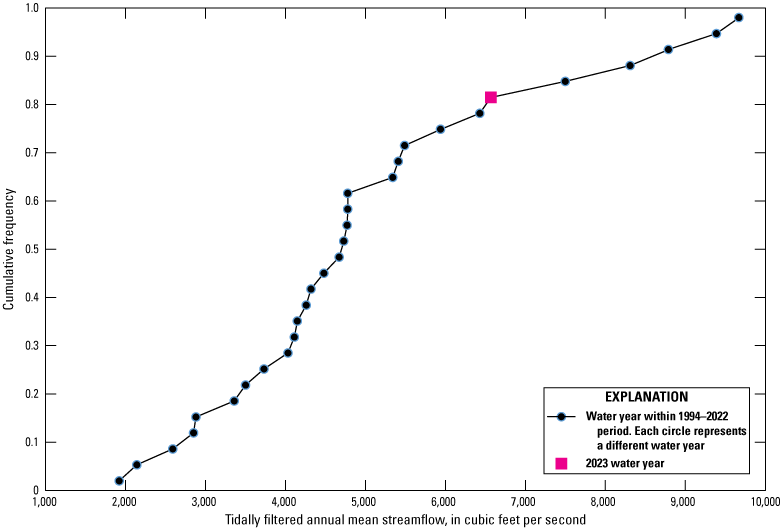
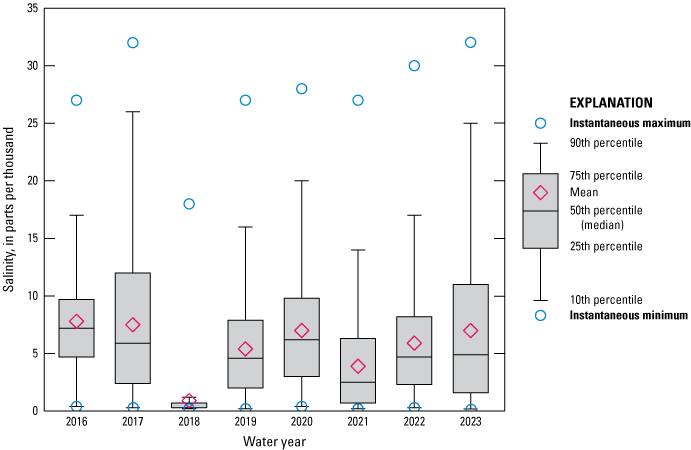
St. Johns River at Jacksonville, Florida.—Daily tidally filtered discharge at St. Johns River at Jacksonville, Fla. (USGS site number 02246500, map number 2) ranged from −60,900 to 82,200 ft3/s during the 2023 water year, with an annual mean of 7,540 ft3/s (figs. 32 and 33). Discharge data were estimated for 1 day in November and not computed for 7 days in November, 12 days in March, 5 days in April, 14 days in July, and 9 days in August because of equipment malfunctions. Salinity ranged from 0.2 to 31 ppt over this same period, with a median of 7.0 ppt and mean of 8.2 ppt (figs. 34 and 35). Salinity was not computed for 3 days in October, 10 days in December, 10 days in January, 1 day in February, 2 days in March, 2 days in April, 2 days in May, 1 day in July, and 1 day in August because of equipment malfunctions. A comparison of historical annual mean tidally filtered flows indicated that the 2023 streamflow ranked in the 68th percentile for the 27 years of record (fig. 33); the median tidally filtered flow for the period of record was 5,830 ft3/s. Annual mean tidally filtered streamflow record was used from 1997 onward because of data collection gaps in the historical record prior to 1997. The 2023 median and mean salinity both ranked second highest among those computed for the 8 years of data collection (fig. 35).
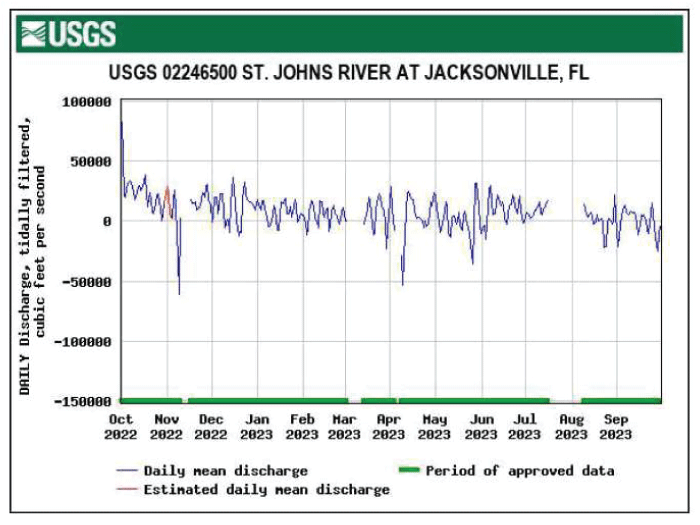
Daily mean tidally filtered discharge for St. Johns River at Jacksonville, Florida.
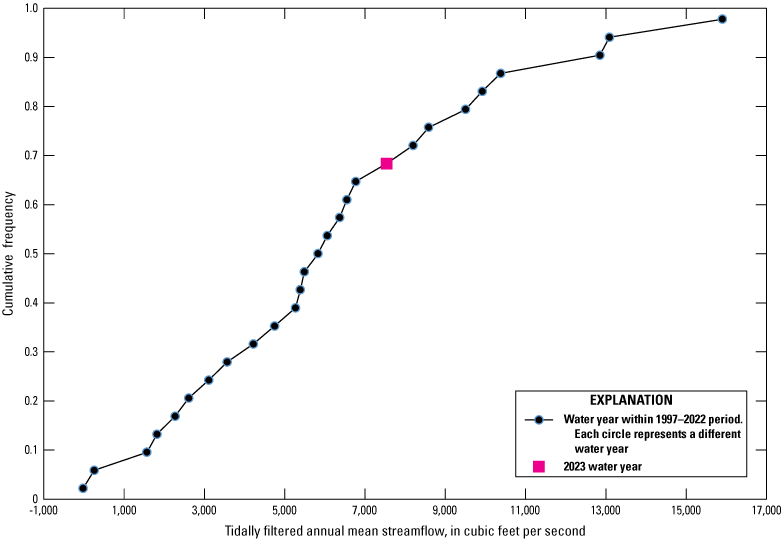
Annual mean tidally filtered streamflow data for St. Johns River at Jacksonville, Florida.
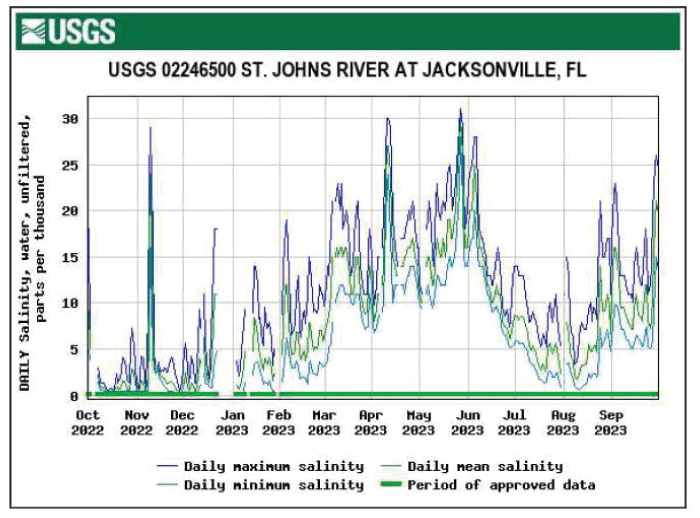
Daily maximum, minimum, and mean salinity for St. Johns River at Jacksonville, Florida.
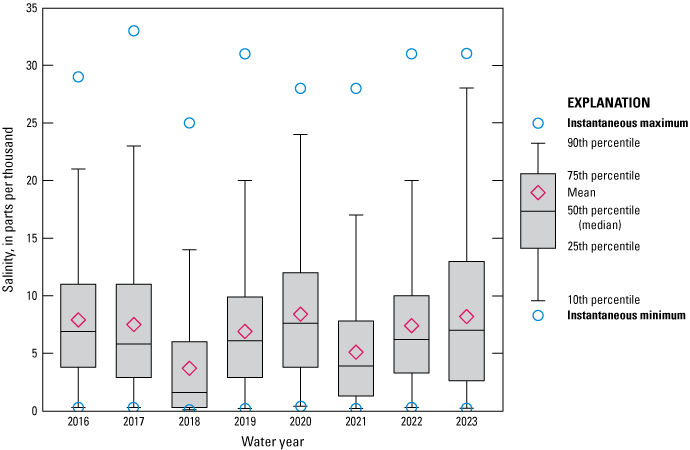
Salinity data for St. Johns River at Jacksonville, Florida.
St. Johns River Dames Point Bridge at Jacksonville, Florida.—Salinity on the St. Johns River Dames Point Bridge at Jacksonville, Fla. (USGS site number 302309081333001, map number 1) ranged from 2.8 to 37 ppt for the top location during the 2023 water year, with a median of 23 ppt and mean of 22 ppt, and from 4 to 34 ppt for the bottom location, with a median of 24 ppt and mean of 23 ppt (figs. 36–39). Salinity at the bottom location was not computed for 4 days in April because of an equipment malfunction. Salinity during the year was generally lower at the top location relative to the bottom and fluctuated weekly at both locations because of upstream conditions. At both locations, the 2023 median salinity tied for highest, and the mean salinity ranked third highest, among those calculated for the 7 years of data collection (figs. 38 and 39). The top location had the highest salinity for the 7 years of data collection (fig. 38).
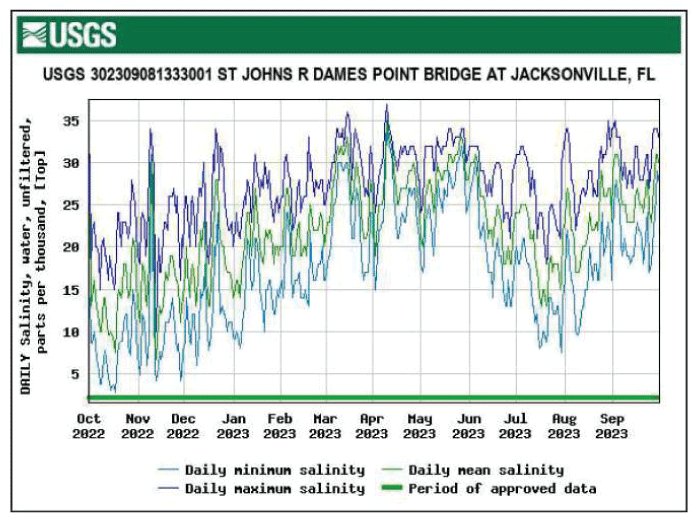
Daily maximum, minimum, and mean salinity for top location of St. Johns River Dames Point Bridge at Jacksonville, Florida.
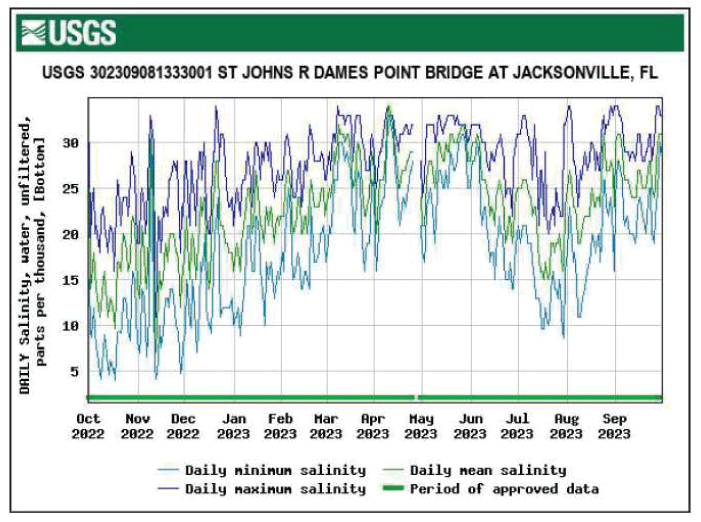
Daily maximum, minimum, and mean salinity for bottom location of St. Johns River Dames Point Bridge at Jacksonville, Florida.
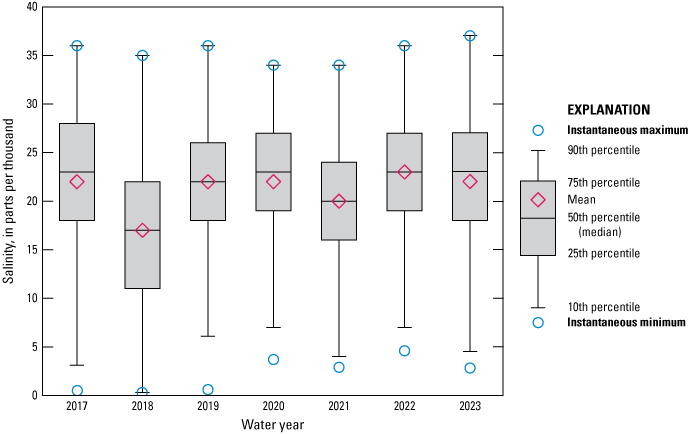
Salinity data for top location of St. Johns River at Dames Point Bridge at Jacksonville, Florida.
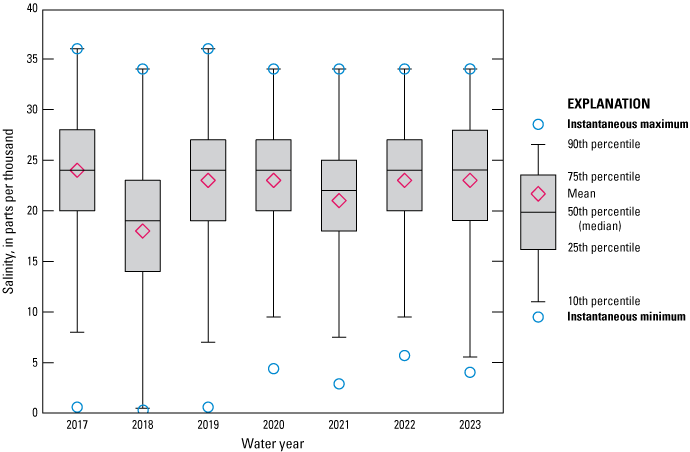
Salinity data for bottom location of St. Johns River at Dames Point Bridge at Jacksonville, Florida.
Tributary Sites
The parameters measured on the tributaries of the St. Johns River are mainly affected by rainfall and at most sites by tidal fluctuations. Heavy rainfall typically increases discharge and decreases salinity, and the tidal influence introduces more daily fluctuation at tidal sites than at nontidal sites. Like the main stem, tributaries of the St. Johns River are also affected by strong easterly winds. Because of their distance from the ocean, tributary sites and main-stem sites farther upstream require prolonged or extremely strong winds, such as those from a hurricane, to experience increased salinity.
Julington Creek at Old St. Augustine Road near Bayard, Florida.—Daily tidally filtered discharge at Julington Creek at Old St. Augustine Road near Bayard, Fla. (USGS site number 02246160, map number 25) ranged from −60.0 to 376 ft3/s during the 2023 water year (fig. 40), with an annual mean flow of 27.2 ft3/s. The lowest daily tidally filtered discharge in 2023 occurred in November just before Hurricane Nicole. This is the lowest discharge on record at this site. Discharge data were not calculated for 5 days in January and 10 days in February because of equipment malfunctions. Discharge was also estimated for 4 days in December.
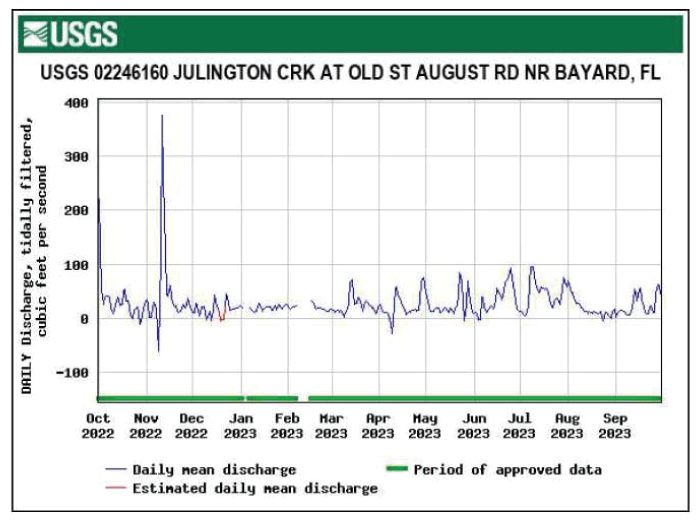
Daily mean tidally filtered discharge for Julington Creek at Old St. Augustine Road near Bayard, Florida.
Julington Creek at Hood Landing near Bayard, Florida.—Salinity at Julington Creek at Hood Landing near Bayard, Fla. (USGS site number 300803081354500, map number 24) ranged from 0.1 to 9.4 ppt during the 2023 water year, with a median of 0.2 ppt and mean of 1.1 ppt (figs. 41 and 42). The maximum salinity for the 2023 water year was the highest among those computed for the 8 years of data collection so far. The 2023 median tied for second highest and the mean salinity was the highest among those computed for the 8 years of data collection (fig. 42).
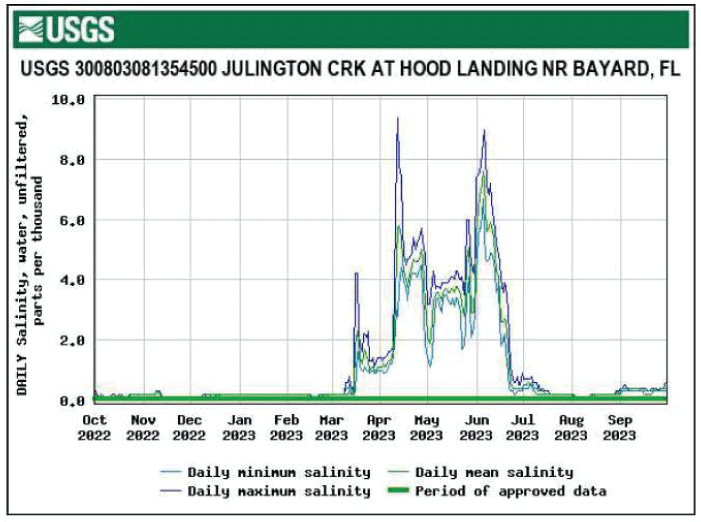
Daily maximum, minimum, and mean salinity for Julington Creek at Hood Landing near Bayard, Florida.
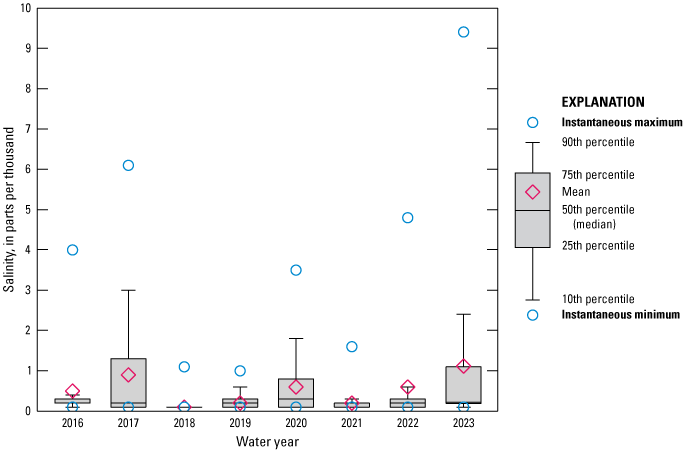
Salinity data for Julington Creek at Hood Landing near Bayard, Florida.
Durbin Creek near Fruit Cove, Florida.—Daily tidally filtered discharge at Durbin Creek near Fruit Cove, Fla. (USGS site number 022462002, map number 26) ranged from −107 to 367 ft3/s during the 2023 water year, with an annual mean of 46.5 ft3/s (fig. 43). The lowest daily tidally filtered discharge in 2023 was the lowest on record at this site and occurred in November just before Hurricane Nicole. Salinity ranged from 0.1 to 5.0 ppt, with a median of 0.1 ppt and mean of 0.2 ppt (figs. 44 and 45). The boxplot for Durbin Creek near Fruit Cove, Fla. (USGS site number 022462002, map number 26) salinity data in 2023 shows the same median for all 8 years of data collection, while the maximum salinity was the highest (fig. 45). The boxplot includes no whiskers because of the low and steady salinities of freshwater flows through the creek. Salinity is missing for 1 day in July and 2 days in August because of equipment malfunctions.
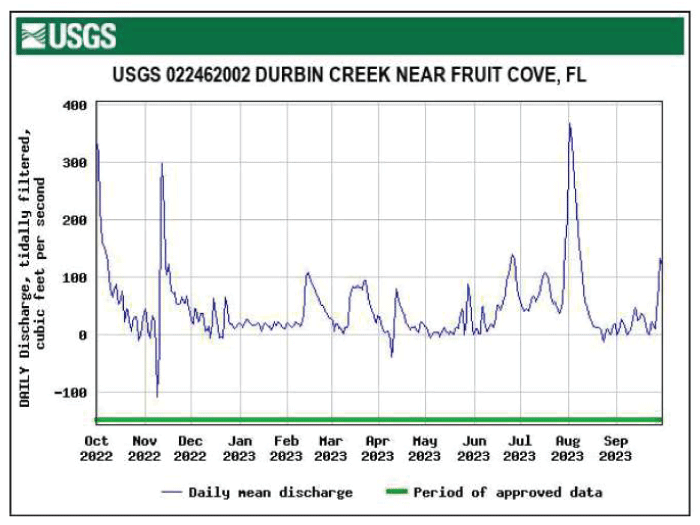
Daily mean tidally filtered discharge for Durbin Creek near Fruit Cove, Florida.
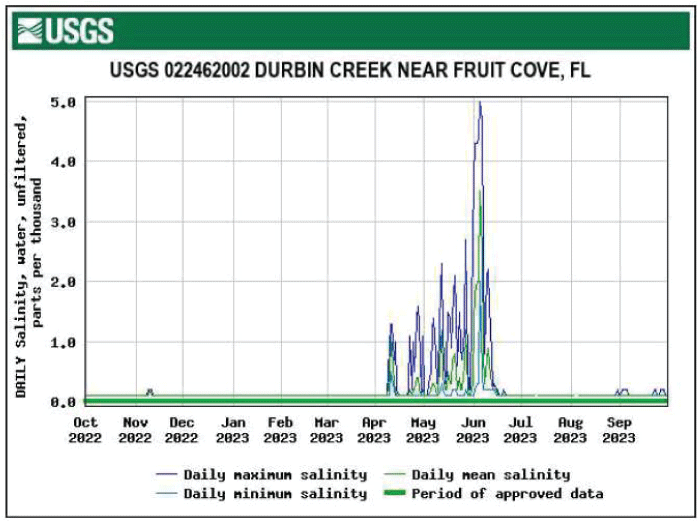
Daily maximum, minimum, and mean salinity for Durbin Creek near Fruit Cove, Florida.
Salinity data for Durbin Creek near Fruit Cove, Florida.
Ortega River at Kirwin Road near Jacksonville, Florida.—Discharge for Ortega River at Kirwin Road near Jacksonville, Fla. (USGS site number 02246318, map number 23) ranged from 5.35 to 185 ft3/s during the 2023 water year, with an annual mean of 27.9 ft3/s (figs. 46 and 47). The largest discharge peak at Ortega River at Kirwin Road near Jacksonville, Fla. (USGS site number 02246318, map number 23) in the 2023 water year occurred in September. The peak streamflow for the period of record ranked in the 10th percentile for the 16 years of record (fig. 47). The peak streamflow record does not include 2016, which has an incomplete record because the monitoring site was installed that year.
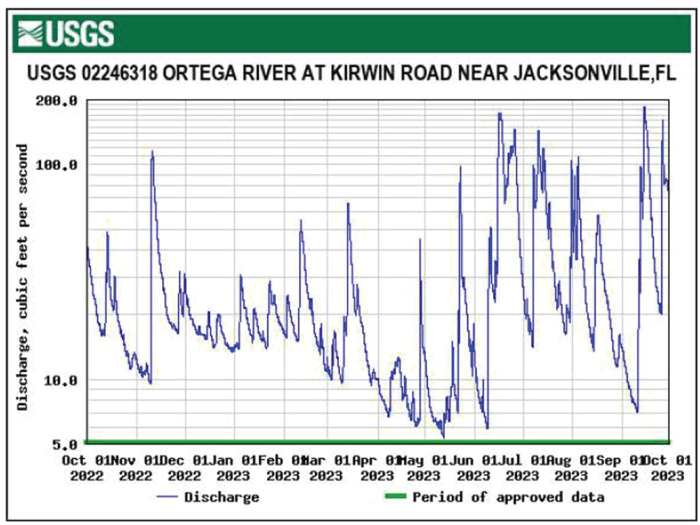
Instantaneous discharge for Ortega River at Kirwin Road near Jacksonville, Florida.
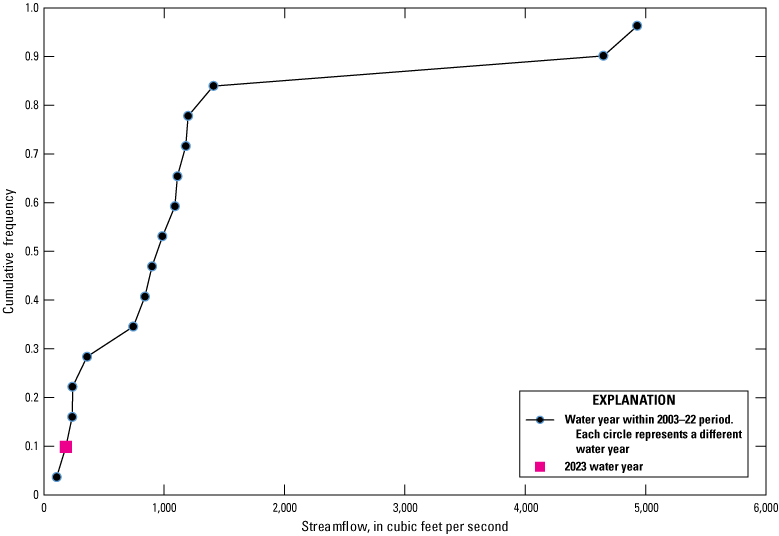
Peak streamflow at Ortega River at Kirwin Road near Jacksonville, Florida.
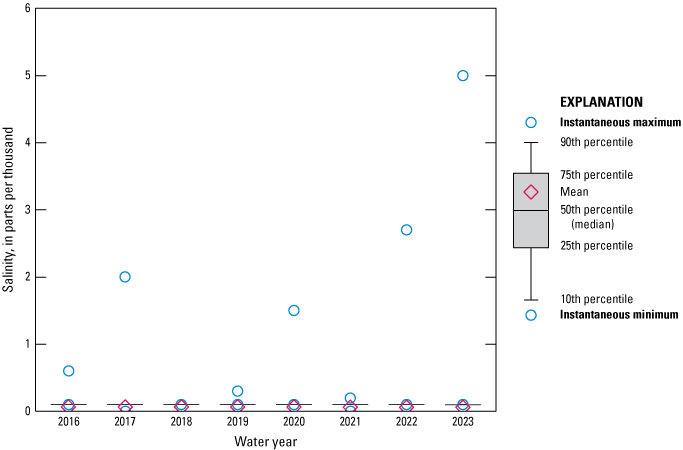
Ortega River salinity at Jacksonville, Florida.—Salinity at the Ortega River salinity at Jacksonville, Fla. site (USGS site number 301204081434900, map number 22) ranged from 0.1 to 20 ppt during the 2023 water year, with a median of 0.2 ppt and mean of 1.3 ppt (figs. 48 and 49). Salinity was not computed for 2 days in February and 4 days in May because of equipment malfunctions. The 2023 maximum salinity and median salinity ranked highest among those calculated for the 8 years of data collection and the mean salinity tied for highest (fig. 49).
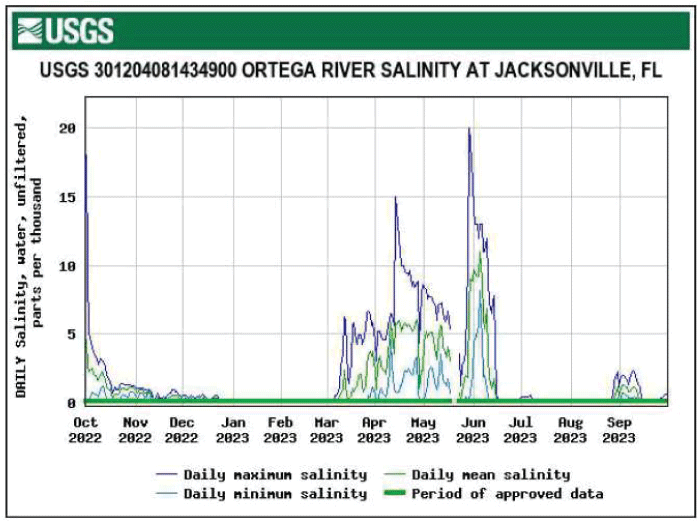
Daily maximum, minimum, and mean salinity for Ortega River salinity at Jacksonville, Florida.
Salinity data for the Ortega River salinity at Jacksonville, Florida site.
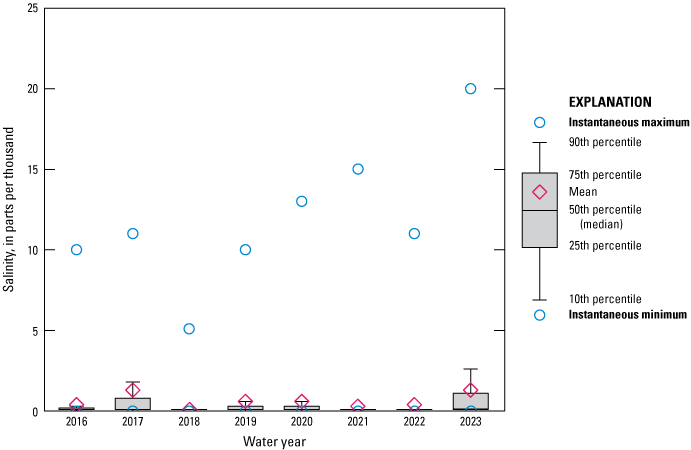
Cedar River at San Juan Avenue at Jacksonville, Florida.—Daily tidally filtered discharge at Cedar River at San Juan Avenue at Jacksonville, Fla. (USGS site number 02246459, map number 21) ranged from −32.9 to 239 ft3/s during the 2023 water year, with an annual mean of 36.5 ft3/s (figs. 50 and 51). Discharge was not computed for 5 days in October and 10 days in May because of equipment malfunctions. Salinity ranged from 0.1 to 23 ppt, with a median of 0.9 ppt and mean of 3.2 ppt (figs. 52 and 53). Salinity was not computed for 5 days in October, 1 day in November, 6 days in December, 21 days in February, 31 days in March, 11 days in April, 1 day in May, and 1 day in August because of equipment malfunctions. The peak discharge for the 2023 water year occurred in June because of above-average rainfall in Duval County (fig. 3). The 2023 annual mean discharge of 36.5 ft3/s ranked in the 62d percentile (fig. 51). The 2023 median salinity ranked fourth highest among those computed for the 8 years of data collection, and the mean and maximum salinity tied for highest (fig. 53).
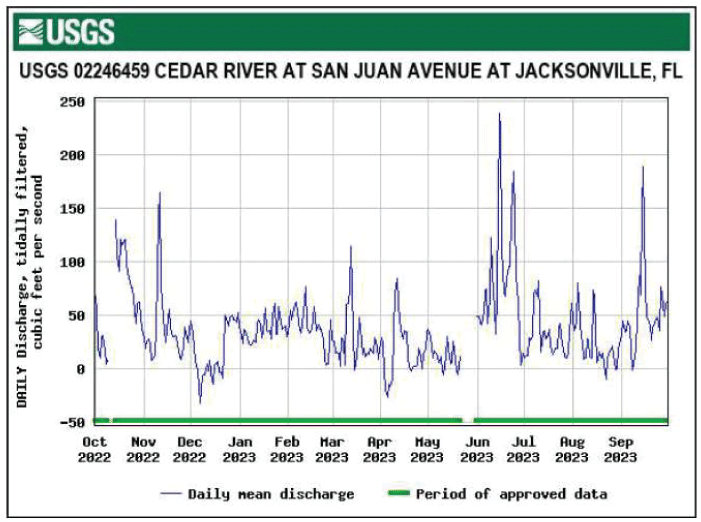
Daily mean tidally filtered discharge for Cedar River at San Juan Avenue at Jacksonville, Florida.
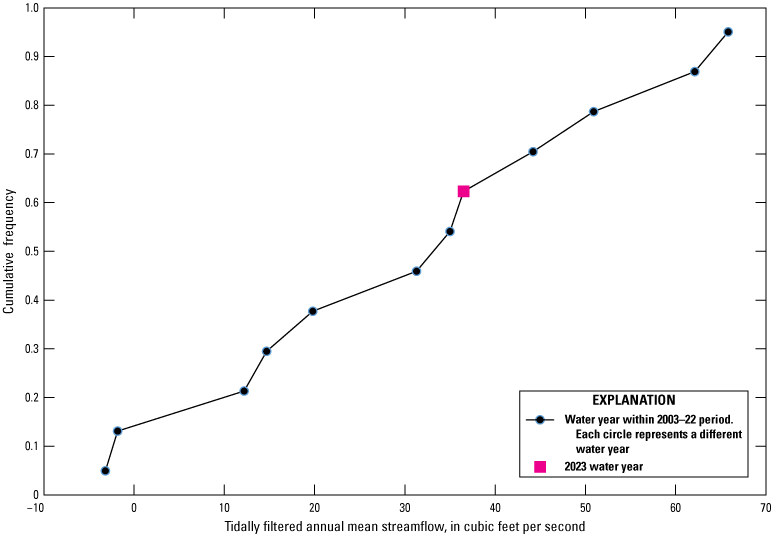
Annual mean tidally filtered streamflow data for Cedar River at San Juan Avenue at Jacksonville, Florida.
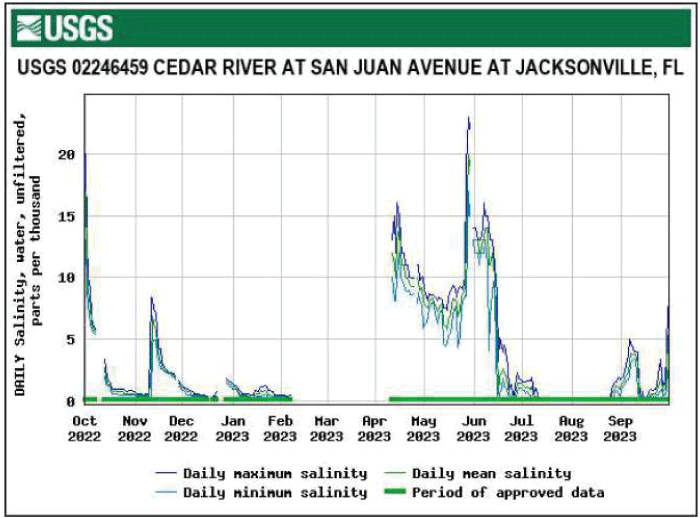
Daily maximum, minimum, and mean salinity for Cedar River at San Juan Avenue at Jacksonville, Florida.
Salinity data for Cedar River at San Juan Avenue at Jacksonville, Florida.
Pottsburg Creek near South Jacksonville, Florida.—Discharge for Pottsburg Creek near South Jacksonville, Fla. (USGS site number 02246515, map number 20) ranged from 1.36 to 230 ft3/s during the 2023 water year, with an annual mean flow of 14.6 ft3/s (figs. 54 and 55). Similar to Cedar River at San Juan Avenue at Jacksonville, Fla. (USGS site number 02246459, map number 21), the highest discharge during the 2023 water year was in June when Duval County had above-average rainfall (fig. 3). The peak streamflow for the 2023 water year was 230 ft3/s and ranked in the 20th percentile for the 13 years of record (fig. 55).
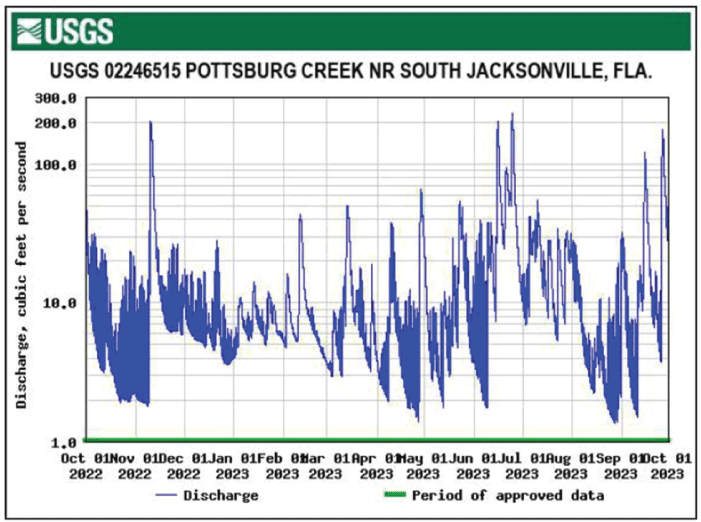
Instantaneous discharge for Pottsburg Creek near South Jacksonville, Florida.
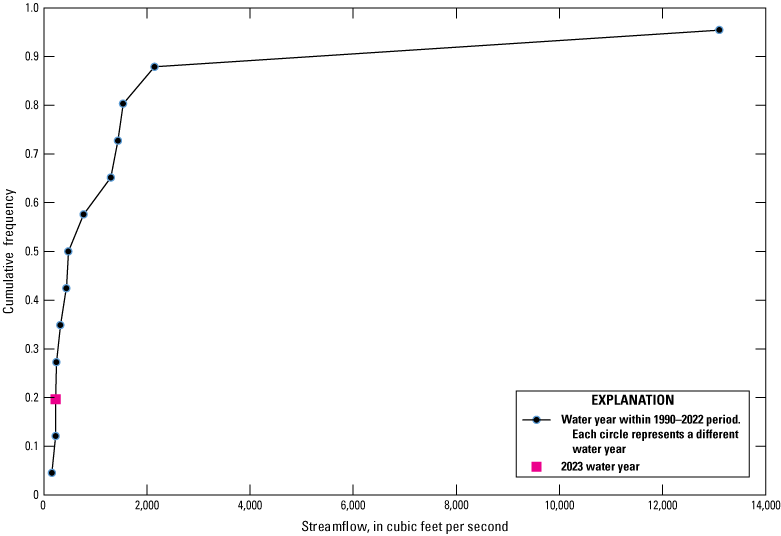
Peak streamflow at Pottsburg Creek near South Jacksonville, Florida.
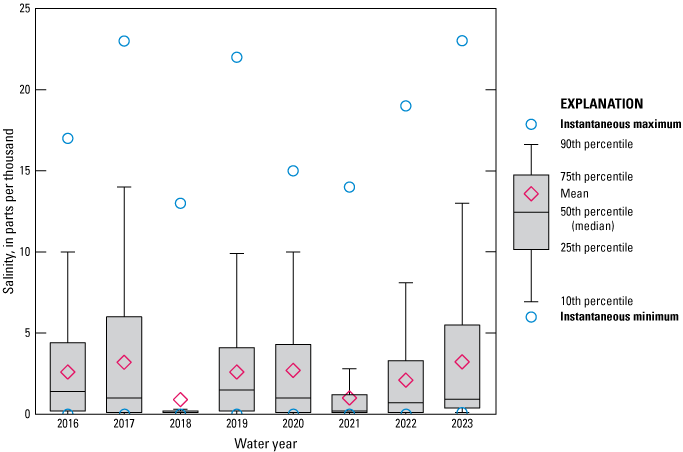
Pottsburg Creek at U.S. 90 near South Jacksonville, Florida.—Daily tidally filtered discharge at Pottsburg Creek at U.S. 90 near South Jacksonville, Fla. (USGS site number 02246518, map number 19) ranged from −13.5 to 214 ft3/s during the 2023 water year, with an annual mean flow of 22.7 ft3/s (fig. 56). The daily discharge peaked at over 200 ft3/s in June when above-average rainfall occurred in Duval County (fig. 3). Discharge was not computed for 5 days in October because of an equipment malfunction. Salinity ranged from 0.1 to 15 ppt, with a median of 0.8 ppt and mean of 2.0 ppt (figs. 57 and 58). The 2023 median and mean were the highest computed for the 8 years of recorded data (fig. 58). Salinity data were not computed for 3 days in September because of equipment malfunctions.
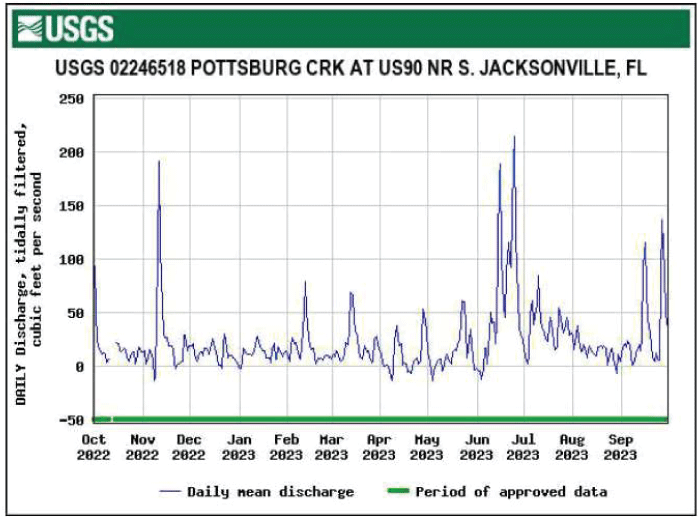
Daily mean tidally filtered discharge for Pottsburg Creek at U.S. 90 near South Jacksonville, Florida.
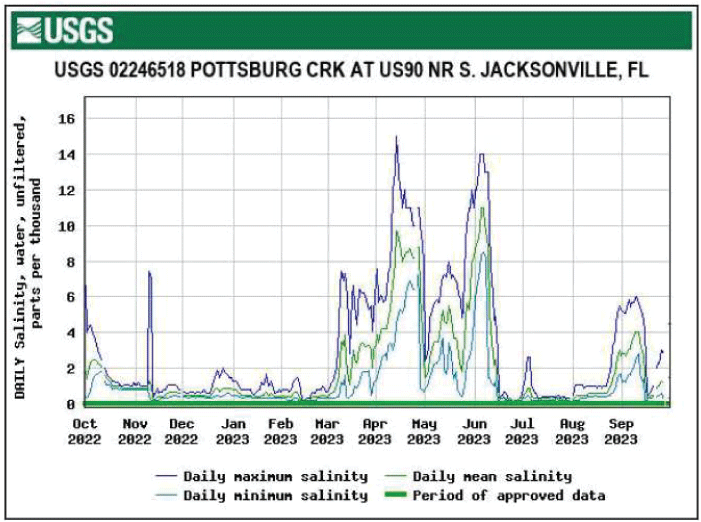
Daily maximum, minimum, and mean salinity for Pottsburg Creek at U.S. 90 near South Jacksonville, Florida.
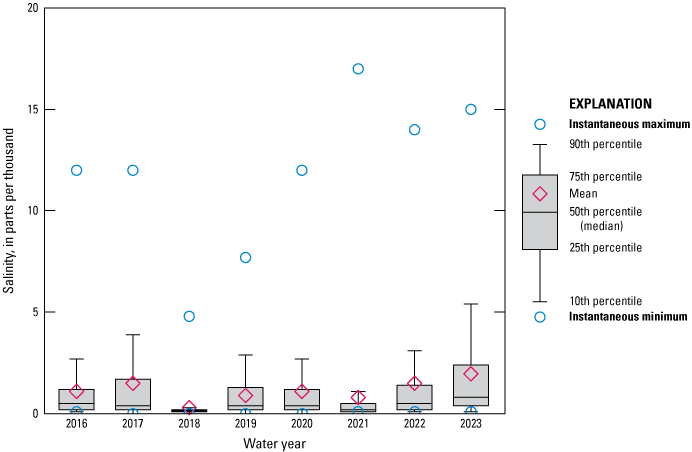
Salinity data for Pottsburg Creek at U.S. 90 near South Jacksonville, Florida.
Trout River near Jacksonville, Florida.—Daily tidally filtered discharge at Trout River near Jacksonville, Fla. (USGS site number 02246621, map number 18) ranged from −236 to 860 ft3/s during the 2023 water year, with an annual mean flow of 56.5 ft3/s (fig. 59). The daily discharge peaked at over 800 ft3/s in November when above-average rainfall occurred in Duval County (fig. 3).
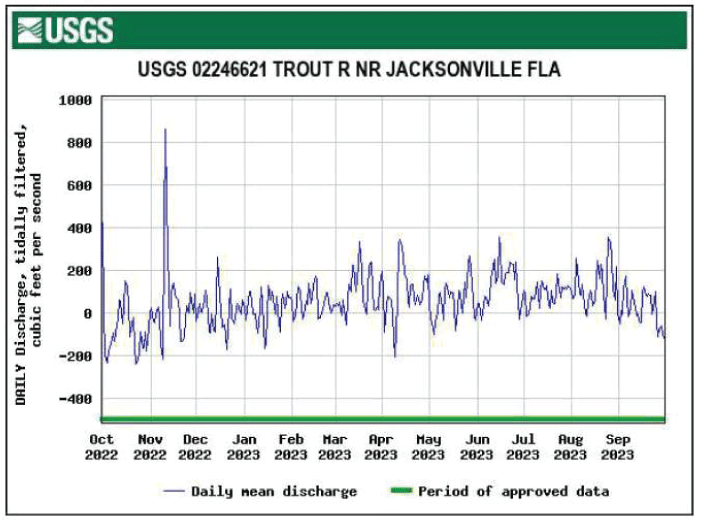
Daily mean tidally filtered discharge for Trout River near Jacksonville, Florida.
Trout River below U.S. 1 at Dinsmore, Florida.—Salinity at Trout River below U.S. 1 at Dinsmore, Fla. (USGS site number 302609081453300, map number 17) ranged from 0.0 to 22 ppt during the 2023 water year, with a median of 2.5 ppt and mean of 3.8 ppt (figs. 60 and 61). Daily maximum salinity values peaked above 12 ppt from early May to mid-June (fig. 60). The 2023 maximum salinity was the highest, and the median and mean salinities both ranked second highest among those calculated for the 8 years of data collection (fig. 61). Salinity was not computed for 2 days in November because of an equipment malfunction.
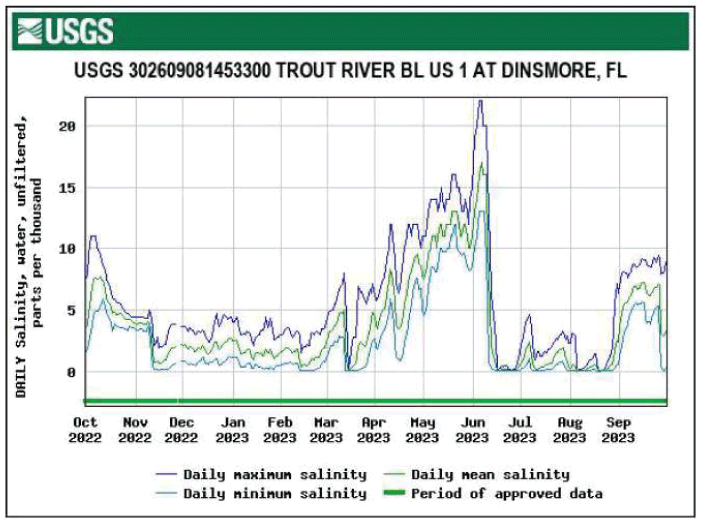
Daily maximum, minimum, and mean salinity for Trout River below U.S. 1 at Dinsmore, Florida.
Salinity data for Trout River below U.S. 1 at Dinsmore, Florida.
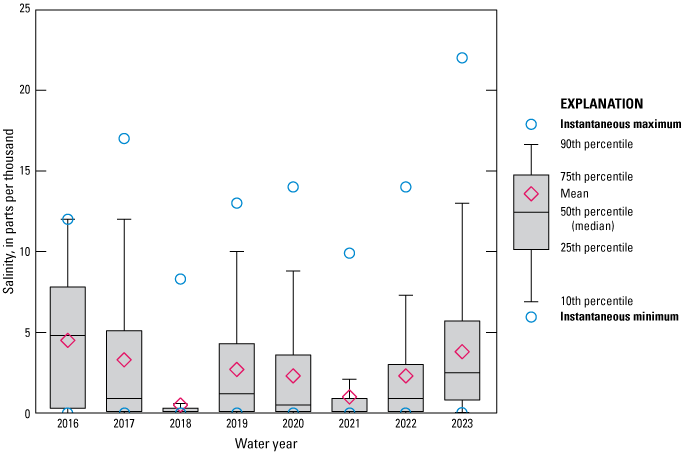
Broward River below Biscayne Blvd. near Jacksonville, Florida.—Daily tidally filtered discharge at Broward River below Biscayne Boulevard near Jacksonville, Fla. (USGS site number 02246751, map number 16) ranged from −37.3 to 143 ft3/s during the 2023 water year (fig. 62), with an annual mean flow of 4.31 ft3/s. Daily tidally filtered discharge was not calculated for 9 days in May, 24 days in June, and 6 days in September because of equipment malfunctions. Discharge was relatively consistent during the period, with a peak in July. Salinity ranged from 0.0 to 20 ppt, with a median of 1.7 ppt and mean of 2.5 ppt (figs. 63 and 64). Peak salinity occurred in June and was the highest salinity recorded for the 8 years of data collection. The 2023 median and mean salinities ranked second highest among those calculated for the 8 years of data collection (fig. 64). Salinity data were not computed for 2 days in March and 1 day in April because of equipment malfunctions.
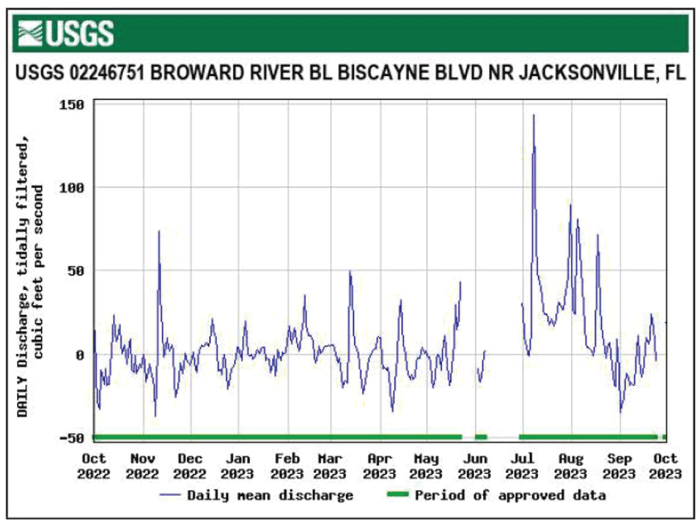
Daily mean tidally filtered discharge for Broward River below Biscayne Boulevard near Jacksonville, Florida.
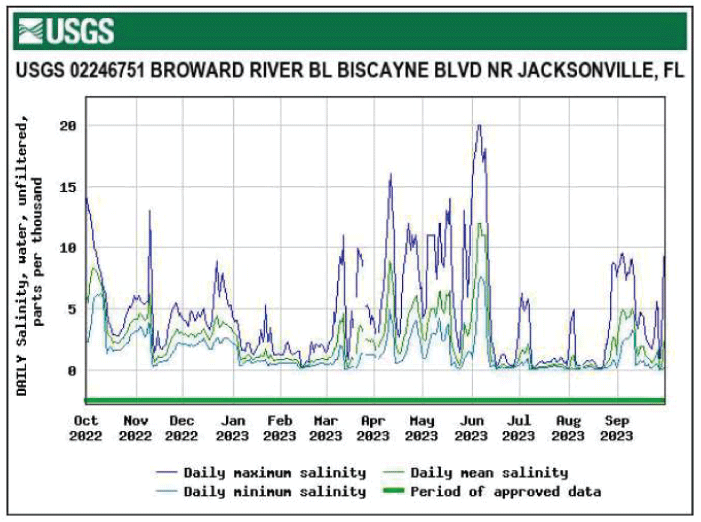
Daily maximum, minimum, and mean salinity for Broward River below Biscayne Boulevard near Jacksonville, Florida.
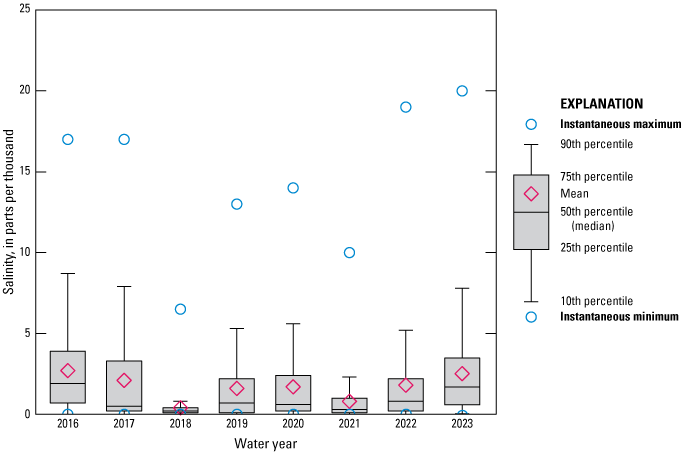
Salinity data for Broward River below Biscayne Boulevard near Jacksonville, Florida.
Dunn Creek at Dunn Creek Road near Eastport, Florida.—Daily tidally filtered discharge at Dunn Creek at Dunn Creek Road near Eastport, Fla. (USGS site number 02246804, map number 15) ranged from −37.7 to 107 ft3/s during the 2023 water year (fig. 65), with an annual mean of 12.8 ft3/s. Daily tidally filtered discharge was not calculated for 5 days in December, 4 days in January, and 7 days in April because of equipment malfunctions. Salinity during the 2023 water year ranged from 0.1 to 22 ppt, with a median of 3.0 ppt and mean of 3.7 ppt (figs. 66 and 67). The 2023 maximum, median, and mean salinities ranked highest among those calculated for the 8 years of data collection (fig. 67).
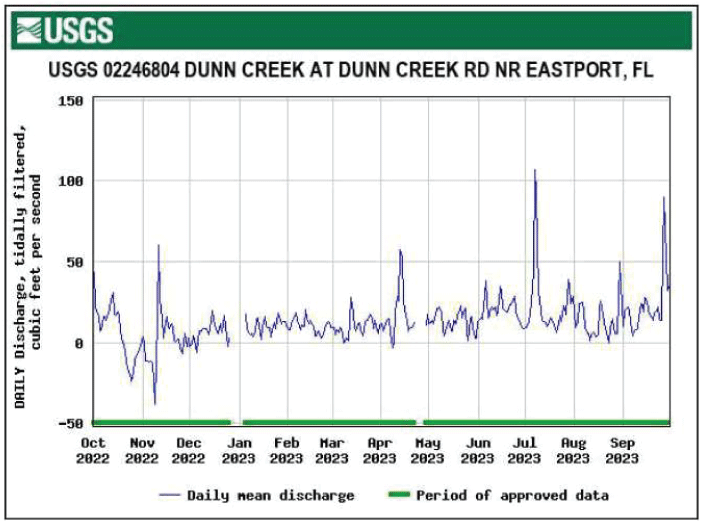
Daily mean tidally filtered discharge for Dunn Creek at Dunn Creek Road near Eastport, Florida.
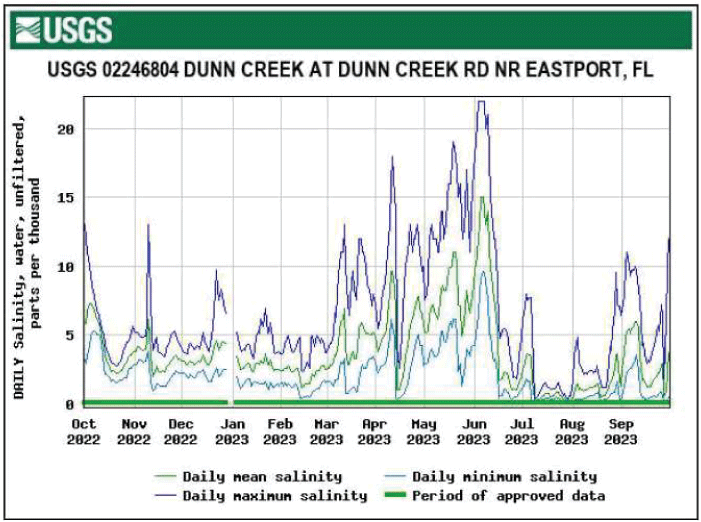
Daily maximum, minimum, and mean salinity for Dunn Creek at Dunn Creek Road near Eastport, Florida.
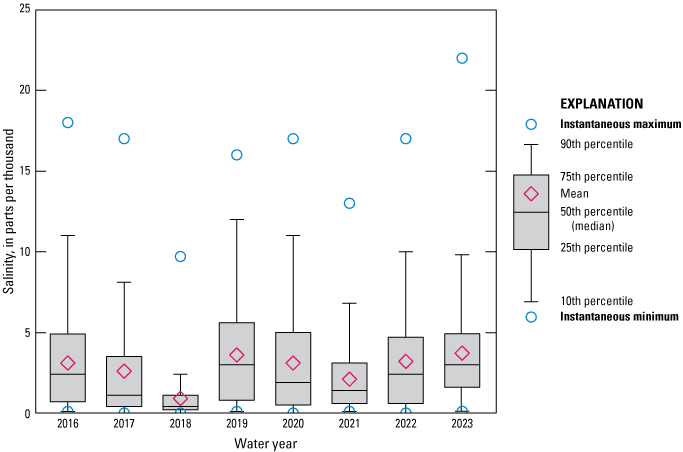
Salinity data for Dunn Creek at Dunn Creek Road near Eastport, Florida.
Clapboard Creek near Jacksonville, Florida.—Daily tidally filtered discharge at Clapboard Creek near Jacksonville, Fla. (USGS site number 02246825, map number 13) ranged from −80.6 to 252 ft3/s during the 2023 water year (fig. 68), with an annual mean flow of 72.7 ft3/s. The peak daily tidally filtered discharge of 252 ft3/s occurred in November just after Hurricane Nicole.
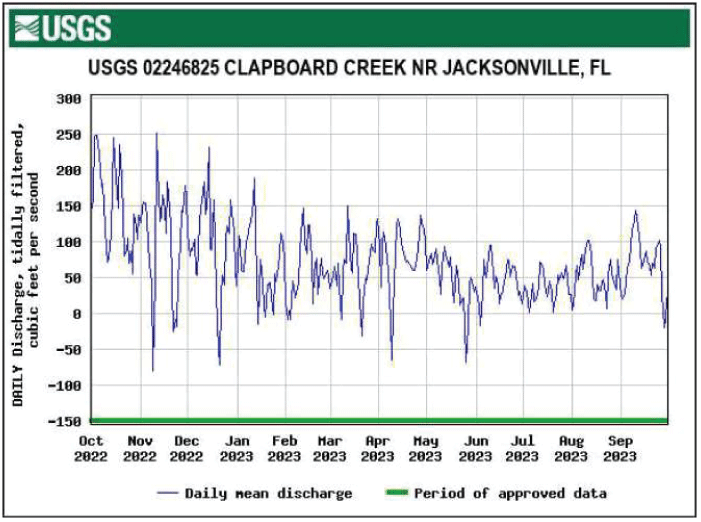
Daily mean tidally filtered discharge for Clapboard Creek near Jacksonville, Florida.
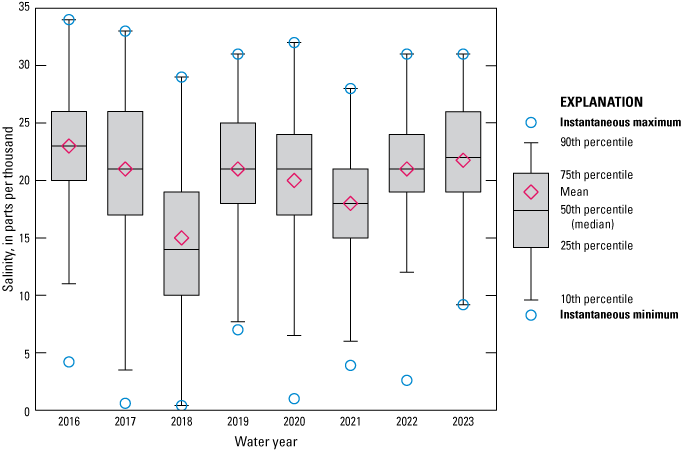
Clapboard Creek above Buckhorn Bluff near Jacksonville, Florida.—Salinity at Clapboard Creek above Buckhorn Bluff near Jacksonville, Fla. (USGS site number 302657081312400, map number 14) ranged from 9.2 to 31 ppt during the 2023 water year, with a median and mean of 22 ppt (figs. 69 and 70). Salinity was missing for 12 days in October, 15 days in November, 6 days in June, and 2 days in July because of equipment malfunctions. The 2023 median and mean salinities both ranked second highest among those calculated for the 8 years of data collection (fig. 70).
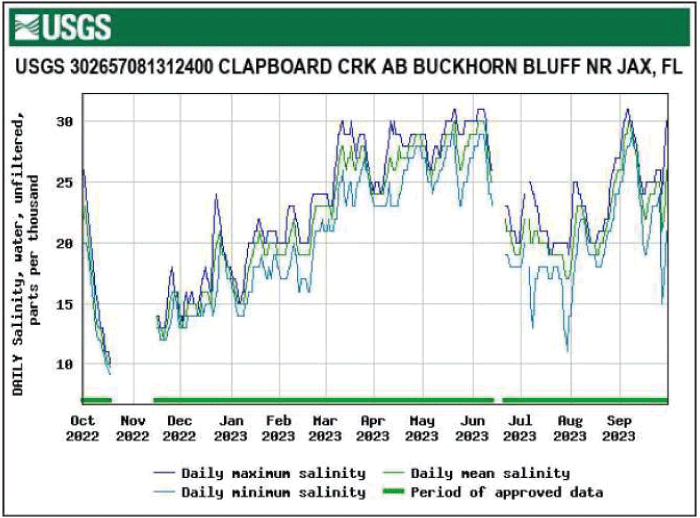
Daily maximum, minimum, and mean salinity for Clapboard Creek above Buckhorn Bluff near Jacksonville, Florida.
Salinity data for Clapboard Creek above Buckhorn Bluff near Jacksonville, Florida.
Discharge and Salinity Site Comparison
Analysis of the annual mean tidally filtered discharge for the 2023 water year along the main stem of the St. Johns River indicates that streamflow increased with distance downstream, as expected (fig. 71). Relative to the 2022 water year, annual mean discharge for the 2023 water year was higher at all main-stem sites. Over the 8 years considered for this study, the annual mean discharge for the 2023 water year at St. Johns River at Astor, Fla. (USGS site number 02236125, map number 12) and St. Johns River at Buffalo Bluff near Satsuma, Fla. (USGS site number 02244040, map number 11) ranked second highest for those sites, and mean annual discharge in 2023 at St. Johns River at Jacksonville, Fla. (USGS site number 02246500, map number 2) ranked third highest for that site. Among the tributaries compared to one another, annual mean discharge in 2023 was highest at Clapboard Creek near Jacksonville, Fla. (USGS site number 02246825, map number 13); followed by Trout River near Jacksonville, Fla. (USGS site number 02246621, map number 18); Durbin Creek near Fruit Cove, Fla. (USGS site number 022462002, map number 26); Cedar River at San Juan Avenue at Jacksonville, Fla. (USGS site number 02246459, map number 21); Ortega River at Kirwin Road near Jacksonville, Fla. (USGS site number 02246318, map number 23); Julington Creek at Old St. Augustine Road near Bayard, Fla. (USGS site number 02246160, map number 25); Pottsburg Creek at U.S. 90 near South Jacksonville, Fla. (USGS site number 02246518, map number 19); Pottsburg Creek near South Jacksonville, Fla. (USGS site number 02246515, map number 20); Dunn Creek at Dunn Creek Road near Eastport, Fla. (USGS site number 02246804, map number 15); and Broward River below Biscayne Boulevard near Jacksonville, Fla. (USGS site number 02246751, map number 16), whose annual mean was lowest (fig. 72). Annual mean discharge at 9 of the 10 tributary monitoring sites was lower for the 2023 water year than for the 2022 water year, with Durbin Creek near Fruit Cove, Fla. (USGS site number 022462002, map number 26) being the only site with a higher annual mean discharge in 2023 than 2022. Furthermore, the computed annual mean flow at Broward River below Biscayne Boulevard near Jacksonville, Fla. (USGS site number 02246751, map number 16) was the lowest recorded for the 8 years of data collection (fig. 72). The countywide annual rainfall for the 2023 water year was below the average yearly rainfall in four of the five counties. It was also lower in all five of the counties for the 2023 water year relative to the 2022 water year (fig. 73).
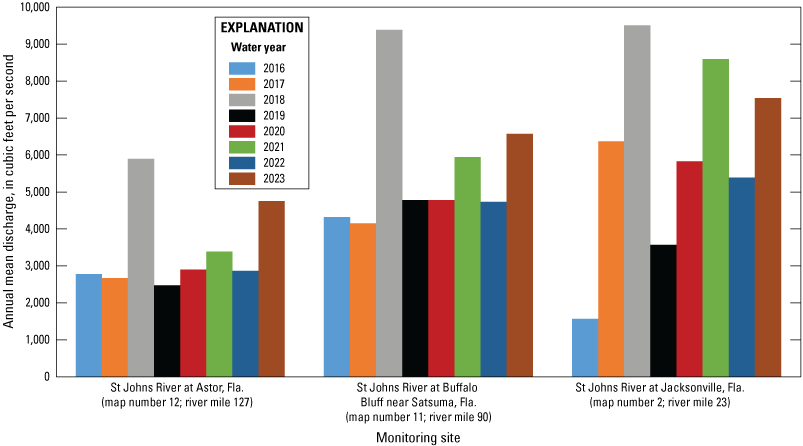
Annual mean tidally filtered discharge at St. Johns River main-stem monitoring sites.
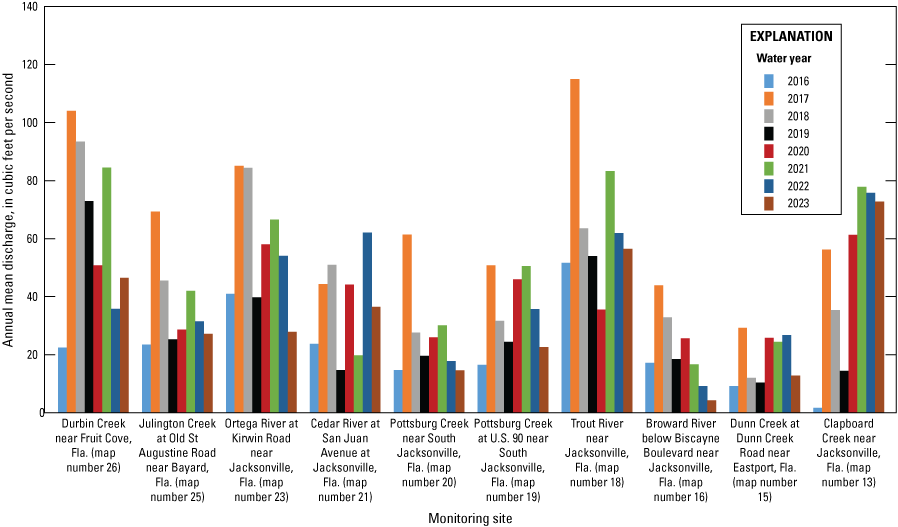
Annual mean discharge at St. Johns River tributary monitoring sites.
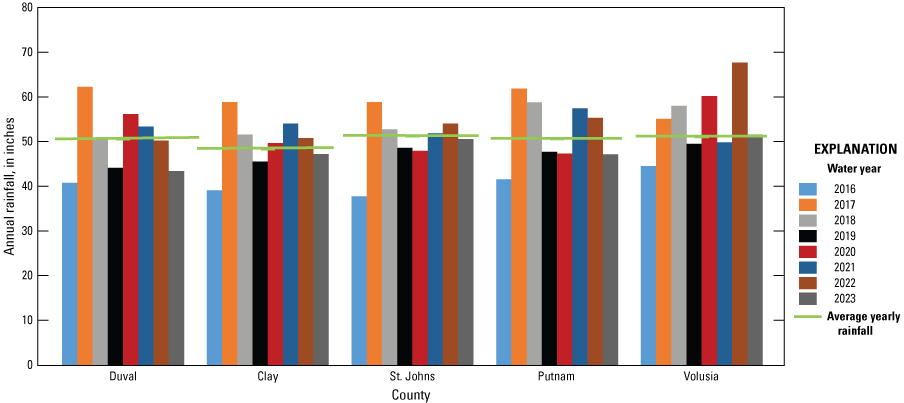
Annual rainfall for Duval, Clay, St. Johns, Putnam, and Volusia Counties.
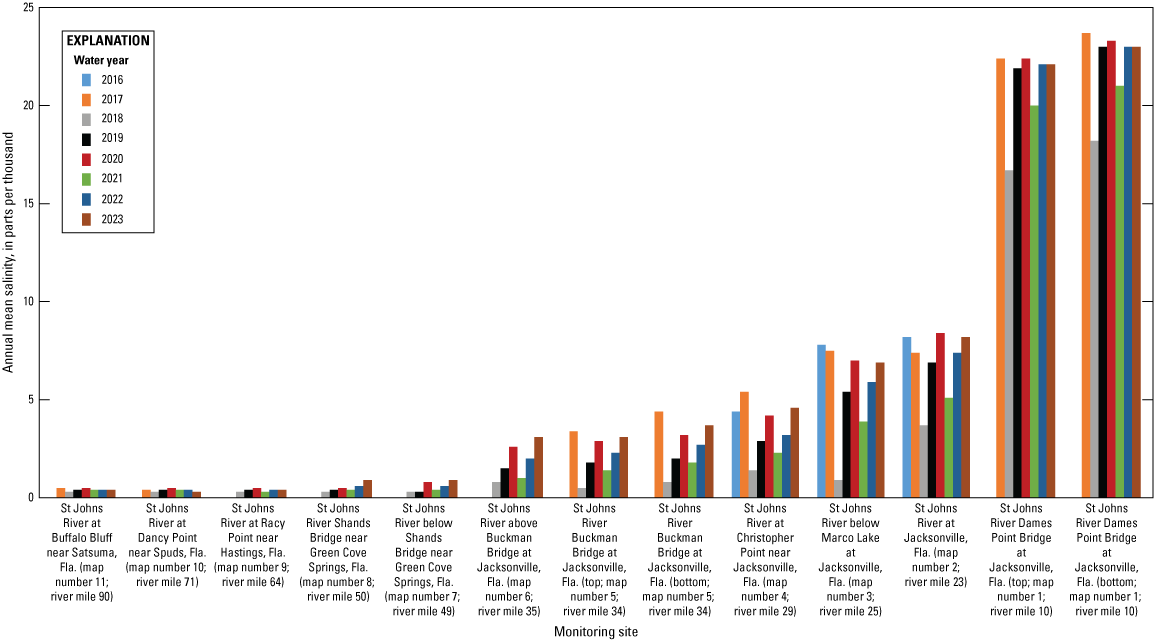
Annual mean salinity for the main-stem sites generally decreased with distance upstream, which was expected (fig. 74). Of all sites in 2023, St. Johns River Dames Point Bridge at Jacksonville, Fla. (USGS site number 302309081333001, map number 1) had the highest annual mean salinities, which were 22 ppt near the surface and 23 ppt near the bottom of the water column. The 2023 annual mean salinity was higher than that of 2022 at all main-stem sites, except for St. Johns River at Buffalo Bluff near Satsuma, Fla. (USGS site number 02244040, map number 11), St. Johns River at Racy point near Hastings, Fla. (USGS site number 02245290, map number 9), and St. Johns River Dames Point Bridge at Jacksonville, Fla. (USGS site number 302309081333001, map number 1), which were the same, and St. Johns River at Dancy Point near Spuds, Fla. (USGS site number 294213081345300, map number 10), which was lower (fig. 74). The 2023 annual mean salinities at St. Johns River Shands Bridge near Green Cove Springs, Fla. (USGS site number 295856081372301, map number 8), St. Johns River below Shands bridge near Green Cove Springs, Fla. (USGS site number 02245340, map number 7), and St. Johns River above Buckman Bridge at Jacksonville, Fla. (USGS site number 301057081414800, map number 6) were the highest recorded at those sites for the 6 years of data collection, while the annual mean salinities at each of the remaining main-stem sites was near the average for the 8 years of the study.
Annual mean salinity at St. Johns River main-stem monitoring sites.
Clapboard Creek above Buckhorn Bluff near Jacksonville, Fla. (USGS site number 302657081312400, map number 14) had the highest annual mean salinity (22 ppt) of all tributaries in 2023 because of its proximity to the Atlantic Ocean. Durbin Creek near Fruit Cove, Fla. (USGS site number 022462002, map number 26) salinity (0.2 ppt) was the lowest of all monitoring locations (fig. 75). A visual comparison of annual mean salinity at tributary sites between the 2023 and 2022 water years indicates salinity was higher in 2023 at all locations, except for Durbin Creek near Fruit Cove, Fla. (USGS site number 022462002, map number 26), which was the same (fig. 75). The 2023 annual mean salinity at 6 of the 9 tributary sites was either the highest or tied for the highest for the 8 years of data collection (fig. 75), while the annual mean salinity at the remaining 3 tributary sites ranked second highest (fig. 75).
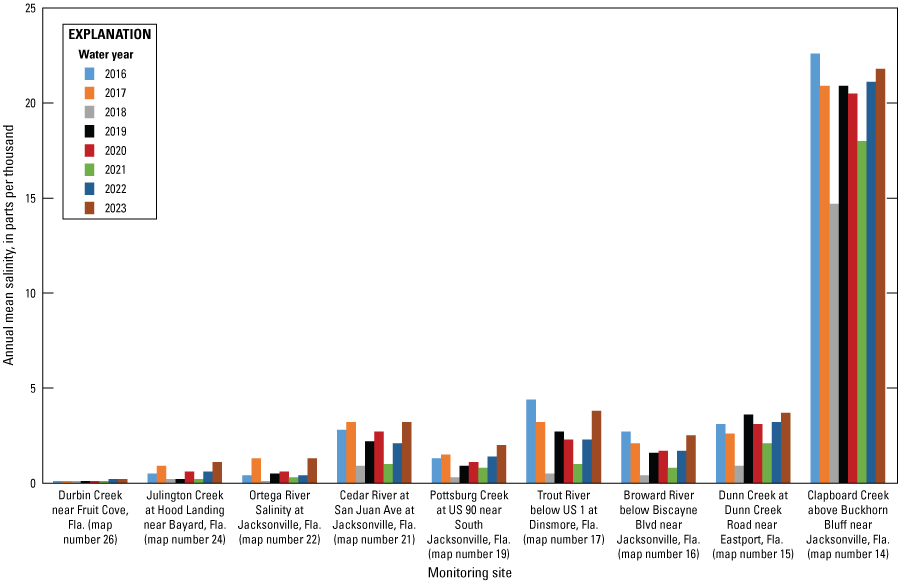
Annual mean salinity at St. Johns River tributary monitoring sites.
Summary
The U.S. Geological Survey (USGS), in cooperation with the U.S. Army Corps of Engineers, collected data during the 2023 water year, from October 2022 to September 2023, at 26 sites on the St. Johns River and its tributaries. The U.S. Army Corps of Engineers initiated dredging of the river in February 2018 and concluded in May 2022 as part of a project to deepen the first 13 river miles of the St. Johns River. Data collection began in the 2016 water year, and 2023 is the eighth annual report of the study. Stage was measured at 17 sites, discharge was calculated at 13 sites, and water temperature and specific conductance data were collected at 20 sites; all parameters were measured at certain sites. Salinity was calculated for each site where water temperature and specific conductance data were collected. Data were collected over a range of hydrologic conditions, including above-average annual rainfall in Volusia County and below-average annual rainfall in Duval, Clay, St. Johns, and Putnam Counties. Many factors—such as wind, rainfall, and hurricanes—can influence flow and salinity within the study area. Specifically, Hurricanes Ian and Nicole affected discharge at several sites in the 2023 water year.
The annual mean tidally filtered discharge for the 2023 water year increased with distance downstream, as expected, along the main stem of the St. Johns River. Of the main-stem sites, over the 8 years considered for this study, the second-highest annual mean discharge was computed for St. Johns River at Buffalo Bluff near Satsuma, Florida (USGS site number 02244040) and St. Johns River at Astor, Fla. (USGS site number 02236125), whereas St. Johns River at Jacksonville, Fla. (USGS site number 02246500) had the third-highest annual mean discharge. The 2023 annual mean salinity was higher than that of 2022 at all main-stem sites, except for St. Johns River at Buffalo Bluff near Satsuma, Fla. (USGS site number 02244040), St. Johns River at Racy Point near Hastings, Fla. (USGS site number 02245290), and St. Johns River Dames Point Bridge at Jacksonville, Fla. (USGS site number 302309081333001), which were the same, and St. Johns River at Dancy Point near Spuds, Fla. (USGS site number 294213081345300) which was lower. The 2023 annual mean salinities at St. Johns River Shands Bridge near Green Cove Springs, Fla. (USGS site number 295856081372301), St. Johns River below Shands bridge near Green Cove Springs, Fla. (USGS site number 02245340), and St. Johns River above Buckman Bridge at Jacksonville, Fla. (USGS site number 301057081414800) were the highest recorded at those sites for the 6 years of data collection, while the annual mean salinities at each of the remaining main-stem sites was near the average for the 8 years of the study.
Of the 10 tributaries measured for discharge, in comparison with one another, annual mean discharge was highest at Clapboard Creek near Jacksonville, Fla. (USGS site number 02246825), followed by Trout River near Jacksonville, Fla. (USGS site number 02246621), Durbin Creek near Fruit Cove, Fla. (USGS site number 022462002); Cedar River at San Juan Avenue at Jacksonville, Fla. (USGS site number 02246459); Ortega River at Kirwin Road near Jacksonville, Fla. (USGS site number 02246318); Julington Creek at Old St. Augustine Road near Bayard, Fla. (USGS site number 02246160); Pottsburg Creek at U.S. 90 near South Jacksonville, Fla. (USGS site number 02246518); Pottsburg Creek near South Jacksonville, Fla. (USGS site number 02246515); Dunn Creek at Dunn Creek Road near Eastport, Fla. (USGS site number 02246804); and Broward River below Biscayne Boulevard near Jacksonville, Fla. (USGS site number 02246751), whose annual mean was lowest. Annual mean discharge at 9 of the 10 tributary monitoring sites was lower for the 2023 water year than for the 2022 water year, with only Durbin Creek near Fruit Cove, Fla. (USGS site number 022462002) having a higher annual mean discharge in 2023 than 2022. The computed annual mean flow at Broward River below Biscayne Boulevard near Jacksonville, Fla. (USGS site number 02246751) was the lowest recorded at that site for the 8 years of data collection. The 2023 annual mean salinity was higher than that of 2022 at all locations, except for Durbin Creek near Fruit Cove, Fla. (USGS site number 022462002), which was the same. The 2023 annual mean salinity at 6 of the 9 tributary sites was either the highest or tied for the highest for the 8 years of data collection. The annual mean salinity at the remaining 3 tributary sites ranked second highest for the 8 years of data collection, coinciding with below average annual rainfall in four out of the five counties within the study area.
References Cited
Carson, J.N., and Benacquisto, M.T., 2025, Continuous stream discharge, salinity, and associated data collected in the lower St. Johns River and its tributaries, Florida, 2022: U.S. Geological Survey Open-File Report 2024–1076, 51 p., https://doi.org/10.3133/ofr20241076.
Jacksonville Port Authority [JAXPORT], 2018, Jacksonville harbor deepening fact sheet: Jacksonville Port Authority web page, accessed March 21, 2019, at https://www.jaxport.com/sites/default/files/images/HarborDeepeningInfo_1.pdf.
Levesque, V.A., and Oberg, K.A., 2012, Computing discharge using the index velocity method: U.S. Geological Survey Techniques and Methods, book 3, chap. A23, 148 p. [Also available at https://pubs.usgs.gov/tm/3a23/.]
Ryan, P.J., 2018, Continuous stream discharge, salinity, and associated data collected in the lower St. Johns River and its tributaries, Florida, 2016: U.S. Geological Survey Open-File Report 2018–1108, 28 p., accessed March 20, 2020, at https://doi.org/10.3133/ofr20181108.
Ryan, P.J., 2019, Continuous stream discharge, salinity, and associated data collected in the lower St. Johns River and its tributaries, Florida, 2017: U.S. Geological Survey Open-File Report 2019–1078, 35 p., accessed March 20, 2020, at https://doi.org/10.3133/ofr20191078.
Ryan, P.J., 2020a, Continuous stream discharge, salinity, and associated data collected in the lower St. Johns River and its tributaries, Florida, 2018: U.S. Geological Survey Open-File Report 2020–1061, 34 p., accessed July 9, 2020, at https://doi.org/10.3133/ofr20201061.
Ryan, P.J., 2020b, Continuous stream discharge, salinity, and associated data collected in the lower St. Johns River and its tributaries, Florida, 2019: U.S. Geological Survey Open-File Report 2020–1140, 48 p., accessed May 26, 2021, at https://doi.org/10.3133/ofr20201140.
Ryan, P.J., 2022, Continuous stream discharge, salinity, and associated data collected in the lower St. Johns River and its tributaries, Florida, 2020: U.S. Geological Survey Open-File Report 2022–1024, 48 p., accessed June 16, 2022, at https://doi.org/10.3133/ofr20221024.
Ryan, P.J., 2023, Continuous stream discharge, salinity, and associated data collected in the lower St. Johns River and its tributaries, Florida, 2021: U.S. Geological Survey Open-File Report 2022–1111, 48 p., accessed May 30, 2023, at https://doi.org/10.3133/ofr20221111.
Sauer, V.B., and Turnipseed, D.P., 2010a, Stage measurement at gaging stations: U.S. Geological Survey Techniques and Methods, book 3, chap. A7, 45 p. [Also available at https://doi.org/10.3133/tm3A7.]
Sauer, V.B., and Turnipseed, D.P., 2010b, Discharge measurements at gaging stations: U.S. Geological Survey Techniques and Methods, book 3, chap. A8, 87 p. [Also available at https://doi.org/10.3133/tm3A8.]
St. Johns River Water Management District [SJRWMD], 2024, Rainfall summary—Hydrologic conditions report: St. Johns River Water Management District web page, accessed May 16, 2024, at http://webapub.sjrwmd.com/agws10/hydroreport/.
U.S. Army Corps of Engineers [USACE], 2014, Jacksonville Harbor navigation study, Duval County, Florida—Final integrated general reevaluation report II and supplemental environmental impact statement: U.S. Army Corps of Engineers, Jacksonville District, 289 p. [Also available at https://usace.contentdm.oclc.org/digital/collection/p16021coll7/id/2118.]
U.S. Army Corps of Engineers [USACE], 2022, USACE, JAXPORT mark milestone—Harbor deepening project complete: U.S. Army Corps of Engineers, Jacksonville District web page, accessed July 2023 at https://www.saj.usace.army.mil/Media/News-Stories/Article/3041195/usace-jaxport-mark-milestone-harbor-deepening-project-complete/.
U.S. Geological Survey [USGS], 2025, USGS water data for the Nation: U.S. Geological Survey National Water Information System database, accessed March 2025 at https://doi.org/10.5066/F7P55KJN.
Wagner, R.J., Boulger, R.W., Jr., Oblinger, C.J., and Smith, B.A., 2006, Guidelines and standard procedures for continuous water-quality monitors—Station operation, record computation, and data reporting: U.S. Geological Survey Techniques and Methods, book 1, chap. D3, 51 p. [Also available at https://pubs.usgs.gov/tm/2006/tm1D3/pdf/TM1D3.pdf.]
Conversion Factors
Datum
Vertical coordinate information is referenced to the North American Vertical Datum of 1988 (NAVD 88).
Horizontal coordinate information is referenced to the North American Datum of 1983 (NAD 83).
Supplemental Information
Specific conductance is given in microsiemens per centimeter at 25 degrees Celsius (µS/cm at 25 °C).
For more information about this publication, contact
Director, Caribbean-Florida Water Science Center
U.S. Geological Survey
7595 SW 33d St.
Davie, FL 33314
For additional information, visit
https://www.usgs.gov/centers/car-fl-water
Publishing support provided by
U.S. Geological Survey Science Publishing Network,
Lafayette Publishing Service Center
Disclaimers
Any use of trade, firm, or product names is for descriptive purposes only and does not imply endorsement by the U.S. Government.
Although this information product, for the most part, is in the public domain, it also may contain copyrighted materials as noted in the text. Permission to reproduce copyrighted items must be secured from the copyright owner.
Suggested Citation
Carson, J.N., and Benacquisto, M.T., 2026, Continuous stream discharge, salinity, and associated data collected in the lower St. Johns River and its tributaries, Florida, 2023: U.S. Geological Survey Open-File Report 2026–1012, 52 p., https://doi.org/10.3133/ofr20261012.
ISSN: 2331-1258 (online)
Study Area
| Publication type | Report |
|---|---|
| Publication Subtype | USGS Numbered Series |
| Title | Continuous stream discharge, salinity, and associated data collected in the lower St. Johns River and its tributaries, Florida, 2023 |
| Series title | Open-File Report |
| Series number | 2026-1012 |
| DOI | 10.3133/ofr20261012 |
| Publication Date | May 15, 2026 |
| Year Published | 2026 |
| Language | English |
| Publisher | U.S. Geological Survey |
| Publisher location | Reston, VA |
| Contributing office(s) | Caribbean-Florida Water Science Center |
| Description | Report: x, 52 p.; Data Release |
| Country | United States |
| State | Florida |
| Other Geospatial | Lower St. Johns River |
| Online Only (Y/N) | Y |
| Additional Online Files (Y/N) | N |