

Summary of Fish Communities in Underwood Creek, Milwaukee, Wisconsin, April 2021
Links
- Document: Report (1.5 MB pdf) , HTML , XML
- Dataset: USGS National Water Information System database - USGS water data for the Nation
- Data Release: USGS data release - Fish community data for rivers and streams in the Milwaukee, Wisconsin, area
- Download citation as: RIS | Dublin Core
Acknowledgments
Funding was provided by the Milwaukee Metropolitan Sewerage District and U.S. Geological Survey Cooperative Matching Funds. We thank Milwaukee Metropolitan Sewerage District employees Thomas Chapman and Matthew Magruder for providing background information on the sites and restoration efforts. We also express appreciation for the U.S. Geological Survey employees who helped in collecting the data contained within this report: Owen M. Stefaniak assisted with fish collection in 2019; and Nicolas H. Buer, Kassidy T. Mapel, and Benjamin M. Young assisted with fish collections in prior years. We also thank Michelle Nott for creating figure 1.
Abstract
Portions of Underwood Creek in Milwaukee County, Wisconsin were reconstructed beginning in 2010 to allow for improved fish habitat and better management of streamflow during storm events. Four reaches of Underwood Creek were sampled in April 2021 for fish abundance by species to evaluate the status of fish communities after reconstruction efforts were completed. A total of 25 fish species were collected during the April 2021 sampling events. Reach D, a recently restored reach, contained the most fish species (14) and individuals (391). White suckers (Catostomus commersonii) were present in three of four reaches, fulfilling one of the success metrics outlined in the Underwood Creek restoration plan. Another success metric, collection of young of year northern pike (Esox lucius), was not met in this sampling event. However, spawning steelhead (Oncorhynchus mykiss) were observed in several reaches, indicating that reconstruction allowed for suitable habitat and passage for some migratory fish.
Introduction
This report summarizes the status of fish communities during and following restoration efforts in Underwood Creek, Wisconsin. Portions of this report’s introduction, methods, and results were originally presented in Bell and others (2021) and are restated or summarized herein.
Underwood Creek is an 8-mile long, small, wadable stream in Waukesha and Milwaukee Counties, Wisconsin, and is a major tributary to the Menomonee River (fig. 1). The 20-square-mile watershed mostly consists of urban land, including dense residential, commercial, and industrial areas (Scudder Eikenberry and others, 2020b). During the 1960s and 1970s, sections of Underwood Creek were modified from their natural bed into a wider, concrete-lined, straightened channel with multiple drop structures to mitigate flooding (U.S. Army Corps of Engineers, 2015). However, 50 years of increased urban development created larger overland flows than the modified channel was designed to manage (U.S. Army Corps of Engineers, 2015). This urban runoff has led to degradation of the biotic communities (Scudder Eikenberry and others 2020a). In 2006, the Milwaukee Metropolitan Sewerage District and the U.S. Army Corps of Engineers developed a plan to reconstruct Underwood Creek from the confluence of the Menomonee River upstream to U.S. Highway 100 to improve flood management and restore the biotic integrity of Underwood Creek (fig. 1; Southeastern Wisconsin Regional Planning Commission, 2000; Sear and others, 2010; Sear and Fowler, 2006; U.S. Army Corps of Engineers, 2015). This reconstruction effort replaced the concrete-lined channel and drop structures, which prevent fish from migrating from Lake Michigan to the headwaters to spawn, with a more natural boulder and stone-lined channel and a riffle-pool-run design. It also widened the floodplain area and reestablished native vegetation in the riparian corridor. The first phase of the reconstruction was completed in 2010 and encompassed reach B (U.S. Geological Survey [USGS] station number 04087088, reach B; U.S. Army Corps of Engineers, 2015). The second phase, completed in 2017 and encompassing reaches A and D, included the section of Underwood Creek from Highway 45 downstream to the confluence with the Menomonee River adjacent to Hansen Golf Course (USGS station number 04087088, reach A; U.S. Army Corps of Engineers, 2015). A feasibility study began in 2018 to remove an additional 12,600 linear feet of concrete and 5 drop structures in upper Underwood Creek upstream of Mayfair Road (U.S. Army Corps of Engineers, 2018). For more details on the history and timeline of reconstruction, refer to Bell and others (2021).
The goal of this project is to reconnect anadromous fish with historical spawning habitat in the headwater of Underwood Creek by reducing creek velocities to allow passage for species such as northern pike (Esox lucius) and steelhead (Oncorhynchus mykiss), and to provide rest areas and areas of reduced predation. Fish community surveys at reach A have been conducted by the USGS every 3 years since 2004, as part of a larger Milwaukee Metropolitan Sewerage District and USGS cooperative project. In 2016, a 3-year sampling schedule for fish community surveys began in reach B after the reconstruction of the channel and reinstallation of the USGS streamgage (04087088). In the spring of 2019, a third reach near Elm Grove, immediately upstream from the county line between Milwaukee and Waukesha Counties near Bluemound Road (USGS station number 0408708567; hereafter Elm Grove reach), was sampled to provide a baseline to allow for eventual comparison of data before and after the completion of reconstruction efforts upstream of Mayfair Road. By 2021, most of the stream reconstruction was complete in the lower reaches of the stream downstream of Mayfair Road. In April 2021, the USGS completed a fish community survey at four locations along Underwood Creek, including two new reaches, C and D. Reach C was a shallow and wide reach just before the confluence with the Menomonee River; it contained little structure or spawning habitat and was expected to have been easily traversed by migratory fish. Reach D was in a recently restored channel and riparian area (completed in 2017) and was located between reaches A and B. This report describes the results of the 2021 sampling effort and qualitatively compares those results to earlier sampling efforts described in Bell and others (2021).
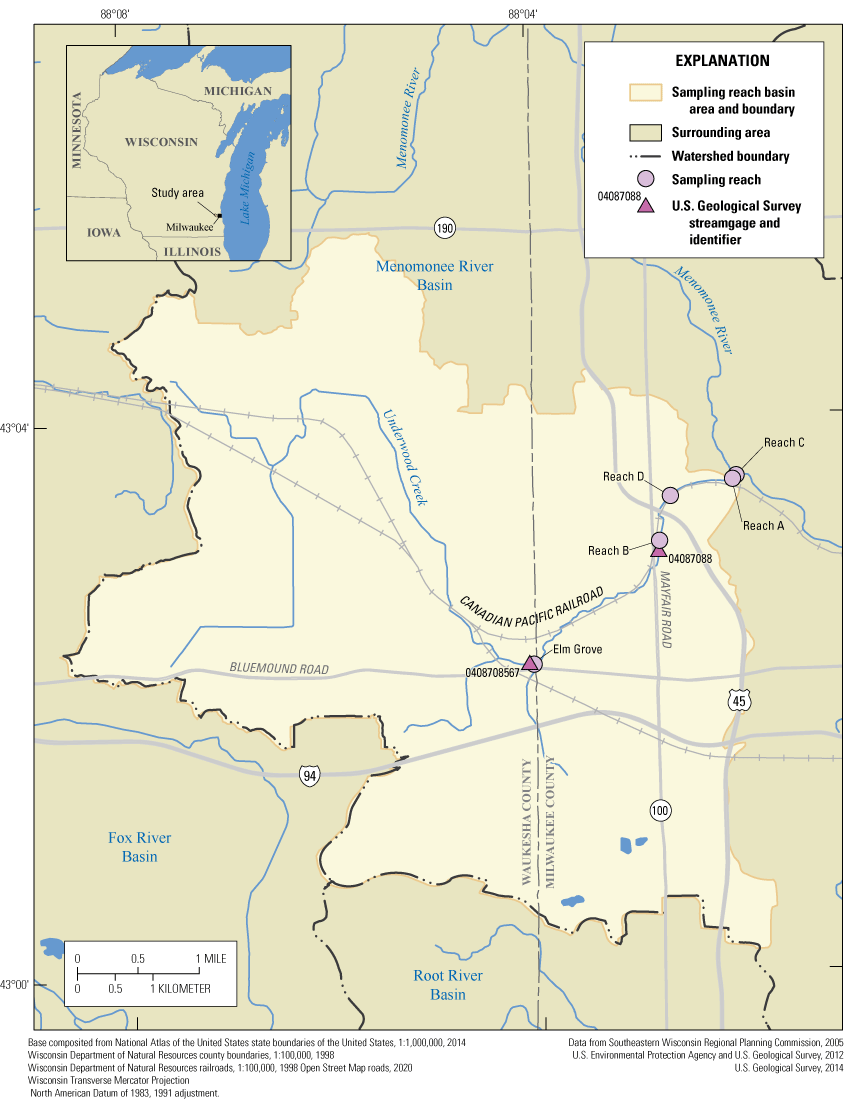
Map showing reaches sampled in Underwood Creek, Milwaukee, Wisconsin, April 2021.
Methods
The methods used to survey the fish community are based on Moulton and others (2002). A representative fish community sample was collected using a backpack-mounted electrofishing unit and a minnow seine with 1/4-inch mesh along a 150-meter reach at each location. Throughout this report, the term reach refers to these 150-meter sections of stream that have similar hydrologic and habitat conditions. Two electrofishing passes of the sampling reach were supplemented with three seine hauls per site. The sampling effort was consistent for all sampling events. Certified and experienced personnel operated a backpack-mounted electrofishing unit that used a pulsed direct current. Two additional personnel used nets with 1/4-inch mesh to capture the fish and place them in buckets with battery-operated aerators to minimize stress on the fish. Identification was determined by one of two aquatic biologists. Fish were identified to the lowest practical taxonomic level (generally species), counted, and released to the stream. Those few fish that could not be identified in the field were identified later in the lab. In the case of game fish, the fish total length and weight were recorded for the first 30 fish of each species. Data collection, quality assurance, and data storage are described in Bell and others (2021).
Fish counts by species from 2021 were used to compute a fish index of biotic integrity (IBI) for Wisconsin warm-transition streams (Lyons, 2012). The IBI is a relative score to assess the condition of the fish assemblage that is based on biological metrics including the number of species and individuals; native species; predator fish; number of fish in certain groups such as sunfishes (Centrarchidae), suckers (Catostomidae), and pollution-sensitive and pollution-tolerant fish. The programming language R version 4.3.1 was used for summarizing the data (R Core Team, 2023).
In a previous report, data collected prior to 2021 were analyzed using the warmwater IBI based on temperature and flow data from the USGS Underwood Creek at Wauwatosa, Wis., streamgage (USGS station 04087088; U.S. Geological Survey, 2020, Bell and others, 2021). However, this report updates those scores based on guidance from the Wisconsin Department of Natural Resources to select IBI based on natural community assessments; under this criteria Underwood Creek is classified as warm-transition (Wisconsin Department of Natural Resources, 2020). Additionally, the stream temperature model presented in Stewart and others (2015) predicts that Underwood Creek would be in the warm-transition range (Stewart and others, 2015). In the present study, we analyze newly collected data and reanalyze previously collected data using the warm-transition IBI. All reaches are considered mainstem except Elm Grove (fig. 1), which is considered a headwater.
The similarities of the fish communities in each sample were assessed with Bray-Curtis Similarity using Primer 6 software (Bray and Curtis, 1957; Clarke and Gorley, 2006). The relative abundance of each taxon was determined for each sample and then fourth-root transformed before a Bray-Curtis Similarity was performed to determine similarity between each of the samples. Similarities range from 0 (having no similarity) to 100 percent (samples are equal). A fourth-root transformation decreases the effects of common taxa and increases the effects of intermediate and rare taxa such that more taxa have an effect in the final multivariate analyses (Clarke and Gorley, 2006). Because of the stochastic nature of sampling fish communities, including annual variation in water temperatures, dissolved oxygen, flow, specific conductivity, fish migration, and timing of sampling, we selected a similarity threshold of 50 percent or greater to be indicative of similar communities.
Results and Discussion
The following sections are a summary and interpretation of the data collected at the five reaches of Underwood Creek (reaches A–D, Elm Grove; fig. 1), including comparisons of the species composition, community traits, and similarities within and among the five reaches (Romano and others, 2025). We also compare the findings of this sampling effort to six previous sampling campaigns (Bell and others, 2021).
Species Composition
A total of 25 different fish taxa were found in the Underwood Creek reaches (fig. 1; table 1), an increase of four species from the total reported in Bell and others (2021). Creek chub (Semotilus atromaculatus) were found during every survey at all reaches. The creek chub is a native Wisconsin species that has no preference for streambed type, water clarity, or water temperature (Becker, 1983), and is found in medium and small streams across the state. The next two most abundant species at all reaches but missing in two individual sampling events, were western blacknose dace (Rhinichthys obtusus) and white sucker (Catostomus commersonii). Both species are ubiquitous in Wisconsin lakes and rivers and are tolerant to a wide range of temperature fluctuations, dissolved oxygen concentrations, substrate types, and pollution conditions (Becker, 1983). Although native to Wisconsin, western blacknose dace and white sucker are often abundant in disturbed urban streams such as Underwood Creek because of their ability to thrive in a variety of stream conditions (Becker, 1983). Other species that were collected at all reaches and in most samples include central stoneroller (Campostoma anomalum) and johnny darter (Etheostoma nigrum).
Table 1.
Count and percent relative abundance (in parentheses) of the fish communities collected via electrofishing at selected locations in Underwood Creek, Milwaukee, Wisconsin, 2004–21.[Cell shading is present for visual groupings. Dates are in month/day/year format; %, percent, --, not applicable]
Data previously collected and reported in Bell and others (2021).
Newly collected (2021) and reported data (Romano and others, 2025).
Fish community data collected in spring 2021 showed that Underwood Creek is meeting some of the criteria for success in the Underwood Creek restoration plan. The Underwood Creek restoration plan (US Army Corps of Engineers, 2015, p. 5) states:
Success is defined as the presence of white sucker or members of the sucker family (Catostomidae) and longnose dace within the reconstructed stream channel (presence/absence), the presence of white sucker or members of the Catostomidae family in the upstream river segment or the presence of 50 [percent] of the fish species found in the downstream sampling segment. Success can also be defined as the collection of young of the year (YOY) northern pike or juvenile northern pike from upstream of the proposed restoration work area as evidence of successful passage of adult to the upstream spawning habitat.
White sucker play an important role in streams in early spring by transporting nutrients that in turn feed the algae and insects that anchor the food chain. White sucker have been collected every year except 2010 in Underwood Creek reach A, but in low numbers (less than 10 percent of total catch in terms of individual fish). Restoration of reach A was completed in 2017 but even when it was partially complete during the 2016 sampling, abundance of white sucker increased substantially to 155 individuals, which comprised about 67 percent of the total catch. During 2021 spring sampling, all reaches had lower fish abundance than previous fall surveys, but white suckers still made up about 70 percent of total catch in reach A. White suckers were found both above and below the drop structure that separates reaches B and D, which are both sections that were reconstructed. White suckers were not found in reach C, but fish abundance there was the lowest of any survey in Underwood Creek (24 individuals).
The longnose dace (Rhinichthys cataractae) is similar in appearance to the western blacknose dace but was not found in Underwood Creek during USGS sample collection in any year. The longnose dace is found in medium-sized fast-moving streams in northern Wisconsin and in small-sized, fast-moving streams in southwestern Wisconsin (Becker, 1983). However, according to descriptions by both Becker and Smith, the longnose dace that occur in southeastern Wisconsin and northeastern Illinois are commonly found in “windswept shoals” (Becker, 1983, p. 474) and “along the turbulent pebble beaches” (Smith, 2002, p. 86) of Lake Michigan. Smith (2002, p. 87) notes that “longnose dace is common along the shoreline of Lake Michigan but extremely rare in inland streams.” Based on the published distribution, an occasional longnose dace may be found in streams in the area; however, the gravel and cobble streambed of the restored and unrestored reaches of Underwood Creek will not likely house a sustainable population of longnose dace despite enhanced habitat conditions.
Northern pike have not been collected since a single specimen was collected in 2013, although these fish may find the restored stream potential suitable habitat in the future. Both species are found in the Menomonee River that Underwood Creek flows into (Scudder Eikenberry and others, 2020b) and it is possible that these larger sport fish will be found in Underwood Creek in the future.
An objective of the Underwood Creek reconstruction was to increase connectivity to headwater spawning habitat. Although steelhead are considered an exotic species (Lyons, 1992), they provide insight into the ability of fish to migrate in Underwood Creek. Steelhead were observed but none collected in reach A. No steelhead were observed or collected in either reach C or reach B. Reach C is a shallow and wide reach just before the confluence with the Menomonee River and lacks spawning habitat for these large fish, but it does not prevent them from swimming to reach suitable habitat upstream. Lack of steelhead at reach B indicates that either the fish were unable to traverse the concrete section of the stream between reach D and reach B, or the habitat in reach B was unsuitable and if any fish did swim through the concrete section, they kept going past reach B in search of spawning habitat further upstream. Of the four restored reaches of Underwood Creek, reach D, which contains a newly restored channel and riparian area with diverse habitat, supported the greatest fish abundance and species richness. Reach D is also directly below a drop structure. Species observed here in 2021, but not in previous surveys of Underwood Creek, include black bullhead (Ameiurus melas), blackside darter (Percina maculata), brook trout (Salvelinus fontinalis), and steelhead. Many steelhead were observed in the reach in spawning condition. Most were observed but not collected to minimize disruption of their spawning.
Community Traits and Index of Biotic Integrity
Bell and others (2021) lists the species attributes to calculate the warmwater IBI for Underwood Creek. We include here an updated table that includes species newly observed in 2021 and attributes applicable to the warm-transition IBI (table 2).
Sampling in 2021 took place in early April to target spring migrating fishes, a key metric of restoration success for Underwood Creek (U.S. Army Corps of Engineers, 2015). Data indicate that the restoration has resulted in suitable habitat for at least some migrating fishes, primarily white sucker and steelhead. White suckers were found at all reaches except reach C (table 1). Steelhead were observed at reaches A and D but collected at only reach D to avoid disruption to spawning (table 1). IBI scores from the spring 2021 sampling effort are included for information but are not directly comparable as the IBI is designed to be used with midsummer-to-early-fall sample collection (table 3).
Table 2.
Selected attributes of fish species collected at five locations in Underwood Creek, Milwaukee, Wisconsin, 2004–21.[—Left][Cell shading is present for visual grouping. Some of these metrics are used to calculate the warm-transition stream index of biotic integrity and are defined in Lyons, 1992. X, fish species is described by the metric; --; fish species is not described by the metric]
Table 2.
Selected attributes of fish species observed at five locations in Underwood Creek, Milwaukee, Wisconsin, 2004–21.[—Right]Table 3.
Selected metrics and index of biotic integrity of the fish communities at five locations in Underwood Creek, Milwaukee, Wisconsin, 2004–21.[Cell shading is present for visual grouping. Several of these metrics are used to calculate the fish index of biotic integrity (IBI) for Wisconsin warm-transition streams and are defined in Lyons, 1992. IBI scores for spring surveys are shown, but the IBI metric is only calibrated for summer and fall sampling. Dates are shown in month/day/year format; %, percent; IBI, Index of Biological Integrity; <, less than; *, not enough fish collected to calculate an IBI.]
Data previously collected and reported in Bell and others (2021).
Newly collected (2021) and reported data (Romano and others, 2025).
Fish tolerance to pollution, low dissolved oxygen, and disturbed habitat can be used to make inferences about the water quality of a stream. Lyons (1992, p. 11) describes intolerant species as those that are “intolerant of environmental degradation, particularly poor water quality, siltation and increased turbidity, and reduced habitat heterogeneity.” Tolerant species are those adaptable to degraded water quality and habitat. Non-tolerant species include intolerant species and species that are neither designated tolerant or intolerant. Pollution-tolerant species comprised 57–75 percent of the species collected at each reach in spring 2021, representing a small decline from the percentage of tolerant species collected in spring 2019 (71–75 percent). Brook trout was the only pollution-intolerant species observed; one individual was collected from reach D and was the first intolerant fish collected since surveying began in 2004 at Underwood Creek. Fishes tolerant to low dissolved oxygen were observed at low abundance (1–17 percent) in all surveyed reaches in spring 2021. Fishes tolerant to pollution and disturbed habitat were more abundant and accounted for 58–88 percent and 42–86 percent of the fish abundance at Underwood Creek in spring 2021, respectively. Spawning traits can also provide information about the quality of physical habitat. Simple lithophilous spawners lay eggs in clean coarse gravel and can be impacted by excess sedimentation (Lyons, 1992). The 2021 surveys indicated that 20–29 percent of species in each reach are lithophilous spawners.
Categorizing fish into feeding groups can provide insight into the structure of the food web. When a stream undergoes reconstruction, it may take several years to stabilize and reestablish the food web. In general, rivers that have a higher percentage of invertivore fish (greater than 30 percent) have a more diverse food web and can support the higher trophic level fish such as northern pike and largemouth bass (Goldstein and others, 1999). The reaches sampled in the 2021 survey contained 38–50 percent invertivore species and 3–38 percent invertivore fishes (table 3).
In 2021 sampling, only reach D contained game or sport fish. Most of these were steelhead, but a brook trout and a pumpkinseed (Lepomis gibbosus) were also collected (table 1). Northern pike and largemouth bass are game fish that were found in surveys prior to 2021 in Underwood Creek, but not during the 2021 sampling. Other species of game fish include top carnivores such as muskellunge (Esox masquinongy), smallmouth bass (Micropterus dolomieu), and sturgeon family (Acipenseridae), among others, but these have not been found in Underwood Creek since surveys began in 2004. Sport fish, in general, are species that are targeted for recreational fishing; this category includes game fish and includes some members of the sunfish family, perch family (Percidae), and bullhead and catfish family (Ictaluridae). In contrast, forage fish are those that are not considered sport fish. The forage fish account for most of the abundance across all samples (96 percent or greater). These forage fish provide food for the top carnivores and are mostly invertivores and omnivores. The largemouth bass (Micropterus salmoides), a top carnivore and sport fish, was not collected in the spring 2021 sampling at reach A despite being collected during previous surveys 2004–19. The habitat alterations in reach A reduced the size of the large plunge pool that existed at the bottom of the former concrete channel, which may have affected the habitat available for fish that are less riverine including sunfish and largemouth bass.
Bray-Curtis Similarity Comparison
In this report, communities in each reach survey are compared based on their Bray-Curtis Similarity score. Two reaches are considered similar if their similarity score is 50 percent or greater. As of this report (2026), reach A has been sampled seven times, with sampling dates between April and October. When reach A surveys were compared to each other, communities were similar about 50 percent of the time, based on a similarity score of 50 percent or greater (table 4). Reach B has been sampled four times since its reconstruction, twice in April and twice in July. The Bray-Curtis Similarity scores always indicated similarity within reach B, indicating the community there is stable. A drop structure separates reach B from reach A and the confluence with the Menomonee River. Prior to 2019, reach A and reach B were similar about 50 percent of the time. In 2019 and 2021, after reach A was reconstructed, reach A and B Bray-Curtis Similarity scores were always similar to each other.
All four samples from reach B have similarities of 58 percent or greater to the Elm Grove reach sample, which was surveyed in 2019 and is upstream from reach B (table 4; fig. 1). Only two surveys in reach A indicated similarity to the Elm Grove reach community. Reach C was generally dissimilar to reach A, despite their proximity. These reaches differ in their history and habitat; reach A was reconstructed in 2017, whereas reach C was not lined with concrete and is low gradient with soft substrate and little structure other than the deep pool at the bottom of the reach. Reach D was only similar to three out of seven surveys in reach A. Reach D underwent similar reconstruction as reach A, but reach D has a higher gradient. Both reaches C and D were similar to Elm Grove reach. Reaches C and D were also similar to all but the earliest survey in reach B.
Table 4.
Bray-Curtis similarity matrix of the fish communities at five U.S. Geological Survey sampling locations in Underwood Creek, Milwaukee, Wisconsin, 2004–21.[Two reaches are considered similar if their Bray-Curtis similarity score is 50 percent or greater (Bray and Curtis 1957). Dates are shown in month/day/year format. U.S. Geological Survey, USGS. --, not applicable]
Summary
Underwood Creek, located in Milwaukee, Wisconsin, has undergone reconstruction to remove drop structures and concrete lining sections of the stream. The Milwaukee Metropolitan Sewage District has sought to understand if these efforts have improved the fish community. Fish sampling in 2021 targeted spring migratory fish. Migrating steelhead were found spawning in recently reconstructed reaches, but not above the remaining drop structure. The greatest fish abundance and species richness surveyed in Underwood Creek was located in reach D, directly below the drop structure. The fish abundance and species richness upstream of the drop structure also increased from past years, indicating that the reconstructed habitat in reach B is also improving. White suckers were present above and below the drop structure, fulfilling one metric of success described in the Underwood Creek restoration plan. The Menomonee River contains many fish species that can migrate to the reach below the drop structure, and habitat may be suitable upstream when remaining fish passage barriers are removed. Any additional habitat improvement will likely support additional fish diversity in Underwood Creek.
References Cited
Bell, A.H., Sullivan, D.J., and Scudder Eikenberry, B.C., 2021, Summary of fish communities along Underwood Creek, Milwaukee, Wisconsin, 2004–2019: U.S. Geological Survey Open-File Report 2020–1112, 14 p., accessed August 22, 2024, at https://doi.org/10.3133/ofr20201112.
Bray, J.R., and Curtis, J.T., 1957, An ordination of the upland forest communities of southern Wisconsin: Ecological Monographs, v. 27, p. 325–349, accessed January 26, 2026, at https://doi. org/10.2307/1942268.
Lyons, J., 1992, Using the index of biotic integrity (IBI) to measure environmental quality in warm water streams of Wisconsin: U.S. Department of Agriculture, Forest Service NC–149, 51 p., accessed August 22, 2024, at https://www.fs.usda.gov/treesearch/ pubs/10213.
Lyons, J., 2012, Development and validation of two fish-based indices of biotic integrity for assessing perennial coolwater streams in Wisconsin, USA: Ecological Indicators, v. 23, p. 402–412, accessed February 4, 2026, at https://doi.org/10.1016/j.ecolind.2012.04.026.
Moulton, S.R., II, Kennen, J.G., Goldstein, R.M., and Hambrook, J.A., 2002, Revised protocols for sampling algal, invertebrate, and fish communities as part of the National Water-Quality Assessment Program: U. S. Geological Survey Open-File Report 02–150, 72 p., accessed August 22, 2024, at https://doi.org/10.3133/ofr2002150.
R Core Team, 2023, R—A language and environment for statistical computing, version 4.3.1: Vienna, Austria, R Foundation for Statistical Computing software release, accessed June 6, 2023, at https://www.r-project.org/.
Romano, J.T., Nott, M.A., Olds, H.T., Diebel, M.W., Johncock, K.E., Ennis, R.P., Eikenberry, B.C., Bell, A.H., and Sullivan, D.J., 2025, Fish community data for rivers and streams in the Milwaukee, Wisconsin, area: U.S. Geological Survey data release, accessed January 26, 2026, at https://doi.org/10.5066/P13FXCII.
Scudder Eikenberry, B.C., Nott, M.A., Stewart, J.S., Sullivan, D.J., Alvarez, D., Fitzpatrick, F.A., and Bell, A.H., 2020a, Ecological status of selected streams in the Milwaukee Metropolitan Sewerage District Planning Area of Wisconsin, 2004–13: U.S. Geological Survey Scientific Investigations Report 2020–5053, 84 p., accessed August 21, 2024, at https://pubs.er.usgs.gov/publication/sir20205035.
Scudder Eikenberry, B.C., Nott, M.A., Stewart, J.S., Sullivan, D.J., Fitzpatrick, F.A., Bell, A.H., and Olds, H.T., 2020b, Aquatic community and environmental data for 14 rivers and streams in the Milwaukee Metropolitan Sewerage District Planning Area, 2004–13: U.S. Geological Survey data release, accessed February 19, 2020, at https://doi.org/10.5066/P9FWMODL.
Sear, T.R., and Fowler, D.C., 2006, Underwood Creek Rehabilitation and Flood Management, Menomonee River Watercourse, Milwaukee, Wisconsin, in World Environmental and Water Resources Congress 2006 — World Environmental and Water Resource Congress 2006: Omaha, Nebr., American Society of Civil Engineers, p. 1–10, accessed February 4, 2026, at https://doi.org/10.1061/40856(200)358.
Sear, T.R., Miller, D., Chmielewski, R.M., and Fowler, D., 2010, Underwood Creek rehabilitation and flood management phase 1—Final design and construction: Milwaukee, Wisconsin, Watershed Management, 12 p, accessed February 4, 2026, at https://doi.org/10.1061/41143(394).
Southeastern Wisconsin Regional Planning Commission, 2000, Analysis of alternative plans for removal of the concrete lining in Underwood Creek in the City of Wauwatosa: Memorandum Report No. 141, accessed August 22, 2024, at https://www.sewrpc.org/SEWRPCFiles/Publications/mr/mr-141_removal_of_concrete_lining_in_underwood_creek.pdf.
Stewart, J.S., Westenbroek, S.M., Mitro, M.G., Lyons, J.D., Kammel, L.E., and Buchwald, C.A., 2015, A model for evaluating stream temperature response to climate change in Wisconsin: U.S. Geological Survey Scientific Investigations Report 2014–5186, 64 p., accessed August 22, 2024, at https://doi.org/10.3133/sir20145186.
U.S. Army Corps of Engineers, 2015, Appendix G monitoring plan—Underwood Creek Great Lakes Fishery And Ecosystem Restoration Project Wauwatosa, Wisconsin: U.S. Army Corps of Engineers, 9 p., accessed August 22, 2024, at https://usace.contentdm.oclc.org/digital/collection/p16021coll7/id/2319.
U.S. Army Corps of Engineers, 2018, C-GLFER-Upper Underwood Creek, Wauwatosa, WI, 1 p., accessed May 18, 2020, at https://www.lre.usace.army.mil/ LinkClick.aspx? fileticket= 0l7T0zNroac%3D&portalid=69.
U.S. Environmental Protection Agency, and U.S. Geological Survey, 2012, National Hydrography Dataset Plus - NHDPlus (Edition 2.10): U.S. Environmental Protection Agency, accessed at http://www.horizon-systems.com/nhdplus/NHDPlusV2_home.php.
U.S. Geological Survey, 2014, USGS small-scale dataset—1:1,000,000-Scale state boundaries of the United States shapefile: National Atlas of the United States, accessed April 4, 2022, at https://www.sciencebase.gov/catalog/item/581d052de4b08da350d524e5.
U.S. Geological Survey, 2020, 04087088 Underwood Creek at Wauwatosa, Wis., in USGS water data for the Nation: U.S. Geological Survey National Water Information System database, https://doi.org/10.5066/F7P55KJN. [Site information accessed directly May 1, 2020, at https://waterdata.usgs.gov/usa/nwis/uv?04087088.]
Wisconsin Department of Natural Resources, 2020, Riverine and lake natural communities: Wisconsin Department of Natural Resources web page, accessed May 8, 2020, at http://dnr.wi.gov/topic/rivers/naturalcommunities.html#lakes.
For more information about this publication, contact:
Director, USGS Upper Midwest Water Science Center
1 Gifford Pinchot Drive
Madison, WI 53726
608–828–9901
For additional information, visit: https://www.usgs.gov/centers/upper-midwest-water-science-center
Publishing support provided by the
USGS Science Publishing Network,
Rolla Publishing Service Center
Disclaimers
Any use of trade, firm, or product names is for descriptive purposes only and does not imply endorsement by the U.S. Government.
Although this information product, for the most part, is in the public domain, it also may contain copyrighted materials as noted in the text. Permission to reproduce copyrighted items must be secured from the copyright owner.
Suggested Citation
Bell, A.H., LaFond-Hudson, S., Stefaniak, O.M., Romano, J.T., and Sullivan, D.J., 2026, Summary of fish communities in Underwood Creek, Milwaukee, Wisconsin, April 2021: U.S. Geological Survey Open-File Report 2026–1060, 17 p., https://doi.org/10.3133/ofr20261060.
ISSN: 2331-1258 (online)
Study Area
| Publication type | Report |
|---|---|
| Publication Subtype | USGS Numbered Series |
| Title | Summary of fish communities in Underwood Creek, Milwaukee, Wisconsin, April 2021 |
| Series title | Open-File Report |
| Series number | 2026-1060 |
| DOI | 10.3133/ofr20261060 |
| Publication Date | February 24, 2026 |
| Year Published | 2026 |
| Language | English |
| Publisher | U.S. Geological Survey |
| Publisher location | Reston, VA |
| Contributing office(s) | Upper Midwest Water Science Center |
| Description | Report: vi, 17 p.; Data Release; Dataset |
| Country | United States |
| State | Wisconsin |
| City | Milwaukee |
| Other Geospatial | Underwood Creek |
| Online Only (Y/N) | Y |
| Additional Online Files (Y/N) | N |