

Evaluation of Benthic Habitat Change within the National Historic Sites of Hawaiʻi’s Kona Coast
Links
- Document: Report (8.9 MB pdf) , HTML , XML
- Data Release: USGS data release - Underwater imagery and classifications of the substrate and coral reef habitat on the Kona coast of the Island of Hawaiʻi, from 2003, 2004, and 2022
- NGMDB Index Page: National Geologic Map Database Index Page (html)
- Download citation as: RIS | Dublin Core
Acknowledgments
Funded by the National Park Service, Pacific West Regional Office through Interagency Agreement P20PG00232 and the U.S. Geological Survey’s Coastal and Marine Hazards and Resources Program. Selena Johnson (U.S. Geological Survey) and Peter Dartnell (U.S. Geological Survey) contributed numerous excellent suggestions and a timely review of our work.
Executive Summary
Coral bleaching events have become increasingly common across the Hawaiian Archipelago since 1996 because of more frequent and intense marine heatwaves. The most significant bleaching event to date occurred from 2014 to 2015, which resulted in catastrophic state-wide coral loss. Bleaching events with less severe effects also occurred in 1996 and 2019. To understand the long-term effects of repeated bleaching events, along with other anthropogenic factors such as water quality, storms, sewage runoff, and coastal development, on coral reefs on the Kona Coast of the Island of Hawaiʻi, the U.S. Geological Survey, in collaboration with the National Park Service, collected underwater imagery in the early 2000s (baseline survey) and again in 2022 (resurvey). These images were captured within and adjacent to the National Historic Parks (NHP) and National Historic Sites (NHS) of Kaloko-Honokōhau NHP (KAHO), Puʻuhonua o Hōnaunau NHP (PUHO), and Puʻukohola Heiau NHS (PUHE). Imagery was classified for live coral cover and dominant type (four coral types, rubble, macroalgae, and two bottom substrate types). Change of percent live coral cover was determined for all sites. Change of coral and non-coral dominant types were calculated by aggregating classifications for each park into coral and non-coral. Net coral cover decreased between the baseline and resurvey period across all three parks, though PUHE exhibited the greatest loss of live coral cover. Across all three parks, the occurrence of lower coral cover classes (0–20 percent) increased and higher coral cover classes (greater than 50 percent) decreased. Furthermore, the total occurrence of non-coral dominant type classifications (rubble, macroalgae, sand, and volcanic pavement) increased by approximately 25 percent across all three parks, with PUHE experiencing a nearly 90-percent increase in the occurrence of non-coral types. There was little to no effect of water depth on change of live coral cover, indicating that marine heatwave driven bleaching events and additional anthropogenic influences affected the entire reef across all water depths from the lower fore reef to the reef flat.
Because coral loss was more severe at PUHE and PUHO than KAHO, creating a monitoring framework that utilizes periodic underwater camera surveys and fixed diver transects by the National Park Service would contextualize the periodic spatial surveys to the fixed transects that have greater temporal resolution. Similarly, increased frequency of spatial surveys would allow for the National Park Service to continue monitoring changes to critical nearshore habitats and marine resources relevant to National Park jurisdiction.
Introduction
Large-scale changes are happening to coral reef ecosystems around the world. Bleaching events occur as a result of prolonged increases in sea surface temperature, more commonly known as marine heatwaves (Hughes and others, 2017; Lough and others, 2018). Coral reefs typically exist at their upper thermal limits making them vulnerable to pollution, overharvesting, and marine heatwaves (Donovan and others, 2021). As a result, the resistance to bleaching events and subsequent recovery of coral reefs is dependent on other local anthropogenic stressors such as poor water quality, more frequent storms, and coastal development (Donovan and others, 2021; Baum and others, 2023; Gove and others, 2023). Investigating changes to nearshore coral reef habitat is critical to understanding physical and biological processes that influence live coral patterns across space, time, and biological scales. This is especially relevant in the context of more frequent and intense marine heatwaves that will be highly influential in shaping these systems (Mellin and others, 2024).
Coral bleaching events have become increasingly common across the Hawaiian Islands since 1996 (Rodgers and others, 2015). The most significant bleaching event in 2015 (Eakin and others, 2019; Skirving and others, 2019) resulted in catastrophic coral loss state-wide. Bleaching events with less severe effects also occurred in 1998 and 2019 (McCarthy and others, 2024). These repeated events have led marine resource managers to want more information on benthic habitat status and resources.
The National Park Service (NPS) Pacific Island Inventory and Monitoring (I&M) network tracks coral trends at four parks in the Pacific Ocean on fixed diver transects, including at Kaloko-Honokōhau National Historic Park (KAHO) (NHP) on the Kona Coast, which is on the west coast of the Island of Hawaiʻi. The U.S. Geological Survey (USGS) worked with the NPS in the early 2000s (Cochran and others, 2007a, 2007b; Gibbs and others, 2007) to collect geolocated seafloor imagery seafloor imagery to map the seafloor geomorphology and benthic habitats within or adjacent to the national parks on the Kona Coast. The results of this work (Gibbs and others, 2007) provided NPS resource managers with the necessary information to establish permanent monitoring sites in KAHO in 2007, which have increased the understanding of the diversity and spatial patterns of marine benthic habitats in this region.
Several subtidal monitoring programs show that coral cover is in decline along the Kona Coast. I&M surveys at KAHO found a 77-percent loss in coral cover across the NHP during the 2014–15 bleaching event with little to no recovery of nearly all coral species (with the exception of Porites compressa) through 2019 (McCutcheon and McKenna, 2021). Although information regarding benthic habitat change and the consequences of bleaching events at Puʻukoholā Heiau NHS (PUHE) and Puʻuhonua o Hōnaunau NHP (PUHO) is temporally and spatially limited, it is likely that the other Kona Coast National Parks (PUHO and PUHE) were similarly acutely affected by the 2014–15 bleaching event. The National Coral Reef Monitoring Program (reports every 3 years from 2013 to present) reported similar declines in coral cover between 2013 and 2016 to the I&M findings for the entire Kona coastline (National Oceanic and Atmospheric Administration Pacific Islands Fisheries Science Center, 2018). Prior to the 2014–15 bleaching event, the Hawaiʻi Coral Reef Assessment and Monitoring Program (CRAMP; annual reports from between 1999 and 2012) reported significant declines in coral cover at PUHE for shallow and deep sites (Rodgers and others, 2015).
In 2022, the USGS returned to the Kona coastline with the primary objective to acquire and analyze new underwater imagery to quantify benthic habitat changes across nearly 20 years. In this report, we detail, with high spatial coverage, the changes in the distribution of live coral cover and dominant habitat type observed in 2022 relative to the early 2000s.
Study Sites
There are three National Parks situated along the Kona Coast (fig. 1, table 1), including the terrestrial and submerged lands of KAHO and the terrestrial lands of PUHO and PUHE. Zonation of corals along the Kona Coast is divided into four zones across a steep nearshore slope with incremental depth categories defining those zones: 1) boulder zone: 2.5–8 meters (m), 2) bench zone: 6–14 m, 3) slope zone: 14–30 m, and 4) rubble zone: 30–50 m (Dollar, 1975). Each zone is dominated by a particular species of coral and is in different phases of succession. The boulder zone has bottom cover consisting of basaltic boulders with Pocillopora meandrina dominating coral cover. The bench zone is characterized by sloping basalt with Porites lobata growing in lobed and encrusting colonies. The slope zone is covered by Porites compressa, a highly competitive coral species. Storm waves tend to be most destructive in this zone. Some specialized coral species grow on rubble fragments in the rubble zone, but the lack of solid substrate limit coral growth. This zonation pattern along the Kona Coast is inconsistent with more common coral zonation pattern where there is a reef flat, reef crest, and a forereef.
The Kona Coast is considered a low wave-energy coast but can experience wave events in four primary wave patterns including 1) North Pacific swell, 2) Northeast trade wind waves, 3) Kona storm waves, and 4) Southern swell (Gibbs and others, 2007). The primary wave energies that influence the Kona Coast are from the westerly North Pacific swell, Southern swell, and Kona storm waves. Kona storm waves are erratic and infrequent, and the largest waves are from the southwest in the wintertime. The Kona Coast is protected from the effects of the Northeast trade winds by its location on the west coast of the island. It is also partially protected by the other Hawaiian Islands from all but the most westerly of the North Pacific swell.
The Kona Coast has less vertical accretion of carbonate material and reef growth than the rest of the Hawaiian Islands, likely due to a combination of the geologically young age of the surface where corals grow, combined with episodic destruction of coral colonies by storms and transport of carbonate material downslope. Sediment delivery is low along the Kona Coast because of the relatively younger geologic age of the adjacent volcanoes, poor soil development, and low annual rainfall (Gibbs and others, 2007). However, land-sea effects exist on the Kona Coast. Reefs with increased herbivorous fish and fewer land-based influences experienced lower coral mortality and positive recovery after disturbances such as marine heatwaves (Gove and others, 2023).
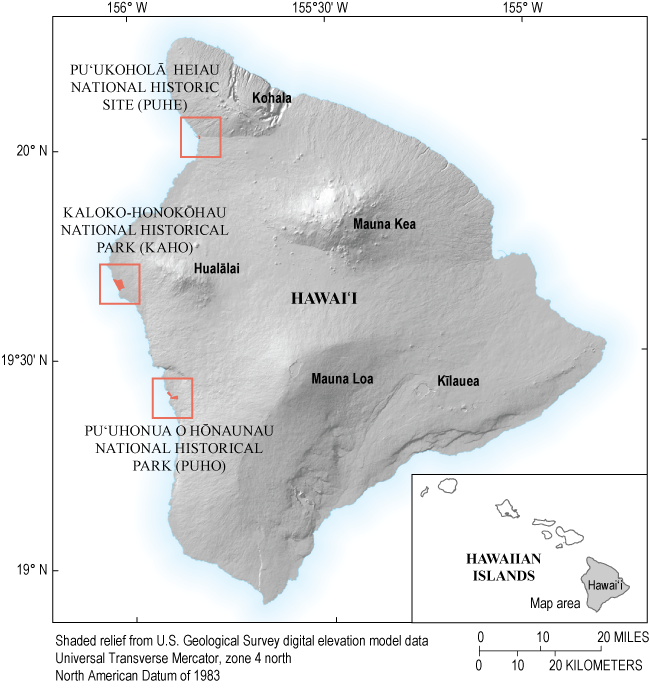
Index map of the Island of Hawaiʻi showing the location of the three National Parks along the Kona Coast. Shaded relief from U.S. Geological Survey digital data.
Table 1.
Kona Coast attributes by park.[Mean depth was determined from the depths of all image locations by park. °, degree; m, meter; PUHE, Puʻukoholā Heiau National Historic Site; KAHO, Kaloko-Honokōhau National Historic Park; PUHO, Puʻuhonua o Hōnaunau National Historic Park]
Puʻukoholā Heiau National Historic Site
The mapping efforts at PUHE focused on the benthic habitats of the waters offshore of PUHE (fig. 2) and excluded inside the Kawaihae Harbor. PUHE boundaries do not officially extend into the marine environment; however, effects downslope of any activity in PUHE are of concern to NPS management (personal communication). The area of Kawaihae Bay mapped by USGS extends from the north edge of Kawaihae Harbor approximately 3.5 kilometers south to the north edge of the Mauna Kea Golf Course and Beach Resort at Waikoloa, and from the shoreline to depths of approximately 40 m below local mean sea level (LMSL) where the fore reef drops off to the sandy shelf.
PUHE is located within the Kawaihae watershed, which contributes approximately 75 percent of the drainage in the northern portion of the study area. The Waikoloa and Waiulaula watersheds contribute approximately 25 percent of the drainage in the southern portion of the study area (Cochran and others, 2007b). Drainages from these watersheds are responsible for the increased input of sediment and urban runoff relative to other unpopulated areas of the island (Gove and others, 2023).
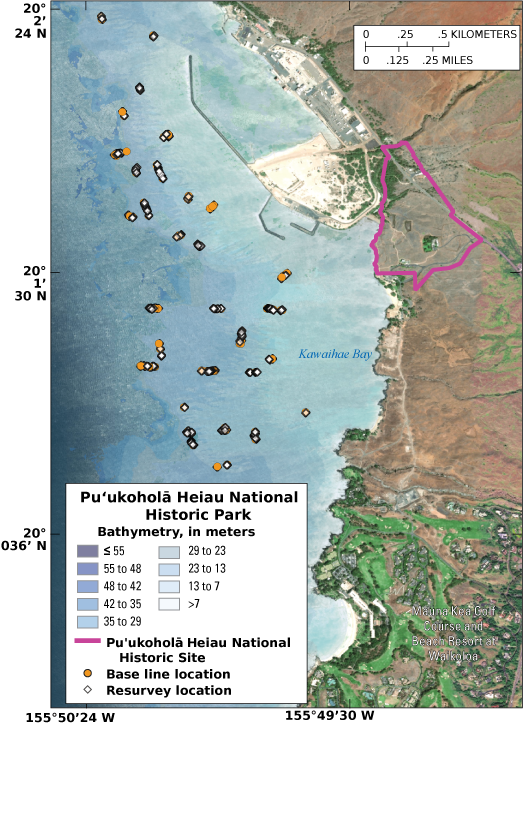
Satellite map overlaid with Office for Coastal Management [OCM] Partners (2022) light detection and ranging (lidar) derived depths (in meters) and locations of baseline and resurvey imagery within the Puʻukoholā Heiau National Historic Site area. Base imagery from QGIS and its licensors.
Kaloko-Honokōhau National Historic Park
The only park on the Kona Coast that includes submerged lands and marine resources within its official boundaries is KAHO (fig. 3). KAHO was established in 1978 and is 1,160 acres in size, including 596 acres of marine area. As of 2025, only a portion of the park has been acquired by the NPS, with the remaining acreage either held privately or by the State of Hawaii Department of Land and Natural Resources Division of Aquatic Resources. KAHO is bordered on the south by the Honokōhau small-boat harbor and on the north by residential homes, a resort, and a golf course.
Although the zonation and community structure transitions described above are evident in KAHO, the seafloor morphology in the park is more complex than along much of the Kona Coast. The mid shelf cliffs, the semi-protected environments provided by the pinnacles off Kaloko Fishpond, and the embayed coastline close to the harbor support localized coral ecosystems that are unique to KAHO. The highest coral covers are generally off the harbor mouth and Kaloko Fishpond (Gibbs and others, 2007).
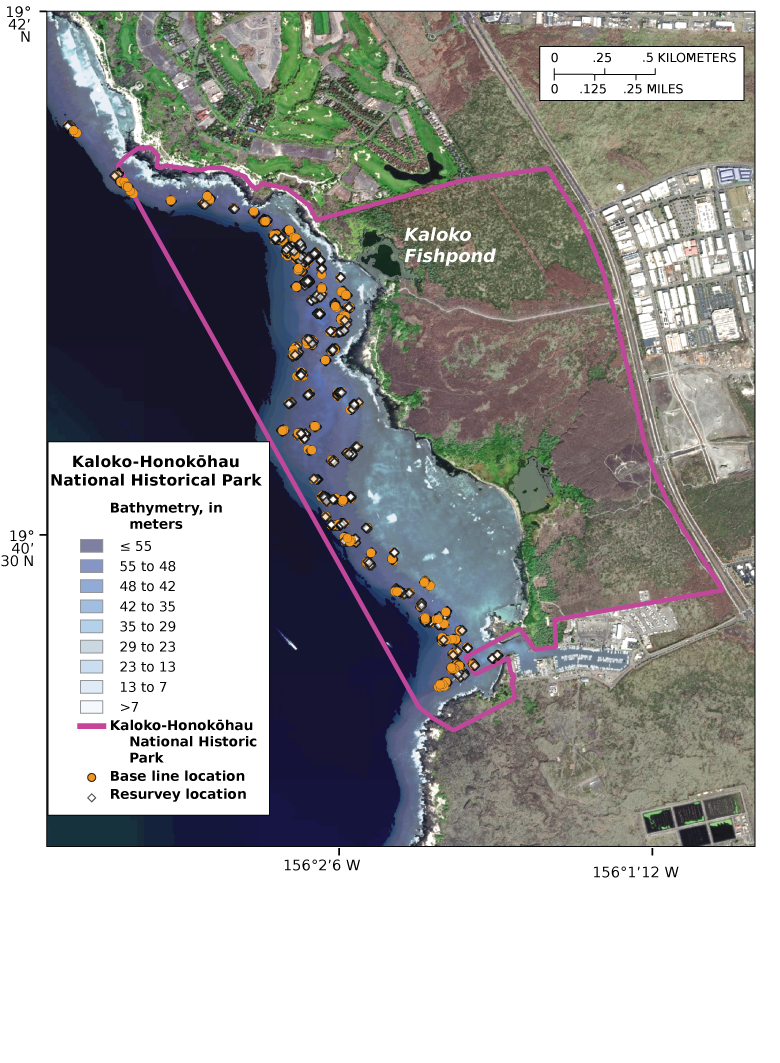
Satellite map overlaid with Office for Coastal Management [OCM] Partners (2022) light detection and ranging (lidar) derived depths (in meters) and locations of baseline and resurvey imagery within the Kaloko-Honokōhau National Historic Park area. Base imagery from QGIS and its licensors.
Puʻuhonua o Hōnaunau National Historic Park
The area mapped for PUHO extends from Mīana Point around Puʻuhonua Point to Kiʻilae Bay and past the southern park boundary (fig. 4). PUHO park boundaries do not officially extend into the marine environment; however, effects downslope of any activity in PUHO are of concern to management (personal communication). PUHO lies within the nearly 850-square-kilometer Kiʻilae watershed, which begins at the crest of Mauna Loa (Cochran and others, 2007a). The Kiʻilae Watercourse runs through the southern area of the park and empties into Kiʻilae Bay, but only during periods of extreme rainfall.
PUHO experiences the lowest land-based effects of all three of the parks (Gove and others, 2023), though groundwater flow may be of concern (Cochran and others, 2007a).
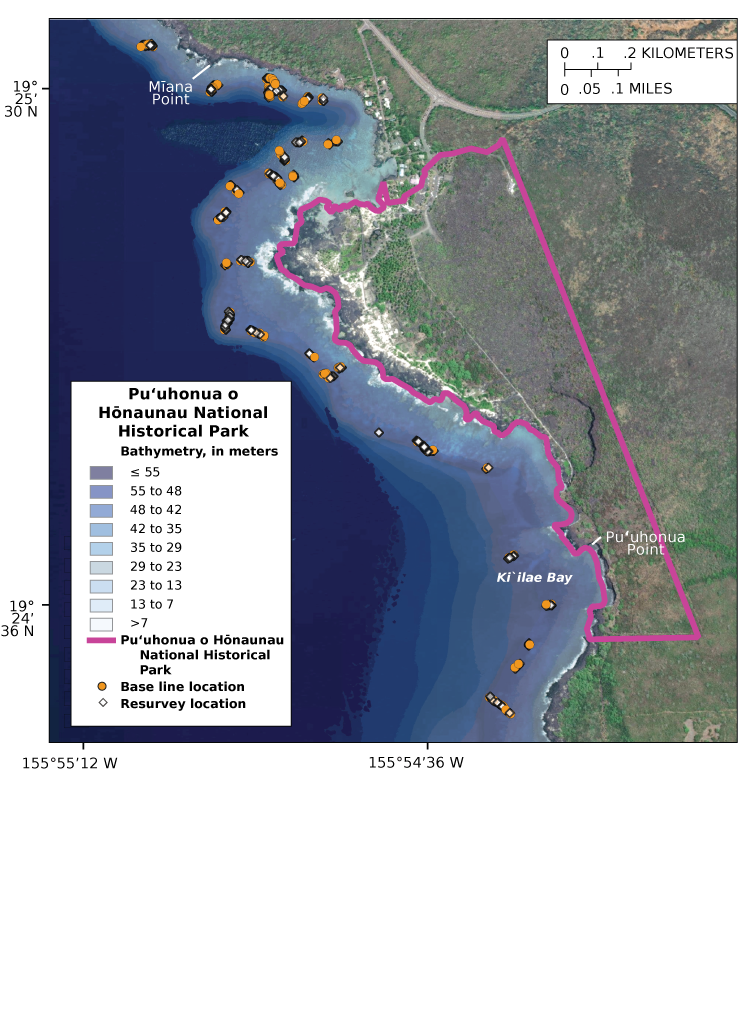
Satellite map overlaid with light detection and ranging (lidar) derived depths (in meters) and locations of baseline and resurvey imagery within the Puʻuhonua o Hōnaunau National Historic Park area. Base imagery from QGIS and its licensors.
Methods
Reef Surveys
The Kona Coast baseline and resurvey mapping efforts were conducted from the Research Vessel Alyce C, a 32-foot vessel operated by Captain Joe Reich of Molokaʻi, Hawaii.
Baseline Imagery Collection
Baseline underwater imagery for this study were acquired during three field activities conducted by the USGS in 2003 and 2004 (activity IDs A-803-HW, A-204-HW, and A-604-HW), as part of a benthic habitat mapping project done in collaboration with NPS (Cochran and others, 2007a, 2007b; Gibbs and others, 2007).
Georeferenced underwater video was collected along single pass transects distributed throughout the offshore portions of each of the three Kona Coast parks using an underwater standard definition (640 by 480 resolution) video camera illuminated with a light-emitting diode ring designed by SeaViewer Underwater Video Systems. The camera was mounted on a small aluminum hand-deployed frame with a rear-mounted plastic fin. Time, date, location, and ship speed were overlaid on the video using the Sea-Trak global positioning system (GPS) method developed by SeaViewer Cameras, Incorporated. Geographic positioning was obtained using a wide area augmentation system (WAAS) enabled Garmin GPS76 receiver. The stated horizontal accuracy of the Garmin GSP76 is less than 3 m when receiving WAAS corrections.
Video imagery was acquired either by towing the camera along transects while underway (towed video) or by lowering the camera near the seafloor at a given location while drifting slowly (drop camera). Still images were acquired from the videos by sampling one frame every 10 seconds using an automated routine in the Media Mapper software package. The software recorded the GPS coordinates for the resulting images in the image Exif headers. The resulting set of georeferenced images was used for the baseline classifications. The original image set contains 10,229 640- by 480-pixel resolution images of the seafloor from varying heights above the seafloor and from various orientations ranging from oblique to downward looking driven by currents and drag on the camera while the boat was underway.
Positional accuracy and uncertainty varied for baseline imagery collection depending on the method used. The uncertainty of towed video was tens of meters, especially in deeper water where the angle of the cable to the camera was greater than in shallow water. Drop camera imagery had estimated uncertainties of around 5 m from the position of the GPS antenna. The final dataset used for this study was predominantly composed of imagery obtained from towed video (1,512 images from towed video, 112 images from drop camera imagery).
Resurvey Imagery Collection
Resurvey underwater imagery was acquired during a single field activity conducted by the USGS in 2022 (USGS activity ID 2022-615-FA) to investigate changes to the nearshore benthic habitat relative to baseline surveys conducted in 2003 and 2004. A total of 146 sites were resurveyed across all three parks. Sites for resurvey were selected based on where coral cover was observed in the baseline surveys. Imagery was acquired at each site while drifting by lowering the camera to 1 to 2 m above the seafloor at each site. The length of the site transects were similar in length to the baseline survey transect lengths because the goal was to “resurvey” the baseline sites.
The underwater image collection system was comprised of three major components. First, a pole-mounted, downward facing digital camera clamped to the side of the surface vessel which extended approximately 1 m below and above the water surface. A global navigation satellite system (GNSS) antenna was fixed at the top of the pole above the downward facing camera and remained approximately 1 m above the water surface to provide accurate image capture locations. Second, a tethered drop-camera system was lowered below the vessel and held roughly 1–3 m above the seabed (fig. 5). Third, a data acquisition and control system was located in the weather protected space of the surface vessel and operated in real-time to maintain image quality by adjusting camera collection rate, exposure, and gain settings of both cameras. The data acquisition system provided real-time position information via a local area network to a separate laptop located on the flying bridge to assist with navigation in the context of the previous survey and planned resurvey locations.
The surface camera was a 12.3-megapixel machine vision camera with a global shutter and a 2.8-centimeter (cm) sensor. The camera was made by Teledyne FLIR (model #BFS-PGE-122S6C-C). The lens used was a manual focus computer (model #V12280MPY) 12-millimeter (mm) focal length, which is approximately equivalent to a 30-mm focal length full frame (35-mm) camera lens. The lens was fixed at f-stop 5.6. The purpose of the surface camera was to collect larger area imagery coincident with the drop camera to facilitate estimating the extent of and continuity of features imaged at close range with the drop camera. The surface camera was designed with a slightly longer focal length lens and higher pixel count than the drop camera so the ground sample distance (amount of seabed imaged per pixel) would be more closely comparable to the drop camera.
The drop camera was a 5.0 MP machine vision camera with a global shutter and a 1.7-cm sensor. The camera was made by Teledyne FLIR (model #BFS-PGE-50S5C-C). The lens used was a manual focus Fujinon (model #HF6XA-5M) 6-mm focal length, which is approximately equivalent to a 23-mm focal length full frame (35-mm) camera lens. The lens was fixed at f-stop 5.6. The drop camera package was tethered to the surface with a sea-cable that provided unlimited power and enabled real-time camera control and image data transfer. In addition to the camera, the subsurface package included dual Ikelite DS160 light-emitting diode strobes modified to accept external power and were included to improve color rendering and image exposure with the limited natural light available at depth. A Tritech PA500 precision altimeter was mounted on the drop camera to measure and display the height above the seafloor to assist with our attempt to maintain a relatively consistent height above the reef.
The drop- and surface-camera housings were designed with identical 50-mm diameter dome windows made from 5-mm-thick optical quality BK7 glass. In both cases, the cameras were rigidly mounted longitudinally in alignment with the long axis of the housings and adjusted fore and aft so that the entrance pupil of the lens aligned with the dome window radius of curvature. This provided the maximum depth of focus and minimized distortion away from image center.
The surface acquisition system included a Trimble R7 GNSS, an electronics interface box that provided power and network communication to the drop camera, a hand reel which incorporated a slip ring for the drop camera tether, and a computer system on which two instances of custom acquisition software were run concurrently to control and acquire images from the two cameras and record the associated GNSS position and precise Coordinated Universal Time (UTC) time at the instant of image capture from either system. Image acquisition frequency was typically set on both cameras to record at a rate of one image every 2 seconds.
The GNSS data for the imagery were post-processed using nearby GNSS base stations from the National Park Service real-time GNSS network. The North American Datum of 1983 (NAD83) ellipsoid heights for the GNSS positions were transformed to orthometric heights referenced to LMSL using the National Geodetic Survey GEOID12B. Precise positions were derived for each image using the GNSS-synchronized image acquisition times and were written into the image Exif headers. Orthometric heights for the imagery from the boat-mounted camera were calculated using the 2.005-m fixed vertical offset between the GNSS antenna and the camera lens. Vertical positions were not recorded for the towed camera imagery; instead, the vertical measurements to the seabed from the camera-mounted altimeter were recorded in the image Exif tags.
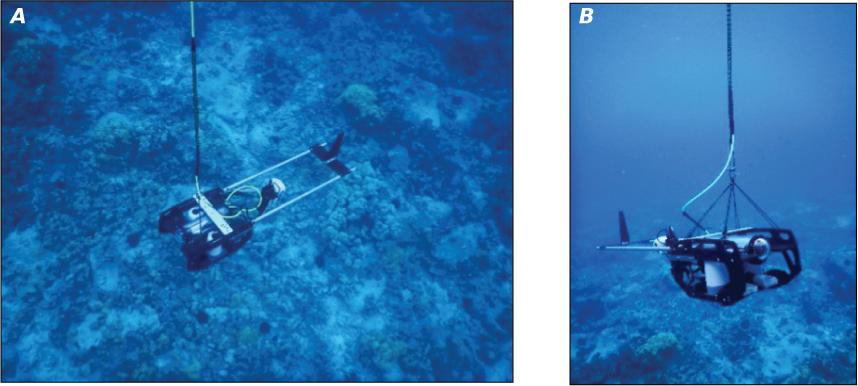
U.S. Geological Survey photographs of the tethered drop-camera system. A, Camera system lowered below the vessel. B, Camera system held roughly 1–3 meters above the seabed.
Image Analysis
Sub-Selection of Underwater Imagery for Classification
Images from the baseline and resurvey datasets were subsampled to facilitate comparable classification of the images. For the baseline data, still frames from the underwater video were created by sampling one frame every 10 seconds using an automated routine in the Media Mapper software package. These baseline images were further subsampled by targeting selected sites where coral cover was previously observed (n=1,621; Cochran and others, 2007a, 2007b; Gibbs and others, 2007) but does not fully exclude other predominant benthic habitat types such as sand and volcanic pavement. For the resurvey data, to ensure a more consistent comparison with the baseline imagery, images from the surface camera were excluded from classifications and only the images from the resurvey drop camera system were used. The images were subsampled to select one image every 10 seconds as an initial step to reduce the large number of images from the same location. The resurvey images were further sub-sampled by only keeping images with GPS positions within a 5-m radius of a baseline image location. Finally, if multiple resurvey images fell within a 2-m grid space, only a single image was kept for classification (n=3,332).
Image Classification Platform
Percent live coral cover (referred to hence forth as “coral cover”) and dominant bottom type classifications of selected baseline and resurvey imagery were performed manually by a single specialist with a background in ecological studies. The open-source software, Label Studio version 1.4 (Tkachenko and others, 2020), was used to enable efficient classification of the baseline and resurvey images using a custom, two-variable classification scheme for live coral cover and dominant bottom type (described in more detail in the “Image Classification of Live Coral Cover” section). The software provided the functionality to sequentially display each image to the specialist and allowed for the use of keyboard hot keys to rapidly assign classification labels to each image. At the end of each classification session, a tabulated comma delimited text file was generated containing the image filenames, geographic coordinates, and classification labels, which were then imported to Python for data analysis.
Image Classification of Live Coral Cover
Coral cover is a commonly measured attribute of coral community composition and was the primary metric used to assess change in coral abundance at the Kona Coast parks. Coral cover was determined visually by assessing the live coral cover as a fraction of total coral (live and dead) cover in each image relative to reference diagrams of percent cover after Terry and Chilingar (1955). Cover estimates were made in multiples of 10 from 0 to 100 percent. A total of 4,282 baseline and resurvey images were visually classified for percent cover. A total of 783, 2,798, and 701 images were classified for PUHE, KAHO, and PUHO, respectively. The classified baseline and resurvey images and associated classifications are available in a USGS data repository (Logan and others, 2025).
The baseline and resurvey imagery differed in resolution, field of view, and camera orientations at each site. This unavoidably resulted in differing image footprints and scales between the surveys, meaning we were unable to ensure the same amount of reef area was covered and analyzed between sampling periods. To mitigate this, we averaged the coral cover by site before determining change in coral cover. We also relied on park-wide density distributions of coral to assess larger scale change.
Image Classification of Dominant Bottom Type
A total of eight coral and non-coral categories were used to classify the dominant bottom type of the imagery. Each image was only assigned one dominant bottom type class (fig. 6). Coral dominant bottom type categories were selected based on the most common coral species occurring along the Kona Coast and included Montipora capitata, Pocillopora meandrina, Porites compressa, and Porites lobata. We distinctly classified P. compressa (finger coral) and P. lobata (lobe coral), but because of morphological genus it is possible that corals classified as either may have similarities across the different Porites species.
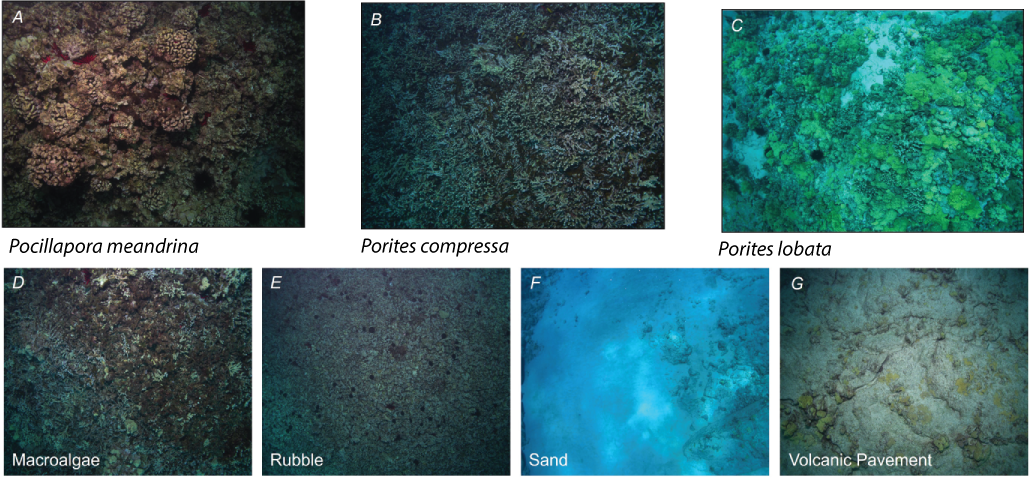
Images of classified coral and non-coral dominant bottom types from resurvey imagery. A, Pocillapora meandrina. B, Porites compressa. C, Porites lobata. D, Macroalgae. E, Rubble. F, Sand. G, Volcanic pavement.
The non-coral dominant bottom type categories were macroalgae, coral rubble, sand, and volcanic pavement. The non-coral categories were selected based on 1) what common benthic habitat classes were previously classified at the three parks (for instance, sand and volcanic pavement; Cochran and others, 2007a, 2007b; Gibbs and others, 2007), and 2) the hypothesis that reef composition shifts from coral to non-coral cover after coral bleaching events. We hypothesized that macroalgae occurrence would increase between the two survey periods due to a coral-macroalgal phase shift that often occurs following bleaching events (Fukunaga and others, 2022). Furthermore, we hypothesized that coral rubble would increase in occurrence as bleaching events produce dead and bleached coral that can then break down and produce rubble.
A total of 2,047 images were assigned one of the 8 above dominant bottom type classifications and 2,235 images were assigned an “Unknown” dominant type classification (table 2).
Quantifying Change
Percent Live Coral Cover
Change in live coral cover for each park and site was determined by:
where
is the percent change of live coral cover,
is the mean resurvey coral cover, and
is the mean baseline coral cover.
Sites that did not have at least two images classified for the baseline and resurvey were excluded from the coral change analysis (PUHE: 2 sites; KAHO: 6 sites; PUHO: 4 sites).
Dominant Bottom Type
Because of the uneven distribution of the number of images within each dominant bottom type category (table 2), all eight dominant types were aggregated by park into either coral or non-coral prior to calculating percent change of these two groups by:
where
is the percent change of aggregated coral,
is the percent change of non-coral dominant types,
is the proportions of coral () classifications to the total classifications calculated for both the baseline ( and ) and resurvey ( and ), and
are the proportions of non-coral () classifications to the total classifications calculated for both the baseline ( and ) and resurvey ( and ).
Unknown classifications were not included in the total number of classifications.
Percent change of individual dominant bottom types was also calculated, but M. capitata, macroalgae and volcanic pavement were excluded from the results because of low sample size (less than n=5) in either one or both survey periods (table 2).
Elevation Data
Elevation data were extracted for each baseline and resurvey image location from the U.S. Army Corp of Engineers National Coastal Mapping Program topobathy light detection and radar (lidar) data collected in 2013 for the Island of Hawaiʻi (Office for Coastal Management [OCM] Partners, 2022). The digital elevation model (DEM) data were derived from lidar data that were adjusted to LMSL with a spatial resolution of 1 m. Elevation data are relative to LMSL, and negative elevations were converted to positive depth values to examine patterns of coral cover and live coral cover change.
Water depth has been determined to be an important driver of recovery and predictor of ecosystem trajectory (Graham and others, 2015). To understand if baseline and resurvey coral cover differed in their water depth dependent patterns, we compared 10-m binned water depth density distributions of coral between the two survey (early 2000s baseline survey and 2022 resurvey) periods. We also evaluated the influence of water depth as a driver of coral change by applying least squares regression analysis to water depth and live coral cover change at each park.
Results
General Patterns of Coral Cover and Other Dominant Types
A decrease in coral cover was observed across all three Kona Coast parks. PUHE experienced the greatest decrease of 61.6 percent, followed by PUHO with a decrease of 52.2 percent, and KAHO with a decrease of 11.7 percent (fig. 7A; table 3). Site variability of coral cover was high in the baseline and resurvey (figs. 7B, 7C; appendix 1; figs. 1.1, 1.2, 1.3; tables 1.1, 1.2, 1.3), indicating high spatial variability of coral cover. Despite this high spatial variability, distinct patterns of coral cover loss were evident, especially at PUHE and PUHO.
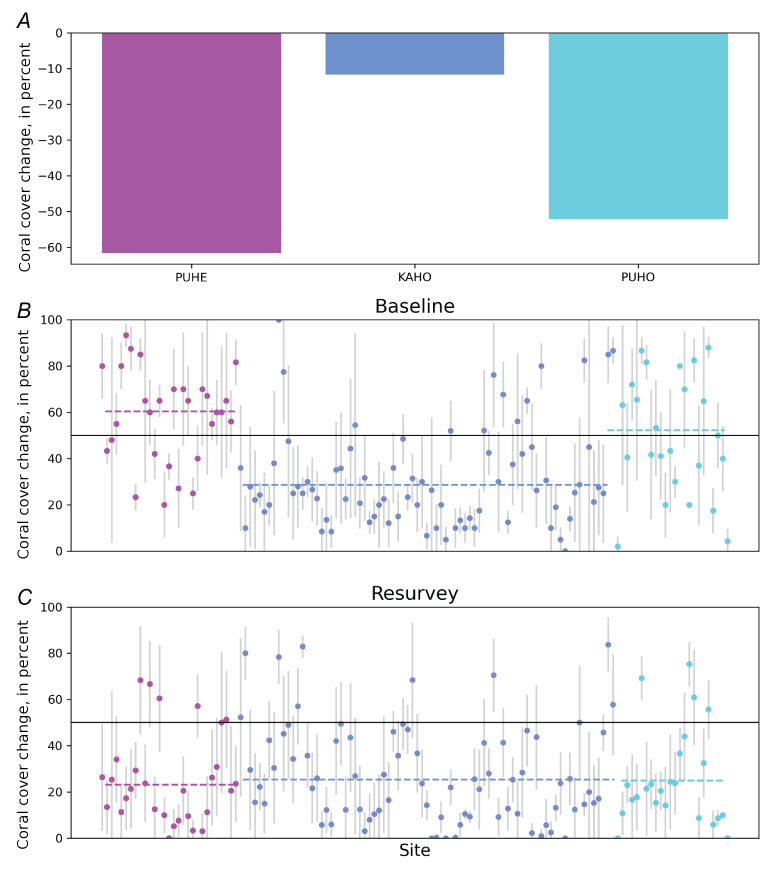
Graphs depicting coral cover depending on the park. A, Bar plot of mean coral cover change for each Kona Coast park (Puʻukoholā Heiau National Historic Site [PUHE], Kaloko-Honokōhau National Historic Park [KAHO], and Puʻuhonua o Hōnaunau National Historic Park [PUHO]). B, Mean baseline coral cover, colored by park. C, Mean resurvey coral cover, colored by park. Vertical gray lines represent the standard deviation of the coral cover for each site. Colored horizontal dashed lines represent the mean baseline and resurvey coral cover, separated by park. Solid black horizontal line indicates 50 percent coral cover (B and C).
Table 2.
A summary of the number of assigned classifications for each dominant bottom type category, unknown category, and the total number of known classifications for each survey type at each of the three Kona Coast parks.[PC, proportion of all aggregated coral types; PN, proportion of non-coral types; PUHE, Puʻukoholā Heiau National Historic Site; BL, baseline; RS, resurvey; KAHO, Kaloko-Honokōhau National Historic Park; PUHO, Puʻuhonua o Hōnaunau National Historic Park]
Table 3.
Percent change of live coral cover, percent change of coral dominant types, percent change of non-coral dominant types, and percent change of dominant bottom types with greater than five samples by park.[%, percent; Δ, change in; PUHE, Puʻukoholā Heiau National Historic Site; —, no data; KAHO, Kaloko-Honokōhau National Historic Park; PUHO, Puʻuhonua o Hōnaunau National Historic Park]
Table 4.
Baseline (BL) and resurvey (RS) percent live coral cover statistics including mean and standard deviation of percent live coral cover, and median of percent live coral cover.[%, percent; PUHE, Puʻukoholā Heiau National Historic Site; KAHO, Kaloko-Honokōhau National Historic Park; PUHO, Puʻuhonua o Hōnaunau National Historic Park]
Puʻukoholā Heiau National Historic Site
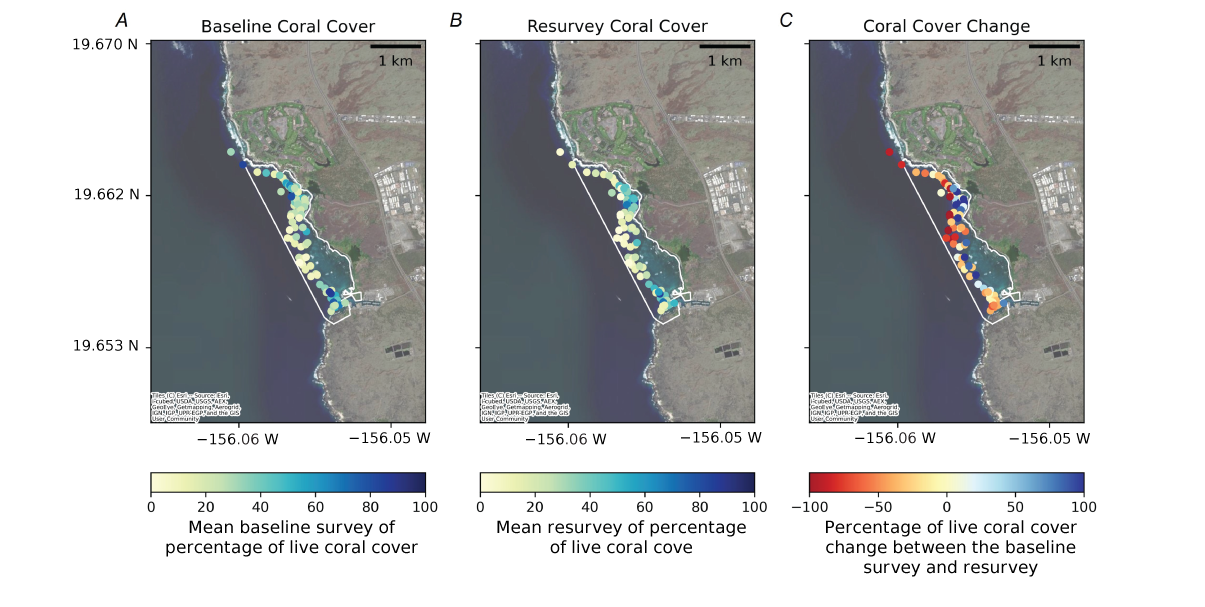
The mean coral cover of PUHE was 60.4 plus or minus (±) 25.2 percent and 23.2±24.5 percent in the baseline and resurvey periods, respectively (table 4; fig. 7). There were no obvious spatial patterns of live coral cover or coral cover change between the baseline and resurvey (fig. 8). There was widespread decrease in live coral cover (park mean= −61.6 percent; table 3; figs. 7, 8), although there were three sites where positive changes in live coral cover were observed (fig. 8C).
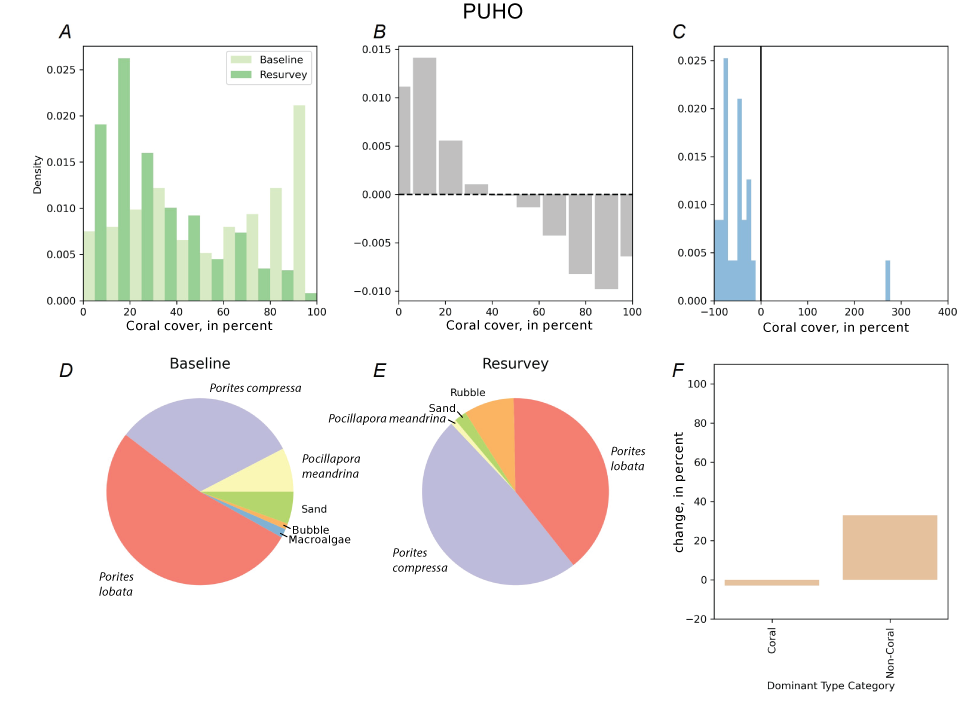
The occurrence of coral cover between 0 and 40 percent increased, whereas the occurrence of coral cover greater than 40 percent decreased at PUHE between the baseline and resurvey periods (figs. 9A, 9B). Most of the site-specific coral cover change was negative, with a strong bias towards 100-percent loss in the distribution curve of percent change (fig. 9C).
Coral types were classified as the dominant type in 90.4 percent of the baseline imagery (table 2; fig. 9). P. compressa was the most common coral type, comprising 55.7 percent of the known dominant type classifications. P. lobata was also relatively common, making up 34.8-percent of the known baseline classifications. The most common non-coral type was sand. In the resurvey, coral types were classified as the dominant type in 80.4 percent and non-coral types were classified in 19.6 percent of the images. Again, P. compressa and P. lobata were the most common coral types in the resurvey at 53.6 percent and 26.0 percent, respectively. Sand continued to be the most common non-coral type, whereas rubble increased between the baseline (0 percent) and resurvey (7.0 percent).
PUHE experienced the greatest increase in non-coral of the three parks (105.2 percent; table 3; fig. 9F), and the greatest decrease of coral (−1.1 percent). This pattern was driven by an increase in the proportion of sand and rubble classification and a decrease in the proportion of P. lobata.
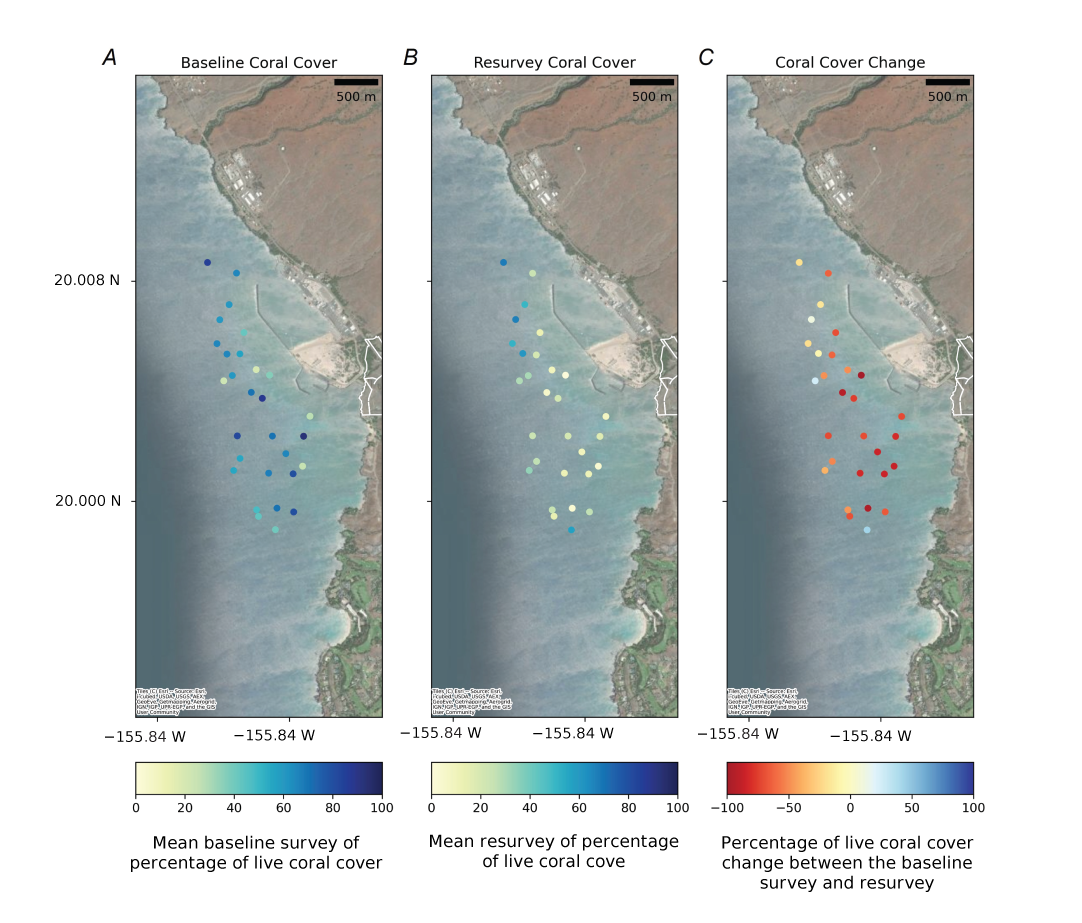
Maps of spatial patterns of live coral cover and change by site at Puʻukoholā Heiau National Historic Site. A, Mean baseline survey of percentage of live coral cover (). B, Mean resurvey of percentage of live coral cover (). C, Percent change of live coral cover () between the baseline and resurvey. Park boundaries are represented in white. Base imagery from Esri and its licensors.
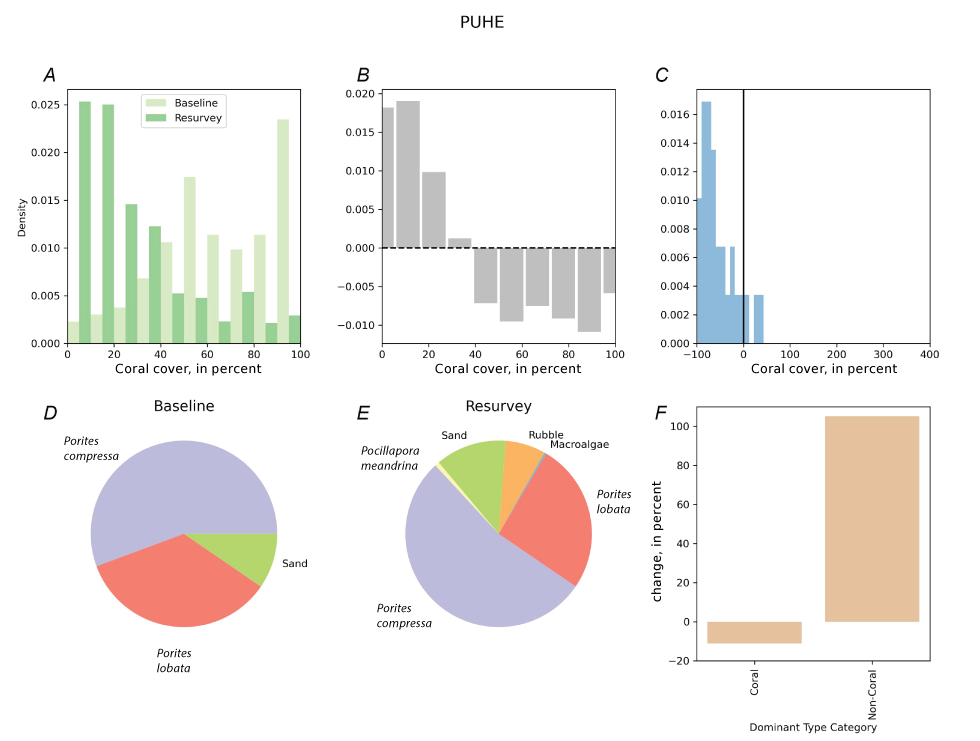
Graphs showing park trends of percent baseline, resurvey, and change of live coral cover and dominant types for Puʻukoholā Heiau National Historic Site. A, Density distribution of percentage of baseline and resurvey coral cover. B, Bar graph showing the difference in baseline and resurvey density distributions (resurvey minus baseline). C, Density distribution of live coral cover (). D, Pie chart of the eight dominant bottom types in the baseline imagery (n equals 115). E, Pie chart of the eight dominant bottom types in the resurvey imagery (n equals 642). F, Bar graph showing the change of coral () and non-coral () dominant types.
Kaloko-Honokōhau National Historic Park
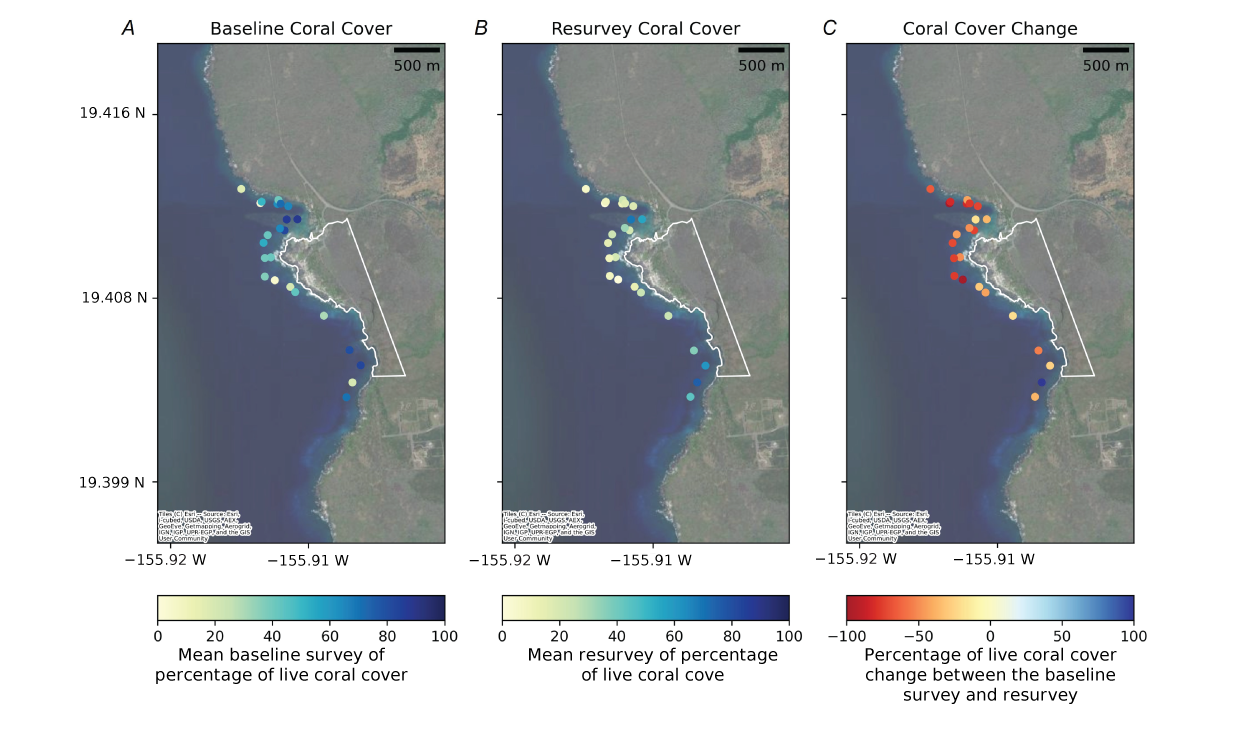
The mean percent live coral cover at KAHO was 28.7±24.9 percent and 25.3±24.7 percent for the baseline and resurvey periods, respectively (table 4; figs. 7, 10A, 10B). The variability of coral cover was higher at KAHO than PUHE and PUHO. In both the baseline and resurvey, the highest percent coral cover was found adjacent to Kaloko Fishpond and near the northern end of the park (fig. 10).
Live coral cover in KAHO decreased by 11.7 percent between the baseline and resurvey (table 3). Despite this loss, there were sites where an increase in coral cover was observed (fig. 10C), including many of the sites adjacent to Kaloko Fishpond and around the harbor. This positive change in coral cover was also reflected in the change of coral and non-coral types, where non-coral types decreased by 16.8 percent and coral types increased 22.3 percent (table 3).
Though there were similar distributions of coral cover between the baseline and resurvey periods at KAHO (fig. 11A), the lowest coral cover bin (0 to 10 percent) showed the greatest increase in occurrences, whereas coral cover bins with percentages greater than 10 percent varied in gains or losses (fig. 11B). Most of the site-specific coral cover change was negative, with a strong bias towards 100-percent loss in the distribution curve of percent change (fig. 11C). The distribution of coral change at KAHO was more weighted towards positive change than PUHE and PUHO with the tail of the distribution extending to gains of 400-percent (fig. 11C). These large gains in cover were relatively rare (n=2) and may be driven by high uncertainties in the locational data of the baseline imagery or the heterogeneity of coral cover of a particular site.
KAHO was more characteristic of lower coral cover in the baseline and resurvey periods as evidenced by a higher proportion of non-coral type classifications (table 2; figs. 11D–F). The most common dominant bottom type in the baseline survey was sand (37 percent), but rubble was significantly more common at KAHO than the other two parks across both surveys. In the resurvey, the occurrence of coral and non-coral types was nearly equal with corals comprising 52.5 percent and non-coral types comprising 47.4 percent of the images. P. lobata was the most common coral type in both survey periods. KAHO was the only site where positive change of coral types and negative change of non-coral types was observed (table 3; fig. 11F).
Three maps of spatial patterns of live coral cover and change by site at Kaloko-Honokōhau National Historic Park. A, Mean baseline survey of percentage of live coral cover (). B, Mean resurvey of percentage of live coral cover (). C, Percentage of live coral cover change () between the baseline and resurvey. Park boundaries are represented in white. Base imagery from Esri and its licensors.
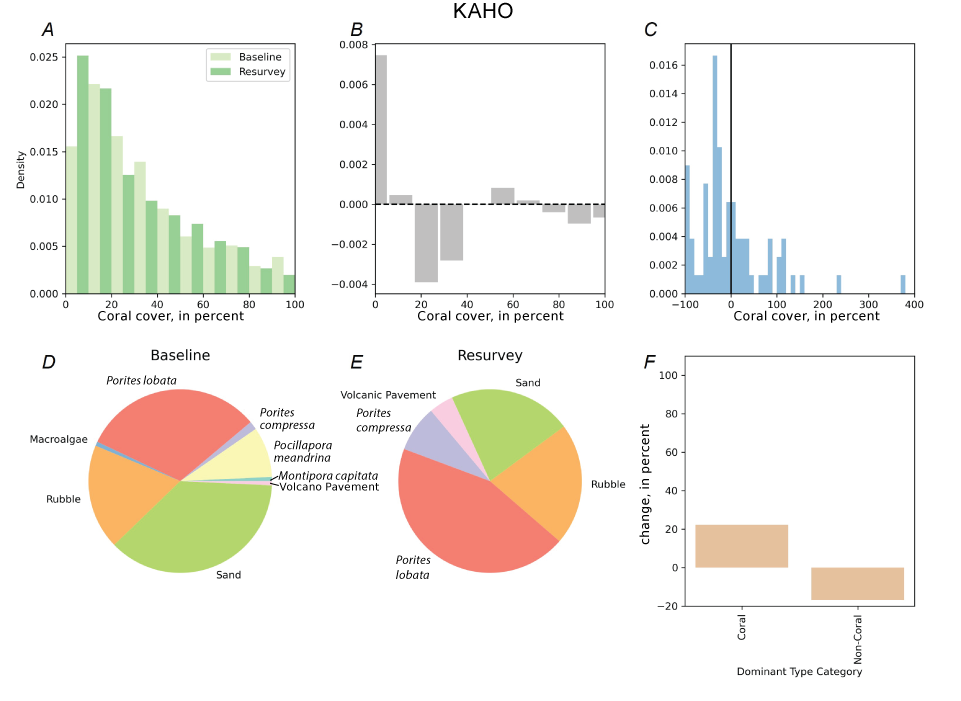
Graphs showing park trends of percent baseline, resurvey, and change of live coral cover and dominant types for Kaloko-Honokōhau National Historic Park. A, Density distribution of percentage of baseline and resurvey coral cover. B, Difference in baseline and resurvey density distributions (resurvey minus baseline). C, Density distribution of live coral cover (). D, Pie chart of the eight dominant bottom types in the baseline imagery (n equals 135). E, Pie chart of the eight dominant bottom types in the resurvey imagery (n equals 512). F, Change of coral () and non-coral () dominant types.
Puʻuhonua o Hōnaunau National Historic Park
The mean percent live coral cover at PUHO was 52.3±31.5 percent and 25.0±23.0 percent in the baseline and resurvey periods, respectively (table 4; figs. 7, 12). Live coral cover decreased by 52.2 percent between the baseline and resurvey (table 3; figs. 7, 12). Generally, live coral cover decreased across the entire park (fig. 12C).
Like PUHE, the occurrence of coral cover between 0 and 40 percent increased, whereas the occurrence of coral cover more than 50 percent decreased at PUHO (figs. 13A, 13B). Most of the site-specific coral cover change was negative, with a strong bias towards 100 percent loss in the distribution curve of percent change (fig. 13C). Despite overwhelming negative coral change across the park, there were some sites that experienced positive change in live coral cover.
Coral types were classified as the dominant type in 91.2 percent of the baseline images at PUHO (table 2; fig. 13). For the baseline survey, P. lobata was the most common bottom type (52.3 percent), followed by P. compressa (32.0 percent). Non-coral types were classified as the dominant type in 6.6 percent of the baseline images. In the resurvey, coral types were classified in 89.2 percent of the images and non-coral in 10.8 percent. P. compressa was the most common dominant bottom type in the resurvey (47.9 percent); however, P. lobata was still relatively common (40.7 percent). Rubble increased from 1.0 percent of all classified dominant bottom types to 8.7 percent (a nearly 800-percent change) between the baseline and resurvey.
Three maps of spatial patterns of live coral cover and change by site at Puʻuhonua o Hōnaunau National Historic Park. A, Mean baseline survey of percentage of live coral cover (). B, Mean resurvey of percentage of live coral cover (). C, Percentage of live coral cover change () between baseline and resurvey. Park boundaries are represented in white. Base imagery from Esri and its licensors.
Graphs showing park trends of percent baseline, resurvey, and change of live coral cover and dominant types for Puʻuhonua o Hōnaunau National Historic Park. A, Density distribution of percentage of baseline and resurvey coral cover. B, Difference in baseline and resurvey density distributions (resurvey minus baseline). C, Density distribution of live coral cover change (). D, Pie chart of the eight dominant bottom types in the baseline imagery (n equals 197). E, Pie chart of the eight dominant bottom types in the resurvey imagery (n equals 426). F, Change of coral () and non-coral () dominant types.
Depth Associated Patterns of Coral
Overall, the patterns of coral cover, live coral change, and dominant type were not found to be strongly associated with depth. PUHE sites were the shallowest site on average (mean depth=11±5.9 m), followed by KAHO (mean=14.2±5.6 m) and then PUHO (mean=15.1±4.8 m).
Depth Distributions of Live Coral Cover
The depth distribution of coral cover bins demonstrated high variability between the baseline and resurvey periods across all three parks (fig. 14). However, high percent cover bins became more concentrated at mid-depths (20 to 15 m) in the resurvey, especially at PUHE and PUHO.
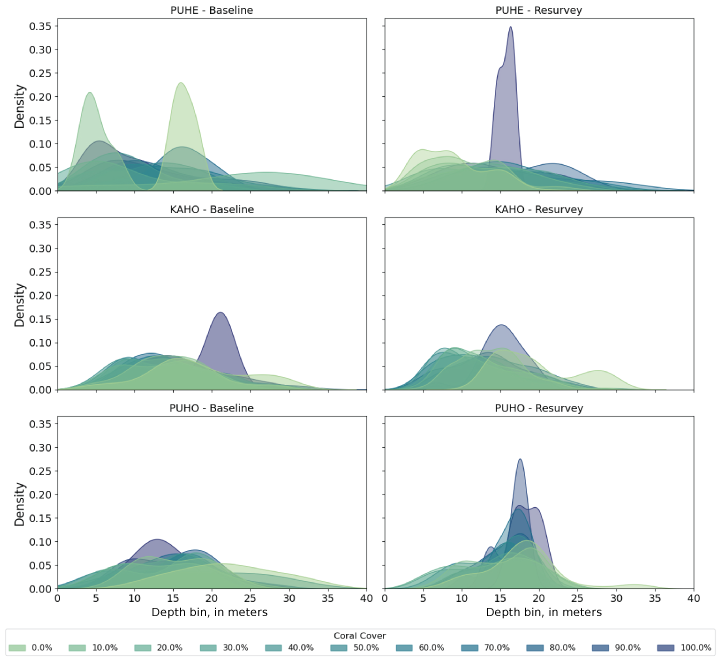
Plot of density distribution of 10 percent coral cover classes at depth bins at Puʻukoholā Heiau National Historic Site (PUHE), Kaloko-Honokōhau National Historic Park (KAHO), and Puʻuhonua o Hōnaunau National Historic Park (PUHO) from baseline (A, C, E) and resurvey (B, D, F) imagery classifications. Histograms do not have a common normalization.
Depth Related Associations of Live Coral Cover Change
Water depth had moderate or little influence on changes in live coral cover across all three parks (fig. 14). The relation between live coral cover change and water depth was significant at all three parks (probability value less than 0.005), but the relations were corroborated by low correlation values (R2<0.2), especially at KAHO and PUHO. At KAHO, increases in coral cover up to 400 percent were observed at certain sites. PUHE exhibited the strongest relation between coral change and depth (correlation value=0.48), where live coral cover loss was pronounced at shallower depths. However, the opposite was observed at KAHO, where coral loss was pronounced at deeper depths and large gains occurred at shallow depths.
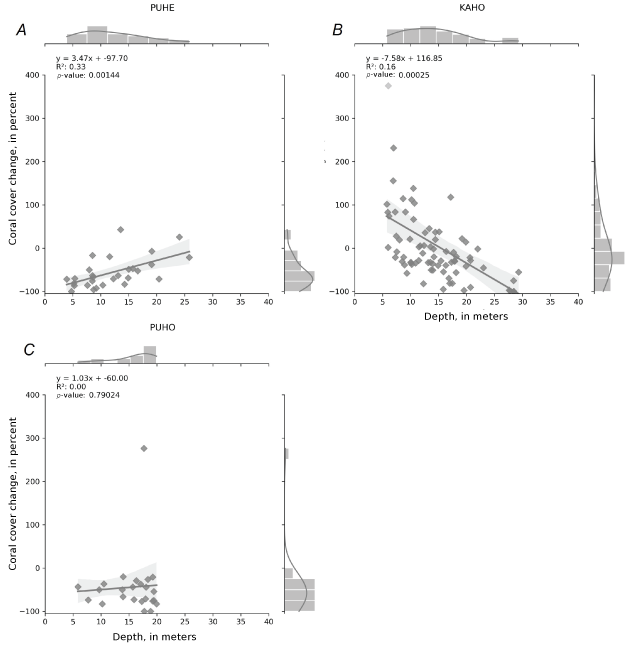
Plots of coral cover change as a function of depth with least squares regression statistics (equation, correlation [R2], and p-value), sorted by park. A, Puʻukoholā Heiau National Historic Site (PUHE). B, Kaloko-Honokōhau National Historic Park (KAHO). C, Puʻuhonua o Hōnaunau National Historic Park (PUHO).
Summary and Conclusions
This study aimed to investigate changes in live coral cover and bottom composition across three national parks on the Kona Coast through a comprehensive analysis of underwater imagery in the early 2000s and again in 2022. Our results indicate there was reduction of live coral cover across all three parks and increases in non-coral dominant bottom types at Puʻukoholā Heiau National Historic Site (PUHE) and Puʻuhonua o Hōnaunau National Historic Park (PUHO). PUHE experienced the greatest decrease of live coral cover, whereas Kaloko-Honokōhau National Historic Park (KAHO) experienced the smallest decrease in live coral cover.
Despite most of the sites in all three parks showing declines in live coral cover, there were sites where positive change in coral was observed. In KAHO, these sites were predominantly adjacent to Kaloko Fishpond and the southern half of the park. The protected nature of the pinnacles off Kaloko Fishpond and the embayment around the harbor may provide reprieve from storm damage and wave energy allowing coral to recover in these areas of KAHO. Furthermore, the highest historical coral cover measured was at these locations and indicates more recovery was possible than at other exposed sites in the KAHO study area. This explanation also supports the negative relation between depth and coral cover change at KAHO (fig. 15) where the shelf begins to transition into a steep shelf break at 12- to 20-m depths. At these depths, coral cover naturally declines and uncolonized substrate increases, indicating that wave stress and damage might be driving coral cover and coral change. Unlike KAHO, there was a positive relation between depth and coral cover change at PUHE (fig. 15). This trend may be driven by patterns in depth distribution of aggregate reef, where the proportion of dominant substrate structure composed of aggregate reef peaks at 25 m, indicating deeper environments are more favorable for coral colonization at PUHE. Positive coral change was only observed at one site in PUHO and there was no significant relation between depth and coral cover change (fig. 15). This positive coral change may be due to locational errors between the baseline and resurvey periods.
Declines in coral cover have been observed in subtidal surveys across the Kona Coast by National Park Service Inventory and Monitoring (NPS I&M), National Coral Reef Monitoring Program, and Coral Reef Assessment and Monitoring, though none are across the same period as the results presented from this study. Records of declining coral cover from multiple organizations, sampling strategies, and periods in this region demonstrate that continued and consistent monitoring across all three parks could be used to inform future decision making and policy development.
Because KAHO is currently the only park to have a fixed, long-term marine monitoring program, expanding the current KAHO I&M surveys to include permanent subtidal monitoring sites at PUHO and PUHE could provide relevant information on coral change for all three parks on the Kona Coast. Despite park boundaries not officially extending into the marine environment, these important ecosystems occur downslope of the parks and are of concern to NPS management. Additionally, validating survey results by crossing future periodic boat-based drop-camera surveys with I&M fixed diver transects across all three park regions would allow the managers to have a more robust understanding of coral cover and change. Continuing U.S. Geological Survey camera surveys in the future would provide consistency in imagery acquisition methodology by utilizing the approach taken in the resurvey period moving forward. Compared to the baseline surveys, the drifted survey approach in the resurvey provides higher-resolution imagery and increased positional control. Combining the drifted survey approach with precise GNSS global positioning system data would likely reduce uncertainty in the locational data across years.
Because of the collective multi-agency approach to management in this region, expanding survey efforts (such as systematic larger area camera system surveys, in conjunction with diver surveys concentrated on smaller sites of particular interest) could benefit multiple state and local agencies. Furthermore, ongoing and expanded surveys could help inform potential future protections of marine systems within NPS boundaries. These continued assessment surveys would enable the NPS to continue monitoring changes to critical nearshore habitats and marine resources under and adjacent to National Park jurisdiction.
References Cited
Baum, J.K., Claar, D.C., Tietjen, K.L., Magel, J.M.T., Maucieri, D.G., Cobb, K.M., and McDevitt-Irwin, J.M., 2023, Transformation of coral communities subjected to an unprecedented heatwave is modulated by local disturbance: ScienceAdvances, v. 9, no. 14, 12 p., https://doi.org/10.1126/sciadv.abq5615.
Cochran, S.A., Gibbs, A.E., and Logan, J.B., 2007a, Geologic resource evaluation of Pu’uhonua O Hōnaunau National Historical Park, Hawai’i, Part II—Benthic habitat mapping: U.S. Geological Survey Scientific Investigations Report 2006–5258, 20 p. [Also available at https://doi.org/10.3133/sir20065258.]
Dollar, S.J., 1975, Zonation of reef corals off the Kona Coast of Hawaii: Honolulu, Hawaii, University of Hawaii, M.S. thesis, 195 p., also available at https://scholarspace.manoa.hawaii.edu/handle/10125/18141.
Donovan, M.K., Burkepile, D.E., Kratochwill, C., Shlesinger, T., Sully, S., Oliver, T.A., Hodgson, G., Freiwald, J., and Van Woesik, R., 2021, Local conditions magnify coral loss after marine heatwaves: Science, v. 372, no. 6545, p. 977–980, https://doi.org/10.1126/science.abd9464.
Eakin, C.M., Sweatman, H.P.A., and Brainard, R.E., 2019, The 2014–2017 global-scale coral bleaching event—Insights and impacts: Coral Reefs, v. 38, no. 4, p. 539–545, https://doi.org/10.1007/s00338-019-01844-2.
Fukunaga, A., Burns, J.H.R., Pascoe, K.H., and Kosaki, R.K., 2022, A remote coral reef shows macroalgal succession following a mass bleaching event: Ecological Indicators, v. 142, 7 p., https://doi.org/10.1016/j.ecolind.2022.109175.
Gibbs, A.E., Cochran, S.A., Logan, J.B., and Grossman, E.E., 2007, Benthic habitats and offshore geological resources of Kaloko-Honokōhau National Historical Park, Hawai’i: U.S. Geological Survey Scientific Investigations Report 2006–5256, 62 p. [Also available at https://doi.org/10.3133/sir20065256.]
Gove, J.M., Williams, G.J., Lecky, J., Brown, E., Conklin, E., Counsell, C., Davis, G., Donovan, M.K., Falinski, K., Kramer, L., Kozar, K., Li, N., Maynard, J.A., McCutcheon, A., McKenna, S.A., Neilson, B.J., Safaie, A., Teague, C., Whittier, R., and Asner, G.P., 2023, Coral reefs benefit from reduced land–sea impacts under ocean warming: Nature, v. 621, no. 7979, p. 536–542, https://doi.org/10.1038/s41586-023-06394-w.
Graham, N.A.J., Jennings, S., MacNeil, M.A., Mouillot, D., and Wilson, S.K., 2015, Predicting climate-driven regime shifts versus rebound potential in coral reefs: Nature, v. 518, no. 7537, p. 94–97, https://doi.org/10.1038/nature14140.
Hughes, T.P., Kerry, J.T., Álvarez-Noriega, M., Álvarez-Romero, J.G., Anderson, K.D., Baird, A.H., Babcock, R.C., Beger, M., Bellwood, D.R., Berkelmans, R., Bridge, T.C., Butler, I.R., Byrne, M., Cantin, N.E., Comeau, S., Connolly, S.R., Cumming, G.S., Dalton, S.J., Diaz-Pulido, G., Eakin, C.M., Figueira, W.F., Gilmour, J.P., Harrison, H.B., Heron, S.F., Hoey, A.S., Hobbs, J.-P.A., Hoogenboom, M.O., Kennedy, E.V., Kuo, C., Lough, J.M., Lowe, R.J., Liu, G., McCulloch, M.T., Malcolm, H.A., McWilliam, M.J., Pandolfi, J.M., Pears, R.J., Pratchett, M.S., Schoepf, V., Simpson, T., Skirving, W.J., Sommer, B., Torda, G., Wachenfeld, D.R., Willis, B.L., and Wilson, S.K., 2017, Global warming and recurrent mass bleaching of corals: Nature, v. 543, no. 7645, p. 373–377, https://doi.org/10.1038/nature21707.
Logan, J.B., McPherson, M.L., Alkins, K., Hatcher, G.A., Gibbs, A.E., Storlazzi, C.D., and Groff, S., 2025, Underwater imagery and classifications of the substrate and coral reef habitat on the Kona coast of the Island of Hawaiʻi, from 2003, 2004, and 2022: U.S. Geological Survey data release, https://doi.org/10.5066/P13ZPWNS.
Lough, J.M., Anderson, K.D., and Hughes, T.P., 2018, Increasing thermal stress for tropical coral reefs—1871–2017: Scientific Reports, v. 8, no. 6079, 7 p., https://doi.org/10.1038/s41598-018-24530-9.
McCarthy, O.S., Winston Pomeroy, M., and Smith, J.E., 2024, Corals that survive repeated thermal stress show signs of selection and acclimatization: PLOS ONE, v. 19, no. 7, 19 p., https://doi.org/10.1371/journal.pone.0303779.
McCutcheon, A.L., and McKenna, S.A., 2021, Coral bleaching, mortality and benthic community assemblages on the reefs within the Pacific Island Network National Parks: Fort Collins, Colorado, National Park Service, Natural Resource Report NPS/PACN/NRR—2021/2322, 70 p., accessed July 29, 2024, at https://doi.org/10.36967/nrr-2287992.
Mellin, C., Brown, S., Cantin, N., Klein-Salas, E., Mouillot, D., Heron, S.F., and Fordham, D.A., 2024, Cumulative risk of future bleaching for the world’s coral reefs: Science Advances, v. 10, no. 26, 9 p., https://doi.org/10.1126/sciadv.adn9660.
National Oceanic and Atmospheric Administration Pacific Islands Fisheries Science Center, Ecosystem Sciences Division, 2018, National coral reef monitoring program—Benthic cover derived from analysis of images collected during stratified random surveys (StRS) of the Hawaiian Archipelago: National Oceanic and Atmospheric Administration [NOAA], accessed April 10, 2025, at https://doi.org/10.7289/v5js9nr4.
Office for Coastal Management [OCM] Partners, 2022, 2013 USACE NCMP Topobathy Lidar DEM (LMSL)—Big Island, HI: National Oceanic and Atmospheric Administration, accessed February 28, 2022, at https://www.fisheries.noaa.gov/inport/item/64784.
Rodgers, K.S., Jokiel, P.L., Brown, E.K., Hau, S., and Sparks, R., 2015, Over a decade of change in spatial and temporal dynamics of Hawaiian coral reef communities: Pacific Science, v. 69, no. 1, p. 1–13, https://doi.org/10.2984/69.1.1.
Skirving, W.J., Heron, S.F., Marsh, B.L., Liu, G., De La Cour, J.L., Geiger, E.F., and Eakin, C.M., 2019, The relentless march of mass coral bleaching—A global perspective of changing heat stress: Coral Reefs, v. 38, no. 4, p. 547–557, https://doi.org/10.1007/s00338-019-01799-4.
Terry, R.D., and Chilingar, G.V., 1955, Summary of “Concerning some additional aids in studying sedimentary formations” by M.S: Journal of Sedimentary Research, v. 25, no. 3, p. 229–234, https://doi.org/10.1306/74D70466-2B21-11D7-8648000102C1865D.
Tkachenko, M., Malyuk, M., Holmanyuk, A., and Liubimov, N., 2020, Label Studio, version 1.20.0: HumanSignal software release, accessed July 31, 2025, at https://github.com/HumanSignal/label-studio.
Appendix 1
Live Coral Cover Distributions by Site
Table 1.1.
Baseline (BL) and resurvey (RS) mean longitude, mean latitude, mean percent live coral cover (), standard deviation of percent live coral cover (), and the number of images classified by site at PUHE (Puʻukoholā Heiau National Historic Site).[°, degree; %, percent]
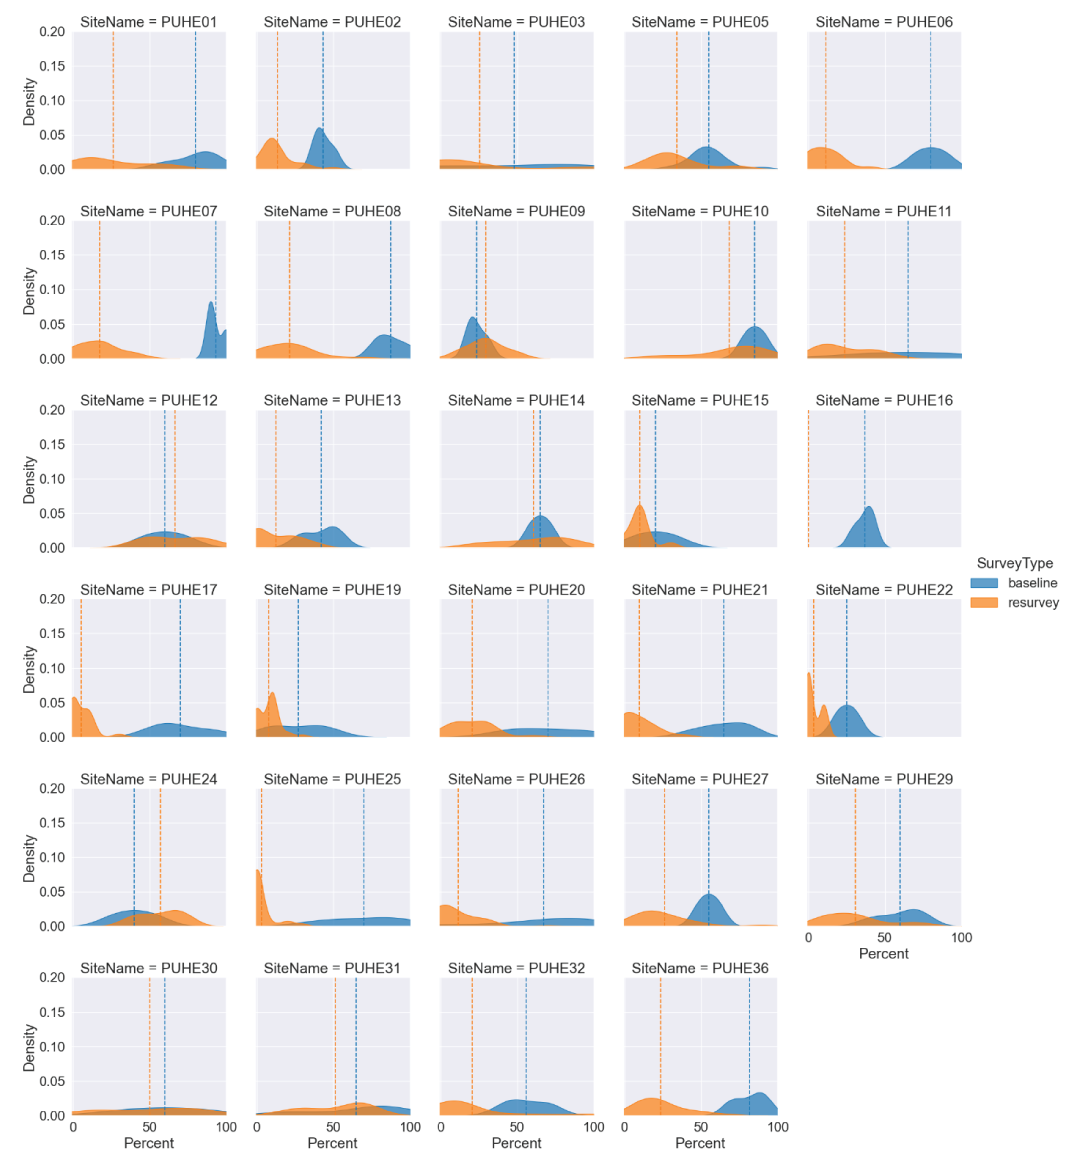
Graphs showing density distribution curves for percent live coral cover for baseline and resurvey sites at Puʻukoholā Heiau National Historic Site (PUHE). Dashed vertical lines indicate the mean percent live coral cover for each survey period.
Table 1.2.
Baseline (BL) and resurvey (RS) mean longitude, mean latitude, mean percent live coral cover (), standard deviation of percent live coral cover (), and the number of images classified by site at Kaloko-Honokōhau National Historic Park (KAHO).[°, degree; %, percent]
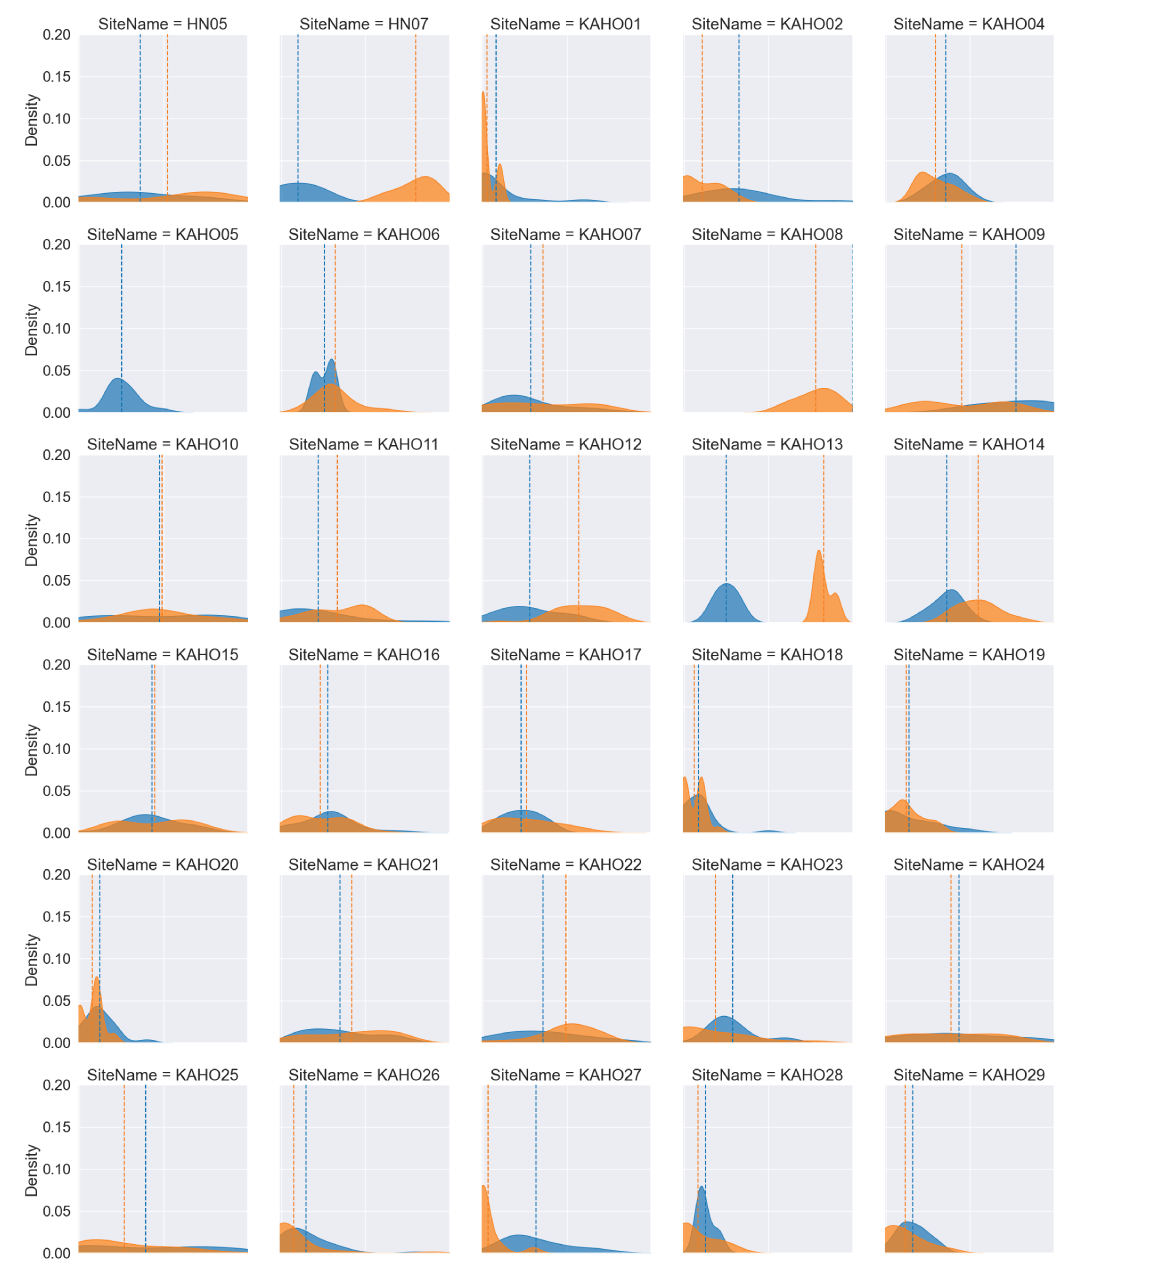
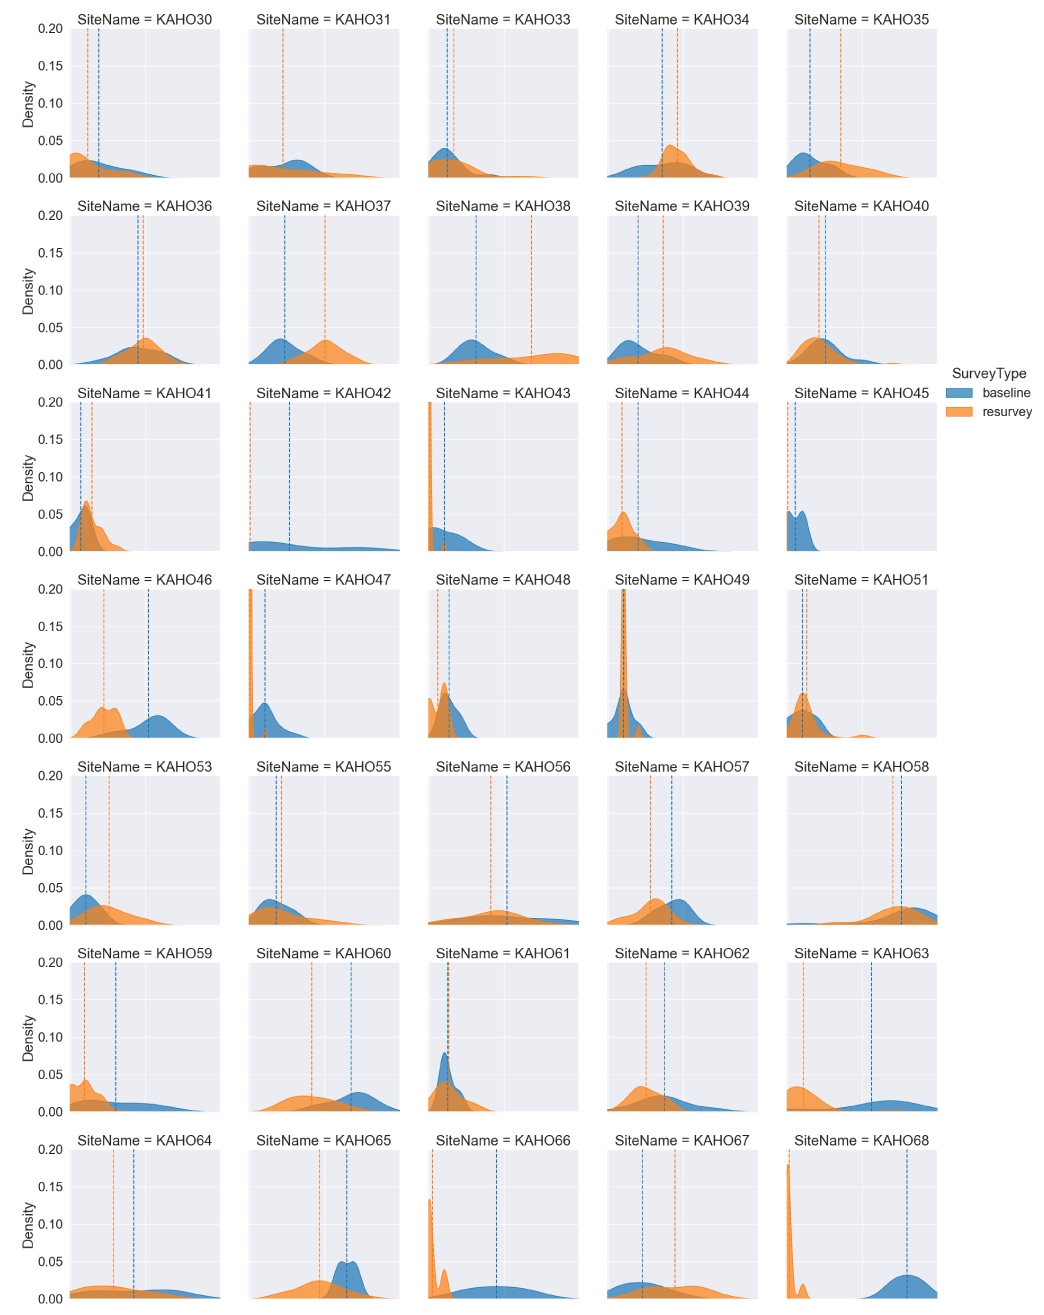
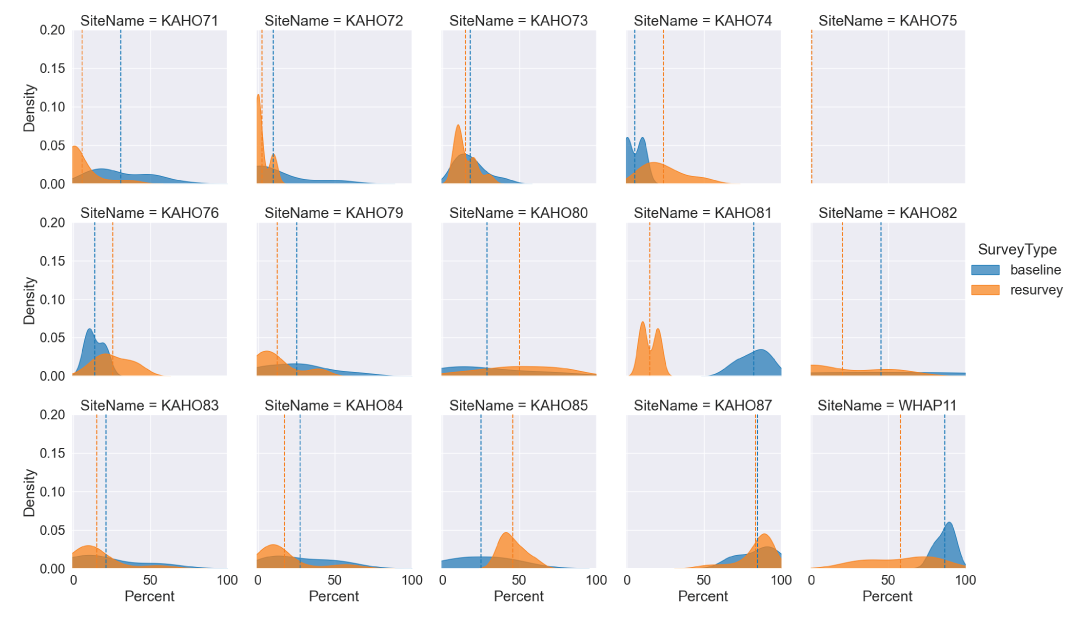
Density distribution curves for percent live coral cover for baseline and resurvey sites at Kaloko-Honokōhau National Historic Park (KAHO). Dashed vertical lines indicate the mean percent live coral cover for each survey period.
Table 1.3.
Baseline (BL) and resurvey (RS) mean longitude, mean latitude, mean percent live coral cover (), standard deviation of percent live coral cover (), and the number of images classified by site at Puʻuhonua o Hōnaunau National Historic Park (PUHO).[°, degree; %, percent]
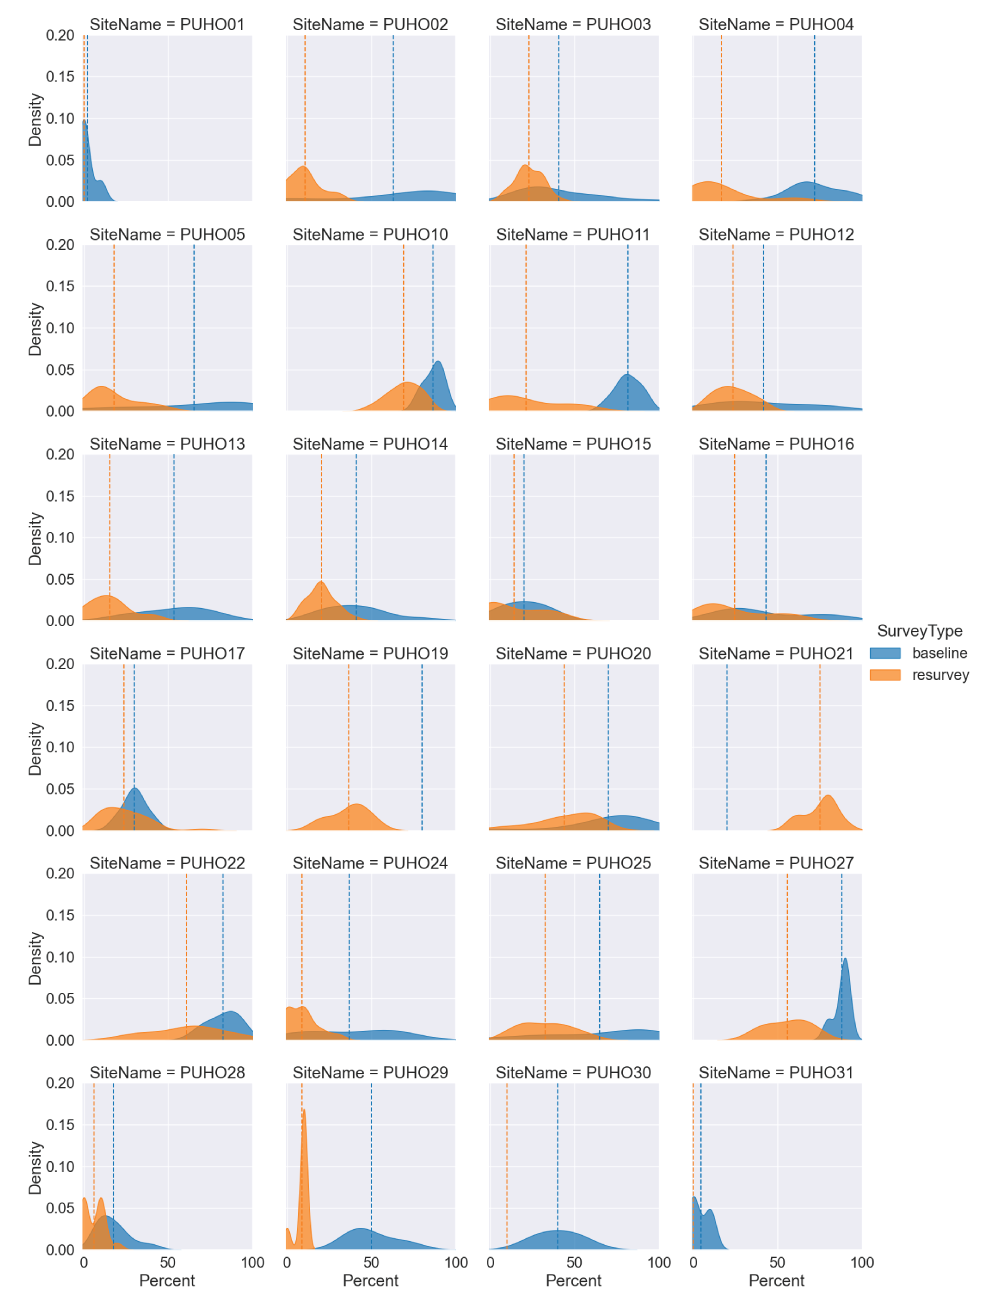
Density distribution curves for percent live coral cover for baseline and resurvey sites at Puʻuhonua o Hōnaunau National Historic Park (PUHO). Dashed vertical lines indicate the mean percent live coral cover for each survey period.
Datum
Vertical coordinate information is referenced to the local mean sea level (LMSL).
Horizontal coordinate information is referenced to the Pacific Plate realization of the North American Datum of 1983 (NAD83(PA11)).
Vertical positions used for depth are referenced to the Local Mean Sea Level (LMSL) tidal datum.
Abbreviations
CRAMP
Coral Reef Assessment and Monitoring Program (Hawai‘i)
DEM
digital elevation model
GNSS
global navigation satellite system
GPS
global positioning system
I&M
inventory and monitoring
KAHO
Kaloko-Honokōhau National Historic Park
LED
light-emitting diode
lidar
light detection and radar
LMSL
local mean sea level
NCRMP
National Coral Reef Monitoring Program
NHP
national historic park
NHS
national historic site
NPS
National Park Service
PUHE
Puʻukoholā Heiau National Historic Site
PUHO
Puʻuhonua o Hōnaunau National Historic Park
USGS
U.S. Geological Survey
Disclaimers
Any use of trade, firm, or product names is for descriptive purposes only and does not imply endorsement by the U.S. Government.
Although this information product, for the most part, is in the public domain, it also may contain copyrighted materials as noted in the text. Permission to reproduce copyrighted items must be secured from the copyright owner.
Suggested Citation
McPherson, M.L., Logan, J.B., Alkins, K.A., Groff, S., Hatcher, G.A., Gibbs, A.E., Cochran, S.A., and Storlazzi, C.D., 2026, Evaluation of benthic habitat change within the national historic sites of Hawaiʻi’s Kona Coast: U.S. Geological Survey Open-File Report 2026–1061, 28 p., https://doi.org/10.3133/ofr20261061.
ISSN: 2331-1258 (online)
Study Area
| Publication type | Report |
|---|---|
| Publication Subtype | USGS Numbered Series |
| Title | Evaluation of benthic habitat change within the national historic sites of Hawaiʻi’s Kona Coast |
| Series title | Open-File Report |
| Series number | 2026-1061 |
| DOI | 10.3133/ofr20261061 |
| Publication Date | April 14, 2026 |
| Year Published | 2026 |
| Language | English |
| Publisher | U.S. Geological Survey |
| Publisher location | Reston, VA |
| Contributing office(s) | Pacific Coastal and Marine Science Center |
| Description | Report: vii, 28 p.; Data Release |
| Country | United States |
| State | Hawaii |
| Other Geospatial | Kona Coast |
| Online Only (Y/N) | Y |