

Evaluation of Turbidity Corrections for EXO Fluorescent Dissolved Organic Matter (fDOM) Sensors
Links
- Document: Report (2.3 MB pdf) , HTML , XML
- Data Release: USGS data release - Fluorescence sensor measurements in sediment suspensions to evaluate turbidity corrections
- Download citation as: RIS | Dublin Core
Executive Summary
The use of field-deployable fluorescence sensors to better understand dissolved organic matter concentrations and composition has grown immensely in recent years. Applications of these sensors to critical monitoring efforts have also grown, encompassing post-fire monitoring, wastewater tracking, and use as a proxy for various contaminants. Despite the growth, it is well known that these sensors require corrections for temperature (Watras and others, 2011) and are subject to many light-field interferences caused by both scattering and absorbance due to dissolved and particulate substances (Downing and others, 2012; Lee and others, 2015; Booth and others, 2023). The most common fluorescence sensors used by the U.S. Geological Survey (USGS) include those targeting fluorescent dissolved organic matter (fDOM) and chlorophylls. Because fDOM sensors primarily measure fluorescence in the dissolved to colloidal phases, corrections to the interferences caused by particulates can be made relatively easily. By the end of 2024, the USGS had 69 fDOM sensors deployed within official water quality monitoring networks included on the USGS National Water Dashboard (https://dashboard.waterdata.usgs.gov/app/nwd/en/) and numerous others used in surveys and research applications across the Nation.
Although temperature corrections are widely applicable across sensor models, interference corrections can be model specific due to differences in design specifications across manufacturers and models (Booth and others, 2023). The corrections are also potentially subject to changes in manufacturing within a specific sensor model. Recently, USGS staff obtained information regarding possible changes in the manufacturing of its most widely-used fDOM sensor model, raising concerns about data consistency and quality in the USGS fDOM sensor networks.
Furthermore, changes in turbidity sensors since the corrections guidance was performed may also affect the performance of the corrections. The turbidity sensor used in the original experiments (Downing and others, 2012) was determined to have a signal output approximately 1.3 times higher than the output of the turbidity sensor currently used in an extensive field comparison study (Messner and others, 2023). With these changes, it is imperative that the corrections be reevaluated to maintain data consistency and continuity across the USGS.
In this study, we evaluated turbidity corrections for fDOM sensors over a range of serial numbers covering manufacturing dates 2015 through 2022 and turbidity serial numbers covering the range 2013 through 2022. The goal was to determine whether reported changes in the manufacturing process of the fDOM and turbidity sensors affected the correction approach developed by Downing and others (2012) such that additional guidance would be required to address this manufacturing change. To evaluate, we repeated a laboratory-based test similar to that performed by Downing and others (2012) in which a series of tank experiments with multiple sensors were deployed in a suspension of Elliot Silt Loam (ESL). High turbidities of the ESL suspension were maintained throughout the tank by turbulent recirculation using submersible pumps. Particulates were removed using a recirculated line equipped with a capsule filter (0.45 micron). Measurements were collected throughout the filtration until turbidities reached approximately 5 formazin nephelometric units (FNU; data available in Baxter and others, 2023). Each experimental run included a mixture of unique sensor combinations to account for variability imposed by the turbidity and temperature sensors. The fDOM correction factor was calculated for each combination of fDOM and turbidity sensors included in the test.
We observed no systematic change in fDOM correction coefficients across serial numbers representing manufacturing years 2015 through 2022. However, the results highlighted questions raised about the corrections for high-turbidity samples, as noted in USGS Techniques and Methods (Booth and others, 2023). Applying the inverse of the commonly-used fDOM ratio with a quadratic fit performed better than the exponential fits when correcting fDOM data for turbidity in the ESL laboratory filtration test and generated a simple scale factor correction equation. This approach also served as a better indicator of data quality than the exponential fit approach. Similar to fDOM, more rigorous quality assurance measures may be necessary to evaluate turbidity sensor calibrations and performance. Sensors exceeding a certain age may need to be replaced despite passing quality assurance checks during calibration. Further testing of the turbidity corrections for different sediment and water types is warranted to better understand the variations in the fits and correctable ranges of turbidity in different systems.
Introduction
From August 2022 through January 2023, the U.S. Geological Survey (USGS) tested their most commonly used Fluorescent Dissolved Organic Matter (fDOM) Sensor to evaluate the stability of the turbidity correction factors over the manufacturing period 2015 through 2022. There were concerns that changes in the manufacturing process during this period may have affected the sensor response to turbidity and that sensor-specific corrections may need adjustment as a result. There was also concern that the corrections being applied across the Nation by USGS staff were not performing well, particularly at turbidities exceeding 200 formazin nephelometric units (FNU). This report summarizes results from a repeat of an experiment that established the correction approach (Downing and others, 2012; Booth and others, 2023). It also proposes an updated turbidity correction approach and the use of a secondary calibration check for fDOM sensors to ensure comparability among sensor measurements in natural waters across the Nation.
Background
Field deployed fDOM sensors have become popular due to their use in studies of dissolved organic matter (DOM) as well as a proxy for other contaminants associated with DOM (Downing and others, 2009; Bergamaschi and others, 2011; Booth and others, 2020, 2023). However, as the use of these sensors expands, users have encountered data quality issues in systems with elevated turbidities. At the time of this study (2024), the USGS National Water Dashboard (https://dashboard.waterdata.usgs.gov/app/nwd/en/) had 69 sites providing continuous fDOM measurements, and there were numerous other sites where fDOM measurements were being collected either in a research capacity or as discrete measurements.
Turbidity can have significant effects on fDOM sensor response (Downing and others, 2012; Lee and others, 2015; Saraceno and others, 2017; Regier and others, 2020). Downing and others (2012) suggested that a sensor-specific correction was widely applicable across the major rivers of the USA but cautioned that site-specific corrections may be necessary, especially when turbidities are above 600 FNU. Saraceno and others (2017) evaluated a field-based method to determine the site-specific corrections and demonstrated the value of the approach for a site where turbidities were frequently above 300 FNU.
The current guidance for corrections of turbidity interferences on fDOM measurements calls for site-specific and sensor-specific validation of the correction factors (Booth and others, 2023). The current USGS guidance for turbidity corrections was based on work that was performed before the latest generation of fDOM sensors, and Downing and others (2012) reported that manufacturer-specific correction factors were necessary because differences among sensor configurations affect the corrections. Recent communications have suggested that changes in the fDOM sensor manufacturing process may affect the turbidity corrections during the period over which the guidance was developed, and updates to firmware are not systematically evaluated or reported. Furthermore, the initial experiment done by Downing and others (2012) did not use the same series of sensors (fDOM or turbidity), so the approach had not yet been evaluated specifically for the series of sensors evaluated in this study.
Several fDOM and turbidity sensors from a range of manufacturing dates (2015–22) were tested to evaluate turbidity corrections for fDOM in controlled lab experiments. The sensors in the experiment included sensors that had been deployed in the field as well as new ones, all of which had been calibrated according to manufacturer specifications and confirmed in 300 micrograms per liter (µg/L) quinine sulfate solution before deployment in the experiment.
Description of Technology, Sensor, or Method
The USGS uses the Technology Readiness Level (TRL) developed by the National Aeronautics and Space Administration (NASA) to evaluate instrument maturity for use across USGS networks (Manning, 2023). Although the widespread use of fDOM sensors across USGS programs and networks has reflected full maturity at the TRL9 stage (system proven through successful mission operations) in non-turbid environments, data processing methods have not effectively cleared the TRL6 stage (demonstration of system/model in a relevant environment) in high-turbidity settings (Manning, 2023). Additional evaluations of data consistency and quality assurance in high-turbidity systems are necessary to develop these sensors and the respective data processing methods to the TRL9 stage in these environmental conditions. Only after these evaluations can proper guidance on fDOM sensor use and data processing be provided to USGS staff for standard operations and maintenance of these sensors.
Sensor Description
The EXO fDOM Digital Smart Sensor (YSI, Inc./Xylem, Inc., Yellow Springs, Ohio), hereafter fDOM sensor, is a fluorescence sensor equipped with a light emitting diode (LED) that emits light at approximately 365 plus or minus 5 nanometers (nm) and detects the fluorescence response in the wavelength range 480 plus or minus 40 nm (Booth and others, 2023). The fDOM sensor was designed to be installed into an EXO2 or EXO3 multiparameter sonde (YSI, Inc./Xylem, Inc., Yellow Springs, Ohio) in tandem with a turbidity sensor (EXO Turbidity Smart Sensor; part number [p/n] 599101; YSI, Inc./Xylem, Inc., Yellow Springs, Ohio) and temperature/conductivity sensor (EXO Conductivity & Temperature Smart Sensor; p/n 599870; YSI, Inc./Xylem, Inc., Yellow Springs, Ohio) for proper operation. The turbidity sensor is necessary for compensation of turbidity interference of the fDOM measurements. The fDOM sensor requires an EXO central wiper for anti-fouling purposes. Although the sensors can also be deployed on an EXO1, the EXO1 is not recommended because it does not include a central wiper for anti-fouling. The fDOM sensor is calibrated using a two-point calibration curve within the KOR software with 0 quinine sulfate units (QSU) using ultrapure deionized (greater than 18.0 megohm per centimeter) water, and with 300 µg/L quinine sulfate (YSI; Booth and others, 2023). The fDOM sensor has an operating range of 0–300 µg/L QSU with precision of plus or minus 5 percent or 1 QSU, whichever is greater. The fDOM sensor is compatible with all EXO accessories, including flow cells and signal output adapters. The characteristics and technical specifications for the sensor are listed in table 1.
Table 1.
Fluorescent dissolved organic matter (fDOM) sensor design and manufacturer-stated specifications (Xylem, Inc., 2024).[g, gram; m, meter; mm, millimeter; nm, nanometer; ppb, parts per billion; QSU, quinine sulfate units; sec, second; VDC, volts of direct current; ±, plus or minus; >, greater than; <, less than; °C, degree Celsius]
The use of the fDOM sensor must be coordinated with a turbidity sensor to account for interferences in the light field that is the foundation of the fDOM measurement (Booth and others, 2023). The manufacturing specifications of the turbidity sensor (light source, angle) and its calibration details (accuracy and precision, linear range) must be known when applying the turbidity corrections to fDOM measurements (table 2).
Table 2.
Turbidity sensor design and manufacturer-stated specifications (Xylem, Inc., 2024).[FNU, formazin nephelometric units; g, gram; m, meter; mm, millimeter; nm, nanometer; NTU, nephelometric turbidity units; sec, second; VDC, volts of direct current; ±, plus or minus; <, less than; °C, degree Celsius; %, percent]
Laboratory Methods to Test Performance
To successfully carry out the experiment, a system was designed to maintain high turbidity and consistent fDOM throughout the period of measurement. Laboratory testing for the study consisted of an initial testing phase and final filtration experiment runs. Initial testing to establish the experimental design included the evaluation of fDOM and turbidity stability in standard solutions under different mixing arrangements and experimental testing of sensor placements (dry run). Once the conditions were established, the full experiment filtration tests could be performed.
Table 3 summarizes the equipment needed to carry out the experiment, including the EXO sondes (equipped with fDOM, turbidity, and conductance/temperature sensors) and a computer with the KOR software required to run the EXOs. Samples collected for laboratory analysis were submitted to the USGS Organic Matter Research Laboratory at the California Water Science Center in Sacramento, California, for optical characterization on an Aqualog 800 series benchtop fluorometer (Horiba Instruments, Inc., Piscataway, New Jersey) following methods outlined by Hansen and others (2018).
Table 3.
Equipment and supplies needed for experiments to test turbidity corrections for fluorescent dissolved organic matter (fDOM) sensors.[ft, feet; g, gram; gal, gallon; gal/min, gallons per minute; HDPE, high-density polyethylene; IHSS, International Humic Substances Society; L, liters; MΩ-cm, megohm-centimeters; VOC, volatile organic carbon; ~, approximately; >, greater than]
Initial Testing to Establish Experimental Conditions
Several approaches were considered to establish the most appropriate conditions for testing turbidity corrections for fDOM measurements by maximizing the turbidity range while minimizing inner-filtering effects. Fluorescence properties are known to change in environmental conditions and water samples over time. Previous testing of fDOM corrections used a prepared organic matter standard, with materials obtained from the International Humic Substances Society (IHSS; St. Paul, Minnesota; http://www.humicsubstances.org). The previous work used Suwanee River natural organic matter (SRNOM; IHSS reference standard 2R101N) for inner-filtering effect corrections and a sediment standard, Elliot Silt Loam (ESL; IHSS reference standard 1BS102M), for the turbidity correction. SRNOM provides a stable DOM solution, particularly in the fluorescence region measured by the fDOM EXO sensor but has a lower than ideal pH (less than 4) for fluorescence measurements (Groeneveld and others, 2022). In the test, the solution was stable and prepared from mixing the highly organic ESL standard with organic free water (OFW), which has a pH of 6.5 to 7 that is ideal for fluorescence measurements.
To test for turbidity interferences, manufacturers typically use turbidity standards as the light scattering matrix. Although these standards scatter light and provide a good calibration for the scattering-based turbidity measurement, they do not represent the full effects of natural, suspended particles that interfere with the fDOM measurement because natural particles scatter light differently and can also absorb significant amounts of light. Therefore, it is likely that the use of these artificial (plastic beads, formazin) turbidity standard matrices for testing fDOM interference results in an underestimate of the effects of turbidity on the fluorescence measurement and leads to erroneous conclusions about turbidity effects on the sensor measurement.
Another approach used in turbidity interference testing is to add particles (for example, diatomaceous earth, purified silt, or sand) to a natural water sample and measure the extinction of the fDOM response. The concern with this approach is that the added particles can interact with DOM from the solution, which may result in the alteration of the DOM in the solution via selective absorption to the particle surfaces. Once sorbed, the fluorescent properties may differ in solution as may the absorption properties of the particles, resulting in a poor correction for natural particles. Although no approach is ideal, the experiment completed here sought to minimize the effects of mixing solutions and particles that could interact physically or chemically with each other. For these experiments, the starting suspension was prepared using the ESL standard in OFW. Different concentrations of ESL were tested to achieve a high-turbidity solution while minimizing inner-filtering effects.
Initial testing was performed in black 5-gallon buckets to obtain the ideal concentration for the experiments. The experiment started with 16,000 milligrams (mg) of ESL into 8 liters (L) of OFW for a concentration of 2,000 mg/L. The concentration was then increased by an additional 2,000 mg/L stepwise to a maximum of 10,000 mg/L ESL seeking the balance of high turbidity with relatively low inner filtering. Once the concentration was identified, the sondes were suspended in the solution with various clamps, stands, and zip ties to determine the best method of suspension and sensor layout in the larger mixing tank (fig. 1). Data was logged from these sensors over the duration of each test to determine:
-
• Ideal addition of ESL to balance turbidity range and fDOM inner-filtering effects
-
• Sensor placement
-
• Resuspension approaches (stir bars, mechanical mixer, submersible pumps)
-
• Methods for suspension of the sensor
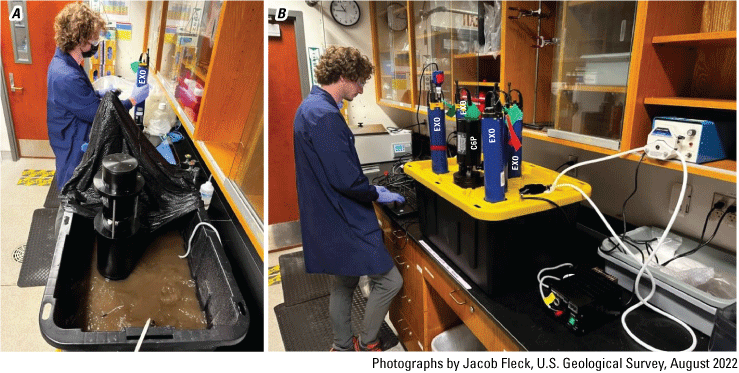
Mixing tank for testing fluorescent dissolved organic matter (fDOM) stability and turbidity maintenance A, without any instruments with the tank uncovered and B, with instruments and with the tank covered.
Filtration Tests
The full experiment was completed during 3 separate days using a different group of sensors in each experimental run (fig. 2). Sensors and equipment were set up and calibrated in accordance with the manufacturer’s guidance (https://www.ysi.com/exo-university/category/exo-sensor-calibration). Each sensor passed the calibration quality check reported by the KOR software SmartQC Score before use in all laboratory experiments. Measurements from the full filtration experiments are available in Baxter and others (2023). Full filtration experiments were done on August 8, 2022; August 11, 2022; and January 12, 2023.
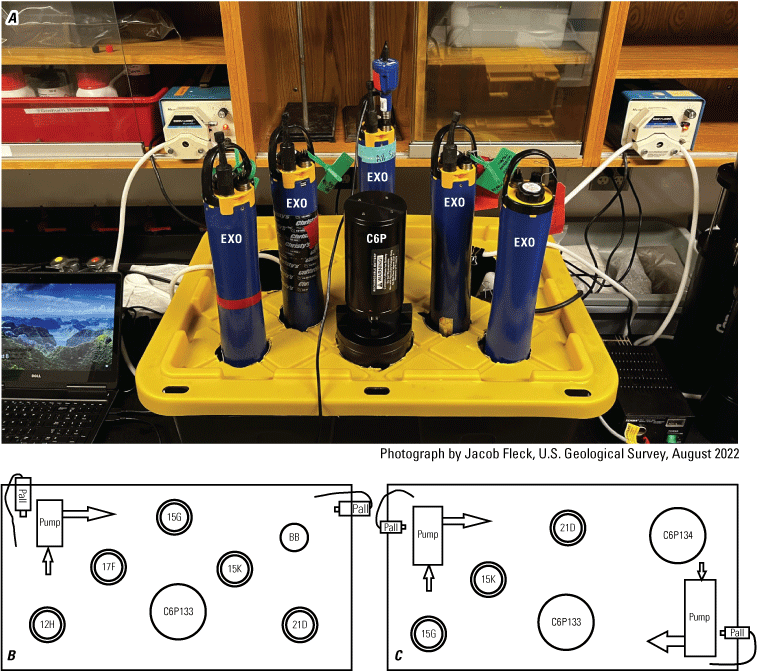
A, Photograph of the full experiment setup and diagrams of sensor placements on B, August 8, 2022, and C, August 11, 2022. The second pump was added to the August 11, 2022, and January 12, 2023, experiments to address insufficient turbidity resuspension observed during the August 8, 2022, experiment caused by the sensor layout. The labels on the diagram reflect the first three digits in the serial numbers for the sonde bodies (12H, 15G, 15K, 17F, 21D) and other instruments used in the experiments (C6P133, C6P134, BB). Data in this report were limited to the sondes. The label Pall indicates the in-line filters used to collect samples for laboratory analysis.
Solutions were prepared on a Monday or Thursday to allow the ESL solution to reach equilibrium over a 3-day period of mixing. An EXO was placed in the 100-L tank with two submersible pumps to circulate the solution throughout the equilibration period to confirm turbidity levels were maintained and fDOM equilibration was achieved during the pre-measurement period. On the fourth day, the remaining sensors were deployed in the tank to begin logging measurements each minute throughout the filtration experiment.
Two capsule filters (0.45 micrometer; Pall-12179; Pall Corporation, Port Washington, New York) were attached to peristaltic tubing and flushed with 2 L of OFW and drained before use (process hereafter referred to as “conditioning”). After conditioning, the filters recirculated water from the resuspension tank directly back into the bin to remove turbidity slowly and continuously from the solution until the turbidity was lowered to less than 5 FNU. When the filtration lines’ flow slowed from a steady stream to dripping, a new capsule filter was conditioned and replaced on the clogged filter line. Each line required at least two filter changes over the course of each experiment, which lasted for several hours. Filtered water samples were collected from the recirculation line at three time points throughout each experiment day to collect independent measurements on the benchtop fluorometer to ensure minimal changes in fluorescence occurred in the filtrate throughout the filtration experiment. Data from the 3 experiment days can be found in Baxter and others (2023).
Results of Laboratory Testing
Results of laboratory testing were merged into a single spreadsheet for evaluation (Baxter and others, 2023). This section provides the results of initial testing that led to the design of the filtration tests and the results of the filtration tests. The results are presented in the context of current guidance for the correction of fDOM measurements for interferences related to turbidity.
Initial Testing
Initial bucket tests revealed that fDOM stabilized after 3 days of equilibration but started to decline after 5 days of mixing (fig. 3). The planned filtration experiment would last for several hours, so the third or fourth days of equilibration were identified for the experimental runs to ensure fDOM stability during the experiment. The initial ESL concentration of 2,000 mg/L generated a nearly ideal fDOM measurement around 40 QSU with low absorbance (A370 less than 0.03; table 4), but the turbidity was lower than desired (approximately 200 FNU). Further additions to increase the ESL concentration led to higher fDOM measurements with substantial inner-filtering effects (table 4).
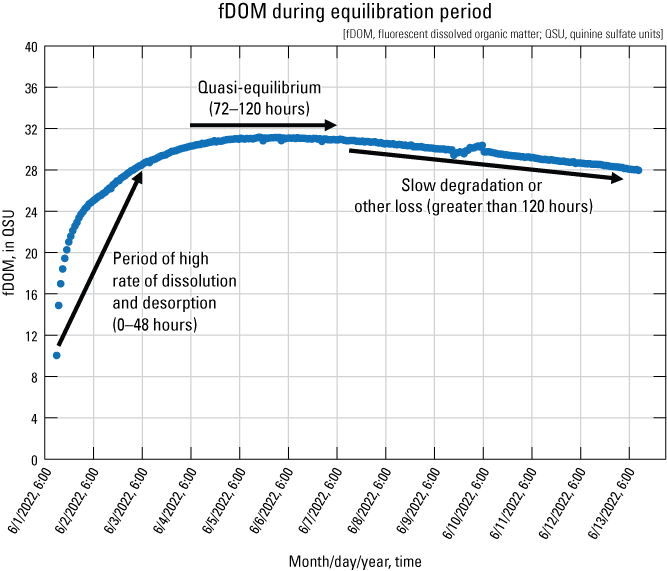
Water temperature-corrected fluorescent dissolved organic matter (fDOM) measurements in lightly mixed solution after addition of Elliott Silt Loam to organic free water to determine equilibration period for fDOM desorption from the sediment before the filtration test. Data are summarized from Baxter and others (2023).
Table 4.
Laboratory and associated sensor measurements for samples collected from the initial tests (July 25–August 4) and the turbidity filtration experiments (August 8–January 12). Data are summarized from Baxter and others (2023).[Time of day is shown in 24-hour notation. Abbreviations: A, absorbance; AU, absorbance units per centimeter; cm, centimeter; DOC, dissolved organic carbon; ESL, Elliot Silt Loam; fDOMxos, fluorescent dissolved organic matter measurement from the EXO fDOM Digital Smart Sensor in quinine sulfate units; fDOMxoL, fluorescent dissolved organic matter measurement from the Aqualog instrument in the laboratory, calibrated to EXO sensor array using quinine sulfate; FNU, formazin nephelometric units; L/mg m, liter per milligram-meter; mg/L, milligram per liter; NA, not analyzed; QSU, quinine sulfate units; RFE, relative fluorescence efficiency; RU, raman normalized units; SUVA, specific ultraviolet absorbance]
Turbidity measurements were relatively low during the initial testing, leading to a sequential addition of ESL, which achieved turbidities of about 1,000 FNU in the July 25, 2022, bucket test. The maximum ESL concentration yielded high-turbidity measurements (greater than 1,500 FNU) in the August 1, 2022, bucket test; however, it was determined that the stir bars were insufficient to reliably maintain turbidity in the larger tank, so other approaches were tested. Mechanical mixing was abandoned because the mixers suffered mechanical failure over the timeframe of the planned filtration experiment. A submersible pump was found to maintain turbidity in the large tank used in the full experiment. The initial full experiment test resulted in lower-than-anticipated turbidity levels because the layout of the multiple sensors interfered with the pump resuspension of the sediment. Ultimately, two submersible pumps were found to be sufficient to maintain turbidity measurements in the tank with all the sensors in place.
There was also a concern about the inner-filtering effect caused by absorption by dissolved substances influencing the turbidity corrections. The results of the July 25, 2022, bucket test suggested that there was possible inner filtering causing lower-than-expected fDOM measurements at the end of the filtration. Interestingly, the results of the August 1, 2022, bucket test did not indicate any inner-filtering effect on the fDOM measurements at the end of the filtration despite the high absorbance of the filtrate. The inner-filtering effect typically occurs when absorbance values exceed 0.03 absorbance units per centimeter (AU/cm; Ohno, 2002). Due to the inconsistent results between the two bucket tests and the high absorbance measurements (greater than 0.04 at 370 nm, near the excitation wavelength of the fDOM sensor), the higher ESL additions were abandoned. Ultimately, with the use of two submersible pumps, it was found that an ESL suspension in the range of 2,000 mg/L to 2,500 mg/L generated a turbidity around 600 FNU when well mixed, which was sufficient for the final filtration experiment objectives while maintaining low absorbance to minimize inner-filtering effects.
Filtration Tests
There was a substantial amount of variability in measurements from the 13 fDOM-turbidity sensor combinations at the endpoints of the three full turbidity filtration experiments (fig. 4; table 5). Despite the use of sensors that passed all manufacturer data quality objectives, the range of fDOM at the end of the filtration varied over a factor of two. We identified two fDOM sensors that had unstable response through the filtrations (serial numbers 15L100961 and 17L101133) and removed these records from further analyses. On experimental run date August 4, 2022, sensors were not secured sufficiently under the high-flow conditions, causing physical disturbance to the sensors and resulting in erroneous fDOM and turbidity data; therefore, results from this experiment were omitted from further analysis. Turbidity in the next experiment (August 8, 2022; maximum 350 FNU) was low due to insufficient performance of the submersible pump when the sensors were installed. Although turbidity varied among sensor combinations within each test, some variation was expected in the mixing tank due to the natural variation of the turbidity measurement in imperfectly mixed solutions.
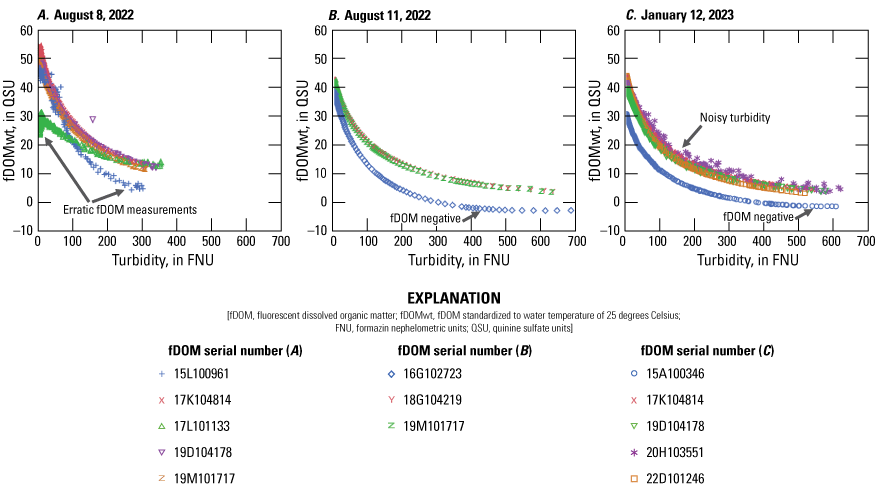
Relationships between fluorescent dissolved organic matter (fDOM) and turbidity for 13 sensor and date combinations tested 3 separate days: A, August 8, 2022; B, August 11, 2022; and C, January 12, 2023 (details of sensors in table 5). A, Two fDOM sensors in the August 8, 2022, test (15L100961, 17L101133) were deemed bad due to high variability and unexplained drops in fDOM response at low turbidities. Two fDOM sensors, 16G102723 in the August 11, 2022, test (B) and 15A100346 in the January 12, 2003, test (C) were determined to have bad calibrations leading to negative values at high turbidities. One fDOM sensor (20H103551) in the January 12, 2023, test (C) showed high variability, but the noise was determined to have been generated from an old turbidity sensor (14G102122), and the fDOM-turbidity relationship followed the same trajectory as most sensor combinations despite the noise. Data are summarized from Baxter and others (2023).
Table 5.
Sensor measurements at the start and end of the filtration experiments and laboratory fluorescent dissolved organic matter measurements for samples collected during the experiment, ordered by experiment date. Data are summarized from Baxter and others (2023).[cal, calibration date; fDOMxoL, fluorescent dissolved organic matter measurement from the Aqualog instrument in the laboratory, calibrated to EXO sensor array in quinine sulfate units; fDOMxos, fluorescent dissolved organic matter measurement from the EXO fDOM Digital Smart Sensor in quinine sulfate units; SN, serial number; Temp, water temperature in degrees Celsius; Turb, turbidity measurement in formazin nephelometric units (FNU); UNK, unknown; YYYYMMDD, year/month/date; >, greater than; %, percent]
Exponential Approaches to Fluorescent Dissolved Organic Matter Corrections
To investigate the possibility that the change in fDOM sensor manufacturing affected corrections, the correction approach used by Downing and others (2012) was followed initially, in which the fraction of fDOM measurements relative to the fully filtered fDOM measurement (fDOMfilt) was plotted against the turbidity across the filtration experiments (fig. 5). A two-parameter (2P) exponential fit was applied in Excel software (Microsoft, Redmond, Washington) using the standard exponential fit:
wherea
is the asymptote,
b
is the scale factor,
exp
is the exponential function, and
c
is the decay coefficient.
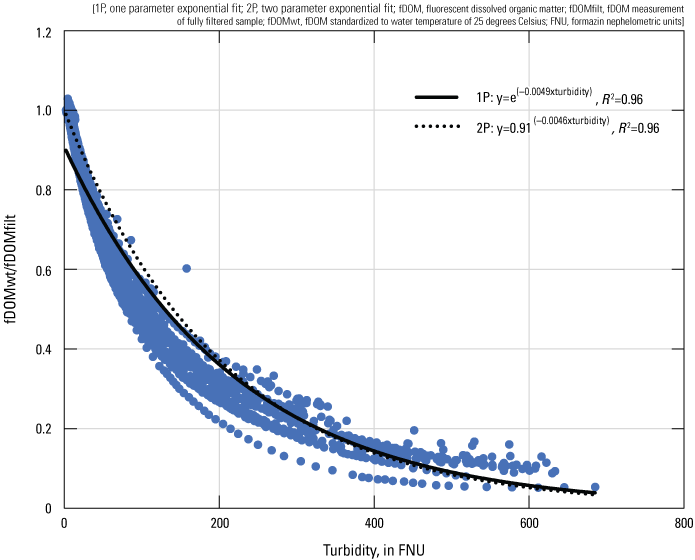
One-parameter (1P) and two-parameter (2P) exponential fits for the pooled data from eleven fluorescent dissolved organic matter (fDOM) and turbidity sensor combinations covering manufacturing years 2015 through 2022. Data are summarized from Baxter and others (2023). See table 6 for comparison of the sensor-specific fits for all individual sensor combinations.
Table 6.
Turbidity correction coefficients for one-parameter and two-parameter exponential fits to the filtration experiments using the approach from the U.S. Geological Survey Techniques and Methods guidance (Booth and others, 2023).[1P, one-parameter fit; 2P, two-parameter fit; b, scale term; c, exponential coefficient; fDOM, fluorescent dissolved organic matter; SN, serial number; YYYYMMDD, year/month/day]
USGS staff generate the turbidity corrections in the form of a one-parameter (1P) exponential fit of the equation, as presented in Downing and others (2012), which sets b=1 when calculating the exponential fit. In previous guidance (Booth and others, 2023), the calculation uses the variable name ρ instead of c; this report uses c for consistency among the different fitting equations presented here. When replicating this approach, the exponential coefficient, c, varied from −0.0043 to −0.0061 among the serial numbers tested with no systematic trend over time (table 6), suggesting that manufacturing changes did not affect the corrections. Because Downing and others (2012) did not explicitly report exponential coefficient (c or ρ) values, it is difficult to report whether the coefficients for these sensors differ markedly from those of the prior generation of fDOM and turbidity sensors. However, the exponential term c has typically been reported between −0.003 and −0.006 (Booth and others, 2023), and the value reported here for the regression using all pooled data (−0.0049) compares well with this range of previously reported values.
Although there was no evidence that fDOM sensor corrections differed by manufacture date (as indicated by the serial numbers), the results raised some larger questions about the current method for applying turbidity corrections to fDOM measurements. The correction guidance in Booth and others (2023) often leads to a poor exponential fit at high turbidity because the 1P exponential approximation does not effectively capture the shape of the fDOM extinction curve (fig. 6). This issue is minor for low turbidities (less than 100 to 200 FNU) where the approximation provides a reasonable fit; however, the issue becomes significant in systems with higher turbidities. This finding also highlights the need for a correction covering the full range of the turbidities encountered at a site because the coefficient is strongly affected by the highest turbidity value.
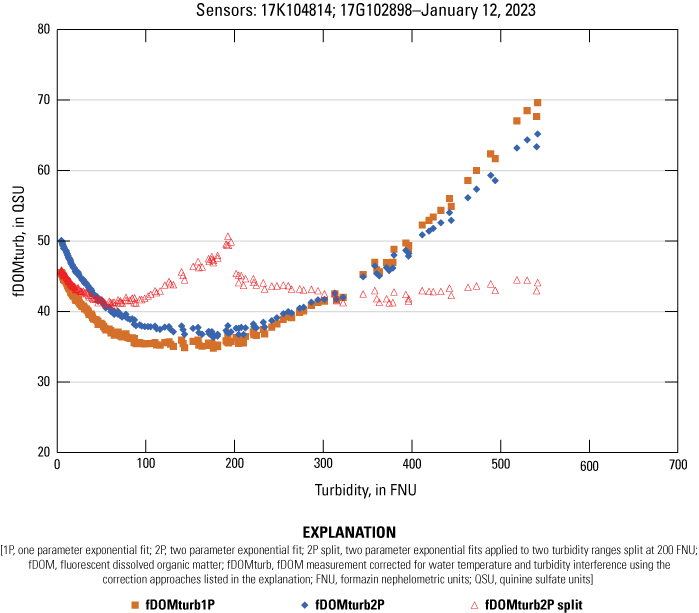
Example of turbidity-corrected fluorescent dissolved organic matter (fDOM) measurements for one-parameter (1P) and two-parameter (2P) exponential fits and a split exponential fit with a break at 200 formazin nephelometric units (FNU).
To address the poor fit to the measured data curvature, other studies have tried to split data into bins (Regier and others, 2020). This approach may generate better corrections over a wider turbidity range but often causes large discontinuities at the binned turbidity break points (fig. 6), resulting in stepwise offsets at the arbitrarily assigned turbidity thresholds that can lead to noisy time series records. Fitting multiple, smaller intervals of turbidity (for example, 100 FNU bins) would likely minimize discontinuities and provide a better correction across a wider range of turbidities but complicates the corrections process and presents a challenge to quality assurance. A better approach is needed to effectively correct fDOM in higher turbidity systems.
To find a better correction approach, a wide range of empirical fits to the filtration experiment data were evaluated, including the two aforementioned exponential fits (1PXL and 2PXL) and four exponential fits (2PJ, three parameter [3PJ], four parameter [4PJ], and five parameter [5PJ]) generated using a statistical software package (version 13.0, JMP Statistical Discovery LLC, Cary, North Carolina). Previous corrections for field-based data reported using a 3P exponential fit (Lee and others, 2015; Saraceno and others, 2017; Regier and others, 2020) in the form:
wherea
is the asymptote,
b
is the scale factor,
exp
is the exponential function, and
c
is the decay coefficient.
fDOMwt
is the measured fDOM value standardized to 25 degrees Celsius, and
fDOMfilt
is the fDOM value at the end of the filtration test when turbidity is at its minimum.
The various exponential fits performed in the statistical software all appeared to fit the pooled data for the 11 sensor combinations well based solely on R 2 values (fig. 7); however, the 2PJ exponential fit did not match the curvature well and yielded a scale factor equal to around 50 times at a turbidity of 650 FNU. The 3PJ exponential fit better fit the curvature and yielded a scale factor of only around 7 times at 650 FNU, nearly an order of magnitude scale factor less than the 2PJ correction. The 4PJ and 5PJ biexponential models appeared to fit the data best across the full turbidity range and yielded similar scale factors of 10 to 12 times at 650 FNU, but the 5PJ had the lowest root mean square error (RMSE), suggesting it was the best fit (fig. 7). The sensor-specific fits for individual sensor combinations were generally consistent, but there were variations among sensor combinations with respect to the model terms (a, b, c, d, e) for the correction equations that warranted further evaluation (table 7).
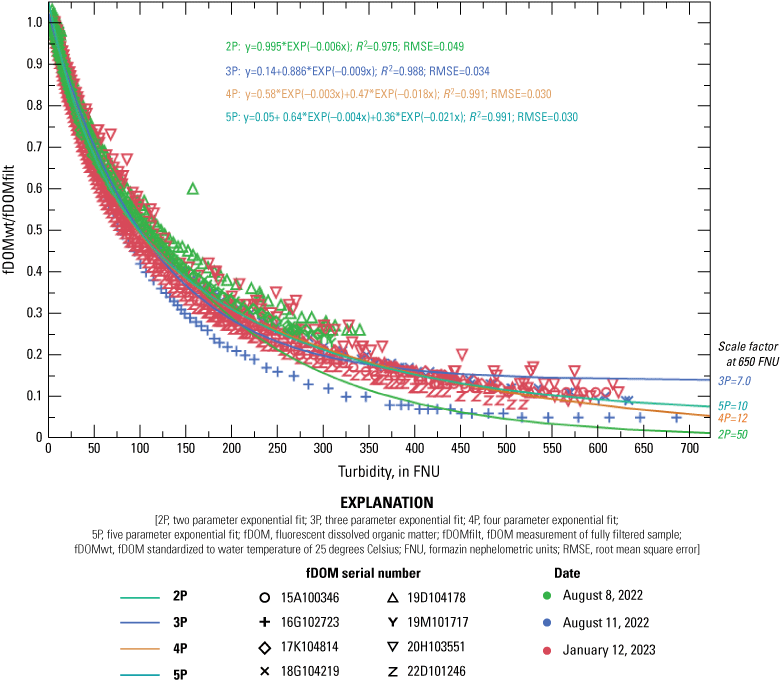
Lines representing the two-parameter (2P) and three-parameter (3P) exponential and four-parameter (4P) and five-parameter (5P) biexponential fits of the 11 sensor combinations. Data are summarized from Baxter and others (2023).
Table 7.
Turbidity correction coefficients for exponential and biexponential fits to the 11 sensor combinations from the filtration experiments (two bad fluorescent dissolved organic matter [fDOM] sensors omitted). Data are summarized from Baxter and others (2023).[2P, two-parameter model; 3P, three-parameter model; 4P, four-parameter model; 5P, five-parameter model; a, asymptote; b, exponential scaling term; c, exponential coefficient; d, biexponential scaling term; e, biexponential coefficient; YYYYMMDD, year/month/day; %, percent]
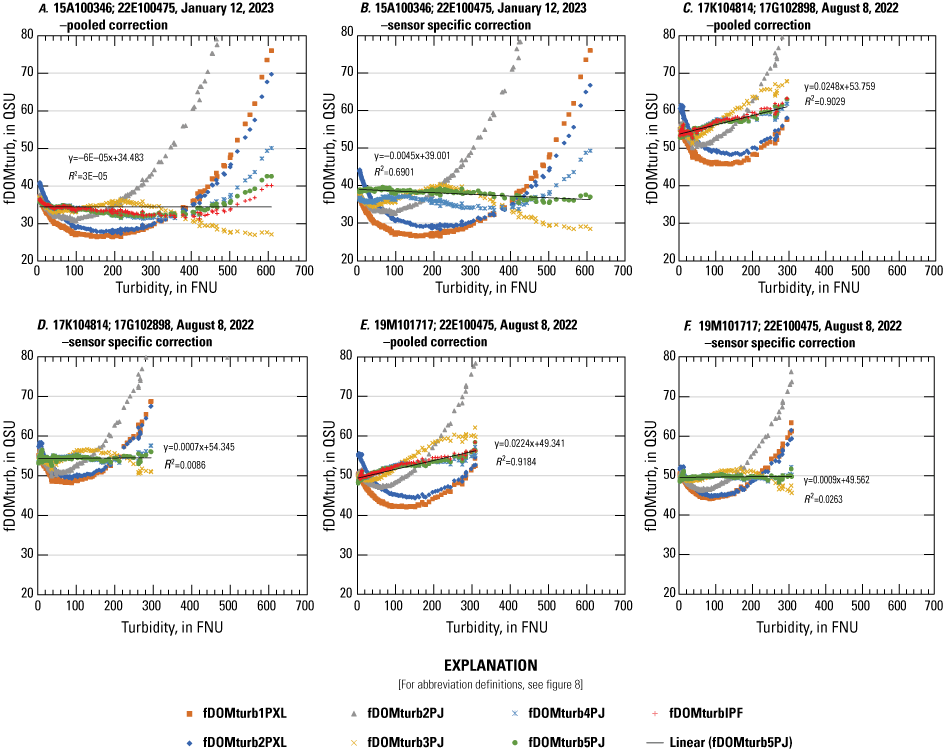
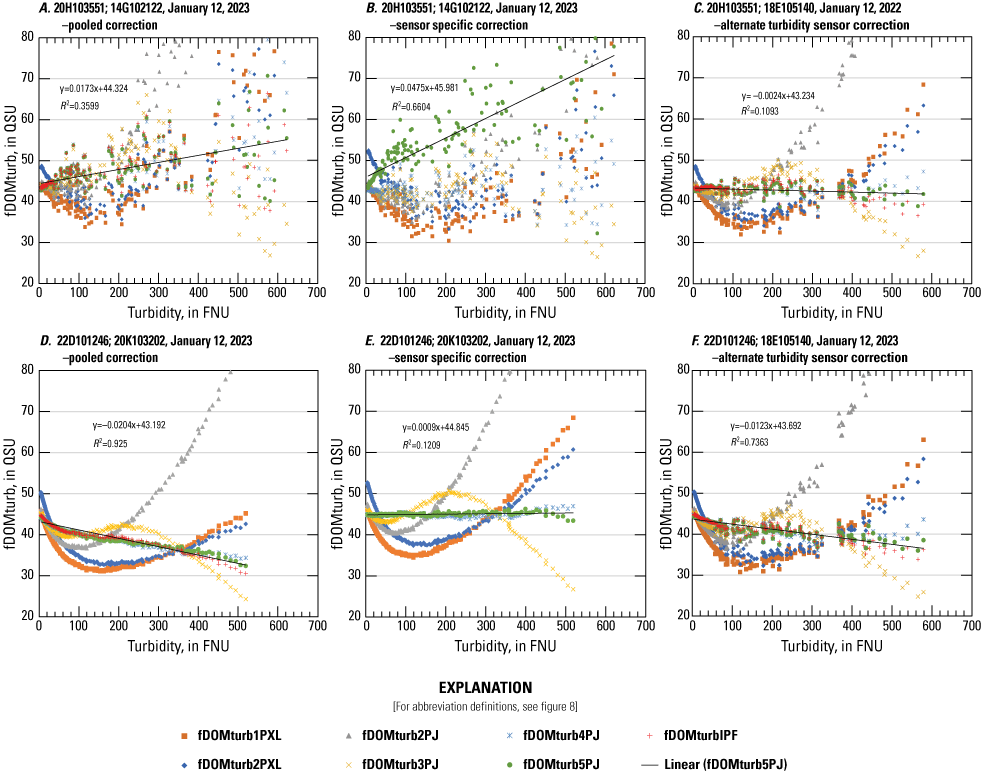
The approach used to evaluate the fDOM corrections among sensor combinations was to apply the corrections across the measurements in the filtration tests. Many of the corrected fDOM records showed minimal variability and appeared stable with slopes near zero across the turbidity range for both the pooled correction and the sensor-specific correction (table 8). The 2PJ exponential fit showed visual differences from the 2PXL exponential fit (fig. 8). Of all the fDOM-turbidity sensor combinations, four corrected records did not differ between the pooled correction and the sensor-specific correction (fig. 8), whereas three combinations had minor differences between the pooled corrections and the sensor-specific corrections (fig. 9). Of those that had minor differences, fDOM sensor 15A100346 had negative values at high turbidities, indicating a poor calibration. Although the slope across the corrected fDOM values was near zero, there was greater variability than desired in the pooled equation corrected values (fig. 9A), likely attributable to a poor calibration or possibly sensor drift. Sensor combinations 17K104814-17G102898 and 19M101717-22E100475 from the August 8, 2022, test had higher than desired slopes (figs. 9C, 9E). In all three cases where the slope was higher than desired, the sensor-specific corrections performed well (figs. 9B, 9D, 9F), likely reflecting sensor drift or possibly a poor calibration.
Table 8.
Summary statistics for the turbidity-corrected fluorescent dissolved organic matter (fDOM) records over the full turbidity range of the experiments comparing the different correction approaches for all 13 sensor combinations included in the study. Data are summarized from Baxter and others (2023).[AVG, average; fDOM, fluorescent dissolved organic matter; fDOMturb1PXL, fluorescent dissolved organic matter measurement from the EXO fDOM Digital Smart Sensor corrected for turbidity using the one-parameter exponential function employed by Excel; fDOMturb2PJ, fluorescent dissolved organic matter measurement from the EXO fDOM Digital Smart Sensor corrected for turbidity using the two-parameter exponential function employed by JMP software; fDOMturb2PXL, fluorescent dissolved organic matter measurement from the EXO fDOM Digital Smart Sensor corrected for turbidity using the two-parameter exponential function employed by Excel; fDOMturb3PJ, fluorescent dissolved organic matter measurement from the EXO fDOM Digital Smart Sensor corrected for turbidity using the three-parameter exponential function employed by JMP software; fDOMturb4PJ, fluorescent dissolved organic matter measurement from the EXO fDOM Digital Smart Sensor corrected for turbidity using the four-parameter biexponential function employed by JMP software; fDOMturb5PJ, fluorescent dissolved organic matter measurement from the EXO fDOM Digital Smart Sensor corrected for turbidity using the five-parameter biexponential function employed by JMP software; fDOMturbIPF, fluorescent dissolved organic matter measurement from the EXO fDOM Digital Smart Sensor corrected for turbidity using the inverse polynomial approach; fDOMxoL, fluorescent dissolved organic matter measurement from the Aqualog instrument in the laboratory, calibrated to EXO sensor array using quinine sulfate; NA, not available; OMRL, organic matter research laboratory; QSU, quinine sulfate units; RSD, relative standard deviation; Stdev, standard deviation; YYYYMMDD, year/month/day; >, greater than; %, percent; —, no data]
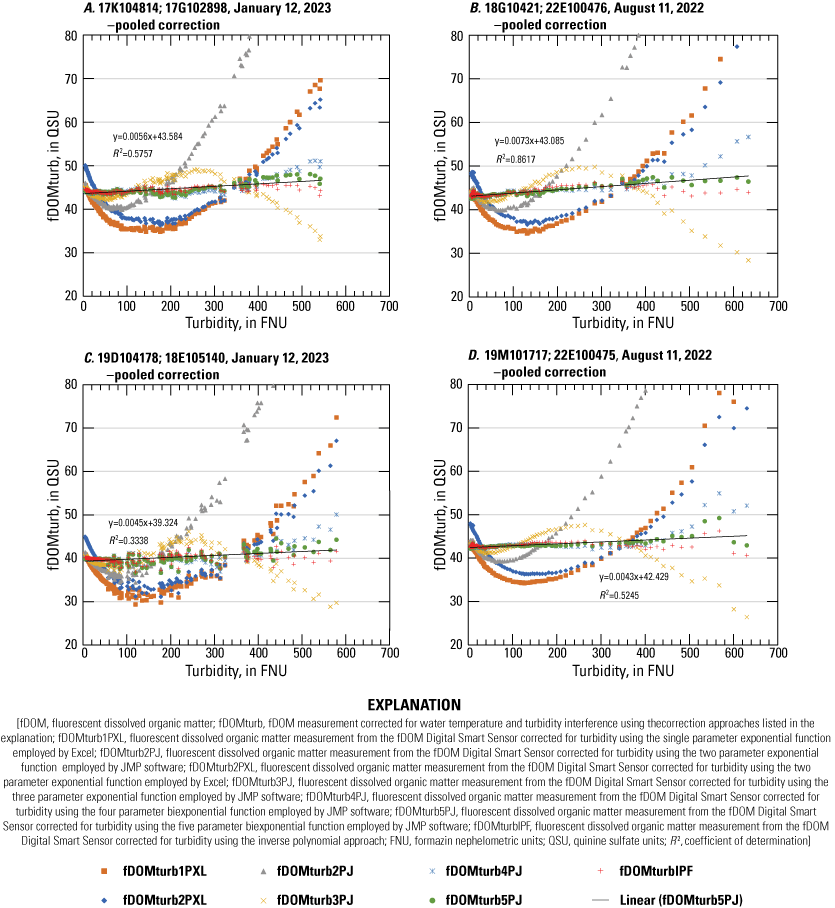
Comparison of turbidity corrected fluorescent dissolved organic matter (fDOM) measurements using the pooled correction equation across the filtration experiment turbidity range for various approaches for A, fDOM sensor 17K104814 and turbidity sensor 17G102898, January 12, 2023; B, fDOM sensor 18G10421 and turbidity sensor 22E100476, August 11, 2022; C, fDOM sensor 19D104178 and turbidity sensor 18E105140, January 12, 2023; and D, fDOM sensor 19M101717 and turbidity sensor 22E100475, August 11, 2022. A flat horizontal line (slope less than 0.02) with a minor deviation (less than 2 quinine sulfate units [QSU]) of points from the line represents a good correction to the data using the various methods. Exponential fits were derived from data from 11 sensor combinations. Inverse polynomial function (IPF) corrections were derived from data from 7 sensor combinations. Data are summarized from Baxter and others (2023).
Comparison of corrected fluorescent dissolved organic matter (fDOM) measurements across the filtration experiment turbidity range for various approaches for A, fDOM sensor 15A100346 and turbidity sensor 22E100475, January 12, 2023, pooled correction; B, fDOM sensor 15A100346 and turbidity sensor 22E100475, January 12, 2023, sensor-specific correction; C, fDOM sensor 17K104814 and turbidity sensor 17G102898, August 8, 2022, pooled correction; D, fDOM sensor 17K104814 and turbidity sensor 17G102898, August 8, 2022, sensor-specific correction; E, fDOM sensor 19M101717 and turbidity sensor 22E100475, August 8, 2022, pooled correction; F, fDOM sensor 19M101717 and turbidity sensor 22E100475, August 8, 2022, sensor-specific correction. These sensor combinations represent cases where pooled corrections differed from the sensor-specific corrections. A flat horizontal line (slope less than 0.02) with minor deviations (less than 2 quinine sulfate units [QSU]) of all points from the line represents a good correction to the data using the various methods. Pooled exponential fits were derived from data from 11 sensor combinations. Inverse polynomial function (IPF) corrections were derived from data from 7 sensor combinations. Data are summarized from Baxter and others (2023).
The remaining four sensor combinations were evaluated more closely because of the age of two of the turbidity sensors (greater than 8 years) contributing to three sensor combinations, and one turbidity sensor (20K103202) being manufactured within the range of sensors that had been flagged for possible drift regardless of age (Xylem, Inc., 2022). Turbidity sensors manufactured within this range may experience a high level of drift while deployed. To evaluate the potential effect of these three turbidity sensors on the fDOM corrections, the turbidity measurements were replaced with a different turbidity record from the same filtration test but on a different sonde.
The corrected fDOM measurements from the first sensor combination in this group (20H103551; 14G102122) were highly variable across the full turbidity range for both the pooled and the sensor-specific corrections (figs. 10A, 10B). When the fDOM measurements for sensor 20H103551 were corrected using measurements from another turbidity sensor (18E105140) from the same test run, the pooled correction yielded stable corrected fDOM measurements across the full turbidity range (fig. 10C; table 9).
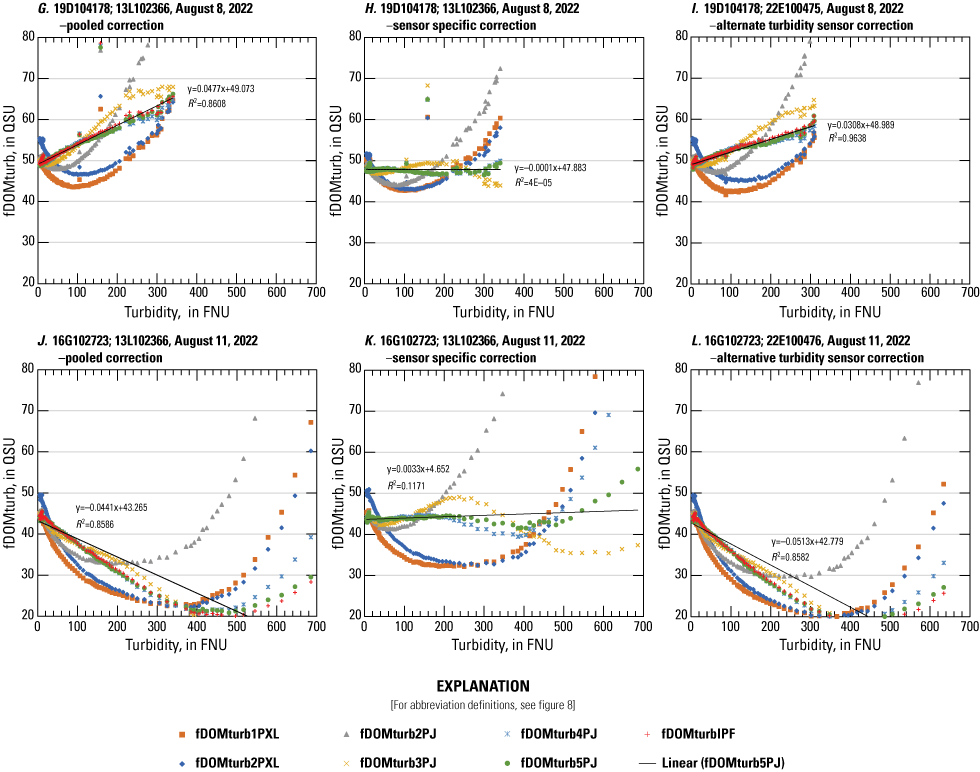
Comparison of corrected fluorescent dissolved organic matter (fDOM) measurements across the filtration experiment turbidity range for various approaches for A, fDOM sensor 20H103551 and turbidity sensor 14G102122, January 12, 2023, pooled correction; B, fDOM sensor 20H103551 and turbidity sensor 14G102122, January 12, 2023, sensor-specific correction; C, fDOM sensor 20H103551 and turbidity sensor 18E105140, January 12, 2023, alternate turbidity sensor correction; D, fDOM sensor 22D101246 and turbidity sensor 20K103202, January 12, 2023, pooled correction; E, fDOM sensor 22D101246 and turbidity sensor 20K103202, January 12, 2023, sensor-specific correction; F, fDOM sensor 22D101246 and turbidity sensor 18E105140, January 12, 2023, alternate turbidity sensor correction; G, fDOM sensor 19D104178 and turbidity sensor 13L102366, August 8, 2022, pooled correction; H, fDOM sensor 19D104178 and turbidity sensor 13L102366, August 8, 2022, sensor-specific correction; I, fDOM sensor 19D104178 and turbidity sensor 22E100475, August 8, 2022, alternate turbidity sensor correction; J, fDOM sensor 16G102723 and turbidity sensor 13L102366, August 11, 2022, pooled correction; K, fDOM sensor 16G102723 and turbidity sensor 13L102366, August 11, 2022, sensor-specific correction; L, fDOM sensor 16G102723 and turbidity sensor 22E100476, August 11, 2022, alternate turbidity sensor correction. These sensor combinations represent cases where turbidity sensor performance raised concerns about correction performance (Xylem, Inc., 2022). Data are summarized from Baxter and others (2023).
Table 9.
Summary statistics for the turbidity-corrected fluorescent dissolved organic matter (fDOM) records over the full turbidity range of the experiments for cases where alternate turbidity records were used to improve the correction. Data are summarized from Baxter and others (2023).[AVG, average; fDOM, fluorescent dissolved organic matter; fDOMturb1PXL, fluorescent dissolved organic matter measurement from the EXO fDOM Digital Smart Sensor corrected for turbidity using the one-parameter exponential function employed by Excel; fDOMturb2PJ, fluorescent dissolved organic matter measurement from the EXO fDOM Digital Smart Sensor corrected for turbidity using the two-parameter exponential function employed by JMP software; fDOMturb2PXL, fluorescent dissolved organic matter measurement from the EXO fDOM Digital Smart Sensor corrected for turbidity using the two-parameter exponential function employed by Excel; fDOMturb3PJ, fluorescent dissolved organic matter measurement from the EXO fDOM Digital Smart Sensor corrected for turbidity using the three-parameter exponential function employed by JMP software; fDOMturb4PJ, fluorescent dissolved organic matter measurement from the EXO fDOM Digital Smart Sensor corrected for turbidity using the four-parameter biexponential function employed by JMP software; fDOMturb5PJ, fluorescent dissolved organic matter measurement from the EXO fDOM Digital Smart Sensor corrected for turbidity using the five-parameter biexponential function employed by JMP software; fDOMturbIPF, fluorescent dissolved organic matter measurement from the EXO fDOM Digital Smart Sensor corrected for turbidity using the inverse polynomial approach; fDOMxoL, fluorescent dissolved organic matter calculated from Aqualog to match the EXO sensor array; OMRL, organic matter research laboratory; RSD, relative standard deviation; Stdev, standard deviation; YYYYMMDD, year/month/day; %, percent]
The corrected fDOM measurements from the second sensor combination in this group (22D101246, 20K103202) included a turbidity sensor within the manufacturing range when drift was a concern among new sensors (March 2019 through July 2021; serial numbers 19C104566 through 21H100299) but had not been identified previously during calibration. The corrected fDOM measurements using the pooled correction showed evidence of drift with a slope of −0.02 across the turbidity range of the filtration test (fig. 10D). The corrected fDOM measurements from the sensor-specific correction were stable with a zero slope (fig. 10E). When the 20K103202 turbidity record was replaced with the record from turbidity sensor 18E105140, as above, the corrected fDOM measurements using the pooled correction improved such that the slope was less than the 0.02 threshold applied (fig. 10F)—although the corrected fDOM measurements had greater variability than the sensor-specific correction, as would be expected for a separate instrument, even in a well-homogenized tank.
The other two combinations in this group included the turbidity sensor 13L102366, the oldest sensor used in the study. The fDOM sensor 19D104178 paired with 13L102366 turbidity sensor had a slope of nearly 0.05 across the turbidity range in the August 8, 2022, filtration test (fig. 10G). The corrected fDOM measurements using the sensor-specific correction showed less variability and a lower slope (fig. 10H). When the 13L102366 turbidity measurements were replaced with those from turbidity sensor 22E100475, there was improvement in the slope across the turbidity range (from nearly 0.05 to 0.03) but did not meet the criteria (slope less than 0.02) for a good correction (fig. 10I).The fDOM sensor 19D104178 was recalibrated and used in another filtration test (January 12, 2023) with a different turbidity sensor resulting in a good fDOM correction using the pooled correction equation (fig. 8C). The poor fDOM correction for the 19D104178-13L102366 sensor combination in the August 8, 2022, filtration test (fig. 10G, 10H) appeared to be caused by both the drift in the old turbidity sensor and a poor fDOM calibration.
The effect of potential drift in turbidity sensor 13L102366 on the correction to fDOM sensor 16G102723 measurements was not quantifiable. This fDOM sensor had negative values at high turbidities and required a baseline offset to process the data, similar to fDOM sensor 15A100346; however, the effect of the fDOM calibration differed. Whereas the calibration correction for sensor 15A100346 appeared to follow a step adjustment across the range of fDOM measurements, the calibration for 16G102723 appeared to be a scale adjustment across the fDOM range, leading to a slope of −0.06 across part of the turbidity range of the test with a steep upward curve at higher turbidities using the pooled correction (fig. 10J). The fDOM correction using the sensor-specific correction generated a stable record, but the effect of the offset was observable at the higher turbidities (fig. 10K). When the turbidity measurements from sensor 13L102366 were replaced with another turbidity record (22E100476), the fDOM correction did not improve but worsened because the turbidity drift compounded the deviation caused by the fDOM calibration issue (fig. 10L). Despite the age of the 13L102366 sensor and some evidence of drift, it appeared to have minimal effect on the fDOM corrections relative to the issues imparted by the apparent errors in fDOM sensor calibrations.
Two other fDOM sensors were used in two different filtration tests, 19M101717 and 22E100475, in the August 8, 2022 (figs. 9E, 9F), and August 11, 2022 (fig. 8D), tests, for which the same fDOM calibration was used, and 17K104814 and 17G102898 in the August 8, 2022 (figs. 9C, 9D), and January 12, 2023 (fig. 8A), tests, for which the fDOM sensor was recalibrated between the tests. In both cases, the fDOM corrections were stable with low slopes (less than 0.02) across the range of turbidities in the August 11, 2022, and January 12, 2023, tests, but the pooled corrections had elevated slopes (0.02–0.03) across the turbidities in the August 8, 2022, test (figs. 8, 9). These differences were relatively minor compared to the scale of the fDOM corrections across the turbidities tested. The only factor that changed among the tests was the 2,500-mg ESL in the August 8, 2022, test versus the 2,000-mg ESL in the August 11, 2022, and January 12, 2023, tests. Further testing should attempt to quantify the effect of concentration on the corrections.
Non-Exponential Approach to Fluorescent Dissolved Organic Matter Corrections
The alternate approach to fitting the fDOM-turbidity curves without exponential fits performed well (table 10; fig. 11). The inverse polynomial fit (IPF) was best fit with a quadratic equation of the form:
where The correction is simply a scale-factor correction that is applied by multiplying the result by the temperature-corrected fDOMxos (fDOMwt) at any turbidity.The resulting fDOM corrections were comparable to the biexponential 5P fit (table 8). One benefit of this approach over the exponential approach is that the sensor combinations with poor fDOM corrections were immediately identified by simply plotting the data and thus were easily flagged for review (fig. 11). This finding is likely because the fDOMfilt/fDOMwt metric more effectively exposes the calibration deviations at the low end of the measured fDOM, where the fit to the data carries more weight compared to the fDOMwt/fDOMfilt metric. Because this approach identified data of poor quality earlier in the process, it may serve as a tool to screen sensor performance. Further evaluations are warranted to determine the robust/stable nature of the quadratic fit and its potential utility as a sensor quality assurance screening tool.
Table 10.
Experiment-derived terms for the inverse polynomial correction equations for the sensor combinations and 11-sensor and 7-sensor pooled data. Data are summarized from Baxter and others (2023).[fDOM, fluorescent dissolved organic matter; SN, serial number; YYYYMMDD, year/month/day]
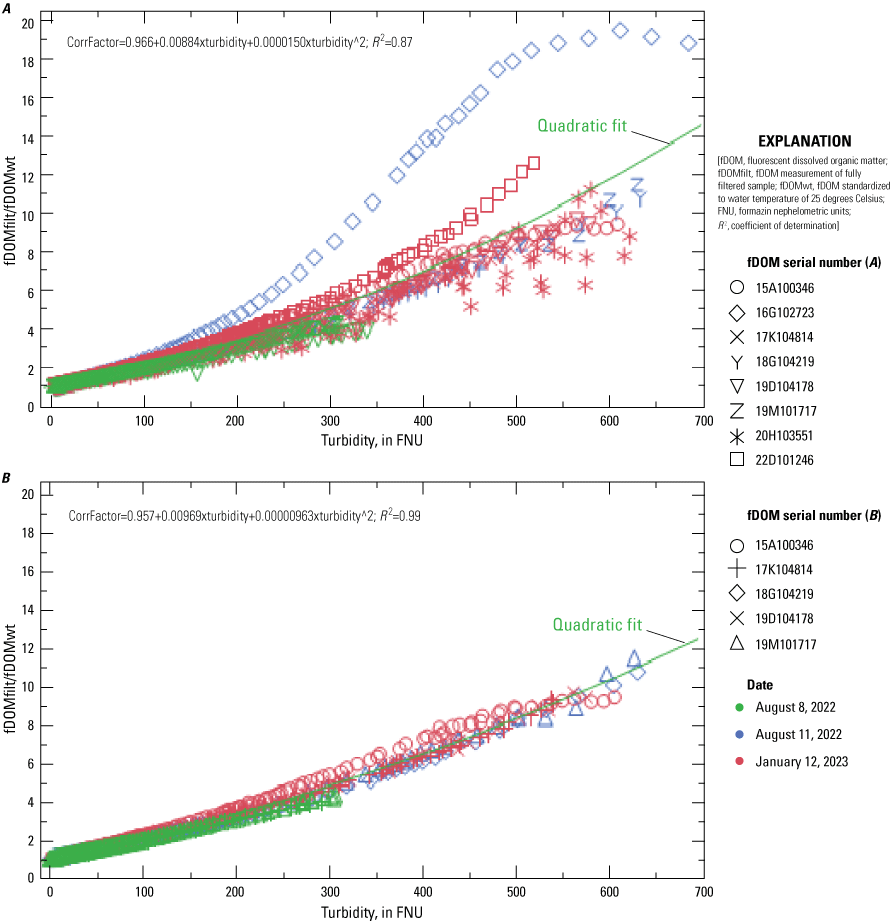
Inverse polynomial approach fits for A, the 11 sensor combinations used to generate the exponential fits and B, the top performing 7 sensor combinations identified using the inverse polynomial approach. Data are summarized from Baxter and others (2023).
Summary and Conclusions
The use of field-deployable fluorescence sensors has grown immensely in recent years to better understand water quality, ecosystem dynamics, and contaminant transport. One of the most popular fluorescence sensors in use across the U.S. Geological Survey (USGS) is the fluorescent dissolved organic matter (fDOM) sensor. While these sensors can provide valuable information about dissolved organic matter dynamics, interference from turbidity can negatively affect sensor accuracy and precision—particularly in systems with turbidities above 300 formazin nephelometric units (FNU) (Booth and others, 2023). A lab study was designed to evaluate turbidity corrections to fDOM measurements across a range of sensor manufacturing dates covering turbidities from 5 FNU to 600 FNU. No systematic change in fDOM correction coefficients was observed across sensors with serial numbers representing manufacturing years 2015 through 2022. In addition, the experiment revealed that corrections for turbidities were robust up to 600 FNU when higher level exponential fits were applied compared to the one- or two-parameter exponential fits commonly used across the USGS (Downing and others, 2012; Booth and others, 2023). When the water sample used in the experiment minimized inner-filtering effects from high absorbance, the one-parameter (1P), two-parameter (2P), and three-parameter (3P) corrections did not provide a reliable fDOM correction for the filtration tests; however, seven of the fDOM-turbidity sensor combinations provided consistent corrected fDOM values across the full turbidity range using the two biexponential equations (four-parameter [4P] and five-parameter [5P]) and an inverse polynomial (IPF) approach (table 8).
The more complex fitting approaches for fDOM corrections were superior to the current guidance for the USGS in high-turbidity conditions. The 4P, 5P and IPF approaches produced similar corrected values with each proving best for at least one sensor combination. There were some benefits to the IPF approach. Applying the inverse of the commonly used fDOM ratio with a quadratic fit provided a better indicator of fDOM data quality than the exponential approach (fig. 11). In this approach, the correction factor also represents a simple scale factor representing the ratio fDOMfilt:fDOMwt, which can be used to highlight potential concerns about uncertainty or compounded error. A correction factor of 10 or greater may introduce substantial error considering the precision of fDOM sensors is on the scale of 1 QSU when the sensor readings are less than 10 QSU (Booth and others, 2023). Finally, the biexponential fitting approach (4P and 5P) requires the use of advanced statistical software or coding experience, whereas the inverse polynomial fitting approach (IPF) offers the dual benefit of being relatively easy to apply, even using approximated exponential equations.
Although not the objective of the study, the inconsistent fDOM results among sensors in the final filtered solution was concerning. Despite all sensors meeting the quality control evaluation step in the instrument software, the experiment revealed performance issues. Two fDOM sensors were wholly removed from the analysis. Two other sensors were baseline-adjusted to remove negative values at the highest turbidities. Although this adjustment addressed the initial problem of fitting an equation to negative numbers, the corrected fDOM measurements were less accurate than the seven well-calibrated sensors. The effect of turbidity sensor age also appeared to contribute to uncertainty in the corrections. This highlights the high level of care that must be taken in sensor calibrations, and the need for a verification step in sensor calibrations. In addition to passing quinine sulfate calibration checks, sensor performance should be evaluated using a secondary calibration check to evaluate intercomparisons among sensors in native waters or a suitable analog for dissolved organic matter with a known, repeatable response for the sensor, such as Suwanee River Natural Organic Matter (International Humic Substances Society, St. Paul, Minnesota; https://humicsubstances.org/). Additional efforts to verify inter-comparability among sensors may be warranted as sensors age.
Future work could include further testing of the turbidity corrections for different sediment and water types to better understand the variations in the fits and correctable ranges of turbidity in different systems. Specific properties that may affect the corrections include particle size and shape, spectral absorbance of the solution and particle phases, and salinity effects.
Acknowledgments
The authors would like to extend our appreciation to U.S. Geological Survey (USGS) staff Brian Pellerin, Russ Lotspeich, James Duncker, and Tim Straub for their contributions to the genesis and ongoing support of this project. We would also like to thank Diana Oros, Bryan Bonham (former USGS), Anne Le (former USGS), Corrine Sanford (former USGS), Balt Von Hoyningen Huene (former USGS), Kyle Nakatsuka, and Tommy Ly (former USGS) for their supporting roles in sensor and laboratory measurements. We would also like to thank our USGS colleagues, Kim Shaffer and Amanda Booth, for their insightful reviews of the report drafts. Funding was provided by the USGS Next Generation Water Observation System, with additional support from the Hydrologic Networks Branch and the Proxies Project.
References Cited
Baxter, T.J., Fleck, J.A., and Hansen, A.M., 2023, Fluorescence sensor measurements in sediment suspensions to evaluate turbidity corrections: U.S. Geological Survey data release, accessed September 17, 2024, at https://doi.org/10.5066/P9OB430E.
Bergamaschi, B.A., Fleck, J.A., Downing, B.D., Boss, E., Pellerin, B., Ganju, N.K., Schoellhamer, D.H., Byington, A.A., Heim, W.A., Stephenson, M., and Fujii, R., 2011, Methyl mercury dynamics in a tidal wetland quantified using in situ optical measurements: Limnology and Oceanography, v. 56, no. 4, p. 1355–1371, accessed September 8, 2022, at https://doi.org/10.4319/lo.2011.56.4.1355.
Booth, A.C., Poulin, B.A., and Krabbenhoft, D.P., 2020, Observed and modeled mercury and dissolved organic carbon concentrations and loads at control structure S-12D, Florida Everglades, 2013–17: U.S. Geological Survey Open-File Report 2020–1092, 27 p., accessed September 8, 2022, at https://doi.org/10.3133/ofr20201092.
Booth, A., Fleck, J., Pellerin, B.A., Hansen, A., Etheridge, A., Foster, G.M., Graham, J.L., Bergamaschi, B.A., Carpenter, K.D., Downing, B.D., Rounds, S.A., and Saraceno, J., 2023, Field techniques for fluorescence measurements targeting dissolved organic matter, hydrocarbons, and wastewater in environmental waters—Principles and guidelines for instrument selection, operation and maintenance, quality assurance, and data reporting: U.S. Geological Survey Techniques and Methods, book 1, chap. D11, 41 p., accessed September 17, 2024, at https://doi.org/10.3133/tm1D11.
Downing, B.D., Boss, E., Bergamaschi, B.A., Fleck, J.A., Lionberger, M.A., Ganju, N.K., Schoellhamer, D.H., and Fujii, R., 2009, Quantifying fluxes and characterizing compositional changes of dissolved organic matter in aquatic systems in situ using combined acoustic and optical measurements: Limnology Oceanography Methods, v. 7, no. 1, p. 119–131, accessed September 17, 2024, at https://doi.org/10.4319/lom.2009.7.119.
Downing, B.D., Pellerin, B.A., Bergamaschi, B.A., Saraceno, J.F., and Kraus, T.E.C., 2012, Seeing the light—The effects of particles, dissolved materials, and temperature on in situ measurements of DOM fluorescence in rivers and streams: Limnology Oceanography—Methods, v. 10, no. 10, p. 767–775, accessed September 17, 2024, at https://doi.org/10.4319/lom.2012.10.767.
Fleck, J.A., Hansen, A.M., Oros, D.M., and Booth, A.C., 2022, Comparisons from an Aqualog fluorometer standardized to quinine sulfate equivalents (QSE) with excitation (ex) and emissions (em) equivalent to fluorescence of dissolved organic matter (fDOM) sensors from multiple manufacturers: U.S. Geological Survey data release, accessed September 17, 2024, at https://doi.org/10.5066/P9VJUCTP.
Groeneveld, M., Catalán, N., Einarsdottir, K., Bravo, A.G., and Kothawala, D.N., 2022, The influence of pH on dissolved organic matter fluorescence in inland waters: Analytical Methods, v. 14, no. 13, p. 1351–1360. [Available at https://doi.org/10.1039/D1AY01702K.]
Hansen, A.M., Fleck, J.A., Kraus, T.E.C., Downing, B.D., von Dessonneck, T., and Bergamaschi, B.A., 2018, Procedures for using the Horiba Scientific Aqualog® fluorometer to measure absorbance and fluorescence from dissolved organic matter: U.S. Geological Survey Open-File Report 2018–1096, 31 p., accessed September 17, 2024, at https://doi.org/10.3133/ofr20181096.
Hansen, A.M., Oros, D., Handley, R.A.Q., Nakatsuka, K., Von Hoyningen Huene, B., Delascagigas, A., Jetson, T., Burau, D., Gelber, A., Ahmed, Q., Berrios, S., Fleck, J.A., and Pellerin, B.A., 2021, Data from the development and testing of a multiparameter standard solution for fluorescent dissolved organic matter (fDOM) and algal fluorescence (fChl) (ver. 2.0, July 2022): U.S. Geological Survey data release, https://doi.org/10.5066/P91LJNAU.
Lee, E.-J., Yoo, G.-Y., Jeong, Y., Kim, K.-U., Park, J.-H., and Oh, N.-H., 2015, Comparison of UV–VIS and FDOM sensors for in situ monitoring of stream DOC concentrations: Biogeosciences, v. 12, no. 10, p. 3109–3118, accessed September 17, 2024, at https://doi.org/10.5194/bg-12-3109-2015.
Manning, C.G., 2023, Technology readiness levels: NASA web page, accessed September 17, 2024, at https://www.nasa.gov/directorates/somd/space-communications-navigation-program/technology-readiness-levels/.
Messner, M.L., Perkins, M.K., and Bunch, A.R., 2023, Comparison of turbidity sensors at U.S. Geological Survey supergages in Indiana from November 2018 to December 2021: U.S. Geological Survey Scientific Investigations Report 2023–5077, 13 p., accessed September 17, 2024, at https://doi.org/10.3133/sir20235077.
Ohno, T., 2002, Fluorescence inner-filtering correction for determining the humification index of dissolved organic matter: Environmental Science & Technology, v. 36, no. 4, p. 742–746, accessed September 8, 2022, at https://doi.org/10.1021/es0155276.
Regier, P.J., González-Pinzón, R., Van Horn, D.J., Reale, J.K., Nichols, J., and Khandewal, A., 2020, Water quality impacts of urban and non-urban arid-land runoff on the Rio Grande: Science of the Total Environment, v. 729, 15 p. [Available at https://doi.org/10.1016/j.scitotenv.2020.138443.]
Saraceno, J.F., Shanley, J.B., Downing, B.D., and Pellerin, B.A., 2017, Clearing the waters—Evaluating the need for site-specific field fluorescence corrections based on turbidity measurements: Limnology Oceanography—Methods, v. 15, no. 4, p. 408–416, accessed September 17, 2024, at https://doi.org/10.1002/lom3.10175.
Watras, C.J., Hanson, P.C., Stacy, T.L., Morrison, K.M., Mather, J., Hu, Y.-H., and Milewski, P., 2011, A temperature compensation method for CDOM fluorescence sensors in freshwater: Limnology Oceanography—Methods, v. 9, no. 7, p. 296–301, accessed September 17, 2024, at https://doi.org/10.4319/lom.2011.9.296.
Xylem, Inc., 2022, Qualifying EXO turbidity sensors for LED drift: Xylem Environmental Solutions web page, accessed September 17, 2024, at https://www.xylemanalytics.com/File%20Library/Resource%20Library/YSI/Technical%20Notes/YSI-EXO-Turbidity-Sensor-Drift-Check.pdf.
Xylem, Inc., 2024, EXO User manual—Advanced water quality [monitoring] platform: Xylem Environmental Solutions web page, accessed September 17, 2024, at https://www.ysi.com/File%20Library/Documents/Manuals/EXO-User-Manual-Web.pdf.
Supplemental Information
Concentrations of chemical constituents in water are in either milligrams per liter (mg/L) or micrograms per liter (µg/L).
Abbreviations
1P
one parameter
2P
two parameter
3P
three parameter
4P
four parameter
5P
five parameter
AVG
average
DOM
dissolved organic matter
ESL
Elliot Silt Loam
FNU
formazin nephelometric units
HDPE
high-density polyethylene
IHSS
International Humic Substances Society
IPF
inverse polynomial function
LED
light emitting diode
NASA
National Aeronautics and Space Administration
NTU
nephelometric turbidity units
OFW
organic free water
OMRL
Organic Matter Research Laboratory
PVC
polyvinyl chloride
QSU
quinine sulfate units
RMSE
root mean squared error
RSD
relative standard deviation
SRNOM
Suwanee River natural organic matter
Stdev
standard deviation
TRL
technology readiness level
USGS
U.S. Geological Survey
VDC
volts of direct current
VOC
volatile organic carbon
fDOM Measurements
fDOM
fluorescent dissolved organic matter
fDOMfilt
fluorescent dissolved organic matter measurement from the EXO fDOM Digital Smart Sensor after complete sample filtration
fDOMturb
fluorescent dissolved organic matter measurement from the fDOM Sensor corrected for turbidity
fDOMturb2PJ
fluorescent dissolved organic matter measurement from the fDOM Sensor corrected for turbidity using the two-parameter exponential function employed by JMP software
fDOMturb3PJ
fluorescent dissolved organic matter measurement from the fDOM Sensor corrected for turbidity using the three-parameter exponential function employed by JMP software
fDOMturb4PJ
fluorescent dissolved organic matter measurement from the fDOM Sensor corrected for turbidity using the four-parameter biexponential function employed by JMP software
fDOMturb5PJ
fluorescent dissolved organic matter measurement from the fDOM Sensor corrected for turbidity using the five-parameter biexponential function employed by JMP software
fDOMturb1PXL
fluorescent dissolved organic matter measurement from the fDOM Sensor corrected for turbidity using the one-parameter exponential function employed by Excel
fDOMturb2PXL
fluorescent dissolved organic matter measurement from the fDOM Sensor corrected for turbidity using the two-parameter exponential function employed by Excel
fDOMturbIPF
fluorescent dissolved organic matter measurement from the fDOM Sensor corrected for turbidity using the inverse polynomial approach
fDOMwt
fluorescent dissolved organic matter measurement from the fDOM Sensor corrected for water temperature
fDOMxoL
fluorescent dissolved organic matter measurement from the Aqualog instrument in the laboratory, calibrated to EXO fDOM Digital Smart Sensor array using quinine sulfate
fDOMxoS
fluorescent dissolved organic matter measurement from the EXO fDOM Digital Smart Sensor
For more information concerning the research in this report, contact the
Director, California Water Science Center
U.S. Geological Survey
6000 J Street, Placer Hall
Sacramento, California 95819
https://www.usgs.gov/centers/california-water-science-center
Publishing support provided by the USGS Science Publishing Network,
Sacramento Publishing Service Center
Disclaimers
Any use of trade, firm, or product names is for descriptive purposes only and does not imply endorsement by the U.S. Government.
Although this information product, for the most part, is in the public domain, it also may contain copyrighted materials as noted in the text. Permission to reproduce copyrighted items must be secured from the copyright owner.
Suggested Citation
Fleck, J.A., Baxter, T.J., and Hansen, A.M., 2026, Evaluation of turbidity corrections for fluorescent dissolved organic matter (fDOM) sensors: U.S. Geological Survey Open-File Report 2026–1063, 30 p., https://doi.org/10.3133/ofr20261063.
ISSN: 2331-1258 (online)
| Publication type | Report |
|---|---|
| Publication Subtype | USGS Numbered Series |
| Title | Evaluation of turbidity corrections for EXO fluorescent dissolved organic matter (fDOM) sensors |
| Series title | Open-File Report |
| Series number | 2026-1063 |
| DOI | 10.3133/ofr20261063 |
| Publication Date | March 06, 2026 |
| Year Published | 2026 |
| Language | English |
| Publisher | U.S. Geological Survey |
| Publisher location | Reston, VA |
| Contributing office(s) | California Water Science Center |
| Description | Report: vi, 30 p.; Data Release |
| Online Only (Y/N) | Y |