

Floods of June 2024 in Northwestern Iowa
Links
- Document: Report (2.3 MB pdf) , HTML , XML
- Data Release: USGS data release - Peak-flow frequency analysis for U.S. Geological Survey streamgages in northwestern Iowa, based on data through water year 2024
- NGMDB Index Page: National Geologic Map Database Index Page (html)
- Download citation as: RIS | Dublin Core
Abstract
Following a heavy, multiday rainfall event that took place between June 20 and June 22, 2024, widespread flooding occurred in parts of northwestern Iowa. Ten U.S. Geological Survey (USGS) streamgages with periods of record ranging from 56 to 99 years in length experienced new peaks of record, three of which were more than double the previous peak-of-record: 06483500 (Rock River near Rock Valley, Iowa), 06605850 (Little Sioux River at Linn Grove, Iowa), and 06606600 (Little Sioux River at Correctionville, Iowa). A Presidential declaration of a major disaster for the State of Iowa was approved on June 24, 2024, and the cost of the flooding is estimated at over $310 million. The severity of this flooding prompted the USGS, in cooperation with the Iowa Department of Transportation, to summarize the meteorological and hydrological conditions preceding the flooding, compile estimates of the magnitude of peak flows resulting from the flooding, and update estimates of peak-flow frequency for selected USGS streamgages. Of the 33 streamgages analyzed, a peak streamflow occurred that corresponded to an annual exceedance probability of less than 4 percent at 13 streamgages, an annual exceedance probability of less than 1 percent at 6 streamgages, and an annual exceedance probability of less than 0.2 percent at 1 streamgage.
Introduction
Heavy, multiday rainfall occurred in northwestern Iowa, southwestern Minnesota, and southeastern South Dakota from June 20, 2024, through June 22, 2024, resulting in widespread flooding. Large parts of northwestern Iowa experienced 2 to 6 inches (in.) of rainfall, with some areas recording upwards of 12 in. (National Weather Service, 2024a; National Oceanic and Atmospheric Administration, 2025; fig. 1). By June 22, 2024, a state disaster had been declared for 22 counties in Iowa (State of Iowa, 2024). Flooding was observed in the Big Sioux, Des Moines, Floyd, Little Sioux, Ocheyedan, and Rock River basins in Iowa and included observations of new record stage at many National Water Prediction Service stations (National Weather Service, 2024a, b; National Oceanic and Atmospheric Administration, 2025). Flood stages exceeding previous records by 5 feet or more were recorded at some U.S. Geological Survey (USGS) streamgages. For instance, USGS streamgage 06483500 (Rock River near Rock Valley, Iowa) peaked at 27.7 feet on June 22, 2024, compared to the previous peak record of 22.7 feet (National Weather Service, 2024a; U.S. Geological Survey, 2025a; fig. 2). Peak-of-record streamflows were observed at 10 of the USGS streamgage locations included in this study. The USGS, in cooperation with the Iowa Department of Transportation, has summarized the meteorological and hydrologic conditions that led to the flooding, compiled peak-streamflow data resulting from the event, and updated estimates of peak-flow frequency for 33 selected USGS streamgages that incorporate the June 2024 annual peak streamflows (fig. 3).
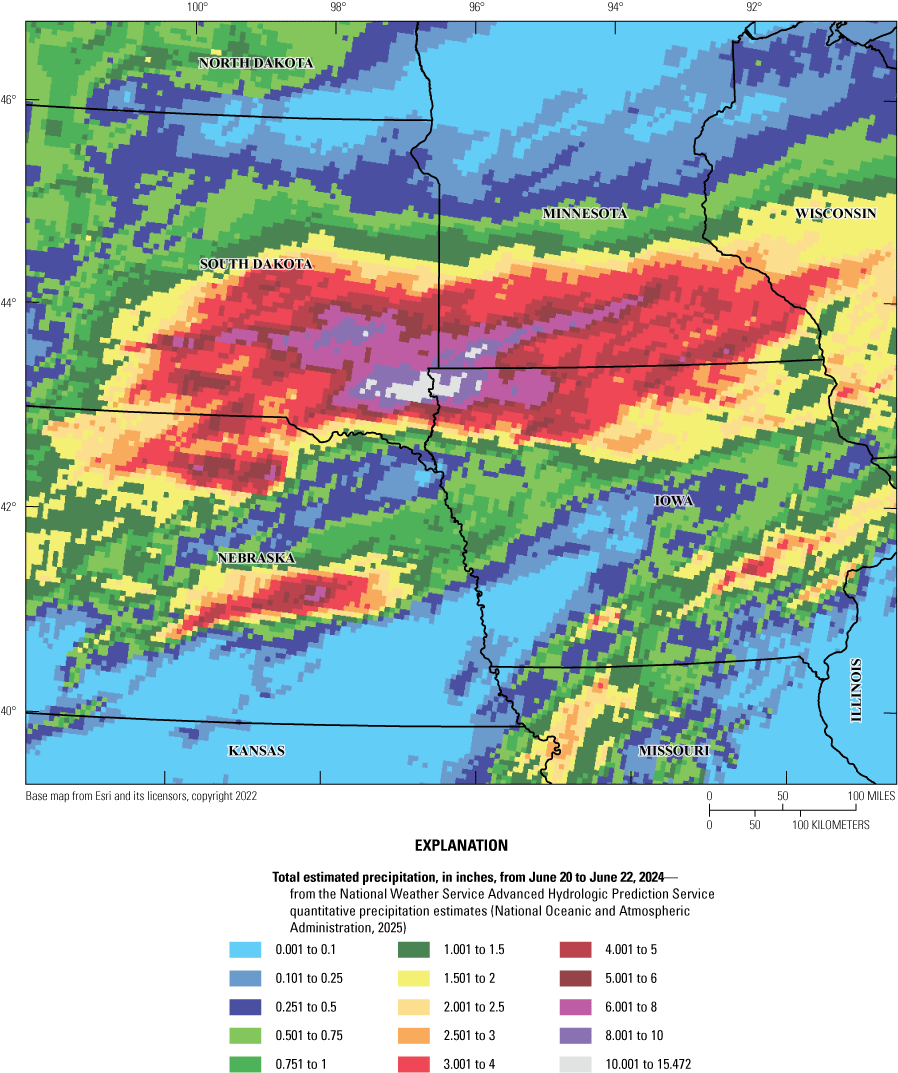
Map showing precipitation totals, in inches, of the rain event from June 20 to June 22nd, 2024, primarily across southeastern South Dakota, southwestern Minnesota, and northwestern Iowa.
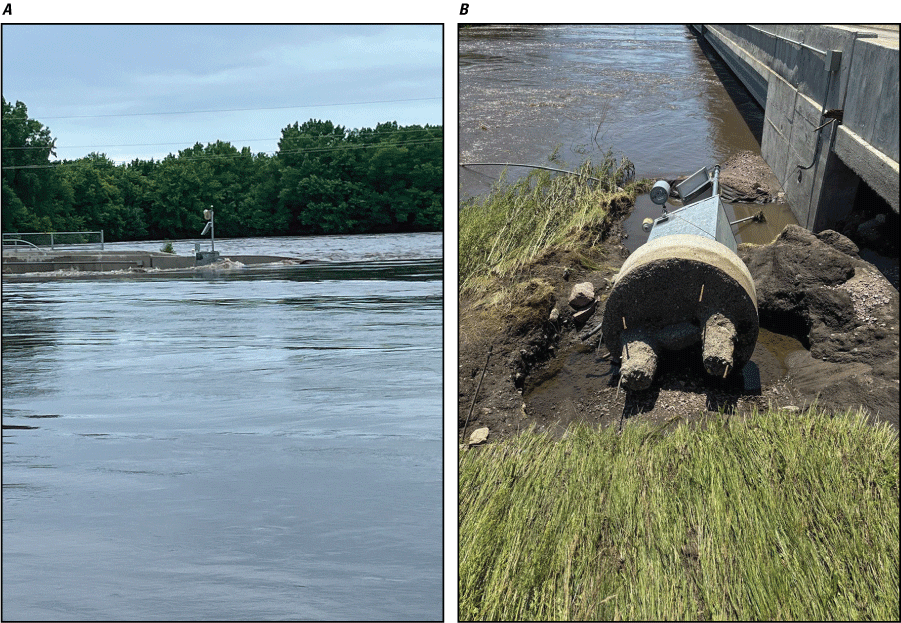
Photographs showing U.S. Geological streamgage 06483500 at Rock River near Rock Valley, Iowa (A) on June 22, 2024, near the peak of the flood event and (B) after the flood waters had receded. Photographs provided by U.S. Geological Survey.
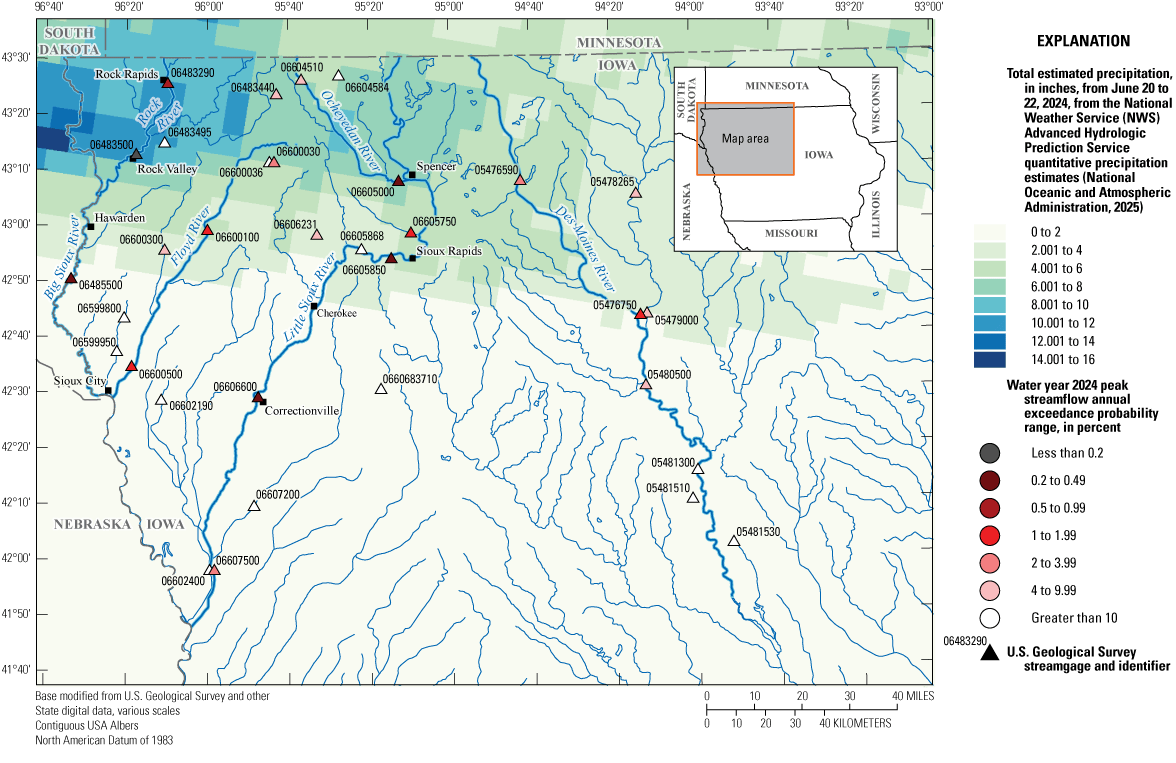
Map showing U.S. Geological Survey streamgages included in the study, denoting the annual exceedance probability range of the June 2024 peak streamflow and displaying estimated precipitation totals for June 20 to June 22, 2024 (National Oceanic and Atmospheric Administration, 2025).
Purpose and Scope
This report presents hydrologic and flood-probability information related to the flooding in northwestern Iowa that occurred during June 2024. Antecedent and meteorologic conditions contributing to the flooding are described. Peak-streamflow data are presented for 33 active USGS streamgages with at least 10 years of annual peak-streamflow record in the Big Sioux, Des Moines, Floyd, Little Sioux, Ocheyedan, and Rock River basins. Updated estimates of peak-flow frequency that include the June 2024 peak streamflows are presented for all 33 streamgages (fig. 3). Input and output data from the peak-flow frequency analysis described here can be found in O’Shea and Marti (2026).
Antecedent Conditions
From January through early March 2024, parts of northwestern Iowa experienced abnormally dry to moderate drought conditions (National Drought Mitigation Center, 2024; fig. 4). In January, far northwestern Iowa experienced above average levels of precipitation followed by below average precipitation in February (Glisan, 2024b, c). In March, most of western Iowa experienced 150–200 percent of normal precipitation (Glisan, 2024d), and by the end of the month a large part of northwestern Iowa was no longer experiencing drought conditions (National Drought Mitigation Center, 2024; fig. 4). In April, northwestern and southeastern Iowa experienced precipitation that was 150–300 percent of normal (Glisan 2024a). Subsoil moisture in northwestern Iowa, measured on April 21, 2024, to a depth of 5 feet in 1-foot increments, was consistent with wet conditions. The top 5 feet of Iowa soil have the potential to hold 10 to 11 in. of moisture (Sorenson and Ten Napel, 2024); in late April, the average subsoil moisture in six counties in northwestern Iowa was 9.6 in. (Sorenson and Ten Napel, 2024).
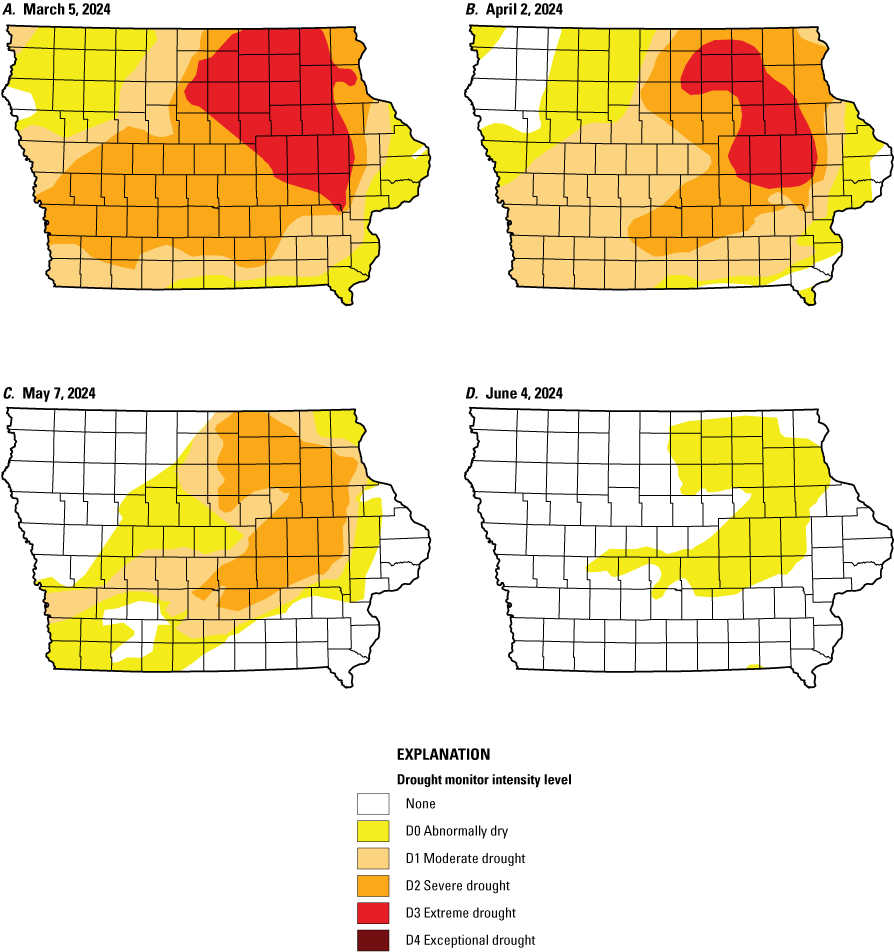
Figures showing drought conditions in Iowa for early March through early June 2024. A, March 5, 2024. B, April, 2, 2024. C, May 7, 2024, and D, June 4, 2024 (National Drought Mitigation Center, 2024).
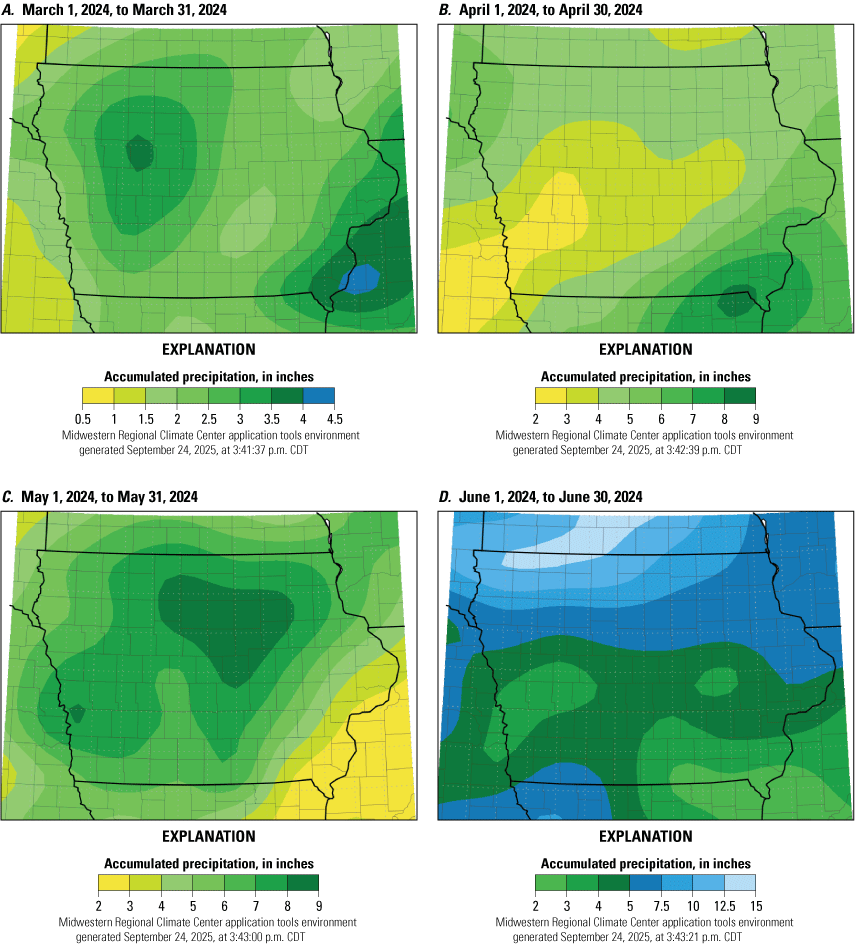
Figures showing State of Iowa monthly accumulated precipitation, in inches, for spring 2024. A, March 2024, B, April 2024, C, May 2024, D, June 2024 (Midwestern Regional Climate Center, 2025).
May 2024 ranked as the eighth wettest May in 152 years of statewide records (Glisan, 2024e), with many parts of the State experiencing above average precipitation (fig. 5). By the end of May, northwestern Iowa was completely free of drought (National Drought Mitigation Center, 2024; fig. 4). Spring 2024 (March through May) in northwestern Iowa was very wet, with some areas experiencing the third wettest spring since 1893 (Iowa Environmental Mesonet, 2024). Daily mean streamflows leading up to the June 2024 rain event were already elevated in many parts of northwestern Iowa, like at USGS streamgages 06483500 (Rock River near Rock Valley, Iowa) and 06605850 (Little Sioux River at Linn Grove, Iowa). These streamgages, which have a length of record of about 75 and 50 years, experienced peaks of record on June 22, 2024, and June 23, 2024, respectively. Hydrographs for water year 2024 (a water year is the period from October 1 to September 30 that is designated by the year in which it ends) show that daily mean streamflow in May and June 2024 at these streamgages was already in the 75–95th percentile before the June 2024 event (fig. 6; U.S. Geological Survey, 2025b).
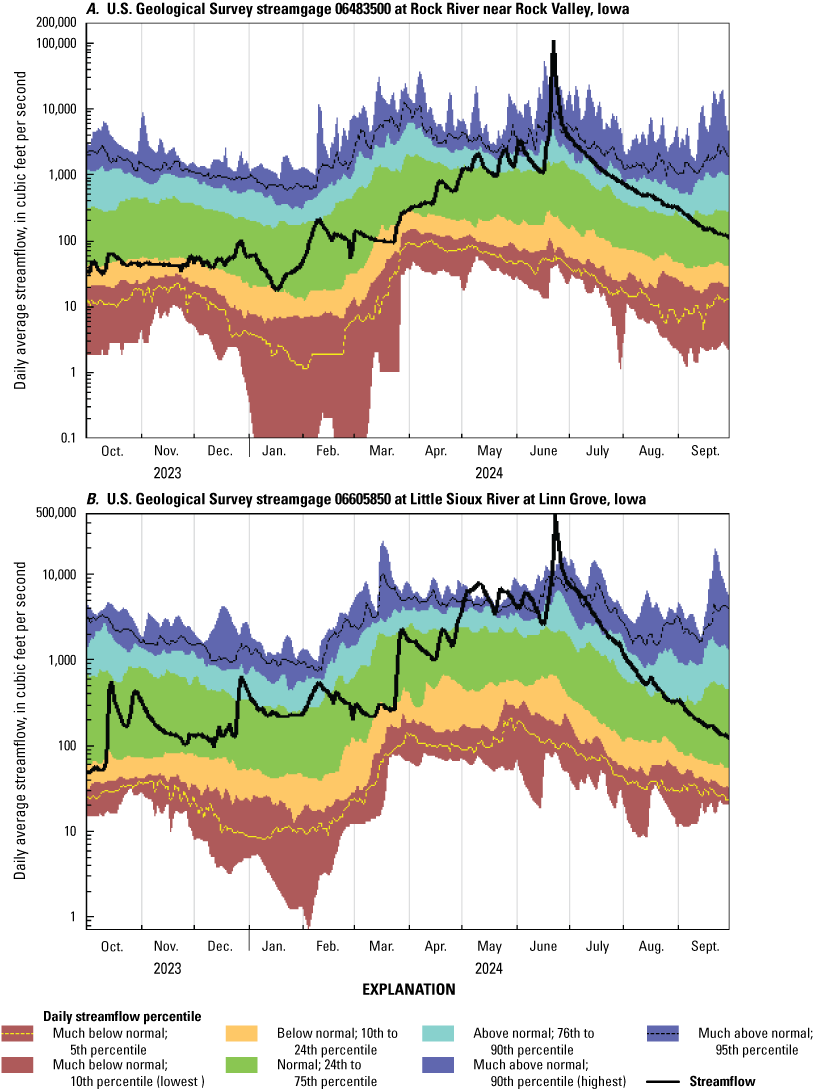
Hydrographs showing daily mean streamflow for water year 2024 for (A) U.S. Geological Survey streamgage 06483500 (Rock River near Rock Valley, Iowa), and (B) U.S. Geological Survey streamgage 06605850 (Little Sioux River at Linn Grove, Iowa).
Flood Effect
Flooding within a single river basin can exhibit considerable spatial variability. Although sustained rainfall may lead to significant flooding in one portion of a river basin, other areas within the same basin may receive only intermittent precipitation. Basin characteristics, such as topography, land cover, and soil type may also influence the extent and severity of flooding. Specific USGS streamgages mentioned in this section are intended to highlight portions of the given river basins that experienced significant flooding. A full list of USGS streamgages available in these river basins can be found in table 1.
Table 1.
Peak-streamflow data for June 2024, including the associated annual exceedance probability and peak-of-record for each of the selected streamgages.[Dates shown as month/day/year. >, greater than; <, less than; NA, not applicable]
In the Des Moines River basin, peak streamflow associated with the June 2024 rainfall at USGS streamgages 05476590 (Des Moines River at Emmetsburg, Iowa) and 05476750 (Des Moines River at Humboldt, Iowa) exceeded the historic floods of 1965, 1993, 2010, and 2019 (table 1).The June 2024 flood peak at USGS streamgage 05476590 (Des Moines River at Emmetsburg, Iowa) was 45 percent larger than the previous peak-of-record observed in 2019 (table 1). The June 2024 peak streamflow was not as significant at streamgages located further downstream along the Des Moines River mainstem or its tributaries.
Along the Rock River, widespread flooding was reported in the communities of Rock Rapids and Rock Valley (Schwaller, 2025; fig. 3). Rock Valley, a town with a population of 4,059 at the time of the 2020 census and located along the Rock River, experienced catastrophic flooding and had a total of 500 homes that sustained damage (U.S. Census Bureau, 2021; Brummer, 2025). The June 2024 flood was the largest flood of record along the mainstem of the Rock River, exceeding the historic peaks of 1962, 1969, 2010, 2014, 2018, and 2019 at USGS streamgages 06483290 (Rock River below Tom Creek at Rock Rapids, Iowa) and 06483500 (Rock River near Rock Valley, Iowa; table 1). Prior to the June 2024 flood peak, the largest recorded flood along the mainstem of the Rock River was observed in June 2014. The June 2024 flood peak at USGS streamgage 06483290 (Rock River below Tom Creek at Rock Rapids, Iowa) was 30 percent larger than the 2014 flood. The June 2024 peak downstream from USGS streamgage 06483290 at USGS streamgage 06483500 (Rock River near Rock Valley, Iowa) was more than 150 percent larger than the June 2014 flood (table 1). For streamgages located along the gaged tributaries of the Rock River, including USGS streamgages 06483440 (Dawson Creek near Sibley, Iowa) and 06483495 (Burr Oak Creek near Perkins, Iowa), the June 2024 peak was the sixth and fifth largest observed peak, respectively (U.S. Geological Survey, 2025a).
In the Big Sioux River basin, the June 2024 flood peak at USGS streamgage 06485500 (Big Sioux River at Akron, Iowa) was the largest peak streamflow observed during the streamgage’s 96 years of record. This new peak-of-record was more than 60 percent larger than the previous peak-of-record associated with the June 2014 flood (table 1). Widespread flooding was reported along the Big Sioux River including Hawarden, Iowa, a community of 2,700 located on the eastern bank of the Big Sioux River (U.S. Census Bureau, 2021; Schwaller, 2025).
At the two USGS streamgages located on the mainstem of the Floyd River, USGS streamgages 06600100 (Floyd River at Alton, Iowa) and 06600500 (Floyd River at James, Iowa), the June 2024 flood was the second largest peak behind only the June 1953 peak (table 1). Along the Little Floyd River, a northern tributary to the Floyd River, the June 2024 flood was the largest observed peak at USGS streamgages 06600030 (Little Floyd River near Sanborn, Iowa) and 06600036 (Sweeney Creek Tributary near Sheldon, Iowa; table 1) exceeding the previous peak-of-record associated with the June 2018 peak.
Within the Little Sioux River basin, widespread flooding was reported in the communities of Spencer, Sioux Rapids, and Cherokee (Schwaller, 2025; fig. 3). Spencer, a town with a population of 11,325 as of the 2020 census, is located at the confluence of the Little Sioux and Ocheyedan Rivers. It is estimated that 80 percent of buildings in Spencer suffered some degree of flood damage (U.S. Census Bureau, 2021; Brummer, 2025). The June 2024 flood was the largest flood of record along the mainstem of the Little Sioux River at USGS streamgages 06605850 (Little Sioux River at Linn Grove, Iowa) and 06606600 (Little Sioux River at Correctionville, Iowa), exceeding the historic peaks of 1953, 1965, and 2019 (table 1; U.S. Geological Survey, 2025a). Prior to the June 2024 flood peak, the largest recorded flood along the mainstem of the Little Sioux River was observed in March 2019. The June 2024 flood peak at USGS streamgages 06605850 (Little Sioux River at Linn Grove, Iowa) and 06606600 (Little Sioux River at Correctionville, Iowa) were more than double the March 2019 peaks (table 1). Much further downstream at USGS streamgage 06607500 (Little Sioux River near Turin, Iowa), close to the confluence of the Little Sioux River with the Missouri River, the June 2024 flood peak was second only to the March 2019 flood (table 1). For gaged tributaries in the middle portion of the Little Sioux River basin, USGS streamgages 06605750 (Willow Creek near Cornell, Iowa), 06605868 (Little Sioux River Tributary near Peterson, Iowa), and 06606231 (Willow Creek near Calumet, Iowa), the June 2024 flood was the second, fifth, and third largest flood, respectively (U.S. Geological Survey, 2025a). The June 2024 flood was not significant along the tributaries to the Little Sioux River located downstream of Correctionville, including the Maple River.
The Ocheyedan River, a major tributary to the Little Sioux River located in the upper portion of the Little Sioux River basin, flows into the Little Sioux River at Spencer. The June 2024 flood peak along the Ocheyedan River was the largest peak-of-record at USGS streamgage 06604510 (Ocheyedan River near Ocheyedan, Iowa) and was 25 percent larger than the previous peak-of-record from June 1993 (table 1). The June 2024 flood was the second largest flood at USGS streamgage 06605000 (Ocheyedan River near Spencer, Iowa) behind only the historic peak of June 1953 (table 1). USGS streamgage 06604510 (Ocheyedan River near Ocheyedan, Iowa) does not have an estimated discharge associated with the June 1953 flood.
A Presidential declaration of a major disaster for the State of Iowa was approved on June 24, 2024 (FEMA–4796–DR; Federal Emergency Management Agency, 2024). This declaration approved the release of FEMA funds from the Individual Assistance program, which is used to provide financial and direct services to individuals and households and to the Public Assistance program, which provides supplemental grants to State, local, and Tribal governments to help repair or replace disaster-damaged infrastructure. As of November 10, 2025, approximately $69 million in individual assistance and approximately $56.5 million in public assistance had been distributed in Iowa as a result of the Presidential disaster declaration (Federal Emergency Management Agency, 2024). The cost of the June 2024 flood in northwestern Iowa has been estimated to be in excess of $310 million (Brummer, 2025).
Effects from the flooding include road closures caused by flooded roadways and bridges. The Iowa Department of Transportation reported at least 20 locations along the primary highway systems in the State had road closures as of 8:30 a.m. on Saturday, June 22 (Iowa Department of Transportation, 2024). Beyond the economic effects, road closures during flood events pose health and safety concerns by impeding the evacuation of flooded areas and the delivery of supplies to affected communities. According to public announcements of road closures by the Iowa Department of Transportation, the following highways in Iowa had at least one portion of road closed due to active flooding between June 21 and June 28, 2024: IA–3, IA–4, IA–9, IA–10, IA–12, IA–15, IA–31, IA–60, US–18, US–20, US–59, US–65, US–69, US–71, US–75, and US–169 (Iowa Department of Transportation, 2025). The date range associated with this list of closures does not include portions of highways closed due to flood related damage that may have required repair after flood waters had receded.
U.S. Geological Survey Response to Flood
During the flood, USGS staff were active throughout the study area maintaining continuous data collection at streamgages and conducting stage and streamflow measurements to ensure stage-discharge relationships were accurate for the observed flooding event and to further develop the stage-discharge relationship for these peak-of-record events. The USGS worked closely with State and Federal agencies, including the National Weather Service, to communicate streamflow information and assist with forecasting needs. USGS staff completed a total of 24 field measurements at the streamgages listed in table 1 (U.S. Geological Survey, 2025a). In the weeks following the flood, USGS staff located and surveyed the elevations of high-water marks at 4 bridge locations along the Big Sioux River, 8 bridge locations along the Rock River, 11 bridge locations along the Little Sioux River, 3 bridge locations along the Ocheyedan River, and 6 bridge locations along the Floyd River. The elevations of high-water marks associated with this flood event are available via the USGS Flood Event Viewer online data portal (https://apps.usgs.gov/fev/). Users can type “2024 June IA Flood” in the search box to view the results.
Changes in Historical Peak Streamflows
Evidence for upward trends in annual peak streamflow in Iowa has been previously observed. Upward change points in the median of annual peak streamflows, observed in eastern and central Iowa for 100-, 75-, and 50-year trend periods ending in 2015, were clustered temporally around the mid-1960s and 1970s (Ryberg and others, 2020). A mix of upward and downward trends in the number of days streamflows were above four different National Weather Service categories (action, minor, moderate, and major) that designate severity of flooding were observed in western Iowa (Slater and Villarini, 2016). An investigation into changes in annual peak streamflow in Iowa over four trend periods ending in 2020 identified trends in the magnitude, frequency, and timing of annual peaks (O’Shea, 2024). Increases in the magnitude of annual peak streamflows were observed at the majority of streamgages across the State for each trend period (ranging in length from 30 to 100 years), including some streamgages in northwestern Iowa. Similar patterns of increase were observed in the frequency of large streamflows that occur on average twice a year, indicating that larger streamflows, and not just peak streamflows, are occurring more often at many streamgages in Iowa. Changes in the timing of annual peak streamflows were also observed. Streamgages in Iowa exhibited a trend indicating that annual peak streamflows, which have historically occurred across the months of March to June, are increasingly occurring in May and June (O’Shea, 2024).
Peak-Flow Frequency
Peak-flow frequency is described in terms of an annual exceedance probability (AEP), which is the percentage chance that a streamflow of a specific magnitude will occur in any single year. Six AEPs are discussed in this report, the 10-, 4-, 2-, 1-, 0.5-, and 0.2-percent AEPs, which are equivalent to annual flood-frequency recurrence intervals of 10, 25, 50, 100, 200, and 500 years, respectively. Larger streamflows, which are less likely to occur in any given year, correspond to smaller AEPs. The AEP ranges used here express the uncertainty of estimating precise annual flood probabilities and are as follows: greater than 10 percent, 4 to 9.99 percent, 2 to 3.99 percent, 1 to 1.99 percent, 0.5 to 0.99 percent, 0.2 to 0.49 percent, and less than 0.2 percent (table 1; table DR-1 in O’Shea and Marti, 2026). The AEP range is based on estimates from the preferred frequency analysis method for each streamgage and is determined from the estimated AEP streamflows that bracket the observed water year 2024 peak streamflow (table 1; table DR-1 and table DR-3 in O’Shea and Marti, 2026). Updated peak-flow frequency estimates for other streamgages in Iowa, Illinois, and Missouri can be found on USGS’s ScienceBase at https://www.sciencebase.gov/catalog/item/5efe1c2282ce3fd7e8a81484?_login=.
Estimated AEP streamflows (hereafter referred to as “AEPS”) were computed based on the annual peak-streamflow data available for streamgages. As additional annual peak-streamflow data are collected, the AEPS may change in magnitude, but they become more statistically reliable. A minimum of 10 years of annual peak-streamflow record is recommended to compute AEPS for streamgages in Iowa (Eash and others, 2013).
Updated AEPS were computed for 33 streamgages using data through water year 2024. USGS flood-frequency software, PeakFQ (version 7.5.1), was used to compute AEPS for streamgages following the guidelines for flood-frequency analysis set forth in Bulletin 17C (England and others, 2018), including the use of the expected moments algorithm to fit a log-Pearson type 3 distribution to the observed annual peak streamflows for each streamgage. These AEPS are referred to as the “at-site” estimates. Methods specific to the estimation of at-site peak-flow frequency for streamgages in Iowa are described by Eash and others (2013).
For all but five streamgages, at-site AEPS were computed using a weighted skew coefficient, which weights the at-site (station) skew coefficient with a regional skew coefficient (table DR-2 in O’Shea and Marti, 2026). The regional skew coefficient computed for Iowa by Eash and others (2013) was used for all streamgages except USGS streamgage 06485500 (Big Sioux River at Akron, Iowa). The regional skew coefficient for Iowa was not appropriate for this streamgage because of its large drainage area (table 1). The regional skew coefficient used for this streamgage was obtained from the generalized skew map in Bulletin 17B (Interagency Advisory Committee on Water Data, 1982).
The use of a weighted skew may be inappropriate for streamgages where the regional skew is not representative of the flood-producing characteristics of the individual streamgage, when the station and regional skews differ by more than 0.5, or when the streamgage has a sufficiently long-record of observed annual peak-streamflow data (England and others, 2018). For several streamgages, the fit of the log-Pearson type 3 distribution using a weighted skew provided a poor fit for the largest floods. The use of the station skew coefficient for at-site analysis was explored to determine if the fit could be improved. The use of the station skew coefficient for at-site analysis was selected at five USGS streamgages: 06483500 (Rock River near Rock Valley, Iowa), 06485500 (Big Sioux River at Akron, Iowa), 06600500 (Floyd River at James, Iowa), 06605850 (Little Sioux River at Linn Grove, Iowa), and 06606600 (Little Sioux River at Correctionville, Iowa; table DR-2 in O’Shea and Marti, 2026). The difference between the station skew coefficients and the regional skew coefficients for these streamgages ranged from 0.303 to 0.843. The observed annual peak-streamflow record for these streamgages ranged from 56 to 99 years. For these five streamgages, the AEPS associated with the at-site station skew frequency analysis method were used to calculate the AEPS associated with the weighted frequency analysis method (table DR-3 in O’Shea and Marti, 2026).
For 30 of 33 streamgages, at-site estimates of AEPS were weighted with regional regression estimates of AEPS to produce weighted estimates (England and others, 2018, page 101). Regional regression estimates of AEPS from table 4 in Eash and others (2013) were used for streamgages included in that study. For streamgages that were not included in Eash and others (2013), the regional regression estimates were computed using StreamStats (https://streamstats.usgs.gov/). For the remaining three streamgages, weighting with regional regression equations was inappropriate because of large drainage areas or the presence of diversion (table DR-1 in O’Shea and Marti, 2026). Variances associated with the at-site and regional regression estimates of the selected AEPSs were used to compute the variances of the weighted estimates (table DR-4 in O’Shea and Marti, 2026).
For each streamgage in the study, either the at-site or weighted estimate was selected as the preferred estimate (table 1; table DR-3 in O’Shea and Marti, 2026). The weighted estimate of an AEPS, also known as the weighted independent estimate, has previously been identified as the preferred estimate for streamgages in Iowa because it incorporates regional information by combining the at-site estimate of an AEPS with the regional regression estimate using the variance of prediction for each (Eash and others, 2013). More recent guidance has suggested that the weighted approach is more appropriate for streamgages with short annual peak-streamflow records, typically less than 20 years. This is particularly important when the hydrologic conditions of the streamgage basin are not representative of the regional conditions used for the development of the regional regression equations (England and others, 2018). For the 33 streamgages included in the study, the weighted estimates were reviewed to identify instances where the 0.2-percent AEP was less than the largest recorded annual peak streamflow (table 1; table DR-3 in O’Shea and Marti, 2026). This occurred at seven USGS streamgages: 06483440 (Dawson Creek near Sibley, Iowa), 06483500 (Rock River near Rock Valley, Iowa), 06600100 (Floyd River at Alton, Iowa), 06600500 (Floyd River at James, Iowa), 06605000 (Ocheyedan River near Spencer, Iowa), 06605850 (Little Sioux River at Linn Grove, Iowa), and 06605868 (Little Sioux River Tributary near Peterson, Iowa). These seven streamgages were reviewed to determine if the at-site estimate of the 0.2 percent AEP was also less than the largest observed annual peak streamflow. If the weighted estimate of the 0.2 percent AEP was less than the largest recorded annual peak streamflow, but the at-site estimate of the 0.2 percent AEP was larger and the number of observed annual peak-streamflow values for the streamgage was greater than 20, the at-site estimate was preferred over the weighted estimate. Six USGS streamgages met these criteria and had at-site estimates of AEPS that were preferred (O’Shea and Marti, 2026): 06483440 (Dawson Creek near Sibley, Iowa), 06483500 (Rock River near Rock Valley, Iowa), 06600100 (Floy River at Alton, Iowa), 06600500 (Floy River at James, Iowa), 06605000 (Ocheyedan River near Spencer, Iowa), and 06605850 (Little Sioux River at Linn Grove, Iowa). For three of the streamgages included in the study, regional regression equations were inappropriate because of large drainage areas or the presence of diversion; the at-site estimates of AEPS are preferred for these sites: 06485500 (Big Sioux River at Akron, Iowa), 06602400 (Monona-Harrison Ditch near Turin, Iowa), and 06607500 (Little Sioux River near Turin, Iowa). For the remaining 24 streamgages, the weighted estimates were preferred.
For the 33 streamgages included in this study, the peak streamflows observed during the June 2024 event exceeded the magnitude 4-percent AEP at 13 streamgages, the magnitude 1-percent AEP at 6 streamgages, and the magnitude 0.2-percent AEP at 1 streamgage (table 1; table DR-1 in O’Shea and Marti, 2026). The June 2024 peak streamflow was the peak-of-record at 10 streamgages. Three active streamgages on the Big Sioux River, along the Iowa and South Dakota border, were not included in the peak-flow frequency update: USGS streamgage 06483950 (Big Sioux River near Hawarden, Iowa), USGS streamgage 06485910 (Big Sioux River near Jefferson, South Dakota), and USGS streamgage 06485950 (Big Sioux River at Sioux City, Iowa). These streamgages had exactly 10 years of annual peak-streamflow data through water year 2024. Because of the short records at these streamgages compared to the 96 years of record at USGS streamgage 06485500 (Big Sioux River at Akron, Iowa), there were considerable downstream inconsistencies in the AEP estimates between these streamgages. It was determined that the three short-record Big Sioux River streamgages should not be included in this peak-flow frequency update. USGS field crews also made note of considerable streamflow diverting over Interstate 29 and into McCook Lake upstream from USGS streamgage 06485950 (Big Sioux River at Sioux City, Iowa) during the June 2024 event. This is apparent by the discrepancy in the peak streamflow for the event at USGS streamgage 06485910 (Big Sioux River near Jefferson, South Dakota), which was 132,000 cubic feet per second and the downstream streamgage, USGS streamgage 06485950 (Big Sioux river at Sioux City, Iowa), which was 97,200 cubic feet per second. Loss of streamflow due to potential diversion may also have affected USGS streamgage 06485910 (Big Sioux River near Jefferson, South Dakota). The diversion of streamflow for large flood events should be further explored as part of any future effort to develop AEP estimates at these two streamgages.
Summary
Following a heavy, multiday rainfall event that occurred between June 20 and June 22, 2024, widespread flooding occurred in parts of northwestern Iowa. Flooding was observed in the Big Sioux, Des Moines, Floyd, Little Sioux, Ocheyedan, and Rock River basins in Iowa. This rainfall event followed the eighth wettest May on record in Iowa, with daily mean streamflows in the areas of flooding already elevated prior to the precipitation event. Ten U.S. Geological (USGS) streamgages experienced new peaks of record, three of which were more than double the previous peak-of-record: USGS streamgages 06483500 (Rock River near Rock Valley, Iowa), 06605850 (Little Sioux River at Linn Grove, Iowa), and 06606600 (Little Sioux River at Correctionville, Iowa). The cost of the flooding is estimated at over $310 million (Brummer, 2025) and a Presidential declaration of a major disaster for the State of Iowa was approved on June 24, 2024.
The severity of this flooding prompted the USGS, in cooperation with the Iowa Department of Transportation, to summarize the meteorological and hydrological conditions leading to the flooding, compile estimates of the magnitudes of peak streamflows resulting from the flooding, and update estimates of peak-flow frequency through water year 2024 for select USGS streamgages. Included in this report are the 10-, 4-, 2-, 1-, 0.5-, and 0.2-percent annual exceedance probabilities, which are equivalent to annual flood-frequency recurrence intervals of 10, 25, 50, 100, 200, and 500 years, respectively. Larger streamflows, which are less likely to occur in any given year, correspond to smaller annual exceedance probabilities. Of the 33 streamgages analyzed, a peak streamflow occurred that corresponded to an annual exceedance probability of less than 4 percent at 13 streamgages, an annual exceedance probability of less than 1 percent at 6 streamgages, and an annual exceedance probability of less than 0.2 percent at 1 streamgage.
References Cited
Brummer, S., 2025, Memories and physical reminders remain for Iowans recovering from last year’s historic flooding: Iowa Public Radio, accessed November 19, 2025, at https://www.iowapublicradio.org/ipr-news/2025-06-20/northwest-iowa-rock-valley-spencer-flood-recovery-one-year-anniversary.
Eash, D.A., Barnes, K.K., and Veilleux, A.G., 2013, Methods for estimating annual exceedance-probability discharges for streams in Iowa, based on data through water year 2010: U.S. Geological Survey Scientific Investigations Report 2013–5086, viii, 63 p., accessed, December 12, 2024, at https://doi.org/10.3133/sir20135086.
England, J.F., Jr., Cohn, T.A., Faber, B.A., Stedinger, J.R., Thomas, W.O., Jr., Veilleux, A.G., Kiang, J.E., and Mason, R.R., Jr., 2018, Guidelines for determining flood flow frequency—Bulletin 17C (ver. 1.1, May 2019): U.S. Geological Survey Techniques and Methods, book 4, chap. B5, 148 p., accessed June 20, 2018, at https://doi.org/10.3133/tm4B5.
Federal Emergency Management Agency, 2024, Iowa severe storms, flooding, straight-line winds, and tornadoes: Federal Emergency Management Agency website, accessed November 19, 2025, at https://www.fema.gov/disaster/4796.
Glisan, J., 2024a, Iowa monthly weather summary—April 2024: Iowa Department of Agriculture & Land Stewardship, 4 p., accessed January 16, 2025, at https://iowaagriculture.gov/sites/default/files/climatology/2024/Monthly-Weather-Summary-2024-04.pdf.
Glisan, J., 2024b, Iowa monthly weather summary—February 2024: Iowa Department of Agriculture & Land Stewardship, 3 p., accessed January 16, 2025, at https://iowaagriculture.gov/sites/default/files/climatology/2024/Monthly-Weather-Summary-2024-02.pdf.
Glisan, J., 2024c, Iowa monthly weather summary—January 2024: Iowa Department of Agriculture & Land Stewardship, 2 p., accessed January 16, 2025, at https://iowaagriculture.gov/sites/default/files/climatology/2024/Monthly-Weather-Summary-2024-01.pdf.
Glisan, J., 2024d, Iowa monthly weather summary—March 2024: Iowa Department of Agriculture & Land Stewardship, 2 p., accessed January 16, 2025, at https://iowaagriculture.gov/sites/default/files/climatology/2024/Monthly-Weather-Summary-2024-03.pdf.
Glisan, J., 2024e, Iowa monthly weather summary—May 2024: Iowa Department of Agriculture & Land Stewardship, 5 p., accessed January 16, 2025, at https://iowaagriculture.gov/sites/default/files/climatology/2024/Monthly-Weather-Summary-2024-05.pdf.
Interagency Advisory Committee on Water Data, 1982, Guidelines for determining flood flow frequency: Reston, Va., U.S. Geological Survey, Bulletin 17B of the Hydrology Subcommittee, 28 p. and appendixes, accessed November 8, 2024, at https://water.usgs.gov/osw/bulletin17b/dl_flow.pdf.
Iowa Department of Transportation, 2024, Several roads in Northwest Iowa are currently affected by flooding: Iowa Department of Transportation, accessed November 19, 2025, at https://iowadot.gov/news/2024-06-22/several-roads-northwest-iowa-are-currently-affected-flooding.
Iowa Department of Transportation, 2025, 511 Social Media Sites: Iowa Department of Transportation, accessed November 11, 2025, at https://iowadot.gov/travel-tools/iowa-511/511-social-media-sites.
Iowa Environmental Mesonet, 2024, Wet spring 2024: Iowa State University Department of Agronomy database, accessed April 10, 2025, at https://mesonet.agron.iastate.edu/onsite/features/cat.php?day=2024-06-03.
Midwestern Regional Climate Center, 2025, cli-MATE, accessed at September 25, 2025, https://mrcc.purdue.edu/CLIMATE/.
National Drought Mitigation Center, 2024, U.S. drought monitor: National Drought Mitigation Center, U.S. Department of Agriculture, and the National Oceanic and Atmospheric Administration map data, accessed January 16, 2025, at https://droughtmonitor.unl.edu/Maps/MapArchive.aspx.
National Oceanic and Atmospheric Administration, 2025, Quantitative precipitation estimate (QPE) data: National Water Prediction Service database, accessed June 3, 2025, at https://water.noaa.gov/about/precipitation-data-access.
National Weather Service, 2024a, Heavy rain and historic flooding of northwest Iowa, southwest Minnesota, and southeast South Dakota, June 20–22, 2024: National Weather Service, National Oceanic and Atmospheric Administration database, accessed January 16, 2025, at https://www.weather.gov/fsd/20240620-22-HeavyRain-Flooding.
National Weather Service, 2024b, Heavy rain and record flooding in northwest Iowa, including the West Fork Des Moines River, June 2024: National Weather Service, National Oceanic and Atmospheric Administration database, accessed June 12, 2025, at https://www.weather.gov/dmx/202406-HeavyRainfall-RecordRiverFlooding.
O’Shea, P.S., 2024, Peak streamflow trends in Iowa and their relation to changes in climate, water years 1921–2020, chap. C of Ryberg, K.R., comp., Peak streamflow trends and their relation to changes in climate in Illinois, Iowa, Michigan, Minnesota, Missouri, Montana, North Dakota, South Dakota, and Wisconsin: U.S. Geological Survey Scientific Investigations Report 2023–5064, 55 p., accessed January 16, 2025, at https://doi.org/10.3133/sir20235064C.
O’Shea, P.S., and Marti, M.K., 2026, Peak-flow frequency analysis for U.S. Geological Survey streamgages in northwestern Iowa, based on data through water year 2024: U.S. Geological Survey data release, https://doi.org/10.5066/P1JFCNSZ.
Ryberg, K.R., Hodgkins, G.A., and Dudley, R.W., 2020, Change points in annual peak streamflows—Method comparisons and historical change points in the United States: Journal of Hydrology, v. 583, 124307, accessed January 16, 2025, at https://doi.org/10.1016/j.jhydrol.2019.124307.
Schwaller, K., 2025, 2024 Floods—Northwest Iowa recovers: The Messenger, accessed November 19, 2025, at https://www.messengernews.net/progress-2025/progress-2025-agriculture/2025/02/2024-floods-northwest-iowa-recovers/.
Slater, L.J., and Villarini, G., 2016, Recent trends in U.S. flood risk: Geophysical Research Letters, v. 43, no. 24, p. 12,428–12,436, accessed December 11, 2024, at https://doi.org/10.1002/2016GL071199.
Sorenson, G., and Ten Napel, L., 2024, Spring 2024 subsoil moisture level report for northwest Iowa: Iowa State University Extension and Outreach blog, May 1, 2024, accessed April 10, 2025, at https://crops.extension.iastate.edu/post/spring-2024-subsoil-moisture-level-report-northwest-iowa.
State of Iowa, 2024, Governor’s disaster proclamations: State of Iowa website, accessed June 10, 2025, at https://www.iowa.gov/about-alignment/governors-disaster-proclamations.
U.S. Census Bureau, 2021, Iowa—2020 Census: U.S. Census Bureau website, accessed December 15, 2025, at https://www.census.gov/library/stories/state-by-state/iowa.html.
U.S. Geological Survey, 2025a, USGS water data for the Nation: U.S. Geological Survey National Water Information System database, accessed June 11, 2025, at https://doi.org/10.5066/F7P55KJN.
U.S. Geological Survey, 2025b, WaterWatch: U.S. Geological Survey, WaterWatch database, accessed September 25, 2025, at https://waterwatch.usgs.gov/.
Supplemental Information
A water year is the 12-month period from October 1 through September 30 of the following year and is designated by the calendar year in which it ends.
For more information about this publication, contact:
Director, USGS Central Midwest Water Science Center
400 South Clinton Street, Suite 269 Iowa City, Iowa 52240
319–337–4191
For additional information, visit: https://www.usgs.gov/centers/cm-water.
Publishing support provided by
USGS Science Publishing Network,
Rolla Publishing Service Center
Disclaimers
Any use of trade, firm, or product names is for descriptive purposes only and does not imply endorsement by the U.S. Government.
Although this information product, for the most part, is in the public domain, it also may contain copyrighted materials as noted in the text. Permission to reproduce copyrighted items must be secured from the copyright owner.
Suggested Citation
Marti, M.K., and O’Shea, P.S., 2026, Floods of June 2024 in northwestern Iowa: U.S. Geological Survey Open-File Report 2026–1066, 16 p., https://doi.org/10.3133/ofr20261066.
ISSN: 2331-1258 (online)
Study Area
| Publication type | Report |
|---|---|
| Publication Subtype | USGS Numbered Series |
| Title | Floods of June 2024 in northwestern Iowa |
| Series title | Open-File Report |
| Series number | 2026-1066 |
| DOI | 10.3133/ofr20261066 |
| Publication Date | March 05, 2026 |
| Year Published | 2026 |
| Language | English |
| Publisher | U.S. Geological Survey |
| Publisher location | Reston, VA |
| Contributing office(s) | Central Midwest Water Science Center |
| Description | Report: vi, 16 p.; Data Release |
| Country | United States |
| State | Iowa |
| Online Only (Y/N) | Y |
| Additional Online Files (Y/N) | N |