

Data-Collection Methods for Total Dissolved Gases Monitoring, Youghiogheny River at Dam Outlet Tunnel Near Confluence, Pennsylvania
Links
- Document: Report (2.83 MB pdf) , HTML , XML
- Dataset: U.S. Geological Survey National Water Information System database - USGS 03077100 Youghiogheny R at dam outlet tunnel nr Confluence, in USGS water data for the Nation
- NGMDB Index Page: National Geologic Map Database Index Page (html)
- Download citation as: RIS | Dublin Core
Abstract
Supersaturation of total dissolved gases (TDG) can potentially occur in the tailrace water at the Youghiogheny River at dam outlet tunnel near Confluence, Pennsylvania (U.S. Geological Survey [USGS] streamgaging and monitoring station 03077100). The USGS, in cooperation with the U.S. Army Corps of Engineers, established methods to collect and report TDG saturation data in the tailrace below the Youghiogheny Dam. Monitoring and TDG data collection started in June 2008 and continues currently (2025). Data are collected from June 1 through November 30 of each year, and these data are used by the U.S. Army Corps of Engineers to guide management of the dam outflow. Methods used for data collection, processing, reporting, and quality assurance for TDG monitored at USGS station 03077100 are presented in this report. The TDG data are publicly available in the USGS National Water Information System database.
Introduction
The Youghiogheny River Lake project of the U.S. Army Corps of Engineers was authorized by the Flood Control Act of 1938 (Public Law 75–761, 75 Stat. 1215) (U.S. Army Corps of Engineers, 2024). Construction was completed in 1943, and the dam became operational in 1948 (U.S. Army Corps of Engineers, 2023). Since completion, the U.S. Army Corps of Engineers estimates that the project has prevented flood damages costing upwards of $569 million (U.S. Army Corps of Engineers, 2024). The Youghiogheny River Lake can store the equivalent runoff of 11 inches of precipitation from its 434 square mile drainage area (U.S. Army Corps of Engineers, 2024). In addition to flood control, the dam provides environmental benefits. For example, water released during low flow conditions helps to increase streamflow, diluting potentially polluted waters entering rivers and streams downstream of the dam and improving river water quality. The increased streamflow during low flow conditions also improves commercial navigation along the Monongahela and upper Ohio Rivers (U.S. Army Corps of Engineers, 2024).
The Federal Energy Regulatory Commission issued a license (Federal Energy Regulatory Commission Docket No. P–3623) to the Youghiogheny Hydroelectric Authority to operate a hydroelectric power plant below the dam; D/R Hydro Company has operated the plant since 1989 (Brant and Rizzo, 2016, U.S. Army Corps of Engineers, 2024). To generate power, the plant diverts water from the dam’s outflow tunnel (Amy Jensen, U.S. Army Corps of Engineers, oral commun., 2022; Brant and Rizzo, 2016). The intake invert (lowest point) of the outflow tunnel is near the lake bottom (Brant and Rizzo, 2016). Water pulled from this depth may be oxygen depleted, particularly from summer through early autumn, due to thermal stratification (U.S. Army Corps of Engineers, 2024). To raise dissolved oxygen (DO) concentrations, the plant uses a combination of methods—low-pressure air blowers, oxygen injection, and spill gate discharges—each of which can be used individually or together to add compressed atmospheric air, pure oxygen, or both to the discharged water (Brant and Rizzo, 2016).The U.S. Geological Survey (USGS), in cooperation with the U.S. Army Corps of Engineers, collects data for water temperature, specific conductance (SC), DO, total dissolved gases (TDG), barometric pressure (BP), and turbidity in the tailrace of the Youghiogheny Dam at USGS station 03077100, Youghiogheny River at dam outflow tunnel near Confluence, Pennsylvania (fig. 1). Data collection for water temperature, SC, DO, TDG, and BP began in June 2008; publication of the data began in June 2010. Collection and publication of turbidity data began in June 2017. Redundant monitors for BP and TDG were added in June 2018 (to be used if the primary TDG or BP monitors malfunction). The monitors are located at the upstream terminus of the tailrace pool below the dam (fig. 1).
Trout rearing pens are installed in the tailrace pool and are stocked with trout several times per year. Much of the water discharged from D/R Hydro’s power plant and the dam’s outflow tunnel circulates counterclockwise (looking downstream), passing the monitor location and trout pens before eventually flowing over a riffle (which functions as a hydraulic structure that backs up water to create the tailrace pool), and then continuing downstream (fig. 1). Streamflow and water-quality data are collected at 15-minute intervals, and transmitted hourly through the Geostationary Operational Environmental Satellite (GOES) system to the USGS National Water Information System (NWIS) database (U.S. Geological Survey, 2025).
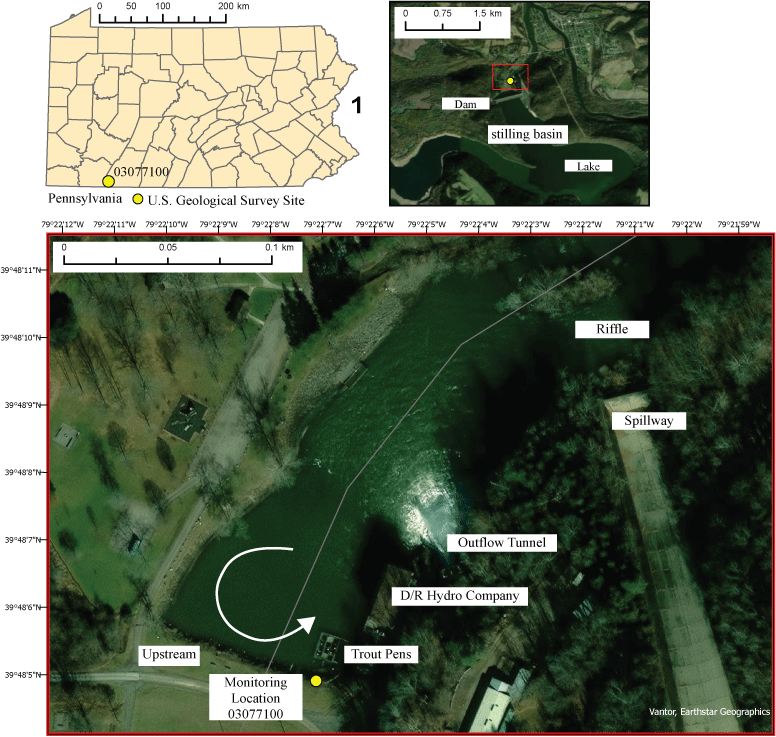
Map showing the study area and aerial photographs showing the lake and dam and of the tailrace area showing the monitoring location, trout pens, and flow direction (white arrow). Imagery credits are on zoomed in image in white and more visible in updated version and are pulled directly from ArcPro GIS credits-“Vantor, Earthstar Geographics.”
Purpose and Scope
This report describes the methods and instrumentation currently used for collecting, quality assuring, analyzing, and processing TDG and BP data at USGS station 03077100 (U.S. Geological Survey, 2025). Methods were adapted from Wagner and others (2006) and from Tanner and Johnston (2001) procedures.
Overview of Total Dissolved Gas
Henry’s Law states that the solubility of a gas in a waterbody is directly proportional to the partial pressure of the gas in equilibrium with the waterbody (Benson and Krause, 1980). The solubility of gases in a waterbody can therefore be estimated using the following equation:
whereC
is the solubility of a gas at a fixed temperature in units of moles of gas per liter of water;
kH(T)
is the Henry’s law solubility constant in units of moles per liter per atmosphere, and is temperature dependent; and
Pgas
is the partial pressure of the gas in equilibrium with the waterbody in units of atmospheres.
In the case of a waterbody in open contact with the atmosphere, the gases dissolved in the water will equilibrate with the overlying atmosphere in proportion to their atmospheric partial pressures, as determined using the Henry’s Law constant at the temperature of the waterbody. The atmospheric partial pressure of a gas can be estimated from the ambient BP, assuming gases behave ideally and are present at mixing ratios typical for the troposphere. At saturation, the TDG of a water mass is equivalent to the overlying atmosphere pressure. When air blowers or turbulence are used to raise the DO concentration, the concentration of the other gases in air (primarily nitrogen with low levels of argon and carbon dioxide) is also raised, and TDG pressure can increase to more than one atmosphere, defined as TDG super saturation (Brant and Rizzo, 2016). This increase in TDG super saturation can cause nitrogen gas-bubble trauma and possibly death in exposed fish (Weitkamp and Katz, 1980). The TDG saturation percentage, TDG%sat, can be described by the following equation:
whereMethods of Data Collection
Instrumentation
Three Eureka Manta-Series multiparameter water-quality monitors are deployed at USGS station 03077100 (U.S. Geological Survey, 2025) in separate 4-inch polyvinyl chloride (PVC) pipes that are anchored to rip rap (a rock structure used to prevent erosion) that armors the bank at the “upstream” terminus of the tailrace pool, below the dam (fig. 1). One monitor is designated as a “basic parameter” monitor and collects data for water temperature, SC, DO, and turbidity. The other two monitors collect TDG data, with one serving as the primary TDG sensor (TDG1) and one serving as a backup (TDG2) if TDG1 fails. Prior to July 2023, TDG1 also collected basic parameter data for water temperature, SC, DO, and turbidity.
The basic parameter and TDG1 monitors are interfaced to a Sutron Satlink 3 data collection platform (DCP) that is interfaced with a Sutron Accubar Barometer sensor (fig. 2A). Data are logged at 15-minute intervals and transmitted hourly through the Geostationary Operational Environmental Satellite system to the USGS NWIS database (U.S. Geological Survey, 2025). The Satlink3 DCP and barometer are housed in a National Electrical Manufacturers Association (NEMA)-approved enclosure. The instrumentation is powered by a sealed 25-amp-hour battery and a 30-watt solar panel.
The TDG2 monitor and a second Sutron Accubar barometer are interfaced to a SutroXLink 500 DCP (fig. 2B). Data are logged every 15 minutes and retrieved hourly through a cellular modem. The XLink 500 DCP and barometer are housed in a vented, locking, steel, theft-proof enclosure located adjacent to the enclosure for the Satlink 3 (fig. 2C). Data are logged at 15-minute intervals and retrieved through the cellular modem (also every 15 minutes) to the USGS NWIS database (U.S. Geological Survey, 2025). Power is provided by a sealed 15-amp-hour battery and a 10-watt solar panel.
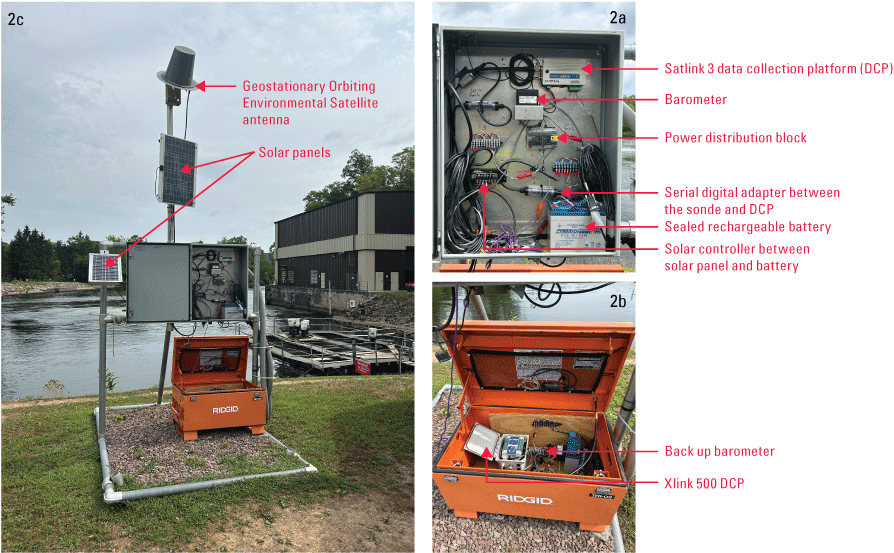
Photographs showing total dissolved gas (TDG) instrumentation, including A, a close-up of the instrumentation shelter that houses the data-collection platform, battery and power management components, primary barometer, and communication interface to the primary TDG sensor (TDG1), B, a close-up of the instrumentation shelter that houses the cellular modem, battery and power management components, backup barometer, and communication interface to the backup TDG sensor (TDG2), and C, a wide-view image of the instrumentation shelters showing the solar panels and Geostationary Operational Environmental Satellite antenna. Photographs by Allan Ruddy, U.S. Geological Survey.
The TDG sensors consist of a pressure transducer (permanently installed on the monitor body) and a removable and replaceable membrane cartridge. The membrane cartridge consists of a length of dimethyl silicone tubing that is wrapped around a plastic spool (figs. 3A and 3B). The ends emerge on the bottom of the membrane (fig. 3B) so that when the membrane is installed on the monitor, an air and water-tight interface between the open ends of the membrane cartridge and the pressure transducer is achieved. Dissolved gases in water diffuse through the membrane until the gas pressure inside the tubing has equilibrated with the TDG pressure in the water. This process typically takes 15–30 minutes but can take as much as 1 hour for equilibrium to be reached. The silicon tubing absorbs water while being submerged, which slows sensor response time. This effect may increase with the duration of deployment.
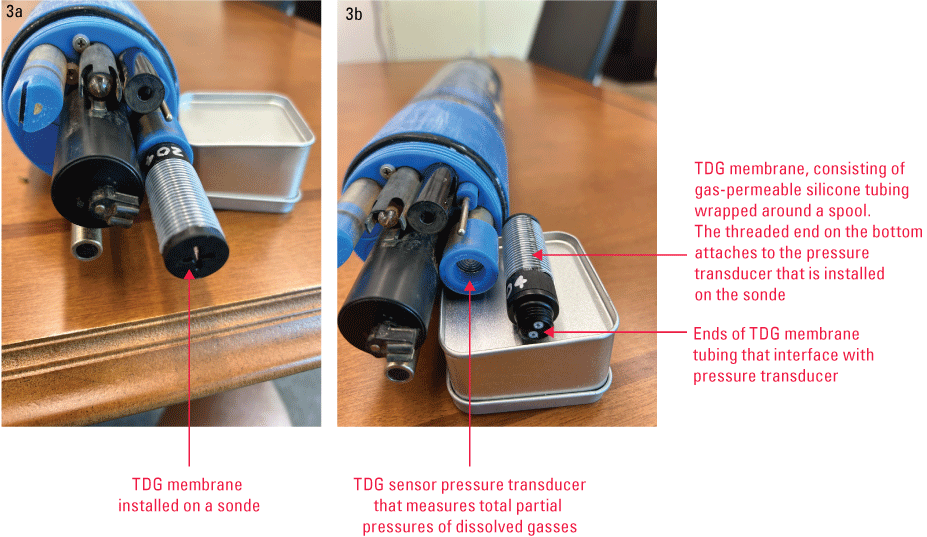
Photographs showing the total dissolved gas (TDG) membrane installed on the A, monitor and with the B, TDG membrane detached so that the pressure port on the monitor and the ends of the gas-permeable silicone tubing on the membrane are visible. Photographs by Allan Ruddy, U.S. Geological Survey.
Site Operation
Data collection at USGS station 03077100 (U.S. Geological Survey, 2025) takes place from June 1 through November 30. Visits to the site for servicing occur every two to three weeks. During a visit, before- and after-cleaning readings are recorded following procedures adapted from Wagner and others (2006); these values are later used to evaluate and correct for errors caused by physical and (or) biological fouling. The accuracy of the site barometers is verified with independent readings from a reference barometer (Control Company model 4247; calibrated biannually).
Once before- and after-cleaning data are recorded, the TDG1 and TDG2 monitors are replaced with monitors that were prepared for deployment at the laboratory as described in the preceding section titled Pre-Deployment Laboratory Calibration and Performance Checks (denoted replacement TDG monitor that is swapped in for the TDG1 monitor during routine visits [repTDG1] and replacement TDG monitor that is swapped in for the TDG2 monitor during routine visits [repTDG2], with the rep prefix referring to as “replacement”). The monitors that were removed from the site are brought back to the laboratory to undergo calibration, quality assurance checks, and maintenance. Pre- and post-deployment calibrations are recorded on paper note sheets developed by the USGS Pennsylvania Water Science Center (PAWSC) (app. 1 and app. 2). Field data are recorded using a combination of paper note sheets developed by the USGS PAWSC, the USGS, and the USGS software internal application Site Visit Mobile, Aquarius (SVMAQ). Pre-deployment, field, and post-deployment procedures are discussed in the section “Pre-Deployment Laboratory Calibration and Performance Checks.”
Additional visits occur when suspect data or malfunctions are found during daily review of real-time data. Tasks involved in an additional visit are determined by the nature of the problem and may include anything from minor instrumentation and (or) infrastructure repairs to a complete replacement of one or both monitors.
Pre-Deployment Laboratory Calibration and Performance Checks
Prior to each site visit (preferably the day before, but no more than 5 working days in advance), calibration checks are performed for the repTDG1 and repTDG2 monitors and for a field monitor that will be used to detect changes in TDG during cleaning procedures in the field. Calibration notes are documented on the laboratory calibration form (app. 1). Monitors can be stored with or without a membrane installed. If a monitor was stored without a membrane installed, a clean, dry membrane is installed, and gas pressure inside the membrane (in air) is allowed to equilibrate for at least 1 hour. If the monitor was stored with a membrane installed, the membrane is visually inspected to ensure that it is clean and intact and is replaced if its integrity is in question. The TDG reading (in air) is compared to an air pressure reading from a certified reference barometer. If the in-air TDG reading differs from the certified reference barometer by more than 2 mm Hg, the sensor is calibrated to the air pressure reading. The 2mm Hg criterion was adapted from Tanner and Johnston (2001), who used 2.5 mm Hg as a standard. Experience within the USGS PAWSC has indicated that the lower value of 2 mm Hg is consistently achievable.
After the calibration procedures are complete, two qualitative tests are performed to verify the integrity of the TDG membrane. These tests are critical because the in-air calibration check will not detect a torn or otherwise compromised membrane, and a sensor with a compromised membrane acts like a pressure transducer in water and reacts to changes in water depth. The first check is performed in a “zero-oxygen” solution (a solution of approximately 2 grams of sodium sulfite per liter of deionized water; U.S. Geological Survey [2020]), which tests the sensor response in undersaturated dissolved gas environments. TDG readings in zero-oxygen solution should drop by approximately 30 mm Hg (compared to the in-air reading and known barometric pressure) within roughly 5 minutes. If the sensor passes the zero-oxygen solution check, a second test is done in supersaturated (carbonated) water. In this test, TDG readings should increase to 1,000 mm Hg or greater within 2 minutes (Tanner and Johnston, 2001). If either check test fails, the membrane is replaced, and these steps (beginning with the calibration check versus air pressure as described above) are repeated.
An optional third test can be performed in a pressure chamber using a Druck DPI 104 pressure gage connected to a vacuum pump and a modified calibration cup through ¼-inch silicone tubing. This calibration cup is mounted on the monitor with the membrane placed on the TDG sensor. The absolute pressure (BP not subtracted) in the chamber is increased to exceed the expected maximum TDG value during deployment, typically 800 mm Hg (fig. 4). The TDG readings of the monitor are then compared to the pressure gage readings. Values are recorded (typically every 15 minutes) until the readings have stabilized. Full stabilization may not be achieved because getting a perfect air-tight connection is difficult. TDG monitor and pressure gage readings should agree within plus or minus (±) 5 mm Hg after about 30 minutes. An instantaneous response during this test indicates a damaged membrane. All pre-deployment TDG notes, calibration checks, and performance checks are recorded on a paper TDG pre-deployment form (app. 1) and digitally archived on local servers and within the USGS Aquarius Time-Series (AQTS) database. Table 1 summarizes each calibration and performance check that is performed on a TDG membrane.
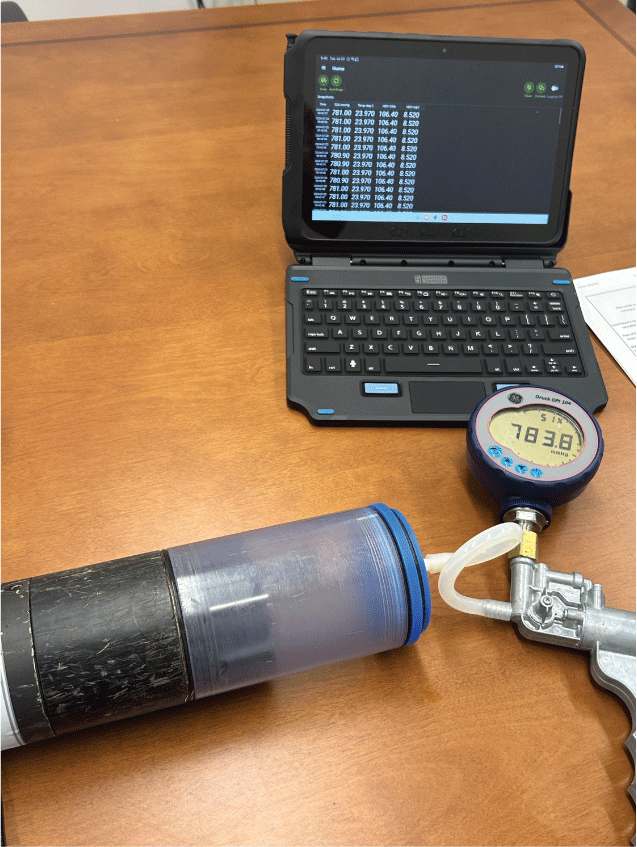
Photograph showing a pressure gage attached to a modified calibration cup. The total dissolved gas reading is compared to the pressure reading. This provides a quantitative check against a second known standard (the first is barometric pressure). Photograph by Allan Ruddy, U.S. Geological Survey.
Table 1.
Summary of pre-deployment total dissolved gas membrane calibration and performance checks.[Primary denotes the procedure used for calibration. The other tests are used to verify sensor performance in supersaturated and undersaturated TDG conditions. TDG, Total dissolved gas; mm Hg, millimeters of mercury; ≥, greater than or equal to]
Field Procedures
The field procedures for collecting TDG data were adapted from procedures described by Wagner and others (2006). Field notes for TDG and BP are recorded on the paper TDG field form (app. 2) and archived on local servers and within AQTS. As noted above in the sections titled Site Operation and Pre-Deployment Calibration and Performance Checks, the repTDG1 and repTDG2 monitors, along with the field monitor, will have undergone calibration and operational checks in advance of the field visit.
Upon arrival at the site, each monitor is placed in a clean, dry location that is not in direct sunlight. Readings from the repTDG1 and repTDG2 monitors, in air, are checked against a reference barometer and are recorded at approximately 10-minute intervals until readings have stabilized (stable over a 10-minute period or changing at the same rate as barometric pressure). Changing temperatures and field factors may slow stabilization. If the TDG monitors pass all laboratory performance checks, then an in-air TDG reading within ±3 mm Hg of the field barometer is accepted. This is slightly less stringent than the ±2 mm Hg criteria from the pre-deployment checks performed in the laboratory, in recognition of the less controlled conditions in the field. If the difference is greater than ±3 mm Hg, the sensor is recalibrated in the field. The purpose of these readings is to ensure the sensor was not damaged during transport from the laboratory to the field site.
Next, the replacement monitors and the field monitor are placed in the tailrace pool, near the operating site monitors that are interfaced to the Satlink 3 and XLink 500 DCPs. Readings from the site monitors, field monitor, and replacement monitors are recorded at approximately 10-minute intervals until readings have stabilized or are changing at approximately the same rate. The last values from TDG1 (or TDG2 if the primary has malfunctioned) and the field monitor are used as “before-cleaning” readings as described in Wagner and others (2006). This process also serves as a functional test for the replacement monitors while allowing them to stabilize to environmental conditions. This will shorten stabilization time when the monitors are eventually swapped.
After TDG readings have stabilized and before-cleaning readings have been recorded, the primary and backup site barometers are checked against a reference barometer to ensure accuracy within ±2 mm Hg. The primary and redundant site TDG monitors are then removed from their deployment tubes for cleaning. The monitor body is wiped down with a microfiber cloth and (or) foam eraser and cleaned as necessary (fig. 5A). The probe guard is removed and cleaned thoroughly using a soft-bristled nylon brush and deionized water. The sensors are rinsed thoroughly with deionized water. Dirt and debris that have accumulated in the TDG membrane (fig. 5B) are carefully removed using foam or cotton swabs (fig. 5C). If fouling is severe, a small amount of diluted soapy water can be used. If soap is used, three tap-water rinses are performed to remove the soap solution, followed by three rinses in deionized water. If soap is not used, then only the three deionized water rinses are needed. Visible debris on the outside of the deployment tubes is removed, and a nylon brush mounted to a chimney cleaning rod is used to remove debris from the inside of each deployment tube.
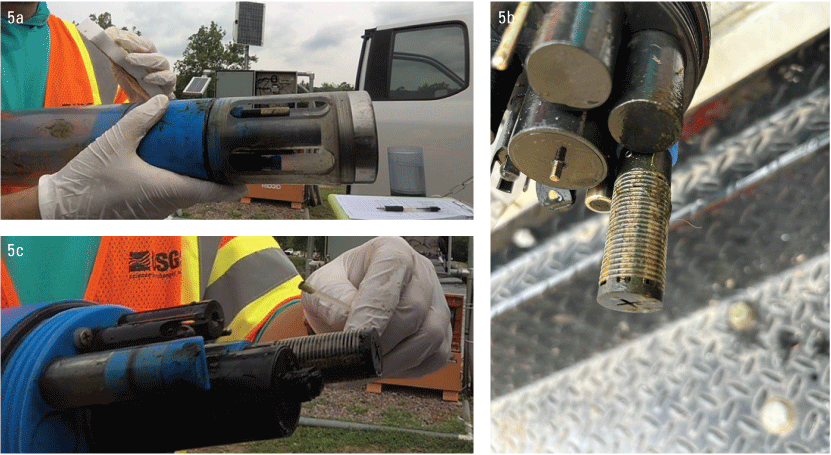
Photographs showing monitor cleaning procedures during a site visit, including A, wiping down the monitor body, B, deposition on the total dissolved gas membrane, and C, cleaning the total dissolved gas membrane with a foam swab. Photographs by Allan Ruddy, U.S. Geological Survey.
The cleaned site monitors are then placed back in their deployment tubes. Readings are again recorded at approximately 10-minute intervals until they have stabilized or are changing at approximately the same rate. The last values from TDG1 (or TDG2 if the primary has malfunctioned) and the field monitor are now recorded as “after-cleaning” readings, as adapted from Wagner and others (2006).
Finally, the TDG1 and TDG2 monitors are removed from their deployment tubes and the repTDG1 and repTDG2 monitors are installed and interfaced to the Satlink3 and XLink 500 DCPs, respectively. Readings from the repTDG1 and repTDG2 monitors and the field monitor are again recorded at approximately 10-minute intervals until readings have stabilized. These readings provide confidence that the replacement monitors are functioning properly in the deployment tubes.
Post-Deployment Calibration Checks
Within 5 business days of returning from the site visit, calibration checks must be performed on the TDG1 and (or) TDG2 monitor that were removed from the site. The same steps that were followed for pre-deployment (table 1) are performed again. The purpose of this step is to verify that the monitor(s) were operational and to determine if a correction for calibration drift will be needed. All post-deployment TDG notes, calibration checks, and performance checks are recorded on a paper TDG post-deployment laboratory calibration form (app. 1), which is digitally archived on local servers and within AQTS. Finally, the monitor and TDG membrane are soaked in soapy water for approximately 10 minutes, rinsed thoroughly with tap water, and allowed to air dry. If necessary, a new TDG membrane could be installed at this time. Monitors are stored with the sensor guards attached, and the membranes are stored dry and open to air.
Collection of Quality Assurance Data
Quality assurance checks are performed at least once per data collection season (June 1–November 30) to verify that data collected at the site monitoring location are representative of water quality in the dam tailrace. Procedures for completing water quality cross-section surveys found in Wagner and others (2006) were modified for this purpose. Data are collected using independent monitors equipped with TDG sensors either from a crewed boat anchored at a minimum of three locations in the tailrace pool, or from a minimum of three locations along the bank. Collecting data from the bank eliminates hazards associated with operating a crewed boat in the turbulent water of the tailrace. TDG readings are not instantaneous because ample time is needed for gases to diffuse through the membrane; thus, two monitors are used to collect data. One monitor is placed on the stream bed, and the other is held just below the water surface (fig. 6). Readings are allowed to stabilize for at least 15 minutes before data are recorded. Collecting data at depth and just below the water surface allows for evaluation of the effect of hydrostatic pressure and depth compensation on the readings. Pool depth near the monitors is typically 3 to 5 feet. Data are recorded in a standard field notebook, and notes are scanned and appended to AQTS and local servers for archiving.
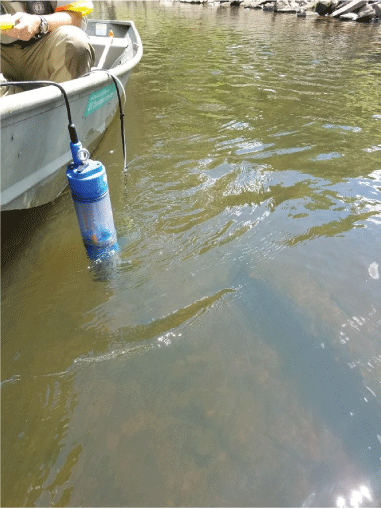
Photograph showing the monitor in view is measuring total dissolved gas values just below the water surface. Photograph by Jamie McCoy, U.S. Geological Survey.
Procedures for collecting independent quality-assurance data were introduced in June 2023. Discrete water samples were collected at the site monitor location and near the power plant and analyzed by the USGS Groundwater Dating Laboratory in Reston, Virginia. Concentrations of dissolved nitrogen, argon, carbon dioxide, methane, and oxygen were determined, and their individual partial pressures were summed and compared to readings from the continuous monitor. Beginning in 2024, these data were collected and analyzed using methods adapted from Busenberg and others (1998) and made available in the USGS NWIS database (U.S. Geological Survey, 2025) to complement data collected using independent monitors.
Data Workup and Analysis
Unlike many other water-quality parameters, the USGS does not have a specified protocol for the analysis of TDG data. Methods used by the USGS PAWSC follow general procedures described by Wagner and others (2006) for water temperature, SC, DO, pH, and turbidity, which describes applying corrections for fouling and drift (Wagner and others, 2006). General criteria for the application of corrections for TDG and BP are described below. All corrections are completed using the AQTS software that is interfaced with the USGS NWIS database (U.S. Geological Survey, 2025). All decisions are documented within the USGS internal Records Management System (RMS) station analysis report. The complete product (corrections applied as needed and completed station analysis) is referred to as a record. Before the data are approved in the USGS NWIS database, the record is subject to an internal review and approval by a qualified person. Audits of approved data by a subject matter expert are performed routinely. Record progress tracking and all supporting documents are stored within the USGS internal RMS.
Review and Deletion of Erroneous Data
TDG data that are clearly erroneous are deleted. Deletion of erroneous data often happens automatically within the USGS NWIS database through screening thresholds or occurs during routine review (generally daily) of real-time data. If the sensor or membrane on the TDG1 sensor is presumed to have failed, data are backfilled with data from the TDG2 sensor within the AQTS software.
Fouling Corrections
Debris and organic matter can deposit on the sensor during deployment, which may result in inaccurate readings. These data can often be corrected. Fouling corrections for TDG are typically applied if fouling exceeds ±1 percent. The BP sensors are not subject to fouling because they are not deployed in the water. Calculation of fouling error of the TDG sensor (in percent) was adapted from methods described by Wagner and others (2006) and is computed as follows:
whereEf %
is the percent TDG sensor fouling error;
Ma
is the site monitor before-cleaning TDG reading (mm Hg);
Mb
is the site monitor after-cleaning TDG reading (mm Hg);
Fb
is the field monitor TDG reading (mm Hg) before the site monitor sensor was cleaned; and
Fa
is the field monitor TDG reading (mm Hg) after the site monitor sensor was cleaned.
Corrections are usually applied in a prorated fashion, beginning at 0 percent following an initial site visit and prorating to full effect at the next visit, when a fouling error was determined using equation 3. For example, a clean, calibrated monitor was deployed on June 1, and a routine site visit was completed on June 15. On June 15, a fouling error of 2 percent was computed from before- and after-cleaning and field readings using equation 3. The correction would be prorated from 0 percent on June 1 to 2 percent on June 15, at the time that the before-cleaning reading was recorded. The correction would terminate on June 15 (resetting to a 0 percent correction) when the cleaned monitor was redeployed in the water. Applying a correction in this manner assumes that fouling occurred gradually, beginning at the end of the previous visit. If there is evidence that fouling began later, the start time can be adjusted. In the example provided above, the monitor was deployed on June 1, and a 2 percent fouling correction was computed from the June 15 field data. If discharge to the tailrace was dramatically increased on June 7 at 12:00 p.m., an analyst may determine that the fouling was caused by the increased flow and prorate a correction from 0 percent on June 7 at 12:00 p.m.to 2 percent on June 15 at the time that the before-cleaning reading was recorded.
Drift Corrections
After completing a site visit, the monitors that had been deployed (but were removed and replaced) are brought back to the laboratory to undergo calibration drift checks. As with the preparation of monitors that are to be deployed, in-air TDG readings are compared to readings from a reference barometer. These readings are used to determine drift error as follows:
whereEd%
is the percent TDG sensor drift error;
BPref
is the reference barometer reading (mm Hg); and
TDGair
is the reading of the removed TDG sensor in air (mm Hg)
Drift corrections are applied in the same prorated fashion described for fouling corrections. Corrections are applied when drift exceeds ±1 percent. Calibrations for the TDG sensors have been shown to be robust; the need for drift corrections is rare.
Other Corrections
Other corrections may be applied at the analyst’s discretion. An example of when such a correction might be applied is an instance where the TDG membrane was damaged during the cleaning process, preventing the computation of fouling and drift error. In this case, the analyst might apply a correction to force data from the site monitor to match that from the field monitor at the time that the “before-cleaning” readings were obtained. The rationale for applying such a correction must be explained in detail in a station analysis report that is stored within the USGS internal RMS database.
Professional Judgment
The general correction criteria described above may be superseded by the analyst’s professional judgment. TDG readings are complicated by the slow diffusion rate of gases through the membrane, which is exacerbated by saturation of membrane tubing with water and the fragility of the membranes. For example, changes in the power plant or dam operations that occur while a site visit is taking place can change the TDG concentration in the tailrace. This can complicate efforts to determine when readings have stabilized because the membranes on the TDG1 and TDG2 are likely water-saturated (after a multiweek deployment), which may result in much slower response times than those of the field, repTDG1, and repTDG2 monitors. If readings are recorded before stabilization, equation 3 may indicate a correction that is not valid. All decisions are documented in an internal analysis report and stored in the USGS internal RMS database.
Summary
This report summarizes methods used by the U.S. Geological Survey (USGS), Pennsylvania Water Science Center, in cooperation with the U.S. Army Corps of Engineers, to measure total dissolved gas (TDG) pressure at the Youghiogheny River at dam outflow tunnel near Confluence, Pennsylvania (USGS station 03077100). The TDG data collected at this streamgage are used by the U.S. Army Corps of Engineers to guide management of the hydroelectric outflow from the dam. TDG supersaturation can potentially occur in the tailrace water below the Youghiogheny Dam when practices are implemented to increase dissolved oxygen levels in water pulled from depth within the Youghiogheny River Lake. Data are collected seasonally from June 1 through November 30 of each calendar year and are publicly available from the U.S. Geological Survey National Water Information System database.
Acknowledgments
The authors express their appreciation to Joshua Master, Jaimie McCoy, Celeste Perino, Stephanie Roussel, Tom Ruby, and Lindsey Sabo of the U.S. Geological Survey (USGS), as well as Lowell Abbadini, Brian Hattenbach, Toby Grzjeka, and Zach Powell (formerly with the U.S. Geological Survey), for their contributions to site operations, including laboratory calibrations, field data collection, data analysis, and equipment installation and maintenance. The authors also thank Allison Casile of the U.S. Geological Survey Groundwater Dating Laboratory in Reston, Virginia, who provided guidance on collection and processing of discrete gas samples used for quality assurance purposes. Finally, the authors thank Marla Stuckey, Joe Duris, Heather Bragg, and Dan Deeds of the U.S. Geological Survey for providing thorough technical reviews.
References Cited
Benson, B.B., and Krause, D., Jr., 1980, The concentration and isotopic fractionation of gases dissolved in freshwater in equilibrium with the atmosphere. 1. Oxygen: Limnology and Oceanography, v. 25, no. 4, p. 662–671. [Also available at https://www.jstor.org/stable/pdfplus/2835754.pdf.]
Brant, G.F., and Rizzo, R.F., 2016, Summary of fish mortality incident and recent events—Yough hydro power station, FERC Project No. P–3623: Federal Energy Regulatory Commission, accessed May 16, 2022, at https://hydropowerelibrary.pnnl.gov/Documents/20161101-0067.
Busenberg, E., Plummer, N., Bartholomay, R.C., and Wayland, J.W., 1998, Chlorofluorocarbons, sulfur hexafluoride, and dissolved permanent gases in groundwater from selected sites in and near the Idaho National Engineering and Environmental Laboratory, Idaho, 1994–97: U.S. Geological Survey Open-File Report 98–274, 72 p. accessed July 23, 2024, at https://pubs.usgs.gov/of/1998/0274/report.pdf.
Tanner, D.Q., and Johnston, M.W., 2001, Data-collection methods, quality-assurance data, and site considerations for total dissolved gas monitoring, lower Columbia River, Oregon and Washington, 2000: U.S. Geological Survey Water-Resources Investigations Report 01–4005, 19 p, accessed August 8, 2023, at https://doi.org/10.3133/wri014005.
U.S. Army Corps of Engineers, 2023, Youghiogheny River Lake to host 75th anniversary celebration: U.S. Army Corps of Engineers Pittsburgh District news release, accessed January 5, 2026, at https://www.lrd.usace.army.mil/News/News-Releases/Display/Article/3636683/youghiogheny-river-lake-to-host-75th-anniversary-celebration/.
U.S. Army Corps of Engineers, 2024, Youghiogheny River Lake: U.S. Army Corps of Engineers Pittsburgh District web page, accessed January 5, 2026, at https://www.lrd.usace.army.mil/Missions/Projects/Article/3641633/youghiogheny-river-lake/.
U.S. Geological Survey, 2020, Chapter A6.2. Dissolved oxygen: U.S. Geological Survey Techniques and Methods, book 9, chap. A6.2, 33 p., https://doi.org/10.3133/tm9A6.2.
U.S. Geological Survey, 2025, USGS 03077100 Youghiogheny R at dam outlet tunnel nr Confluence, in USGS water data for the Nation: U.S. Geological Survey data release, https://doi.org/10.5066/F7P55KJN. [Site information directly accessible at https://waterdata.usgs.gov/monitoring-location/03077100.]
Wagner, R.J., Boulger, R.W., Jr., Oblinger, C.J., and Smith, B.A., 2006, Guidelines and standard procedures for continuous water-quality monitors—Station operation, record computation, and data reporting: U.S. Geological Survey Techniques and Methods 1–D3, 51 p. plus 8 attachments, accessed August 8, 2023, at https://pubs.usgs.gov/tm/2006/tm1D3/.
Weitkamp, D.E., and Katz, M., 1980, A review of dissolved gas supersaturation literature: Transactions of the American Fisheries Society, v. 109, no. 7, p. 659–702, accessed August 8, 2023, at https://doi.org/10.1577/1548-8659(1980)109<659:ARODGS>2.0.CO;2.
Appendix 1. U.S. Geological Survey Pennsylvania Water Science Center Total Dissolved Gas Pre-Deployment Form
Appendix 2. U.S. Geological Survey Pennsylvania Water Science Center Total Dissolved Gas Field and Post-Deployment Form
Conversion Factors
International System of Units to U.S. customary units
Temperature in degrees Celsius (°C) may be converted to degrees Fahrenheit (°F) as follows: °F = (1.8 × °C) + 32.
Temperature in degrees Fahrenheit (°F) may be converted to degrees Celsius (°C) as follows: °C = (°F – 32) / 1.8.
Datum
Vertical coordinate information is referenced to the North American Vertical Datum of 1988 (NAVD 88).
Supplemental Information
Total partial pressure of dissolved gases is given in millimeters of mercury (mm Hg).
Barometric (air) pressure is given in millimeters of mercury (mm Hg).
Abbreviations
AQTS
Aquarius Time-Series database
BP
barometric pressure
DCP
data collection platform
DO
dissolved oxygen
NWIS
National Water Information System
PAWSC
Pennsylvania Water Science Center
repTDG1
replacement TDG monitor
repTDG2
replacement TDG monitor
RMS
Records Management System
SC
specific conductance
TDG
total dissolved gas (partial pressure of total dissolved gases
USGS
U.S. Geological Survey
For additional information, contact
Director, Pennsylvania Water Science Center
U.S. Geological Survey
215 Limekiln Road
New Cumberland, PA 17070
or visit our website at:
https://usgs.gov/centers/pa-water/
Publishing support provided by the U.S. Geological Survey, Science Publishing Network, Baltimore Publishing Service Center.
Disclaimers
Any use of trade, firm, or product names is for descriptive purposes only and does not imply endorsement by the U.S. Government.
Although this information product, for the most part, is in the public domain, it also may contain copyrighted materials as noted in the text. Permission to reproduce copyrighted items must be secured from the copyright owner.
Suggested Citation
Ruddy, A.J., Woodward, E.E., and Casile, G.C., 2026, Data-collection methods for total dissolved gases monitoring, Youghiogheny River at Dam Outlet Tunnel near Confluence, Pennsylvania: U.S. Geological Survey Open-File Report 2026–1068, 14 p., https://doi.org/10.3133/ofr20261068.
ISSN: 2331-1258 (online)
Study Area
| Publication type | Report |
|---|---|
| Publication Subtype | USGS Numbered Series |
| Title | Data-collection methods for total dissolved gases monitoring, Youghiogheny River at Dam Outlet Tunnel near Confluence, Pennsylvania |
| Series title | Open-File Report |
| Series number | 2026-1068 |
| DOI | 10.3133/ofr20261068 |
| Publication Date | March 27, 2026 |
| Year Published | 2026 |
| Language | English |
| Publisher | U.S. Geological Survey |
| Publisher location | Reston, VA |
| Contributing office(s) | Pennsylvania Water Science Center |
| Description | Report: v, 14 p.; Dataset |
| Country | United States |
| State | Pennsylvania |
| City | Confluence |
| Other Geospatial | Youghiogheny River |
| Online Only (Y/N) | Y |
| Additional Online Files (Y/N) | N |