

The National Integrated Water Availability Assessment, Water Years 2010–20
Links
- Document: Report (22.6 MB pdf) , HTML , XML
- Larger Work: This publication is Chapter A of U.S. Geological Survey Integrated Water Availability Assessment—2010–20
- NGMDB Index Page: National Geologic Map Database Index Page (html)
- Download citation as: RIS | Dublin Core
Preface
This is one chapter in a multichapter report that assesses water availability in the United States for water years 2010–20. This work was conducted as part of the fulfillment of the mandates of Subtitle F of the Omnibus Public Land Management Act of 2009 (Public Law 111-11), also known as the SECURE Water Act. As such, this work examines the spatial and temporal distribution of water quantity and quality in surface water and groundwater, as related to human and ecosystem needs and as affected by human and natural influences. Chapter A (this chapter) introduces the National Integrated Water Availability Assessment and provides important background and definitions for how the report characterizes water availability and its components. Chapter A also presents the key findings of Chapters B–F and thus acts as a summary of the entire report. Chapter B (Gorski and others, 2025) is a national assessment of water supply, which is the quantity of water supplied through climatic inputs. Chapter C (Erickson and others, 2025) is a national assessment of water quality, which is the chemical and physical characteristics of water. Chapter D (Medalie and others, 2025) assesses water use including withdrawals and consumptive use in the conterminous United States. Chapter E (Scholl and others, 2025) presents an analysis of factors affecting future water availability under changing climate conditions. The National Integrated Water Availability Assessment culminates with Chapter F (Stets and others, 2025a), which is an integrated assessment of water availability that considers the amount and quality of water coupled with the suitability of that water for specific uses. Together, these six chapters constitute the National Integrated Water Availability Assessment for water years 2010–20.
Abstract
Water availability is fundamentally important to human well-being, economic vitality, and ecosystem health. Because of its central importance, the U.S. Congress tasked the U. S. Geological Survey (USGS) and other Federal agencies with conducting regular, comprehensive assessments of water availability in the United States through the requirements under the SECURE Water Act. In response to this mandate, the USGS has developed the U.S. Geological Survey Integrated Water Availability Assessment—2010–20, which addresses aspects of water supply, quality, and use related to water availability in the United States. This is the first chapter of that report. The major climatic factors affecting water availability are also described. Multiple aspects of water availability are integrated to produce a more comprehensive analysis of water availability in the United States. This chapter enumerates the development, organization, and tools used in the USGS Integrated Water Availability Assessment. SECURE Water Act reports, developed by the Department of Energy Hydropower Climate Change Assessment and the Bureau of Reclamation West-Wide Climate and Hydrology Assessment, are also described. A distilled list of key findings from the overall report is also provided, serving as an introduction to each topic along with the most important high-level information.
Development of a National Water Availability Assessment
Water availability is fundamentally important to human well-being, economic vitality, and ecosystem health. Because of its central importance, the U.S. Congress tasked the U.S. Geological Survey (USGS) and other Federal agencies, with conducting regular, comprehensive assessments of water availability in the United States. Authorization for these assessments was written into Subtitle F of the Omnibus Public Land Management Act of 2009 (Public Law 111-11), also known as the SECURE Water Act. Other Federal agencies produced reports related to aspects of water availability and water reliability in response to the SECURE Water Act, including an analysis of the effects of climate change on electric power generation at federally owned hydropower facilities (see “sidebar 1”) and an assessment of water reliability in the Western United States (see “sidebar 2”).
Sidebar 1. Department of Energy Hydropower Climate Change Assessment
The U.S. Department of Energy (DOE) reported that electric power generation at federally owned hydropower facilities is likely to increase by 4 percent by 2040 because of a 9 percent increase in streamflow under a suite of climate-change scenarios (U.S. Department of Energy, 2022). These findings were published as part of the DOE third assessment report required under the SECURE Water Act. These reports, called the 9505 Assessments in reference to the section of that act requiring them, use a suite of climate projections to determine how changes in the hydrologic cycle may change electric power generation at federally owned hydropower facilities. Seasonality in streamflow and power-generation responses to climate change were especially pronounced in the Bonneville and Western Area Power Administrations (fig. S1.1), with decreases in summer streamflow coupled with increases in winter and spring streamflow and corresponding changes in power generation (Kao and others, 2022). Nationwide, annual increases were also projected, with a similar seasonality shifting toward greater spring and winter streamflow and power generation, decreases in summer, and inconclusive results in autumn (Kao and others, 2022).
Reports were published in 2012, 2016, and 2022 (Sale and others, 2012; Kao and others, 2016, 2022). The third assessment report used a more fully built-out multimodel assessment framework than the previous two assessments that allowed estimates of uncertainty in predictions attributed to various combinations of modeling choices including climate projections, climate downscaling methods, reference meteorological conditions, hydrologic model, and hydropower model. The 2012 and 2016 assessments developed empirical relations between runoff and hydropower generation in the river basins of interest and used downscaled general circulation models to estimate changes in runoff and the resulting changes in hydropower generation (described in Kao and others, 2022). The third assessment report built upon this framework and incorporated more complete hydrologic models and hydropower generation models (U.S. Department of Energy, 2022). The report simulated future conditions using a range of model applications to develop an ensemble suite of outcomes, which encompass a greater range of future conditions. The study included 132 hydropower plants, which generate 46 percent of all U.S. hydropower. The results were analyzed nationally and by Power Marketing Administrations, which included the Bonneville Power Administration, Western Area Power Administration, Southwestern Power Administration, and Southeastern Power Administration (fig. S1.1).
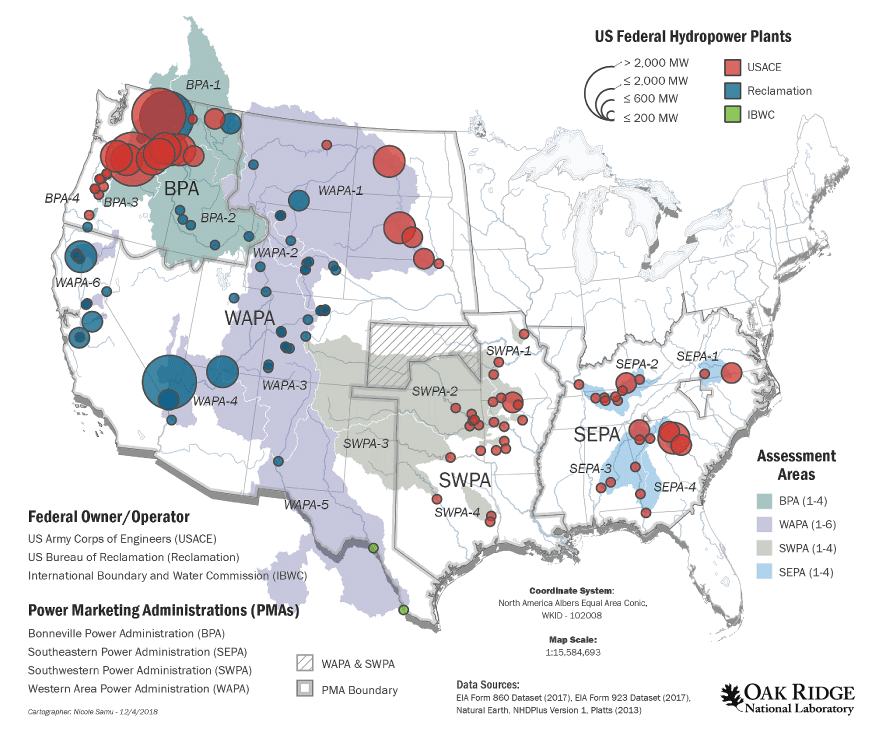
Federal hydropower facilities and Federal Power Marketing Administrations assessed in the U.S. Department of Energy reports for conterminous United States. Figure reprinted from U.S. Department of Energy (2022). US, United States; MW, megawatt; >, greater than; ≤, less than or equal to.
Sidebar 2. Bureau of Reclamation West-Wide Climate and Hydrology Assessment
In response to the SECURE Water Act, the Bureau of Reclamation has produced a series of reports on water reliability in the Western United States (Bureau of Reclamation, 2021a). The reports focus on past, present, and future water supplies across the West with focused studies in seven major river basins: Colorado, Columbia, Klamath, Missouri, Rio Grande, Sacramento–San Joaquin, and Truckee–Carson River Basins (fig S2.1). Changes to temperature, precipitation, and streamflow were predicted in these basins under four climate scenarios from the Coupled Model Intercomparison Project (Taylor and others, 2012). Temperatures are predicted to increase across the Western United States under all future climate scenarios whereas changes in precipitation are expected to vary regionally (fig S2.2). Of particular interest is the future of drought, which is expected to increase in intensity and duration throughout much of the Western United States. The relative severity of current and future droughts was placed in a larger context using tree-ring proxies, which provided a means of gaging the severity of droughts for the past several hundred years (in other words, beyond meteorological record keeping). Findings differed by basin, but the most general findings indicated that droughts in the West would likely increase in the next century along with overall climate variability. The Bureau of Reclamation published these results as a full report and as a set of separate reports for each of the seven major river basins.
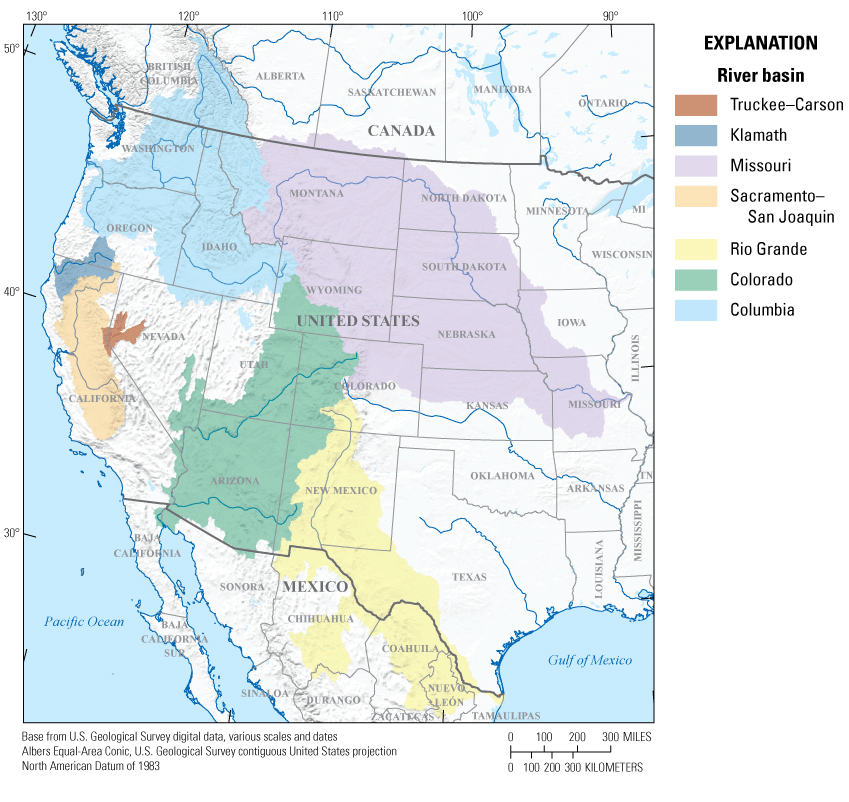
Seven major river basins in the Western part of the conterminous United States included in the Bureau of Reclamation West-Wide Climate and Hydrology Assessment (Bureau of Reclamation, 2021b). Reprinted from Bureau of Reclamation (2021a).
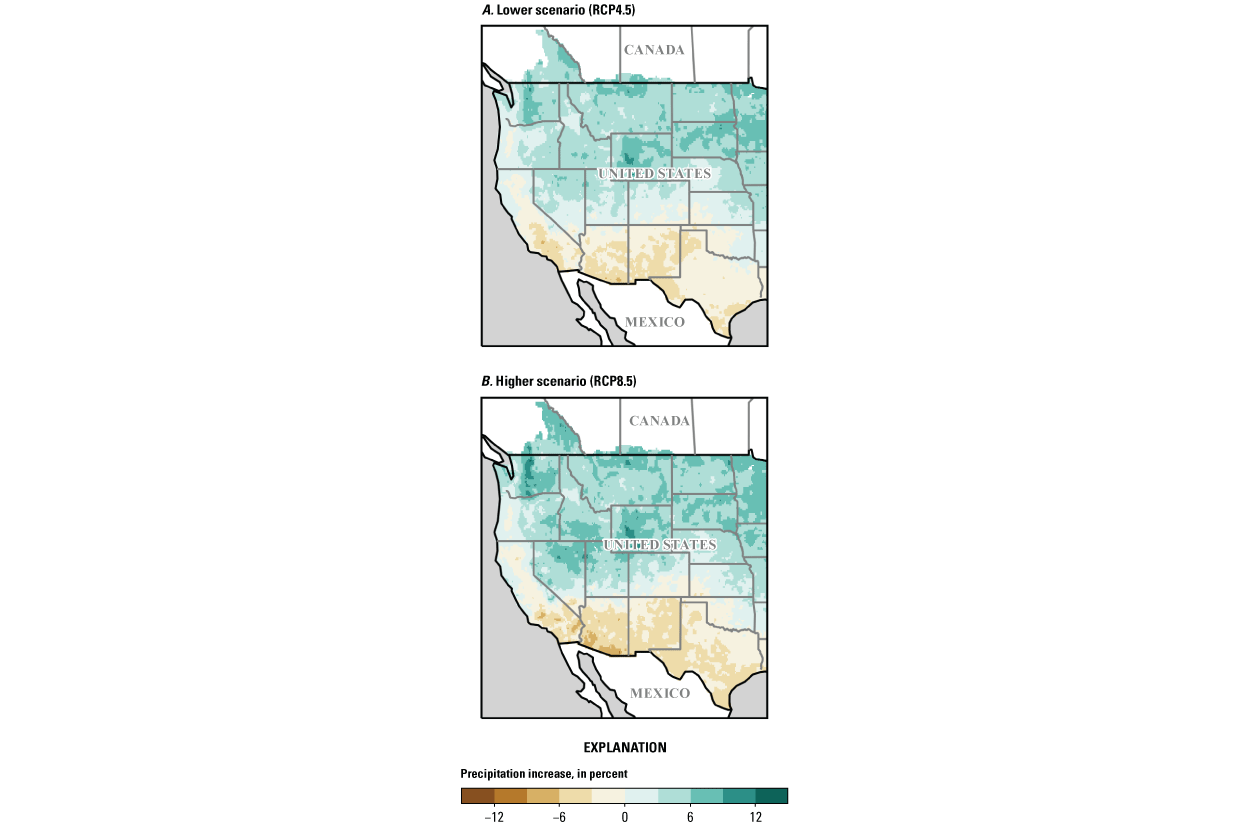
Projected change in precipitation in Western United States during 2040–69 compared with baseline reference period of 1970–99 under (A) lower (Representative Concentration Pathway [RCP4.5]) and (B) higher (RCP8.5) climate-change scenarios. Projections represent an average across 32 separate simulations. Reprinted from Bureau of Reclamation (2021a).
The USGS delivered preliminary reports in 2013 and 2018 in response to the mandates of the SECURE Water Act (Alley and others, 2013; Evenson and others, 2018). Those reports described the Focus Area Studies that served as case studies for the initial development of modeling tools and approaches used in water availability assessments. The 2018 report also articulated a need to develop more comprehensive modeling capabilities to estimate water use in the United States (Evenson and others, 2018), some of which are used in this assessment. These capabilities include models estimating water withdrawals for crop irrigation, thermoelectric power, and public supply (Alzraiee and others, 2024; Harris and others, 2024; Martin and others, 2023), which allow estimates of water use at much finer temporal and spatial resolution than have been previously available. Additionally, two national-scale hydrologic models—the USGS National Hydrologic Model, which is a national-scale instance of the Precipitation Runoff Modeling System (Regan and others, 2018), and the Weather Research and Forecasting Hydrologic Model (WRF-Hydro; Rafieeinasab and others, 2024)—were developed for use in this assessment. Both models use the novel CONUS404 hydroclimate dataset as input (Rasmussen and others, 2023), which was produced through a collaboration between the USGS and the National Center for Atmospheric Research. The models are described in more detail in Gorski and others (2025 [chap. B]; see “sidebar 3”).
Sidebar 3. The CONUS404 Dataset
The CONUS404 dataset is an application of the Weather Research and Forecasting (WRF) model code at a very high resolution (4 kilometers), over a very large geographic domain (the conterminous United States [CONUS], plus some parts of Canada, Mexico, and the oceans), over a long time period (40 years, 1980–2020), using dynamical downscaling methods. The dataset is the result of a U.S. Geological Survey collaboration with National Center for Atmospheric Research to include two-way, land surface-atmosphere dynamics and improved parameterization and simulation of several land-surface processes. The CONUS404 historical dataset uses a downscaled fifth-generation European Reanalysis (ERA5) climate product output (a reanalysis of general circulation models [GCMs] and observational data at GCM scales; Hersbach and others, 2020), which provides hydroclimatological consistency for the entire period of simulation (including through the transition from historical to future conditions) across the entire geographic domain, at a resolution that is useful for simulating terrestrial hydrologic responses. This combination of dataset qualities is part of what differentiates the CONUS404 dataset from many other available options. Execution of the model run was a substantial effort and the model itself required around-the-clock computation for 11.5 months on a supercomputer.
CONUS404 compares well with existing meteorological products including observationally derived data (Rasmussen and others, 2023). Areas of notable improvement over existing datasets are the representation of precipitation over complex terrain, and in short, high-intensity events. Additionally, the accurate representation of snow processes was a focus of development. A detailed description of the methodologies for the development of CONUS404 are available in Rasmussen and others (2023). One strength of this dataset is that it depicts mesoscale events, such as large storm systems, in a physically coherent way across large regions. In certain areas, improved regional coherence comes at the expense of local accuracy when comparing CONUS404 to other observational records such as the National Oceanic and Atmospheric Administration Analysis of Record for Calibration (AORC) or gridMET (Abatzoglou, 2013; Fall and others, 2023). Recognition of this fact led to the implementation of a bias-adjustment technique that leveraged the Daymet data product, which provides continuous, gridded weather estimates through interpolations of ground-based observations (Thornton and others, 2022). This report relies on summaries of weather and hydrology at the scale of 12-digit hydrologic units up to larger aggregated regions, so the loss of fine-scale accuracy is not an impediment to the assessment methodology. The spatial and temporal resolution and coverage of CONUS404 facilitates the analysis of water-resource issues at the continental, regional, and basin scale under past, present, and potential future conditions, all using the same consistently produced set of meteorological inputs in a manner that has not been previously developed.
This report is the first comprehensive, national assessment of water availability in the Nation conducted by the USGS in response to the SECURE Water Act. Water availability is defined as the “spatial and temporal distribution of water quantity and quality, as related to human and ecosystem needs” (Evenson and others, 2013, p. 3). Therefore, this report is constructed to be inclusive of water quantity, quality, and use, which are individual aspects of water availability that can be integrated to provide a more comprehensive assessment. Another similarly comprehensive assessment was published in 1978 by the Water Resources Council in fulfillment of requirements of the Water Resources Planning Act of 1965 (42 U.S.C. §1962a-2; U.S. Water Resources Council, 1978). The current assessment relies on capabilities developed through the WaterSMART initiative and other efforts to create an integrated assessment of water availability (described further in Evenson and others, 2018). This assessment covers water years 2010–20 to describe average water-availability conditions over that period along with broad considerations for year-to-year variability in the results.
Regional Studies in Support of Integrated Water Availability Assessments at the National Scale
USGS observational capabilities support the development of integrated water availability assessments. The USGS conducts monitoring across the United States, including real-time observations of streamflow, groundwater levels, meteorologic data, and water-quality information. National monitoring networks are distributed across rivers and aquifers throughout the Nation. Additionally, the USGS has developed capabilities to support the study of interactions between climate, surface water, groundwater, and soil moisture across small to medium-sized areas (Eberts and others, 2019). Associated water availability assessment activities are organized through a series of regional studies conducted within medium-sized river basins, with substantial water-availability challenges (Miller and others, 2022). Addressing the specific water-availability issues in these basins supports the further development of integrated water availability assessments (Miller and others, 2021). Further description of the selected Integrated Water Science (IWS) basins appears in “sidebar 4.”
Sidebar 4. Regional Integrated Water Availability Assessments
Regional Integrated Water Availability Assessments (regional IWAAs) focus on water availability related to unique regional challenges and support national models and assessments in medium-sized Integrated Water Science (IWS) basins and other areas. The regional IWAAs studies in IWS basins were selected to represent a wide range of hydrologic settings and water-resource challenges (Miller and others, 2021) and follow a consistent phased approach. Innovative monitoring capabilities, integrated modeling, and updated assessments are being implemented by the USGS to improve our understanding of how to address water resource-challenges across the Nation (Miller and others, 2020; fig. S4.1).
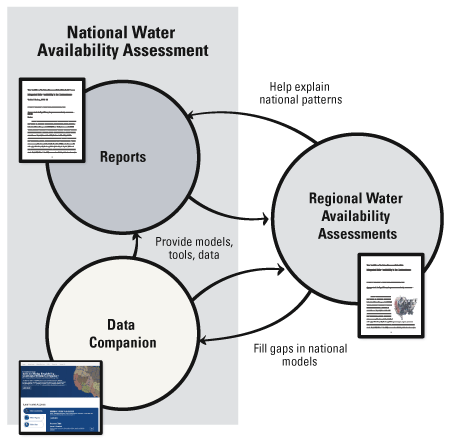
Relations between the National Water Availability Assessments, Regional Water Availability Assessments, and the Data Companion. Illustration by Amanda Carr, U.S. Geological Survey.
Regional IWAAs studies are underway in five IWS basins including the Delaware, Upper Colorado, Illinois, Willamette, and Trinity–San Jacinto River Basins. The impact of increasing surface and groundwater salinity on water availability is being studied in the Delaware River Basin. Changes in snow conditions affecting water supply and salinity are the study focus in the Upper Colorado River Basin. The drivers of nutrient contamination and resulting harmful algal blooms are the investigative focus in the Illinois River Basin. Competing ecological and human demands necessitate detailed water-availability information in the Willamette River Basin. The regional IWAAs study in the Trinity–San Jacinto River Basin is focused on urban flooding and its socioeconomic impacts in a dense urban setting.
The additional regional IWAAs studies underway outside these IWS basins are located in the Klamath River Basin, the Mississippi Alluvial Plain, and the saline lakes ecosystems in the Great Basin. Reservoir drawdown begun in early 2024 along the Klamath River for the largest dam removal project in U.S. history in an attempt to reverse ecological damage and restore fish populations. Groundwater declines resulting from pumping for agricultural supplies in the Mississippi Alluvial Plain have limited water availability for other uses in this region. Drought has reduced water supplies for ecological uses, such as bird habitat, in the saline lake ecosystems of the Great Basin, and work there will focus on ways to sustain waterbird populations in the face of hydroclimatic change and complex water-use dynamics.
Organization of the Assessment Report
Water availability is multifaceted, including aspects of water supply, quality, use, socioeconomic drivers, and other factors. This report integrates many of these components to develop an assessment of water availability on a monthly basis for water years 2010–20.
The water year 2010–20 assessment is organized with six chapters, including this introductory chapter. Three chapters address individual aspects of water availability during water years 2010–20 on the national scale: water supply (chap. B, Gorski and others, 2025), water quality (chap. C, Erickson and others, 2025), and water use (chap. D, Medalie and others,2025). These chapters are followed by a chapter placing current water availability conditions in the context of documented and projected effects of ongoing climate change on water-resource availability in the future (chap. E, Scholl and others, 2025). Finally, the integrated water availability chapter (chap. F, Stets and others, 2025a) considers information on water supply, quality, and use, and socioeconomic conditions together to develop relative metrics of water stress during water years 2010–20 for the conterminous United States (CONUS). Throughout the report, complementary studies within the USGS and other Federal agencies are highlighted to provide a fuller picture of the efforts made toward understanding water availability throughout the Nation.
Spatial Resolution of Water Availability Analyses
Water availability analyses were performed at a spatial resolution represented by the 12-digit hydrologic unit code (HUC12; see, “sidebar 5”). We also expressed results at the scale of hydrologic and aggregated hydrologic regions. The hydrologic regions are areas of the country with similar hydrology and water availability concerns that were originally developed to help inform selection of basins for more in-depth sampling, analysis, and modeling as part of ongoing updates to the USGS approach to water science (Van Metre and others, 2020). Eighteen hydrologic regions within the CONUS were identified (fig. 1; Van Metre and others, 2020). Several regions were added for areas outside the CONUS (Alaska, Hawaii, Puerto Rico, and Virgin Islands) where relevant results were available, which are collectively referred to as OCONUS. For comparative purposes, we further grouped the hydrologic regions into four CONUS aggregated hydrologic regions based on location and shared water-availability characteristics and challenges (Northeast through Midwest, Southeast, High Plains, and Western).
Sidebar 5. Hydrologic Unit Codes
The U.S. Geological Survey uses a depiction and classification scheme for hydrologic units known as hydrologic unit codes (HUCs). HUCs generally represent catchments, and river basins are represented by a unique series of numbers with successively smaller hydrologic units nested inside of larger ones (fig S5.1). Digits are added as hydrologic units become smaller, such that a 2-digit HUC encompasses multiple 4-digit HUCs, and a 4-digit HUC encompasses multiple 6-digit HUCs, etc. This assessment uses 12-digit HUCs (HUC12s), which generally range from 50 to 100 square kilometers (km2) in size. The CONUS contains 18 2-digit HUCs and over 93,000 12-digit HUCs. The HUC12 median areal extent in the conterminous United States is 90 km2. Although in practice, HUCs represent river basins, they are formally administrative units, and not always natural watersheds. As such, HUCs can depict human-created drainages and diversions or arbitrary breaks in connected flow systems.

Nesting of hydrologic unit codes (HUCs), which result in successively smaller drainage units and add digits to the HUC to create a unique “address.” km2, square kilometer.
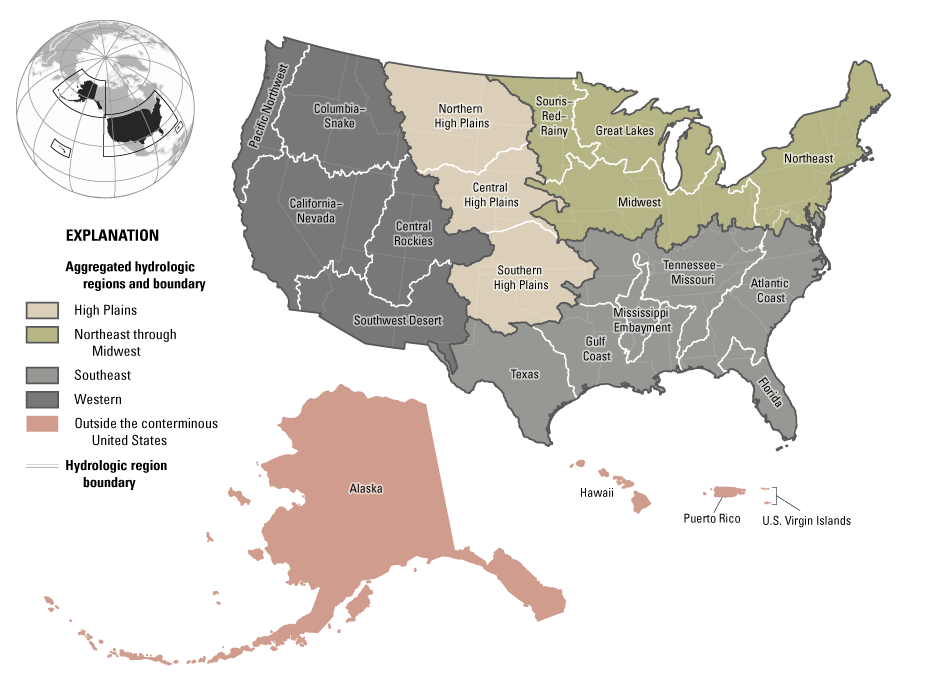
Hydrologic regions and aggregated hydrologic regions used in this report in the conterminous United States, Alaska, Hawaii, Puerto Rico, and the U.S. Virgin Islands.
Categorizing and discussing water-availability issues on the basis of hydrologic regions is beneficial because of the internal homogeneity of major factors and processes determining water availability within a hydrologic region, and the heterogeneity with external neighboring hydrologic regions. Three criteria categories—natural factors, anthropogenic factors, and the importance of resource to receptors—were used to form the hydrologic regions. These designations resulted in regions with internal consistency in potential water-availability limitations although natural flow routing is sometimes broken between the regions. For example, the upper Mississippi River Basin was split into an eastern part that was located in the Great Lakes hydrologic region and a western part that was located within the Souris–Red–Rainy hydrologic region. Similarly, placing the upper Rio Grande Basin in the Central Rockies hydrologic region and the lower Rio Grande Basin in the Desert Southwest hydrologic region is appropriate with respect to water quality, but less so with respect to hydrology. Although the modeling capabilities accurately reflect hydrologic routing, the aggregation of these results to the hydrologic regions places a greater emphasis on commonalities in potential water-availability limitations as described in Van Metre and others (2020).
Key Findings for the Status of Water Availability in the United States, Water Years 2010–20
National Assessment of Water Supply (Chapter B, Gorski and others, 2025)
Water supply, defined here as the quantity of water supplied to the Nation through climatic inputs, is critical within the global water cycle and in understanding water availability. The analysis of water supply in this chapter included precipitation (snow or rain), streamflow, soil moisture, snow water equivalent (snowpack), and groundwater levels. On an average annual basis, about 5,000 billion gallons per day (Ggal/d) enters CONUS through precipitation and about 63 percent is returned to the atmosphere through evapotranspiration (ET); 25 percent results in streamflow to Canada, the Atlantic and Pacific Oceans, or the Gulf of Mexico; 2 percent is lost to consumptive use; and 10 percent is stored in surface or groundwater (fig. 2).
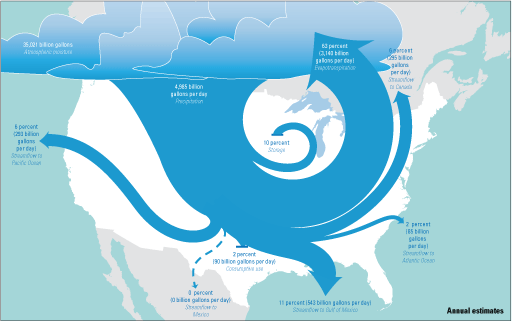
Annual average hydrologic fluxes across the conterminous United States. Flux estimates are derived from model simulation and literature values and exclude consumptive use in the Great Lakes hydrologic region, which represents the sum of irrigation, public supply, and thermoelectric consumptive use; further details are available in chapter D, Medalie and others (2025).
Periods of low precipitation can have cascading effects throughout the water cycle, expanding areas of water stress and aggravating water quality issues (see chap. F, Stets and others, 2025a). For example, much of the High Plains aggregated hydrologic regions and Midwest hydrologic region had low precipitation totals in water years 2011 and 2012. The lack of rain resulted in low streamflow, ET, and soil moisture, and resulted in one of the most substantial droughts since the 1930s. The highest interannual variability in precipitation during 2010–2020 was noted in the California–Nevada, Texas, Southern High Plains, and the Southwest Desert hydrologic regions, whereas the lowest interannual variability was reported in the Florida, Tennessee–Missouri, and Northeast hydrologic regions.
In the Western and High Plains aggregated hydrologic regions, where precipitation patterns are highly seasonal and show strong interannual variability, storage components (for example, snowpack and soil moisture) serve to buffer water supplies during the dry season and (or) dry years. In contrast, in the Northeast through Midwest aggregated hydrologic regions and parts of the Southeast aggregated hydrologic regions (which have higher annual precipitation totals), storage can contribute to flooding through rain on snow events and soil-saturation excess.
Some areas of the United States obtain a substantial amount of the water needed for human activities from groundwater (see chap. D, Medalie and others, 2025), which may lead to declines in groundwater levels if recharge of the groundwater aquifers is insufficient. For example, groundwater levels were determined to be low in comparison with historical averages in several important aquifer systems that supply water resources to many people across the Nation, including the California Coastal Basin aquifers, Colorado Plateaus aquifers, Snake River Plain basaltic-rock aquifers, Rio Grande aquifer system, and Northern Atlantic Coastal Plain aquifer system (fig. 3). Additionally, the central and southern regions of the High Plains unconfined aquifer showed declines during water years 2010–20, which were part of a long history of groundwater depletion in the region (fig. 3A).
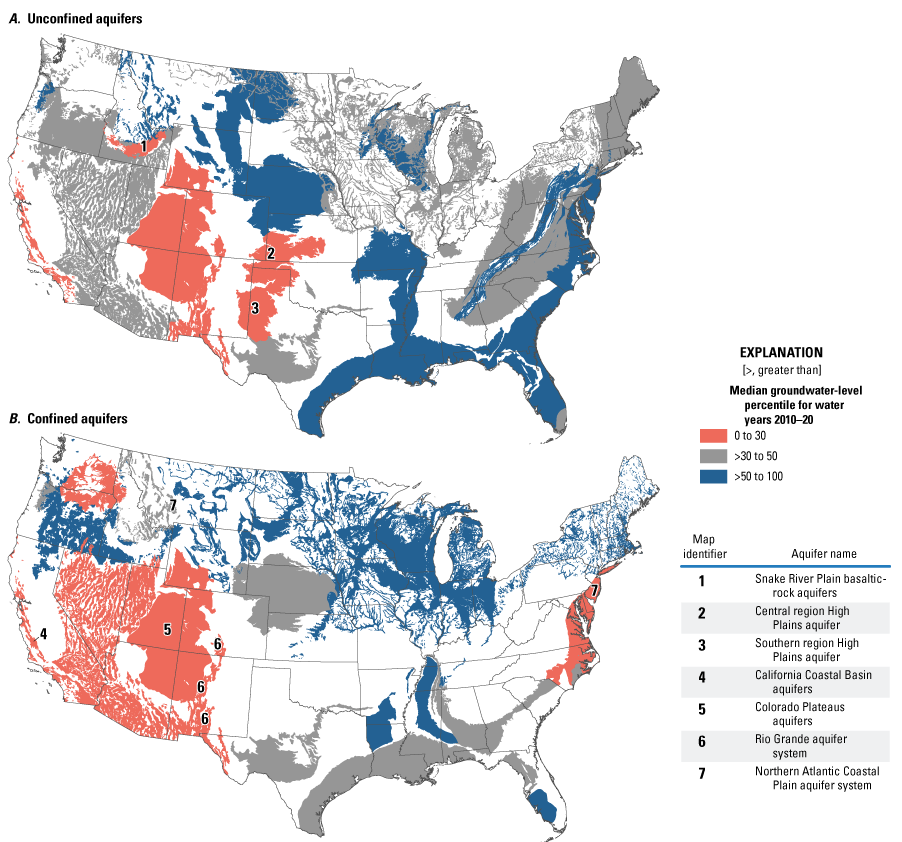
Median groundwater-level percentiles, by regional aquifer, for (A) unconfined aquifers and (B) confined aquifers, in the conterminous United States across the period of analysis (water years 2010–20). Unconfined aquifers are usually shallower than confined aquifers and have the water table as their upper boundary. Confined aquifers are usually deeper than unconfined aquifers and have confining layers, or aquitards, as their boundaries. Principal aquifers without sufficient data in the National Groundwater Monitoring Network at the time of analysis are not depicted on the map. In all, 29 unconfined and 23 confined principal aquifers were included in the analysis.
National Assessment of Water Quality (Chapter C, Erickson and others, 2025)
Water quality, defined here as the chemical and physical characteristics of water, is often a primary determinant of water availability for human and ecosystem uses. A literature review of previous national and aggregated regional water quality assessments in surface water and groundwater is presented in this chapter. Surface-water contaminants were grouped into categories of nutrients, salinity, sediment, temperature, organic contaminants, biotic constituents, metals and physical properties. Groundwater contaminants were grouped into two categories: geogenic constituents and anthropogenic constituents. National modeling results of surface-water nutrients and perfluoroalkyl and polyfluoroalkyl substances (PFAS) were included along with observational results on salinity, pesticides, and sediment. Groundwater models of arsenic, nitrate, and other geogenic contaminants were used in this assessment. Water quality was also compared with established contaminant criteria levels to assess river impairments by water-quality constituent. Finally, the results were examined in the context of societal factors that relate to the potential vulnerability of water availability due to water-quality limitations.
Threats to water quality differ depending on water usage (for example, for drinking water versus recreation) and vary with water source (for example, surface water versus groundwater). Most Americans are provided with drinking water from public supplies. Substantial areas within principal aquifers that provide about one-third of public supplies have elevated concentrations of inorganic contaminants such as arsenic, manganese, radionuclides, and nitrate (fig. 4). Low-income and minority-dominated communities and people with domestic wells as their drinking water source experience increased exposure to drinking water contamination.
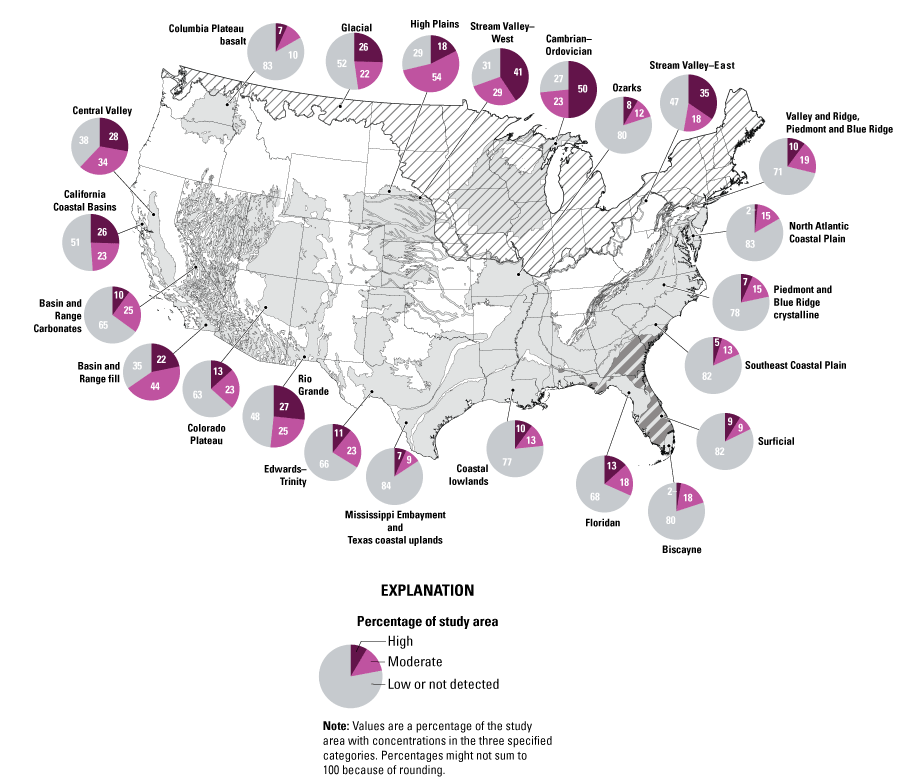
Overview of water quality in principal aquifers across the conterminous United States, 2013–21. Colored pie charts indicate the percentage of the area studied that contained a constituent in untreated groundwater at a concentration that exceeds a human-health benchmark for drinking water (high), one-half of that value (moderate), or less than one-half of that value (low). Data from Belitz and others (2022).
Metal contamination, salinity, and sediments were identified as the main threats to streams and rivers used as a drinking-water source (fig. 5). Stream contaminants that threaten fish-consumption use by humans included primarily polychlorinated biphenyls and mercury, whereas contaminants that threaten recreational use were mainly biotic pathogens (fig. 5). The identification of these contaminants was influenced by the existence of health standards and observational data needed to assess exceedances of those standards.
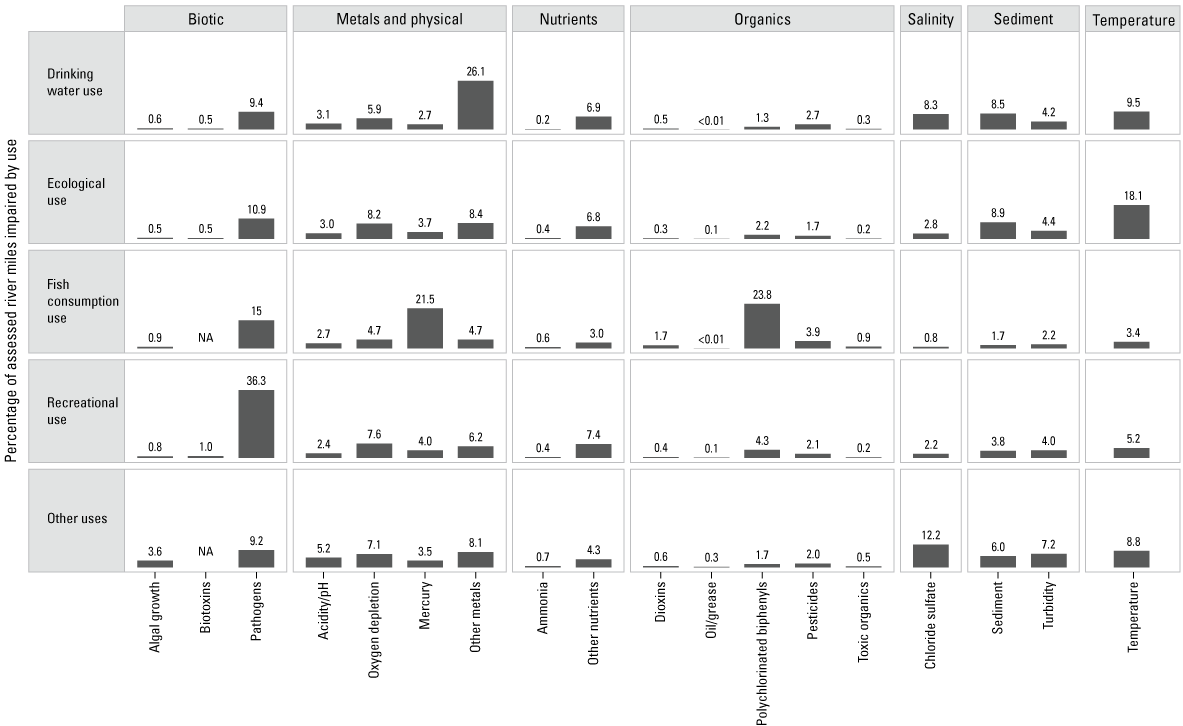
Selected surface-water-quality parameters that have been identified as impairing water availability, disaggregated by selected beneficial use of water categories, for the conterminous United States. NA, no limitation reported; <, less than.
Human activities can affect water quality through multiple pathways, including application of contaminants at the land surface (for example, fertilizers, organic chemicals); modification of storage and flow (for example, dredging, irrigation); and by permanently altering the landscape (for example, dams, urbanization). Increased water demands can aggravate mobilization and transport of geogenic trace elements and radionuclides in groundwater through altered groundwater chemistry and perturbations to the water cycle resulting from drought, managed aquifer recharge, and groundwater-level changes.
Numerous water-quality constituents or mixtures of constituents have effect on water availability that currently are unknown, underexplored, or without thresholds for various beneficial uses, which limits the ability to develop a comprehensive national assessment.
National Assessment of Water Use (Chapter D, Medalie and others, 2025)
An understanding of withdrawals of water (where, when, how much, and for what purpose) for human use is fundamental to the evaluation of the Nation’s water availability. The water-use assessment presented in this chapter provides an analysis of the three types of water use that account for approximately 90 percent of water withdrawals in the CONUS: public supply, crop irrigation, and thermoelectric power. Water use for an additional five categories is presented for the year 2015. The water-use assessment also describes terminology associated with water use and withdrawals by source of water (groundwater and surface water). Additional topics are also discussed, including water used for energy production, reuse, bottled water, and interbasin transfers.
How we use water varies across the country, including the source of water (groundwater versus surface water) and the type of use (for example, crop irrigation, public supply and thermoelectric power; figs. 6 and 7). On average during water years 2010–20, about 225,000 million gallons per day (Mgal/d) of fresh water were used for combined uses of crop irrigation, public supply, and thermoelectric power in the lower 48 States. Another approximately 21,000 Mgal/d of saline water were used for thermoelectric power.
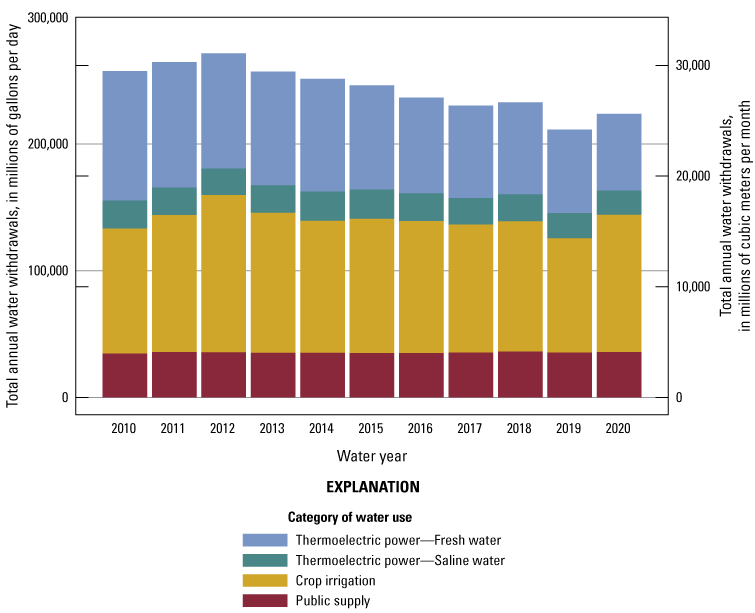
Model estimates of total annual water withdrawals for thermoelectric power (saline and fresh water), crop irrigation, and public supply, for the conterminous United States, water years 2010–20.
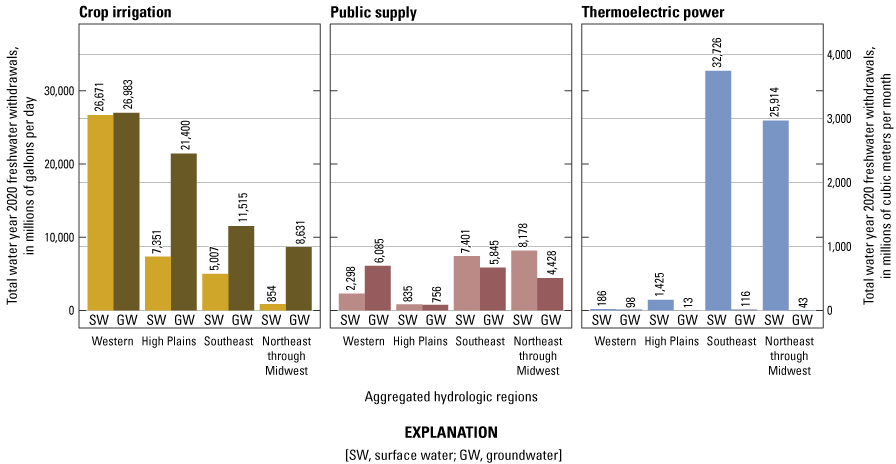
Relative importance of surface water and groundwater as sources for water withdrawals for the three modeled categories of water use (crop irrigation, public supply, and thermoelectric power), by aggregated hydrologic regions, in the conterminous United States, water year 2020.
Of the three main water-use categories, crop irrigation was the largest water use on average across the CONUS (figs. 6 and 7). Regionally, crop irrigation was the primary water-use category in the Western and High Plains aggregated hydrologic regions of the United States, whereas water use for thermoelectric power was the largest water-use category in the Northeast through the Midwest and the Southeast aggregated hydrologic regions (fig. 7). Groundwater was a larger proportion of public-supply withdrawals than surface water in the Western aggregated hydrologic regions. The opposite was true in the Northeast through Midwest and Southeast aggregated hydrologic regions, where surface water was a larger proportion of public-supply withdrawals. Crop-irrigation water use was dominated by groundwater sources in all aggregated hydrologic regions of the United States except for the Western aggregated hydrologic regions, in which it was approximately equally sourced from groundwater and surface water. Thermoelectric power used primarily surface-water sources in all aggregated hydrologic regions.
Not all water withdrawn for human water use returns to the local environment. Some proportion is lost as consumptive use. An example of consumptive water use is the evaporation and transpiration of water used for crop irrigation. Approximately 84,000 Mgal/d (34 percent of total withdrawals) were lost as consumptive water use in the CONUS. Crop irrigation accounted for 90 percent of the consumptive losses whereas thermoelectric and public supply accounted for much smaller loss amounts (3 and 7 percent, respectively; chap. D, Medalie and others, 2025).
Comprehensive information about movement of water across watershed boundaries (interbasin transfers) was not considered in this assessment. However, the chapter reported that, in some parts of the country—for purposes such as public supply, irrigation, flood management, or a combination of these uses—interbasin transfers had a substantial effect on water availability in sending and receiving basins.
Total water withdrawals were highest during the notably dry water years of 2011 and 2012, during which there was increased water used for agricultural irrigation (fig. 6). Withdrawals for thermoelectric power decreased during the period of analysis.
National Assessment of Future Water Resources (Chapter E, Scholl and others, 2025)
Understanding how changes in major climatic drivers impact the water cycle and simulating these impacts accurately in hydrological models is crucial to predicting future water availability. Predictions of future water availability can support the development of adaptation strategies to ensure sufficient quantity and quality of water supplies for humans and ecosystems. The steady rise in global temperature as a result of human activity is causing changes in Earth’s water cycle. The amount of water stored within and moving between vapor, liquid, and frozen components of the water cycle is shifting, with substantial consequences for water availability. In this chapter, a literature review of the major threats to water availability in the United States under future climate scenarios is presented.
The top threats to water availability for humans and ecosystems in North America include increases in drought and aridification, flooding and heavy precipitation, and cryosphere decline (decreases in the timing and extent of ice or frozen ground; fig. 8). We reviewed assessments of climate drivers for modeling scenarios corresponding to global warming levels of 2–2.4 degrees Celsius (°C). Confidence in model-projected change in water-related drivers is highest for heat-related impacts, cryosphere changes, surface carbon dioxide levels, and coastal processes.
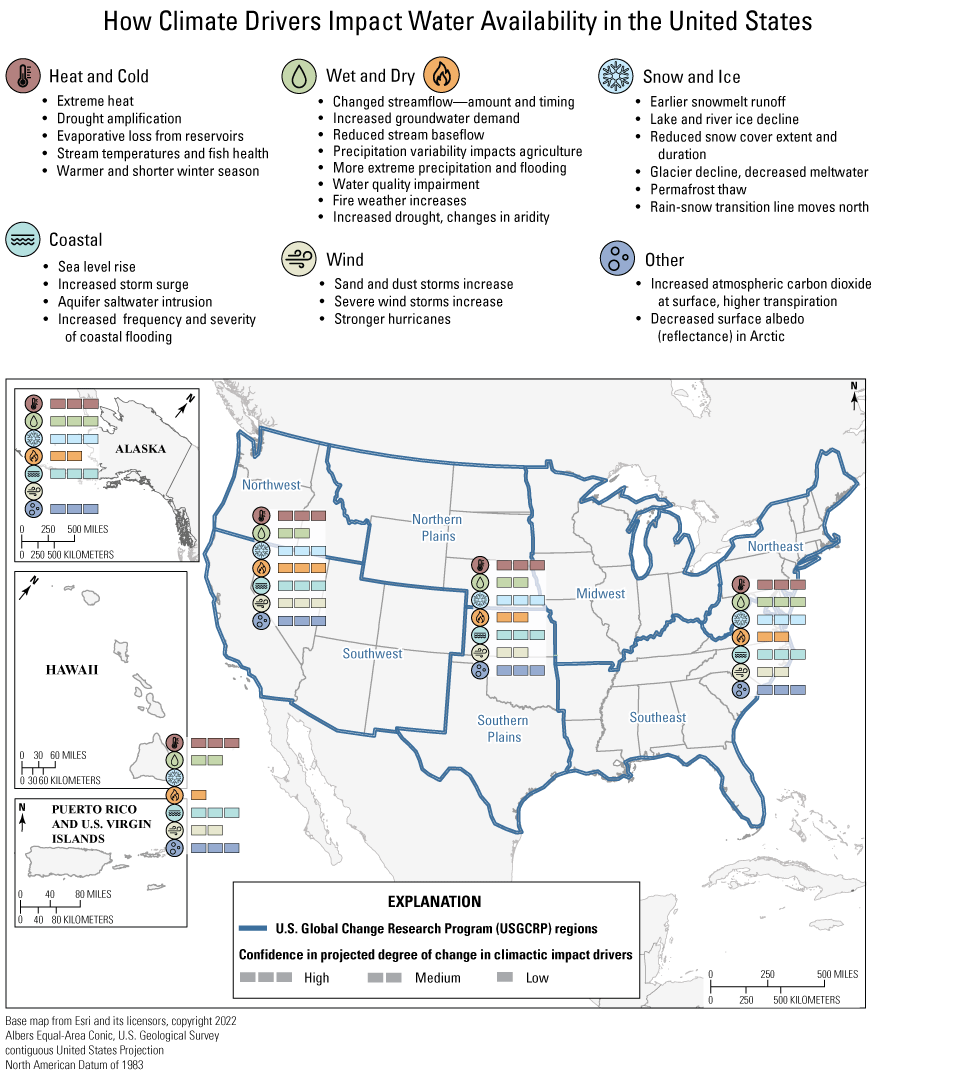
Primary water-availability impacts organized by climatic impact driver category and the regional-level confidence in projected levels and direction of change in the climate drivers with global warming across the United States.
Water quality, an important aspect of water availability, is threatened by rising water temperatures, flooding, and saltwater intrusion in coastal areas. Changing water quality underlies regional and local water-availability concerns in climate change scenarios, such as groundwater decline, ecosystem shifts, and socioeconomic impacts of changes in water availability.
Confidence in model-projected change in water-related drivers for mid-century scenarios corresponding to global warming levels between 2 and 2.4 °C is highest for heat-related impacts, cryosphere changes, surface carbon dioxide levels, and coastal processes.
National Assessment of Integrated Water Availability (Chapter F, Stets and others, 2025a)
Water availability—the spatial and temporal distribution of water quantity and quality, as related to human and ecosystem needs (Evenson and others, 2013)—can be limited by different factors depending on the needs of a water user. The comprehensive description of water availability requires consideration of multiple aspects such as the amount and conditions of water (quantity and quality), along with the sensitivity of users to those conditions. For example, the criteria for drinking water are often stricter than those for crop irrigation. Information from the assessments of water supply, quality, and use in this chapter was used to create a more integrated regional investigation of water availability and across the CONUS. Water availability was summarized as an index referred to as the surface water-supply and use index (SUI), which determined the relative stress from potential imbalances between water supply and water use. Higher levels of SUI indicate higher local water stress. Specific water-availability components were also compared with ecological factors such as fish species exposure and with metrics of social vulnerability to analyze water availability comprehensively across the CONUS.
High water use can lead to limitations in water availability because it is associated with depletion of water supplies and potential impairment of water quality, which can affect water availability for downstream users. Water supply, calculated as runoff, was much higher than total nationwide consumptive water use, and many areas of the United States had a low or very low SUI (figs. 9 and 10). However, in arid and semiarid parts of CONUS (such as the High Plains and Western aggregated regions of the United States) the differences between these two values were much smaller and limitations on water were more common.
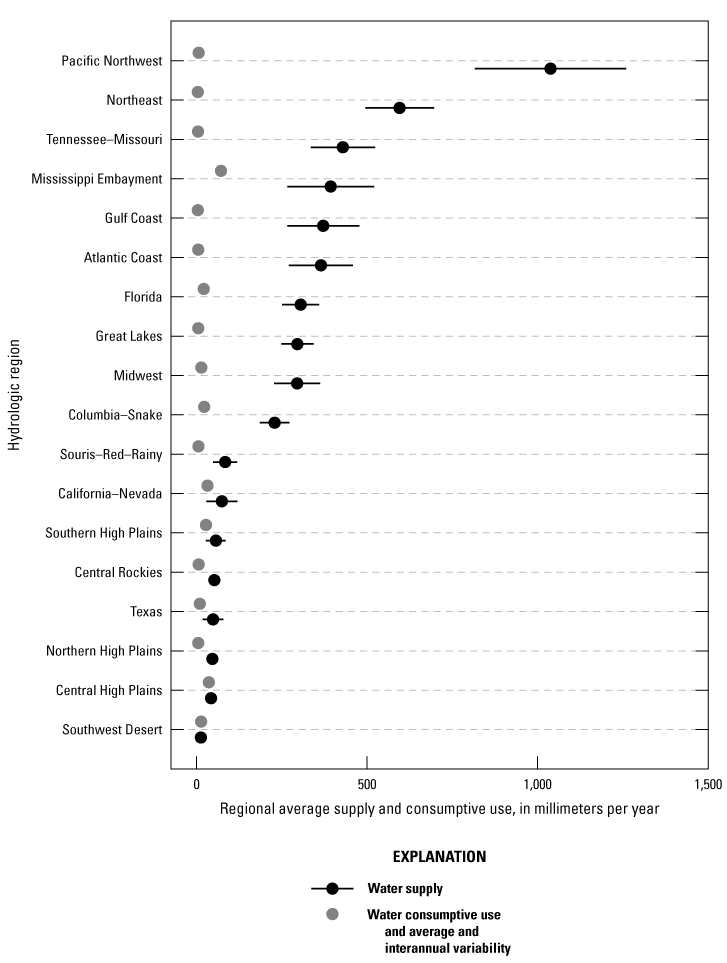
Average and interannual variability (standard deviation) of water supply and consumptive use by hydrologic region, in the conterminous United States, water years 2010–20. For most regions, error bars on consumptive use estimates are smaller than the symbol. Water supply was calculated as the sum of annual runoff for all 12-digit hydrologic unit code (HUC12) catchments in the region divided by the area of the region. Consumptive use was calculated as the sum of water consumed (in other words, removed from the immediate water environment) by crop irrigation, thermoelectric power, and public-supply use within all HUC12 catchments in the region divided by the area of the region. Data source: Miller and others (2024).
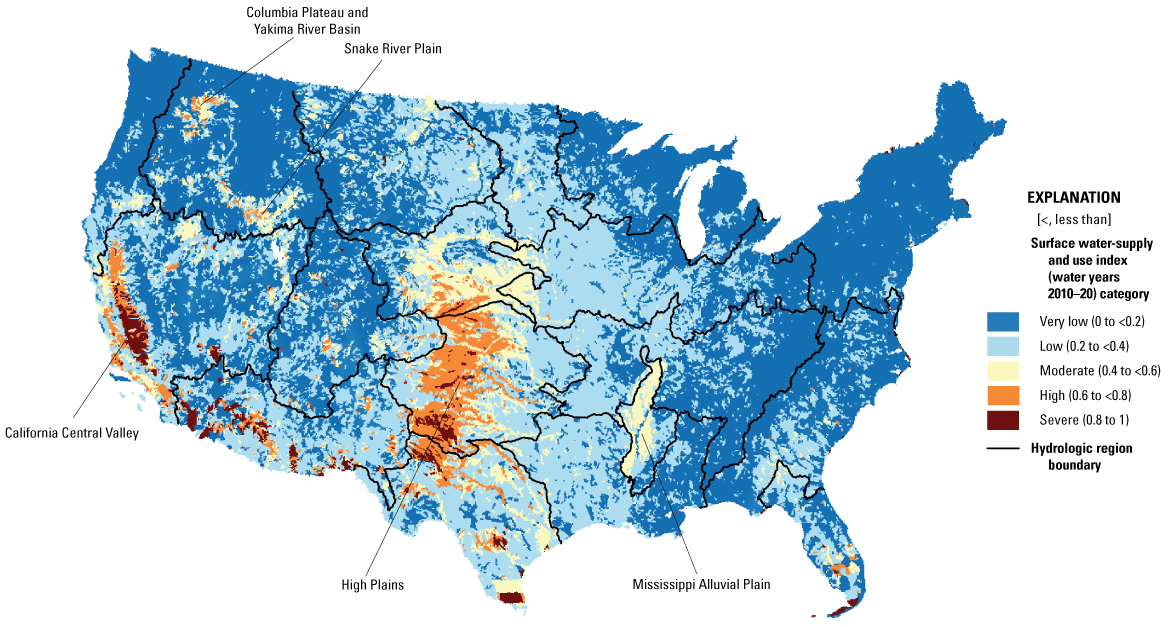
Average decadal surface water supply and use index by 12-digit hydrologic unit code, which expresses the imbalance between surface water supply and consumptive uses in the conterminous United States, water years 2010–20. Figure recreated from Stets and others (2025b).
About 27 million people lived in areas where water use was a high percentage of surface-water supply, indicating a high degree of local water stress. A higher proportion of the people living in areas of high or severe SUI were considered socially vulnerable compared with those living in areas of more local water availability.
Water availability varied from year to year, depending on interannual variations in supply and use. Total withdrawals were highest during water years 2011 and 2012, which were notably dry, because of increased water used for agricultural irrigation (chap. D, Medalie and others, 2025). Water supply was lower during this time as evidenced by abnormally low precipitation, soil moisture, and streamflow (see chap. B, Gorski and others, 2025).
Three fish species of conservation concern had a large percentage of their habitat range affected by potential water-quantity limitations through supply and use imbalances. The Arkansas River shiner (Notropis girardi) had more than (>) 50 percent of its habitat range in severe supply and use imbalance and the plains killifish (Fundulus zebrinus) and Utah sucker (Catostomus ardens) each were reported to have >40 percent of their habitat range in severe supply and use imbalance (Stets and others, 2025b).
Streams with nitrogen and phosphorus concentrations greater than reference conditions were widespread across the CONUS (chap. C, Erickson and others, 2025). More than 50 percent of the stream reaches in eight of the hydrologic regions (Souris–Red–Rainy, Midwest, Central High Plains, Southern High Plains, Northern High Plains, Mississippi Embayment, Tennessee–Missouri, and Central Rockies) were at least four times higher than ecologically relevant reference conditions (Stets and others, 2025b). Groundwater concentrations of nitrate and arsenic were elevated in a much smaller proportion of the CONUS, although areas with elevated concentrations can present risks to populations that depend on groundwater as a drinking-water source.
Stressors to water availability tended to co-occur such that hydrologic regions with elevated stress in one aspect of water availability usually showed elevated stress in multiple categories (fig. 11).
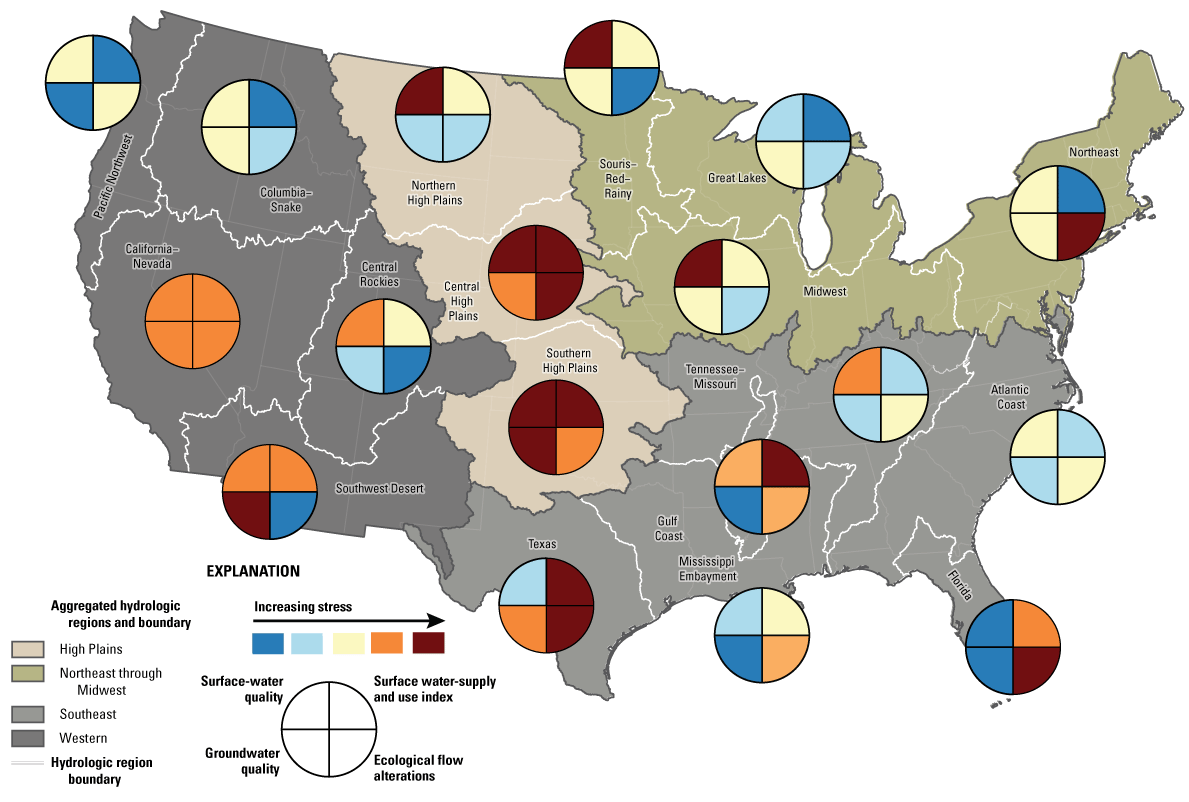
Assessment of relative stress on water availability in four different categories for each hydrologic region in the conterminous United States. Categories include the water stress as supply-demand imbalance (surface water-supply and use index; Stets and others, 2025b); surface-water quality from model estimates of total nitrogen and total phosphorus; groundwater quality from models of nitrate and arsenic (Lombard and others, 2021; Ransom and others, 2022); and percentage of river miles in each region with ecological flow alterations, adapted from Carlisle (2019).
Summary
The U.S. Geological Survey (USGS) is one of several Federal agencies with requirements under the SECURE Water Act to produce assessments of water availability in the United States. The Integrated Water Availability Assessment was developed in response to this mandate. This report is the first comprehensive, national assessment of water availability conducted by the USGS in response to the SECURE Water Act. Preliminary reports were delivered in 2013 and 2018 setting the stage for the development of the tools and models that have been used to create this more integrated assessment. The report has been structured to consider multiple aspects of water availability including water supply, water quality, water use, climatic effects, and the integration of these components into a more comprehensive investigation of water availability. This analysis spans water years 2010–20 and considers water availability on a range of scales from 12-digit hydrologic code (HUC12) catchments to hydrologic regions, aggregated hydrologic regions, and the national scale.
A summary of the key findings and key figures from this report is presented in this chapter. A full water budget for the conterminous United States (CONUS) is shown along with a summary of groundwater levels during water years 2010–20 compared with historical averages. For water quality, an assessment of the degree of water-quality contamination in principal aquifers is shown. A matrix of the percentage of river miles impaired by a suite of contaminants for a variety of beneficial uses is shown. Water use is summarized by major category and the source of water, whether groundwater or surface water, is compared across aggregated hydrologic regions. The summarized climatic impact drivers are presented by climate region. Finally, a description of the integrated assessment of water availability is presented that considers the relative balance of supply and consumptive water use in CONUS. These results are then placed in further context by considering the relative degradation of surface water and groundwater and streamflow alteration in relation to ecological flow needs. The summary information uses key figures from the other chapters of this volume (chapters B–F) to illustrate major findings.
Acknowledgments
The U.S. Geological Survey Water Availability and Use Science Program and the National Water Quality Program support assessments of current and future human and ecosystem water availability and use.
References Cited
Abatzoglou, J.T., 2013, Development of gridded surface meteorological data for ecological applications and modelling: International Journal of Climatology, v. 33, no. 1, p. 121–131, accessed September 21, 2023, at https://doi.org/10.1002/joc.3413.
Alley, W.M., Evenson, E.J., Barber, N.L., Bruce, B.W., Dennehy, K.F., Freeman, M., Freeman, W.O., Fischer, J.M., Hughes, W.B., and Kennen, J., 2013, Progress toward establishing a national assessment of water availability and use: U.S. Geological Survey Circular 1384, 34 p., accessed October 8, 2023, at https://pubs.usgs.gov/circ/1384/.
Alzraiee, A., Niswonger, R., Luukkonen, C., Larsen, J., Martin, D., Herbert, D., Buchwald, C., Dieter, C., Miller, L., Stewart, J., Houston, N., Paulinski, S., and Valseth, K., 2024, Next generation public supply water withdrawal estimation for the conterminous United States using machine learning and operational frameworks: Water Resources Research, v. 60, no. 7, 33 p., accessed July 24, 2024, at https://agupubs.onlinelibrary.wiley.com/doi/abs/10.1029/2023WR036632.
Belitz, K., Fram, M., Lindsey, B.D., Stackelberg, P.E., Bexfield, L.M., Johnson, T.D., Jurgens, B.C., Kingsbury, J.A., McMahon, P.B., and Dubrovsky, N.M., 2022, The quality of groundwater used for public supply in the continental United States—A comprehensive assessment: Environmental Science & Technology—Water, 12 p., accessed April 3, 2023, at https://doi.org/10.1021/acsestwater.2c00390.
Bureau of Reclamation, 2021a, Water reliability in the West—2021 SECURE Water Act report: Bureau of Reclamation Office of Water Resource Planning, 60 p., accessed October 8, 2023, at https://www.usbr.gov/climate/secure/2021secure.html.
Bureau of Reclamation, 2021b, West-wide climate and hydrology assessment: Bureau of Reclamation Office of Water Resource Planning, 423 p., accessed October 8, 2023, at https://www.usbr.gov/climate/secure/docs/2021secure/westwidesecurereport.pdf.
Carlisle, D., Wolock, D., Konrad, C., McCabe, G., Eng, K., Grantham, T., and Mahler, B., 2019, Flow modification in the Nation's streams and rivers: U.S. Geological Survey Circular 1461, 75 p., accessed July 10, 2023, at https://doi.org/10.3133/cir1461.
Eberts, S.M., Wagner, C.R., and Woodside, M.D., 2019, Water priorities for the nation—The U.S. Geological Survey next generation water observing system: U.S. Geological Survey Fact Sheet 2019–3046, 2 p., accessed October 7, 2023, at https://doi.org/10.3133/fs20193046.
Erickson, M.L, Miller, O.L, Cashman, J.J., Degnan, J.R., Reddy, J.E., Martinez, A.J., and Azadpour, E, 2025, Status of water-quality conditions in the United States, 2010–20 (ver. 1.1, February 2025), chap. C of U.S. Geological Survey Integrated Water Availability Assessment—2010–20: U.S. Geological Survey Professional Paper 1894–C, 85 p., https://doi.org/10.3133/pp1894C.
Evenson, E.J., Jones, S.A., Barber, N.L., Barlow, P.M., Blodgett, D.L., Bruce, B.W., Douglas-Mankin, K.R., Farmer, W.H., Fischer, J.M., Hughes, W.B., Kennen, J., Kiang, J.E., Maupin, M.A., Reeves, H.W., Senay, G.B., Stanton, J.S., Wagner, C.R., and Wilson, J.T., 2018, Continuing progress toward a national assessment of water availability and use: U.S. Geological Survey Circular 1440, 64 p., accessed September 22, 2023, at https://doi.org/10.3133/cir1440.
Evenson, E.J., Orndorff, R.C., Blome, C.D., Böhlke, J.K., Hershberger, P.K., Langenheim, V.E., McCabe, G.J., Morlock, S.E., Reeves, H.W., Verdin, J.P., Weyers, H.S., and Wood, T.M., 2013, U.S. Geological Survey water science strategy—Observing, understanding, predicting, and delivering water science to the Nation: U.S. Geological Survey Circular 1383–G, 63 p., accessed February 20, 2023, at https://doi.org/10.3133/cir1383G.
Fall, G., Kitzmiller, D., Pavlovic, S., Zhang, Z., Patrick, N., St. Laurent, M., Trypaluk, C., Wu, W., and Miller, D., 2023, The Office of Water Prediction’s analysis of record for calibration, version 1.1—Dataset description and precipitation evaluation: Journal of the American Water Resources Association, v. 59, no. 6, p. 1246–1272, accessed July 12, 2024, at https://doi.org/10.1111/1752-1688.13143.
Gorski, G., Stets, E., Scholl, M.A., Degnan, J.R., Mullaney, J.R., Galanter, A.E., Martinez, A.J., Padilla, J., LaFontaine, J.H., Corson-Dosch, H.R., and Shapiro, A.M., 2025, Water supply in the conterminous United States, Alaska, Hawaii, and Puerto Rico, water years 2010–20 (ver. 1.1, January 17, 2025), chap. B of U.S. Geological Survey Integrated Water Availability Assessment—2010–20: U.S. Geological Survey Professional Paper 1894–B, 60 p., https://doi.org/10.3133/pp1894B.
Harris, M.A., Diehl, T.H., Gorman-Sanisaca, L.E., Galanter, A.E., Lombard, M.A., Skinner, K.D., Chamberlin, C., McCarthy, B.A., Niswonger, R., Stewart, J.S., and Valseth, Kristen, J., 2024, Automating physics-based models to estimate thermoelectric-power water use: Submitted to Environmental Modelling and Software, accessed December 3, 2024, 64 p., at https://doi.org/10.1016/j.envsoft.2024.106265.
Hersbach, H., Bell, B., Berrisford, P., Hirahara, S., Horányi, A., Muñoz-Sabater, J., Nicolas, J., Peubey, C., Radu, R., Schepers, D., Simmons, A., Soci, C., Abdalla, S., Abellan, X., Balsamo, G., Bechtold, P., Biavati, G., Bidlot, J., Bonavita, M., De Chiara, G., Dahlgren, P., Dee, D., Diamantakis, M., Dragani, R., Flemming, J., Forbes, R., Fuentes, M., Geer, A., Haimberger, L., Healy, S., Hogan, R.J., Hólm, E., Janisková, M., Keeley, S., Laloyaux, P., Lopez, P., Lupu, C., Radnoti, G., de Rosnay, P., Rozum, I., Vamborg, F., Villaume, S., and Thépaut, J.-N., 2020, The ERA5 global reanalysis: Quarterly Journal of the Royal Meteorological Society, v. 146, no. 730, p. 1999–2049, accessed October 2, 2023, at https://rmets.onlinelibrary.wiley.com/doi/abs/10.1002/qj.3803.
Kao, S.-C., Ashfaq, M., Naz, B.S., Uria Martinez, R., Rastogi, D., Mei, R., Jager, Y., Samu, N.M., and Sale, M.J., 2016, The second assessment of the effects of climate change on federal hydropower: Oak Ridge, Tennessee, Oak Ridge National Laboratory, 308 p., accessed September 21, 2023, at https://doi.org/10.2172/1340431.
Kao, S.-C., Ashfaq, M., Rastogi, D., Gangrade, S., Uria Martinez, R., Fernandez, A., Konapala, G., Voisin, N., Zhou, T., Xu, W., Gao, H., Zhao, B., and Zhao, G., 2022, The third assessment of the effects of climate change on Federal hydropower: Oak Ridge, Tennessee, Oak Ridge National Laboratory, 310 p., accessed September 21, 2023, at https://doi.org/10.2172/1887712.
Lombard, M.A., Bryan, M.S., Jones, D.K., Bulka, C., Bradley, P.M., Backer, L.C., Focazio, M.J., Silverman, D.T., Toccalino, P., Argos, M., Gribble, M.O., and Ayotte, J.D., 2021, Machine learning models of arsenic in private wells throughout the conterminous United States as a tool for exposure assessment in human health studies: Environmental Science & Technology, v. 55, no. 8, p. 5012–5023, accessed February 16, 2023, at https://doi.org/10.1021/acs.est.0c05239.
Martin, D.J., Regan, R.S., Haynes, J.V., Read, A.L., Henson, W.R., Stewart, J.S., Brandt, J.T., and Niswonger, R.G., 2023, Irrigation water use reanalysis for the 2000–20 period by HUC12, month, and year for the conterminous United States: U.S. Geological Survey data release, accessed January 15, 2024, at https://doi.org/10.5066/P9YWR0OJ.
Medalie, L., Galanter, A.E., Martinez, A.J., Archer, A.A., Luukkonen, C.L., Harris, M.A., and Haynes, J.V., 2025, Water use across the conterminous United States, water years 2010–20, chap. D of U.S. Geological Survey Integrated Water Availability Assessment—2010–20: U.S. Geological Survey Professional Paper 1894–D, 56 p., https://doi.org/10.3133/pp1894D.
Miller, M.P., Clark, B.R., Eberts, S.M., Lambert, P.M., and Toccalino, P., 2020, Water priorities for the Nation—U.S. Geological Survey Integrated Water Availability Assessments: U.S. Geological Survey Fact Sheet 2020–3044, 2 p., accessed October 8, 2023, at https://pubs.usgs.gov/publication/fs20203044.
Miller, M.P., Eberts, S.M., and Sprague, L.A., 2021, Water priorities for the Nation—USGS Integrated Water Science basins: U.S. Geological Survey Fact Sheet 2021–3041, 2 p., accessed October 8, 2023, at https://doi.org/10.3133/fs20213041.
Miller, M.P., Skalak, K., and Lesmes, D.P., 2022, Water priorities for the Nation—U.S. Geological Survey Integrated Water Prediction science program: U.S. Geological Survey Fact Sheet 2022–3028, 2 p., accessed October 8, 2023, at https://doi.org/10.3133/fs20223028.
Miller, O.L., Martinez, A.J., Cashman, M.J., Powlen, K.A., Padilla, J.A., and Stets, E.G., 2024, Water budget results for a water availability assessment across the conterminous United States for water years 2010–2020: U.S. Geological Survey data release, accessed December 9, 2024, at https://doi.org/10.5066/P1CFYEHO.
Rafieeinasab, A., Dugger, A., Mazrooei, A., Enzminger, T., Srivatava, I., Gochis, D., Sampson, K., Omani, N., Grim, J., Zhang, Y., LaFontaine, J., Viger, R., Liu, Y., and Schneider, T., 2024, A WRF-Hydro-based retrospective simulation of water resources for US integrated water availability assessment: Hydrology and Earth System Sciences Discussions, 37 p., accessed November 15, 2024, at https://doi.org/10.5194/hess-2024-262.
Ransom, K.M., Nolan, B.T., Stackelberg, P.E., Belitz, K., and Fram, M.S., 2022, Machine learning predictions of nitrate in groundwater used for drinking supply in the conterminous United States: Science of the Total Environment, v. 807, 11 p., accessed October 3, 2022, at https://doi.org/10.1016/j.scitotenv.2021.151065.
Rasmussen, R.M., Chen, F., Liu, C.H., Ikeda, K., Prein, A., Kim, J., Schneider, T., Dai, A., Gochis, D., Dugger, A., Zhang, Y., Jaye, A., Dudhia, J., He, C., Harrold, M., Xue, L., Chen, S., Newman, A., Dougherty, E., Abolafia-Rosenzweig, R., Lybarger, N.D., Viger, R., Lesmes, D., Skalak, K., Brakebill, J., Cline, D., Dunne, K., Rasmussen, K., and Miguez-Macho, G., 2023, CONUS404—The NCAR–USGS 4-km long-term regional hydroclimate reanalysis over the CONUS: Bulletin of the American Meteorological Society, v. 104, no. 8, 27 p., accessed September 22, 2023, at https://doi.org/10.1175/BAMS-D-21-0326.1.
Regan, R.S., Markstrom, S.L., Hay, L.E., Viger, R.J., Norton, P.A., Driscoll, J.M., and LaFontaine, J.H., 2018, Description of the national hydrologic model for use with the precipitation-runoff modeling system (prms): U.S. Geological Survey Techniques and Methods, book 6, chap. B9, 38 p., accessed September 21, 2023, at https://doi.org/10.3133/tm6B9.
Sale, M.J., Shih-Chieh, K., Ashfaq, M., Kaiser, D.P., Martinez, R., Webb, C., and Wei, Y., 2012, Assessment of the effects of climate change on federal hydropower: Washington, D.C., Energy Efficiency and Renewable Energy Publication and Product Library, 210 p., accessed September 21, 2023, at https://doi.org/10.2172/1220238.
Scholl, M.A., McCabe, G.J., Olson, C.G., and Powlen, K.A., 2025, Climate change and future water availability in the United States, chap. E of U.S. Geological Survey Integrated Water Availability Assessment—2010–20: U.S. Geological Survey Professional Paper 1894–E, 60 p., https://doi.org/10.3133/pp1894E.
Stets, E., Cashman, M.J., Miller, O.L., and Powlen, K.A., 2025a, Integrated water availability in the conterminous United States, 2010–20, chap. F of U.S. Geological Survey Integrated Water Availability Assessment—2010–20: U.S. Geological Survey Professional Paper 1894–F, 41 p., https://doi.org/10.3133/pp1894F.
Stets, E., M. Cashman, O.L. Miller, K.A. Powlen, A. Martinez, and J. Padilla, 2025b, Local water use and climate effects on water stress over the conterminous U.S. with substantial impacts to fish species of greatest conservation need: ESS Open Archive, accessed January 11, 2025, at https://doi.org/10.22541/essoar.173655431.12049152/v1.
Taylor, K.E., Stouffer, R.J., and Meehl, G.A., 2012, An overview of CMIP5 and the experiment design: Bulletin of the American Meteorological Society, v. 93, no. 4, p. 485–498, accessed July 12, 2024, https://doi.org/10.1175/BAMS-D-11-00094.1.
Thornton, M.M., Shrestha, R., Wei, Y., Thornton, P.E., and Kao, S.C., 2022, Daymet—Daily surface weather data on a 1-km grid for North America, version 4 R1: Oak Ridge National Laboratory Distributed Active Archive Center website, accessed September 2023, at https://doi.org/10.3334/ORNLDAAC/2129.
U.S. Department of Energy, 2022, The effects of climate change on federal hydropower—Third 9505 assessment: U.S. Department of Energy, Office of Energy Efficiency and Renewable Energy, 2 p., accessed July 12, 2024, at https://www.energy.gov/sites/default/files/2023-01/wpto-third-9505-assessment.pdf.
Van Metre, P.C., Qi, S., Deacon, J., Dieter, C., Driscoll, J.M., Fienen, M., Kenney, T., Lambert, P., Lesmes, D., Mason, C.A., Mueller-Solger, A., Musgrove, M., Painter, J., Rosenberry, D., Sprague, L., Tesoriero, A.J., Windham-Myers, L., and Wolock, D., 2020, Prioritizing river basins for intensive monitoring and assessment by the US Geological Survey: Environmental Monitoring and Assessment, v. 192, no. 7, p. 1–17, accessed September 22, 2023, at https://doi.org/10.1007/s10661-020-08403-1.
Conversion Factors
Supplemental Information
A water year is the 12-month period from October 1 through September 30 of the following year and is designated by the calendar year in which it ends.
HUC2, HUC4, HUC6, HUC8, HUC10, HUC12 are hydrologic unit codes (HUCs) with the numbers representing the number of digits in the code. HUCs are an addressing system for identifying catchments in the United States. HUC catchments are nested, with more digits indicating progressively smaller hydrologic units in terms of the area they cover.
Abbreviations
CONUS
conterminous United States of America, excluding Alaska, Hawaii and U.S. territories of Puerto Rico, U.S. Virgin Islands, and U.S. Pacific Islands
CONUS404
4-kilometer resolution, long-term regional hydroclimate simulation over the conterminous United States dataset
DoD
Department of Defense
DOE
Department of Energy
GCM
general circulation model
IWS
Integrated Water Science
MW
megawatt
OCONUS
outside the conterminous United States
PFAS
perfluoroalkyl and polyfluoroalkyl substances
ppm
part per million
regional IWAAs
regional Integrated Water Availability Assessments
RCP
Representative Concentration Pathway (climate change scenario)
SUI
surface water-supply and use index
USGS
U.S. Geological Survey
WRF
Weather Research and Forecasting
WRF-Hydro
Weather Research and Forecasting hydrologic model
For more information concerning the research in this report, contact the
National_IWAAs@usgs, Water Resources Mission Area
U.S. Geological Survey
12201 Sunrise Valley Drive
Reston, Virginia 20192
Manuscript approved on November 27, 2024
Publishing support provided by the U.S. Geological Survey
Science Publishing Network, Tacoma, and Rolla Publishing Service Centers
Edited by John Osias and Vanessa Ball
Illustration by Althea Archer
Design and layout by Guadalupe Stratman
Disclaimers
Any use of trade, firm, or product names is for descriptive purposes only and does not imply endorsement by the U.S. Government.
Although this information product, for the most part, is in the public domain, it also may contain copyrighted materials as noted in the text. Permission to reproduce copyrighted items must be secured from the copyright owner.
Suggested Citation
Stets, E.G., Archer, A.A., Degnan, J.R., Erickson, M.L., Gorski, G., Medalie, L., and Scholl, M.A., 2025, The National integrated water availability assessment, water years 2010–20, chap. A of U.S. Geological Survey Integrated Water Availability Assessment—2010–20: U.S. Geological Survey Professional Paper 1894–A, 24 p., https://doi.org/10.3133/pp1894A.
ISSN: 2330-7102 (online)
Study Area
| Publication type | Report |
|---|---|
| Publication Subtype | USGS Numbered Series |
| Title | The National integrated water availability assessment, water years 2010–20 |
| Series title | Professional Paper |
| Series number | 1894 |
| Chapter | A |
| DOI | 10.3133/pp1894A |
| Publication Date | January 15, 2025 |
| Year Published | 2025 |
| Language | English |
| Publisher | U.S. Geological Survey |
| Publisher location | Reston, VA |
| Contributing office(s) | WMA - Earth System Processes Division |
| Description | vii, 24 p. |
| Country | United States |
| Other Geospatial | conterminous United States |
| Online Only (Y/N) | Y |
| Additional Online Files (Y/N) | N |