

Status of Water-Quality Conditions in the United States, 2010–20
Links
- Document: Report (50 MB pdf) , HTML , XML
- Larger Work: This publication is Chapter C of U.S. Geological Survey Integrated Water Availability Assessment—2010–20
- Additional Report Piece: Interactive maps (html)
- Version History: Version History (3 KB txt)
- NGMDB Index Page: National Geologic Map Database Index Page (html)
- Software Releases:
- USGS software release - Decadal change plots of water-quality constituents
- USGS software release - Water quality across the conterminous United States using SPARROW 2012 simulated nutrient load estimates
- Download citation as: RIS | Dublin Core
Preface
This is one chapter in a multichapter report that assesses water availability in the United States for water years 2010–20. This work was conducted as part of the fulfillment of the mandates of Subtitle F of the Omnibus Public Land Management Act of 2009 (Public Law 111-11), also known as the SECURE Water Act. As such, this work examines the spatial and temporal distribution of water quantity and quality in surface water and groundwater, as related to human and ecosystem needs and as affected by human and natural influences. Chapter A (Stets and others, 2025a) introduces the National Integrated Water Availability Assessment and provides important background and definitions for how the report characterizes water availability and its components. Chapter A also presents the key findings of Chapters B–F and thus acts as a summary of the entire report. Chapter B (Gorski and others, 2025) is a national assessment of water supply, which is the quantity of water supplied through climatic inputs. Chapter C (this report) is a national assessment of water quality, which is the chemical and physical characteristics of water. Chapter D (Medalie and others, 2025) assesses water use including withdrawals and consumptive use in the conterminous United States. Chapter E (Scholl and others, 2025) presents an analysis of factors affecting future water availability under changing climate conditions. The National Integrated Water Availability Assessment culminates with Chapter F (Stets and others, 2025b), which is an integrated assessment of water availability that considers the amount and quality of water coupled with the suitability of that water for specific uses. Together, these six chapters constitute the National Integrated Water Availability Assessment for water years 2010–20.
Abstract
Degradation of water quality can make water harmful or unusable for humans and ecosystems. Although many studies have assessed the effect of individual constituents or narrow suites of constituents on freshwater systems, no consistent, comprehensive assessment exists over the wide range of water-quality effects on water availability. Using published studies, data, and models completed at regional or national scales in the United States during 2010–20, this chapter moves towards a comprehensive assessment by summarizing how selected anthropogenic and geogenic water-quality constituents affect national-scale water availability for human and ecosystem needs. Several types of human health, agricultural, ecological, and beneficial-use standards or thresholds were used to provide context for categorizing surface-water and groundwater quality.
Water availability for human and ecological use is limited by elevated concentrations of geogenic and anthropogenic constituents in surface and groundwater. Elevated concentrations of five geogenic constituents (arsenic, manganese, strontium, radium, and adjusted gross alpha) are common in groundwater and collectively affect the drinking water supply to over 30 million people. Surface water sourced drinking water supplies are impaired in about a third of assessed stream miles, most commonly because of non-mercury metals and salinity. Health-based violations at community water systems may disproportionately affect socially vulnerable communities. Ecological water uses are predominantly limited by nutrients, sediment, temperature, pathogens, salinity, and pesticides.
Water availability for human and ecological use is adversely affected by human activities including human contaminant sources (for example, wastewater, agriculture), processes (for example, dredging, groundwater pumping), or permanent landscape modifications (for example, dams, urbanization). Primary contaminant sources vary spatially and include fertilizer and manure, atmospheric deposition, wastewater treatment plants, urban land, and a range of natural sources. Contaminants of emerging concern, contaminants without regulatory thresholds, and mixtures of geogenic and anthropogenic water contaminants also contribute to ecological degradation and human exposure.
Key Points
Key findings related to groundwater and surface water quality problems that affect water availability include the following:
-
• Drinking-water use is affected by geogenic and anthropogenic contaminants. Elevated concentrations of arsenic, manganese, strontium, radium, adjusted gross alpha, and nitrate are common in drinking water aquifers serving more than 30 million people in the United States.
-
• About one-third of stream miles assessed as surface-water sourced drinking-water supply are impaired with respect to drinking-water use, most commonly because of non-mercury metals and salinity.
-
• Health-based drinking-water violations at public water systems may disproportionately affect socially vulnerable communities. People with domestic wells as their drinking-water source are more prone to exposure to contaminants compared to people served by public water systems.
-
• Ecological water uses are predominantly limited by nutrients, sediment, temperature, pathogens, salinity, and pesticides. Contaminants without or historically without regulatory thresholds (for example, polyfluoroalkyl substances [PFAS]) have been underrepresented in previous assessments and also likely contribute to ecological degradation and human exposure.
-
• Water availability for human and ecological use is limited by elevated constituent concentrations in surface water and groundwater because of human activities. Human activities include sources (for example, inorganic and organic chemicals), processes (for example, dredging), or permanent landscape modifications (for example, dams, urbanization).
-
• Interactions between groundwater and surface water can influence water quality. Surface-water recharge can be a source of contaminants to aquifers, whereas groundwater discharge, with slow transport times, results in long-term, lagged delivery of pollutants to surface waters (especially nitrate, chloride, PFAS, and other constituents).
-
• Little information exists regarding human-health exposure risks from mixtures of geogenic and anthropogenic drinking-water contaminants. Co-occurrence and mixtures of multiple water-quality constituents, taken together, can cause compounding negative effects on water availability but mixtures are rarely measured in standard monitoring protocols.
-
• Alternative water resources could increase water availability by providing additional supply from non-traditional sources such as reclaimed wastewater, brackish and saline water, and produced water from oil and gas development.
Introduction
This chapter summarizes the state of knowledge related to how, where, and why water quality does or may limit water availability for various ecological and human beneficial uses. Water-quality limitations are diverse and can severely affect human health; disrupt trade, economic activity, and infrastructure; and alter local ecosystems, with different water-quality requirements depending on the beneficial use and constituent being considered (table 1). Water quality can be degraded by either anthropogenic or geogenic (natural) sources. Anthropogenic constituents make their way into water supplies through human action, often at or near land surface. Geogenic constituents are chemicals or isotopes that have a geologic or other natural source independent of human activity (for example, weathering, soil leaching, water-rock interaction). Human activity often transports or concentrates natural constituents far greater than their background concentrations such that their presence becomes harmful to humans or ecosystems (Robertson and Saad, 2021; Erickson and others, 2024a). Constituent sources can also be categorized into point-sources (that is, originating from a specific location, like a piped discharge), or nonpoint sources (that is, diffuse across a wide region or land use). Water-quality constituents may share similar sources, transport processes, and mobilization mechanisms (fig. 1). Water-quality problems are present from local to national scales, and local-scale, water-quality problems that make media headlines (sidebar 1) can be indicative of larger-scale water-quality challenges.
Table 1.
Generalized categories of the most common water-quality limitations affecting the availability of water for intended purposes.[Abbreviations: MCL, U.S. Environmental Protection Agency Maximum Contaminant Level (U.S. Environmental Protection Agency, 2018); SMCL, U.S. Environmental Protection Agency Secondary Maximum Contaminant Level (U.S. Environmental Protection Agency, 2018); HBSL, Health-Based Screening Level (Norman and others, 2018); NRCS, Natural Resources Conservation Service Technical Note MT-1 (Natural Resources Conservation Service, 2011); REC, recreational use criteria (U.S. Environmental Protection Agency, 2023a); ECO, U.S. Environmental Protection Agency aquatic life criteria (U.S. Environmental Protection Agency, 2023b)]
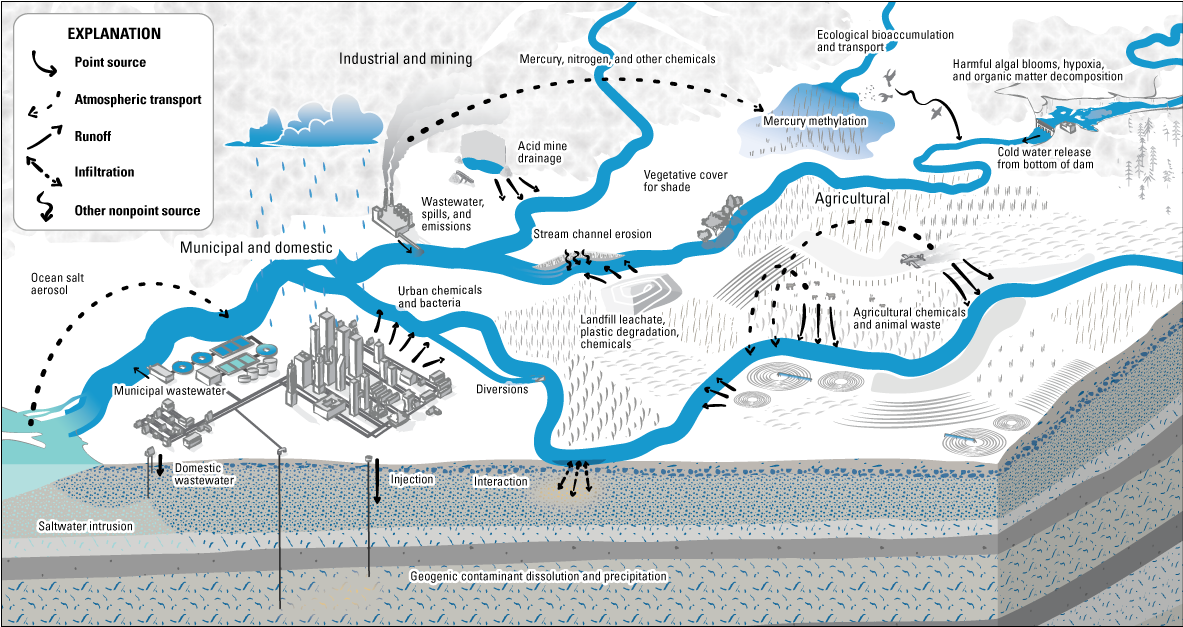
Examples of sources of water-quality contaminants, transport mechanisms, and distribution; and how contaminants can potentially affect water availability. Illustration by Amanda Carr, U.S. Geological Survey.
Sidebar 1. Water Quality Problems from the Headlines
Water-quality problems can become headlines in the news. There are many news examples of water quality limiting water availability, and these are just a few from the past decade:
• Lead contamination due to corrosive water in public water supply in Flint, Michigan (Kennedy, 2016);
• Ice storm and water crisis in Jackson, Mississippi (Marshall and Mozee, 2022);
• Harmful algal blooms, or HABs (fig. S1.1), contaminating surface water at the intake for the Toledo, Ohio, public supply (Chappell, 2014);
• Increasing turbidity threatening the drinking water supply for New York, New York (DePalma, 2006);
• Adverse ecological effects from increasing salinity in the Great Salt Lake, Utah (fig. S1.2; Kintisch, 2022);
• Geogenic and mining-related uranium and arsenic groundwater contamination (figs. S1.3 and S1.5) at the Navajo Nation drinking water supply wells in Arizona, New Mexico, and Utah (Jones and others, 2020a); and
• Drinking water arsenic exposure (figs. S1.4 and S1.5) for agricultural workers in the Central Valley of California (Facio-Krajcer and Cowan, 2022).
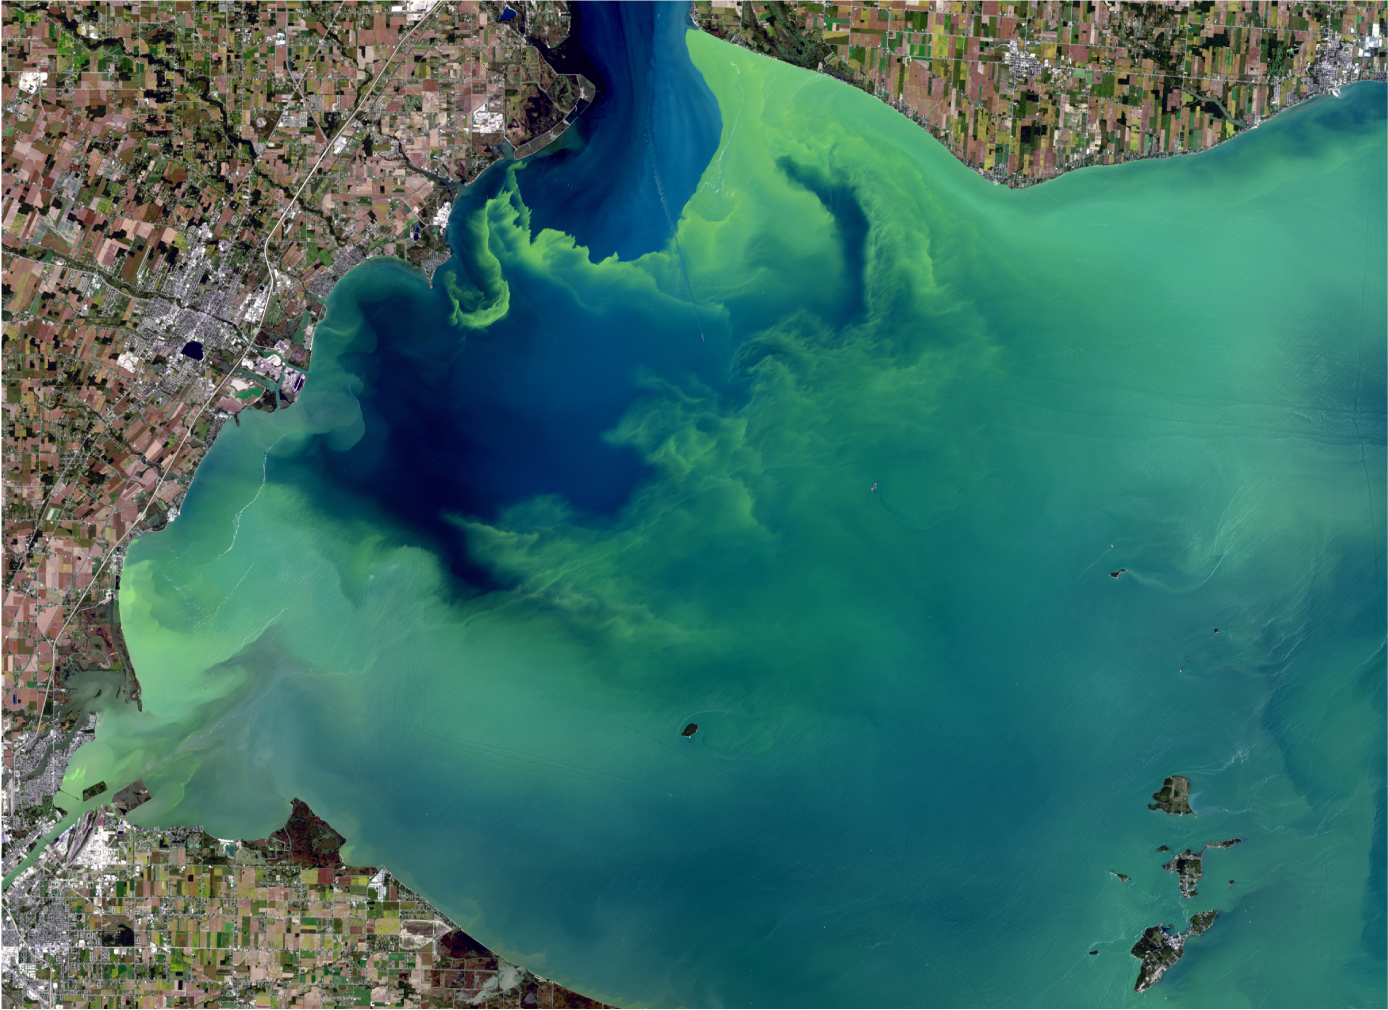
Landsat satellite image of Lake Erie during a harmful algal bloom event. Public domain photograph.
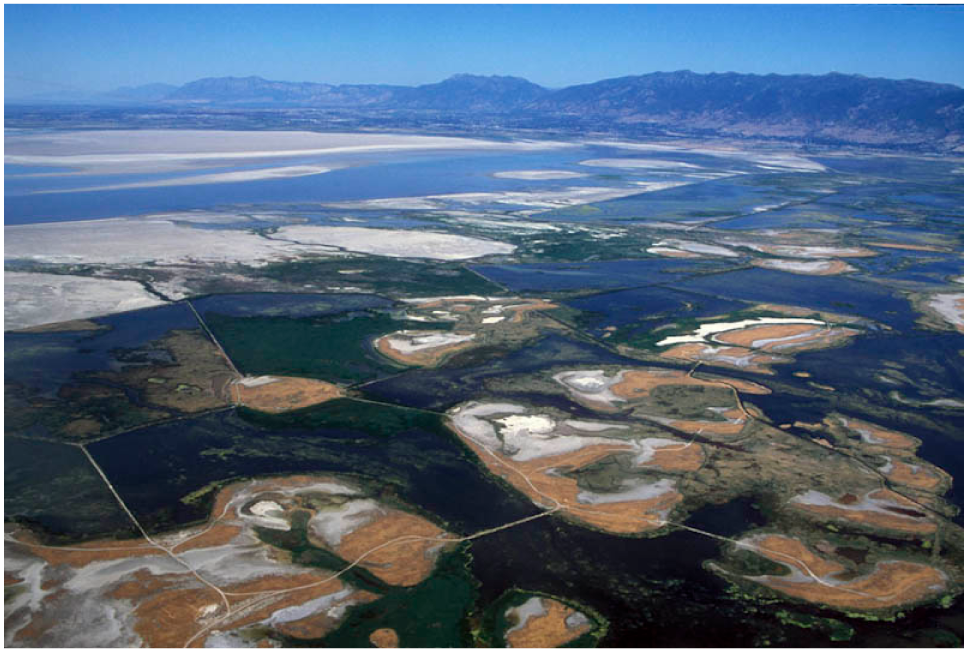
Wetlands along edge of Great Salt Lake, Utah. Photograph by Professor Marli Miller, University of Oregon.
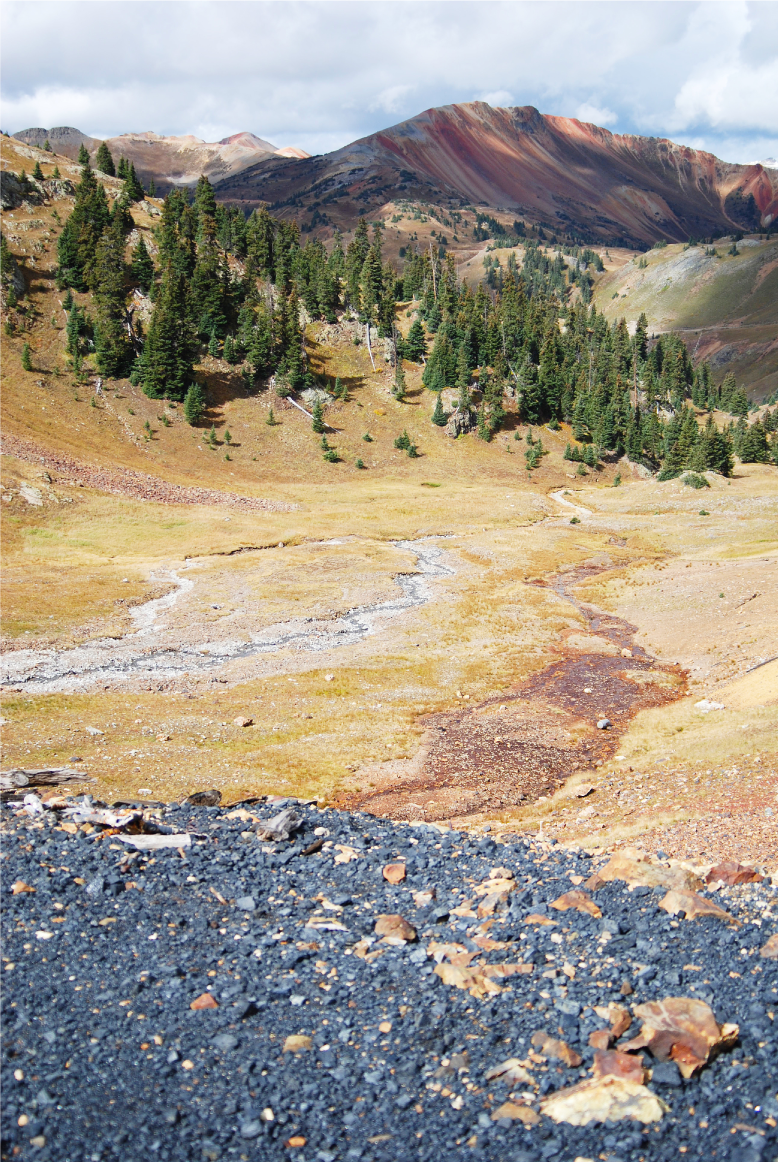
Example of acidic mine drainage. Public domain photograph.
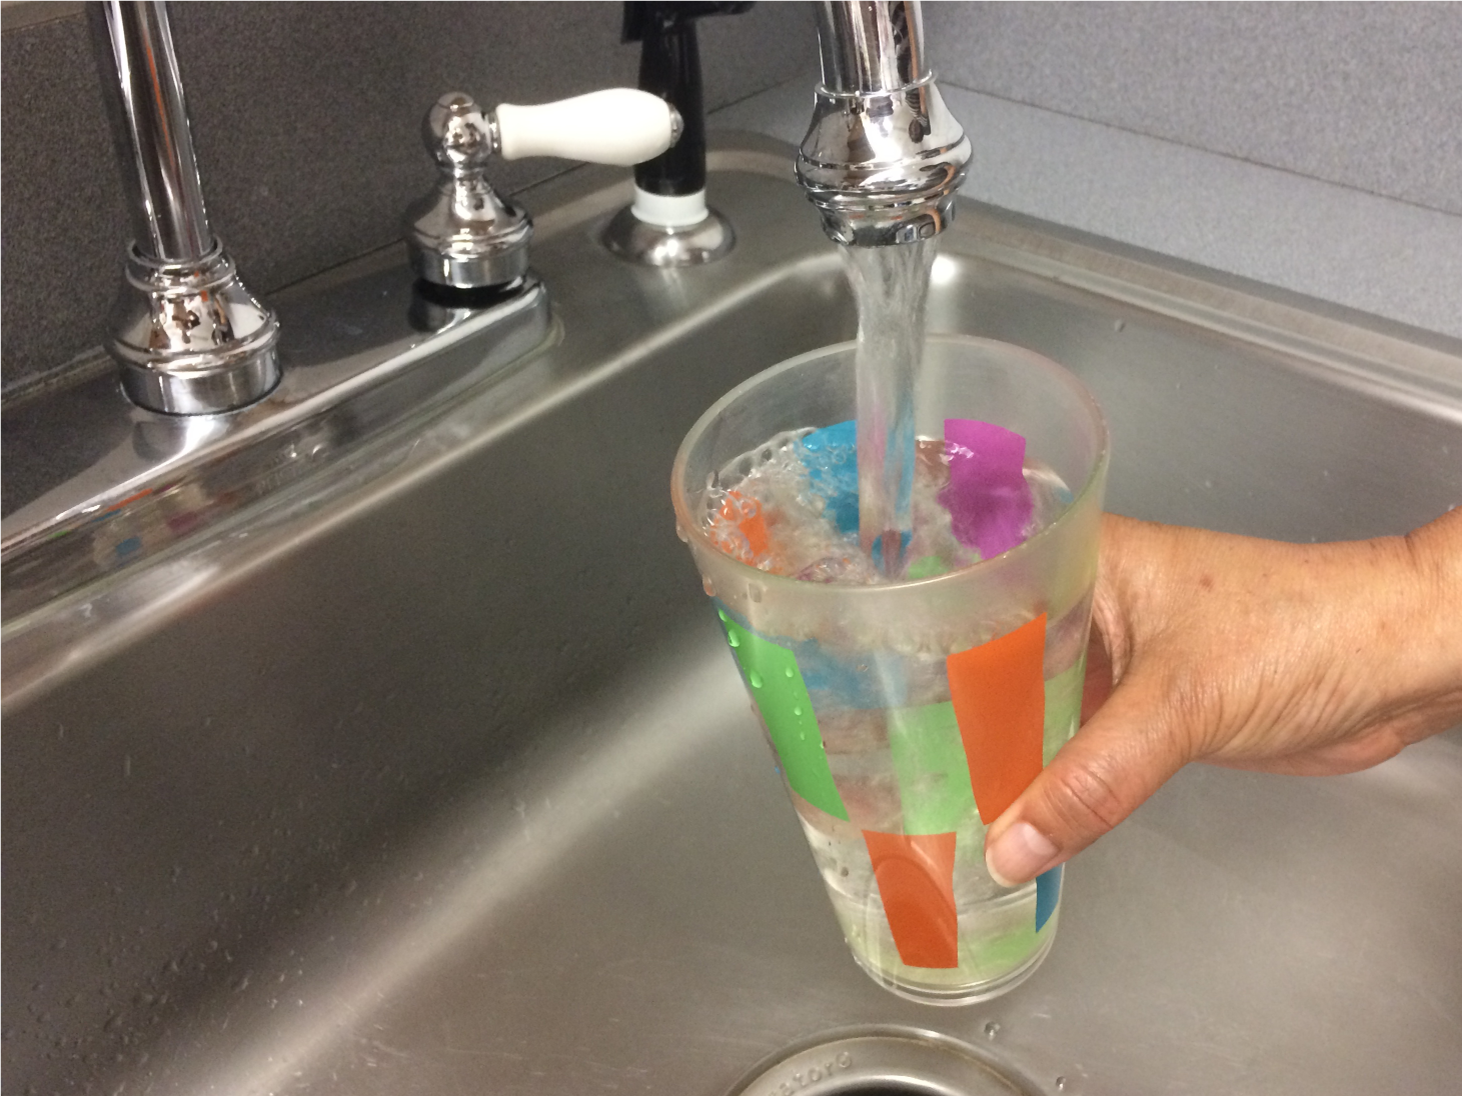
Glass of water being filled from the tap. The quality of the water we drink can affect our health. Public domain photograph.
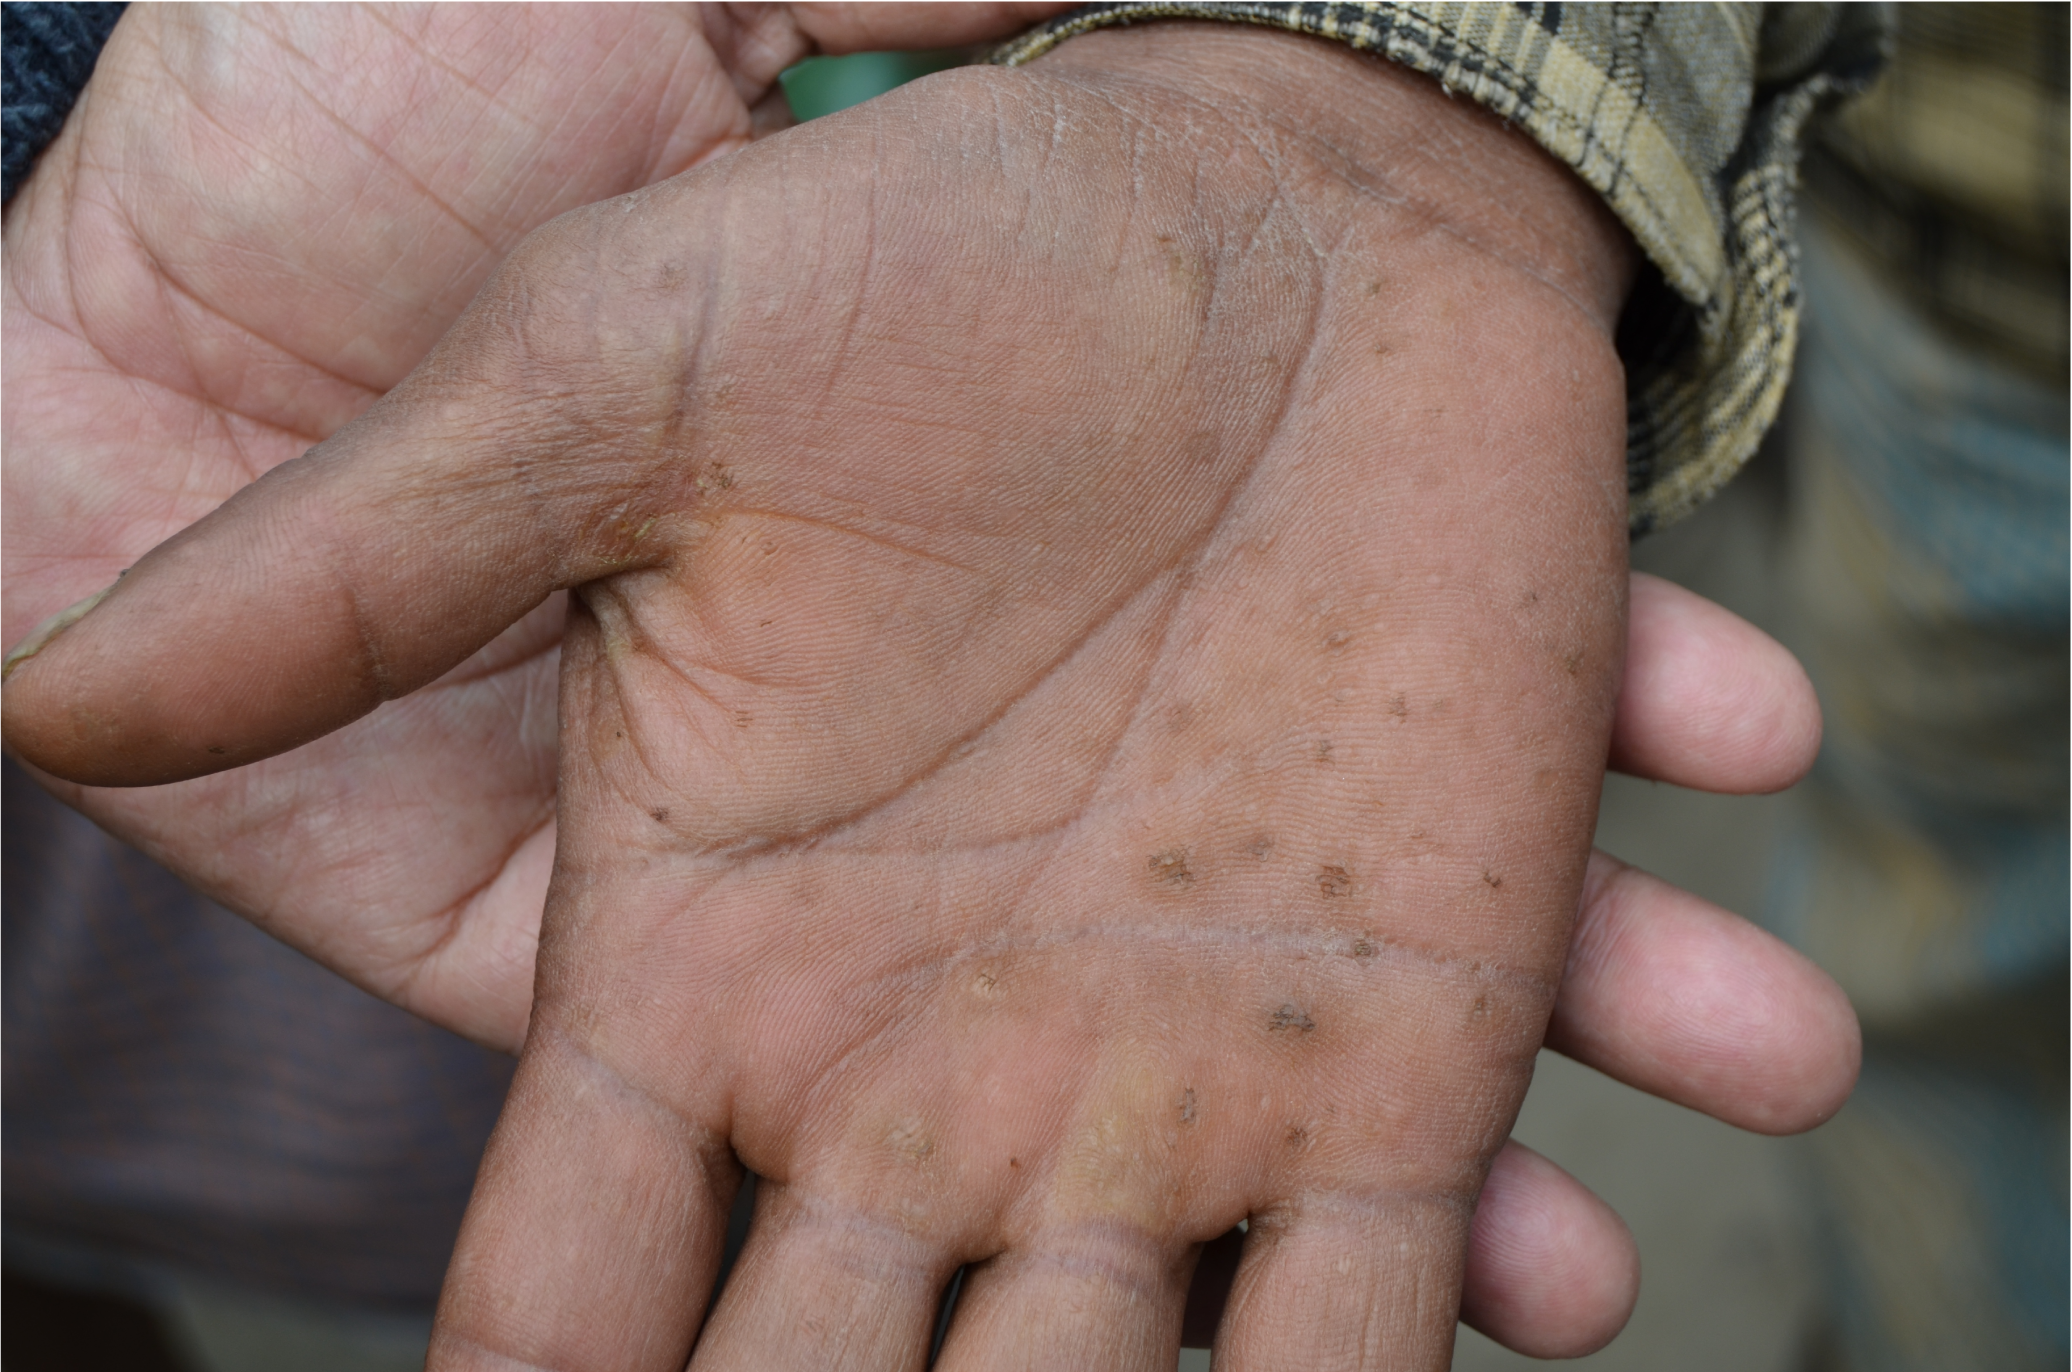
Skin lesions that are characteristic of damage from drinking water arsenic exposure. Photograph by David Funkhouser, Earth Institute of Columbia University.
Table 1 lists some of the most common regulatory, human-health, and aesthetic water-quality limitations affecting human beneficial uses of water. Numerous standards and thresholds apply to human health, other human beneficial uses, ecological needs, and aquatic life.
The objective of this chapter is to summarize how selected water-quality constituents influence water availability for human and ecosystem needs at the national scale by synthesizing information from previous assessments. In this study, we use relevant human-health or ecosystem benchmarks to evaluate if a constituent may limit water availability because of concentration that affects human health, other beneficial use requirements, or ecosystem services. For context, we summarize the major sources, transport processes, and effects on human and ecosystem users related to each constituent. We also discuss knowledge, data, and modeling gaps that limit our ability to consistently assess how water quality influences water availability at the national scale. However, it is beyond the scope of this report to present a detailed explanation of constituent sources and processes, or to evaluate exceedance criteria.
Standards and Thresholds for Assessing Water Availability
The existing regulatory framework, summarized in this section, guides the determination of water availability from a water-quality perspective in this chapter, but important limitations exist within this framework. Single-item thresholds are generally the focus of regulatory criteria, which may underestimate potential negative effects of common constituent and chemical mixtures of two or more contaminants. Criteria that are not regulatory per se also tend to be minimized, leading to gaps in coverage within the framework. For example, many individual jurisdictions have established separate water-quality standards, such as for nutrients, which vary across boundaries, were derived from varying methodologies, or are missing for some jurisdictions. As a result, jurisdictional-specific methods may not be appropriate for consistent regional and national assessments because of inconsistent methods and gaps in coverage (Fanelli and others, 2022). Therefore, this chapter predominantly focuses on nationally or regionally consistent standards for evaluating water quality when available.
Human-Health and Other Beneficial-Use Standards
Several types of human-health, agricultural, or ecological beneficial-use standards or thresholds are routinely used for regulating, assessing, or categorizing surface-water and groundwater quality. The Safe Drinking Water Act (42 U.S.C. §300f et seq. [1974]) requires that the U.S. Environmental Protection Agency (USEPA) set enforceable, regulatory drinking-water standards called Maximum Contaminant Levels (MCLs) on specific chemicals and compounds (Ayotte and others, 2017; U.S. Environmental Protection Agency, 2018). Certain human-health and occurrence criteria must be met for USEPA to regulate a drinking-water contaminant, so only a limited number of constituents have established MCL, and new MCLs are periodically enacted (for example, per- and polyfluoroalkyl substances [PFAS]; U.S. Environmental Protection Agency, 2024d). MCLs are enforced for public water systems (PWSs) whereas private domestic well water remains largely unregulated and untested (Bowen and others, 2019; U.S. Environmental Protection Agency, 2022a). Nevertheless, domestic well water has the same or higher likelihood of contamination as PWS wells (Spaur and others, 2021; Aiken and others, 2023). Because MCLs are established for only a limited number of contaminants, additional non-enforceable aesthetic and human-health drinking-water thresholds are used in this report to provide context for drinking-water quality. Other human-health thresholds include the Health-Based Screening Level (HBSL; Norman and others, 2018); Alternative Maximum Contaminant Level (AMCL; U.S. Environmental Protection Agency, 2018); and Unregulated Contaminant Monitoring Rule (UCMR; U.S. Environmental Protection Agency, 2016a). Other relevant benchmarks include Secondary Maximum Contaminant Level (SMCL; U.S. Environmental Protection Agency, 2018), agriculture-related standards (Natural Resources Conservation Service, 2011), other human-health standards (for example, fish consumption advisories, recreational standards), aquatic-life standards, aesthetic standards, and biological standards (U.S. Environmental Protection Agency, 2023a, 2023b). In this report, a concentration is defined as “high” if it exceeds a human-health drinking-water threshold (selected criteria provided in table 2) or another relevant benchmark. The term “elevated” is used if a concentration exceeds one-half of a threshold.
Table 2.
Regulatory and other human-health benchmarks for drinking-water contaminants most commonly found at high concentrations in groundwater and surface water sources used for drinking water.[“Drinking water only” assumes that 100 percent of exposure to lithium comes from drinking water (Lindsey and others, 2021a). Abbreviations: µg/L, microgram per liter; MCL, Maximum Contaminant Level (U.S. Environmental Protection Agency, 2018); HBSL, Health-Based Screening Level (Norman and others, 2018); UCMR, Unregulated Contaminant Monitoring Rule (U.S. Environmental Protection Agency, 2016a); NA, not available; pCi/L, picocurie per liter; AMCL, Alternative Maximum Contaminant Level (U.S. Environmental Protection Agency, 2018); mg/L, milligras per liter]
Ecological and Aquatic-Life Thresholds
Many water-quality constituents do not have singular, definitive national ecological standards or thresholds, but instead have varying thresholds for different regions of the country, specific taxa, time-windows of exposure, and relative levels of severity. Although many standards are established through controlled laboratory-style experiments (for example, the threshold causing mortality of 50 percent of the population), other thresholds may be established through field-based studies. Thresholds established with field studies may use statistical correlation between the constituent and ecosystem condition, or the range of constituent conditions within an overall region or found within a region’s least disturbed areas, and with presumed, but not directly quantified, ecosystem effects.
Regional thresholds for aquatic life are often used because local ecosystems are broadly adapted to long-term natural water-quality conditions, which naturally vary across the country. Separate regional standards can better capture the relative severity of water-quality disturbance. Additionally, different components of the ecosystem (for example, algae, benthic insects, mussels, fish) and among species (for example, cutthroat trout or blue catfish) can have varying sensitivity to water-quality constituents because of their life history and functional traits and habitat preferences.
Multiple aquatic-life criteria or thresholds can exist according to the time frame of exposure. For example, “Acute” thresholds cover maximum, short-duration exceedances at any point in time— such as during a storm peak—and “Chronic” thresholds are exceedances that typically have lower concentrations than Acute thresholds but are subject to longer durations of exposure. Similarly, upper and lower temperature thresholds have been established for many aquatic organisms at short-term thermal thresholds and longer-term weekly average thresholds, and at varying levels of severity, including lethal and sub-lethal thresholds (for example, for growth or successful spawning; U.S. Environmental Protection Agency, 2020a).
The USEPA National Rivers and Streams Assessment has also created multiple non-regulatory quality-graded thresholds for several water-quality constituents across the conterminous United States (CONUS; U.S. Environmental Protection Agency, 2020a; table 3). Qualitative regional thresholds designating “Good,” “Fair,” and “Poor” conditions were created for acidification (that is, pH), total nitrogen, total phosphorus, salinity, and excess streambed sediment (that is, a surrogate for sediment conditions) based on the range of field-based monitoring data at least-disturbed watersheds in that region.
Table 3.
Threshold categories from assessment results from the National Rivers and Streams Assessment 2013–14 (U.S. Environmental Protection Agency, 2020a).[Fair designations occupy the range of values between the Good and Poor thresholds. Abbreviations and symbols: µg/L, microgram per liter; µS/cm, microsiemens per centimeter at 25 degrees Celsius; ≤, less than or equal to; ≥, greater than or equal to]
Although aquatic-life thresholds are typically developed from the effect of a single water-quality constituent in isolation, water-quality constituents occur in combinations in the environment, sometimes referred to as “stressor mixtures.” Further discussion of the effect of multiple stressors, stressor interactions, and issues with causally attributing ecological degradation to a single constituent is presented in the section “Multiple Stressors, Contaminant Mixtures.”
National Standards Not Established
Not all water-quality constituents have established formal national standards, even if the constituent has the potential to limit water availability for various beneficial uses. For example, although some aquatic-life, water-temperature thresholds are provided by USEPA for a limited number of species, numerous other water-temperature thresholds and preference classes have been compiled in the scientific literature for a range of other species (Comte and Olden, 2017; Welch and Jager, 2022), but have not been formally adopted by regulatory agencies. Additionally, many organic contaminants of emerging concern (CECs) and their degradates have not been formally evaluated for regulatory ecological life thresholds, despite field assessments detecting statistical effects of these contaminants on ecological condition (Mahler and others, 2021; Waite and others, 2021).
In the absence of standards for stressors or mixtures, certain tools can be used to help assess water quality. For example, when a poor ecological condition is identified in jurisdictional-level monitoring programs, jurisdictions are recommended to undergo a stressor identification process, such as the USEPA’s Causal Analysis/Diagnosis Information System (CADDIS; Norton and others, 2009). This process can be used to help identify the water-quality constituent that is likely degrading ecological communities and to include that constituent in a regulatory impairment listing.
Sources of Data
This chapter describes the status of water quality based on a literature review of national and regional water-quality monitoring and modeling studies completed primarily by the U.S. Geological Survey (USGS) from 2010 to 2020. For some constituents (for example, mercury, PFAS), monitoring results are presented that fall outside the assessment time frame because national or regional studies do not exist within that period. Additional references are provided throughout the chapter for other data sources, relevant regional or local studies or models, and specific interpretive publications or models based on the described assessments and models. Published data are used to create summary figures and tables presented in this chapter and in a linked, interactive online data visualization resource. We do not explicitly consider temporal trends in water quality. Surface-water results are presented by constituent group type, with the most common, pervasive, widely studied, and modeled constituents presented first. Groundwater results are grouped as geogenic and anthropogenic contaminants.
Monitoring Studies for National and Regional Water-Quality Assessment
In this chapter, we synthesize results from several recent (2010–20), national-scale, water-quality monitoring assessments completed by USGS to gain insight into the nature and geographic distribution of water-quality limitations to water availability in CONUS. Results include summaries of USGS National Water Quality Assessment (NAWQA) Cycle 3 surface-water-quality and groundwater-quality results along with other relevant published water-quality studies. NAWQA began in 1991, and the NAWQA framework and science plan for the third decade (Cycle 3) was developed with a focus on assessing status and trends of freshwater quality, and how human activities affect water quality (Rowe and others, 2010; National Research Council, 2012; Rowe and others, 2013). A national-scale USGS assessment of brackish groundwater resources is also presented (Stanton and others, 2017).
Results are also included for aquatic ecosystem health metrics from the USGS Regional Stream Quality Assessments, a part of NAWQA involving sampling of wadable streams in selected regions to assess water quality and characterization of the relation between multiple water-quality stressors and aquatic life. Results are also included for the USEPA National Rivers and Streams Assessment (NRSA; U.S. Environmental Protection Agency, 2009, 2016b, 2020a, 2020b), a national, probabilistic, collaborative stream survey to monitor the ecological condition and stressors affecting the Nation’s rivers and streams (see sidebar 2).
Sidebar 2. The U.S. Environmental Protection Agency (USEPA) National Rivers and Streams Assessment
The National Rivers and Streams Assessment (NRSA) is a national probabilistic field survey collaboratively conducted between the USEPA, States, and Tribes to assess the conditions of the Nation’s rivers and streams and the major instream stressors affecting them. In contrast to the USEPA Assessment and Total Maximum Daily Load Tracking and Implementation System (ATTAINS) database, which is part of the regulatory listing and tracking process at a jurisdiction-by-jurisdiction scale, the NRSA objectives are explicitly non-regulatory, and are meant to evaluate aquatic conditions using standardized and consistent methods across the country. The goal of NRSA is not only to evaluate a current snapshot of status, but also to track changes through time and evaluate the extent of problematic stressors’ relative risk to biological communities. NRSA replaced the previous USEPA Wadable Streams Assessment, formally began during 2008–09, and was repeated in 5-year cycles during 2013–14 and 2018–19.
Through this field-based monitoring campaign, NRSA was used to evaluate the condition of various biological, chemical, physical, and human-health indicators. Biological conditions included sub-measures of the fish community, benthic macroinvertebrates, periphyton, and algae (examples illustrated in fig. S2.1). Water quality included concentrations of nutrients (that is, total nitrogen and phosphorus), salinity, and acidification (pH). Physical-habitat indicators included streambed-sediment condition, instream fish habitat, riparian vegetative cover, and riparian disturbance. Human-health indicators included enterococci as a fecal indicator, mercury in fish tissue, and algal toxins.
Instream conditions were categorized on a relative scale (for example, “Good,” “Fair,” and “Poor”) based on NRSA-derived “least-disturbed” regional benchmarks, existing USEPA-derived nationally consistent benchmarks, and nationally consistent literature-based benchmarks. The probabilistic design was then able to estimate the percentage of the country’s river and stream miles in each condition score. The vulnerability of ecosystems to each stressor across the country was then assessed through a vulnerability framework of relative sensitivity and exposure. Sensitivity was evaluated for each stressor by quantifying the increased likelihood that ecosystems were in a degraded state when the stressor was degraded. Exposure was then evaluated against the prevalence for degraded stressor conditions across the country. Together, vulnerability is the combined score of the likelihood of a stressor to cause ecological degradation weighted by the prevalence of degraded stressor conditions across the country.
These data not only provide the backbone for NRSA reports of condition (U.S. Environmental Protection Agency, 2023e) and associated scholarly publications (Wathen and others, 2015; Batt and others, 2016; Kaufmann and others, 2022a, 2022b; Keely and others, 2022), but have been used for a series of other national-scale evaluations (Hill and others, 2017, 2023; McManamay and DeRolph, 2019) and have been combined with USGS monitoring data for additional insights (Carlisle and others, 2017, 2022; Schmidt and others, 2019).
The probabilistic approach of NRSA can be contrasted with targeted USGS monitoring: the probabilistic spatial representativeness under spring and summer low-flow conditions against the targeted monitoring coverage of temporally changing through seasons and streamflow conditions (Sprague and others, 2019).
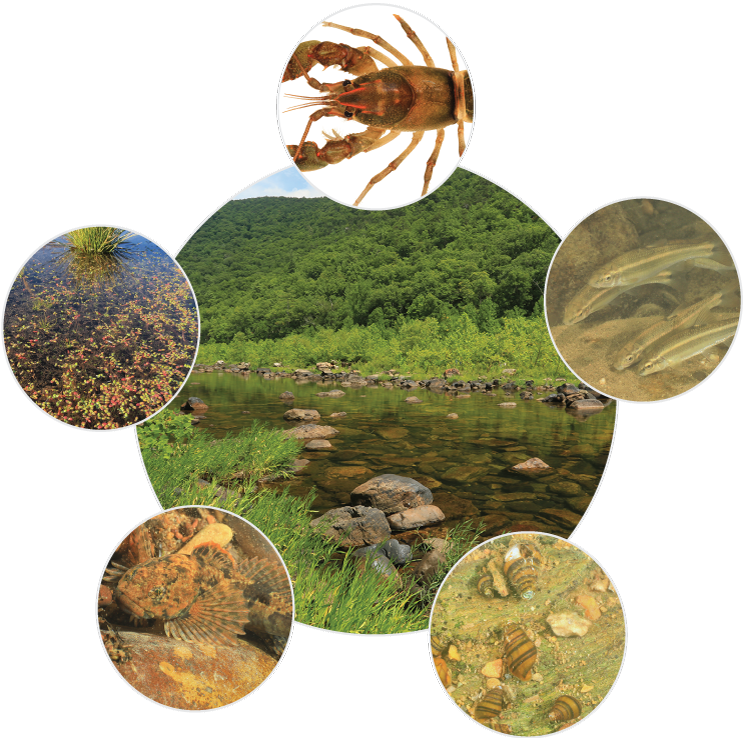
Photographs (clockwise starting at top followed by center photograph) showing a crayfish (family Cambaridae), a largescale stoneroller fish (Campostoma oligolepis), freshwater snails, a banded sculpin fish (Cottus carolinae), and hedgehyssop plant (Gratiola amphiantha), with center photograph of the Maury River at Goshen Pass in Rockbridge County, Virginia. Photographs by Alan Cressler, U.S. Geological Survey.
This report also presents information summarized from the current reporting-cycle data contained in the USEPA Assessment and Total Maximum Daily Load Tracking and Implementation System (ATTAINS; U.S. Environmental Protection Agency, 2023c), the database for regulatory assessments and beneficial-use impairments by States and jurisdictions for compliance with sections 303(d)/305(b) of the Clean Water Act. In this chapter, we examined all data contained in the ATTAINS database of rivers, streams, and flowing waters (linear assessment features) that have been assessed, reported in miles, and listed for “non-supporting” a beneficial use. We extracted all water-quality constituent groupings discussed in this report and examined their relative percentage as the cause of non-supported beneficial uses by river mile across the country. These water-quality constituents may be contained in lists of either Clean Water Act sections 305(b) or 303(d). Although attributing a use impairment to specific water-quality constituents in ATTAINS can vary based on methodological differences from jurisdiction to jurisdiction (Fanelli and others, 2022), this national-scale analysis provides a broad overview of which water-quality issues local jurisdictions believe are affecting beneficial uses and are subsequently regulating.
Modeling Studies for National and Regional Water-Quality Assessments
We also summarize results from several recent (2010–20) national-scale, water-quality modeling studies to gain insight into the nature and geographic distribution of water-quality limitations to water availability in CONUS. Although large regional or national-scale modeling studies are less common than monitoring studies and exist for fewer constituents, modeling studies can provide consistent information about a constituent across CONUS for unmonitored areas and, therefore, support more comprehensive assessments of water availability. Several models have been produced by USGS to provide spatially continuous assessments of estimated water-quality conditions across the country to help inform water-availability assessments.
We primarily focus on assessments of national surface-water quality from a hybrid statistical and process-based model called SPAtially Referenced Regressions On Watershed attributes (SPARROW; Schwarz and others, 2006). SPARROW is a model that has been used to quantify the sources and transport of contaminants in watersheds of widely varying sizes, from catchment to continental scales. SPARROW includes three major process components that explain spatial variability in stream water quality or quantity: (1) contaminant or water sources, (2) land-to-water delivery, and (3) stream and reservoir transport and decay. SPARROW establishes a mathematical relation between water-quality measurements made at a network of monitoring stations and attributes of the watersheds containing the stations. These relations are then used to track and predict water-quality constituent loads, concentrations, and the contributions from each source for all stream reaches across a study area. SPARROW models with large regional or national coverage have only been developed for a limited number of constituents, and results are presented where available. Process-based models, such as the Soil and Water Assessment Tool (SWAT), have also been routinely used at a range of watershed scales to evaluate the transport and routing for water-quality constituents, as well as to evaluate scenarios such as climate change, land use change, and watershed-management-scenario testing (Arnold and others, 2010; Wang and others, 2019). SWAT was not given a focus in this assessment because of a relative lack of national-scale modeling efforts. We also discuss other modeling approaches, including machine-learning, tree-based methods such as boosted regression trees and random forest (Cutler and others, 2007; Elith and others, 2008; Kuhn and Johnson, 2013), which have been implemented for some regional and national studies for select constituents. Recent advancements in machine-learning models—including machine-learning models that are spatially aware of the river network (Topp and others, 2023) and deep-learning models that can be pre-trained on traditional process models (Read and others, 2019)—have been developed for select regions but are not yet available nationally.
In addition to sampling results, groundwater quality for some constituents is assessed using results from several national-scale and regional-scale, machine-learning groundwater-quality models. Machine-learning-ensemble tree methods—such as boosted regression trees and random forest (Cutler and others, 2007; Elith and others, 2008), which combine many simple models—improve prediction accuracy compared with more traditional statistical methods (Hastie and others, 2009). The models are built by using measured constituent concentration or categories of greater than or less than a threshold in wells, and spatial predictor variables representing well characteristics, hydrologic conditions, geology, land use, climate, or other relevant factors. Output results from other empirical or numerical process-based models can also be used as predictor variables. Model predictions can be presented in terms of concentrations or likelihoods of threshold exceedance across the spatial extent of the study area at depths relevant to drinking-water supplies or stream-aquifer interaction contributing to base flow.
Challenges to National-Scale Assessment and Water-Quality Modeling
Assessing water-quality effects on water availability requires sufficient representative data in space and time, relevant water quality criteria for appropriate uses, and ideally modeling approaches that allow for assessments at unmonitored locations. The degree to which each of these requirements is met for each constituent varies greatly, which results in variability in the extent to which we can consistently assess how water quality affects water availability. Here we summarize the high-level challenges associated with water-quality criteria, data, and models for water availability assessments. Table 4 provides a high-level, national-scale summary of the availability of water-quality information.
Table 4.
Summary of water quality information availability assessment results.[National-scale modeling gaps identified: Detailed national, regional, and local scale modeling gaps and needs are summarized in Harvey and others (2024) and Tesoriero and others (2024a). National or regional standards, guidance, or thresholds: MCL, U.S. Environmental Protection Agency Maximum Contaminant Level (U.S. Environmental Protection Agency, 2018); SMCL, U.S. Environmental Protection Agency Secondary Maximum Contaminant Level (U.S. Environmental Protection Agency, 2018); HBSL, Health-Based Screening Level (Norman and others, 2018); USEPA proposed, U.S. Environmental Protection Agency proposed regulation for per- and polyfluronalkyl substances (U.S. Environmental Protection Agency, 2023); USEPA advisory, U.S. Environmental Protection Agency drinking water health advisory for cylindrospermopsin and microsystins (U.S. Environmental Protection Agency, 2015); USDA NRCS, U.S. Department of Agriculture Natural Resources Conservation Service Technical Note MT-1 (Natural Resources Conservation Service, 2011); REC, recreational water use (U.S. Environmental Protection Agency, 2023a); NRSA, National Rivers and Streams Assessment (U.S. Environmental Protection Agency, 2020a, b); ALC, Aquatic Life Criteria (U.S. Environmental Protection Agency, 2023b); ALB, Aquatic Life Benchmarks and Ecological Risk Assessments for Registered Pesticides (U.S. Environmental Protection Agency, 2023d); NA, not applicable. National-scale modeling status: SPARROW, SPAtially Referenced Regressions On Watershed; *, no national-scale model currently in development by the U.S. Geological Survey.]
Major challenges that limit nationally consistent assessments of water-quality effects on water availability include the inconsistencies among criteria for constituents and affected uses. Criteria can differ based on individual constituents and for different beneficial uses based on metrics of interest (for example, maximum, mean, and minimum), time frame of exposure (for example, annual, seasonal, daily, hourly, or cumulative over a threshold), and even which observations are most relevant (for example, dissolved versus particulate). Different standards and criteria are also based on varying levels of evidence; some thresholds are established by rigorous laboratory toxicity experiments, whereas others are based on correlative field-based studies that may be confounded by unknown factors. Constituents with multiple analytes, such as pesticides, may not have criteria for each analyte, and even as new criteria are developed, novel compounds with new effects continue to be created and used in the environment.
National-scale assessments and models require data produced with consistent collection and measurement methods. Major challenges associated with obtaining representative data for national-scale assessments of water quality include (1) a lack of consistent, comprehensive, representative spatial and temporal data; (2) adequate data at time steps appropriate for evaluation of acute exceedances; (3) inconsistent or improper monitoring methods; (4) methodological discrepancies between sampling and relevant criteria; (5) variations in detection limits; and (6) sampling and analytical costs and complexities. The temporal resolution of monitoring data available may limit the ability to detect short-term “acute” water-quality exceedances (Moore and others, 2020), or the full range of constituents that may be sporadically applied and transported from the landscape (Van Metre and others, 2017). For some constituents (for example, pesticides), there may be hundreds of potential analytes, which may have variable amounts of data.
Water-quality models can provide information about conditions at unmonitored locations and can be used to make near-term forecasts or long-term projections under changing climatic, land-cover, or water-management conditions, as well as information about the various sources and processes that control a constituent. Although it is possible to assess water-quality effects on water availability using data alone, models can extend and refine the spatial and temporal scales at which assessments can be done. However, developing and applying accurate, nationally consistent water-quality models is challenging because of the data limitations described earlier in this section. Additionally, models may not be developed to correspond to the appropriate criteria or constituent, or temporal or spatial resolution, because of limitations in the data needed to accurately capture the factors driving constituent behavior in the environment. The temporal resolution of modeling output (for example, mean annual, seasonal, or monthly) may omit other important short-term effects on water availability. Moreover, source- and process-level understanding are often inadequate to be able to develop predictive models for some constituents.
Two recent reports described some of the most important scientific gaps that limit the ability to predict water-quality effects on water availability for beneficial use and ecosystem health across the United States (Harvey and others, 2024; Tesoriero and others, 2024a). These reports also outlined research that could fill crucial water-quality knowledge gaps, and related work prioritized geographic areas for research specific to answering water-quality questions about selected high-priority, water-quality constituents (sidebar 3).
Sidebar 3. Ranking Results for Water-Quality Gaps
Current USGS water-availability research efforts include regional and national integrated-water-availability assessments in coordination with relatively intensive investigations in selected river basins within the conterminous United States (CONUS). Basins were selected through a quantitative prioritization scheme (Van Metre and others, 2020). The framework for the river basin prioritization scheme consisted of 163 candidate basins distributed among 18 hydrologic regions. Candidate basins were ranked within each region primarily based on anthropogenic surface-water, resource-quantity stressors (Van Metre and others, 2020). The Van Metre and others (2020) basin prioritization scheme focused on water quantity, so it included limited consideration of water quality and did not consider societal factors. Recent work, shown graphically in figure S3.1, developed CONUS-scale watershed ranking considering four water-quality constituent groups (nutrients, salinity, geogenic constituents, and temperature) and societal factors. A high rank indicates that a basin is identified as a high priority for research (Erickson and others, 2024b; Tesoriero and others, 2024b; Conaway and others, 2025; Naranjo and others, in press.). These water-quality rankings can be used to inform water-quality research needs in selected intensive study basins, prioritize selection of constituents for water quality monitoring, and incorporate societal factors into decision-making. For example, several basins in the Midwest rank as high research priority for most or all of the considered constituent groups; basins in the Pacific Northwest rank as high-priority when considering geogenic constituents (but rank lower when considering other constituents). Ranking results can also alert communities to potential unrecognized threats to local or regional water availability owing to specific water-quality issues or societal factors.
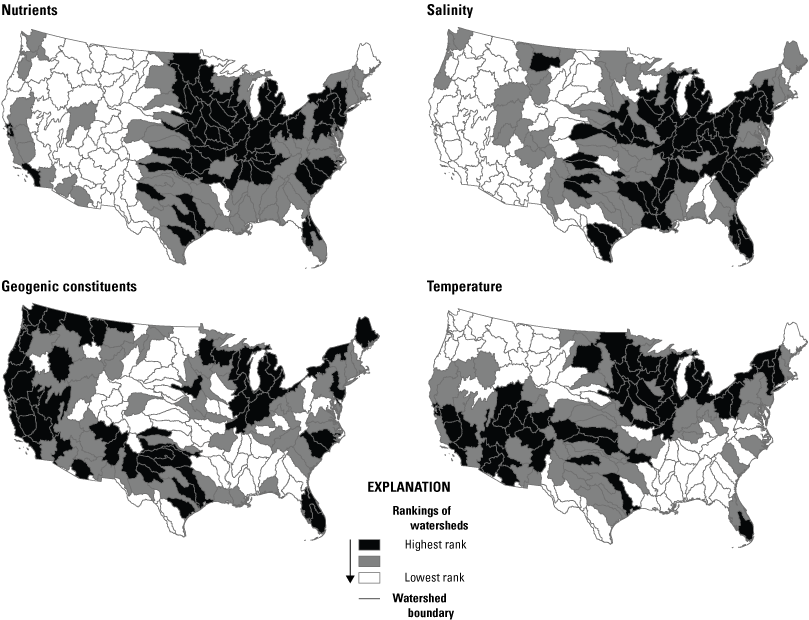
Conterminous United States showing rankings of watersheds (demarcated by gray lines) from highest to lowest considering four water-quality constituent groups and societal factors—(A) nutrients, (B) salinity, (C) geogenic constituents, and (D) temperature.
Quality of Surface-Water Resources
Surface water is the drinking-water source for about two-thirds of the Nation’s population and the fundamental control of aquatic ecosystem conditions. Based on USEPA ATTAINS data as shown in figure 2 and table 5 (U.S. Environmental Protection Agency, 2023c), different water-quality problems affect different uses of water. About one-third of the 365,000 stream miles assessed for drinking-water supply do not support drinking-water use, most commonly because of non-mercury metals, salinity, sediment, temperature, and pathogens. About one-half of the 1.2 million stream miles assessed for support of ecosystems do not support ecological use because of impairments from temperature, pathogens, sediment, metals, low oxygen, or nutrients. About one-third of the 345,000 stream miles assessed for fish consumption do not support that use because of concentrations of polychlorinated biphenyls (PCBs), mercury, or pathogens. About one-third of the 690,000 stream miles assessed for support of recreational use (for example, swimming) are impaired primarily because of the presence of pathogens or nutrients. Water-quality conditions and assessment limitations with respect to individual constituents (especially those without regulatory benchmarks such as pesticides) are described in this section.
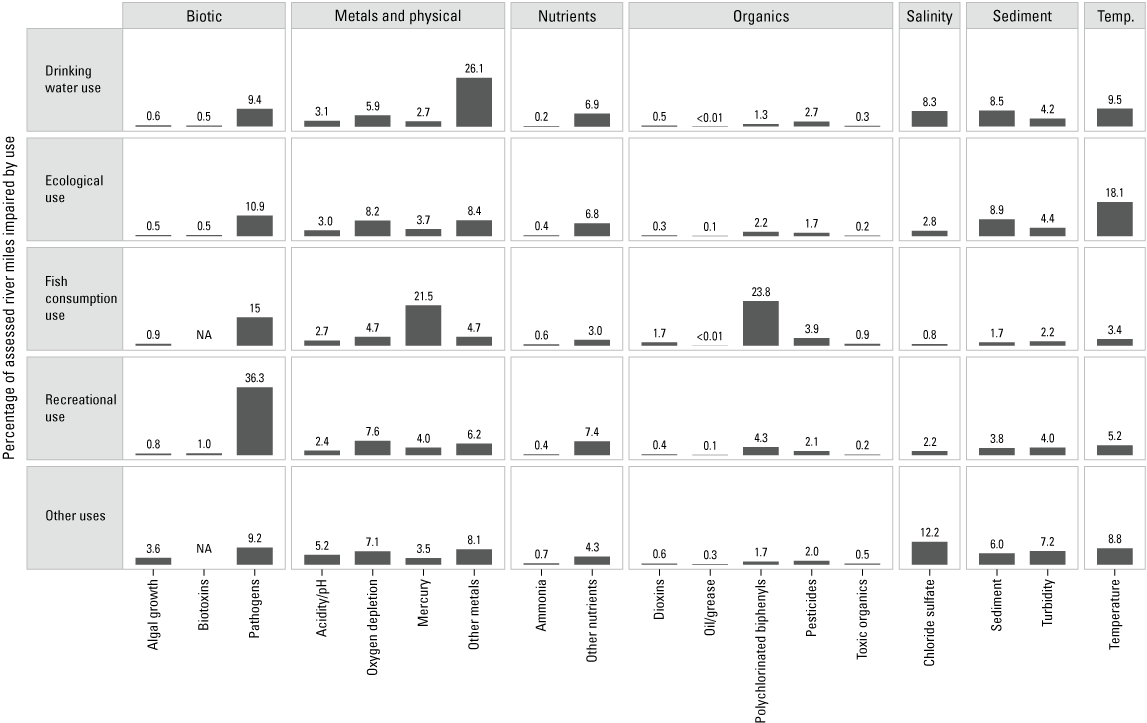
Select surface-water-quality parameters that have been identified as a cause of impaired water availability, disaggregated by selected beneficial use of water categories, for the conterminous United States. Y-axis shows the percentage of all assessed and impaired miles for a surface-water beneficial use, identified to be caused by an individual water-quality parameter. All data were obtained from the U.S. Environmental Protection Agency (USEPA) Assessment, Total Maximum Daily Load (TMDL) Tracking and Implementation System (ATTAINS) database (U.S. Environmental Protection Agency, 2023c). Temp., temperature; NA, no limitation reported; <, less than.
Table 5.
Summary of stream miles assessed for selected water-use categories and status of whether use is supported given existing conditions determined by water use status.Nutrients
Nutrient effects on water availability for human and ecological users are widespread and can be substantial. Excessive nutrients commonly occur in surface water (Shoda and others, 2019) and can limit water availability for ecological needs, human recreation, and drinking-water beneficial uses (fig. 2). A national analysis of water-quality monitoring stations by Shoda and others (2019) indicated that, during 2002–12, nutrients were more likely to exceed ecosystem benchmarks than human drinking-water benchmarks. Their study reported that, for total nitrogen and total phosphorus concentrations, only 17 and 14 percent (out of 267 and 357 sites, respectively), were less than the USEPA ecoregional nutrient criteria. In comparison, most sites (99 percent of 386 sites) had nitrate concentrations less than the drinking-water MCL, and all sites (100 percent of 234 sites) had ammonia concentrations less than the Drinking Water Advisory Table Taste Threshold. Other assessments of nutrient pollution limiting water availability were generally limited in time but covered CONUS. The USEPA NRSA study for 2013–14 reported that 58 percent of river and stream miles were rated poor because of elevated total phosphorus concentrations relative to the least-disturbed sites, and 43 percent of river and stream miles were rated poor because of elevated total nitrogen concentrations relative to the least-disturbed reference benchmark. The number of sites during 2013–14 with poor water quality was higher for both constituents than in the USEPA NRSA study conducted for 2008–09 (U.S. Environmental Protection Agency, 2020a). According to the USEPA ATTAINS database, less than (<) 10 percent of river miles impaired for drinking water, ecological uses, fish consumption, recreational uses, or other uses are attributable to nutrients other than ammonia (fig. 2; U.S. Environmental Protection Agency, 2023c).
Spatially explicit modeling studies (SPARROW) indicate that nutrient (total nitrogen and total phosphorus) yields and mean-annual flow-weighted concentrations (fig. 3) are generally highest in the Midwest region and parts of the East and West Coasts (Ator, 2019; Hoos and Roland, 2019; Robertson and Saad, 2019; Wise, 2019; Wise and others, 2019).
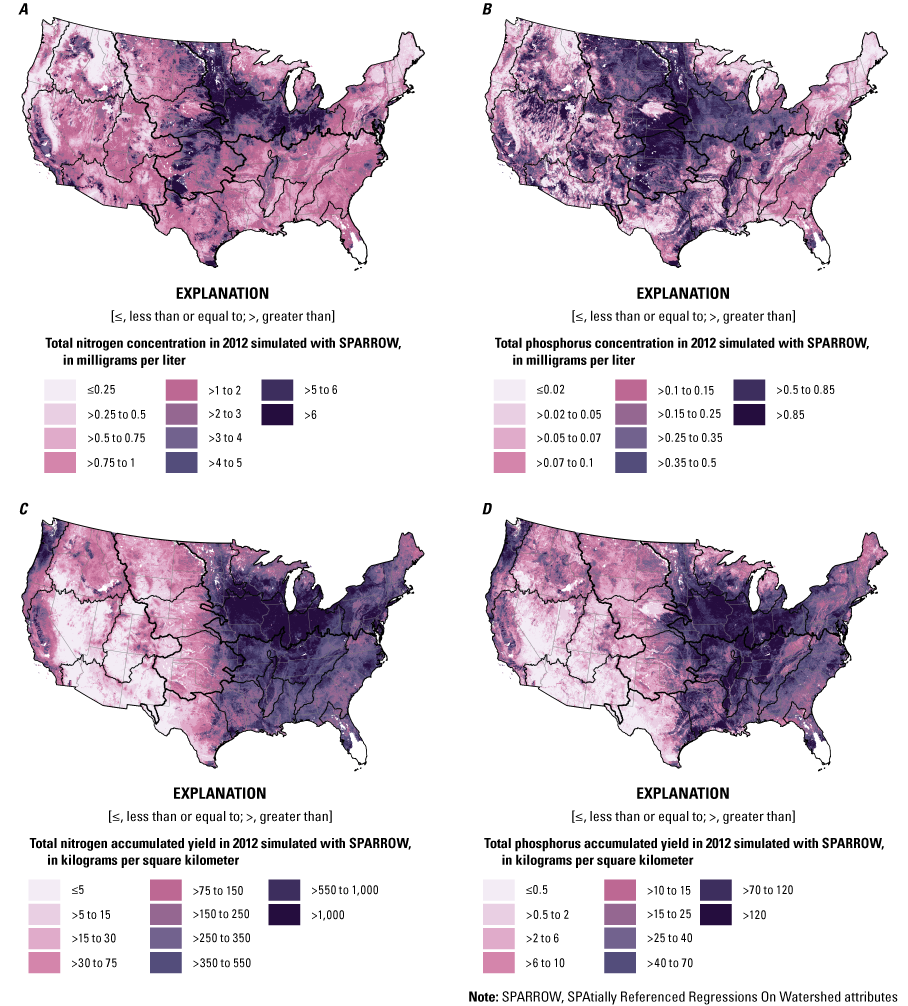
Conterminous United States showing predicted (A) total nitrogen concentration, (B) total phosphorus concentration, (C) total nitrogen accumulated yield, and (D) total phosphorus accumulated yield from 2012 mean annual SPAtially Referenced Regressions On Watershed attributes (SPARROW) models (Martinez and others, 2024). Grids presented here are also accessible in an interactive searchable map in appendix 1, figure 1.1. Black lines indicate hydrologic region boundaries. White areas on the map were excluded from analysis.
We referenced SPARROW nutrient concentrations against existing benchmarks following past examples (Spahr and others, 2010a), specifically the USEPA NRSA regional “Good” water-quality criteria for near-reference, least-disturbed ecological conditions. Much of the country had twofold greater nutrient concentrations than near-reference conditions, with localized regions containing nutrient concentrations tenfold or greater than near-reference conditions (fig. 4). This analysis highlights how nutrients, even outside regions with the greatest nutrient concentrations and yield (fig. 3), may still pose water-availability concerns for local ecosystems. This is particularly notable for regions that might have naturally low nutrient concentrations, such as nitrogen in the Western United States (figs. 4, 5).
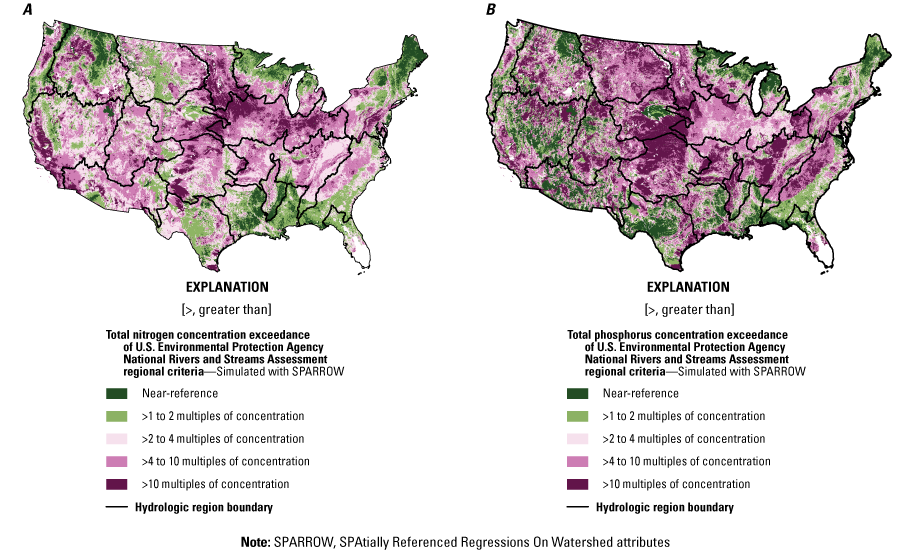
Predicted 2012 mean annual SPARROW nutrient concentrations benchmarked against U.S. Environmental Protection Agency National Rivers and Streams Assessment regional water-quality thresholds for the least disturbed, near-reference condition for (A) total nitrogen concentration and (B) total phosphorus concentration. Categories are multiples of the concentration established as the regional near-reference “Good” condition. Grids presented here are also accessible in an interactive searchable map at appendix 1, figure 1.1. White areas on the map were excluded from analysis.
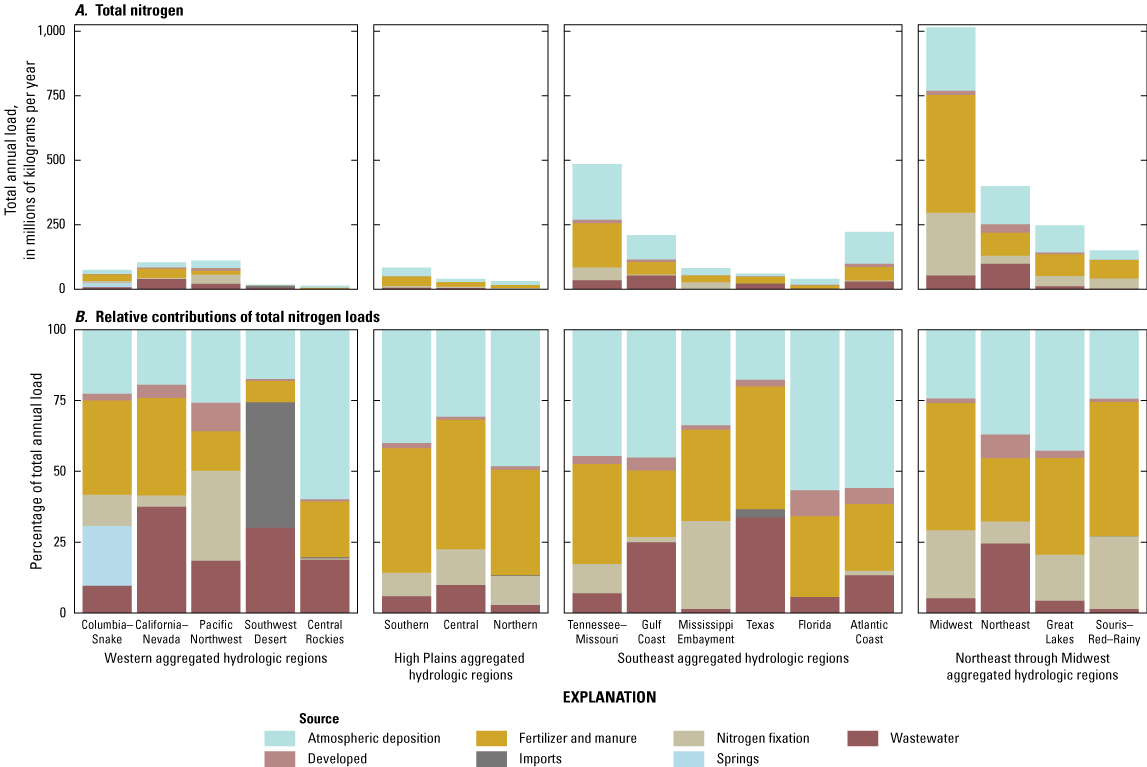
(A) Total nitrogen and (B) relative contributions of total nitrogen loads by source for each hydrologic region of the conterminous United States.
Excess nutrients (nitrogen and phosphorus) can affect ecosystems and people in indirect ways. Nutrients can contribute to eutrophication, which disrupts many other ecosystem functions (Wurtsbaugh and others, 2019), including primary productivity, food webs, and species composition. Eutrophication is also an important driver of harmful algal blooms (HABs), which can indirectly cause hypoxia (that is, low dissolved oxygen [DO]), resulting in fish kills, and degrade beneficial recreational uses of waterbodies (see sections, “Harmful Algal Blooms” and “Dissolved Oxygen”). The relative ratios of nitrogen to phosphorus can also suggest which nutrient may be limiting algal growth, although exact thresholds may vary based on local context (Keck and Lepori, 2012). High nutrient concentrations may also contribute to potential human-health effects at drinking-water nitrate concentrations less than the regulatory limit (Ward and others, 2018).
Nutrients have a range of natural and anthropogenic sources. Natural sources of nutrients in surface water include fixation of atmospheric nitrogen by soil bacteria that is transported to streams, geogenic sources, fixation by aquatic bacteria and algae, and lightning strikes (fig. 1). Anthropogenic sources of nutrients in surface water generally include nonpoint fertilizer and manure application, atmospheric deposition (which generally has anthropogenic origins), nitrogen fixation by crops, and point sources such as wastewater treatment plant discharge (Galloway and others, 2004; Carpenter, 2008). Legacy nitrogen stored in groundwater can also be an important source to streams as well (Tesoriero and others, 2013; Van Meter and others, 2016). Across the CONUS, primary sources vary spatially, and include fertilizer and manure, atmospheric deposition, wastewater treatment plants, urban land, and a range of natural sources including stream channel and geologic sources (figs. 5, 6).
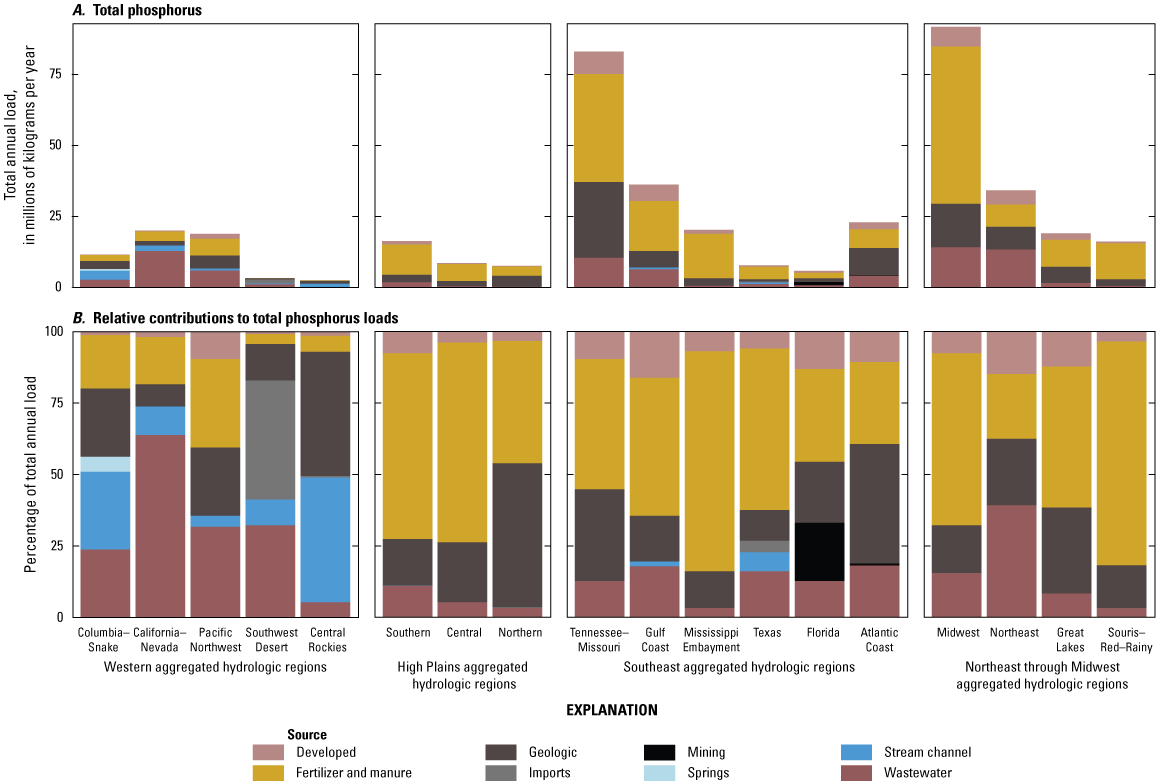
(A) Total phosphorus and (B) relative contributions of total phosphorus loads by source for each hydrologic region of the conterminous United States.
We integrated total and source-specific nutrient loads from five independently developed regional SPARROW models to assess CONUS spatial patterns in loads and sources (Ator, 2019; Hoos and Roland, 2019; Robertson and Saad, 2019; Wise, 2019; Wise and others, 2019). Variability in sources across regional models makes regional comparisons challenging. To address this issue, we generalized common sources to enable a simple comparison. Still, some key sources are not represented across all regions, so our analysis is approximate. Despite this limitation, some clear patterns emerge. Nutrient total loads vary by region. The Midwest and Tennessee–Missouri hydrologic regions have the highest loads of total nitrogen and total phosphorous, whereas the Central Rockies have the lowest loads (figs. 5, 6). Other regions generally have substantially lower loads than the Midwest and Tennessee–Missouri hydrologic regions, with the highest loads tending to have high loads from multiple sources compared to a single source driving high loads. Nutrients in the Midwest and Tennessee–Missouri hydrologic region streams have local effects on aquatic ecosystems and water use and contribute to HABs and reoccurring hypoxic zones downstream, including in the Gulf of Mexico (Rabalais and Turner, 2019).
The sources of nutrients in streams vary across the CONUS. Fertilizer, manure, and atmospheric deposition contribute most of the total nitrogen load in nearly all hydrologic regions (fig. 5). Fertilizer and manure, geologic sources, and wastewater are the largest sources of total phosphorus in the Midwest and Tennessee–Missouri hydrologic regions (fig. 6). Fertilizer and manure, geologic sources, and wastewater are also the dominant sources of total phosphorus across the CONUS, with fertilizer and manure contributing 50 percent or more of the load in most hydrologic regions in the High Plains, Southeast, and Northeast through Midwest (fig. 6). Wastewater discharge to streams is an important source of total nitrogen in some hydrologic regions such as the California–Nevada, Southwest Desert, and Texas hydrologic regions, and a relatively minor source in other hydrologic regions such as the Mississippi Embayment and Souris–Red–Rainy hydrologic regions (fig. 5). However, a study in the Delaware, Illinois, and Upper Colorado River Basins indicated that even the complete elimination of wastewater point sources would not improve nitrogen and phosphorus concentrations to below various nutrient benchmarks for most reaches because of the persistence of various nonpoint sources (Ator and others, 2022). Nitrogen fixation is an important source of total nitrogen in the Mississippi Embayment, Souris–Red–Rainy, Midwest, and Pacific Northwest hydrologic regions. The importance of developed lands for nutrients varies by hydrologic region as well. Springs are a uniquely important source of nutrients in models representing the Columbia–Snake hydrologic region, as are stream channels in the Western and Southeast aggregated regions. Understanding variability in sources across regions can help tailor nutrient-management strategies to individual areas.
Salinity
Salinity effects on water availability are more spatially limited than nutrients, but salinity can cause considerable local issues for human beneficial uses and ecosystem needs. Salinity can be indicated by a range of constituents or properties, including specific conductance, (total) dissolved solids, chloride, and other ions. The USEPA NRSA for 2013–14 (U.S. Environmental Protection Agency, 2020a) indicated that 85 percent of streams across the country were classified as having good salinity conditions for ecosystems based on specific conductance. Compared with sites identified as suitable for data assessment across the United States (Oelsner and others, 2017), 80 percent of samples were within the USEPA NRSA specific conductance good criteria benchmark, and 80 percent of sample concentrations were less than the USEPA total dissolved solids SMCL for drinking water of 500 milligrams per liter for water years 2010–17 (fig. 7; table 3). These results also generally agree with Shoda and others (2019), who, using the same data over a slightly later time period, reported that dissolved-solid concentrations at 74 percent of stream sites were less than the drinking-water SMCL during 2002–12. Predictions from a SPARROW model representing long-term average conditions during 1980–2009 showed that 12.6 percent of stream reaches were predicted to have dissolved-solid concentrations greater than the SMCL, and these exceedances are most common (over 25 percent of reaches are predicted to exceed the SMCL) in the Souris–Red–Rainy, Rio Grande, Arkansas-White-Red, Missouri, Lower Colorado, and Texas-Gulf regions (Anning and Flynn, 2014). About 50 percent of river reaches in the Souris–Red–Rainy region are predicted to have dissolved solids concentrations that exceed the SMCL (Anning and Flynn, 2014). The SMCL only applies to water served to customers for drinking water and does not apply to all stream reaches across the country or to water that is used for purposes other than drinking water, but it is used here as a metric for evaluating model results in the context of drinking-water supply. According to the USEPA ATTAINS database, 10–15 percent of river miles impaired for drinking water and other uses are attributable to chloride/sulfate, an indicator of salinity, and <5 percent of river miles are impaired for ecological uses, fish consumption, or recreational uses owing to salinity (fig. 2; U.S. Environmental Protection Agency, 2023c). However, the use of high-resolution data would be beneficial in the detection of acute aquatic-life exceedances for chloride (Moore and others, 2020), although such data are not yet fully represented at a continental scale because they are sparse on a long-term basis. The further development of long-term continuous salinity-monitoring sensors help enable a more comprehensive temporal assessment of salinity stress on water availability (Conaway and others, 2024a).
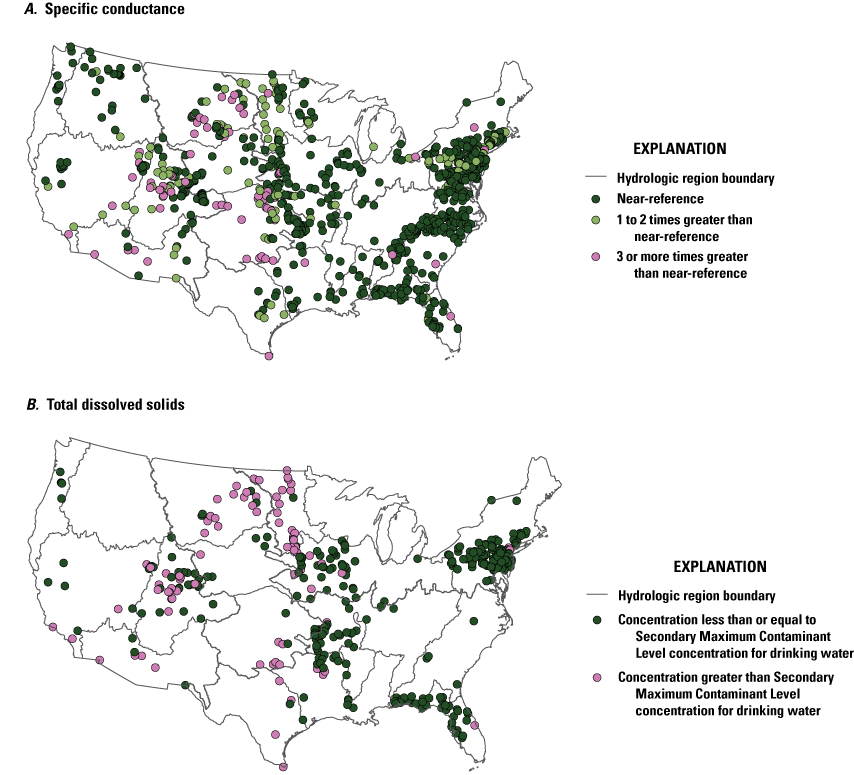
(A) Specific conductance in surface water benchmarked against U.S. Environmental Protection Agency regional water-quality thresholds for the least-disturbed, near-reference condition (table 3; U.S. Environmental Protection Agency, 2020b) and (B) total dissolved solids benchmarked against the 500 milligrams per liter national Secondary Maximum Contaminant Level, in the conterminous United States for water years 2010–17.
There has been a growing recognition of the threat that freshwater salinization (increasing salinity) of surface waters poses to water availability (Cañedo-Argüelles, 2020), with 37 percent of the drainage area of the CONUS having experienced salinization, primarily in the populated Northeast through Midwest aggregated hydrologic regions (Kaushal and others, 2018; Cañedo-Argüelles, 2020). Trend assessments at individual sites across the United States show increasing salinity with time at many sites, particularly in urban areas, and at concentrations that indicate potential corrosion to drinking-water infrastructure. A study that compared predicted salinity concentrations to human user needs for drinking-water and agricultural uses in the Upper Colorado River Basin indicated that estimated mean-annual flow-weighted, total-dissolved-solid concentrations (a measurement of salinity) exceeded State standards for agricultural water use and (or) the SMCL for drinking water in 52 percent of streams by length (Ator and others, 2022). Salinity can limit water availability for beneficial uses and result in substantial economic damages. Excessive salinity can limit water availability for humans through reduced agricultural yields, damage to infrastructure through corrosion, high drinking-water lead levels attributable to corrosion of lead-containing service lines or household plumbing, mobilization of other metals or pollutants, and unpleasant taste, or by causing water to be too saline for consumption (Stets and others, 2018; U.S. Environmental Protection Agency, 2020b). Ecological communities in naturally low-salinity areas are particularly vulnerable to salinity changes (Clements and Kotalik, 2016), and anthropogenic elevations of salinity above background levels are related to effects on aquatic life (Cormier and others, 2018). Increasing salinity can limit water availability for ecosystems through the mechanisms of increased osmoregulatory stress on individuals, resulting in mortality, and causing cascading changes to populations, communities, and ecosystems (Cañedo-Argüelles and others, 2013).
Salinity has geogenic (natural) and anthropogenic sources, and yields are greatest in the Midwest, Northeast, West Coast, and agricultural areas in the intermountain West (Anning and Flynn, 2014). Geogenic sources include groundwater, saline springs, and rock formations, which are the predominant source in 89 percent of the CONUS catchments and contribute 71 percent of the total amount of dissolved solids delivered to CONUS streams (Anning and Flynn, 2014). A study by Olson and Cormier (2019) predicted background natural salinity (specific conductivity) during 2001–15 across the CONUS, and national estimates of salinity (dissolved solids) across the CONUS have been made for long-term conditions (Anning and Flynn, 2014). Anthropogenic sources (for example, road deicers); land use such as irrigation, urbanization, and pasture/rangeland; and release of produced water from oil and gas production can be locally important and contribute to increasing salinity with time (Mullaney and others, 2009; Anning and Flynn, 2014; Harkness and others, 2015; Thorslund and others, 2021). Road deicers, which contribute 13.9 percent of the long-term average annual dissolved solids load to CONUS stream reaches, are the predominant source of salinity to streams in 5 percent of CONUS catchments, primarily in the Northeast and Great Lakes regions (Anning and Flynn, 2014). Pasture lands, which contribute 7 percent of the long-term average annual dissolved-solid load to CONUS stream reaches, are the predominant source of salinity to streams in 3 percent of catchments, primarily in the western half of the country (Anning and Flynn, 2014). Urban lands, which contribute 5 percent of the long-term average annual dissolved solids load to CONUS stream reaches, are the predominant source in 2 percent of catchments (Anning and Flynn, 2014). Base flow (groundwater discharge to streams), which includes geogenic and anthropogenic sources, can be an important pathway for salinity to enter streams (Rumsey and others, 2017). For example, according to a time-varying, dissolved-solid SPARROW model of the Upper Colorado River Basin, groundwater contributes 66–82 percent of the dissolved-solid loads to streams (Miller and others, 2024). Base-flow sources may be especially relevant to chronic thresholds, whereas seasonal surface runoff with deicer salts can result in short-term salinity peaks relevant to acute thresholds (Moore and others, 2020). The subtopic of salinity from saltwater intrusion is covered later in this chapter (see section “Brackish Groundwater and Sea Water”).
Sediment
Excessive sediment and its effect on turbidity can frequently limit water availability for ecological uses, drinking water, recreation, and other beneficial uses such as navigation and infrastructure (fig. 2). However, national-scale assessments of sediment effects on water availability are challenged by the wide range of ways sediment can limit beneficial uses and ecological needs, as well as by inconsistencies in monitoring approaches, regulatory criteria, and modeling metrics. Although an aquatic-life standard exists for sediment (turbidity) limitation on light, including for aesthetic purposes, sediment is frequently assessed for its effect on impairing aquatic life through excess fine streambed sediment (Collins and others, 2011; Fanelli and others, 2022).
Using a nationally consistent approach, the USEPA NRSA indicated that approximately one-half of the Nation’s rivers and streams have streambed sediment in good condition to support ecosystems and that approximately 20 percent of rivers and streams have streambed sediment in poor condition (U.S. Environmental Protection Agency, 2020a). Sediment standards for aquatic life are also regularly used as the same benchmark for protecting recreational uses (U.S. Environmental Protection Agency, 2023d). National SPARROW model estimates of suspended sediment across the CONUS indicate that mean-annual flow-weighted concentrations are generally higher in the western half of the country than in the eastern half and that areas of high yields are widespread (fig. 8; Ator, 2019; Hoos and Roland, 2019; Robertson and Saad, 2019; Wise, 2019; Wise and others, 2019). Drinking water-standards exist for finished, treated, public-supply water, but no consistent standards exist for raw public-supply intake water because of the varying ability of different filtering and treatment technologies to handle turbidity and sediment.
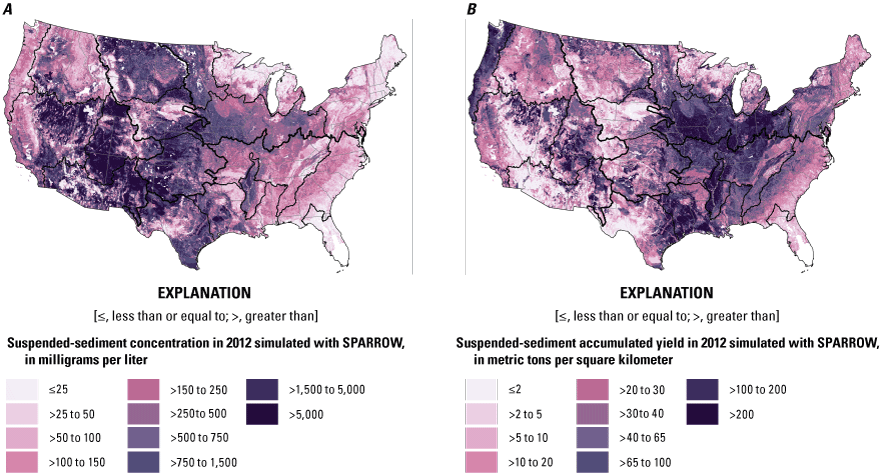
(A) Suspended sediment concentration and (B) accumulated yield from 2012 mean-annual SPAtially Referenced Regressions On Watershed (SPARROW) models, in the conterminous United States (Martinez and others, 2024). Grids presented here are also accessible in an interactive searchable map in appendix 1, figure 1.1. Black lines indicate hydrologic region boundaries.
Excessive suspended sediment can limit water availability by making water directly unusable when in suspension in the water column and after settling onto the bed of downstream waters. Altered sediment bedload, the portion of the total sediment load that is transported along the riverbed, is associated with channel instability and mobility, flooding, and habitat simplification (Sims and Rutherfurd, 2017). Bedload is also a particular threat to beneficial uses dependent on reservoirs because bedload is efficiently trapped by most reservoirs, difficult to manage with flushing techniques, and a critical component of long-term reservoir sustainability (Morris, 2016). However, direct monitoring measurements of bedload are rare and typically estimated (Morris, 2016). Reservoir sedimentation has resulted in an estimated loss of 40 billion cubic meters in storage capacity across the United States since the late 1980s (Randle and others, 2021). Loss of reservoir capacity can reduce the ability to support public water supply, irrigation, hydroelectric generation, and other industry, navigation, and recreational uses, as well as flood risk reduction, with sufficient loss of capacity resulting in dam decommissioning (Randle and others, 2021).
Excessive sediment in suspension has myriad potential effects on surface waters, including directly reducing light penetration for ecosystems; affecting water color, visibility, and aesthetic standards for drinking water, recreation, and industrial uses; interfering with water treatment and disinfectant processes; and, causing direct physical harm to biota. Excess sediment deposition or bedload can reduce channel capacity and hinder navigation, necessitating dredging to maintain navigational uses at costs of billions of dollars per year (the costs of which have substantially risen in the last several decades; Fuller and others, 2023). Sedimentation in reservoirs can reduce capacity for beneficial uses and can decrease trapping efficiencies, resulting in increased downstream transport of other water-quality constituents, such as nutrients (Zhang and others, 2016). Sediment can also function as a vector for other water-quality constituent concerns, such as particulate nutrients, microbial pathogens, and other sediment-bound contaminants. Fine-grained sediment (<2 millimeters [mm] in diameter)—encompassing silts, clays, and equivalent sized organic matter—is typically the largest component of suspended-sediment loads and has greater surface area for the sorption, transport, and delivery of nutrients, heavy metals, and other contaminants than coarse-grained sediment. The deposition of fine sediments onto the streambed also has large effects on ecosystems by smothering bed habitat for biota and increasing consumption of DO required by aquatic organisms and for the spawning success by some fishes (Kemp and others, 2011; Jones and others, 2012).
Conversely, insufficient sediment supply can be a locally important water-availability issue. Sediment deposition is crucial to sustaining river deltas and coastal marshlands, particularly as sea level rises, and to delta- and marsh-dependent ecosystems and industries such as fisheries (Grossman and others, 2022). Sediment starvation can occur below impoundments (Phillips and others, 2004) and as a result of in-channel sand and gravel mining, which can limit sediment availability for ecological needs and habitat creation (Melis and others, 2012), as well as threaten infrastructure through effects such as bridge scour (Avila, 2016; Torres Santana, 2016).
Sediment transport in surface water originates with the natural erosion of landscapes and stream corridors and is a vital part of maintaining the function of river systems. Erosion rates and sediment yields naturally vary across the country owing to local topography and slopes, geologic uplift, landscape vegetation types and cover, and rainfall patterns. Increased sediment can be caused by the anthropogenic erosion of sources in the uplands, especially agricultural and urban land uses, which can alter vegetation cover, make soils more erosion-prone, and concentrate the erosive forces of surface runoff. Historical, legacy land uses and degradation (such as mining and land clearing) can also continue to affect current rates of erosion because of long transit times and storage, and remobilization of these older sediments from within channels and floodplains (James, 2013), which complicates the understanding of sediment processes (Gellis and others, 2024). Erosion of the stream channel, especially stream banks, can also contribute a large fraction of suspended-sediment (Gellis and others, 2017) and total-phosphorus loads (Ishee and others, 2015), but this process is not robustly considered in existing modeling approaches (Gellis and others, 2024). Across large spatial scales, suspended sediment and its effect on excess streambed fine sediments is further mediated by topographic positioning, slope, local channel forms, and hydraulics, suggesting the need for more direct modeled assessments of streambed sediment condition for use in assessment limitations on aquatic life. SPARROW models estimate important sources of suspended sediment across the country, including agricultural land, forested areas, stream channels, and geologic sources (fig. 9).
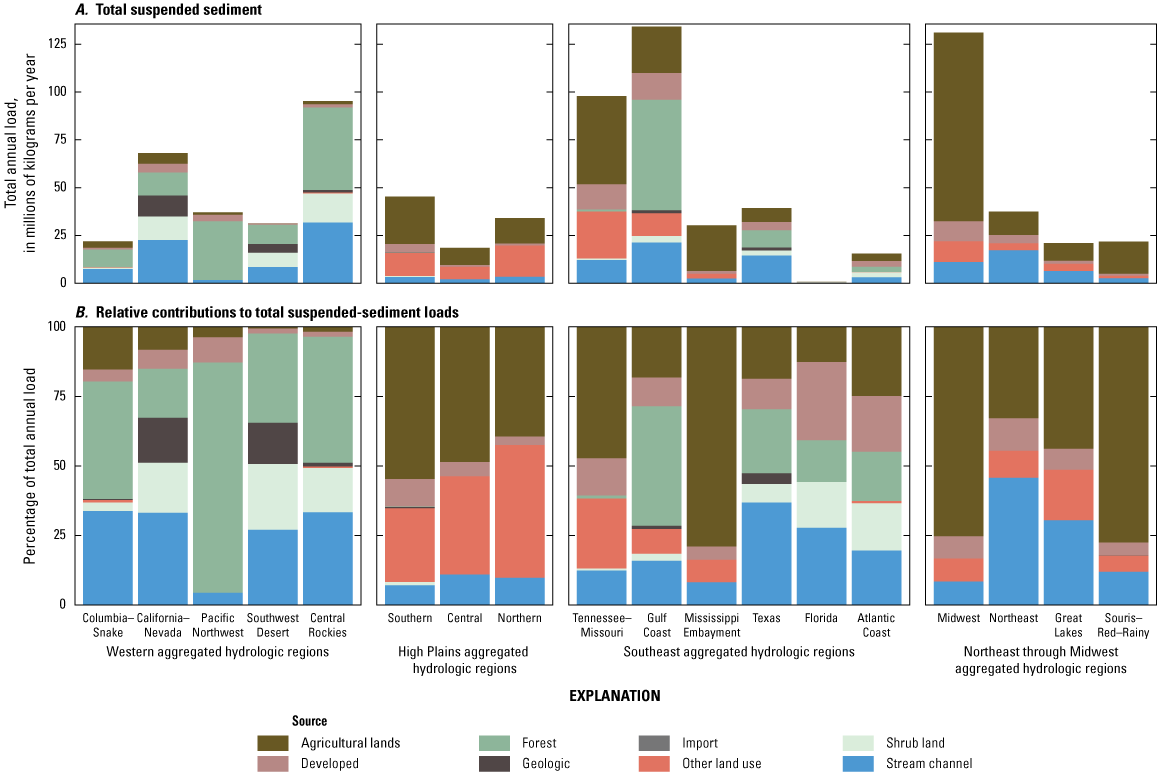
(A) Total suspended-sediment loads by source for each hydrologic region and (B) relative contributions of sources to loads by hydrologic region of the conterminous United States.
Like with the nutrients analysis, we integrated total and source-specific suspended-sediment loads from five regional SPARROW models to assess CONUS spatial patterns in loads and sources (Ator, 2019; Hoos and Roland, 2019; Robertson and Saad, 2019; Wise, 2019; Wise and others, 2019). Within these models, suspended sediment in streams originates from either upland erosion or stream channel erosion. Sediment loads vary considerably across hydrologic regions of the CONUS, with higher loads mostly attributed to erosion of agricultural lands, forested lands, and other land use compared to hydrologic regions with lower sediment loads (fig. 9). The Gulf Coast, Midwest, and Tennessee–Missouri hydrologic regions have the highest loads of suspended sediment, whereas the Florida hydrologic region has the lowest loads (fig. 9).
Erosion of agricultural land, forested lands, stream channels, and other land use are important sources of suspended sediment across the country. The relative importance of different sources varies greatly among hydrologic regions (fig. 9). For example, erosion of forested lands ranges from being the dominant source in the Pacific Northwest hydrologic region to being a minor source in many other regions. In the Pacific Northwest hydrologic region, erosion of agricultural lands and developed lands deliver more suspended sediment per unit area than forested lands, but the large areal coverage of forested lands results in it being the dominant source in this hydrologic region (Wise, 2019). Agricultural lands are the dominant source of suspended sediment in other regions, particularly in the High Plains, and Northeast through Midwest aggregated regions. Recognition of the variability of source importance across regions can help in the management of suspended sediments.
Temperature
Temperature limits water availability, primarily for ecosystem uses, but also human uses such as drinking water, recreation, and (to a limited extent) fish consumption, and other uses like industrial cooling (fig. 2). Temperature impairments are predominantly located in the Western United States (U.S. Environmental Protection Agency, 2023c), and a major management focus revolves around the persistence and availability of cold-water habitats for specific fish communities.
Several large regional temperature assessment models are focused on ecosystem needs and the persistence of cold-water fish taxa, including NorWest for the Western United States (Isaak and others, 2017) and Ecosheds in the Mid-Atlantic and Northeastern United States (Letcher and others, 2016). Overall, these models have indicated historical stream warming as well as forecasted future warming under multiple climate scenarios and suggest that cold-water habitats suitable for cold-water fisheries will decrease in areal extent (Walker and others, 2020). At the CONUS scale, a spatially continuous national temperature model exists, which categorizes rivers and streams into various summer and annual thermal class categories (McManamay and DeRolph, 2019). Recent work using process-guided deep learning has also predicted daily surface temperatures for 185,549 lakes across CONUS from 1980 to 2020 (Willard and others, 2022).
Temperature affects water availability for aquatic ecosystems through various processes, including through its control of dissolved-oxygen solubility and by regulating growth rates (affecting reproduction, respiration, and life stage) and can impose physiologically lethal limits. Water temperature is an important factor controlling DO in surface waters and limits rates of chemical reactions for other water-quality constituents. Specific thermal optima and maxima vary by individual species (Welch and Jager, 2022), as well as by an individual’s life-stage, duration of exposure, and co-exposure to other water-quality stressors. Broad temperature-preference classifications have been developed for a range of fish taxa (U.S. Environmental Protection Agency, 2023d), ranging from warm- to cold-water preferencing taxa, with cold-water taxa particularly vulnerable to changes in stream temperature (Wagner and others, 2023). As a result, anthropogenic alterations to the natural thermal regime of a river can alter habitat suitability for fish species, thereby reducing water availability for ecosystem needs.
Water temperatures are predominantly driven by air temperature but can be affected by groundwater interactions, canopy shading, channel complexity and depths, and other human influences such as discharge from thermoelectric plants and dam impoundments, and runoff from anthropogenic land use (Leach and others, 2023). Groundwater interaction in mountain streams (specifically local bedrock depths and discrete hydrogeologic features) can drive spatial patterns of summer base flow, temperature, and flow disconnection (Briggs and others, 2022), all crucial factors in understanding the persistence of summer cold-water habitat refugia in response to climate change (Snyder and others, 2015). An analysis of thermoelectric impacts on surface-water temperatures across the United States indicated that one-through coolant effluent (1) averaged nearly 10 degrees Celsius (°C) higher than intake water; (2) had an average maximum effluent temperature of 37 °C; and, (3) at more than one-half of U.S. power plant cooling systems, increased temperatures by an amount sufficient to impact aquatic life (Madden and others, 2013). USGS streamgage data across large spatial scales highlight that water temperatures follow typical air temperature gradients of being colder in the north and in mountainous areas compared to warmer in the south and more low-lying areas (fig. 10), but with important outliers highlighting key anthropogenic alterations like aforementioned bottom-releases from dams.
Work is ongoing in the USGS Water Resources Mission Area to adapt process-guided deep learning—pre-trained on calibrated National Hydrologic Model temperature output to produce daily water temperature metrics during 1980–2020 for rivers and streams across CONUS.
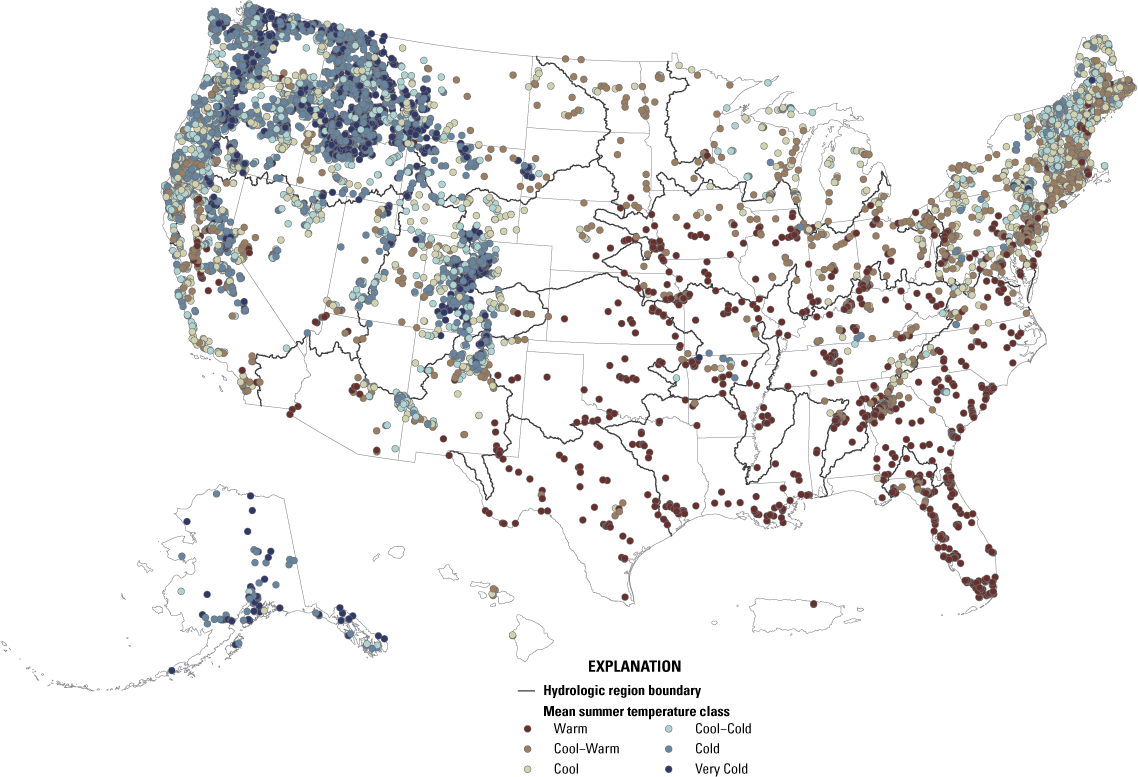
Mean summer temperature observational data from across the United States (Oliver and others, 2024) binned into summer temperature classifications adapted from McManamay and DeRolph (2019). Very Cold, less than 10 degrees Celsius (°C); Cold, 10–15 °C; Cool–Cold, 18–21 °C; Cool, 18–21 °C; Cool–Warm, 21–24 °C; Warm, greater than or equal to 24 °C.
Organic Constituents and Contaminants of Emerging Concern (CECs)
Pesticides
Pesticides and their degradates are regularly detected in surface waters in all hydrologic regions of the country. In fact, at least 50 percent of each region’s sites had at least one chronic aquatic-life benchmark exceedance. Of 74 monitored sites, nearly all had at least 1 exceedance of aquatic-life thresholds, but exceedances of human-health benchmarks were rare (Stackpoole and others, 2021). Pesticides are anthropogenic chemicals designed to kill insects, undesirable plants, and fungi. Pesticides persist in the environment, however, beyond the site of application and after the expected period of use (Stackpoole and others, 2021). Therefore, runoff and persistence can expose nontarget aquatic insects, plants and algae, and fish, as well as humans, and affect ecosystem condition, recreation, fish consumption, and drinking-water beneficial uses (fig. 2). Different pesticides can have different effects on biota. The presence of pesticides in rivers and streams can have lethal effects on nontarget organisms at environmental concentrations. Nonlethal effects can also disrupt ecological communities and create problems in fish health that affect fish-consumption uses (Brander and others, 2016). Some pesticides are highly lipophilic and can accumulate in sediments and bioaccumulate in fishes (Brander and others, 2016), potentially having toxic effects on humans. Pesticides are applied in agricultural areas, homes, businesses, and recreational areas, and they are also discharged in food-processing wastewater (Hubbard and others, 2022).
The likelihood of aquatic-life exceedances for pesticides is high across all hydrologic regions of the country. The Midwest hydrologic region has high pesticide application rates across a large spatial area (fig. 11), which is associated with high pesticide concentrations, and leading to the greatest detection frequency in surface-water samples (Stackpoole and others, 2021). Within the range of pesticides and degradates detected in surface waters, ecological-benchmark exceedances predominantly occurred in a relatively small number of compounds, most notably the herbicides atrazine and metolachlor and insecticide imidacloprid. Imidacloprid, with 245 benchmark exceedances at 60 of the 74 monitoring sites, posed the greatest potential threat to aquatic life (Stackpoole and others, 2021).
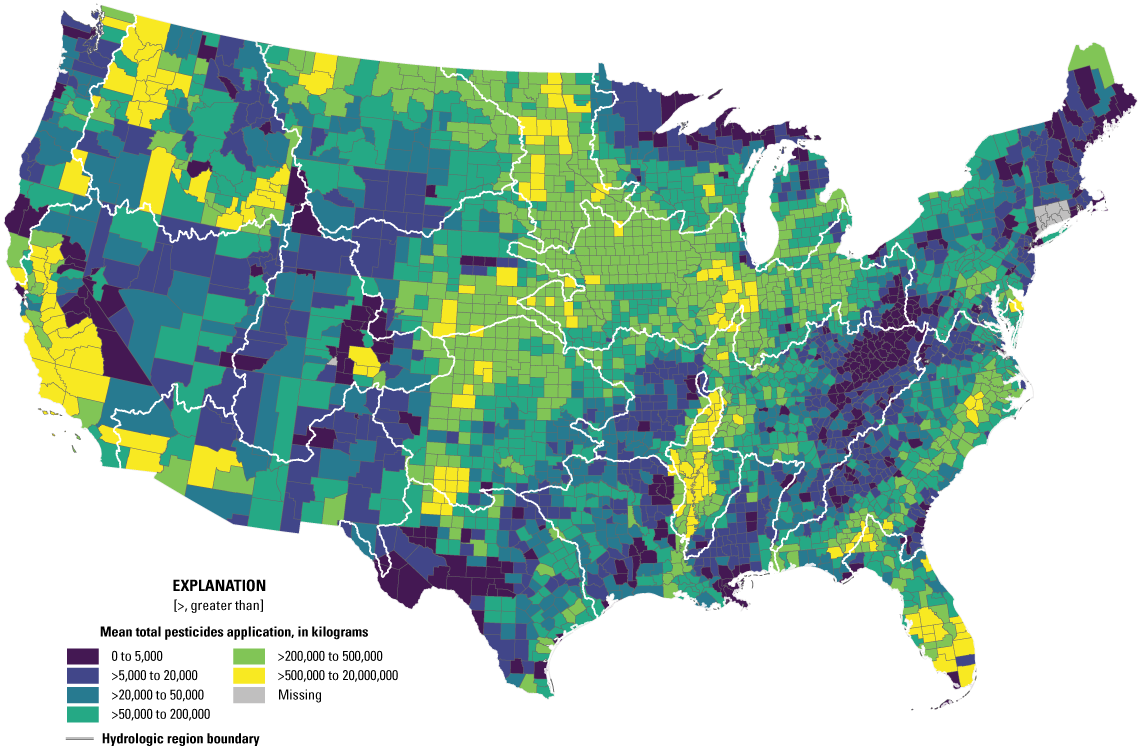
Mean annual application of total reported pesticides at county scale across the conterminous United States, 2013–17 (Wieben, 2019).
Although the USEPA ATTAINS database indicates that <5 percent of river miles are impaired for drinking water, ecological uses, fish consumption, recreational uses, or other uses because of pesticides (fig. 2; U.S. Environmental Protection Agency, 2023c), the regulatory environment tends to lag behind pesticide creation and adoption such that most of the prevalent pesticides do not have existing criteria (U.S. Environmental Protection Agency, 2023d). Additionally, pesticide transformation products and chronic exposures are incompletely considered in current hazard quotients (Mahler and others, 2021), which risks misattribution of some types of ecological effects to other water-quality constituents that co-occur as mixtures, such as nutrients in agricultural settings (Fanelli and others, 2022). Mixtures of multiple pesticides can cause compounding toxicity problems to aquatic life (Covert and others, 2020); within USGS multi-stressor studies across the country, various pesticides and their degradates were commonly the top causes of degraded algal, fish, and especially macroinvertebrate conditions (Waite and others, 2021).
Overall, risk to surface-water availability from pesticides is likely underestimated because of a limited number of pesticides having toxicity benchmarks (Mahler and others, 2021). An even smaller number of pesticide breakdown byproducts have benchmarks but have also been shown to have toxic effects (Mahler and others, 2021). Additionally, pesticide occurrence in surface waters is characterized by a high degree of temporal variability, which might be missed by traditional discrete water-quality samples compared to more integrated, time-averaging sampling (Van Metre and others, 2017).
Per- and Polyfluoroalkyl Substances
Per- and polyfluoroalkyl substances (PFAS) are a large, varied group of chemicals of potential concern that can limit water availability through their effects on human and ecological health. Drinking-water uses are of particular concern; at least 45 percent of the Nation’s tap water is estimated to have one or more PFAS, and people in urban areas have a higher probability of PFAS exposure than people in rural areas (Romanok and others, 2023; Smalling and others, 2023). PFAS have numerous common anthropogenic sources. PFAS are widely used manufactured chemicals that persist in the environment for a long time and have been recognized as a CEC by the USEPA (Podder and others, 2021; U.S. Environmental Protection Agency, 2022b, Romanok and others, 2023; Smalling and others, 2023). Thousands of PFAS have been used for various industrial and commercial product purposes including food packaging, cookware coatings, firefighting foams, furniture, military installations, airports, and manufacturing and processing facilities. Wastewater treatment plant discharge and atmospheric deposition are the primary sources of PFAS in the environment (Podder and others, 2021), with waters becoming local sinks for PFAS.
Some PFAS can bioaccumulate through trophic levels, leading to potential human exposure through fish consumption (Fair and others, 2019). PFAS can be particularly resistant to degradation and can persist, bioaccumulate, and have toxic effects on humans and aquatic life (Mahoney and others, 2022). Exposure to PFAS can affect human health, including human development, organs (including the kidney and liver), obesity, and immune systems, and increased cancer risk (U.S. Environmental Protection Agency, 2019a; Heindel and others, 2022). PFAS exposure can also be toxic to aquatic life and cause neurobehavioral changes, growth deformities, hormone disruption, and oxidative stress, and affect fish-health metrics (Mahoney and others, 2022), although more study is needed to determine risks for many PFAS (Ankley and others, 2021). The USEPA developed recommended Aquatic Life Criteria and Aquatic Life Benchmarks for selected PFAS (U.S. Environmental Protection Agency, 2024a, 2024b, 2024c).
The USGS conducted a national reconnaissance of PFAS from 716 locations (269 private-wells, 447 public supply wells) across the United States during 2016–21. The study filled a gap in information about PFAS in residential tap water at the point of use, especially from private wells (Romanok and others, 2023; Smalling and others, 2023). Concentrations of PFAS were assessed by three laboratories and compared with land-use and potential-source metrics to determine drivers of contamination (Romanok and others, 2023; Smalling and others, 2023). Across the United States, multiple PFAS compounds and estimated median cumulative concentrations were similar among private wells and public-supply tap water. Seventeen PFAS were observed at least once, and detection probabilities varied spatially with limited temporal variation. The USEPA is establishing drinking-water standards for selected PFAS (U.S. Environmental Protection Agency, 2024d).
Other studies have also detected the widespread occurrence of PFAS in drinking water. The USEPA analyzed data collected during 2013–15 at all PWSs serving more than 10,000 people and 800 systems serving 10,000 or fewer people and reported that 1.3 percent of PWSs had measured concentrations of two types of PFAS (perfluorooctanoic acid and perfluorooctane sulfonate) that were greater than the USEPA lifetime drinking-water health advisory limit (U.S. Environmental Protection Agency, 2016c, 2016d, 2019a). Lake Michigan is the drinking-water source for the Chicago-Naperville-Elgin-Illinois-Indiana-Wisconsin Metropolitan Statistical Area, the third largest U.S. metropolitan statistical area with an estimated 2017 population of 9.5 million. Within 45 homes in this area, PFAS detection was ubiquitous with detections in all but one sample (Bradley and others, 2020a). In a multi-State assessment, PFAS were detected in 84 percent of tap water samples taken in homes and workplaces (Bradley and others, 2018).
Given the burgeoning importance of PFAS with respect to human and environmental health, a strategic science plan was developed to comprehensively assess PFAS at the national scale (Tokranov and others, 2021) and that the USGS has begun to implement. Expanded knowledge of various PFAS sources and their relative contributions to ambient concentrations could be used to enhance USGS models aiming to predict PFAS concentrations in surface-water resources, their potential ecotoxicological effects, and possible exposure routes for humans and ecosystems. Prior assessments of PFAS have been limited to regional and metropolitan scales, and more sampling is needed for national coverage (Tokranov and others, 2021), especially in wastewater discharge effluents and ambient water resources. However, the continued development of novel PFAS compounds, even as previous legacy PFAS compounds receive more study, continues to challenge overall PFAS assessments because of the general lack of information about mechanisms and toxic potencies (Mahoney and others, 2022) and effects of PFAS on different components of the ecosystem (Banyoi and others, 2022).
Pharmaceuticals
Pharmaceuticals can affect water availability primarily for ecosystem uses, with consequences for recreational fishing and human consumption, from headwaters streams to large rivers. Nationally, many different kinds of pharmaceuticals have been detected in surface waters, including drinking water, and although they are generally detected at concentrations associated with low direct risk to human health, they may pose risks to aquatic organisms (World Health Organization, 2012; Batt and others, 2016; Wilkinson and others, 2022). Exposure to pharmaceuticals can affect human and ecosystem health, with various effects and mechanisms related to the type of pharmaceutical present in the environment, which can include antibiotics, non-steroidal anti-inflammatory drugs, blood lipid lowering agents, reproductive hormones, beta-blockers, and antidepressants (Santos and others, 2010). Various pharmaceuticals can affect aquatic-species behavior, health, and mortality; contribute to antibiotic-resistant bacteria; feminize fish; and increase fish susceptibility to predation (Kidd and others, 2007; Brodin and others, 2013; Wellington and others, 2013; Horký and others, 2021; Ortúzar and others, 2022). Although negative effects on human health are unlikely due to exposure to the trace concentrations of pharmaceuticals that could potentially be found in treated drinking water, exposure through drinking water is a concern because it is involuntary and can potentially occur over long time periods (World Health Organization, 2012).
Sources of pharmaceutical contamination in surface waters include human wastewater and food processing wastewater point sources (World Health Organization, 2012; Hubbard and others, 2022), but also nonpoint sources. USGS studies have determined that although pharmaceutical detections and concentrations are correlated with urban land use and wastewater treatment plant discharges, pharmaceutical mixtures were also found across the Nation in streams without large wastewater plant discharges but with dispersed sources such as septic systems or animal waste runoff (Bradley and others, 2020b), with numerous effects on local ecosystems. Under low-flow conditions, streams are vulnerable to public wastewater-contaminant discharges because wastewater discharge flow can be most important for maintaining stream flow at low flow for small streams (Rice and Westerhoff, 2017).
Estrogenic and endocrine-disrupting chemicals can also be produced naturally by some plants, called phytoestrogens, with notable sources including some agricultural crops (Burnison and others, 2003) and industrial applications (Lundgren and Novak, 2009). Endocrine-disrupting chemicals have been shown to cause reproductive problems and intersex in freshwater fishes, especially sport fish (Blazer and others, 2012), assessed at regional scales (Gordon and others, 2021).
Microplastics
Although there are no criteria to which to compare them, the presence of microplastics, which are small (<5-mm) plastic fragments and fibers, has been documented throughout the environment, from remote mountains to deep ocean trenches (Baldwin and others, 2016; Baldwin and others, 2017; Whitmire and Van Bloem, 2017; Hale and others, 2020; Baldwin and others, 2021; Reynolds and others, 2022). Compared to marine environments, however, relatively less focus has been placed on the assessment of microplastics in fresh water and their potential ecotoxicological effects on freshwater ecosystems (Li and others, 2023). However, recent studies have suggested that microplastics may have a range of potential effects on humans and ecosystems.
Microplastics can potentially limit water availability through their presence in water. Microplastics are easily colonizable by biofilms, have been shown to concentrate harmful pathogens, and can potentially promote pathogenic transfer across long distances (Li and others, 2023), which may limit drinking-water uses. Because of their small size, microplastics are easily ingestible by wildlife, including birds, fish, plankton, filter feeders, and other aquatic organisms, and can be easily lodged in gills. Once ingested, microplastics can cause physical damage (impaired reproduction, inflammation, altered metabolism, or death), block an animal’s digestive system, and reduce or interfere with feeding. Plastic degradation can release additives or plasticizers. Pollutants, trace metals, and pathogens can (1) adhere to microplastics, (2) bioaccumulate in animals that consume microplastics, and (3) alter the bioavailability of heavy metals and other organic contaminants (Li and others, 2020). Overall, however, toxic effects are mainly limited to individual and tissue levels and more study is needed on larger community and ecosystem effects.
Microplastics have anthropogenic sources. Microplastics are either synthesized for the cosmetic or chemical industry or form through degradation of larger plastic pieces including plastic litter, cleaning products, medicines, and textiles. Microplastics enter the environment through their disposal in solid waste, wastewater, tire wear, paint failure, and textile washing (Hale and others, 2020). However, this is an emerging field of study with many unanswered questions about sources, transport, and effects on humans and ecosystems.
Other Organic Contaminants
Other notable organic contaminants include polychlorinated biphenyls (PCBs), tire-wear by-products, and polycyclic aromatic hydrocarbons (PAHs), all of which can persistently limit water availability. Their presence in surface water typically results from long-term additions and subsequent accumulation of contaminants on land, in groundwater, and in areas adjacent to stream channels. The existence of some of these accumulated contaminants can cause substantial time lags between the implementation of remediation or restoration efforts and when the effects of these efforts are observed within aquatic ecosystems.
PCBs are a legacy and persistent organic contaminant that are still of widespread concern for water availability (sidebar 4), primarily for humans but also for ecological uses. According to the USEPA ATTAINS database, 23.8 percent of river miles impaired for fish consumption are the result of PCBs; just 5 percent or fewer of river miles impaired for drinking water, ecological uses, recreational uses, or other uses are the result of PCBs (fig. 2; U.S. Environmental Protection Agency, 2023c). PCBs are endocrine-disrupting compounds, associated with cancers and a wide range of human-health risks, are generally stable and persistent in the environment, and can bioaccumulate in aquatic organisms and food webs (Ngoubeyou and others, 2022), leading to concerns for ecological and recreational uses and hazards to human health through fish consumption (fig. 2). Although PCBs were prohibited decades ago, PCB contamination can be common in industrial sites (point sources) and hydrologically connected locations. About 30 percent of the historical worldwide production of PCBs is still present in aquatic ecosystems, sediments, and aquatic food webs (Ngoubeyou and others, 2022). However, PCBs were also extensively used as a plasticizer in building materials in the mid-20th century and may function as a nonpoint source of PCB exposure across developed landscapes of certain aged construction (Herrick and others, 2016).
Tire wear on road surfaces has recently been shown to have the potential to severely limit water availability for fish. Tire wear can create residue that is prevalent in urban stormwater flows and can kill salmonids within 24 hours of exposure at environmentally measurable concentrations (McIntyre and others, 2023). Water-quality issues associated with urban stormwater have been a known issue on limiting water availability for the successful spawning of federally listed coho salmon (Oncorhynchus kisutch) in the Pacific Northwest (Scholz and others, 2011). The specific chemical responsible for the toxicity was previously unknown but has been linked to 6PPD-Quinone, a degradate of a common tire-derived chemical (6PPD), an anti-degradant in car tires used to promote tire longevity and consumer safety (Tian and others, 2021). Typical exposure levels can result in upwards of 90-percent mortality in female coho salmon prior to spawning in urban watersheds (Scholz and others, 2011). USGS research has been involved in assessing the transport and distribution of these compounds, species sensitivity, and methods of toxicity.
PAHs are a broad, diverse class of widespread organic pollutants that can limit water availability for human and ecosystem uses. PAHs can be released into aquatic environments through natural and anthropogenic sources (Douben, 2003)—including the combustion and (or) breakdown of hydrocarbons such as crude oil, tar, and oil shale (Lima and others, 2005)—and can be transported through atmospheric deposition and subsequent runoff of dust and sediments with PAH-bound particles. PAHs are associated with multiple negative ecological effects (Douben, 2003) and potential human-health concerns (Ball and Truskewycz, 2013; Mallah and others, 2022). Within urban areas, pavement coated with coal-tar-based sealcoats (sidebar 4)—which have been historically used in the Eastern United States—has been shown to be a notable source of PAHs (Van Metre and others, 2022). PAH concentrations from runoff of coal-tar-sealed pavements can remain high for weeks to months after application, at concentration levels potentially fatal to aquatic organisms and fish (Mahler and others, 2014). The breakdown and wear of coal-tar-sealed pavements into road dust can also result in sediment-bound transport into nearby waterbodies (Van Metre and others, 2022).
Sidebar 4. Examples of Other Legacy and Persistent Organic Contaminants
Polychlorinated biphenyls (PCBs), banned in the 1970s, are still of widespread concern for water availability today, for example by limiting ecological and recreational water uses. PCBs are also a potential hazard to human health through fish consumption (fig. S4.1).
Polycyclic aromatic hydrocarbons (PAHs) are persistent organic pollutants that are still in use and can be released into aquatic environments through natural and anthropogenic sources. Pavement coated with coal-tar based sealcoats (fig. S4.2) can have runoff with high PAH concentrations for weeks to months after application. PAH concentrations in pavement runoff can be hazardous to aquatic organisms, fish, and human health.
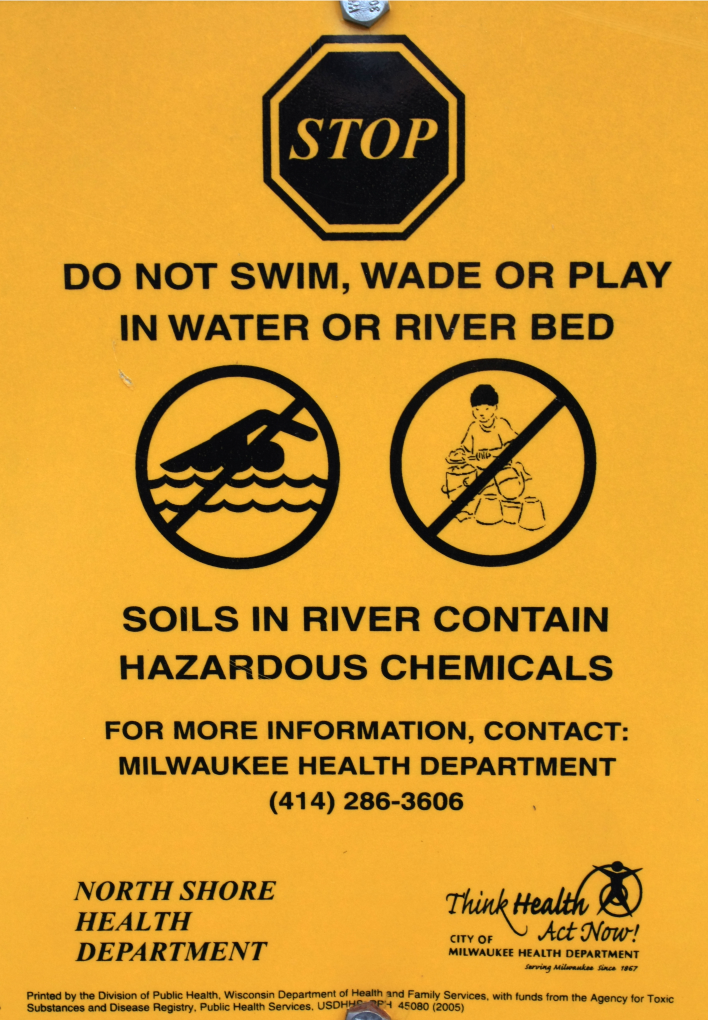
A sign warning of hazardous chemical conditions in a river. Photograph by Alan Cressler, U.S. Geological Survey.
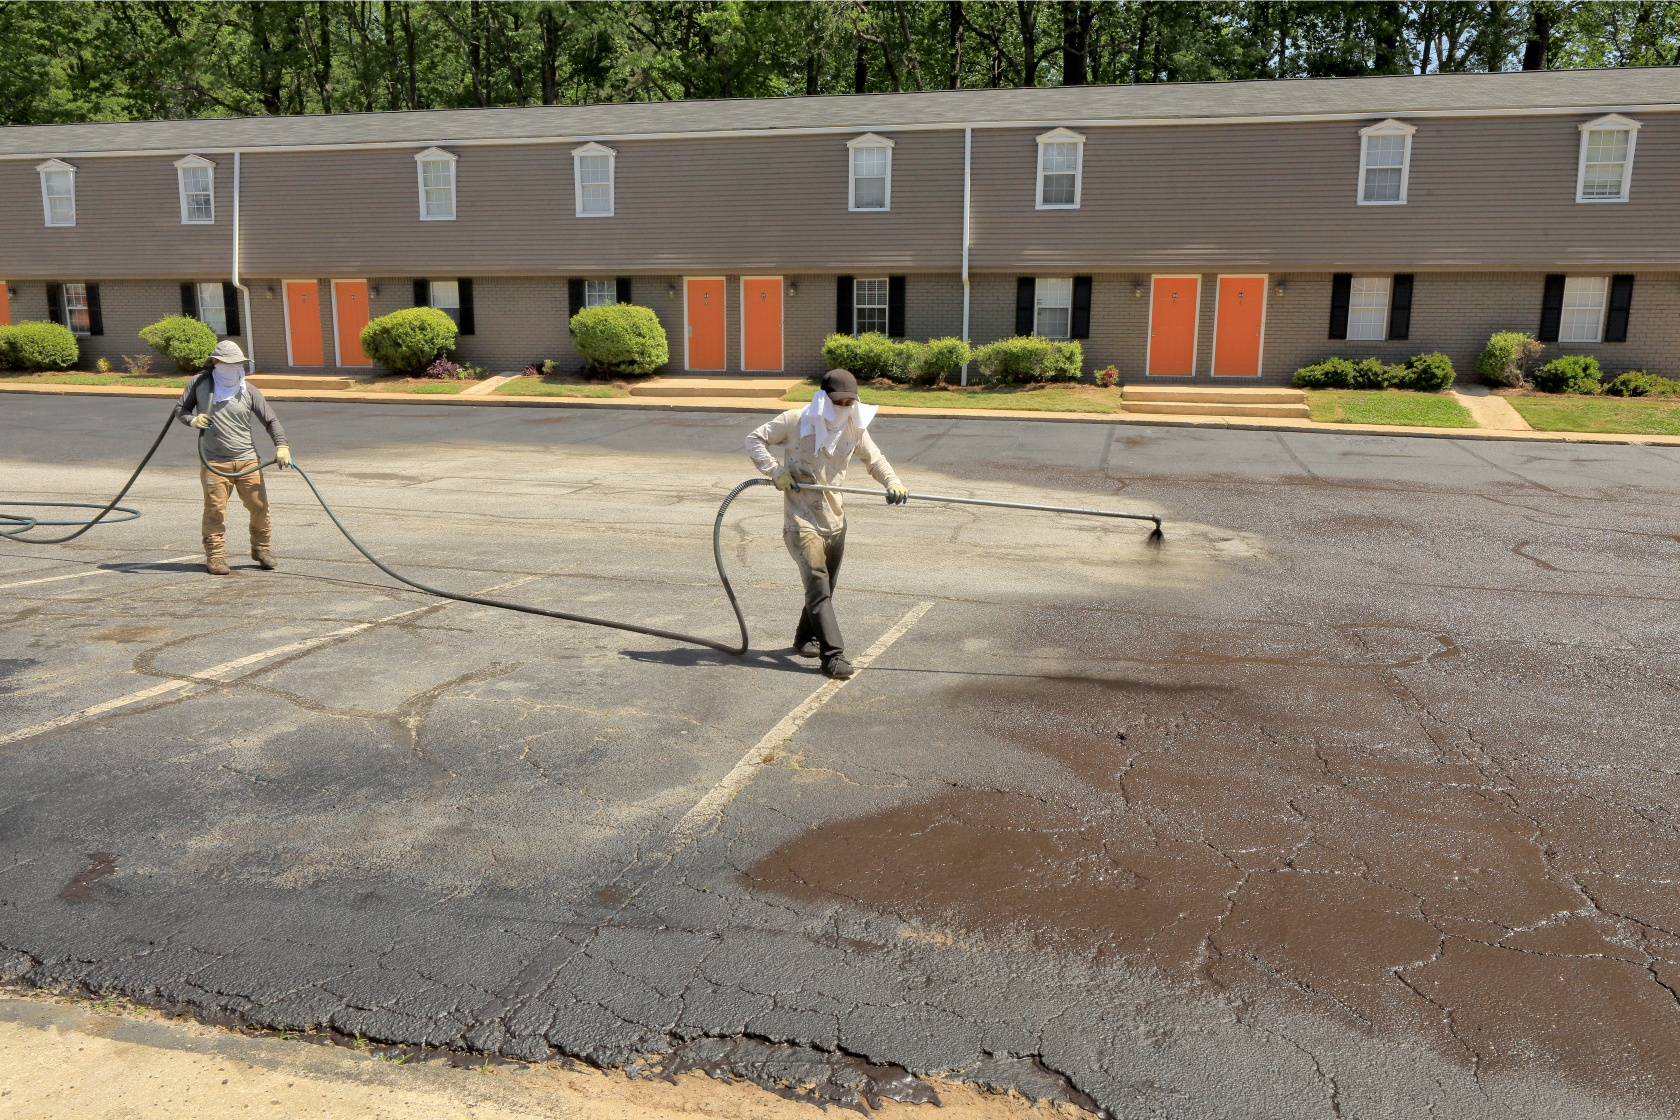
Spray application of asphalt seal coat chemicals to a parking lot. Photograph by Alan Cressler, U.S. Geological Survey.
Biotic Constituents
Harmful Algal Blooms
Harmful algal blooms (HABs) can severely limit water availability for human and ecosystem uses in many waterbodies across the Nation. Aquatic algae occur naturally in all waterbodies and occur in benthic (that is, attached to bottom surfaces) and planktonic (that is, in the water column) forms. Under advantageous conditions, high growth rates can lead to large accumulations of benthic or planktonic algae known as an “harmful algal blooms,” and depending on the taxa, can produce toxins. HABs can limit water availability through nuisance algal growth, food-web impairment, bloom decomposition causing hypoxia, taste and odor problems in drinking water, and lost recreational opportunities(Wackler and others, 2017; Graham and others, 2020). Some algal blooms produce biotoxins at a concentration hazardous to people, pets, and aquatic ecosystems. Biotoxins primarily affect ecological and recreational beneficial water uses, and in some rare cases, drinking water (fig. 2).
Phytoplankton have been assessed nationally for many decades, and these early assessments noted high phytoplankton abundances occurring in areas of high nutrient concentrations in water associated with human and agricultural activities and erodible soils (Briggs and Ficke, 1977). HABs have been correlated with agricultural land use and associated increased total nitrogen, dissolved organic carbon (DOC), and temperature (Beaver and others, 2014; Yuan and Pollard, 2017), although in some instances they can be limited by turbidity effects on light availability. Cyanobacteria can cause HABs and produce toxins. Satellite imagery provided CONUS-scale assessments of cyanobacteria showing that cyanobacteria bloom frequency was widespread and relatively stable in large lakes during 2017–19 (Coffer and others, 2021a). A national assessment of cyanobacteria blooms near 685 drinking-water intakes resolvable in 2019 satellite imagery indicated that the median frequency of blooms identified in satellite images at each location was 2 percent (that is, a bloom was present at that 300-meter pixel in 2 percent of the images during a year). However, the maximum was 100 percent, indicating that a bloom was always present in the images near a drinking-water intake for a given year (Coffer and others, 2021b). A review of potential toxin-producing algal blooms in surface waters on Federal lands and Trust species—including marine mammals, migratory birds, threatened and endangered species, and species of concern exposed to algal toxins—indicated that at least 11.1 percent of 1,944 Federal land units that cover 2.59 million square kilometers have been affected by toxin-producing algae and cyanobacteria, although exposures are likely underreported (Laughrey and others, 2022). Handler and others (2023) identified the risk of toxic blooms among more than 2,000 lakes in the United States and identified several hundred priority lakes at high risk of exceeding various thresholds, including chlorophyll-a, cyanobacteria, and microcystin. This study identified clusters of lakes with a high probability of exceeding HAB thresholds in the Midwest, Gulf Coast, and Florida, although within-region variability in exceedance probability was high.
Much of the existing data and research on HABs has focused on lakes, reservoirs, and coastal water, but HABs are also found in rivers. The properties and conditions of HABs in rivers remain less defined (Bouma-Gregson and others, 2017; Graham and others, 2020; Giblin and others, 2022). The presence of cyanobacteria capable of producing toxins, and the genes responsible for producing them, are common in eutrophic rivers, especially in the midcontinent region (Graham and others, 2020; Zuellig and others, 2021). The 2013–14 USEPA NRSA report estimated that the algal toxin microcystin was present in about 38 percent of the Nation’s river miles, but concentrations exceeded the USEPA-recommended recreational swimming advisory in only 0.1 percent of river miles (U.S. Environmental Protection Agency, 2016b, 2020a). Additionally, much HAB work has focused on planktonic algae, but there is growing recognition and research on the role of benthic algae in HABs and biotoxin creation (Catherine and others, 2013). In particular, benthic HABs in rivers are particularly sensitive to flow regimes, local hydraulics, and flow regulation, which can reduce flow disturbance and scour, and facilitate conditions for HAB creation (Catherine and others, 2013).
HABs are caused by complex interactions among physical, chemical, biological, hydrological, and meteorological conditions, and determining the conditions that may lead to bloom formation and specifically toxin production is an active area of research of great interest to water-resource managers (Sellner and others, 2003; Beaver and others, 2018).
Microbial Pathogens
Microbial pathogens, especially bacteria, are the top cause of overall impairment of water availability in rivers and streams for various uses across the United States (U.S. Environmental Protection Agency, 2023c) and primarily are a threat to human health through ingestion and recreational activities like swimming, although they are also linked to ecological uses (fig. 2). Bacteria can originate from natural or human activities that cause contamination including (1) wastewater treatment plant discharge, leaky septic systems, stormwater runoff, animal waste; and (2) runoff from animal pastures, feedlots, or manure storage (Cabral, 2010; Verhougstraete and others, 2015; U.S. Environmental Protection Agency, 2020a).
According to the USEPA ATTAINS database, nearly 40 percent of river miles impaired for recreational use are attributable to pathogens, and <15 percent of river miles impaired for drinking water, ecological uses, fish consumption, or other uses are attributable to pathogens (fig. 2; U.S. Environmental Protection Agency, 2023c). Each year in the United States, an estimated 560,000 people may suffer from moderate-to-severe waterborne infection, an estimated 1.7 million people suffer from mild-to-moderate waterborne infections, and an estimated 1,200 people die from waterborne infections (Morris and Levine, 1995). Young children are particularly vulnerable to waterborne diseases. Enterococci are bacteria that are harmless to humans but are used to indicate the presence of disease-causing agents such as viruses, bacteria, and protozoa. Enterococci assessment in the 2013–14 USEPA NRSA program indicated that an estimated 65 percent of national stream and river miles were in good status, whereas 30 percent of river and stream miles exceeded the recommended enterococci human-health criterion (U.S. Environmental Protection Agency, 2020a).
Metals and Physical Characteristics
Mercury
Mercury can limit water availability for aquatic species and humans through consumption of aquatic species. Mercury has geogenic sources (volcanos, hot springs, geologic deposits, and the ocean) and anthropogenic sources (industrial processes, mining, and primarily coal combustion). Dispersion of mercury through the atmosphere has resulted in widespread occurrence of mercury in the environment. The methylated form of mercury, methylmercury, is highly bioavailable and can accumulate in higher trophic levels, such as fish, relative to lower trophic levels at concentrations that make fish consumption unhealthy for humans (Wentz and others, 2014).
Fish consumption is the primary exposure route for humans and other wildlife, and 81 percent of all fish consumption advisories are attributable to mercury (Wentz and others, 2014). As a result, mercury affects water availability through its toxicity primarily for fish consumption uses because of its bioaccumulation, followed by ecological and recreational uses (fig. 2). According to the USEPA ATTAINS database, more than 20 percent of river miles impaired for fish consumption are attributable to mercury, and <5 percent of river miles impaired for drinking water, ecological use, recreational use, or other uses are attributable to mercury (fig. 2; U.S. Environmental Protection Agency, 2023c).
A national assessment of mercury in streams indicated that bioavailable methylmercury concentrations in fish exceeded the USEPA criterion for the protection of human health at approximately 25 percent of streams (Wentz and others, 2014). Mercury concentrations tend to be higher in soil in the Eastern one-half of the United States and in streambed sediments in urban areas. In streams, methylmercury concentrations vary with the abundance of wetland, which are areas of active mercury methylation, and the amount of inorganic mercury available. Streams with historical mercury or gold mining can also have high methylmercury concentrations. USEPA national sampling during 2008–09 and 2013–14 resulted in the detection of methylmercury concentrations in all fish samples, and concentrations exceeded human-health criterion in about 25 percent of river miles (U.S. Environmental Protection Agency, 2016b, 2020a). Small basin- and stream-scale studies have provided valuable insights into mercury and methylmercury ecosystem cycling, highlighting the sources, processes, and watershed characteristics that influence mercury and methylmercury transport and bioaccumulation (Brumbaugh and others, 2001; Shanley and others, 2008; Brigham and others, 2009; Chasar and others, 2009; Marvin-DiPasquale and others, 2009; Bradley and others, 2011; Riva-Murray and others, 2011; Burns and others, 2012; Bradley and others, 2013).
Mercury limits water availability through its toxic effects. Mercury is a neurotoxin that has been associated with adverse effects on human and wildlife health ranging from pathologies of the central nervous system, diminished cardiovascular health, endocrine disruption, reproduction, and long-term impairments in brain function, to death (Clarkson and others, 2003; Scheuhammer and others, 2007; Choi and Grandjean, 2008; Tan and others, 2009; Wentz and others, 2014). Fetal exposure, even at low levels, has been linked to neurological effects (Mahaffey and others, 2011).
Iron, Selenium, Arsenic, Lead, Copper, and Other Metals
Although many metals are critical to sustaining health and life, metals can limit water availability through risks associated with toxicity for human and aquatic health. Metal toxicity depends on the physical and chemical form of the metal, concentration, and route of exposure and physical characteristics of exposed individuals (Förstner and Wittmann, 1983; Tchounwou and others, 2012). Metal exposure even at low levels can contribute to DNA, cellular, and organ damage, as well as the onset of cancer.
According to the USEPA ATTAINS database, 26.1 percent of river miles impaired for drinking water are attributable to metals other than mercury (fig. 2; U.S. Environmental Protection Agency, 2023c). Non-mercury metals typically impair water availability predominantly for ecological and drinking beneficial water uses (fig. 2), and iron, selenium, arsenic, lead, and copper are the top non-mercury metals impairing rivers and streams across the United States (U.S. Environmental Protection Agency, 2023c). Several global assessments of metals in surface water have been conducted, although the coarse spatial resolution limits interpretation at sub-continental or sub-country scales (Kumar and others, 2019; Zhou and others, 2020). Many assessments of metals in surface waters have generally focused on individual waterbodies or on metals in groundwater.
Metals occur naturally in surface water from geogenic sources such as rock weathering, soil erosion, and dissolution of water-soluble salts. Human activities—including mining, urban runoff, wastewater, fertilizer and pesticide use, fuel combustion, and nuclear reactions—can (1) add substantial volumes of metals to the environment above background levels, (2) intensify effects of naturally occurring metals, and (3) release greater amounts of metals in more toxic and mobile forms than natural sources (Vareda and others, 2019; Zhou and others, 2020; Van Metre and others, 2022). Metals can concentrate in sediment, preferentially binding to fine-fraction silt and clays, and can accumulate through ecosystems. Binding of metals to dissolved organic matter also influences speciation, toxicity, and bioavailability (Breault and others, 1996, and references therein).
Many of these metals are associated with mining and mine drainage from active and inactive metal and coal mining. Acidic mine drainage interacting with underlying rock can create an iron- and metal-rich solution that can be released into nearby waters (Gray, 1997). Selenium contamination is also associated with coal mining and can be a particular hazard; even at low concentrations, selenium is prone to rapid bioaccumulation in food chains to levels toxic for aquatic life (Lemly, 2009). Geogenic arsenic occurrence is ubiquitous in the environment, although concentrations in water are influenced by local geology, climate, and mining and agricultural practices (Welch and others, 2000; Tchounwou and others, 2012; Jones and others, 2020b). Fossil-fuel burning, mining, and manufacturing contribute to high concentrations of lead greater than natural background concentrations in the environment, and corrosion and dissolution of lead in pipes can mobilize lead into drinking water (Tchounwou and others, 2012; Pieper and others, 2017). Mining, industrial processes, fertilizer application, and the wear of automobile brakes and tires and subsequent urban runoff contribute copper to surface waters (Hwang and others, 2016; Rehman and others, 2019; U.S. Environmental Protection Agency, 2023b).
pH
pH is a measure of how acidic or basic water is and ranges from 0 to 14. Water with a pH of 7 is neutral, water with pH greater than 7 is basic, and water with pH less than 7 is acidic. The alkalinity of water indicates the ability of water to resist changes to pH and is influenced by local geology. Excessively high- or low-pH waters can cause damage or death through either direct contact or through the biological availability and solubility of nutrients and metals. pH can also affect chemical reactions that determine water-quality conditions; the pH of water determines the biological availability, chemical solubility, and toxicity of chemical constituents like nutrients and metals and, therefore, plays a key role in influencing water availability.
Water can be too acidic or basic for the health of human or aquatic species. Water that is too acidic or basic primarily limits ecological uses, but also affects various human uses directly and indirectly through other water-quality constituents (fig. 2). According to the USEPA ATTAINs database, <5 percent of river miles are impaired for drinking water, ecological uses, fish consumption, recreational uses, or other uses due to pH (fig. 2; U.S. Environmental Protection Agency, 2023c). Increasing pH from salt pollution, accelerated weathering, mining, and resource extraction, and easily weathered minerals in agriculture and urbanization has affected 90 percent of the CONUS drainage area over the past century (Kaushal and others, 2018). The acidification assessment in USEPA NRSA program estimates that 98 percent of national streams and rivers are in good status, although when they are in poor condition, pH has a large effect on local ecosystems (U.S. Environmental Protection Agency, 2020a).
pH can be influenced by a wide range of chemical, hydrologic, and climatic conditions, and human activities. Locally, pH problems can be caused by (1) acidic drainage from mines in rivers near legacy mining (Acharya and Kharel, 2020); (2) urban, industrial, and agricultural waste, including through atmospheric deposition (Driscoll and others, 2001); and (3) photosynthesis and respiration (Fuller and Davis, 1989). Human activities can alter the acidification state of nearshore coastal habitats (Cai and others, 2011; Ekstrom and others, 2015).
Dissolved Oxygen
Low dissolved oxygen (DO), also known as hypoxia, can limit water availability primarily for ecosystem users (U.S. Environmental Protection Agency, 2023e) but can also affect human beneficial uses. According to the USEPA ATTAINSs database, <10 percent of river miles impaired for drinking water, ecological uses, fish consumption, recreational uses, or other uses are attributable to DO (fig. 2; U.S. Environmental Protection Agency, 2023c). A recent study of river hypoxia indicated that, although extended periods of hypoxia are rare, infrequent hypoxic conditions are common across the globe and CONUS and are more likely to occur in warm, small, and low-gradient rivers, especially those draining urban or wetland land cover (Blaszczak and others, 2023). Many high-profile estuaries and coastal water bodies, such as the Gulf of Mexico and Chesapeake Bay, have regulatory Total Maximum Daily Load requirements to reduce upstream nutrient loadings, but with the goal to improve DO conditions for aquatic-life uses (U.S. Environmental Protection Agency, 2003, 2007).
Ecosystems are typically sensitive to disturbances in pH and oxygen because DO is needed for respiration and can affect animal behaviors and swimming performance (Eliason and Farrell, 2016). DO is also a main concern for reproductive success of gravel-spawning fishes, especially as affected by flow modifications, and fine and organic sediment deposition can affect the DO available in interstitial flows for fish embryo survival (Kemp and others, 2011). DO is also an important regulator of (1) oxidation-reduction (redox)-sensitive chemical reactions, including carbon and nutrient cycles; and (2) the control of phosphorus and metal sorption to sediments (Lovley, 1993). DO can also affect recreational uses owing to byproducts associated with hypoxia, such as color, odor, or other aesthetic factors.
DO is controlled by a series of physical and biological processes regulated by natural and anthropogenic drivers (McCabe and others, 2021; Zhi and others, 2023), including (1) ambient water temperature, which is a factor limiting the total amount of oxygen that can remain dissolved in solution; (2) flow, turbulence, and wind-based physical agitation, which can aerate water and increase dissolved oxygen; (3) photosynthesis and respiration attributable to the production and metabolism of aquatic life; and (4) organic matter decomposition, such as decomposition caused by organic fine sediments, nutrient-rich wastewater and runoff, and die off from algal blooms.
DO typically follows a diurnal cycle, increasing through photosynthesis by aquatic plants and algae during the day and decreasing through biologic respiration at night. The deposition of organic matter in the bed of aquatic ecosystems can, in some lakes and other non-mixed systems, cause stratified DO conditions in the water column, where organic matter decomposition can cause localized hypoxic (that is, low oxygen) conditions near the bed that are isolated from oxic DO higher in the water column.
Surface-Water Societal Factors
The United Nations defines access to clean water as a human right (United Nations General Assembly, 2010), and societal factors are often related to access to clean water. Most Americans get drinking water from public supplies, and about 60 percent of the public supply comes from surface-water sources (Johnson and others, 2022). Low-income and minority-dominated communities, often have greater exposure to drinking-water contamination (Balazs and Ray, 2014; Stillo and Gibson, 2017; Schaider and others, 2019). Health-based violations of the Safe Drinking Water Act at community water systems disproportionately affect socially vulnerable communities. Approximately 70 percent of community water systems with health-based violations systems have a high modified Social Vulnerability Index (mSVI, calculated by measures of socioeconomic status, race and language, and demographics and housing; Scanlon and others, 2023). Surface Water Treatment Rule violations, Disinfection Bioproduct Rule violations, and Lead and Copper Rule violations (noncompliance) were particularly associated with high mSVI; small systems face substantial challenges to the implementation and maintenance of treatment systems (Scanlon and others, 2023). In addition to a greater proportion of such systems serving minority communities than other communities, the duration of noncompliance for systems serving minority communities is also greater (Scanlon and others, 2023). Response times are also longer for facility inspections for noncompliant facilities in communities with higher percentages of poor and Hispanic people than other communities (Konisky and others, 2021).
For marginalized communities, the maintenance or replacement of water infrastructure can also involve challenges that can result in disproportionate financial and health impacts (Katner and others, 2018). Population loss from urban areas can compound water infrastructure inequities through increased per-capita cost burdens, which disproportionately affect low-income and racial minority communities (Butts and Gasteyer, 2011; Katner and others, 2018). Communities lacking piped water are more common on American Indian lands, rural Alaskan Native communities, and border communities known as colonias (VanDerslice, 2011). A lack of secure, clean household water can have substantial negative health and developmental effects (Fink and others, 2011; Tanana and others, 2021).
Water-quality problems that affect ecosystems may also affect people who rely on ecosystems for food. For example, Arctic Indigenous peoples have a traditional diet rich in marine mammals and fish, which are also a substantial source of mercury exposure (Arctic Monitoring and Assessment Programme, 2009, 2011). Young children and developing fetuses are particularly vulnerable to mercury exposure through movement across the placenta from mother to fetus. In Alaska nearly 20 percent of blood samples from Inuit and Yup’ik women of childbearing age had mercury levels that exceeded the USEPA guideline of 5.8 micrograms per liter (µg/L; Arctic Monitoring and Assessment Programme, 2009, 2011), compared with about 8 percent of women in a more diverse group of women of childbearing age across the United States exceeding the USEPA guideline (Schober and others, 2003). This study also identified increased mercury levels among women who consumed more fish.
Native communities can also be subject to unique cultural impacts from water-quality degradation based on differing socio-economic and political structures and ways of relating to the natural world (Clausen and others, 2021, 2023). Surface-water-quality degradation can interfere with the relations many Native people have with the land and disrupt the community-building processes (Fernández-Llamazares and others, 2020).
Quality of Groundwater Resources
Groundwater serves as the drinking-water source for about 140 million people, about one-third of the Nation’s population. Of those, about 43 million people have a drinking-water supply that is a sole-source domestic well (DeSimone, 2009; DeSimone and others, 2015; Norman and others, 2018; U.S. Environmental Protection Agency, 2018; Johnson and others, 2019, 2022; Belitz and others, 2022; and references therein). This section focuses primarily on groundwater-quality problems from widely occurring geogenic sources that can limit water availability for domestic and public drinking-water supply. Anthropogenic groundwater constituents (such as chloride and nitrate) are also discussed, which can limit the use of groundwater and degrade surface water when discharged as base flow. Ecological contaminant thresholds may differ from drinking-water thresholds for groundwater concentration contributions to surface water base flow. The more stringent of two different water-quality standards can most limit water availability.
Across the Nation, Principal Aquifers (PAs; Miller, 1999) and Secondary Hydrogeologic Regions (SHRs; Belitz and others, 2018) have been defined by lithology and other physical characteristics. Each PA and SHR has a unique name, and they can be grouped into categories of similar hydrogeochemical characteristics and described in the context of influences on susceptibility to geogenic or anthropogenic contaminants. PAs provide most of the public supply and domestic supply, but SHRs can be locally important groundwater drinking-water sources (Miller, 1999; Johnson and others, 2019, 2022; Degnan and others, 2021; Belitz and others, 2022; U.S. Environmental Protection Agency, 2022a). The USGS has been designing, conducting, and interpreting national-scale and regional-scale sampling for 3 decades and the synthesis presented here draws heavily from that work. The groundwater sampling was organized into networks of wells, and each network type fulfilled a specific purpose (Rowe and others, 2010, 2013). The broad purpose of the USGS groundwater network design was to provide data to answer questions such as “what is the quality of groundwater serving public or domestic supply?” and “what is the quality of groundwater underlying urban or agricultural areas?” The national distribution of high concentrations of contaminants from human and geologic sources in most of the Nation’s important drinking-water aquifers is shown in figure 12. Some of the most important groundwater-quality constituents and issues are presented and discussed in this section.
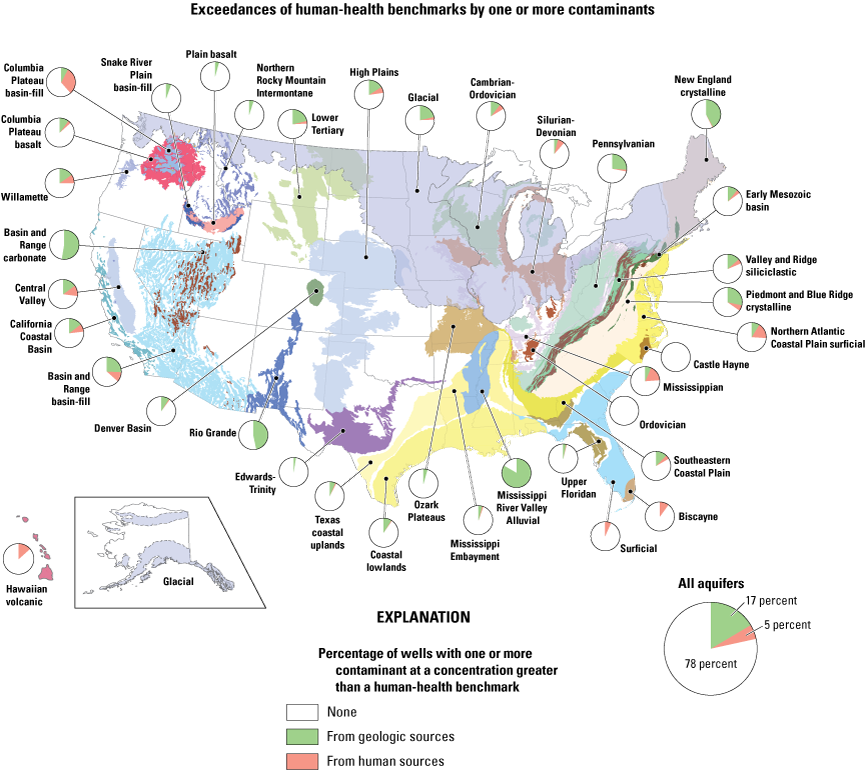
Contaminants from geologic sources exceed human-health benchmarks more frequently than contaminants from manmade sources in most principal aquifers across the United States, 1999–2010. From DeSimone and others (2015, fig. 4-2).
Groundwater-Quality Drivers—Age, Geochemical Evolution, and Physicochemical Setting
Groundwater flow path, age distribution, physicochemical setting including redox condition, pH, and other factors all drive the likelihood of groundwater contamination from geogenic sources, anthropogenic sources, or combined sources (DeSimone and others, 2015; Belitz and others, 2022; Jurgens and others, 2022). Groundwater primarily composed of recent recharge is commonly considered to be susceptible to contamination by anthropogenic contaminants from the land surface (fig. 13). Geogenic contaminants, conversely, are more commonly elevated in older groundwater because over long time periods they dissolve from aquifer material (fig. 13). Using tritium as an indicator, Lindsey and others (2019) developed a groundwater age classification scheme (modern, mixed, premodern) that can inform the likelihood of groundwater susceptibility to contamination from anthropogenic or geogenic contaminants. Age can serve as a proxy for groundwater geochemical evolution processes that alter the physicochemical setting. Redox condition can shift from atmospheric oxic conditions near land surface, through the ecological succession of electron acceptors (DO, nitrate, manganese, iron, sulfate; McMahon and Chapelle, 2008; Jurgens and others, 2009) to more reducing conditions deeper, with older water (Degnan and others, 2020; Erickson and others, 2021a). Likewise, pH can evolve over time and depth, from being similar to rainwater to being more alkaline or acidic because of interaction with carbonates or pyrite respectively, or other minerals (Morgan and Stumm, 1981; Appelo and Postma, 2005). The effect of groundwater age distributions and groundwater quality on surface water quality is further discussed in the section “Groundwater Flow Path, Contaminant Residence Time, and Groundwater–Surface Water Interactions.”
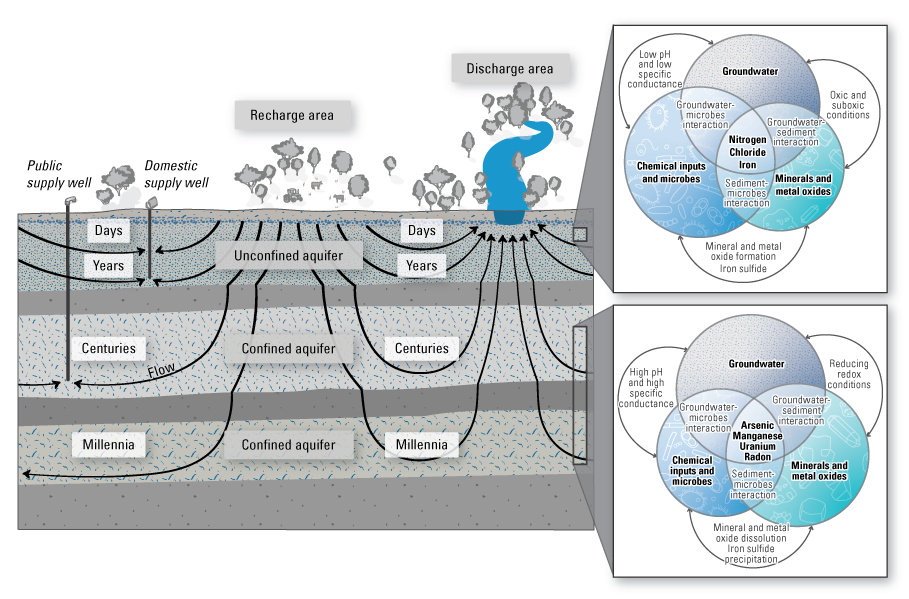
Key hydrologic and geochemical concepts related to groundwater quality. Anthropogenic contaminants released at the ground surface can be transported through shallow or deep groundwater and can discharge to surface water years or decades after entering the subsurface or can degrade through interaction with microbes or sediment. Geogenic contaminants can be continuously cycled through immobilization, mobilization, transport, and discharge through well water or into surface water through aquifer sediment interaction with microbes, anthropogenic chemicals, and changing pH or oxidation-reduction conditions. Illustration by Amanda Carr, U.S. Geological Survey.
Geogenic (Geologic Source) Constituents
Geogenic constituents are the category most commonly found at elevated or high-concentration in drinking-water aquifers across the Nation (DeSimone and others, 2015; Stackelberg and others, 2018; McMahon and others, 2019, 2020; Lindsey and others, 2021a; Musgrove, 2021; Belitz and others, 2022). The effect of elevated concentrations of geogenic constituents using areal and population metrics is shown in figures 14–16, as follows, using data from Belitz and others (2022):
-
• Areal distribution of elevated inorganic constituent concentrations in assessed drinking-water aquifers (fig. 14).
-
• Affected population, area, and relative proportion of elevated concentration of specific geogenic constituents and nitrate (fig. 15).
-
• Areal distribution of elevated arsenic and manganese (fig. 16).
Results for selected individual constituents in decadal well networks and PAs are also accessible in interactive searchable maps in appendix 1, figures 1.2 and 1.3.
Elevated concentrations of geogenic constituents affect extensive areas and millions of people using aquifers for drinking water across the country. Five geogenic constituents—arsenic, manganese, strontium, radium, and adjusted gross alpha (the total amount of energy released from radionuclides)—each have a substantially larger area and larger population affected by elevated concentration than nitrate. There is also considerable co-occurrence of geogenic constituents at elevated concentrations. Elevated geogenic constituent concentrations affect more than 30 million people, with the largest affected groundwater-dependent populations using three aquifers—two of the western unconsolidated PAs (California Coastal Basin and Basin and Range basin-fill aquifers) and the Glacial aquifer (Belitz and others, 2022).
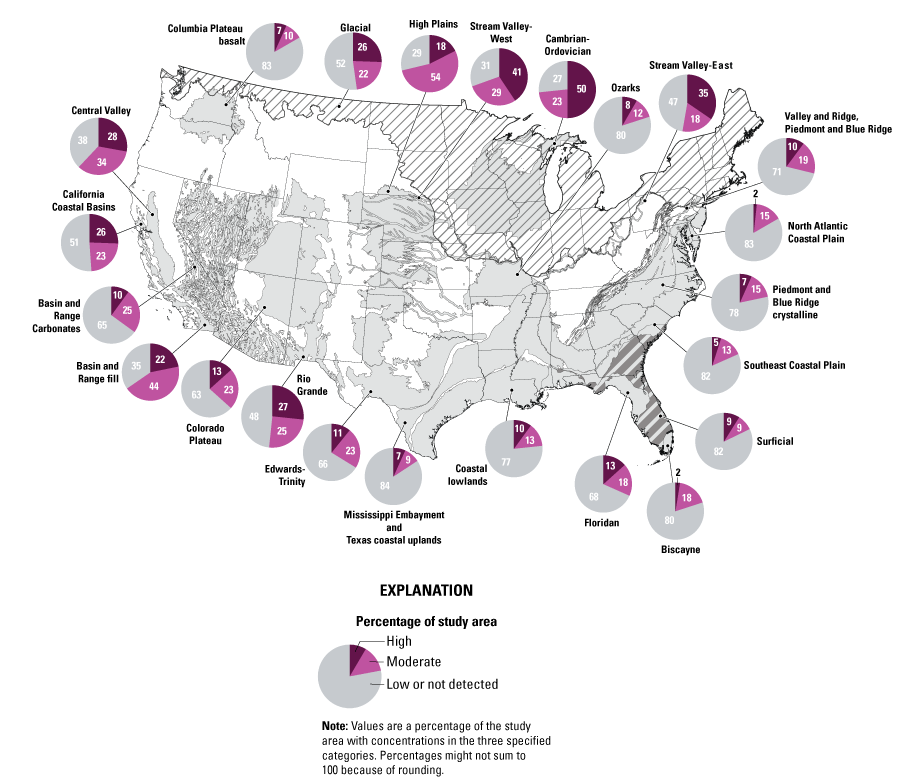
Overview of water quality in principal aquifers across the continental United States, 2013–21. Colored pie charts indicate the percentage of the area studied that contained a constituent in untreated groundwater at a concentration that exceeds a human-health benchmark for drinking water (high) or one-half of that value (moderate; Azadpour and others, 2025). Data from Belitz and others (2022). Results for selected individual constituents are also accessible in an interactive searchable map in appendix 1, figure 1.3.
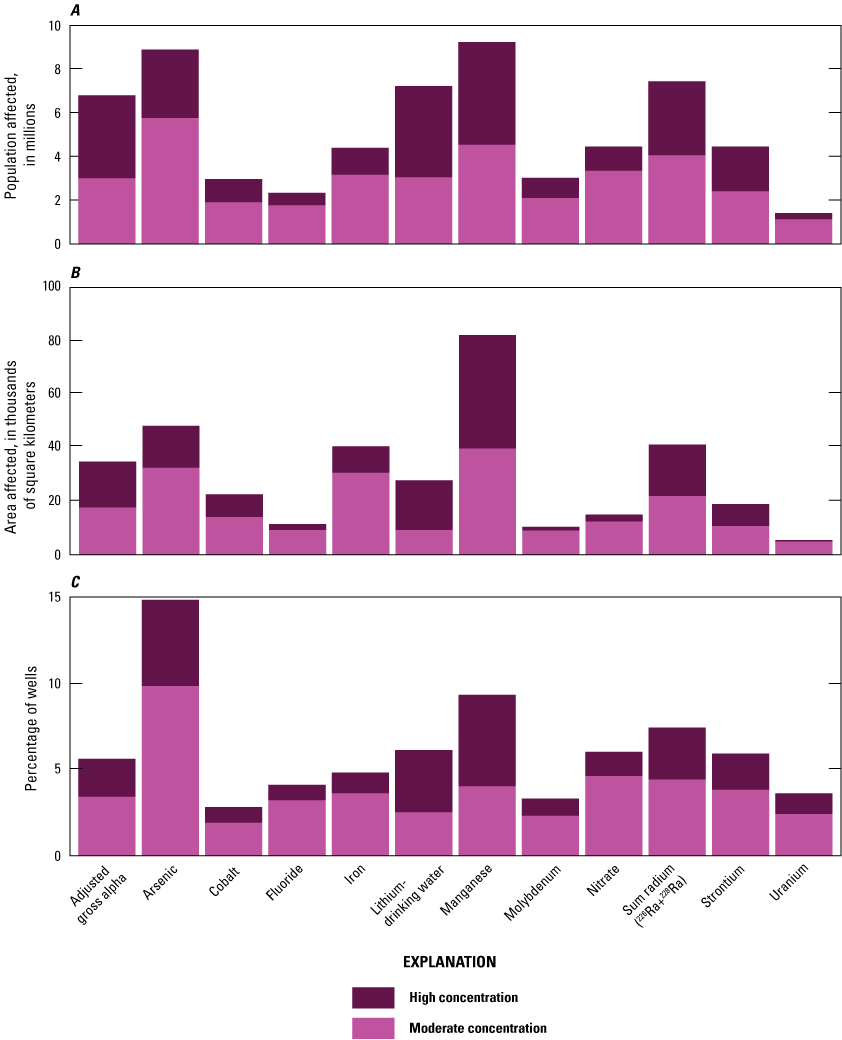
Groundwater quality summary, by geogenic constituent, of (A) population affected, (B) area affected, and (C), percentage of wells affected, in the continental United States, 2013–21, using data from Belitz and others (2022). High concentration exceeds a human-health drinking-water threshold (selected constituents are provided in table 2). Moderate concentration exceeds one-half of a threshold but is less than the threshold.
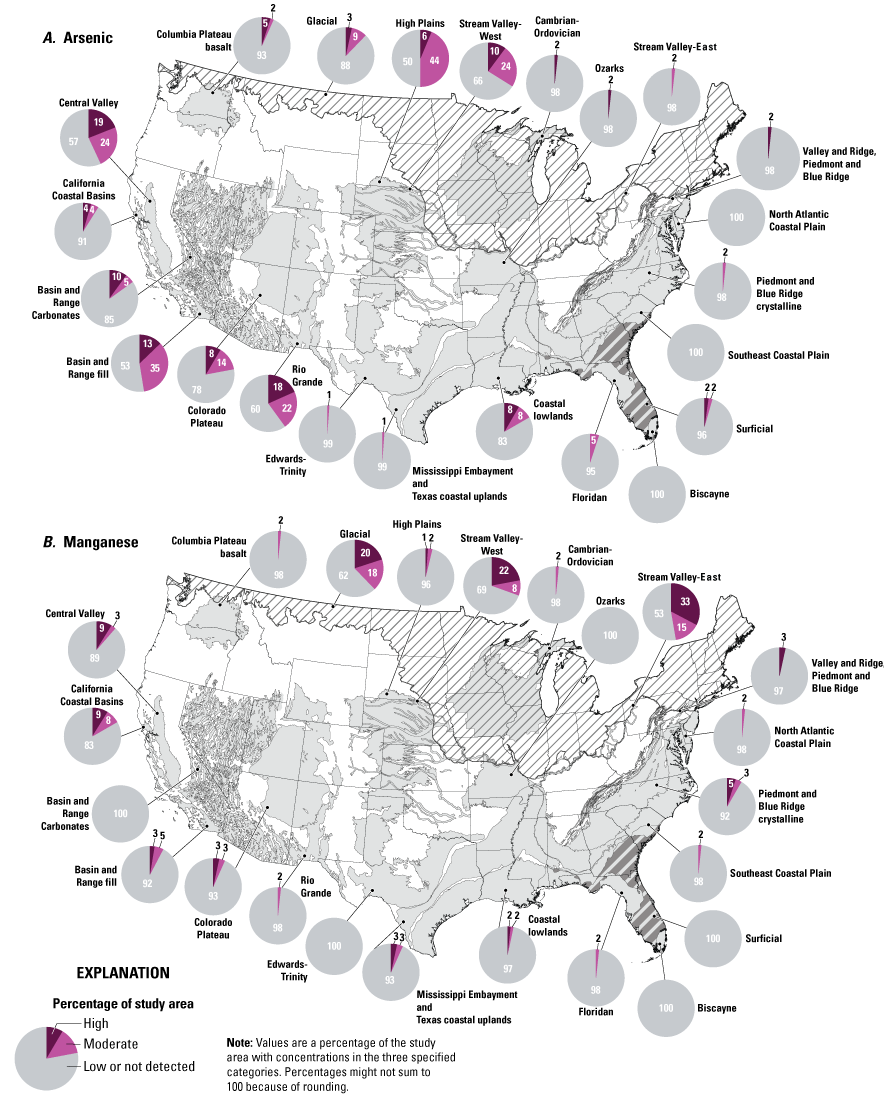
Water quality for (A) arsenic and (B) manganese across the continental United States, 2013–21. Principal aquifer locations are shown in gray or pattern. Data from Belitz and others (2022).
Selected constituents frequently found at high concentration in groundwater will be described in more detail in this section. Results for selected individual constituents are also accessible in interactive searchable maps at appendix 1, figures 1.2, 1.3, and 1.4.
Arsenic
Arsenic is frequently detected at elevated concentrations in groundwater and potentially affects the drinking-water supply quality of more than 14 million people in the CONUS (figs. 15, 16; Ayotte and others, 2017; Erickson and others, 2019a; Lombard and others, 2021a; Spaur and others, 2021; Belitz and others,2022). Exposure to inorganic arsenic is linked to increased risk of adverse health outcomes (immune, nervous, pulmonary, reproductive, and cardiovascular systems) and to cancer (skin, liver, kidney, and bladder; Naujokas and others, 2013; Jiang and others, 2015; Kuo and others, 2017; Mendez and others, 2017; Krajewski and others, 2021).
Arsenic in groundwater reflects the interaction of key factors, including geologic source, groundwater geochemistry, and geochemical processes related to hydrochemistry. Two common arsenic mobilization mechanisms are (1) release during dissolution of iron and manganese oxides in anoxic conditions and (2) desorption from solid materials under oxic, alkaline conditions (Fujii and Swain, 1995; Ayotte and others, 1999; Welch and others, 2000; Smedley and Kinniburgh, 2002; Thomas, 2007; Camacho and others, 2011; Anning and others, 2012; Erickson and others, 2019a). Geochemical factors such as the redox process or pH (not high-arsenic, solid-phase source material) are often the most important drivers of arsenic mobilization processes on a local or regional scale (Ayotte and others, 2017; Belitz and others, 2022). Results for arsenic concentrations in decadal well networks and PAs, and model results for arsenic and redox condition in groundwater are also accessible in interactive searchable maps in appendix 1, figures 1.2, 1.3, and 1.4.
Aquifers in the southwestern, southcentral, midwestern, and northeastern parts of the CONUS have high proportions of aquifers with elevated arsenic. Groundwater pumping and groundwater-level changes, inputs of carbon (for example, organic releases), and other human activities can trigger geochemical changes that mobilize arsenic from solids and into groundwater (Ayotte and others, 2011; Harte and others, 2012; Bexfield and Jurgens, 2014; Cozzarelli and others, 2016; Erickson and others, 2019b). Climate change, through many mechanisms (for example, drought and salinization), is predicted to increase the proportion of drinking-water aquifers contaminated with elevated arsenic (Lombard and others, 2021b; Erickson and others, 2024a). Managed aquifer recharge is a practice in which excess water during wet periods is stored in shallow aquifers through infiltration or in deep aquifers through direct injection. Introduction of recharge water can alter hydrologic and geochemical aquifer conditions such that arsenic and other geogenic contaminants are mobilized (fig. 17; Fakhreddine and others, 2021).
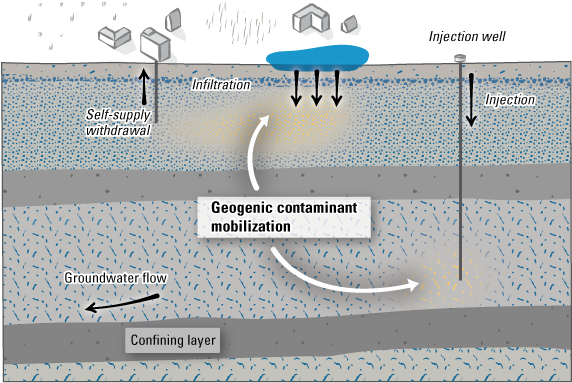
Managed aquifer-recharge methods and processes. Managed recharge—which uses water of dissimilar geochemistry from groundwater through infiltration into shallow aquifers or injection into deep aquifers—can alter hydrologic and geochemical aquifer conditions such that arsenic and other geogenic contaminants are mobilized from sediment to aqueous phase. Modified by Amanda Carr, U.S. Geological Survey, from Fakhreddine and others (2021) graphical abstract.
Manganese
Manganese is currently a secondary drinking-water contaminant, but it is being considered for possible future regulation (Eaton, 2021). Manganese is prevalent at elevated concentrations in relatively shallow groundwater under reduced conditions. Elevated manganese concentrations potentially affect the drinking-water-supply quality of more than 13 million people (domestic supply and public supply) in the CONUS (figs. 15, 16; McMahon and others, 2019; Belitz and others, 2022). Domestic wells are often drilled to shallower depths than public supply wells, so manganese may disproportionately affect domestic well users compared to people served by PWSs (McMahon and others, 2019; Belitz and others, 2022). Although manganese is an essential element, infants and children exposed to higher concentrations of manganese in drinking water (compared to lower manganese concentrations) may suffer adverse outcomes, including infant mortality, hyperactivity, and impairments to intelligence, memory, attention, and motor function (Wasserman and others, 2016; Bouchard and others, 2018; Health Canada, 2019; Kullar and others, 2019; Schullehner and others, 2020; Scher and others, 2021). Elevated manganese is also associated with cognitive impairment in older adults (Larvie and others, 2022).
Like arsenic, groundwater geochemistry influences manganese mobilization from aquifer materials to groundwater. Elevated groundwater manganese has been attributed to reductive dissolution of manganese, soil- or river-derived DOC, and acidic conditions (McMahon and others, 2019). Elevated manganese concentrations are most commonly found in the drinking-water aquifers in the Great Lakes, Midwest, Mississippi Embayment, and Northeast hydrologic regions (Ying and others, 2017; McMahon and others, 2019; DeSimone and Ransom, 2021; Erickson and others, 2021b; Belitz and others, 2022; Knierim and others, 2022).
Several types of anthropogenic activities, influences, and risk factors affect manganese release or mobilization, including (1) shifts in well pumping patterns that change groundwater flow patterns or water levels, (2) leaching of agricultural chemicals to groundwater, (3) releases of mine wastes or leachate, (4) enhanced aquifer recharge, and (5) wastewater or other organic carbon inputs (Ayotte and others, 2011; Brown and others, 2019; McMahon and others, 2019; Fakhreddine and others, 2021; Riedel and others, 2022). Changing groundwater resource stresses owing to climate change may enhance known manganese mobilization mechanisms through increased groundwater extraction, increased use of enhanced aquifer recharge, and other factors. Results for manganese concentrations in decadal well networks and principal aquifers, and model results for manganese and for manganese as a redox condition indicator in groundwater are also accessible in interactive searchable maps in appendix 1, figures 1.2, 1.3, and 1.4.
Strontium
Strontium, frequently detected at elevated concentrations in groundwater, potentially affects the drinking-water-supply quality of more than 5.5 million people in the CONUS (fig. 15; Musgrove, 2021; Belitz and others, 2022). Although not currently regulated, strontium is being considered for possible future regulation (U.S. Environmental Protection Agency, 2019b). Strontium, an alkaline-earth metal that behaves similarly to calcium, is a common trace element in rocks, soils, sediments, and waters (Musgrove, 2021). When ingested, strontium is a bone-seeking trace metal that can have adverse health effects, including strontium rickets in children and teeth mottling (Curzon and Spector, 1977; Ozgür and others, 1996; Agency for Toxic Substances and Disease Registry, 2004).
Geogenic and anthropogenic sources can cause elevated concentrations of strontium in groundwater. Geogenic strontium sources include carbonate aquifer minerals, evaporative concentration, and mixing with upwelling saline groundwater. Anthropogenic sources include fly ash and agricultural chemicals (Musgrove, 2021; Belitz and others, 2022). High concentrations of total dissolved solids are an indicator of elevated strontium. Carbonate and carbonate-containing drinking-water aquifers in Florida, Texas, the Southwest, and the Midwest most commonly have elevated strontium. Upwelling saline groundwater is also a source of strontium in some locations, including Texas and Florida. Shallow groundwater in unconsolidated sand and gravel aquifers in arid or semiarid settings also commonly has elevated strontium attributable to applied sources of strontium or evaporative concentration of dissolved constituents (Musgrove, 2021; Belitz and others, 2022).
Uranium and Other Radionuclides
Geogenic radionuclides—including uranium, radium, lead-210, polonium-210, and their isotopes—are primarily present in groundwater because of water-rock interactions of geologic materials that contain radioactive elements (Erickson and others, 2024a). The interaction of aquifer and groundwater geochemistry (for example, solubility, speciation, redox condition, pH), aquifer lithology, and hydrogeology together affect concentrations of radionuclides in groundwater (Vengosh and others, 2022).
Elevated groundwater uranium concentrations are most common in aquifers in the arid and semiarid West (Belitz and others, 2022). Uranium exposure can cause an increased risk of cancer, interference with bone chemistry, and kidney toxicity (U.S. Environmental Protection Agency, 2002; Kurttio and others, 2005; Vicente-Vicente and others, 2010), and more than 1 million people are estimated to use drinking-water-aquifer sources with elevated uranium (fig. 15; Belitz and others, 2022). A wide range of pH and redox conditions are conducive to uranium mobility, so key drivers are availability of uranium in aquifer sediments (granites and other silicic igneous rock parent material) and concentration of complexing aqueous species (dissolved inorganic carbon; Hobday and Galloway, 1999; Jurgens and others, 2010). Uranium can also be mobilized by anthropogenic activities (Jurgens and others, 2010; Nolan and Weber, 2015; Riedel and Kübeck, 2018; Tesoriero and others, 2019).
Radium and other radioactive isotope occurrences at elevated concentrations in drinking water are a human-health concern because they are known human-carcinogen sources attributable to ionizing radiation (Agency for Toxic Substances and Disease Registry, 1999; Weinhold, 2012). Radium, which is regulated as the sum of radium-226 plus radium-228, primarily occurs in low-pH groundwater or in anoxic, highly mineralized groundwater. Radium mobilization can be enhanced by road salt contamination (McNaboe and others, 2017; Lindsey and others, 2021b). Elevated radium is found in aquifers serving more than 7.5 million people (fig. 15), and is most prevalent in carbonate aquifers, particularly the Cambrian-Ordovician aquifer system (Stackelberg and others, 2018; Belitz and others, 2022). Elevated adjusted gross alpha (sum of alpha-emitting) and elevated adjusted gross beta (sum of beta-emitting) isotopes are most common in certain carbonate and surficial aquifers, including the Cambrian-Ordovician aquifer system (Szabo and others, 2020; Belitz and others, 2022). On the basis of lifetime cancer risks, lead-210 and polonium-210 in drinking-water supplies may pose human-health concerns (Seiler, 2016); however, these constituents do not have individual, enforceable human health drinking-water thresholds (U.S. Environmental Protection Agency, 2018).
Fluoride
Elevated groundwater fluoride concentrations occur when geochemical conditions are favorable to mobilize fluoride to groundwater from an existing aquifer source, such as fluorine-bearing minerals or mixing with geothermal fluids (Belitz and others, 2022; Rosecrans and others, 2022). Fluoride in drinking water at relatively low concentrations can be beneficial to human tooth and bone health; however, there are multiple adverse health effects at higher concentrations (US Department of Health and Human Services Federal Panel on Community Water Fluoridation, 2015; World Health Organization, 2017). An estimated 3.3 million people use groundwater drinking-water sources with elevated fluoride (fig. 15; McMahon and others, 2020; Belitz and others, 2022). There is a high prevalence of elevated fluoride concentration in aquifers with a wide range of hydrogeologic characteristics (Belitz and others, 2022), but higher groundwater fluoride concentrations are associated with higher pH values, higher dissolved solids and alkalinity concentrations, and deeper well depths. Lower calcium-sodium ratios and less mean annual precipitation are also associated with higher groundwater fluoride concentrations (McMahon and others, 2020).
Lithium
Lithium is widely found in groundwater at elevated concentrations when compared to either of two relevant thresholds, 10 µg/L HBSL and 60 µg/L “drinking water only” (fig. 15; Lindsey and others, 2021a; Belitz and others, 2022; Lombard and others, 2024). Health effects from elevated drinking-water lithium include inverse relations with depression, mortality from Alzheimer’s disease, suicide rates, and violent crime rates (Brown and others, 2018; Ishii and Terao, 2018; Barjasteh-Askari and others, 2020) as well as adverse effects on thyroid function (Concha and others, 2010; Broberg and others, 2011). Geogenic groundwater lithium is attributable to mineral-water interactions, evaporation, and mixing young water with continental, brackish, lithium-bearing water. Lithium is used in batteries, myriad consumer products, and medicine; anthropogenic sources of lithium include leachate from waste disposal, produced water from oil and gas wells, and human wastewater (Lindsey and others, 2021a). Elevated concentrations were prevalent in aquifers in arid regions and with older groundwater (for example, unconsolidated clastic aquifers and sandstones), but less prevalent in carbonate-rock aquifers. The findings are consistent with lithium abundance differences in major lithologies and extent of rock weathering (Lindsey and others, 2021a; Belitz and others, 2022). Model results for lithium in groundwater are also accessible in interactive searchable maps in appendix 1, figure 1.4.
Anthropogenic Constituents and Pathogens
Chloride
High chloride concentrations in groundwater contribute to groundwater corrosivity, and corrosivity increases risk of mobilization of lead and copper in plumbing systems that can cause lead contamination in drinking-water supplies (Belitz and others, 2016; Jurgens and others, 2019; Lazur and others, 2020). Chloride concentrations have increased in shallow, modern groundwater, especially in urban cold-weather areas (DeSimone and others, 2015; Hintz and others, 2022; U.S. Geological Survey, 2023). Anthropogenic sources of chloride include road salt, wastewater, and water softeners. Groundwater chloride can also increase because of climate change effects such as saltwater intrusion or evaporative concentration (Kaushal and others, 2021). Elevated groundwater chloride concentrations can affect drinking-water availability (DeSimone and others, 2015; Levitt and Larsen, 2020; Hintz and others, 2022) and ecological water availability owing to chloride input to streams through groundwater discharge (Kaushal and others, 2021; Hintz and others, 2022). Contamination from road salt can also mobilize radium and other geogenic constituents (McNaboe and others, 2017; Kaushal and others, 2021; Lindsey and others, 2021b). Brackish groundwater and produced water from oil and gas production, which also have substantial chloride concentrations, are discussed in more detail in the “Alternative Water Resources” section.
Nutrients
Nitrate is the only nutrient commonly found at high concentrations in groundwater, with more than 5.5 million people estimated to use drinking-water aquifers with elevated concentrations of nitrate (fig. 15; Belitz and others, 2022; Ransom and others, 2022). The drinking-water standard protects infants less than 6 months old, who are at risk of developing methemoglobinemia or “blue baby syndrome” from excess nitrate in drinking water (Ward and others, 2018). Although there are geogenic sources of nitrate, most of the elevated nitrate is attributable to anthropogenic sources such as fertilizer, manure, and human wastewater. The measured or modeled likelihood of exceedance of the drinking-water standard is related to manure and fertilizer application, agricultural land use, and climate (Pennino and others, 2020; Ransom and others, 2022). Nitrate degrades in anoxic aquifer conditions, so elevated nitrate is primarily found in modern groundwater that has oxic conditions. Aquifers in the Central Valley of California, the Midwest, and the central Southwest are most affected by elevated nitrate concentrations.
Groundwater movement and transport of stored legacy nitrate can be an important source of nitrate to streams (Van Meter and others, 2016). Groundwater transport of nitrate at concentrations much lower than current drinking-water standards can contribute to HABs through discharge to surface water. Because of a growing USGS nitrate dataset and collaboration with academia, progress is being made in the further identification of the spatial distribution and type of nitrate input sources in groundwater (Boshers and others, 2019). Sources and processes affecting individual samples or regions identified in previous studies are being confirmed through analysis of machine-learning model results from drinking-water supply depths (Ransom and others, 2022) and shallow depths with additional source/input-related predictor variables (Ransom and Kauffman, 2023). Model results for nitrate in groundwater are also accessible in interactive searchable maps in appendix 1, figure 1.4.
Pesticides
Pesticides and their degradates are anthropogenic constituents used to control plant and insect pests in urban and agricultural areas. Pesticide detections are associated with agricultural and urban areas in modern-age groundwater in shallow wells or aquifers with karst features. Atrazine, metolachlor, and their degradates were among the most frequently detected pesticides. Although detection of pesticides and their degradates is common, the concentrations of pesticide and pesticide degradates in public supply wells did not exceed a benchmark or estimated benchmark, even when considering mixtures and degradates without benchmarks (Bexfield and others, 2021); only 0.6 percent of samples had an elevated concentration (Belitz and others, 2022). In shallow monitoring wells in urban and agricultural areas, pesticide concentrations exceeded thresholds at a higher rate than in domestic wells (DeSimone and others, 2015).
Per- and Polyfluoroalkyl Substances
Per- and polyfluoroalkyl substances (PFAS), a large group of chemicals with numerous anthropogenic sources, were described in section “Per- and Polyfluoroalkyl Substances” under the Quality of Surface-Water Resources heading of this chapter. Although a national-scale study of PFAS in groundwater has not yet been completed, PFAS have been widely detected in groundwater. In a study of seven drinking-water well networks in aquifers in the Eastern United States, 14 of the 24 analyzed PFAS were detected in groundwater, with 60 and 20 percent of public-supply and domestic wells, respectively, containing at least one PFAS detection (McMahon and others, 2022). In an expanded study of more than 30 networks in aquifers in the continental United States, 18 PFAS compounds were detected in groundwater, with 43 and 17 percent of public-supply and domestic wells, respectively, containing at least 1 PFAS detection (Tokranov and others, 2024). Model results for PFAS in groundwater are also accessible in interactive searchable maps in appendix 1, figure 1.4. USEPA risk-level standards for human and aquatic organism health are evolving to lower concentrations such that in the future any detection may indicate exceedance of standards (U.S. Environmental Protection Agency, 2016c, 2016d, 2022b, 2024a, 2024b, 2024c383384385). USEPA is establishing drinking-water standards for selected PFAS, and the new primary drinking-water standards may have threshold concentrations that are less than the current method detection levels PFAS (U.S. Environmental Protection Agency, 2024a). In addition to being a drinking-water hazard, persistent PFAS plumes found in groundwater can eventually discharge into surface water bodies and surface-water, drinking-water sources, which then can affect the health of downstream aquatic organisms and humans.
Microbial Pathogens
Microbial pathogens, such as bacteria and viruses, can cause gastrointestinal disease in humans; in a recent review, five pathogens were responsible for most disease outbreaks: norovirus, Campylobacter, Shigella, hepatitis A and Giardia (Murphy and others, 2017). Untreated groundwater supply (water supply that is not disinfected) is at high risk for causing gastrointestinal disease (Murphy and others, 2017; Burch and others, 2022).
Although a national-scale synthesis of microbial pathogens in groundwater has not been published, State-scale and regional-scale studies can provide information about why microbial pathogens are found in groundwater in a wide range of aquifers and hydrogeological conditions (Stokdyk and others, 2020; Borchardt and others, 2021; Burch and others, 2022; Stokdyk and others, 2022). Sources of pathogens are common in the environment (septic waste, animal waste, leakage from sanitary sewer pipes, urban stormwater), and rapid transport of pathogens deep into aquifers is possible (Bradbury and others, 2013; Hunt and others, 2014; Murphy and others, 2020; Stokdyk and others, 2020; de Lambert and others, 2021). Transport of pathogens to drinking-water wells is associated with precipitation events and karst aquifer systems (Bradbury and others, 2013; Murphy and others, 2020). These findings merit consideration because disinfection is not required for groundwater-sourced, public drinking-water systems unless the system has been determined to be under the influence of surface water; domestic well water has no disinfection requirement (U.S. Environmental Protection Agency, 2006, 2022a).
Groundwater Societal Factors
Equity of drinking-water quality can be evaluated using societal factors such as income, race, proximity to pollution sources, drinking-water source, and knowledge (or lack of knowledge) about environmental conditions. Recent research highlights that societal factors including historical economic and racial disparities relate to drinking-water-quality inequities (Cutter and others, 2003; Tanana and others, 2021; Nigra and others, 2022; Ravalli and others, 2022). For example, Ravalli and others (2022) reported that barium, chromium, selenium, and uranium are highest in public water supplies serving Hispanic communities. Nigra and others (2022) found that public water supplies serving low-income populations are more likely to have high arsenic concentrations. Some Native American tribal communities depend on private domestic well water that has high uranium and arsenic concentrations or is near historical mines (Tanana and others, 2021). Because of the absence of required water testing or water treatment, people with domestic wells as their drinking-water source are more prone to exposure to contaminants compared to people served by PWSs (Gibson and others, 2020; Spaur and others, 2021). Studies have shown that, although arsenic exposure declined for people served by PWSs after the 2006 arsenic MCL was lowered to 10 µg/L from 50 µg/L, it did not decline for people using domestic wells (Nigra and others, 2017; Welch and others, 2018). There are substantial socioeconomic disparities in domestic well testing and home water treatment in the United States attributable to cost and other factors (Flanagan and others, 2016; Malecki and others, 2017; Yang and others, 2020). Predominantly Hispanic and African American communities rely on domestic wells in some areas because of historical barriers to PWS access (Wilson and others, 2008; Gibson and Pieper, 2017; Purifoy, 2021). Violations of the arsenic and radionuclide rules were associated with higher modified Social Vulnerability Index (mSVI categories; Scanlon and others, 2023). Although arsenic and radionuclide violations in PWSs are driven primarily by physical factors such as arid climate, the length of time a facility remained in violation of drinking-water standards was related to mSVI categories (Scanlon and others, 2022; Scanlon and others, 2023). Tribal PWSs have a disproportionate number of drinking-water rule violations, with about 30 percent of people affected by a health-based violation compared to about 10 percent across the CONUS. The Tribal system violations are primarily attributable to violations of the Groundwater Rule, Revised Total Coliform Rule, and Arsenic Rule (Scanlon and others, 2023).
Groundwater–Surface Water Interactions and Chemical Mixtures
Groundwater Flow Path, Contaminant Residence Time, and Groundwater–Surface Water Interactions
Stream base flow can be an important pathway for many groundwater-quality constituents to enter and mix with surface waters. Surface water can also recharge groundwater in losing stream reaches, through subsurface losses from reservoirs, or intentionally through enhanced or managed infiltration intended to store groundwater for water supplies. Storage and transport through the subsurface can delay the delivery of contaminants to streams; for example, road salt (Rossi and others, 2022), nitrogen (Spahr and others, 2010b; Sanford and Pope, 2013; Tesoriero and others, 2013; fig. 18), and endocrine-disrupting compounds and other agricultural contaminants (Thompson and others, 2021). Salt pollution that enters groundwater can become a dominant source to surface waters during base-flow conditions. During low-flow times of the year, biota may be adversely affected by fluctuation in water quality during a sensitive lifecycle period, such as for spawning success (Malcolm and others, 2004). Groundwater inputs to streams also provide important temperature refugia by buffering stream temperatures for some cold-water species like trout (Snyder and others, 2015).
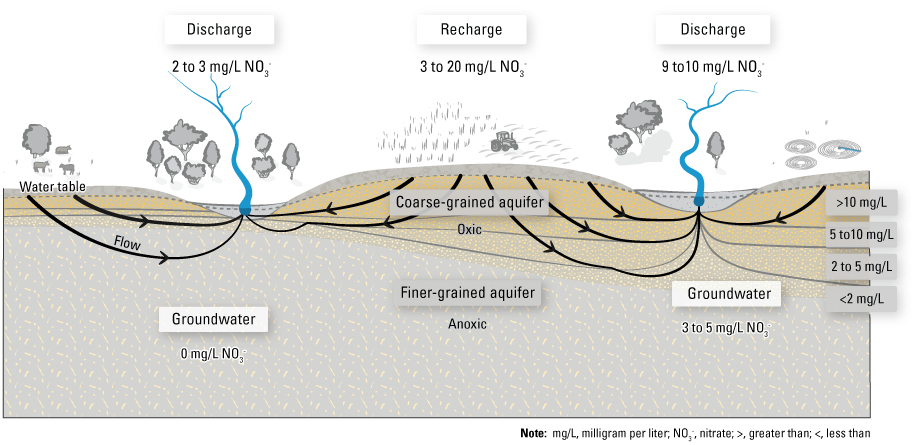
An example of how groundwater geochemical conditions and flow paths (arrows) influence nitrate concentration distributions in shallow oxic and deeper anoxic groundwater and resulting contaminant contributions to streamflow. Flow paths through anoxic conditions foster denitrification to lower nitrate concentrations, but flow paths in oxic conditions allow nitrate to remain unchanged. Nitrate (NO3-) shown in milligrams per liter (mg/L) as nitrogen (N). Modified by Amanda Carr, U.S. Geological Survey, from Winter and others (1998).
Base-flow nitrogen loading from groundwater to surface water can be substantial (Spahr and others, 2010b; see fig. 18 example). Estimates of nitrogen loading from base flow generated from results of a machine-learning model of groundwater nitrate concentrations (Ransom and others, 2022) are currently (2024) being evaluated as SPARROW input. Microbial pathogens in surface water and stormwater can be transported through infiltration to drinking-water wells when groundwater is “under the influence” of surface water (Stokdyk and others, 2019; de Lambert and others, 2021).
Several tools are available to help scientists determine groundwater susceptibility to contamination from mobilization of geogenic contaminants or from surface-loaded anthropogenic contaminants. Environmental tracer and dissolved gas concentrations can be used to determine groundwater age using interactive workbook programs, including lumped parameter modeling (TracerLPM; Jurgens and others, 2012, 2016) and Dissolved Gas Modeling and Environmental Tracer Analysis (DGMETA; Jurgens and others, 2020). Lumped parameter models developed with TracerLPM have been used in national efforts for evaluating age-tracer data in local and regional studies of groundwater contaminant trends. DGMETA is used to model dissolved-gas concentration data for age tracers and reactive biogeochemistry, including denitrification. A Groundwater Age Mixtures and Contaminant Trends Tool (GAMACTT) has been developed to guide users through the process of evaluating how groundwater age distributions from TracerLPM and changing surficial contaminant inputs affect anthropogenic contaminant trends in water-supply wells and other groundwater discharges (Böhlke and others, 2014a, 2014b). Age-tracer modeling results from TracerLPM have been shown to be equivalent to particle-tracking age results produced from much more complex models (Eberts and others, 2012). Differing contaminant trends, groundwater-age distributions, and hydrogeologic settings of aquifer water supplies can be related with the new tools (Eberts and others, 2012; Lindsey and others, 2017). Basic water chemistry results can also be evaluated to determine the groundwater redox condition using an interactive workbook program (Jurgens and others, 2009). GAMACTT and these other related tools and principles for evaluating groundwater supplies for contaminant susceptibility and trends evolved from USGS water-quality and research studies. Examples of the many of studies that used these tools include Böhlke and others (2007, 2009)41, Levitt and other (2019), and Lindsey and others (2017).
Multiple Stressors and Contaminant Mixtures
Although aquatic-life thresholds are based on single water-quality constituents in isolation, water-quality constituents are typically altered in combination (sometimes referred to as “stressor mixtures” or “urban stream syndrome”). Typically, ecological degradation is observed in streams that drain urban land, with degradation driven by common landscape or anthropogenic changes (Walsh and others, 2005). In the context of these co-occurring stressor mixtures, causal attribution for the primary stressor(s) causing ecological impairment can be challenging and biased by disproportionate monitoring foci (Fanelli and others, 2022). For example, stressor studies from the USGS have emphasized the important harmful role of contaminants (especially insecticides, herbicides, and metals) on ecological outcomes, which are rarely measured in standard monitoring protocols (Schmidt and others, 2019; Waite and others, 2019, 2021). Additionally, stressor mixtures can have interactive effects—whereby the exposure to multiple elevated water-quality constituents might have additive or multiplicative effects on biota unlike when considered in isolation—and have been shown to be important in USGS assessments across the country (Waite and others, 2021). A multi-region assessment of chemical mixtures evaluated the cumulative effects of contaminant mixtures in wadable urban- and agriculture-gradient streams across the United States (Bradley and others, 2021). Overall, identification tools have been developed to identify limiting stressors in causal assessments on ecological condition within stressor mixtures, such as the USEPA’s Causal Analysis/Diagnosis Decision Information System (CADDIS) tool (U.S. Environmental Protection Agency, 2022c), when comprehensive, multiple-stressor studies cannot be conducted (Waite and others, 2021).
Although drinking-water contaminants are regulated individually, multiple drinking-water contaminants can occur together at elevated or high concentrations (Ryker, 2014; Scanlon and others, 2022; Barber and others, 2024; Erickson and others, 2024a). Little information exists regarding human health exposure risks from mixtures of drinking-water contaminants. Although much groundwater geochemical data exist, little interpretive work has analyzed groundwater contaminant mixtures. In many PWSs, drinking-water supply comes from surface water and groundwater sources (Johnson and others, 2021; Johnson and others, 2022), which can result in potentially different mixtures of constituents in source water.
Alternative Water Resources
Wastewater Reuse
A review of water-quality knowledge gaps related to wastewater is presented in Tesoriero and others (2024a, chapter D), and some of the most important considerations are summarized here. Wastewater reuse can be intentional or incidental (for example, incidental where municipal wastewater discharges to a stream that has a public water supply intake downstream). Wastewaters are a substantial source of CECs to surface water and groundwater. CECs in wastewater include pharmaceuticals and personal care products, PFAS, and numerous industrial chemicals (Glassmeyer and others, 2005; Elliott and others, 2018a, 2018b; Fork and others, 2021). A substantial gap in knowledge exists regarding direct and indirect water-quality degradation from anthropogenically used water that is returned to surface water or infiltrated to groundwater.
Barber and others (2024) identified wastewater categories that are most suitable for reuse, as well as challenges to purposeful water reuse (U.S. Environmental Protection Agency, 2020c). The National Water Reuse Action Plan (U.S. Environmental Protection Agency, 2020c) provides useful data and outcomes to promote water reuse in the face of climate change. A needed tool is a scheme that allows cross-comparison of different water-quality or toxicity benchmark measurements; for example, drinking-water thresholds compared to aquatic-life benchmarks. Municipal wastewater is an example of a complex chemical mixture of CECs that is often reused. Field and laboratory-based studies could assess complex mixtures of CECs and the effects of their transformation products on water quality following methods similar to work in Colorado and Iowa (Bradley and others, 2007; Barber and others, 2011, 2013; Zhi and others, 2020, 2021; Webb and others, 2021).
Brackish Groundwater and Sea Water
Brackish water resources (with dissolved-solids concentrations of 1,000–10,000 milligrams per liter) may be a partial solution to increasing water demands; beneficial use limitations and unknowns were described in McMahon and others (2016). The most common brackish groundwater categories are mixed cation-sulfate, sodium-chloride, sodium, sulfate, calcium-sulfate, and sodium-bicarbonate. Within brackish groundwater, high mineral saturations for barite, calcite, and chalcedony are common; high concentrations of arsenic, boron, fluoride, nitrate, and uranium are also common (McMahon and others, 2016). Because brackish groundwater and sea water have high concentrations of ions and high mineral saturation, traditional treatment systems, such as reverse-osmosis systems, may have efficacy or operational problems (mineral precipitation).
Stanton and others (2017) estimated the distribution of saline and brackish groundwater in the United States by using a compiled well-chemistry database. The most extensive occurrence of brackish groundwater was observed in a wide band in the Central United States that extends from Montana and North Dakota in the north to Texas and Louisiana in the south, along the coastline in States along the Atlantic Coast, and in many other States. Within four regional areas defined in their report, Stanton and others (2017) described brackish groundwater resources by geochemical characteristics, depth encountered, principal aquifer system, and volume. In the Coastal Plains region, about 23 percent of the grid-cell volume contained brackish groundwater, mostly 50–1,500 feet (ft) below land surface, and most commonly in the Intermediate, Southeastern Coastal Plain and Coastal lowlands aquifer systems. In the Eastern Midcontinent, about 16 percent of the observed grid-cell volume had brackish groundwater 0–3,000 ft below land surface, with most groundwater deeper than 1,500 ft being brackish. The Marshall aquifer, Silurian-Devonian aquifers, Mississippian aquifers, and New York and New England carbonate-rock aquifers had the highest percentages of brackish groundwater. About 50 percent of the observed grid-cell volume had brackish groundwater in the Western Midcontinent region, primarily at depths of 0–3,000 ft. The highest proportions of brackish groundwater were in the Blaine aquifer, the Upper Cretaceous aquifers, the lower Tertiary aquifers, the Pecos River Basin alluvial aquifer, the Lower Cretaceous aquifers, and the Seymour aquifer. The Southwestern Basins region had brackish groundwater observed in 31 percent of the grid-cell volume, mostly at depths of 50–1,500 ft below ground surface, with all considered principal aquifers having substantial volumes of brackish groundwater. The chemical composition of brackish groundwater varies widely because of differences in geologic setting and associated hydrologic and geochemical processes. The diversity in water composition, geochemical processes, and water-use needs differ across the United States, which has important implications for the feasibility and cost of using brackish groundwater. For example, brackish groundwater may be oversaturated with respect to barite (BaSO4), calcite (CaCO3), or chalcedony (SiO2), which could lead to precipitation of solids (scaling) during conveyance, storage, or treatment (Stanton and others, 2017). The use of saline and brackish water resources is projected to increase, and Conaway and others (2024b) present a detailed description of some of the most important considerations and water-quality knowledge gaps related to sustainably using increased volumes of brackish water. We provide a summary here.
The mapped distribution of brackish groundwater could be improved using additional existing geochemistry data and adding existing geophysical data (surface geophysical surveys and borehole logs) to refine spatial resolution. Borehole logs of electrical properties could improve resolution of salinity gradients, which are needed for delineating boundaries and determining volumes of fresh, brackish, and saline groundwater (Williams and others, 2016; Stephens and others, 2019). Borehole logs could also be used to refine the distribution of geologic features that control the distribution of groundwater salinity. The subsurface distribution of important hydrogeologic properties such as porosity, permeability, recharge or discharge, confinement, and connection with adjacent aquifers could be refined with three-dimensional geologic maps, borehole descriptions, well yields, and pump tests. Variability in the chemical composition of brackish and saline water resources affect the evaluation of water treatment needs and the design of treatment processes, so improved geochemical modeling tools could assist water treatment and planning. Predictive models for geochemical water type in groundwater based on local geologic, hydrologic, and climatic conditions may be considered to better inform decisions by water managers.
Sea-level rise is expected to affect water availability in coastal areas. Understanding the effects of sea-level rise on water availability is crucial because 2017 census data show that 94.7 million people (29 percent of the U.S. population) lived in coastline counties (Cohen, 2019). Vengosh (2014, p. 338) describes saltwater intrusion as “one of the most widespread and important processes that degrades water-quality to levels exceeding acceptable drinking and irrigation standards.” Sea-level rise can be expected to accelerate saltwater intrusion into groundwater of coastal carbonate aquifers, other aquifers composed of porous and permeable materials, and likely all coastal aquifers (Ferguson and Gleeson, 2012; Wdowinski and others, 2016; Costall and others, 2020). Drinking and irrigation water on the Hawaiian Islands and other volcanic islands may be particularly vulnerable to effects from sea-level rise.
Sea-level rise also promotes the upstream advance of the saltwater wedge in coastal rivers. For example, in the Delaware River Basin, the upstream advance of saltwater may require moving the intake for the water supply of Philadelphia (Hurdle, 2021), a city of about 1.6 million people. Inundation of coastal soils can also lead to arsenic and other geogenic contaminant mobilization, but the potential magnitude of the problem and full effect is unknown (LeMonte and others, 2017).
Produced Water
Oil and gas development, using either conventional and unconventional wells, requires large volumes of water and results in large volumes of produced water. The USGS has compiled an online database of analytical results from samples of produced water. The linked online mapper of sample locations shows that oil and gas development and produced water discharge is most common in California and Nevada, central interior States from Montana to Texas to Alabama, Midwest states, and parts of Alaska (Blondes and others, 2018; U.S. Geological Survey, 2022). Produced water typically has high salinity, high radionuclide concentrations, high trace element (for example, arsenic) concentrations, and proprietary chemical additives (Harkness and others, 2015; Chaudhary and others, 2019; McDevitt and others, 2019; Conrad and others, 2020; Yazdan and others, 2020; Cooper and others, 2022). Produced water has conventionally been considered a waste product. In 2012, an estimated 90 percent of produced water was reinjected (onsite disposal well, off-site disposal well, or enhanced recovery use; Clark and Veil, 2009; Veil and Clark, 2011). In some areas, produced water can be released to surface water under the National Pollutant Discharge Elimination System permitting process (McDevitt and others, 2019; Cooper and others, 2022). Produced water reuse, especially in semiarid and arid regions, could reduce demand on freshwater supplies (Zemlick and others, 2018; Conrad and others, 2020; Cooper and others, 2022).
Recent review papers highlight potential best-fit, beneficial-use targets as well as summarize the myriad benefits and challenges for reuse of produced water (Conrad and others, 2020; Cooper and others, 2022). Comparison in New Mexico shows the competitiveness of total energy costs for treatment and reuse of produced water for fracking compared to extraction of fresh groundwater (Zemlick and others, 2018). On-site or proximal reuse of produced water in oil and gas production would often require the least amount of treatment (Conrad and others, 2020). Reuse in salt-tolerant, non-consumable crop irrigation (for example, cotton) would require substantial reduction of salts, metals, and other constituents, likely necessitating primary and secondary treatment. Additional research would benefit development of effective and efficient treatment technologies aimed at irrigation reuse of produced water (Conrad and others, 2020; Cooper and others, 2022). The most restrictive treatment requirements apply to reuse as potable water, which would require conformance to drinking-water regulations for inorganics, organics, and bacteria (U.S. Environmental Protection Agency, 2018). Challenges to widespread adoption of produced-water reuse for irrigation and potable supply include a lack of standard analytical methods and standards for testing treated water (Conrad and others, 2020), technological challenges, and water-delivery challenges (Cooper and others, 2022).
Summary
Degradation of water quality can make water harmful or unusable for humans and ecosystems. Although many studies have assessed the effect of individual constituents or narrow suites of constituents on freshwater systems, no consistent, comprehensive assessment exists over the wide range of water-quality effects on water availability. Inconsistent or nonexistent criteria, data, and models challenge national-scale, comprehensive assessment. Using literature reviews, this chapter moves towards a comprehensive assessment by summarizing how selected anthropogenic and geogenic water-quality constituents affect water availability for human and ecosystem needs at the national scale. Several types of human health, agricultural, and ecological beneficial-use standards or thresholds were used to provide context for categorizing surface-water and groundwater quality. Presented results rely primarily on published studies, data, and models of national and regional water quality completed in the United States during 2010–20.
Human beneficial uses of water are affected by a range of water-quality problems. Nationally, elevated concentrations of geogenic constituents such as arsenic, manganese, strontium, radium, and adjusted gross alpha together affect extensive areas and millions of people using groundwater aquifers for drinking water across the country. Collectively, elevated geogenic constituent concentrations affect more than 30 million people, with the largest affected groundwater-dependent populations using three aquifers: two of the western unconsolidated aquifer groups (California Coastal Basin aquifers and Basin and Range basin-fill aquifers) and the Glacial aquifer. Nitrate can also have high concentrations in groundwater with considerable co-occurrence of geogenic constituents at elevated concentrations. Additionally, about one-third of stream miles assessed for surface-water-sourced, drinking-water supply are impaired with respect to drinking-water use, most commonly because of non-mercury metals and salinity. At least 45 percent of the Nation’s tap water is estimated to have one or more per- and polyfluoroalkyl substances (PFAS), with higher probabilities of PFAS exposure in urban as compared with rural areas. PFAS profiles and estimated median cumulative concentrations were similar among private wells and public-supply tap water.
Numerous other beneficial uses can be affected by water quality, including recreation, fish consumption, navigation, and agricultural and industrial uses. Increasing surface-water salinity has been linked to an increased potential for corrosion of drinking-water infrastructure and mobilization of lead. Agricultural beneficial uses of water can be limited by trace elements, salinity, and pH. Excess sediment can smother bed habitat, reduce river-channel capacity, hinder navigation, fill in reservoirs, and reduce dam function. Sediment can also function as a vector to hold and transport other pollutants, such as nutrients, microbial pathogens, and other sediment-bound contaminants. Human fish consumption is limited by health concerns in about one-third of assessed stream miles because of high concentrations of mercury, polychlorinated biphenyls, and pathogenic bacteria. Recreational use of water (for example, swimming) is also limited in about one-third of assessed stream miles, most commonly because of microbial pathogens that can cause waterborne infections (with young children being particularly vulnerable) and harmful algal blooms (HABs) resulting from excess nutrients. Numerous constituents, including PFAS, do not have established thresholds for many human beneficial uses.
Almost one-half of the assessed stream miles in the United States do not support ecological uses because of impairments from anthropogenic sources, including elevated concentrations of water-quality constituents—particularly nutrients, sediment, temperature, pathogens, salinity, and pesticides. Much of the country had nutrient concentrations, which were at least double the estimated near-reference conditions, with localized regions containing nutrient concentrations tenfold or greater than near-reference conditions. Across the conterminous United States, primary sources vary spatially, and include fertilizer and manure, atmospheric deposition, wastewater treatment plants, urban land, and a range of natural sources including stream channel and geologic sources. Excess nutrients (nitrogen and phosphorus) can contribute to eutrophication and disrupt many other ecosystem functions, including ecosystem productivity, food webs, and species community composition. Eutrophication is also a main driver of HABs, which can cause food-web impairment and indirectly cause hypoxia (that is, low dissolved oxygen [DO]), resulting in fish kills, and can have toxic effects on humans, pets, and other wildlife.
Fine sediment deposition can affect ecosystems by smothering bed habitat for biota and increasing consumption of DO required by aquatic organisms. SPAtially Referenced Regressions On Watershed models estimate important sources of suspended sediment across the country including agricultural land, forested areas, stream channels, and geologic sources. Increased sediment can be caused by the anthropogenic erosion of sources in the uplands (especially agricultural and urban land uses), which can alter vegetation cover, make soils more erosion-prone, and concentrate the erosive forces of surface runoff. U.S. Geological Survey (USGS) streamgage data across large spatial scales highlight that water temperatures generally correspond with air temperature gradients (for example, colder in the north and in mountainous areas) with important outliers that highlight key anthropogenic alterations, such as bottom-releases of water from dams and other impoundments. State-identified temperature impairments are predominantly located in the Western United States, but temperature is a major management focus across the country for the persistence and availability of cold-water habitats for specific fish communities.
Nationwide, the predominant source of dissolved solids (salinity) is geologic materials in 89 percent of the catchments, with road deicers and other anthropogenic activities responsible for the source in 11 percent of catchments. Catchments with dissolved solids that originated predominantly from geologic sources or from urban lands are found across much of the Nation. Dissolved solids originating predominantly from road deicers are largely found in the Northeast, and catchments with dissolved solids that originated predominantly from cultivated or pasture lands are largely found in the West. Salinity has been found to be increasing in much of the country, posing threats to water availability. High-resolution salinity data are often beneficial to detect short-term, acute, aquatic-life exceedances, and many assessments may underestimate the effects of increasing acute exceedances of salinity on ecological water availability.
Pesticides and their degradates are regularly detected in surface waters in all regions of the country, although few are currently listed under regulatory impairments. In national monitoring, nearly all sites have at least one exceedance of aquatic-life thresholds, but exceedances for human health are rare. Although the potential risk of aquatic-life exceedances is high across all regions of the country, the Midwest has the greatest detection frequency in surface-water samples. Despite the range of pesticides and degradates present in surface waters, exceedances predominantly occurred with a relatively small number of compounds. The herbicides atrazine and metolachlor and insecticide imidacloprid were the pesticides most commonly exceeding benchmarks, but many pesticide compounds and degradates do not have established thresholds. At environmental concentrations, pesticides in rivers and stream can have lethal effects on nontarget organisms and sublethal effects on behavior, physiology, and endocrinology, affecting not only ecological communities, but also creating problems in fish health that affect fish consumption uses for humans. Groundwater pesticide detections are associated with agricultural and urban areas in modern-age groundwater in shallow wells or aquifers with karst features, with atrazine, metolachlor, and their degradates among the most frequently detected. Although detection is common, the concentrations of pesticide and pesticide degradates in public supply wells did not exceed a benchmark or estimated benchmark, even when considering mixtures and degradates without benchmarks. Pesticide concentrations exceeded thresholds at higher rates in shallow monitoring wells in urban and agricultural areas than in domestic wells.
Numerous water-quality constituents have effects on water availability that are currently unknown, underexplored, or without thresholds for various beneficial uses. Co-occurrence and mixtures of multiple water-quality constituents can have compounding negative effects on water availability; however, co-occurrence and mixtures do not have standards or thresholds (standards and thresholds are single-constituent). Little information exists regarding human-health exposure risks from mixtures of geogenic and anthropogenic drinking-water contaminants. Although much groundwater geochemical data exist, little interpretive work has analyzed groundwater contaminant mixtures. Mixtures of multiple pesticides in surface water can cause compounding toxicity problems to aquatic life, and multi-stressor studies across the country indicate that various pesticides and their degradates were commonly the top causes of degraded algal, fish, and macroinvertebrate conditions. USGS stressor studies have emphasized the important harmful role of contaminant mixtures—especially insecticides, herbicides, and metals—in ecological outcomes, which are rarely measured in standard monitoring protocols. Detections of individual pharmaceutical compounds are most commonly at concentrations less than human-health benchmarks. Individual and mixtures of pharmaceutical compounds, however, are found in rivers and streams (including headwaters without wastewater discharge) and can have numerous effects on local ecosystems. Effects include change in aquatic species behavior, health, and mortality, contributing to antibiotic-resistant bacteria, feminized fish, and increased fish susceptibility to predation. PFAS are a large, varied group of chemicals currently without standards; draft standards indicate that PFAS may limit future water availability for human beneficial uses and ecological health. Recent studies indicate widespread PFAS detections in drinking water, and some PFAS can bioaccumulate through trophic levels, leading to potential human exposure through fish consumption. PFAS ecosystem effects are an active area of research.
Climate change and anthropogenic activities can intensify the mobilization and transport of geogenic trace elements and radionuclides in groundwater. Conditions and processes include drought, managed aquifer recharge, salinization, anthropogenic chemicals, and groundwater-level changes. A substantial gap in knowledge exists regarding direct and indirect water-quality degradation from anthropogenically used water that is returned to surface water or infiltrated to groundwater and later reused.
Interactions between groundwater and surface water can influence the water quality of each water source. Because of transport times ranging from decades to centuries, groundwater with anthropogenic contamination by nitrate, chloride, and other constituents is an ongoing, long-term source of contaminant inputs to surface water. Groundwater discharge to streams, which can integrate anthropogenic and geogenic sources, can be an important source of salinity and nitrogen to streams. Additionally, persistent PFAS plumes found in groundwater eventually discharge into surface-water bodies and surface-water, drinking-water sources, which then can affect the health of downstream aquatic organisms and humans. Recharge can also transport constituents from surface water to aquifers.
Alternative water resources do or could contribute to increasing water availability. Wastewater reuse can provide water efficiency and may be intentional (for example, internal reuse within an industrial facility) or incidental (for example, municipal wastewater discharge to a stream that has a public water supply intake downstream). The U.S. Environmental Protection Agency’s National Water Reuse Action Plan provides useful data and outcomes to promote water reuse in the face of climate change. Brackish water resources (dissolved-solids concentrations of 1,000–10,000 milligrams per liter) may be a partial solution to increasing water demands for some beneficial uses, and recent publications summarize beneficial-use limitations and unknowns. The most extensive occurrence of brackish groundwater is observed in a wide band in the Central United States that extends from Montana and North Dakota in the north to Texas and Louisiana in the south, along the coastline in States along the Atlantic Coast, and in many other States. The chemical composition of brackish groundwater varies widely because of differences in geologic setting and associated hydrologic and geochemical processes. The diversity in water composition, geochemical processes, and water use needs differs across the United States, which has important implications for the feasibility and cost of using brackish groundwater. Oil and gas development requires large volumes of water and results in large volumes of produced water. Oil and gas development and produced water discharge are most common in California and Nevada, central interior States from Montana to Texas to Alabama, Midwest States, and parts of Alaska. Produced water typically has high salinity, high radionuclide concentrations, high trace element (for example, arsenic) concentrations, and proprietary chemical additives. Produced water reuse, especially in semiarid and arid regions, could reduce oil and gas development demand on freshwater supplies.
Acknowledgments
The authors thank all U.S. Geological Survey colleagues who assisted with and supported this project, including Edward Stets for project leadership; Althea Archer for coordinating and leading the Data Visualization project team; Amanda Carr for illustrations; Sarah Stackpoole and Anthony Tesoriero for sharing insightful comments in their colleague reviews, which greatly improved the report by; and Luis E. Menoyo for creating the online searchable, interactive figures.
References Cited
Acharya, B.S., and Kharel, G., 2020, Acid mine drainage from coal mining in the United States—An overview: Journal of Hydrology, v. 588, article 125061, accessed May 19, 2023, at https://doi.org/10.1016/j.jhydrol.2020.125061.
Agency for Toxic Substances and Disease Registry, 1999, Toxicological profile for ionizing radiation: Atlanta, Georgia, U.S. Department of Health and Human Services, Public Health Service, [variously paged], accessed March 7, 2023, at https://www.atsdr.cdc.gov/ToxProfiles/tp149.pdf.
Agency for Toxic Substances and Disease Registry, 2004, Toxicological profile for strontium: U.S. Department of Health and Human Services, Public Health Service, [variously paged], accessed March 31, 2023, at https://www.atsdr.cdc.gov/toxprofiles/tp159.pdf.
Aiken, M.L., Pace, C.E., Ramachandran, M., Schwabe, K.A., Ajami, H., Link, B.G., and Ying, S.C., 2023, Disparities in drinking water manganese concentrations in domestic wells and community water systems in the Central Valley, CA, USA: Environmental Science & Technology, v. 57, no. 5, p. 1987–1996, accessed February 28, 2023, at https://doi.org/10.1021/acs.est.2c08548.
Arctic Monitoring and Assessment Programme, 2009, Human health in the Arctic 2009: Arctic Monitoring and Assessment Programme, 254 p., accessed January 17, 2024, at http://hdl.handle.net/11374/702.
Arctic Monitoring and Assessment Programme, 2011, AMAP assessment 2011—Mercury in the Arctic: Arctic Monitoring and Assessment Programme, 38 p., accessed January 17, 2024, at http://hdl.handle.net/11374/1063.
Ankley, G.T., Cureton, P., Hoke, R.A., Houde, M., Kumar, A., Kurias, J., Lanno, R., McCarthy, C., Newsted, J., Salice, C.J., Sample, B.E., Sepúlveda, M.S., Steevens, J., and Valsecchi, S., 2021, Assessing the ecological risks of per- and polyfluoroalkyl substances—Current state-of-the science and a proposed path forward: Environmental Toxicology and Chemistry, v. 40, no. 3, p. 564–605, accessed February 15, 2023, at https://doi.org/10.1002/etc.4869.
Anning, D.W., and Flynn, M.E., 2014, Dissolved-solids sources, loads, yields, and concentrations in streams of the conterminous United States: U.S. Geological Survey Scientific Investigations Report 2014–5012, 113 p., accessed October 14, 2022, at https://doi.org/10.3133/sir20145012.
Anning, D.W., Paul, A.P., McKinney, T.S., Huntington, J.M., Bexfield, L.M., and Thiros, S.A., 2012, Predicted nitrate and arsenic concentrations in basin-fill aquifers of the Southwestern United States: U.S. Geological Survey Scientific Investigations Report 2012–5065, 128 p., accessed February 27, 2023, at https://doi.org/10.3133/sir20125065.
Arnold, G.J.M., Allen, P., Volk, M.R., Williams, J., and Bosch, D.D., 2010, Assessment of different representations of spatial variability on SWAT model performance: Transactions of the ASABE, v. 53, no. 5, p. 1433–1443, accessed January 5, 2024, at https://doi.org/10.13031/2013.34913.
Ator, S.W., 2019, Spatially referenced models of streamflow and nitrogen, phosphorus, and suspended-sediment loads in streams of the northeastern United States: U.S. Geological Survey Scientific Investigations Report 2019–5118, accessed October 14, 2022, at https://doi.org/10.3133/sir20195118.
Ator, S.W., Miller, O.L., and Saad, D.A., 2022, Effects of return flows on stream water quality and availability in the Upper Colorado, Delaware, and Illinois River Basins: PLOS Water, v. 1, no. 7, 24 p., accessed October 6, 2023, at https://doi.org/10.1371/journal.pwat.0000030.
Avila, C., 2016, 25 years of fixing bridges on gravel mined rivers in California (Keynote), in 8th International Conference on Scour and Erosion, Oxford, United Kingdom, September 12–15, 2016: Southampton, United Kingdom, HR Wallingford, 8 p., accessed October 8, 2023, at https://eprints.hrwallingford.com/id/eprint/1021.
Ayotte, J.D., Medalie, L., Qi, S.L., Backer, L.C., and Nolan, B.T., 2017, Estimating the high-arsenic domestic-well population in the conterminous United States: Environmental Science & Technology, v. 51, no. 21, p. 12443–12454, accessed October 3, 2022, at https://doi.org/10.1021/acs.est.7b02881.
Ayotte, J.D., Nielsen, M.G., Robinson, Jr., G.R., and Moore, R.B., 1999, Relation of arsenic, iron, and manganese in ground water to aquifer type, bedrock lithogeochemistry, and land use in the New England coastal basins: U.S. Geological Survey Water-Resources Investigations Report 99–4162, 63 p., accessed February 27, 2023, at https://doi.org/10.3133/wri994162.
Ayotte, J.D., Szabo, Z., Focazio, M.J., and Eberts, S.M., 2011, Effects of human-induced alteration of groundwater flow on concentrations of naturally-occurring trace elements at water-supply wells: Applied Geochemistry, v. 26, no. 5, p. 747–762, accessed October 3, 2022, at https://doi.org/10.1016/j.apgeochem.2011.01.033.
Azadpour, E., Martinez, A.J., and Padilla, J.A., 2025, Decadal change plots of water-quality constituents: U.S. Geological Survey software release, https://doi.org/10.5066/P13N7XHW.
Balazs, C.L., and Ray, I., 2014, The drinking water disparities framework—On the origins and persistence of inequities in exposure: American Journal of Public Health, v. 104, no. 4, p. 603–611, accessed January 12, 2024, at https://doi.org/10.2105/AJPH.2013.301664.
Baldwin, A.K., Corsi, S.R., and Mason, S.A., 2016, Plastic debris in 29 Great Lakes tributaries—Relations to watershed attributes and hydrology: Environmental Science & Technology, v. 50, no. 19, p. 10377–10385, accessed May 19, 2023, at https://doi.org/10.1021/acs.est.6b02917.
Baldwin, A.K., King, K., Damstra, R., Karns, B., Weller, L., Mason, S.A., Hoellein, T., and Kim, L.H., 2017, Microplastics are everywhere!: U.S. Geological Survey Great Lakes Network Resource Brief, 4 p., accessed May 19, 2023, at https://pubs.er.usgs.gov/publication/70188074.
Baldwin, A.K., Spanjer, A.R., Hayhurst, B., and Hamilton, D., 2021, Microplastics in the Delaware River, northeastern United States: U.S. Geological Survey Fact Sheet 2020–3071, 4 p., accessed May 19, 2023, at https://doi.org/10.3133/fs20203071.
Ball, A., and Truskewycz, A., 2013, Polyaromatic hydrocarbon exposure—An ecological impact ambiguity: Environmental Science and Pollution Research International, v. 20, no. 7, p. 4311–4326, accessed August 17, 2023, at https://doi.org/10.1007/s11356-013-1620-2.
Banyoi, S.-M., Porseryd, T., Larsson, J., Grahn, M., and Dinnétz, P., 2022, The effects of exposure to environmentally relevant PFAS concentrations for aquatic organisms at different consumer trophic levels—Systematic review and meta-analyses: Environmental Pollution, v. 315, 10 p., accessed October 8, 2023, at https://doi.org/10.1016/j.envpol.2022.120422.
Barber, L.B., Jasmann, J.R., Tomaszewski, E.J., and Bekins, B.A., 2024, The influence of contaminants of emerging concern on beneficial uses of water, chap. D of Tesoriero, A.J., Erickson, M.L., Conaway, C.H., Tomaszewski, E.J., and Green, C.T., eds., Knowledge gaps and opportunities for understanding water-quality processes affecting water availability for beneficial uses: U.S. Geological Survey Open-File Report 2023–1086, 18 p., accessed March 15, 2024, at https://doi.org/10.3133/ofr20231086.
Barber, L.B., Keefe, S.H., Brown, G.K., Furlong, E.T., Gray, J.L., Kolpin, D.W., Meyer, M.T., Sandstrom, M.W., and Zaugg, S.D., 2013, Persistence and potential effects of complex organic contaminant mixtures in wastewater-impacted streams: Environmental Science & Technology, v. 47, no. 5, p. 2177–2188, accessed April 6, 2023, at https://doi.org/10.1021/es303720g.
Barber, L.B., Keefe, S.H., Kolpin, D.W., Schnoebelen, D.J., Flynn, J.L., Brown, G.K., Furlong, E.T., Glassmeyer, S.T., Gray, J.L., Meyer, M.T., Sandstrom, M.W., Taylor, H.E., and Zaugg, S.D., 2011, Lagrangian sampling of wastewater treatment plant effluent in Boulder Creek, Colorado, and Fourmile Creek, Iowa, during the summer of 2003 and spring of 2005—Hydrological and water-quality data: U.S. Geological Survey Open-File Report 2011–1054, 84 p., accessed April 6, 2023, at https://doi.org/10.3133/ofr20111054.
Barjasteh-Askari, F., Davoudi, M., Amini, H., Ghorbani, M., Yaseri, M., Yunesian, M., Mahvi, A.H., and Lester, D., 2020, Relationship between suicide mortality and lithium in drinking water—A systematic review and meta-analysis: Journal of Affective Disorders, v. 264, p. 234–241, accessed March 31, 2023, at https://doi.org/10.1016/j.jad.2019.12.027.
Batt, A.L., Kincaid, T.M., Kostich, M.S., Lazorchak, J.M., and Olsen, A.R., 2016, Evaluating the extent of pharmaceuticals in surface waters of the United States using a national-scale rivers and streams assessment survey: Environmental Toxicology and Chemistry, v. 35, no. 4, p. 874–881, accessed August 16, 2023, at https://doi.org/10.1002/etc.3161.
Beaver, J.R., Manis, E.E., Loftin, K.A., Graham, J.L., Pollard, A.I., and Mitchell, R.M., 2014, Land use patterns, ecoregion, and microcystin relationships in U.S. lakes and reservoirs—A preliminary evaluation: Harmful Algae, v. 36, p. 57–62, accessed March 27, 2023, at https://doi.org/10.1016/j.hal.2014.03.005.
Beaver, J.R., Tausz, C.E., Scotese, K.C., Pollard, A.I., and Mitchell, R.M., 2018, Environmental factors influencing the quantitative distribution of microcystin and common potentially toxigenic cyanobacteria in U.S. lakes and reservoirs: Harmful Algae, v. 78, p. 118–128, accessed March 27, 2023, at https://doi.org/10.1016/j.hal.2018.08.004.
Belitz, K., Fram, M., Lindsey, B.D., Stackelberg, P.E., Bexfield, L.M., Johnson, T.D., Jurgens, B.C., Kingsbury, J.A., McMahon, P.B., and Dubrovsky, N.M., 2022, The quality of groundwater used for public supply in the continental United States—A comprehensive assessment: Environmental Science & Technology—Water, 12 p., accessed April 3, 2023, at https://doi.org/10.1021/acsestwater.2c00390.
Belitz, K., Jurgens, B.C., and Johnson, T.D., 2016, Potential corrosivity of untreated groundwater in the United States: U.S. Geological Survey Scientific Investigations Report 2016–5092, 24 p., accessed April 3, 2023, at https://doi.org/10.3133/sir20165092.
Belitz, K., Watson, E., Johnson, T.D., and Sharpe, J.B., 2018, Secondary hydrogeologic regions of the conterminous United States: Ground Water, v. 57, no. 3, p. 367–377, accessed October 19, 2022, at https://doi.org/10.1111/gwat.12806.
Bexfield, L.M., Belitz, K., Lindsey, B.D., Toccalino, P.L., and Nowell, L.H., 2021, Pesticides and pesticide degradates in groundwater used for public supply across the United States—occurrence and human-health context: Environmental Science & Technology, v. 55, no. 1, p. 362–372, accessed October 3, 2022, at https://doi.org/10.1021/acs.est.0c05793.
Bexfield, L.M., and Jurgens, B.C., 2014, Effects of seasonal operation on the quality of water produced by public-supply wells: Ground Water, v. 52, no. S1, p. 10–24, accessed August 8, 2023, at https://doi.org/10.1111/gwat.12174.
Blaszczak, J.R., Koenig, L.E., Mejia, F.H., Gómez-Gener, L., Dutton, C.L., Carter, A.M., Grimm, N.B., Harvey, J.W., Helton, A.M., and Cohen, M.J., 2023, Extent, patterns, and drivers of hypoxia in the world’s streams and rivers: Limnology and Oceanography Letters, v. 8, no. 3, p. 453–463, accessed December 29, 2023, at https://doi.org/10.1002/lol2.10297.
Blazer, V.S., Iwanowicz, L.R., Henderson, H., Mazik, P.M., Jenkins, J.A., Alvarez, D.A., and Young, J.A., 2012, Reproductive endocrine disruption in smallmouth bass (Micropterus dolomieu) in the Potomac River basin—Spatial and temporal comparisons of biological effects: Environmental Monitoring and Assessment, v. 184, no. 7, p. 4309–4334, accessed April 3, 2023, at https://doi.org/10.1007/s10661-011-2266-5.
Blondes, M.S., Gans, K.D., Engle, M.A., Kharaka, Y.K., Reidy, M.E., Saraswathula, V., Thordsen, J.J., Rowan, E.L., and Morrissey, E.A., 2018, U.S. Geological Survey national produced waters geochemical database (ver. 2.3, January 2018): U.S. Geological Survey data release, accessed October 14, 2022, at https://doi.org/10.5066/F7J964W8.
Böhlke, J.K., Verstraeten, I.M., and Kraemer, T.F., 2007, Effects of surface-water irrigation on sources, fluxes, and residence times of water, nitrate, and uranium in an alluvial aquifer: Applied Geochemistry, v. 22, no. 1, p. 152–174, accessed July 31, 2024, at https://doi.org/10.1016/j.apgeochem.2006.08.019.
Böhlke, J.K., Hatzinger, P.B., Sturchio, N.C., Gu, B., Abbene, I., and Mroczkowski, S.J., 2009, Atacama Perchlorate as an Agricultural Contaminant in Groundwater: Isotopic and Chronologic Evidence from Long Island, New York: Environmental Science & Technology, v. 43, no. 15, p. 5619–5625, accessed July 31, 2024, at https://doi.org/10.1021/es9006433.
Böhlke, J.K., Jurgens, B.C., Uselmann, D.J., and Eberts, S.M., 2014a, Educational webtool illustrating groundwater age effects on contaminant trends in wells: Ground Water, v. 52, no. S1, p. 8–9, accessed March 31, 2023, at https://doi.org/10.1111/gwat.12261.
Böhlke, J.K., Jurgens, B.C., Uselmann, D.J., and Eberts, S.M., 2014b, GAMACTT (version 1.0): U.S. Geological Survey National Water-Quality Program, accessed March 31, 2023, at https://ca.water.usgs.gov/projects/gamactt/.
Borchardt, M.A., Stokdyk, J.P., Kieke, B.A., Jr., Muldoon, M.A., Spencer, S.K., Firnstahl, A., Bonness, D., Hunt, R.J., and Burch, T.R., 2021, Sources and risk factors for nitrate and microbial contamination of private household wells in the fractured dolomite aquifer of northeastern Wisconsin: Environmental Health Perspectives, v. 129, no. 6, 18 p., accessed October 19, 2022, at https://doi.org/10.1289/EHP7813.
Boshers, D.S., Granger, J., Tobias, C.R., Böhlke, J.K., and Smith, R.L., 2019, Constraining the oxygen isotopic composition of nitrate produced by nitrification: Environmental Science & Technology, v. 53, no. 3, p. 1206–1216, accessed October 4, 2023, at https://doi.org/10.1021/acs.est.8b03386.
Bouchard, M.F., Surette, C., Cormier, P., and Foucher, D., 2018, Low level exposure to manganese from drinking water and cognition in school-age children: Neurotoxicology, v. 64, p. 110–117, accessed February 16, 2023, at https://doi.org/10.1016/j.neuro.2017.07.024.
Bouma-Gregson, K., Power, M.E., and Bormans, M., 2017, Rise and fall of toxic benthic freshwater cyanobacteria (Anabaena spp.) in the Eel River—Buoyancy and dispersal: Harmful Algae, v. 66, p. 79–87, accessed May 19, 2023, at https://doi.org/10.1016/j.hal.2017.05.007.
Bowen, K., Krishna, T., Backer, L., Hodgins, K., Waller, L.A., and Gribble, M.O., 2019, State-level policies concerning private wells in the United States: Water Policy, v. 21, no. 2, p. 428–435, accessed December 27, 2023, at https://doi.org/10.2166/wp.2019.205.
Bradbury, K.R., Borchardt, M.A., Gotkowitz, M., Spencer, S.K., Zhu, J., and Hunt, R.J., 2013, Source and transport of human enteric viruses in deep municipal water supply wells: Environmental Science & Technology, v. 47, no. 9, p. 4096–4103, accessed April 5, 2023, at https://doi.org/10.1021/es400509b.
Bradley, P.M., Argos, M., Kolpin, D.W., Meppelink, S.M., Romanok, K.M., Smalling, K.L., Focazio, M.J., Allen, J.M., Dietze, J.E., Devito, M.J., Donovan, A.R., Evans, N., Givens, C.E., Gray, J.L., Higgins, C.P., Hladik, M.L., Iwanowicz, L.R., Journey, C.A., Lane, R.F., Laughrey, Z.R., Loftin, K.A., McCleskey, R.B., McDonough, C.A., Medlock-Kakaley, E., Meyer, M.T., Putz, A.R., Richardson, S.D., Stark, A.E., Weis, C.P., Wilson, V.S., and Zehraoui, A., 2020a, Mixed organic and inorganic tapwater exposures and potential effects in greater Chicago area, USA: Science of the Total Environment, v. 719, 16 p., accessed October 18, 2022, at https://doi.org/10.1016/j.scitotenv.2020.137236.
Bradley, P.M., Barber, L.B., Kolpin, D.W., McMahon, P.B., and Chapelle, F.H., 2007, Biotransformation of caffeine, cotinine, and nicotine in stream sediments—Implications for use as wastewater indicators: Environmental Toxicology and Chemistry, v. 26, no. 6, p. 1116–1121, accessed October 18, 2022, at https://doi.org/10.1897/06-483R.1.
Bradley, P.M., Burns, D.A., Murray, K.R., Brigham, M.E., Button, D.T., Chasar, L.C., Marvin-DiPasquale, M., Lowery, M.A., and Journey, C.A., 2011, Spatial and seasonal variability of dissolved methylmercury in two stream basins in the eastern United States: Environmental Science & Technology, v. 45, no. 6, p. 2048–2055, accessed March 27, 2023, at https://doi.org/10.1021/es103923j.
Bradley, P.M., Journey, C.A., Brigham, M.E., Burns, D.A., Button, D.T., and Riva-Murray, K., 2013, Intra- and inter-basin mercury comparisons—Importance of basin scale and time-weighted methylmercury estimates: Environmental Pollution, v. 172, p. 42–52, accessed October 18, 2022, at https://doi.org/10.1016/j.envpol.2012.08.008.
Bradley, P.M., Journey, C.A., Button, D.T., Carlisle, D.M., Huffman, B.J., Qi, S.L., Romanok, K.M., and Van Metre, P.C., 2020b, Multi-region assessment of pharmaceutical exposures and predicted effects in USA wadeable urban-gradient streams: PLoS One, v. 15, no. 1, 25 p., accessed October 18, 2022, at https://doi.org/10.1371/journal.pone.0228214.
Bradley, P.M., Journey, C.A., Romanok, K.M., Breitmeyer, S.E., Button, D.T., Carlisle, D.M., Huffman, B.J., Mahler, B.J., Nowell, L.H., Qi, S.L., Smalling, K.L., Waite, I.R., and Van Metre, P.C., 2021, Multi-region assessment of chemical mixture exposures and predicted cumulative effects in USA wadeable urban/agriculture-gradient streams: Science of the Total Environment, v. 773, 12 p., accessed October 18, 2022, at https://doi.org/10.1016/j.scitotenv.2021.145062.
Bradley, P.M., Kolpin, D.W., Romanok, K.M., Smalling, K.L., Focazio, M.J., Brown, J.B., Cardon, M.C., Carpenter, K.D., Corsi, S.R., DeCicco, L.A., Dietze, J.E., Evans, N., Furlong, E.T., Givens, C.E., Gray, J.L., Griffin, D.W., Higgins, C.P., Hladik, M.L., Iwanowicz, L.R., Journey, C.A., Kuivila, K.M., Masoner, J.R., McDonough, C.A., Meyer, M.T., Orlando, J.L., Strynar, M.J., Weis, C.P., and Wilson, V.S., 2018, Reconnaissance of mixed organic and inorganic chemicals in private and public supply tapwaters at selected residential and workplace sites in the United States: Environmental Science & Technology, v. 52, no. 23, p. 13972–13985, accessed February 15, 2023, at https://doi.org/10.1021/acs.est.8b04622.
Brander, S.M., Gabler, M.K., Fowler, N.L., Connon, R.E., and Schlenk, D., 2016, Pyrethroid pesticides as endocrine disruptors—Molecular mechanisms in vertebrates with a focus on fishes: Environmental Science & Technology, v. 50, no. 17, p. 8977–8992, accessed October 6, 2023, at https://doi.org/10.1021/acs.est.6b02253.
Breault, R.F., Colman, J.A., Aiken, G.R., and McKnight, D., 1996, Copper speciation and binding by organic matter in copper-contaminated streamwater: Environmental Science & Technology, v. 30, no. 12, p. 3477–3486, accessed May 19, 2023, at https://doi.org/10.1021/es9601301.
Briggs, J.C., and Ficke, J.F., 1977, Quality of rivers of the United States, 1975 water year; based on the National Stream Quality Accounting Network (NASQAN): U.S. Geological Survey Open-File Report 78–200, 446 p., accessed March 9, 2023, at https://doi.org/10.3133/ofr78200.
Briggs, M., Goodling, P., Johnson, Z., Rogers, K., Hitt, N., Fair, J., and Snyder, C., 2022, Bedrock depth influences spatial patterns of summer baseflow, temperature and flow disconnection for mountainous headwater streams: Hydrology and Earth System Sciences, v. 26, no. 15, p. 3989–4011, accessed January 18, 2024, at https://doi.org/10.5194/hess-26-3989-2022.
Brigham, M.E., Wentz, D.A., Aiken, G.R., and Krabbenhoft, D.P., 2009, Mercury cycling in stream ecosystems—1. Water column chemistry and transport: Environmental Science & Technology, v. 43, no. 8, p. 2720–2725, accessed March 27, 2023, at https://doi.org/10.1021/es802694n.
Broberg, K., Concha, G., Engström, K., Lindvall, M., Grandér, M., and Vahter, M., 2011, Lithium in drinking water and thyroid function: Environmental Health Perspectives, v. 119, no. 6, p. 827–830, accessed March 31, 2023, at https://doi.org/10.1289/ehp.1002678.
Brodin, T., Fick, J., Jonsson, M., and Klaminder, J., 2013, Dilute concentrations of a psychiatric drug alter behavior of fish from natural populations: Science, v. 339, no. 6121, p. 814–815, accessed October 8, 2023, at https://doi.org/10.1126/science.1226850.
Brown, C.J., Barlow, J.R.B., Cravotta, C.A., III, and Lindsey, B.D., 2019, Factors affecting the occurrence of lead and manganese in untreated drinking water from Atlantic and Gulf Coastal Plain aquifers, eastern United States—Dissolved oxygen and pH framework for evaluating risk of elevated concentrations: Applied Geochemistry, v. 101, p. 88–102, accessed March 3, 2023, at https://doi.org/10.1016/j.apgeochem.2018.10.017.
Brown, E.E., Gerretsen, P., Pollock, B., and Graff-Guerrero, A., 2018, Psychiatric benefits of lithium in water supplies may be due to protection from the neurotoxicity of lead exposure: Medical Hypotheses, v. 115, p. 94–102, accessed March 3, 2023, at https://doi.org/10.1016/j.mehy.2018.04.005.
Brumbaugh, W.G., Krabbenhoft, D.P., Helsel, D.R., Wiener, J.G., and Echols, K.R., 2001, A national pilot study of mercury contamination of aquatic ecosystems along multiple gradients—Bioaccumulation in fish: U.S. Geological Survey Biological Science Report 2001–0009, 25 p., accessed March 27, 2023, at https://pubs.er.usgs.gov/publication/bsr20010009.
Burch, T.R., Stokdyk, J.P., Rice, N., Anderson, A.C., Walsh, J.F., Spencer, S., Firnstahl, A., and Borchardt, M.A., 2022, Statewide quantitative microbial risk assessment for waterborne viruses, bacteria, and protozoa in public water supply wells in Minnesota: Environmental Science & Technology, v. 56, no. 10, p. 6315–6324, accessed October 19, 2022, at https://doi.org/10.1021/acs.est.1c06472.
Burnison, B.K., Hartmann, A., Lister, A., Servos, M.R., Ternes, T., and Van Der Kraak, G., 2003, A toxicity identification evaluation approach to studying estrogenic substances in hog manure and agricultural runoff: Environmental Toxicology and Chemistry, v. 22, no. 10, p. 2243–2250, accessed March 3, 2023, at https://doi.org/10.1897/02-437.
Burns, D.A., Riva-Murray, K., Bradley, P.M., Aiken, G.R., and Brigham, M.E., 2012, Landscape controls on total and methyl Hg in the upper Hudson River basin, New York, USA: Journal of Geophysical Research, v. 117, no. G1, 15 p., accessed March 27, 2023, at https://doi.org/10.1029/2011JG001812.
Butts, R., and Gasteyer, S., 2011, Environmental reviews & case studies—More cost per drop—Water rates, structural inequality, and race in the United States—The case of Michigan: Environmental Practice, v. 13, no. 4, p. 386–395, accessed January 17, 2024, at https://doi.org/10.1017/S1466046611000391.
Cabral, J.P.S., 2010, Water microbiology—Bacterial pathogens and water: International Journal of Environmental Research and Public Health, v. 7, no. 10, p. 3657–3703, accessed May 19, 2023, at https://doi.org/10.3390/ijerph7103657.
Cai, W.-J., Hu, X., Huang, W.-J., Murrell, M.C., Lehrter, J.C., Lohrenz, S.E., Chou, W.-C., Zhai, W., Hollibaugh, J.T., Wang, Y., Zhao, P., Guo, X., Gundersen, K., Dai, M., and Gong, G.-C., 2011, Acidification of subsurface coastal waters enhanced by eutrophication: Nature Geoscience, v. 4, no. 11, p. 766–770, accessed April 6, 2023, at https://doi.org/10.1038/ngeo1297.
Camacho, L.M., Gutiérrez, M., Alarcón-Herrera, M.T., Villalba, M.L., and Deng, S., 2011, Occurrence and treatment of arsenic in groundwater and soil in northern Mexico and southwestern USA: Chemosphere, v. 83, no. 3, p. 211–225, accessed February 27, 2023, at https://doi.org/10.1016/j.chemosphere.2010.12.067.
Cañedo-Argüelles, M., 2020, A review of recent advances and future challenges in freshwater salinization: Limnetica, v. 39, no. 1, p. 185–211, accessed February 16, 2023, at https://doi.org/10.23818/limn.39.13.
Cañedo-Argüelles, M., Kefford, B.J., Piscart, C., Prat, N., Schäfer, R.B., and Schulz, C.-J., 2013, Salinisation of rivers—An urgent ecological issue: Environmental Pollution, v. 173, p. 157–167, accessed February 13, 2023, at https://doi.org/10.1016/j.envpol.2012.10.011.
Carlisle, D.M., Grantham, T.E., Eng, K., and Wolock, D.M., 2017, Biological relevance of streamflow metrics—Regional and national perspectives: Freshwater Science, v. 36, no. 4, p. 927–940, accessed August 16, 2023, at https://doi.org/10.1086/694913.
Carlisle, D.M., Spaulding, S.A., Tyree, M.A., Schulte, N.O., Lee, S.S., Mitchell, R.M., and Pollard, A.A., 2022, A web-based tool for assessing the condition of benthic diatom assemblages in streams and rivers of the conterminous United States: Ecological Indicators, v. 135, 13 p., accessed August 16, 2023, at https://doi.org/10.1016/j.ecolind.2021.108513.
Carpenter, S.R., 2008, Phosphorus control is critical to mitigating eutrophication: Proceedings of the National Academy of Sciences of the United States of America, v. 105, no. 32, p. 11039–11040, accessed May 19, 2023, at https://doi.org/10.1073/pnas.0806112105.
Catherine, Q., Susanna, W., Isidora, E.-S., Mark, H., Aurélie, V., and Jean-François, H., 2013, A review of current knowledge on toxic benthic freshwater cyanobacteria—Ecology, toxin production and risk management: Water Research, v. 47, no. 15, p. 5464–5479, accessed May 19, 2023, at https://doi.org/10.1016/j.watres.2013.06.042.
Chappell, B., 2014, Algae toxins prompt Toledo to ban its drinking water: National Public Radio, accessed October 17, 2022, at https://www.npr.org/sections/thetwo-way/2014/08/03/337545914/algae-toxins-prompt-toledo-to-ban-its-drinking-water.
Chasar, L.C., Scudder, B.C., Stewart, A.R., Bell, A.H., and Aiken, G.R., 2009, Mercury cycling in stream ecosystems—3. Trophic dynamics and methylmercury bioaccumulation: Environmental Science & Technology, v. 43, no. 8, p. 2733–2739, accessed March 27, 2023, at https://doi.org/10.1021/es8027567.
Chaudhary, B.K., Sabie, R., Engle, M.A., Xu, P., Willman, S., and Carroll, K.C., 2019, Spatial variability of produced-water quality and alternative-source water analysis applied to the Permian Basin, USA: Hydrogeology Journal, v. 27, no. 8, p. 2889–2905, accessed April 3, 2023, at https://doi.org/10.1007/s10040-019-02054-4.
Choi, A.L., and Grandjean, P., 2008, Methylmercury exposure and health effects in humans: Environmental Chemistry, v. 5, no. 2, p. 112–120, accessed February 16, 2023, at https://doi.org/10.1071/EN08014.
Clark, C.E., and Veil, J.A., 2009, Produced water volumes and management practices in the United States—Argonne National Lab: Argonne, Illinois, Argonne National Lab, accessed April 9, 2023, at https://doi.org/10.2172/1007397.
Clarkson, T.W., Magos, L., and Myers, G.J., 2003, Human exposure to mercury—The three modern dilemmas: The Journal of Trace Elements in Experimental Medicine, v. 16, no. 4, p. 321–343, accessed February 16, 2023, at https://doi.org/10.1002/jtra.10050.
Clausen, R., Montoya, T., and Chief, K., Chischilly, S., Yazzie, J., Turner, J., Jacobs, L.M., and Merchant, A., 2021, Social Impacts of the Gold King Mine spill on the Animas–San Juan River watershed communities in Clark, B.T., and McCormick, P., eds., Gold metal waters—The Animas River and the Gold King Mine spill: Boulder, University Press of Colorado, p. 190–217.
Clausen, R.J., Chief, C., Teufel-Shone, N.I., Begay, M.A., Charley, P.H., Jr., Beamer, P.I., Anako, N., and Chief, K., 2023, Diné-centered research reframes the Gold King Mine spill—Understanding social and spiritual impacts across space and time: Journal of Rural Studies, v. 97, p. 449–457, accessed January 17, 2023, at https://doi.org/10.1016/j.jrurstud.2022.12.021.
Clements, W.H., and Kotalik, C., 2016, Effects of major ions on natural benthic communities—An experimental assessment of the US Environmental Protection Agency aquatic life benchmark for conductivity: Freshwater Science, v. 35, no. 1, p. 126–138, accessed October 6, 2023, at https://doi.org/10.1086/685085.
Coffer, M.M., Schaeffer, B.A., Foreman, K., Porteous, A., Loftin, K.A., Stumpf, R.P., Werdell, P.J., Urquhart, E., Albert, R.J., and Darling, J.A., 2021b, Assessing cyanobacterial frequency and abundance at surface waters near drinking water intakes across the United States: Water Research, v. 201, 13 p., accessed February 15, 2023, at https://doi.org/10.1016/j.watres.2021.117377.
Coffer, M.M., Schaeffer, B.A., Salls, W.B., Urquhart, E., Loftin, K.A., Stumpf, R.P., Werdell, P.J., and Darling, J.A., 2021a, Satellite remote sensing to assess cyanobacterial bloom frequency across the United States at multiple spatial scales: Ecological Indicators, v. 128, 12 p., accessed February 15, 2023, at https://doi.org/10.1016/j.ecolind.2021.107822.
Cohen, D., 2019, About 60.2M live in areas most vulnerable to hurricanes: U.S. Census Bureau, accessed April 6, 2023, at https://www.census.gov/library/stories/2019/07/millions-of-americans-live-coastline-regions.html.
Collins, A.L., Naden, P.S., Sear, D.A., Jones, J.I., Foster, I.D.L. and Morrow, K. (2011), Sediment targets for informing river catchment management: international experience and prospects: Hydrological Processes, v. 25, no. 13, p. 2112–2129, accessed May 15, 2023, at https://doi.org/10.1002/hyp.7965.
Comte, L., and Olden, J.D., 2017, Climatic vulnerability of the world’s freshwater and marine fishes: Nature Climate Change, v. 7, no. 10, p. 718–722, accessed October 6, 2023, at https://doi.org/10.1038/nclimate3382.
Conaway, C.H., Baker, N.T., and Böhlke, J.K., 2024b, Addressing salinity challenges to the beneficial uses of water, chap. B of Tesoriero, A.J., Erickson, M.L., Conaway, C.H., Tomaszewski, E.J., and Green, C.T., eds., 2024, Knowledge gaps and opportunities for understanding water-quality processes affecting water availability for beneficial uses: U.S. Geological Survey Open-File Report 2023–1086, 81 p., accessed March 15, 2024, at https://doi.org/10.3133/ofr20231086.
Conaway, C.H., Baker, N.T., Harvey, J.W., and Gellis, A.C., 2024a, Freshwater salinization—An expanding impairment of aquatic ecosystem health, chap. E of Harvey, J.W., Conaway, C.H., Dornblaser, M., Gellis, A., Stewart, A.R., and Green, C.T., eds., Knowledge gaps and opportunities in water-quality drivers of aquatic ecosystem health: U.S. Geological Survey Open-File Report 2023–1085, 10 p., accessed March 15,2 2024, at https://doi.org/10.3133/ofr20231085.
Concha, G., Broberg, K., Grandér, M., Cardozo, A., Palm, B., and Vahter, M., 2010, High-level exposure to lithium, boron, cesium, and arsenic via drinking water in the Andes of Northern Argentina: Environmental Science & Technology, v. 44, no. 17, p. 6875–6880, accessed March 31, 2023, at https://doi.org/10.1021/es1010384.
Conrad, C.L., Ben Yin, Y., Hanna, T., Atkinson, A.J., Alvarez, P.J.J., Tekavec, T.N., Reynolds, M.A., and Wong, M.S., 2020, Fit-for-purpose treatment goals for produced waters in shale oil and gas fields: Water Research, v. 173, 16 p., accessed April 9, 2023, at https://doi.org/10.1016/j.watres.2020.115467.
Cooper, C.M., McCall, J., Stokes, S.C., McKay, C., Bentley, M.J., Rosenblum, J.S., Blewett, T.A., Huang, Z., Miara, A., Talmadge, M., Evans, A., Sitterley, K.A., Kurup, P., Stokes-Draut, J.R., Macknick, J., Borch, T., Cath, T.Y., and Katz, L.E., 2022, Oil and gas produced water reuse—Opportunities, treatment needs, and challenges: ACS ES&T Engineering, v. 2, no. 3, p. 347–366, accessed March 3, 2023, at https://doi.org/10.1021/acsestengg.1c00248.
Cormier, S.M., Zheng, L., and Flaherty, C.M., 2018, A field-based model of the relationship between extirpation of salt-intolerant benthic invertebrates and background conductivity: Science of the Total Environment, v. 633, p. 1629–1636, accessed October 18, 2022, at https://doi.org/10.1016/j.scitotenv.2018.02.044.
Costall, A.R., Harris, B.D., Teo, B., Schaa, R., Wagner, F.M., and Pigois, J.P., 2020, Groundwater throughflow and seawater intrusion in high quality coastal aquifers: Scientific Reports, v. 10, no. 1, 33 p., accessed April 6, 2023, at https://doi.org/10.1038/s41598-020-66516-6.
Covert, S.A., Shoda, M.E., Stackpoole, S.M., and Stone, W.W., 2020, Pesticide mixtures show potential toxicity to aquatic life in U.S. streams, water years 2013–2017: Science of the Total Environment, v. 745, 12 p., accessed October 18, 2022, at https://doi.org/10.1016/j.scitotenv.2020.141285.
Cozzarelli, I.M., Schreiber, M.E., Erickson, M.L., and Ziegler, B.A., 2016, Arsenic cycling in hydrocarbon plumes—Secondary effects of natural attenuation: Ground Water, v. 54, no. 1, p. 35–45, accessed February 28, 2023, at https://doi.org/10.1111/gwat.12316.
Curzon, M.E.J., and Spector, P.C., 1977, Enamel mottling in a high strontium area of the U.S: Community Dentistry and Oral Epidemiology, v. 5, no. 5, p. 243–247, accessed March 7, 2023, at https://doi.org/10.1111/j.1600-0528.1977.tb01648.x.
Cutler, D.R., Edwards, T.C., Jr., Beard, K.H., Cutler, A., Hess, K.T., Gibson, J., and Lawler, J.J., 2007, Random forests for classification in ecology: Ecology, v. 88, no. 11, p. 2783–2792, accessed December 28, 2023, at https://doi.org/10.1890/07-0539.1.
Cutter, S.L., Boruff, B.J., and Shirley, W.L., 2003, Social vulnerability to environmental hazards: Social Science Quarterly, v. 84, no. 2, p. 242–261, accessed June 2, 2023, at https://doi.org/10.1111/1540-6237.8402002.
de Lambert, J.R., Walsh, J.F., Scher, D.P., Firnstahl, A., and Borchardt, M.A., 2021, Microbial pathogens and contaminants of emerging concern in groundwater at an urban subsurface stormwater infiltration site: Science of the Total Environment, v. 775, 9 p., accessed October 19, 2022, at https://doi.org/10.1016/j.scitotenv.2021.145738.
Degnan, J.R., Kauffman, L.J., Erickson, M.L., Belitz, K., and Stackelberg, P.E., 2021, Depth of groundwater used for drinking-water supplies in the United States: U.S. Geological Survey Scientific Investigations Report 2021–5069, 69 p., accessed October 19, 2022, at https://doi.org/10.3133/sir20215069.
Degnan, J.R., Lindsey, B.D., Levitt, J.P., and Szabo, Z., 2020, The relation of geogenic contaminants to groundwater age, aquifer hydrologic position, water type, and redox conditions in Atlantic and Gulf Coastal Plain aquifers, eastern and south-central USA: Science of the Total Environment, v. 723, 15 p., accessed April 3, 2023, at https://doi.org/10.1016/j.scitotenv.2020.137835.
DePalma, A., 2006, New York’s water supply may need filtering: New York Times, accessed October 17, 2022, at https://www.nytimes.com/2006/07/20/nyregion/20water.html.
DeSimone, L.A., 2009, Quality of water from domestic wells in principal aquifers of the United States, 1991–2004: U.S. Geological Survey Scientific Investigations Report 2008–5227, 139 p., accessed October 3, 2022, at https://doi.org/10.3133/sir20085227.
DeSimone, L.A., McMahon, P.B., and Rosen, M.R., 2015, The quality of our Nation's waters—Water quality in principal aquifers of the United States, 1991–2010: U.S. Geological Survey Circular 1360, 151 p., accessed October 3, 2022, at https://doi.org/10.3133/cir1360.
DeSimone, L.A., and Ransom, K.M., 2021, Manganese in the Northern Atlantic Coastal Plain aquifer system, eastern USA—Modeling regional occurrence with pH, redox, and machine learning: Journal of Hydrology. Regional Studies, v. 37, 20 p., accessed October 3, 2022, at https://doi.org/10.1016/j.ejrh.2021.100925.
Douben, P.E.T., 2003, PAHs—An ecotoxicological perspective: Chichester, United Kingdom, John Wiley & Sons, Ltd. [Also available at https://onlinelibrary.wiley.com/doi/epdf/10.1002/0470867132.]
Driscoll, C.T., Lawrence, G.B., Bulger, A.J., Butler, T.J., Cronan, C.S., Eagar, C., Lambert, K.F., Likens, G.E., Stoddard, J.L., and Weathers, K.C., 2001, Acidic deposition in the northeastern United States—Sources and inputs, ecosystem effects, and management strategies—The effects of acidic deposition in the northeastern United States include the acidification of soil and water, which stresses terrestrial and aquatic biota: Bioscience, v. 51, no. 3, p. 180–198, accessed May 19, 2023, at https://doi.org/10.1641/0006-3568(2001)051[0180:ADITNU]2.0.CO;2.
Eaton, A., 2021, Assessment of manganese occurrence in drinking water in the United States: ACS ES&T Water, v. 1, no. 11, p. 2450–2458, accessed February 28, 2023, at https://doi.org/10.1021/acsestwater.1c00293.
Eberts, S.M., Böhlke, J.K., Kauffman, L.J., and Jurgens, B.C., 2012, Comparison of particle-tracking and lumped-parameter age-distribution models for evaluating vulnerability of production wells to contamination: Hydrogeology Journal, v. 20, no. 2, p. 263–282, accessed March 31, 2023, at https://doi.org/10.1007/s10040-011-0810-6.
Ekstrom, J.A., Suatoni, L., Cooley, S.R., Pendleton, L.H., Waldbusser, G.G., Cinner, J.E., Ritter, J., Langdon, C., van Hooidonk, R., Gledhill, D., Wellman, K., Beck, M.W., Brander, L.M., Rittschof, D., Doherty, C., Edwards, P.E.T., and Portela, R., 2015, Vulnerability and adaptation of U.S. shellfisheries to ocean acidification: Nature Climate Change, v. 5, no. 3, p. 207–214, accessed April 6, 2023, at https://doi.org/10.1038/nclimate2508.
Eliason, E.J., and Farrell, A.P., 2016, Oxygen uptake in Pacific salmon Oncorhynchus spp.—When ecology and physiology meet: Journal of Fish Biology, v. 88, no. 1, p. 359–388, accessed May 19, 2023, at https://doi.org/10.1111/jfb.12790.
Elith, J., Leathwick, J.R., and Hastie, T., 2008, A working guide to boosted regression trees: Journal of Animal Ecology, v. 77, no. 4, p. 802–813, accessed March 24, 2023, at https://doi.org/10.1111/j.1365-2656.2008.01390.x.
Elliott, S.M., Erickson, M.L., Krall, A.L., and Adams, B.A., 2018a, Concentrations of pharmaceuticals and other micropollutants in groundwater downgradient from large on-site wastewater discharges: PLoS One, v. 13, no. 11, 17 p., accessed April 6, 2023, at https://doi.org/10.1371/journal.pone.0206004.
Elliott, S.M., Erickson, M.L., Krall, A.L., and Adams, B.A., 2018b, Wastewater indicators, hormones, sterols, antibiotics, and pharmaceuticals in soil at an agricultural field irrigated with domestic septage, central Minnesota, September 2014: U.S. Geological Survey Scientific Investigations Report 2018–5100, 34 p., accessed April 6, 2023, at https://doi.org/10.3133/sir20185100.
Erickson, M.L., Brown, C.J., Tomaszewski, E.J., Ayotte, J.D., Qi, S.L., Kent, D.B., and Böhlke, J.K., 2024b, Prioritizing water availability study settings to address geogenic contaminants and related societal factors: Environmental Monitoring and Assessment, v. 196, no. 303, 28 p., accessed March 15, 2024, at https://doi.org/10.1007/s10661-024-12362-2.
Erickson, M.L., Elliott, S.M., Brown, C.J., Stackelberg, P.E., Ransom, K.M., and Reddy, J.E., 2021a, Machine learning predicted redox conditions in the glacial aquifer system, northern continental United States: Water Resources Research, v. 57, no. 4, 17 p., accessed March 3, 2023, at https://doi.org/10.1029/2020WR028207.
Erickson, M.L., Elliott, S.M., Brown, C.J., Stackelberg, P.E., Ransom, K.M., Reddy, J.E., and Cravotta, C.A., III, 2021b, Machine-learning predictions of high arsenic and high manganese at drinking water depths of the glacial aquifer system, northern continental United States: Environmental Science & Technology, v. 55, no. 9, p. 5791–5805, accessed February 16, 2023, at https://doi.org/10.1021/acs.est.0c06740.
Erickson, M.L., Kent, D.B., Böhlke, J.K., and Conaway, C.H., 2024a, Geogenic water-quality effects on beneficial uses of water, chap. C of Tesoriero, A.J., Erickson, M.L., Conaway, C.H., Tomaszewski, E.J., and Green, C.T., eds., Knowledge gaps and opportunities for understanding water-quality processes affecting water availability for beneficial uses: U.S. Geological Survey Open-File Report 2023–1086, 29 p., accessed March 15, 2024, at https://doi.org/10.3133/ofr20231086.
Erickson, M.L., Malenda, H.F., Berquist, E.C., and Ayotte, J.D., 2019b, Arsenic concentrations after drinking water well installation—Time-varying effects on arsenic mobilization: Science of the Total Environment, v. 678, p. 681–691, accessed March 3, 2023, at https://doi.org/10.1016/j.scitotenv.2019.04.362.
Erickson, M.L., Yager, R.M., Kauffman, L.J., and Wilson, J.T., 2019a, Drinking water quality in the glacial aquifer system, northern USA: Science of the Total Environment, v. 694, 14 p., accessed March 3, 2023, at https://doi.org/10.1016/j.scitotenv.2019.133735.
Facio-Krajcer, A., and Cowan, J., 2022, When there’s arsenic in the water, but ‘we have nowhere to go’: New York Times, accessed October 18, 2022, at https://www.nytimes.com/2022/07/31/us/oasis-mobile-home-park-coachella.html.
Fair, P.A., Wolf, B., White, N.D., Arnott, S.A., Kannan, K., Karthikraj, R., and Vena, J.E., 2019, Perfluoroalkyl substances (PFASs) in edible fish species from Charleston Harbor and tributaries, South Carolina, United States—Exposure and risk assessment: Environmental Research, v. 171, p. 266–277, accessed October 4, 2023, at https://doi.org/10.1016/j.envres.2019.01.021.
Fakhreddine, S., Prommer, H., Scanlon, B.R., Ying, S.C., and Nicot, J.P., 2021, Mobilization of arsenic and other naturally occurring contaminants during managed aquifer recharge: Environmental Science & Technology, v. 55, no. 4, p. 2208–2223, accessed March 3, 2023, at https://doi.org/10.1021/acs.est.0c07492.
Fanelli, R.M., Cashman, M.J., and Porter, A.J., 2022, Identifying key stressors driving biological impairment in freshwater streams in the Chesapeake Bay watershed, USA: Environmental Management, v. 70, no. 6, p. 926–949, accessed October 17, 2022, at https://doi.org/10.1007/s00267-022-01723-7.
Ferguson, G., and Gleeson, T., 2012, Vulnerability of coastal aquifers to groundwater use and climate change: Nature Climate Change, v. 2, no. 5, p. 342–345, accessed April 6, 2023, at https://doi.org/10.1038/nclimate1413.
Fernández-Llamazares, Á., Garteizgogeascoa, M., Basu, N., Brondizio, E.S., Cabeza, M., Martínez-Alier, J., McElwee, P., and Reyes-García, V., 2020, A state-of-the-art review of indigenous peoples and environmental pollution: Integrated Environmental Assessment and Management, v. 16, no. 3, p. 324–341, accessed January 17, 2024, at https://doi.org/10.1002/ieam.4239.
Fink, G., Günther, I., and Hill, K., 2011, The effect of water and sanitation on child health—Evidence from the demographic and health surveys 1986–2007: International Journal of Epidemiology, v. 40, no. 5, p. 1196–1204, accessed January 12, 2024, at https://doi.org/10.1093/ije/dyr102.
Flanagan, S.V., Spayd, S.E., Procopio, N.A., Marvinney, R.G., Smith, A.E., Chillrud, S.N., Braman, S., and Zheng, Y., 2016, Arsenic in private well water part 3 of 3—Socioeconomic vulnerability to exposure in Maine and New Jersey: Science of the Total Environment, v. 562, p. 1019–1030, accessed June 2, 2023, at https://doi.org/10.1016/j.scitotenv.2016.03.217.
Fork, M.L., Fick, J.B., Reisinger, A.J., and Rosi, E.J., 2021, Dosing the coast—Leaking sewage infrastructure delivers large annual doses and dynamic mixtures of pharmaceuticals to urban rivers: Environmental Science & Technology, v. 55, no. 17, p. 11637–11645, accessed April 6, 2023, at https://doi.org/10.1021/acs.est.1c00379.
Fujii, R., and Swain, W.C., 1995, Areal distribution of selected trace elements, salinity, and major ions in shallow ground water: California, Tulare Basin, Southern San Joaquin Valley: U.S. Geological Survey Water-Resources Investigations Report 95–4048, 67 p., accessed February 27, 2023, at https://doi.org/10.3133/wri954048.
Fuller, C.C., and Davis, J.A., 1989, Influence of coupling of sorption and photosynthetic processes on trace element cycles in natural waters: Nature, v. 340, no. 6228, p. 52–54, accessed October 19, 2023, at https://doi.org/10.1038/340052a0.
Fuller, W.P., Wagner, R.J., and Lewis, R.E., 2023, U.S. hydrodynamic dredging challenges and opportunities: Transportation Research Record, 14 p., accessed January 11, 2024, at https://doi.org/10.1177/03611981231207849.
Galloway, J.N., Dentener, F.J., Capone, D.G., Boyer, E.W., Howarth, R.W., Seitzinger, S.P., Asner, G.P., Cleveland, C.C., Green, P.A., Holland, E.A., Karl, D.M., Michaels, A.F., Porter, J.H., Townsend, A.R., and Vöosmarty, C.J., 2004, Nitrogen cycles—Past, present, and future: Biogeochemistry, v. 70, no. 2, p. 153–226, accessed May 19, 2023, at https://doi.org/10.1007/s10533-004-0370-0.
Gellis, A.C., Fuller, C.C., and Van Metre, P.C., 2017, Sources and ages of fine-grained sediment to streams using fallout radionuclides in the Midwestern United States: Journal of Environmental Management, v. 194, p. 73–85, accessed June 5, 2023, at https://doi.org/10.1016/j.jenvman.2016.06.018.
Gellis, A.C., Harvey, J.W., Conaway, C.H., and Baker, N.T., 2024, Fine sediment drivers of aquatic ecosystem health, chap. D of Harvey, J.W., Conaway, C.H., Dornblaser, M., Gellis, A., Stewart, A.R., and Green, C.T., eds., 2024, Knowledge gaps and opportunities in water-quality drivers of aquatic ecosystem health: U.S. Geological Survey Open-File Report 2023–1085, 18 p., accessed March 15, 2024, at https://doi.org/10.3133/ofr20231085.
Giblin, S.M., Larson, J.H., and King, J.D., 2022, Environmental drivers of cyanobacterial abundance and cyanotoxin production in backwaters of the Upper Mississippi River: River Research and Applications, v. 38, no. 6, p. 1115–1128, accessed March 27, 2023, at https://doi.org/10.1002/rra.3987.
Gibson, J.M., Fisher, M., Clonch, A., MacDonald, J.M., and Cook, P.J., 2020, Children drinking private well water have higher blood lead than those with city water: Proceedings of the National Academy of Sciences of the United States of America, v. 117, no. 29, p. 16898–16907, accessed June 2, 2023, at https://doi.org/10.1073/pnas.2002729117.
Gibson, J.M., and Pieper, K.J., 2017, Strategies to improve private-well water quality—A North Carolina perspective: Environmental Health Perspectives, v. 125, no. 7, 9 p., accessed June 2, 2023, at https://doi.org/10.1289/EHP890.
Glassmeyer, S.T., Furlong, E.T., Kolpin, D.W., Cahill, J.D., Zaugg, S.D., Werner, S.L., Meyer, M.T., and Kryak, D.D., 2005, Transport of chemical and microbial compounds from known wastewater discharges—Potential for use as indicators of human fecal contamination: Environmental Science & Technology, v. 39, no. 14, p. 5157–5169, accessed April 6, 2023, at https://doi.org/10.1021/es048120k.
Gordon, S., Jones, D.K., Blazer, V.S., Iwanowicz, L., Williams, B., and Smalling, K., 2021, Modeling estrogenic activity in streams throughout the Potomac and Chesapeake Bay watersheds: Environmental Monitoring and Assessment, v. 193, no. 2, p. 105, accessed April 3, 2023, at https://doi.org/10.1007/s10661-021-08899-1.
Gorski, G., Stets, E., Scholl, M.A., Degnan, J.R., Mullaney, J.R., Galanter, A.E., Martinez, A.J., Padilla, J., LaFontaine, J.H., Corson-Dosch, H.R., and Shapiro, A.M., 2025, Water supply in the conterminous United States, Alaska, Hawaii, and Puerto Rico, water years 2010–20 (ver. 1.1, January 17, 2025), chap. B of U.S. Geological Survey Integrated Water Availability Assessment—2010–20 (ver. 1.1, January 17, 2025): U.S. Geological Survey Professional Paper 1894–B, 60 p., https://doi.org/10.3133/pp1894B.
Graham, J.L., Dubrovsky, N.M., Foster, G.M., King, L.R., Loftin, K.A., Rosen, B.H., and Stelzer, E.A., 2020, Cyanotoxin occurrence in large rivers of the United States: Inland Waters, v. 10, no. 1, p. 109–117, accessed October 18, 2022, at https://doi.org/10.1080/20442041.2019.1700749.
Gray, N.F., 1997, Environmental impact and remediation of acid mine drainage—A management problem: Environmental Geology, v. 30, no. 1, p. 62–71, accessed May 19, 2023, at https://doi.org/10.1007/s002540050133.
Grossman, E.E., Crosby, S.C., Stevens, A.W., Nowacki, D.J., vanArendonk, N.R., and Curran, C.A., 2022, Assessment of vulnerabilities and opportunities to restore marsh sediment supply at Nisqually River Delta, west-central Washington: U.S. Geological Survey Open-File Report 2022–1088, 50 p., accessed February 13, 2023, at https://doi.org/10.3133/ofr20221088.
Hale, R.C., Seeley, M.E., La Guardia, M.J., Mai, L., and Zeng, E.Y., 2020, A global perspective on microplastics: Journal of Geophysical Research—Oceans, v. 125, no. 1, 40 p., accessed May 19, 2023, at https://doi.org/10.1029/2018JC014719.
Handler, A.M., Compton, J.E., Hill, R.A., Leibowitz, S.G., and Schaeffer, B.A., 2023, Identifying lakes at risk of toxic cyanobacterial blooms using satellite imagery and field surveys across the United States: Science of the Total Environment, v. 869, 12 p., accessed March 9, 2023, at https://doi.org/10.1016/j.scitotenv.2023.161784.
Harkness, J.S., Dwyer, G.S., Warner, N.R., Parker, K.M., Mitch, W.A., and Vengosh, A., 2015, Iodide, bromide, and ammonium in hydraulic fracturing and oil and gas wastewaters—Environmental implications: Environmental Science & Technology, v. 49, no. 3, p. 1955–1963, accessed April 7, 2023, at https://doi.org/10.1021/es504654n.
Harte, P.T., Ayotte, J.D., Hoffman, A., Révész, K.M., Belaval, M., Lamb, S., and Böhlke, J.K., 2012, Heterogeneous redox conditions, arsenic mobility, and groundwater flow in a fractured-rock aquifer near a waste repository site in New Hampshire, USA: Hydrogeology Journal, v. 20, no. 6, p. 1189–1201, accessed February 28, 2023, at https://doi.org/10.1007/s10040-012-0844-4.
Harvey, J.W., Conaway, C., Dornblaser, M.M., Gellis, A.C., Stewart, R., Baker, N.T., Jasmann, J.R., Repert, D.A., Smith, R.L., Tomaszewski, E.J., Wickland, K.P., and Green, C.T., eds., 2024, Knowledge gaps and opportunities in water quality drivers of aquatic ecosystem health: U.S. Geological Survey Open-File Report 2023–1085, 72 p., accessed March 15, 2024, at https://doi.org/10.3133/ofr20231085/.
Health Canada, 2019, Guidelines for Canadian drinking water quality—Guideline technical document−Manganese: Ottawa, Ontario, Canada, accessed February 16, 2023, at https://www.canada.ca/en/health-canada/services/publications/healthy-living/guidelines-canadian-drinking-water-quality-guideline-technical-document-ma nganese.html.
Heindel, J.J., Howard, S., Agay-Shay, K., Arrebola, J.P., Audouze, K., Babin, P.J., Barouki, R., Bansal, A., Blanc, E., Cave, M.C., Chatterjee, S., Chevalier, N., Choudhury, M., Collier, D., Connolly, L., Coumoul, X., Garruti, G., Gilbertson, M., Hoepner, L.A., Holloway, A.C., Howell, G., III, Kassotis, C.D., Kay, M.K., Kim, M.J., Lagadic-Gossmann, D., Langouet, S., Legrand, A., Li, Z., Le Mentec, H., Lind, L., Monica Lind, P., Lustig, R.H., Martin-Chouly, C., Munic Kos, V., Podechard, N., Roepke, T.A., Sargis, R.M., Starling, A., Tomlinson, C.R., Touma, C., Vondracek, J., vom Saal, F., and Blumberg, B., 2022, Obesity II—Establishing causal links between chemical exposures and obesity: Biochemical Pharmacology, v. 199, 49 p., accessed on February 15, 2023, at https://doi.org/10.1016/j.bcp.2022.115015.
Herrick, R.F., Stewart, J.H., and Allen, J.G., 2016, Review of PCBs in U.S. schools—A brief history, an estimate of the number of impacted schools, and an approach for evaluating indoor air samples: Environmental Science and Pollution Research International, v. 23, no. 3, p. 1975–1985, accessed August 3, 2023, at https://doi.org/10.1007/s11356-015-4574-8.
Hill, R.A., Fox, E.W., Leibowitz, S.G., Olsen, A.R., Thornbrugh, D.J., and Weber, M.H., 2017, Predictive mapping of the biotic condition of conterminous U.S. rivers and streams: Ecological Applications, v. 27, no. 8, p. 2397–2415, accessed October 16, 2023, at https://doi.org/10.1002/eap.1617.
Hill, R.A., Moore, C.C., Doyle, J.M., Leibowitz, S.G., Ringold, P.L., and Rashleigh, B., 2023, Estimating biotic integrity to capture existence value of freshwater ecosystems: Proceedings of the National Academy of Sciences of the United States of America, v. 120, no. 18, 8 p., accessed October 16, 2023, at https://doi.org/10.1073/pnas.2120259119.
Hintz, W.D., Fay, L., and Relyea, R.A., 2022, Road salts, human safety, and the rising salinity of our fresh waters: Frontiers in Ecology and the Environment, v. 20, no. 1, p. 22–30, accessed October 19, 2022, at https://doi.org/10.1002/fee.2433.
Hobday, D.K., and Galloway, W.E., 1999, Groundwater processes and sedimentary uranium deposits: Hydrogeology Journal, v. 7, no. 1, p. 127–138, accessed March 30, 2023, at https://doi.org/10.1007/s100400050184.
Hoos, A.B., and Roland, II, V.L., 2019, Spatially referenced models of streamflow and nitrogen, phosphorus, and suspended-sediment loads in the southeastern United States: U.S. Geological Survey Scientific Investigations Report 2019–5135, 87 p., accessed October 14, 2022, at https://doi.org/10.3133/sir20195135.
Horký, P., Grabic, R., Grabicová, K., Brooks, B.W., Douda, K., Slavík, O., Hubená, P., Sancho Santos, E.M., and Randák, T., 2021, Methamphetamine pollution elicits addiction in wild fish: The Journal of Experimental Biology, v. 224, no. 13, 7 p., accessed October 8, 2023, at https://doi.org/10.1242/jeb.242145.
Hubbard, L.E., Kolpin, D.W., Givens, C.E., Blackwell, B.R., Bradley, P.M., Gray, J.L., Lane, R.F., Masoner, J.R., McCleskey, R.B., Romanok, K.M., Sandstrom, M.W., Smalling, K.L., and Villeneuve, D.L., 2022, Food, beverage, and feedstock processing facility wastewater—A unique and underappreciated source of contaminants to U.S. streams: Environmental Science & Technology, v. 56, no. 2, p. 1028–1040, accessed October 18, 2022, at https://doi.org/10.1021/acs.est.1c06821.
Hunt, R.J., Borchardt, M.A., and Bradbury, K.R., 2014, Viruses as groundwater tracers—Using ecohydrology to characterize short travel times in aquifers: Ground Water, v. 52, no. 2, p. 187–193, accessed April 5, 2023, at https://doi.org/10.1111/gwat.12158.
Hurdle, J., 2021, As sea levels rises, will drinking water supplies be at risk?: YaleEnvironment-360, accessed April 6, 2023, at https://e360.yale.edu/features/as-sea-levels-rise-will-drinking-water-supplies-be-at-risk.
Hwang, H.-M., Fiala, M.J., Park, D., and Wade, T.L., 2016, Review of pollutants in urban road dust and stormwater runoff—Part 1—Heavy metals released from vehicles: International Journal of Urban Sciences, v. 20, no. 3, p. 334–360, accessed May 19, 2023, at https://doi.org/10.1080/12265934.2016.1193041.
Isaak, D.J., Wenger, S.J., Peterson, E.E., Ver Hoef, J.M., Nagel, D.E., Luce, C.H., Hostetler, S.W., Dunham, J.B., Roper, B.B., Wollrab, S.P., Chandler, G.L., Horan, D.L., and Parkes-Payne, S., 2017, The NorWeST summer stream temperature model and scenarios for the western US—A crowd‐sourced database and new geospatial tools foster a user community and predict broad climate warming of rivers and streams: Water Resources Research, v. 53, no. 11, p. 9181–9205, accessed June 2, 2023, at https://doi.org/10.1002/2017WR020969.
Ishee, E.R., Ross, D.S., Garvey, K.M., Bourgault, R.R., and Ford, C.R., 2015, Phosphorus characterization and contribution from eroding streambank soils of Vermont’s Lake Champlain Basin: Journal of Environmental Quality, v. 44, no. 6, p. 1745–1753, accessed August 9, 2023, at https://doi.org/10.2134/jeq2015.02.0108.
Ishii, N., and Terao, T., 2018, Trace lithium and mental health: Journal of Neural Transmission, v. 125, no. 2, p. 223–227, accessed March 31, 2023, at https://doi.org/10.1007/s00702-017-1824-6.
James, L.A., 2013, Legacy sediment—Definitions and processes of episodically produced anthropogenic sediment: Anthropocene, v. 2, p. 16–26, accessed October 18, 2023, at https://doi.org/10.1016/j.ancene.2013.04.001.
Jiang, J., Liu, M., Parvez, F., Wang, B., Wu, F., Eunus, M., Bangalore, S., Newman, J.D., Ahmed, A., Islam, T., Rakibuz-Zaman, M., Hasan, R., Sarwar, G., Levy, D., Slavkovich, V., Argos, M., Bryan, M.S., Farzan, S.F., Hayes, R.B., Graziano, J.H., Ahsan, H., and Chen, Y., 2015, Association between arsenic exposure from drinking water and longitudinal change in blood pressure among HEALS cohort participants: Environmental Health Perspectives, v. 123, no. 8, p. 806–812, accessed February 8, 2024, at https://doi.org/10.1289/ehp.1409004.
Johnson, T.D., Belitz, K., Kauffman, L.J., Watson, E., and Wilson, J.T., 2022, Populations using public-supply groundwater in the conterminous U.S. 2010—Identifying the wells, hydrogeologic regions, and hydrogeologic mapping units: Science of the Total Environment, v. 806, 15 p., accessed October 3, 2022, at https://doi.org/10.1016/j.scitotenv.2021.150618.
Johnson, T.D., Belitz, K., Kauffman, L.J., Wilson, J.T., and Watson, E., 2021, Estimated equivalent population using groundwater for public supply domestic use in the conterminous U.S. 2010, hydrogeologic mapping units, and wells used: U.S. Geological Survey data release, accessed October 3, 2022, at https://doi.org/10.5066/P97Y8D6Q.
Johnson, T.D., Belitz, K., and Lombard, M.A., 2019, Estimating domestic well locations and populations served in the contiguous U.S. for years 2000 and 2010: Science of the Total Environment, v. 687, p. 1261–1273, accessed October 3, 2022, at https://doi.org/10.1016/j.scitotenv.2019.06.036.
Jones, J.I., Murphy, J.F., Collins, A.L., Sear, D.A., Naden, P.S., and Armitage, P.D., 2012, The impact of fine sediment on macro-invertebrates: River Research and Applications, v. 28, no. 8, p. 1055–1071, accessed May 19, 2023, at https://doi.org/10.1002/rra.1516.
Jones, L., Credo, J., Parnell, R., and Ingram, J.C., 2020a, Dissolved uranium and arsenic in unregulated groundwater sources—Western Navajo Nation: Journal of Contemporary Water Research & Education, v. 169, no. 1, p. 27–43, accessed May 19, 2023, at https://doi.org/10.1111/j.1936-704X.2020.03330.x.
Jones, M.C., Credo, J.M., Ingram, J.C., Baldwin, J.A., Trotter, R.T., Jr., and Propper, C.R., 2020b, Arsenic concentrations in ground and surface waters across Arizona including native lands: Journal of Contemporary Water Research & Education, v. 169, no. 1, p. 44–60, accessed May 19, 2023, at https://doi.org/10.1111/j.1936-704X.2020.03331.x.
Jurgens, B.C., Böhlke, J.K., and Eberts, S.M., 2012, TracerLPM—Version 1—An Excel® workbook for interpreting groundwater age distributions from environmental tracer data: U.S. Geological Survey Techniques and Methods, book 4. chap. F3, 60 p., accessed March 31, 2023, at https://doi.org/10.3133/tm4F3.
Jurgens, B.C., Böhlke, J.K., Haase, K., Busenberg, E., Hunt, A.G., and Hansen, J.A., 2020, DGMETA—Version 1—Dissolved gas modeling and environmental tracer analysis computer program: U.S. Geological Survey Techniques and Methods, book 4, chap. F5, 50 p., accessed March 31, 2023, at https://doi.org/10.3133/tm4F5.
Jurgens, B.C., Böhlke, J.K., Kauffman, L.J., Belitz, K., and Esser, B.K., 2016, A partial exponential lumped parameter model to evaluate groundwater age distributions and nitrate trends in long-screened wells: Journal of Hydrology, v. 543, p. 109–126, accessed March 31, 2023, at https://doi.org/10.1016/j.jhydrol.2016.05.011.
Jurgens, B.C., Faulkner, K., McMahon, P.B., Hunt, A.G., Casile, G., Young, M.B., and Belitz, K., 2022, Over a third of groundwater in USA public-supply aquifers is Anthropocene-age and susceptible to surface contamination: Communications Earth & Environment, v. 3, no. 1, p. 153, accessed March 31, 2023, at https://doi.org/10.1038/s43247-022-00473-y.
Jurgens, B.C., Fram, M.S., Belitz, K., Burow, K.R., and Landon, M.K., 2010, Effects of groundwater development on uranium—Central Valley, California, USA: Ground Water, v. 48, no. 6, p. 913–928, accessed March 31, 2023, at https://doi.org/10.1111/j.1745-6584.2009.00635.x.
Jurgens, B.C., McMahon, P.B., Chapelle, F.H., and Eberts, S.M., 2009, An Excel workbook for identifying redox processes in ground water: U.S. Geological Survey Open-File Report 2009-1004, 8 p., accessed October 19, 2022, at https://doi.org/10.3133/ofr20091004.
Jurgens, B.C., Parkhurst, D.L., and Belitz, K., 2019, Assessing the lead solubility potential of untreated groundwater of the United States: Environmental Science & Technology, v. 53, no. 6, p. 3095–3103, accessed April 3, 2023, at https://doi.org/10.1021/acs.est.8b04475.
Katner, A.L., Brown, K., Pieper, K., Edwards, M., Lambrinidou, Y., and Subra, W., 2018, America’s path to drinking water infrastructure inequality and environmental injustice—The Case of Flint, Michigan, in Brinkmann, R., and Garren, S.J., eds., The Palgrave handbook of sustainability—Case studies and practical solutions: Cham, Switzerland, Springer International Publishing, p. 79–97.
Kaufmann, P.R., Hughes, R.M., Paulsen, S.G., Peck, D.V., Seeliger, C.W., Kincaid, T., and Mitchell, R.M., 2022a, Physical habitat in conterminous US streams and rivers, part 2—A quantitative assessment of habitat condition: Ecological Indicators, v. 141, 15 p., accessed August 16, 2023, at https://doi.org/10.1016/j.ecolind.2022.109047.
Kaufmann, P.R., Hughes, R.M., Paulsen, S.G., Peck, D.V., Seeliger, C.W., Weber, M.H., and Mitchell, R.M., 2022b, Physical habitat in conterminous US streams and rivers, part 1—Geoclimatic controls and anthropogenic alteration: Ecological Indicators, v. 141, 21 p., accessed August 16, 2023, at https://doi.org/10.1016/j.ecolind.2022.109046.
Kaushal, S.S., Likens, G.E., Pace, M.L., Reimer, J.E., Maas, C.M., Galella, J.G., Utz, R.M., Duan, S., Kryger, J.R., Yaculak, A.M., Boger, W.L., Bailey, N.W., Haq, S., Wood, K.L., Wessel, B.M., Park, C.E., Collison, D.C., Aisin, B.Y.I., Gedeon, T.M., Chaudhary, S.K., Widmer, J., Blackwood, C.R., Bolster, C.M., Devilbiss, M.L., Garrison, D.L., Halevi, S., Kese, G.Q., Quach, E.K., Rogelio, C.M.P., Tan, M.L., Wald, H.J.S., and Woglo, S.A., 2021, Freshwater salinization syndrome—From emerging global problem to managing risks: Biogeochemistry, v. 154, no. 2, p. 255–292, accessed April 3, 2023, at https://doi.org/10.1007/s10533-021-00784-w.
Kaushal, S.S., Likens, G.E., Pace, M.L., Utz, R.M., Haq, S., Gorman, J., and Grese, M., 2018, Freshwater salinization syndrome on a continental scale: Proceedings of the National Academy of Sciences of the United States of America, v. 115, no. 4, p. E574–E583, accessed April 3, 2023, at https://doi.org/10.1073/pnas.1711234115.
Keck, F., and Lepori, F., 2012, Can we predict nutrient limitation in streams and rivers?: Freshwater Biology, v. 57, no. 7, p. 1410–1421, accessed July 31, 2023, at https://doi.org/10.1111/j.1365-2427.2012.02802.x.
Keely, S.P., Brinkman, N.E., Wheaton, E.A., Jahne, M.A., Siefring, S.D., Varma, M., Hill, R.A., Leibowitz, S.G., Martin, R.W., Garland, J.L., and Haugland, R.A., 2022, Geospatial patterns of antimicrobial resistance genes in the US EPA national rivers and streams assessment survey: Environmental Science & Technology, v. 56, no. 21, p. 14960–14971, accessed August 16, 2023, at https://doi.org/10.1021/acs.est.2c00813.
Kemp, P., Sear, D., Collins, A., Naden, P., and Jones, I., 2011, The impacts of fine sediment on riverine fish: Hydrological Processes, v. 25, no. 11, p. 1800–1821, accessed March 24, 2023, at https://doi.org/10.1002/hyp.7940.
Kennedy, M., 2016, Lead-laced water in Flint—A step-by-step look at the makings of a crisis: National Public Radio, accessed August 14, 2023, at https://www.npr.org/sections/thetwo-way/2016/04/20/465545378/lead-laced-water-in-flint-a-step-by-sep-look-at-the-makings-of-a-crisis.
Kidd, K.A., Blanchfield, P.J., Mills, K.H., Palace, V.P., Evans, R.E., Lazorchak, J.M., and Flick, R.W., 2007, Collapse of a fish population after exposure to a synthetic estrogen: Proceedings of the National Academy of Sciences of the United States of America, v. 104, no. 21, p. 8897–8901, accessed October 8, 2023, at https://doi.org/10.1073/pnas.0609568104.
Kintisch, E., 2022, At the Great Salt Lake, record salinity and low water imperils millions of birds: Science, v. 377, no. 6612, 2 p., accessed October 17, 2022, at https://doi.org/10.1126/science.ade8712.
Knierim, K.J., Kingsbury, J.A., Belitz, K., Stackelberg, P.E., Minsley, B.J., and Rigby, J.R., 2022, Mapped predictions of manganese and arsenic in an alluvial aquifer using boosted regression trees: Ground Water, v. 60, no. 3, p. 362–376, accessed March 3, 2023, at https://doi.org/10.1111/gwat.13164.
Konisky, D.M., Reenock, C., and Conley, S., 2021, Environmental injustice in Clean Water Act enforcement—Racial and income disparities in inspection time: Environmental Research Letters, v. 16, no. 8, accessed January 17, 2024, at https://doi.org/10.1088/1748-9326/ac1225.
Krajewski, A.K., Jimenez, M.P., Rappazzo, K.M., Lobdell, D.T., and Jagai, J.S., 2021, Aggregated cumulative county arsenic in drinking water and associations with bladder, colorectal, and kidney cancers, accounting for population served: Journal of Exposure Science & Environmental Epidemiology, v. 31, no. 6, p. 979–989, accessed February 16, 2023, at https://doi.org/10.1038/s41370-021-00314-8.
Kullar, S.S., Shao, K., Surette, C., Foucher, D., Mergler, D., Cormier, P., Bellinger, D.C., Barbeau, B., Sauvé, S., and Bouchard, M.F., 2019, A benchmark concentration analysis for manganese in drinking water and IQ deficits in children: Environment International, v. 130, 8 p., accessed February 16, 2023, at https://doi.org/10.1016/j.envint.2019.05.083.
Kumar, V., Parihar, R.D., Sharma, A., Bakshi, P., Singh Sidhu, G.P., Bali, A.S., Karaouzas, I., Bhardwaj, R., Thukral, A.K., Gyasi-Agyei, Y., and Rodrigo-Comino, J., 2019, Global evaluation of heavy metal content in surface water bodies—A meta-analysis using heavy metal pollution indices and multivariate statistical analyses: Chemosphere, v. 236, 14 p., accessed May 19, 2023, at https://doi.org/10.1016/j.chemosphere.2019.124364.
Kuo, C.-C., Moon, K.A., Wang, S.-L., Silbergeld, E., and Navas-Acien, A., 2017, The association of arsenic metabolism with cancer, cardiovascular disease, and diabetes—A systematic review of the epidemiological evidence: Environmental Health Perspectives, v. 125, no. 8, 15 p., accessed February 9, 2024, at https://doi.org/10.1289/EHP577.
Kurttio, P., Komulainen, H., Leino, A., Salonen, L., Auvinen, A., and Saha, H., 2005, Bone as a possible target of chemical toxicity of natural uranium in drinking water: Environmental Health Perspectives, v. 113, no. 1, p. 68–72, accessed March 30, 2023, at https://doi.org/10.1289/ehp.7475.
Larvie, D.Y., Erikson, K.M., and Armah, S.M., 2022, Elevated whole blood manganese is associated with impaired cognition in older adults, NHANES 2013–2014 cycle: Neurotoxicology, v. 91, p. 94–99, accessed February 16, 2023, at https://doi.org/10.1016/j.neuro.2022.04.016.
Laughrey, Z.R., Christensen, V.G., Dusek, R.J., Senegal, S., Lankton, J.S., Ziegler, T.A., Jones, L.C., Jones, D.K., Williams, B.M., Gordon, S., Clyde, G.A., Emery, E.B., and Loftin, K.A., 2022, A review of algal toxin exposures on reserved federal lands and among trust species in the United States: Critical Reviews in Environmental Science and Technology, v. 52, no. 23, p. 4284–4307, accessed February 15, 2023, at https://doi.org/10.1080/10643389.2021.2010511.
Lazur, A., VanDerwerker, T., and Koepenick, K., 2020, Review of implications of road salt use on groundwater quality—Corrosivity and mobilization of heavy metals and radionuclides: Water, Air, and Soil Pollution, v. 231, no. 9, p. 474, accessed April 3, 2023, at https://doi.org/10.1007/s11270-020-04843-0.
Leach, J.A., Kelleher, C., Kurylyk, B.L., Moore, R.D., and Neilson, B.T., 2023, A primer on stream temperature processes: WIREs Water, v. 10, no. 4, 18 p., accessed December 29, 2023, at https://doi.org/10.1002/wat2.1643.
LeMonte, J.J., Stuckey, J.W., Sanchez, J.Z., Tappero, R., Rinklebe, J., and Sparks, D.L., 2017, Sea level rise induced arsenic release from historically contaminated coastal soils: Environmental Science & Technology, v. 51, no. 11, p. 5913–5922, accessed April 6, 2023, at https://doi.org/10.1021/acs.est.6b06152.
Letcher, B.H., Hocking, D.J., O’Neil, K., Whiteley, A.R., Nislow, K.H., and O’Donnell, M.J., 2016, A hierarchical model of daily stream temperature using air-water temperature synchronization, autocorrelation, and time lags: PeerJ, v. 4, 26 p., accessed March 29, 2023, at https://doi.org/10.7717/peerj.1727.
Levitt, J.P., Degnan, J.R., Flanagan, S.M., and Jurgens, B.C., 2019, Arsenic variability and groundwater age in three water supply wells in southeast New Hampshire: Geoscience Frontiers, v. 10, no. 5, p. 1669–1683, accessed July 31, 2024, at https://doi.org/10.1016/j.gsf.2019.01.002.
Levitt, J.P., and Larsen, S.L., 2020, Groundwater chloride concentrations in domestic wells and proximity to roadways in Vermont, 2011–2018: U.S. Geological Survey Open-File Report 2019–1148, 12 p., accessed April 3, 2023, at https://doi.org/10.3133/ofr20191148.
Li, C., Busquets, R., and Campos, L.C., 2020, Assessment of microplastics in freshwater systems—A review: Science of the Total Environment, v. 707, 12 p., accessed October 6, 2023, at https://doi.org/10.1016/j.scitotenv.2019.135578.
Li, X., Chen, Y., Zhang, S., Dong, Y., Pang, Q., Lynch, I., Xie, C., Guo, Z., and Zhang, P., 2023, From marine to freshwater environment—A review of the ecotoxicological effects of microplastics: Ecotoxicology and Environmental Safety, v. 251, 15 p., accessed October 6, 2023, at https://doi.org/10.1016/j.ecoenv.2023.114564.
Lima, A.L.C., Farrington, J.W., and Reddy, C.M., 2005, Combustion-derived polycyclic aromatic hydrocarbons in the environment—A review: Environmental Forensics, v. 6, no. 2, p. 109–131, accessed August 16, 2023, at https://doi.org/10.1080/15275920590952739.
Lindsey, B.D., Ayotte, J.D., Jurgens, B.C., and Desimone, L.A., 2017, Using groundwater age distributions to understand changes in methyl tert-butyl ether (MtBE) concentrations in ambient groundwater, northeastern United States: Science of the Total Environment, v. 579, p. 579–587, accessed March 31, 2023, at https://doi.org/10.1016/j.scitotenv.2016.11.058.
Lindsey, B.D., Belitz, K., Cravotta, C.A., III, Toccalino, P.L., and Dubrovsky, N.M., 2021a, Lithium in groundwater used for drinking-water supply in the United States: Science of the Total Environment, v. 767, 15 p., accessed October 19, 2022, at https://doi.org/10.1016/j.scitotenv.2020.144691.
Lindsey, B.D., Cravotta, III, C.A., Szabo, Z., Belitz, K., and Stackelberg, P., 2021b, Relation between road-salt application and increasing radium concentrations in a low-pH aquifer, southern New Jersey: ACS ES&T Water, v. 1, no. 12, p. 2541–2547, accessed October 18, 2022, at https://doi.org/10.1021/acsestwater.1c00307.
Lindsey, B.D., Jurgens, B.C., and Belitz, K., 2019, Tritium as an indicator of modern, mixed, and premodern groundwater age: U.S. Geological survey Scientific Investigations Report 2019–5090, 18 p., accessed October 19, 2022, at https://doi.org/10.3133/sir20195090.
Lombard, M.A., Brown, E.E., Saftner, D.M., Arienzo, M.M., Fuller-Thomson, E., Brown, C.J., and Ayotte, J.D., 2024, Estimating lithium concentrations in groundwater used as drinking water for the conterminous United States: Environmental Science & Technology, v. 58, no. 2, p. 1255–1264, accessed January 11, 2024, at https://doi.org/10.1021/acs.est.3c03315.
Lombard, M.A., Bryan, M.S., Jones, D.K., Bulka, C., Bradley, P.M., Backer, L.C., Focazio, M.J., Silverman, D.T., Toccalino, P., Argos, M., Gribble, M.O., and Ayotte, J.D., 2021a, Machine learning models of arsenic in private wells throughout the conterminous United States as a tool for exposure assessment in human health studies: Environmental Science & Technology, v. 55, no. 8, p. 5012–5023, accessed February 16, 2023, at https://doi.org/10.1021/acs.est.0c05239.
Lombard, M.A., Daniel, J., Jeddy, Z., Hay, L.E., and Ayotte, J.D., 2021b, Assessing the impact of drought on arsenic exposure from private domestic wells in the conterminous United States: Environmental Science & Technology, v. 55, no. 3, p. 1822–1831, accessed February 28, 2023, at https://doi.org/10.1021/acs.est.9b05835.
Lovley, D.R., 1993, Dissimilatory metal reduction: Annual Review of Microbiology, v. 47, no. 1, p. 263–290, accessed May 25, 2023, at https://doi.org/10.1146/annurev.mi.47.100193.001403.
Lundgren, M.S., and Novak, P.J., 2009, Quantification of phytoestrogens in industrial waste streams: Environmental Toxicology and Chemistry, v. 28, no. 11, p. 2318–2323, accessed April 3, 2023, at https://doi.org/10.1897/09-029.1.
Madden, N., Lewis, A., and Davis, M., 2013, Thermal effluent from the power sector—An analysis of once-through cooling system impacts on surface water temperature: Environmental Research Letters, v. 8, no. 3, 8 p., accessed January 18, 2024, at https://doi.org/10.1088/1748-9326/8/3/035006.
Mahaffey, K.R., Sunderland, E.M., Chan, H.M., Choi, A.L., Grandjean, P., Mariën, K., Oken, E., Sakamoto, M., Schoeny, R., Weihe, P., Yan, C.-H., and Yasutake, A., 2011, Balancing the benefits of n-3 polyunsaturated fatty acids and the risks of methylmercury exposure from fish consumption: Nutrition Reviews, v. 69, no. 9, p. 493–508, accessed February 16, 2023, at https://doi.org/10.1111/j.1753-4887.2011.00415.x.
Mahler, B.J., Nowell, L.H., Sandstrom, M.W., Bradley, P.M., Romanok, K.M., Konrad, C.P., and Van Metre, P.C., 2021, Inclusion of pesticide transformation products is key to estimating pesticide exposures and effects in small U.S. streams: Environmental Science & Technology, v. 55, no. 8, p. 4740–4752, accessed March 24, 2023, at https://doi.org/10.1021/acs.est.0c06625.
Mahler, B.J., Van Metre, P.C., and Foreman, W.T., 2014, Concentrations of polycyclic aromatic hydrocarbons (PAHs) and azaarenes in runoff from coal-tar- and asphalt-sealcoated pavement: Environmental Pollution, v. 188, p. 81–87, accessed August 17, 2023, at https://doi.org/10.1016/j.envpol.2014.01.008.
Mahoney, H., Xie, Y., Brinkmann, M., and Giesy, J.P., 2022, Next generation per- and poly-fluoroalkyl substances—Status and trends, aquatic toxicity, and risk assessment: Eco-Environment & Health, v. 1, no. 2, p. 117–131, accessed February 9, 2023, at https://doi.org/10.1016/j.eehl.2022.05.002.
Malcolm, I.A., Soulsby, C., Youngson, A.F., Hannah, D.M., McLaren, I.S., and Thorne, A., 2004, Hydrological influences on hyporheic water quality—Implications for salmon egg survival: Hydrological Processes, v. 18, no. 9, p. 1543–1560, accessed May 19, 2023, at https://doi.org/10.1002/hyp.1405.
Malecki, K.M.C., Schultz, A.A., Severtson, D.J., Anderson, H.A., and VanDerslice, J.A., 2017, Private-well stewardship among a general population based sample of private well-owners: Science of the Total Environment, v. 601–602, p. 1533–1543, accessed June 2, 2023, at https://doi.org/10.1016/j.scitotenv.2017.05.284.
Mallah, M.A., Changxing, L., Mallah, M.A., Noreen, S., Liu, Y., Saeed, M., Xi, H., Ahmed, B., Feng, F., Mirjat, A.A., Wang, W., Jabar, A., Naveed, M., Li, J.-H., and Zhang, Q., 2022, Polycyclic aromatic hydrocarbon and its effects on human health—An overeview: Chemosphere, v. 296, 16 p., accessed August 17, 2023, at https://doi.org/10.1016/j.chemosphere.2022.133948.
Marshall, I., and Mozee, S., Jr., 2022, Implications of the 2021 Jackson water crisis—Past, present, and future: Online Journal of Rural & Urban Research, Jackson State University, Spring 2022 Special Issue, 131 p., accessed January 12, 2024, at https://www.jsums.edu/murc/files/2023/08/2022.OJRUR_JacksonWaterCrisis_Special.Issue_.Final_.pdf.
Martinez, A.J., Azadpour, E., Padilla, J.A., Cashman, M.J., and Miller, O.I., 2024, Water quality across the conterminous United States using SPARROW 2012 simulated nutrient load estimates: U.S. Geological Survey software release, https://doi.org/10.5066/P14XRQ9R.
Marvin-DiPasquale, M., Lutz, M.A., Brigham, M.E., Krabbenhoft, D.P., Aiken, G.R., Orem, W.H., and Hall, B.D., 2009, Mercury cycling in stream ecosystems—2, Benthic methylmercury production and bed sediment—Pore water partitioning: Environmental Science & Technology, v. 43, no. 8, p. 2726–2732, accessed March 27, 2023, at https://doi.org/10.1021/es802698v.
McCabe, K.M., Smith, E.M., Lang, S.Q., Osburn, C.L., and Benitez-Nelson, C.R., 2021, Particulate and dissolved organic matter in stormwater runoff influences oxygen demand in urbanized headwater catchments: Environmental Science & Technology, v. 55, no. 2, p. 952–961, accessed August 8, 2024, at https://doi.org/10.1021/acs.est.0c04502.
McDevitt, B., McLaughlin, M., Cravotta, C.A., Ajemigbitse, M.A., Van Sice, K.J., Blotevogel, J., Borch, T., and Warner, N.R., 2019, Emerging investigator series—Radium accumulation in carbonate river sediments at oil and gas produced water discharges—Implications for beneficial use as disposal management: Environmental Science Processes & Impacts, v. 21, no. 2, p. 324–338, accessed April 9, 2023, at https://doi.org/10.1039/C8EM00336J.
McIntyre, J.K., Spromberg, J., Cameron, J., Incardona, J.P., Davis, J.W., and Scholz, N.L., 2023, Bioretention filtration prevents acute mortality and reduces chronic toxicity for early life stage coho salmon (Oncorhynchus kisutch) episodically exposed to urban stormwater runoff: Science of the Total Environment, v. 902, 11 p, accessed August 16, 2023, at https://doi.org/10.1016/j.scitotenv.2023.165759.
McMahon, P.B., Belitz, K., Reddy, J.E., and Johnson, T.D., 2019, Elevated manganese concentrations in United States groundwater, role of land surface–Soil–aquifer connections: Environmental Science & Technology, v. 53, no. 1, p. 29–38, accessed October 3, 2022, at https://doi.org/10.1021/acs.est.8b04055.
McMahon, P.B., Böhlke, J.K., Dahm, K.G., Parkhurst, D.L., Anning, D.W., and Stanton, J.S., 2016, Chemical considerations for an updated national assessment of brackish groundwater resources: Ground Water, v. 54, no. 4, p. 464–475, accessed October 3, 2022, at https://doi.org/10.1111/gwat.12367.
McMahon, P.B., Brown, C.J., Johnson, T.D., Belitz, K., and Lindsey, B.D., 2020, Fluoride occurrence in United States groundwater: Science of the Total Environment, v. 732, 15 p., accessed October 3, 2022, at https://doi.org/10.1016/j.scitotenv.2020.139217.
McMahon, P.B., and Chapelle, F.H., 2008, Redox processes and water quality of selected principal aquifer systems: Ground Water, v. 46, no. 2, p. 259–271, accessed October 3, 2022, at https://doi.org/10.1111/j.1745-6584.2007.00385.x.
McMahon, P.B., Tokranov, A.K., Bexfield, L.M., Lindsey, B.D., Johnson, T.D., Lombard, M.A., and Watson, E., 2022, Perfluoroalkyl and polyfluoroalkyl substances in groundwater used as a source of drinking water in the eastern United States: Environmental Science & Technology, v. 56, no. 4, p. 2279–2288, accessed October 3, 2022, at https://doi.org/10.1021/acs.est.1c04795.
McManamay, R.A., and DeRolph, C.R., 2019, A stream classification system for the conterminous United States: Scientific Data, v. 6, no. 1, 18 p., accessed October 18, 2022, at https://doi.org/10.1038/sdata.2019.17.
McNaboe, L.A., Robbins, G.A., and Dietz, M.E., 2017, Mobilization of radium and radon by deicing salt contamination of groundwater: Water, Air, and Soil Pollution, v. 228, no. 3, accessed April 3, 2022, at https://doi.org/10.1007/s11270-016-3227-y.
Medalie, L., Galanter, A.E., Martinez, A.J., Archer, A.A., Luukkonen, C.L., Harris, M.A., and Haynes, J.V., 2025, Water use across the conterminous United States, water years 2010–20, chap. D of U.S. Geological Survey Integrated Water Availability Assessment—2010–20: U.S. Geological Survey Professional Paper 1894–D, 56 p., https://doi.org/10.3133/pp1894D.
Melis, T.S., Korman, J., and Kennedy, T.A., 2012, Abiotic & biotic responses of the Colorado River to controlled floods at Glen Canyon Dam, Arizona, USA: River Research and Applications, v. 28, no. 6, p. 764–776, accessed October 8, 2023, at https://doi.org/10.1002/rra.1503.
Mendez, W.M., Jr., Eftim, S., Cohen, J., Warren, I., Cowden, J., Lee, J.S., and Sams, R., 2017, Relationships between arsenic concentrations in drinking water and lung and bladder cancer incidence in U.S. counties: Journal of Exposure Science & Environmental Epidemiology, v. 27, no. 3, p. 235–243, accessed February 16, 2023, at https://doi.org/10.1038/jes.2016.58.
Miller, J.A., 1999, Ground water atlas of the United States—Introduction and national summary: U.S. Geological Survey Hydrologic Atlas 730A, 15 p., accessed October 18, 2022, at https://doi.org/10.3133/ha730A.
Miller, O., Putman, A., Smith, R., Schwarz, G., Hess, M., McDonnell, M., and Jones, D., 2024, Temporal variability in irrigated land and climate influences on salinity loading across the Upper Colorado River Basin, 1986–2017: Environmental Research Letters, v. 19, no. 2, 14 p., accessed February 9, 2024, at https://doi.org/10.1088/1748-9326/ad18dd.
Moore, J., Fanelli, R.M., and Sekellick, A.J., 2020, High-frequency data reveal deicing salts drive elevated specific conductance and chloride along with pervasive and frequent exceedances of the U.S. Environmental Protection Agency aquatic life criteria for chloride in urban streams: Environmental Science & Technology, v. 54, no. 2, p. 778–789, accessed October 14, 2022, at https://doi.org/10.1021/acs.est.9b04316.
Morris, G.L., 2016, Sediment monitoring in extending the life of reservoirs—Sustainable sediment management for dams and run-of-river hydropower: Washington, D.C., The World Bank, p. 77–98. [Also available at https://documents.worldbank.org/en/publication/documents-reports/documentdetail/794841476187802040/extending-the-life-of-reservoirs-sustainable-sedime nt-management-for-dams-and-run-of-river-hydropower.]
Morris, R.D., and Levine, R., 1995, Estimating the incidence of waterborne infectious disease related to drinking water in the United States, in Assessing and managing health risks from drinking water contamination—Approaches and applications, proceedings of the Rome Symposium, September 1994: Wallingford, Oxfordshire, United Kingdom, International Association of Hydrological Sciences Press, p. 75–88.
Mullaney, J.R., Lorenz, D.L., and Arntson, A.D., 2009, Chloride in groundwater and surface water in areas underlain by the glacial aquifer system, Northern United States: U.S. Geological Survey Scientific Investigations Report 2009–5086, 43 p., accessed October 12, 2023, at https://doi.org/10.3133/sir20095086.
Murphy, H.M., McGinnis, S., Blunt, R., Stokdyk, J., Wu, J., Cagle, A., Denno, D.M., Spencer, S., Firnstahl, A., and Borchardt, M.A., 2020, Septic systems and rainfall influence human fecal marker and indicator organism occurrence in private wells in southeastern Pennsylvania: Environmental Science & Technology, v. 54, no. 6, p. 3159–3168, accessed April 5, 2023, at https://doi.org/10.1021/acs.est.9b05405.
Murphy, H.M., Prioleau, M.D., Borchardt, M.A., and Hynds, P.D., 2017, Review—Epidemiological evidence of groundwater contribution to global enteric disease, 1948–2015: Hydrogeology Journal, v. 25, no. 4, p. 981–1001, accessed April 5, 2023, at https://doi.org/10.1007/s10040-017-1543-y.
Musgrove, M., 2021, The occurrence and distribution of strontium in U.S. groundwater: Applied Geochemistry, v. 126, 18 p., accessed October 3, 2022, at https://doi.org/10.1016/j.apgeochem.2020.104867.
Natural Resources Conservation Service, 2011, Assessing water quality for human consumption, agriculture, and aquatic life uses: Natural Resources Conservation Service Environmental Technical Note No. MT-1 (Rev. 2), p. 31, accessed August 9, 2024, at https://docslib.org/doc/13097282/assessing-water-quality-for-human-consumption-agriculture-and-aquatic-life-uses-tom-pick-water-quality-specialist.
Naujokas, M.F., Anderson, B., Ahsan, H., Aposhian, H.V., Graziano, J.H., Thompson, C., and Suk, W.A., 2013, The broad scope of health effects from chronic arsenic exposure—Update on a worldwide public health problem: Environmental Health Perspectives, v. 121, no. 3, p. 295–302, accessed February 16, 2023, at https://doi.org/10.1289/ehp.1205875.
Ngoubeyou, P.S.K., Wolkersdorfer, C., Ndibewu, P.P., and Augustyn, W., 2022, Toxicity of polychlorinated biphenyls in aquatic environments—A review: Aquatic Toxicology, v. 251, 16 p., accessed August 18, 2023, at https://doi.org/10.1016/j.aquatox.2022.106284.
Nigra, A.E., Cazacu-De Luca, A., and Navas-Acien, A., 2022, Socioeconomic vulnerability and public water arsenic concentrations across the US: Environmental Pollution, v. 313, 10 p., accessed October 14, 2022, at https://doi.org/10.1016/j.envpol.2022.120113.
Nigra, A.E., Sanchez, T.R., Nachman, K.E., Harvey, D.E., Chillrud, S.N., Graziano, J.H., and Navas-Acien, A., 2017, The effect of the Environmental Protection Agency maximum contaminant level on arsenic exposure in the USA from 2003 to 2014—An analysis of the National Health and Nutrition Examination Survey (NHANES): The Lancet Public Health, v. 2, no. 11, p. e513–e521, accessed June 2, 2023, at https://doi.org/10.1016/S2468-2667(17)30195-0.
Nolan, J., and Weber, K.A., 2015, Natural uranium contamination in major U.S. aquifers linked to nitrate: Environmental Science & Technology Letters, v. 2, no. 8, p. 215–220, accessed March 30, 2023, at https://doi.org/10.1021/acs.estlett.5b00174.
Norman, J.E., Toccalino, P.L., and Morman, S.A., 2018, Health-based screening levels for evaluating water-quality data (2d ed.): U.S. Geological Survey web page, accessed October 3, 2022, at https://water.usgs.gov/water-resources/hbsl/.
Norton, S.B., Cormier, S.M., Suter, G.W., Schofield, K., Yuan, L., Shaw-Allen, P., and Ziegler, C.R., 2009, CADDIS—The causal analysis/diagnosis decision information system, in Marcomini, A., Suter Ii, G.W., and Critto, A., eds., 2009, Decision support systems for risk-based management of contaminated sites: Boston, Massachusetts, Springer, p. 1–24.
Oelsner, G.P., Sprague, L.A., Murphy, J.C., Zuellig, R.E., Johnson, H.M., Ryberg, K.R., Falcone, J.A., Stets, E.G., Vecchia, A.V., Riskin, M.L., De Cicco, L.A., Mills, T.J., and Farmer, W.H., 2017, Water-quality trends in the Nation’s rivers and streams, 1972–2012—Data preparation, statistical methods, and trend results: U.S. Geological Survey Scientific Investigations Report 2017–5006, 158 p., accessed February 13, 2023, at https://doi.org/10.3133/sir20175006.
Oliver, S.K., Appling, A., Watkins, D., Atshan, R., and Read, J., 2024, Compilation of multi-agency water temperature observations for U.S. streams, 1894–2022: U.S. Geological Survey data release, accessed October 16, 2024, at https://doi.org/10.5066/P9EMWZ35.
Olson, J.R., and Cormier, S.M., 2019, Modeling spatial and temporal variation in natural background specific conductivity: Environmental Science & Technology, v. 53, no. 8, p. 4316–4325, accessed May 19, 2023, at https://doi.org/10.1021/acs.est.8b06777.
Ortúzar, M., Esterhuizen, M., Olicón-Hernández, D.R., González-López, J., and Aranda, E., 2022, Pharmaceutical pollution in aquatic environments—A concise review of environmental impacts and bioremediation systems: Frontiers in Microbiology, v. 13, 25 p., accessed October 8, 2023, at https://doi.org/10.3389/fmicb.2022.869332.
Ozgür, S., Sümer, H., and Koçoğlu, G., 1996, Rickets and soil strontium: Archives of Disease in Childhood, v. 75, no. 6, p. 524–526, accessed March 7, 2023, at https://doi.org/10.1136/adc.75.6.524.
Pennino, M.J., Leibowitz, S.G., Compton, J.E., Hill, R.A., and Sabo, R.D., 2020, Patterns and predictions of drinking water nitrate violations across the conterminous United States: Science of the Total Environment, v. 722, 16 p., accessed March 24, 2023, at https://doi.org/10.1016/j.scitotenv.2020.137661.
Pieper, K.J., Tang, M., and Edwards, M.A., 2017, Flint water crisis caused by interrupted corrosion control—Investigating “ground zero” home: Environmental Science & Technology, v. 51, no. 4, p. 2007–2014, accessed May 19, 2023, at https://doi.org/10.1021/acs.est.6b04034.
Podder, A., Sadmani, A.H.M.A., Reinhart, D., Chang, N.-B., and Goel, R., 2021, Per and poly-fluoroalkyl substances (PFAS) as a contaminant of emerging concern in surface water—A transboundary review of their occurrences and toxicity effects: Journal of Hazardous Materials, v. 419, 22 p., accessed October 19, 2022, at https://doi.org/10.1016/j.jhazmat.2021.126361.
Purifoy, D.M., 2021, North Carolina [un]incorporated—Place, race, and local environmental inequity: The American Behavioral Scientist, v. 65, no. 8, p. 1072–1103, accessed June 2, 2023, at https://doi.org/10.1177/0002764219859645.
Rabalais, N.N., and Turner, R.E., 2019, Gulf of Mexico hypoxia—Past, present, and future: Limnology and Oceanography Bulletin, v. 28, no. 4, p. 117–124, accessed January 11, 2024, at https://doi.org/10.1002/lob.10351.
Randle, T.J., Morris, G.L., Tullos, D.D., Weirich, F.H., Kondolf, G.M., Moriasi, D.N., Annandale, G.W., Fripp, J., Minear, J.T., and Wegner, D.L., 2021, Sustaining United States reservoir storage capacity—Need for a new paradigm: Journal of Hydrology, v. 602, 12 p., accessed January 11, 2024, at https://doi.org/10.1016/j.jhydrol.2021.126686.
Ransom, K., and Kauffman, L., 2023, Data for machine learning predictions of nitrate in shallow groundwater in the conterminous United States: U.S. Geological Survey data release, accessed October 4, 2023, at https://doi.org/10.5066/P9RT579Z.
Ransom, K.M., Nolan, B.T., Stackelberg, P.E., Belitz, K., and Fram, M.S., 2022, Machine learning predictions of nitrate in groundwater used for drinking supply in the conterminous United States: Science of the Total Environment, v. 807, 11 p., accessed October 3, 2022, at https://doi.org/10.1016/j.scitotenv.2021.151065.
Ravalli, F., Yu, Y., Bostick, B.C., Chillrud, S.N., Schilling, K., Basu, A., Navas-Acien, A., and Nigra, A.E., 2022, Sociodemographic inequalities in uranium and other metals in community water systems across the USA, 2006–11—A cross-sectional study: The Lancet Planetary Health, v. 6, no. 4, p. e320–e330, accessed October 14, 2022, at https://doi.org/10.1016/S2542-5196(22)00043-2.
Read, J.S., Jia, X., Willard, J., Appling, A.P., Zwart, J.A., Oliver, S.K., Karpatne, A., Hansen, G.J.A., Hanson, P.C., Watkins, W., Steinbach, M., and Kumar, V., 2019, Process-guided deep learning predictions of lake water temperature: Water Resources Research, v. 55, no. 11, p. 9173–9190, accessed January 5, 2024, at https://doi.org/10.1029/2019WR024922.
Rehman, M., Liu, L., Wang, Q., Saleem, M.H., Bashir, S., Ullah, S., and Peng, D., 2019, Copper environmental toxicology, recent advances, and future outlook—A review: Environmental Science and Pollution Research International, v. 26, no. 18, p. 18003–18016, accessed May 19, 2023, at https://doi.org/10.1007/s11356-019-05073-6.
Reynolds, R.L., Goldstein, H.L., Kokaly, R.F., and Derry, J., 2022, Microplastic particles in dust-on-snow, Upper Colorado River Basin, Colorado Rocky Mountains, 2013–16: U.S. Geological Survey Open-File Report 2022–1061, 7 p., accessed May 25, 2023, at https://doi.org/10.3133/ofr20221061.
Rice, J., and Westerhoff, P., 2017, High levels of endocrine pollutants in US streams during low flow due to insufficient wastewater dilution: Nature Geoscience, v. 10, no. 8, p. 587–591, accessed May 19, 2023, at https://doi.org/10.1038/ngeo2984.
Riedel, T., and Kübeck, C., 2018, Uranium in groundwater—A synopsis based on a large hydrogeochemical data set: Water Research, v. 129, p. 29–38, accessed April 3, 2023, at https://doi.org/10.1016/j.watres.2017.11.001.
Riedel, T., Kübeck, C., and Quirin, M., 2022, Legacy nitrate and trace metal (Mn, Ni, As, Cd, U) pollution in anaerobic groundwater—Quantifying potential health risk from “the other nitrate problem”: Applied Geochemistry, v. 139, 13 p., accessed March 2, 2023, at https://doi.org/10.1016/j.apgeochem.2022.105254.
Riva-Murray, K., Chasar, L.C., Bradley, P.M., Burns, D.A., Brigham, M.E., Smith, M.J., and Abrahamsen, T.A., 2011, Spatial patterns of mercury in macroinvertebrates and fishes from streams of two contrasting forested landscapes in the eastern United States: Ecotoxicology, v. 20, no. 7, p. 1530–1542, accessed March 27, 2023, at https://doi.org/10.1007/s10646-011-0719-9.
Robertson, D.M., and Saad, D.A., 2019, Spatially referenced models of streamflow and nitrogen, phosphorus, and suspended-sediment loads in streams of the midwestern United States: U.S. Geological Survey Scientific Investigations Report 2019–5114, 88 p., accessed August 14, 2022, at https://doi.org/10.3133/sir20195114.
Robertson, D.M., and Saad, D.A., 2021, Nitrogen and phosphorus sources and delivery from the Mississippi/Atchafalaya River Basin—An update using 2012 SPARROW models: Journal of the American Water Resources Association, v. 57, no. 3, p. 406–429, accessed August 14, 2022, at https://doi.org/10.1111/1752-1688.12905.
Romanok, K., Smalling, K., Bradley, P., Riddle, D., Kenefic, L., Gray, J., and Kanagy, L., 2023, Concentrations of per- and polyfluoroalkyl substances (PFAS) in tapwater collected throughout the United States, 2021–22: U.S. Geological Survey data release, accessed December 7, 2023, at https://doi.org/10.5066/P9HIG9WI.
Rosecrans, C.Z., Belitz, K., Ransom, K.M., Stackelberg, P.E., and McMahon, P.B., 2022, Predicting regional fluoride concentrations at public and domestic supply depths in basin-fill aquifers of the western United States using a random forest model: Science of the Total Environment, v. 806, no. 4, 13 p., accessed October 19, 2022, at https://doi.org/10.1016/j.scitotenv.2021.150960.
Rossi, M.L., Kremer, P., Cravotta, III, C.A., Scheirer, K.E., and Goldsmith, S.T., 2022, Long-term impacts of impervious surface cover change and roadway deicing agent application on chloride concentrations in exurban and suburban watersheds: Science of the Total Environment, v. 851, part 2, 13 p., accessed October 19, 2022, at https://doi.org/10.1016/j.scitotenv.2022.157933.
Rowe, G.L., Belitz, K., Demas, C.R., Essaid, H.I., Gilliom, R.J., Hamilton, P.A., Hoos, A.B., Lee, C.J., Munn, M.D., and Wolock, D.W., 2013, Design of cycle 3 of the National Water-Quality Assessment Program, 2013–23—Part 2—Science plan for improved water-quality information and management: U.S. Geological Survey Open-File Report 2013–1160, 110 p., accessed March 22, 2023, at https://doi.org/10.3133/ofr20131160.
Rowe, G.L., Belitz, K., Essaid, H.I., Gilliom, R.J., Hamilton, P.A., Hoos, A.B., Lynch, D.D., Munn, M.D., and Wolock, D.W., 2010, Design of cycle 3 of the National Water-Quality Assessment Program, 2013–2022—Part 1—Framework of water-quality issues and potential approaches: U.S. Geological Survey Open-File Report 2009–1296, 54 p., accessed March 22, 2023, at https://doi.org/10.3133/ofr20091296.
Rumsey, C.A., Miller, M.P., Schwarz, G.E., Hirsch, R.M., and Susong, D.D., 2017, The role of baseflow in dissolved solids delivery to streams in the Upper Colorado River Basin: Hydrological Processes, v. 31, no. 26, p. 4705–4718, accessed October 19, 2022, at https://doi.org/10.1002/hyp.11390.
Sanford, W.E., and Pope, J.P., 2013, Quantifying groundwater’s role in delaying improvements to Chesapeake Bay water quality: Environmental Science & Technology, v. 47, no. 23, p. 13330–13338, accessed January 11, 2024, at https://doi.org/10.1021/es401334k.
Santos, L.H.M.L.M., Araújo, A.N., Fachini, A., Pena, A., Delerue-Matos, C., and Montenegro, M.C.B.S.M., 2010, Ecotoxicological aspects related to the presence of pharmaceuticals in the aquatic environment: Journal of Hazardous Materials, v. 175, nos. 1–3, p. 45–95, accessed October 8, 2023, at https://doi.org/10.1016/j.jhazmat.2009.10.100.
Scanlon, B., Reedy, R., Fakhreddine, S., Yang, Q., and Pierce, G., 2023, Drinking water quality and social vulnerability linkages at the system level in the United States: Environmental Research Letters, v. 18, no. 9, 12 p., accessed January 17, 2024, at https://doi.org/10.1088/1748-9326/ace2d9.
Scanlon, B.R., Fakhreddine, S., Reedy, R.C., Yang, Q., and Malito, J.G., 2022, Drivers of spatiotemporal variability in drinking water quality in the United States: Environmental Science & Technology, v. 56, no. 18, p. 12965–12974, accessed November 2, 2022, at https://doi.org/10.1021/acs.est.1c08697.
Schaider, L.A., Swetschinski, L., Campbell, C., and Rudel, R.A., 2019, Environmental justice and drinking water quality—Are there socioeconomic disparities in nitrate levels in U.S. drinking water?: Environmental Health, v. 18, no. 3, 15 p., accessed October 14, 2022, at https://doi.org/10.1186/s12940-018-0442-6.
Scher, D.P., Goeden, H.M., and Klos, K.S., 2021, Potential for manganese-induced neurologic harm to formula-fed infants—A risk assessment of total oral exposure: Environmental Health Perspectives, v. 129, no. 4, 13 p., accessed October 5, 2022, at https://doi.org/10.1289/EHP7901.
Scheuhammer, A.M., Meyer, M.W., Sandheinrich, M.B., and Murray, M.W., 2007, Effects of environmental methylmercury on the health of wild birds, mammals, and fish: AMBIO—A Journal of the Human Environment, v. 36, no. 1, p. 12–19, accessed February 16, 2023, at https://doi.org/10.1579/0044-7447(2007)36[12:EOEMOT]2.0.CO;2.
Schmidt, T.S., Van Metre, P.C., and Carlisle, D.M., 2019, Linking the agricultural landscape of the Midwest to stream health with structural equation modeling: Environmental Science & Technology, v. 53, no. 1, p. 452–462, accessed October 17, 2022, at https://doi.org/10.1021/acs.est.8b04381.
Schober, S.E., Sinks, T.H., Jones, R.L., Bolger, P.M., McDowell, M., Osterloh, J., Garrett, E.S., Canady, R.A., Dillon, C.F., Sun, Y., Joseph, C.B., and Mahaffey, K.R., 2003, Blood mercury levels in US children and women of childbearing age, 1999–2000: Journal of the American Medical Association, v. 289, no. 13, p. 1667–1674, accessed January 17, 2024, at https://doi.org/10.1001/jama.289.13.1667.
Scholl, M.A., McCabe, G.J., Olson, C.G., and Powlen, K.A., 2025, Climate change and future water availability in the United States, chap. E of U.S. Geological Survey Integrated Water Availability Assessment—2010–20: U.S. Geological Survey Professional Paper 1894–E, 60 p., https://doi.org/10.3133/pp1894E.
Scholz, N.L., Myers, M.S., McCarthy, S.G., Labenia, J.S., McIntyre, J.K., Ylitalo, G.M., Rhodes, L.D., Laetz, C.A., Stehr, C.M., French, B.L., McMillan, B., Wilson, D., Reed, L., Lynch, K.D., Damm, S., Davis, J.W., and Collier, T.K., 2011, Recurrent die-offs of adult coho salmon returning to spawn in Puget Sound Lowland urban streams: PLoS One, v. 6, no. 12, 12 p., accessed August 16, 2023, at https://doi.org/10.1371/journal.pone.0028013.
Schullehner, J., Thygesen, M., Kristiansen, S.M., Hansen, B., Pedersen, C.B., and Dalsgaard, S., 2020, Exposure to manganese in drinking water during childhood and association with attention-deficit hyperactivity disorder—A nationwide cohort study: Environmental Health Perspectives, v. 128, no. 9, 10 p., accessed February 9, 2024, at https://doi.org/10.1289/EHP6391.
Schwarz, G., Hoos, A.B., Alexander, R.B., and Smith, R.A., 2006, Section 3—The SPARROW surface water-quality model—Theory, application and user documentation: U.S. Geological Survey Techniques and Methods, book 6, chap. B3, 248 p., accessed March 22, 2023, at https://doi.org/10.3133/tm6B3.
Seiler, R., 2016, 210Po in drinking water, its potential health effects, and inadequacy of the gross alpha activity MCL: Science of the Total Environment, v. 568, p. 1010–1017, accessed March 31, 2023, at https://doi.org/10.1016/j.scitotenv.2016.05.044.
Sellner, K.G., Doucette, G.J., and Kirkpatrick, G.J., 2003, Harmful algal blooms—Causes, impacts and detection: Journal of Industrial Microbiology & Biotechnology, v. 30, no. 7, p. 383–406, accessed October 19, 2022, at https://doi.org/10.1007/s10295-003-0074-9.
Shanley, J.B., Alisa Mast, M., Campbell, D.H., Aiken, G.R., Krabbenhoft, D.P., Hunt, R.J., Walker, J.F., Schuster, P.F., Chalmers, A., Aulenbach, B.T., Peters, N.E., Marvin-DiPasquale, M., Clow, D.W., and Shafer, M.M., 2008, Comparison of total mercury and methylmercury cycling at five sites using the small watershed approach: Environmental Pollution, v. 154, no. 1, p. 143–154, accessed March 31, 2023, at https://doi.org/10.1016/j.envpol.2007.12.031.
Shoda, M.E., Sprague, L.A., Murphy, J.C., and Riskin, M.L., 2019, Water-quality trends in U.S. rivers, 2002 to 2012—Relations to levels of concern: Science of the Total Environment, v. 650, p. 2314–2324, accessed October 11, 2022, at https://doi.org/10.1016/j.scitotenv.2018.09.377.
Sims, A.J., and Rutherfurd, I.D., 2017, Management responses to pulses of bedload sediment in rivers: Geomorphology, v. 294, p. 70–86, accessed January 11, 2024, at https://doi.org/10.1016/j.geomorph.2017.04.010.
Smalling, K., Romanok, K., Bradley, P., Morriss, M., Gray, J., Kanagy, L., Gordon, S., Williams, B., Breitmeyer, S., Jones, D., DeCicco, L., Eagles-Smith, C., and Wagner, T., 2023, Per- and polyfluoroalkyl substances (PFAS) in United States tapwater—Comparison of underserved private-well and public-supply exposures and associated health implications: Environment International, v. 178, 12 p., accessed July 7, 2023, at https://doi.org/10.1016/j.envint.2023.108033.
Smedley, P.L., and Kinniburgh, D.G., 2002, A review of the source, behaviour and distribution of arsenic in natural waters: Applied Geochemistry, v. 17, no. 5, p. 517–568, accessed February 27, 2023, at https://doi.org/10.1016/S0883-2927(02)00018-5.
Snyder, C.D., Hitt, N.P., and Young, J.A., 2015, Accounting for groundwater in stream fish thermal habitat responses to climate change: Ecological Applications, v. 25, no. 5, p. 1397–1419, accessed August 18, 2022, at https://doi.org/10.1890/14-1354.1.
Spahr, N.E., Dubrovsky, N.M., Gronberg, J.M., Franke, O.L., and Wolock, D.M., 2010b, Nitrate loads and concentrations in surface-water base flow and shallow groundwater for selected basins in the United States, water years 1990–2006: U.S. Geological Survey Scientific Investigations Report 2010–5098, 20 p., accessed October 8, 2023, at https://doi.org/10.3133/sir20105098.
Spahr, N.E., Mueller, D.K., Wolock, D.M., Hitt, K.J., and Gronberg, J.M., 2010a, Development and application of regression models for estimating nutrient concentrations in streams of the conterminous United States, 1992–2001: U.S. Geological Survey Scientific Investigations Report 2009–5199, 22 p., accessed October 8, 2023, at https://doi.org/10.3133/sir20095199.
Spaur, M., Lombard, M.A., Ayotte, J.D., Harvey, D.E., Bostick, B.C., Chillrud, S.N., Navas-Acien, A., and Nigra, A.E., 2021, Associations between private well water and community water supply arsenic concentrations in the conterminous United States: Science of the Total Environment, v. 787, 40 p., accessed October 8, 2023, https://doi.org/10.1016/j.scitotenv.2021.147555.
Sprague, L.A., Mitchell, R.M., Pollard, A.I., and Falcone, J.A., 2019, Assessing water-quality changes in US rivers at multiple geographic scales using results from probabilistic and targeted monitoring: Environmental Monitoring and Assessment, v. 191, no. 6, 12 p., accessed October 11, 2022, at https://doi.org/10.1007/s10661-019-7481-5.
Stackelberg, P.E., Szabo, Z., and Jurgens, B.C., 2018, Radium mobility and the age of groundwater in public-drinking-water supplies from the Cambrian-Ordovician aquifer system, north-central USA: Applied Geochemistry, v. 89, p. 34–48, accessed October 3, 2022, at https://doi.org/10.1016/j.apgeochem.2017.11.002.
Stackpoole, S.M., Shoda, M.E., Medalie, L., and Stone, W.W., 2021, Pesticides in US Rivers—Regional differences in use, occurrence, and environmental toxicity, 2013 to 2017: Science of the Total Environment, v. 787, 11 p., accessed March 24, 2023, at https://doi.org/10.1016/j.scitotenv.2021.147147.
Stanton, J.S., Anning, D.W., Brown, C.J., Moore, R.B., McGuire, V.L., Qi, S.L., Harris, A.C., Dennehy, K.F., McMahon, P.B., Degnan, J.R., and Böhlke, J.K., 2017, Brackish groundwater in the United States: U.S. Geological Survey Professional Paper 1833, 202 p., accessed October 3, 2022, at https://doi.org/10.3133/pp1833.
Stephens, M.J., Shimabukuro, D.H., Gillespie, J.M., and Chang, W., 2019, Groundwater salinity mapping using geophysical log analysis within the Fruitvale and Rosedale Ranch oil fields, Kern County, California, USA: Hydrogeology Journal, v. 27, no. 2, p. 731–746, accessed April 6, 2023, at https://doi.org/10.1007/s10040-018-1872-5.
Stets, E., Archer, A.A., Degnan, J.R., Erickson, M.L., Gorski, G., Medalie, L, and Scholl, M.A., 2025a, The national integrated water availability assessment, water years 2010–20, chap. A of U.S. Geological Survey Integrated Water Availability Assessment—2010–20: U.S. Geological Survey Professional Paper 1894–A, 24 p., https://doi.org/10.3133/pp1894A.
Stets, E., Cashman, M.J., Miller, O.L., and Powlen, K.A., 2025b, Integrated water availability in the conterminous United States, 2010–20, chap. F of U.S. Geological Survey Integrated Water Availability Assessment—2010–20: U.S. Geological Survey Professional Paper 1894–F, 41 p., https://doi.org/10.3133/pp1894F.
Stets, E.G., Lee, C.J., Lytle, D.A., and Schock, M.R., 2018, Increasing chloride in rivers of the conterminous U.S. and linkages to potential corrosivity and lead action level exceedances in drinking water: Science of the Total Environment, v. 613–614, p. 1498–1509, accessed October 11, 2022, at https://doi.org/10.1016/j.scitotenv.2017.07.119.
Stillo, F., and Gibson, J.M., 2017, Exposure to contaminated drinking water and health disparities in North Carolina: American Journal of Public Health, v. 107, no. 1, p. 180–185, accessed January 17, 2024, at https://doi.org/10.2105/AJPH.2016.303482.
Stokdyk, J.P., Borchardt, M.A., Firnstahl, A., Bradbury, K., Muldoon, M., and Kieke, B.A., 2022, Assessing private well contamination in Grant, Iowa, and Lafayette Counties, Wisconsin—The southwest Wisconsin groundwater and geology study: Extension Iowa County, University of Wisconsin-Madison, 66 p., accessed October 19, 2022, at https://pubs.er.usgs.gov/publication/70231664.
Stokdyk, J.P., Firnstahl, A., Walsh, J.F., Spencer, S.K., de Lambert, J.R., Anderson, A.C., Rezania, L.-W., Kieke, B.A., Jr., and Borchardt, M.A., 2020, Viral, bacterial, and protozoan pathogens and fecal markers in wells supplying groundwater to public water systems in Minnesota, USA: Water Research, v. 178, 10 p., accessed April 4, 2023, at https://doi.org/10.1016/j.watres.2020.115814.
Stokdyk, J.P., Spencer, S.K., Walsh, J.F., de Lambert, J.R., Firnstahl, A.D., Anderson, A.C., Rezania, L.-W., and Borchardt, M.A., 2019, Cryptosporidium incidence and surface water influence of groundwater supplying public water systems in Minnesota, USA: Environmental Science & Technology, v. 53, no. 7, p. 3391–3398, accessed April 4, 2023, at https://doi.org/10.1021/acs.est.8b05446.
Szabo, Z., Stackelberg, P., and Cravotta, C.A., III, 2020, Occurrence and geochemistry of lead-210 and polonium-210 radionuclides in public-drinking-water supplies from principal aquifers of the United States: Environmental Science & Technology, v. 54, no. 12, p. 7236–7249, accessed October 19, 2022, at https://doi.org/10.1021/acs.est.0c00192.
Tan, S.W., Meiller, J.C., and Mahaffey, K.R., 2009, The endocrine effects of mercury in humans and wildlife: Critical Reviews in Toxicology, v. 39, no. 3, p. 228–269, accessed February 16, 2023, at https://doi.org/10.1080/10408440802233259.
Tanana, H., Combs, J., and Hoss, A., 2021, Water is life—Law, systemic racism, and water security in Indian country: Health Security, v. 19, no. S1, p. S-78–S-82, accessed June 2, 2023, at https://doi.org/10.1089/hs.2021.0034.
Tesoriero, A., Robertson, D., Green, C., Bohlke, J., Harvey, J., and Qi, S., 2024b, Prioritizing river basins for nutrient studies: Environmental Monitoring and Assessment, v. 196, no. 248, 21 p., accessed March 15, 2023, at https://doi.org/10.1007/s10661-023-12266-7.
Tesoriero, A.J., Burow, K.R., Frans, L.M., Haynes, J.V., Hobza, C.M., Lindsey, B.D., and Solder, J.E., 2019, Using age tracers and decadal sampling to discern trends in nitrate, arsenic, and uranium in groundwater beneath irrigated cropland: Environmental Science & Technology, v. 53, no. 24, p. 14152–14164, accessed January 11, 2024, at https://doi.org/10.1021/acs.est.9b03459.
Tesoriero, A.J., Duff, J.H., Saad, D.A., Spahr, N.E., and Wolock, D.M., 2013, Vulnerability of streams to legacy nitrate sources: Environmental Science & Technology, v. 47, no. 8, p. 3623–3629, accessed December 28, 2023. https://doi.org/10.1021/es305026x.
Tesoriero, A.J., Erickson, M.L., Conaway, C.H., Tomaszewski, E.J., Green, C.T., eds., 2024a, Knowledge gaps and opportunities for understanding water-quality processes affecting water availability for beneficial uses: U.S. Geological Survey Open-File Report 2023–1086, 81 p., accessed March 15, 2024, at https://doi.org/10.3133/ofr20231086.
Thomas, M.A., 2007, The association of arsenic with redox conditions, depth, and ground-water age in the glacial aquifer system of the northern United States: U.S. Geological Survey Scientific Investigations Report 2007–5036, 26 p., accessed February 27, 2023, at https://doi.org/10.3133/sir20075036.
Thompson, T.J., Briggs, M.A., Phillips, P.J., Blazer, V.S., Smalling, K.L., Kolpin, D.W., and Wagner, T., 2021, Groundwater discharges as a source of phytoestrogens and other agriculturally derived contaminants to streams: Science of the Total Environment, v. 755, 11 p., accessed April 5, 2023, at https://doi.org/10.1016/j.scitotenv.2020.142873.
Thorslund, J., Bierkens, M.F.P., Oude Essink, G.H.P., Sutanudjaja, E.H., and van Vliet, M.T.H., 2021, Common irrigation drivers of freshwater salinisation in river basins worldwide: Nature Communications, v. 12, no. 1, 13 p., accessed February 13, 2023, at https://doi.org/10.1038/s41467-021-24281-8.
Tian, Z., Zhao, H., Peter, K.T., Gonzalez, M., Wetzel, J., Wu, C., Hu, X., Prat, J., Mudrock, E., Hettinger, R., Cortina, A.E., Biswas, R.G., Kock, F.V.C., Soong, R., Jenne, A., Du, B., Hou, F., He, H., Lundeen, R., Gilbreath, A., Sutton, R., Scholz, N.L., Davis, J.W., Dodd, M.C., Simpson, A., McIntyre, J.K., and Kolodziej, E.P., 2021, A ubiquitous tire rubber–derived chemical induces acute mortality in coho salmon: Science, v. 371, no. 6525, p. 185–189, accessed July 11, 2024, at https://doi.org/10.1126/science.abd6951.
Tokranov, A.K., Bradley, P.M., Focazio, M.J., Kent, D.B., LeBlanc, D.R., McCoy, J.W., Smalling, K.L., Steevens, J.A., and Toccalino, P.L., 2021, Integrated science for the study of perfluoroalkyl and polyfluoroalkyl substances (PFAS) in the environment—A strategic science vision for the U.S. Geological Survey: U.S. Geological Survey Circular 1490, 50 p., accessed February 15, 2023, at https://doi.org/10.3133/cir1490.
Tokranov, A.K., McMahon, P.B., Bexfield, L.M., Lindsey, B.D., Johnson, T.D., Lombard, M.A., and Watson, E., 2024, National predictions of groundwater PFAS occurrence in the United States: Science, v. 386, no. 6723, p. 748-755, accessed October 24, 2024, at https://doi.org/ 10.1126/science.ado6638.
Topp, S.N., Barclay, J., Diaz, J., Sun, A.Y., Jia, X., Lu, D., Sadler, J.M., and Appling, A.P., 2023, Stream temperature prediction in a shifting environment—Explaining the influence of deep learning architecture: Water Resources Research, v. 59, no. 4, 19 p., accessed January 5, 2024, at https://doi.org/10.1029/2022WR033880.
United Nations General Assembly, 2010, The human right to water and sanitation: Resolution adopted by the General Assembly of the United Nations on July 28, 2010, accessed January 11, 2024, at https://digitallibrary.un.org/record/687002?ln=en&v=pdf.
U.S. Environmental Protection Agency, 2002, Radionuclides in drinking water—A small entity compliance guide: U.S. Environmental Protection Agency, Office of Ground Water and Drinking Water, Document No. EPA 815-R-02-001, 33 p., accessed March 30, 2023, at https://www.epa.gov/dwreginfo/radionuclide-rule-compliance-help-public-water-systems.
U.S. Environmental Protection Agency, 2003, Ambient water quality criteria for dissolved oxygen, water clarity and chlorophyll a for the Chesapeake Bay and its tidal tributaries: U.S. Environmental Protection Agency, Region III, Chesapeake Bay Program Office, Document No. EPA 903-r-03-002, 219 p. plus appendixes, accessed January 18, 2024, at https://www.chesapeakebay.net/content/publications/cbp_13142.pdf.
U.S. Environmental Protection Agency, 2006, Occurrence and monitoring document for final ground water rule EPA 815-R-06-012: Washington D.C., U.S. Environmental Protection Agency, 160 p., accessed August 9, 2024, at https://nepis.epa.gov/Exe/ZyPDF.cgi?Dockey=P1002XR7.txt.
U.S. Environmental Protection Agency, 2007, Hypoxia in the northern Gulf of Mexico—An update: U.S. Environmental Protection Agency Science Advisory Board, Hypoxia Assessment Panel, Document No. EPA-SAB-08-004, 333 p., accessed January 18, 2024, at https://www.epa.gov/sites/default/files/2015-03/documents/2008_1_31_msbasin_sab_report_2007.pdf.
U.S. Environmental Protection Agency, 2009, National rivers and streams assessment—Field operations manual: Washington, D.C., U.S. Environmental Protection Agency, Document No. EPA-841-B-07-009, 354 p., accessed March 24, 2023, at https://www.epa.gov/sites/default/files/2013-11/documents/nrsa_field_manual_4_21_09.pdf.
U.S. Environmental Protection Agency, 2016d, Drinking water health advisory for perfluorooctane sulfonate (PFOS): Washington, D.C., U.S. Environmental Protection Agency, Document No. EPA 822-R-16-002, 88 p., accessed February 15, 2023, at https://www.epa.gov/sites/production/files/2016-05/documents/pfos_health_advisory_final_508.pdf.
U.S. Environmental Protection Agency, 2015, Drinking water health advisories for cyanotoxins: Washington, D.C., U.S. Environmental Protection Agency website, accessed October 4, 2023, at https://www.epa.gov/cyanohabs/epa-drinking-water-health-advisories-cyanotoxins.
U.S. Environmental Protection Agency, 2016c, Drinking water health advisory for perfluorooctanoic acid (PFOA): Washington, D.C., U.S. Environmental Protection Agency, Document No. EPA 822-R-16-005, 103 p., accessed February 15, 2023, at https://www.epa.gov/sites/production/files/2016-05/documents/pfoa_health_advisory_final_508.pdf.
U.S. Environmental Protection Agency, 2016a, Fourth unregulated contaminant monitoring rule: Washington, D.C., U.S. Environmental Protection Agency website, accessed October 12, 2022, at https://www.epa.gov/dwucmr/fourth-unregulated-contaminant-monitoring-rule.
U.S. Environmental Protection Agency, 2016b, National rivers and streams assessment 2008–2009—A collaborative survey: Washington, D.C., U.S. Environmental Protection Agency, Document No. EPA/841/R-16/007, 131 p., accessed February 16, 2023, at https://www.epa.gov/national-aquatic-resource-surveys/national-rivers-and-streams-assessment-2008-2009-report.
U.S. Environmental Protection Agency, 2018, 2018 edition of the drinking water standards and health advisories tables, 12 p., accessed October 3, 2022, at https://www.epa.gov/system/files/documents/2022-01/dwtable2018.pdf.
U.S. Environmental Protection Agency, 2019b, Contaminant candidate list (CCL) and regulatory determination—Regulatory determination 3: U.S. Environmental Protection Agency website, accessed March 7, 2023, at https://www.epa.gov/ccl/regulatory-determination-3.
U.S. Environmental Protection Agency, 2019a, EPA’s per- and polyfluoroalkyl substances (PFAS) action plan: U.S. Environmental Protection Agency, Document No. EPA 823R18004, 72 p., accessed February 15, 2023, at https://www.epa.gov/sites/production/files/2019-02/documents/pfas_action_plan_021319_508compliant_1.pdf.
U.S. Environmental Protection Agency, 2020a, National Rivers and Streams Assessment 2013–2014—A collaborative survey: Washington, D.C., U.S. Environmental Protection Agency, Document No. EPA 841-R-19-001, 57 p. plus appendixes, accessed October 18, 2022, at https://www.epa.gov/system/files/documents/2021-10/nrsa_13-14_report_508_ci_2021-10-15.pdf.
U.S. Environmental Protection Agency, 2020b, National Rivers and Streams Assessment 2013–2014 technical support document: Washington, D.C., U.S. Environmental Protection Agency, Document No. EPA 843-R-19-001, 179 p., accessed October 6, 2023, at https://www.epa.gov/sites/default/files/2020-12/documents/nrsa_2013-14_final_tsd_12-15-2020.pdf.
U.S. Environmental Protection Agency, 2020c, National Water Reuse Action Plan (WRAP)—Improving the security, sustainability, and resilience of our Nation’s water resources—Collaborative implementation (Version 1): Washington, D.C., U.S. Environmental Protection Agency, 40 p. plus appendixes, accessed April 6, 2023, at https://www.epa.gov/sites/default/files/2020-02/documents/national-water-reuse-action-plan-collaborative-implementation-version-1.pdf.
U.S. Environmental Protection Agency, 2022c, Causal Analysis/Diagnosis Decision Information System (CADDIS): Washington, D.C., U.S. Environmental Protection Agency, Office of Research and Development, accessed April 5, 2023, at https://www.epa.gov/caddis.
U.S. Environmental Protection Agency, 2022b, Drinking water health advisories for PFAS: U.S. Environmental Protection Agency fact sheet for communities, accessed August 9, 2024, at https://www.epa.gov/system/files/documents/2022-06/drinking-water-ha-pfas-factsheet-communities.pdf.
U.S. Environmental Protection Agency, 2022a, Private drinking water wells: U.S. Environmental Protection Agency website, accessed October 14, 2022, at https://www.epa.gov/privatewells.
U.S. Environmental Protection Agency, 2023d, Aquatic life benchmarks and ecological risk assessments for registered pesticides: U.S. Environmental Protection Agency website, accessed October 6, 2023, at https://www.epa.gov/pesticide-science-and-assessing-pesticide-risks/aquatic-life-benchmarks-and-ecological-risk.
U.S. Environmental Protection Agency, 2023c, Assessment, Total Maximum Daily Load (TMDL) Tracking and Implementation System (ATTAINS): U.S. Environmental Protection Agency database, accessed April 5, 2023, at https://www.epa.gov/waterdata/attains.
U.S. Environmental Protection Agency, 2023e, Indicators used in the National Aquatic Resource Surveys: U.S. Environmental Protection Agency website, accessed October 5, 2023, at https://www.epa.gov/national-aquatic-resource-surveys/indicators-used-national-aquatic-resource-surveys.
U.S. Environmental Protection Agency, 2023b, National recommended water quality criteria—Aquatic life criteria table: U.S. Environmental Protection Agency website, accessed May 19, 2023, at https://www.epa.gov/wqc/national-recommended-water-quality-criteria-aquatic-life-criteria-table.
U.S. Environmental Protection Agency, 2023a, Water quality criteria: U.S. Environmental Protection Agency website, accessed March 21, 2023, at https://www.epa.gov/wqc.
U.S. Environmental Protection Agency, 2024a, Aquatic life criteria–Perfluorooctane sulfonate (PFOS), accessed January 6, 2025, at https://www.epa.gov/wqc/aquatic-life-criteria-perfluorooctane-sulfonate-pfos.
U.S. Environmental Protection Agency, 2024b, Aquatic life criteria–Perfluorooctanoic acid (PFOA), accessed January 6, 2025, at https://www.epa.gov/wqc/aquatic-life-criteria-perfluorooctanoic-acid-pfoa.
U.S. Environmental Protection Agency, 2024c, Clean Water Act aquatic life benchmarks for PFAS, accessed January 6, 2025, at https://www.epa.gov/wqc/clean-water-act-aquatic-life-benchmarks-pfas.
U.S. Environmental Protection Agency, 2024d, Final PFAS National Primary Drinking Water Regulation, accessed January 6, 2025, at https://www.epa.gov/swda/and-polyfluoroalkyl-substances-pfas.
U.S. Geological Survey, 2022, Map of produced water sample locations (interactive): U.S. Geological Survey National produced waters geochemical database, ver. 3.0, accessed October 14, 2022, at https://eerscmap.usgs.gov/pwapp/.
U.S. Geological Survey, 2023, Decadal change in groundwater quality mapper: U.S. Geological Survey web page, accessed April 3, 2023, at https://nawqatrends.wim.usgs.gov/Decadal/.
U.S. Department of Health and Human Services Federal Panel on Community Water Fluoridation, 2015, U.S. Public Health Service recommendation for fluoride concentration in drinking water for the prevention of dental caries: Public Health Reports, v. 130, no. 4, p. 318–331, accessed March 29, 2023, at https://doi.org/10.1177/003335491513000408.
VanDerslice, J., 2011, Drinking water infrastructure and environmental disparities—Evidence and methodological considerations: American Journal of Public Health, v. 101, no. S1, p. S109–S114, accessed January 12, 2024, at https://doi.org/10.2105/AJPH.2011.300189.
Van Meter, K.J., Basu, N.B., Veenstra, J.J., and Burras, C.L., 2016, The nitrogen legacy—Emerging evidence of nitrogen accumulation in anthropogenic landscapes: Environmental Research Letters, v. 11, no. 3, 13 p., accessed October 19, 2022, at https://doi.org/10.1088/1748-9326/11/3/035014.
Van Metre, P.C., Alvarez, D.A., Mahler, B.J., Nowell, L., Sandstrom, M., and Moran, P., 2017, Complex mixtures of pesticides in Midwest U.S. streams indicated by POCIS time-integrating samplers: Environmental Pollution, v. 220, p. 431–440, accessed October 19, 2022, at https://doi.org/10.1016/j.envpol.2016.09.085.
Van Metre, P.C., Mahler, B.J., Qi, S.L., Gellis, A.C., Fuller, C.C., and Schmidt, T.S., 2022, Sediment sources and sealed-pavement area drive polycyclic aromatic hydrocarbon and metal occurrence in urban streams: Environmental Science & Technology, v. 56, no. 3, p. 1615–1626, accessed August 18, 2023, at https://doi.org/10.1021/acs.est.1c00414.
Van Metre, P.C., Qi, S., Deacon, J., Dieter, C., Driscoll, J.M., Fienen, M., Kenney, T., Lambert, P., Lesmes, D., Mason, C.A., Mueller-Solger, A., Musgrove, M., Painter, J., Rosenberry, D., Sprague, L., Tesoriero, A.J., Windham-Myers, L., and Wolock, D., 2020, Prioritizing river basins for intensive monitoring and assessment by the U.S. Geological Survey: Environmental Monitoring and Assessment, v. 192, no. 7, p. 458, accessed October 3, 2022, at https://doi.org/10.1007/s10661-020-08403-1.
Vareda, J.P., Valente, A.J.M., and Durães, L., 2019, Assessment of heavy metal pollution from anthropogenic activities and remediation strategies—A review: Journal of Environmental Management, v. 246, p. 101–118, accessed May 19, 2023, at https://doi.org/10.1016/j.jenvman.2019.05.126.
Veil, J.A.A., and Clark, C.E.E., 2011, Produced-water-volume estimates and management practices: SPE Production & Operations, v. 26, no. 3, p. 234–239, accessed April 9, 2023, at https://doi.org/10.2118/125999-PA.
Vengosh, A., Coyte, R.M., Podgorski, J., and Johnson, T.M., 2022, A critical review on the occurrence and distribution of the uranium- and thorium-decay nuclides and their effect on the quality of groundwater: Science of the Total Environment, v. 808, 23 p., accessed April 6, 2023, at https://doi.org/10.1016/j.scitotenv.2021.151914.
Verhougstraete, M.P., Martin, S.L., Kendall, A.D., Hyndman, D.W., and Rose, J.B., 2015, Linking fecal bacteria in rivers to landscape, geochemical, and hydrologic factors and sources at the basin scale: Proceedings of the National Academy of Sciences of the United States of America, v. 112, no. 33, p. 10419–10424, accessed May 19, 2023, at https://doi.org/10.1073/pnas.1415836112.
Vicente-Vicente, L., Quiros, Y., Pérez-Barriocanal, F., López-Novoa, J.M., López-Hernández, F.J., and Morales, A.I., 2010, Nephrotoxicity of uranium—Pathophysiological, diagnostic and therapeutic perspectives: Toxicological Sciences, v. 118, no. 2, p. 324–347, accessed March 30, 2023, at https://doi.org/10.1093/toxsci/kfq178.
Wackler, T., Babb-Brott, D., Matthews, L., Burke, T., Friedman, B., Lee, J., McGrath, J., Davis, C., Murray, R., Thur, S., Gould, C., Southerland, E., Novitski, L., D'Anglada, L., Lee, D., McLeroy, S., Melnick, R., Davis, T., Anderson, E., and Deliman, P., 2017, Harmful algal blooms and hypoxia in the Great Lakes Research Plan and Action Strategy—An Interagency Report: National Science and Technology Council, 111 p., accessed February 15, 2023, at https://www.researchgate.net/publication/319287620_HARMFUL_ALGAL_BLOOMS_AND_HYPOXIA_IN_THE_GREAT_LAKES_RESEARCH_PLAN_AND_ACTION_STRATEGY_AN_INTERAGENC Y_REPORT.
Wagner, T., Schliep, E.M., North, J.S., Kundel, H., Custer, C.A., Ruzich, J.K., and Hansen, G.J.A., 2023, Predicting climate change impacts on poikilotherms using physiologically guided species abundance models: Proceedings of the National Academy of Sciences of the United States of America, v. 120, no. 15, 8 p., accessed July 31, 2023, at https://doi.org/10.1073/pnas.2214199120.
Waite, I.R., Munn, M.D., Moran, P.W., Konrad, C.P., Nowell, L.H., Meador, M.R., Van Metre, P.C., and Carlisle, D.M., 2019, Effects of urban multi-stressors on three stream biotic assemblages: Science of the Total Environment, v. 660, p. 1472–1485, accessed October 17, 2022, at https://doi.org/10.1016/j.scitotenv.2018.12.240.
Waite, I.R., Van Metre, P.C., Moran, P.W., Konrad, C.P., Nowell, L.H., Meador, M.R., Munn, M.D., Schmidt, T.S., Gellis, A.C., Carlisle, D.M., Bradley, P.M., and Mahler, B.J., 2021, Multiple in-stream stressors degrade biological assemblages in five U.S. regions: Science of the Total Environment, v. 800, 16 p., accessed October 17, 202, at https://doi.org/10.1016/j.scitotenv.2021.149350.
Walker, J.D., Letcher, B.H., Rodgers, K.D., Muhlfeld, C.C., and D’Angelo, V.S., 2020, An interactive data visualization framework for exploring geospatial environmental datasets and model predictions: Water, v. 12, no. 10, 20 p., accessed October 8, 2023, at https://doi.org/10.3390/w12102928.
Walsh, C.J., Roy, A.H., Feminella, J.W., Cottingham, P.D., Groffman, P.M., and Morgan, II, R.P., 2005, The urban stream syndrome—Current knowledge and the search for a cure: Journal of the North American Benthological Society, v. 24, no. 3, p. 706–723, accessed April 5, 2023, at https://doi.org/10.1899/04-028.1.
Wang, Y., Jiang, R., Xie, J., Zhao, Y., Yan, D., and Yang, S., 2019, Soil and Water Assessment Tool (SWAT) Model—A systemic review: Journal of Coastal Research, v. 93, p. 22–30, accessed January 5, 2024, at https://doi.org/10.2112/SI93-004.1.
Ward, M.H., Jones, R.R., Brender, J.D., De Kok, T.M., Weyer, P.J., Nolan, B.T., Villanueva, C.M., and Van Breda, S.G., 2018, Drinking water nitrate and human health—An updated review: International Journal of Environmental Research and Public Health, v. 15, no. 7, 31 p., accessed December 28, 2023, at https://doi.org/10.3390/ijerph15071557.
Wasserman, G.A., Liu, X., Parvez, F., Factor-Litvak, P., Kline, J., Siddique, A.B., Shahriar, H., Uddin, M.N., van Geen, A., Mey, J.L., Balac, O., and Graziano, J.H., 2016, Child intelligence and reductions in water arsenic and manganese—A two-year follow-up study in Bangladesh: Environmental Health Perspectives, v. 124, no. 7, p. 1114–1120, accessed October 17, 2022, at https://doi.org/10.1289/ehp.1509974.
Wathen, J.B., Lazorchak, J.M., Olsen, A.R., and Batt, A., 2015, A national statistical survey assessment of mercury concentrations in fillets of fish collected in the U.S. EPA national rivers and streams assessment of the continental USA: Chemosphere, v. 122, p. 52–61, accessed August 16, 2023, at https://doi.org/10.1016/j.chemosphere.2014.11.005.
Wdowinski, S., Bray, R., Kirtman, B.P., and Wu, Z., 2016, Increasing flooding hazard in coastal communities due to rising sea level—Case study of Miami Beach, Florida: Ocean and Coastal Management, v. 126, p. 1–8, accessed April 6, 2023, at https://doi.org/10.1016/j.ocecoaman.2016.03.002.
Webb, D.T., Zhi, H., Kolpin, D.W., Klaper, R.D., Iwanowicz, L.R., and LeFevre, G.H., 2021, Emerging investigator series—Municipal wastewater as a year-round point source of neonicotinoid insecticides that persist in an effluent-dominated stream: Environmental Science. Processes & Impacts, v. 23, no. 5, p. 678–688, accessed April 6, 2023, at https://doi.org/10.1039/D1EM00065A.
Weinhold, B., 2012, Unknown quantity—Regulating radionuclides in tap water: Environmental Health Perspectives, v. 120, no. 9, p. a350–a356, accessed March 30, 2023, at https://doi.org/10.1289/ehp.120-a350.
Welch, A.H., Westjohn, D.B., Helsel, D.R., and Wanty, R.B., 2000, Arsenic in ground water of the United States—Occurrence and geochemistry: Ground Water, v. 38, no. 4, p. 589–604, accessed February 27, 2023, at https://doi.org/10.1111/j.1745-6584.2000.tb00251.x.
Welch, B., Smit, E., Cardenas, A., Hystad, P., and Kile, M.L., 2018, Trends in urinary arsenic among the U.S. population by drinking water source—Results from the National Health and Nutritional Examinations Survey 2003–2014: Environmental Research, v. 162, p. 8–17, accessed June 2, 2023, at https://doi.org/10.1016/j.envres.2017.12.012.
Welch, J., and Jager, H., 2022, Thermal response metrics for freshwater fish, CONUS—Version 1. HydroSource: Oak Ridge, Tennessee, Oak Ridge National Laboratory dataset, accessed August 3, 2023, at https://doi.org/10.21951/GMLC_Thermal_Metric/1897392.
Wellington, E.M.H., Boxall, A.B.A., Cross, P., Feil, E.J., Gaze, W.H., Hawkey, P.M., Johnson-Rollings, A.S., Jones, D.L., Lee, N.M., Otten, W., Thomas, C.M., and Williams, A.P., 2013, The role of the natural environment in the emergence of antibiotic resistance in Gram-negative bacteria: The Lancet Infectious Diseases, v. 13, no. 2, p. 155–165, accessed October 8, 2023, at https://doi.org/10.1016/S1473-3099(12)70317-1.
Wentz, D.A., Brigham, M.E., Chasar, L.C., Lutz, M.A., and Krabbenhoft, D.P., 2014, Mercury in the nation's streams—Levels, trends, and implications: U.S. Geological Survey Circular 1395, 100 p., accessed October 18, 2022, at https://doi.org/10.3133/cir1395.
Whitmire, S.L., and Van Bloem, S.J., 2017, Quantification of microplastics on National Park beaches: National Oceanic and Atmospheric Administration, Contract GSI-CU-1505, 28 p., accessed May 19, 2023, at https://marinedebris.noaa.gov/microplastics/quantification-microplastics-national-park-beaches.
Wieben, C.M., 2019, Estimated annual agricultural pesticide use for counties of the conterminous United States, 2013–17 (ver. 2.0, May 2020): U.S. Geological Survey data release, accessed March 27, 2023, at https://doi.org/10.5066/P9F2SRYH.
Wilkinson, J.L., and others, 2022, Pharmaceutical pollution of the world’s rivers: Proceedings of the National Academy of Sciences of the United States of America, v. 119, no. 8, 10 p., accessed October 8, 2023, at https://doi.org/10.1073/pnas.2113947119.
Willard, J.D., Read, J.S., Topp, S., Hansen, G.J.A., and Kumar, V., 2022, Daily surface temperatures for 185,549 lakes in the conterminous United States estimated using deep learning (1980–2020): Limnology and Oceanography Letters, v. 7, no. 4, p. 287–301, accessed August 18, 2023, at https://doi.org/10.1002/lol2.10249.
Williams, L.J., Raines, J.E., and Lanning, A.E., 2016, Geophysical log database for the Floridan aquifer system and southeastern Coastal Plain aquifer system in Florida and parts of Georgia, Alabama, and South Carolina (ver. 1.1): U.S. Geological Survey Data Series 760, 11 p., accessed April 6, 2023, at https://doi.org/10.3133/ds760.
Wilson, S.M., Heaney, C.D., Cooper, J., and Wilson, O., 2008, Built environment issues in unserved and underserved African-American neighborhoods in North Carolina: Environmental Justice, v. 1, no. 2, p. 63–72, accessed June 2, 2023, at https://doi.org/10.1089/env.2008.0509.
Winter, T.C., Harvey, J.W., Franke, O.L., and Alley, W.M., 1998, Ground water and surface water—A single resource: U.S. Geological Survey Circular 1139, 79 p., accessed August 3, 2023, at https://doi.org/10.3133/cir1139.
Wise, D.R., 2019, Spatially referenced models of streamflow and nitrogen, phosphorus, and suspended-sediment loads in streams of the Pacific region of the United States: U.S. Geological Survey Scientific Investigations Report 2019–5112, 78 p., accessed October 14, 2022, at https://doi.org/10.3133/sir20195112.
Wise, D.R., Anning, D.W., and Miller, O.L., 2019, Spatially referenced models of streamflow and nitrogen, phosphorus, and suspended-sediment transport in streams of the southwestern United States: U.S. Geological Survey Scientific Investigations Report 2019–5106, 78 p., accessed October 14, 2022, at https://doi.org/10.3133/sir20195106.
World Health Organization, 2012, Pharmaceuticals in drinking-water: World Health Organization Situation Report, 52 p., accessed October 8, 2023, at https://www.who.int/publications/i/item/9789241502085.
World Health Organization, 2017, Guidelines for drinking-water quality (4th ed., incorporating the 1st addendum): World Health Organization Guideline, 631 p., accessed March 29, 2023, at https://www.who.int/publications/i/item/9789241549950.
Wurtsbaugh, W.A., Paerl, H.W., and Dodds, W.K., 2019, Nutrients, eutrophication and harmful algal blooms along the freshwater to marine continuum: WIREs Water, v. 6, no. 5, article e1373, accessed July 31, 2023, at https://doi.org/10.1002/wat2.1373.
Yang, Q., Flanagan, S.V., Chillrud, S., Ross, J., Zeng, W., Culbertson, C., Spayd, S., Backer, L., Smith, A.E., and Zheng, Y., 2020, Reduction in drinking water arsenic exposure and health risk through arsenic treatment among private well households in Maine and New Jersey, USA: Science of the Total Environment, v. 738, 9 p., accessed June 2, 2023, at https://doi.org/10.1016/j.scitotenv.2020.139683.
Yazdan, M.M.S., Ahad, M.T., Jahan, I., and Mazumder, M., 2020, Review on the evaluation of the impacts of wastewater disposal in hydraulic fracturing industry in the United States: Technologies, v. 8, no. 4, 17 p., accessed April 3, 2023, at https://doi.org/10.3390/technologies8040067.
Ying, S.C., Schaefer, M.V., Cock-Esteb, A., Li, J., and Fendorf, S., 2017, Depth stratification leads to distinct zones of manganese and arsenic contaminated groundwater: Environmental Science & Technology, v. 51, no. 16, p. 8926–8932, accessed March 2, 2023, at https://doi.org/10.1021/acs.est.7b01121.
Yuan, L.L., and Pollard, A.I., 2017, Using national-scale data to develop nutrient–microcystin relationships that guide management decisions: Environmental Science & Technology, v. 51, no. 12, p. 6972–6980, accessed March 27, 2023, at https://doi.org/10.1021/acs.est.7b01410.
Zemlick, K., Kalhor, E., Thomson, B.M., Chermak, J.M., Sullivan Graham, E.J., and Tidwell, V.C., 2018, Mapping the energy footprint of produced water management in New Mexico: Environmental Research Letters, v. 13, no. 2, 11 p., accessed April 7, 2023, at https://doi.org/10.1088/1748-9326/aa9e54.
Zhang, Q., Hirsch, R.M., and Ball, W.P., 2016, Long-term changes in sediment and nutrient delivery from Conowingo Dam to Chesapeake Bay—Effects of reservoir sedimentation: Environmental Science & Technology, v. 50, no. 4, p. 1877–1886, accessed October 18, 2022, at https://doi.org/10.1021/acs.est.5b04073.
Zhi, H., Kolpin, D.W., Klaper, R.D., Iwanowicz, L.R., Meppelink, S.M., and LeFevre, G.H., 2020, Occurrence and spatiotemporal dynamics of pharmaceuticals in a temperate-region wastewater effluent-dominated stream—Variable inputs and differential attenuation yield evolving complex exposure mixtures: Environmental Science & Technology, v. 54, no. 20, p. 12967–12978, accessed April 6, 2023, at https://doi.org/10.1021/acs.est.0c02328.
Zhi, H., Mianecki, A.L., Kolpin, D.W., Klaper, R.D., Iwanowicz, L.R., and LeFevre, G.H., 2021, Tandem field and laboratory approaches to quantify attenuation mechanisms of pharmaceutical and pharmaceutical transformation products in a wastewater effluent-dominated stream: Water Research, v. 203, 10 p., accessed April 6, 2023, at https://doi.org/10.1016/j.watres.2021.117537.
Zhi, W., Ouyang, W., Shen, C., and Li, L., 2023, Temperature outweighs light and flow as the predominant driver of dissolved oxygen in U.S. rivers: Nature Water, v. 1, no. 3, p. 249–260, accessed December 29, 2023, at https://doi.org/10.1038/s44221-023-00038-z.
Zhou, Q., Yang, N., Li, Y., Ren, B., Ding, X., Bian, H., and Yao, X., 2020, Total concentrations and sources of heavy metal pollution in global river and lake water bodies from 1972 to 2017: Global Ecology and Conservation, v. 22, 11 p., accessed May 19, 2023, at https://doi.org/10.1016/j.gecco.2020.e00925.
Zuellig, R.E., Graham, J.L., Stelzer, E.A., Loftin, K.A., and Rosen, B.H., 2021, Cyanobacteria, cyanotoxin synthetase gene, and cyanotoxin occurrence among selected large river sites of the conterminous United States, 2017–18: U.S. Geological Survey Scientific Investigations Report 2021–5121, 22 p., accessed March 27, 2023, at https://doi.org/10.3133/sir20215121.
Appendix 1. Information About Linked Interactive Maps
References Cited
Ator, S.W., 2019, Spatially referenced models of streamflow and nitrogen, phosphorus, and suspended-sediment loads in streams of the northeastern United States: U. S. Geological Survey Scientific Investigations Report 2019–5118, 57 p., accessed October 14, 2022, at https://doi.org/10.3133/sir20195118.
Azadpour, E., Martinez, A.J., and Padilla, J.A., 2025, Decadal change plots of water-quality constituents: U.S. Geological Survey software release, https://doi.org/10.5066/P13N7XHW.
Belitz, K., Fram, M., Lindsey, B.D., Stackelberg, P.E., Bexfield, L.M., Kingsbury, J.A., Johnson, T.D., Jurgens, B.C., McMahon, P.B., and Dubrovsky, N.M., 2022, The quality of groundwater used for public supply in the continental United States—A comprehensive assessment: Environmental Science & Technology—Water, p. 2645–2656, accessed April 3, 2023, at https://doi.org/10.1021/acsestwater.2c00390.
Cutler, D.R., EdwardsJr., T.C., Beard, K.H., Cutler, A., Hess, K.T., Gibson, J., and Lawler, J.J., 2007, Random forests for classification in ecology: Ecology, v. 88, no. 11, p. 2783–2792, accessed December 28, 2023, at https://doi.org/10.1890/07-0539.1.
Elith, J., Leathwick, J.R., and Hastie, T., 2008, A working guide to boosted regression trees: Journal of Animal Ecology, v. 77, no. 4, p. 802–813, accessed March 24, 2023, at https://doi.org/10.1111/j.1365-2656.2008.01390.x.
Hoos, A.B., and Roland, II, V.L., 2019, Spatially referenced models of streamflow and nitrogen, phosphorus, and suspended-sediment loads in the Southeastern United States: U. S. Geological Survey Scientific Investigations Report 2019–5135, 87 p., accessed October 14, 2022, at https://doi.org/10.3133/sir20195135.
Lindsey, B.D., Johnson, T.D., Privette, L.M., and Estes, N.J., 2018, Decadal changes in groundwater quality: U.S. Geological Survey web page, accessed August 17, 2023, at https://nawqatrends.wim.usgs.gov/Decadal/.
Lindsey, B.D., May, A.N., Watson, E., and Johnson, T.D., 2023, Data from Decadal Change in Groundwater Quality web site, 1988–2022: U.S. Geological Survey data release, accessed August 17, 2023, at https://doi.org/10.5066/P9YEB7FS.
Lombard, M.A., Brown, E.E., Saftner, D.M., Arienzo, M.M., Fuller-Thomson, E., Brown, C.J., and Ayotte, J.D., 2024, Estimating lithium concentrations in groundwater used as drinking water for the conterminous United States: Environmental Science & Technology, v. 58, no. 2, p. 1255–1264, accessed January 11, 2024, at https://doi.org/10.1021/acs.est.3c03315.
Lombard, M.A., Bryan, M.S., Jones, D.K., Bulka, C., Bradley, P.M., Backer, L.C., Focazio, M.J., Silverman, D.T., Toccalino, P., Argos, M., Gribble, M.O., and Ayotte, J.D., 2021, Machine learning models of arsenic in private wells throughout the conterminous United States as a tool for exposure assessment in human health studies: Environmental Science & Technology, v. 55, no. 8, p. 5012–5023, accessed February 16, 2023, at https://doi.org/10.1021/acs.est.0c05239.
Martinez, A.J., Azadpour, E., Padilla, J.A., Cashman, M.J., and Miller, O.I., 2024, Water quality across the conterminous United States using SPARROW 2012 simulated nutrient load estimates: U.S. Geological Survey software release, https://doi.org/10.5066/P14XRQ9R.
Moore, R.B., Johnston, C.M., Robinson, K.W., and Deacon, J.R., 2004, Estimation of total nitrogen and phosphorus in New England streams using spatially referenced regression models: U.S. Geological Survey Scientific Investigations Report 2004–5012, 50 p., accessed August 17, 2023, at https://doi.org/10.3133/sir20045012.
Ransom, K.M., Nolan, B.T., Stackelberg, P.E., Belitz, K., and Fram, M.S., 2022, Machine learning predictions of nitrate in groundwater used for drinking supply in the conterminous United States: Science of the Total Environment, v. 807, 11 p., accessed October 3, 2022, at https://doi.org/10.1016/j.scitotenv.2021.151065.
Robertson, D.M., and Saad, D.A., 2019, Spatially referenced models of streamflow and nitrogen, phosphorus, and suspended-sediment loads in streams of the midwestern United States: U. S. Geological Survey Scientific Investigations Report 2019–5114, 88 p., accessed August 14, 2022, at https://doi.org/10.3133/sir20195114.
Robertson, D.M., and Saad, D.A., 2021, Nitrogen and phosphorus sources and delivery from the Mississippi/Atchafalaya River Basin—An update using 2012 SPARROW models: JAWRA Journal of the American Water Resources Association, v. 57, no. 3, p. 406–429, accessed August 14, 2022, at https://doi.org/10.1111/1752-1688.12905.
Rowe, G.L., Belitz, K., Demas, C.R., Essaid, H.I., Gilliom, R.J., Hamilton, P.A., Hoos, A.B., Lee, C.J., Munn, M.D., and Wolock, D.W., 2013, Design of Cycle 3 of the National Water-Quality Assessment Program, 2013–23—Part 2—Science plan for improved water-quality information and management: U. S. Geological Survey Open-File Report 2013–1160, 110 p., accessed March 22, 2023, at https://doi.org/10.3133/ofr20131160.
Rowe, G.L., Belitz, K., Essaid, H.I., Gilliom, R.J., Hamilton, P.A., Hoos, A.B., Lynch, D.D., Munn, M.D., and Wolock, D.W., 2010, Design of Cycle 3 of the National Water-Quality Assessment Program, 2013–2022—Part 1—Framework of water-quality issues and potential approaches: U. S. Geological Survey Open-File Report 2009–1296, 54 p., accessed March 22, 2023, at https://doi.org/10.3133/ofr20091296.
Schwarz, G., Hoos, A.B., Alexander, R.B., and Smith, R.A., 2006, Section 3—The SPARROW surface water-quality model—Theory, application and user documentation: U.S. Geological Survey Techniques and Methods book 6, chap. B3, 248 p., accessed March 22, 2023, at https://doi.org/10.3133/tm6B3.
TesorieroAJ, WherrySA, DupuyDI, JohnsonTD. 2024. Predicting redox conditions in groundwater at a National scale using random forest classification: Environmental Science & Technology, v. 58, no. 11, p. 5079–5092, accessed October 3, 2024, at https://doi.org/10.1021/acs.est.3c07576.
Tokranov, A.K., McMahon, P.B., Bexfield, L.M., Lindsey, B.D., Johnson, T.D., Lombard, M.A., and Watson, E., 2024. Predictions of groundwater PFAS occurrence at drinking water supply depths in the United States. Science. Accessed October 30, 2024, at https://www.science.org/doi/10.1126/science.ado6638.
Wise, D.R., 2019, Spatially referenced models of streamflow and nitrogen, phosphorus, and suspended-sediment loads in streams of the Pacific region of the United States: U. S. Geological Survey Scientific Investigations Report 2019–5112, 78 p., accessed October 14, 2022, at https://doi.org/10.3133/sir20195112.
Wise, D.R., Anning, D.W., and Miller, O.L., 2019, Spatially referenced models of streamflow and nitrogen, phosphorus, and suspended-sediment transport in streams of the southwestern United States: U. S. Geological Survey Scientific Investigations Report 2019–5106, 78 p., accessed October 14, 2022, at https://doi.org/10.3133/sir20195106.
Conversion Factors
International System of Units to U.S. customary units
Temperature in degrees Celsius (°C) may be converted to degrees Fahrenheit (°F) as follows:
°F = (1.8 × °C) + 32.
Supplemental Information
Specific conductance is in microsiemens per centimeter at 25 degrees Celsius (µS/cm at 25 °C).
Concentrations of chemical constituents in water are in either milligrams per liter (mg/L) or micrograms per liter (µg/L).
A water year is the 12-month period from October 1 through September 30 of the following year and is designated by the calendar year in which it ends.
Abbreviations
AMCL
Alternative Maximum Contaminant Level
ATTAINS
Assessment and Total Maximum Daily Load Tracking and Implementation System
CADDIS
Causal Analysis/Diagnosis Information System
CEC
contaminant of emerging concern
CONUS
conterminous United States of America, excluding Alaska, Hawaii, and U.S. territories of Puerto Rico, U.S. Virgin Islands, and U.S. Pacific Islands
DGMETA
Dissolved Gas Modeling and Environmental Tracer Analysis
DOC
dissolved organic carbon
ECO
aquatic life criteria table
GAMACTT
Groundwater Age Mixtures and Contaminant Trends Tool
HAB
harmful algal bloom
HBSL
Health-Based Screening Level
MCL
Maximum Contaminant Level
mSVI
modified Social Vulnerability Index
NAWQA
National Water Quality Assessment
NRSA
National Rivers and Streams Assessment
PAH
polycyclic aromatic hydrocarbon
PA
Principal Aquifer
PCB
polychlorinated biphenyl
PFAS
per- and polyfluoroalkyl substances
PWS
public water system
REC
recreational water use
redox
oxidation-reduction
SHR
Secondary Hydrogeologic Region
SMCL
Secondary Maximum Contaminant Level
SPARROW
SPAtially Referenced Regressions On Watershed
SWAT
Soil and Water Assessment Tool
UCMR
Unregulated Contaminant Monitoring Rule
USEPA
U.S. Environmental Protection Agency
USGS
U.S. Geological Survey
For more information concerning the research in this report, contact the
National_IWAAs@usgs, Water Resources Mission Area
U.S. Geological Survey
12201 Sunrise Valley Drive
Reston, Virginia 20192
Manuscript approved on November 27, 2024
Publishing support provided by the U.S. Geological Survey
Science Publishing Network, Tacoma, and Rolla Publishing Service Centers
Edited by John Osias and Vanessa Ball
Illustration by Althea Archer
Design and layout by Guadalupe Stratman
Interactive map design and layout by Luis Menoyo
Disclaimers
Any use of trade, firm, or product names is for descriptive purposes only and does not imply endorsement by the U.S. Government.
Although this information product, for the most part, is in the public domain, it also may contain copyrighted materials as noted in the text. Permission to reproduce copyrighted items must be secured from the copyright owner.
Suggested Citation
Erickson, M.L., Miller, O.L., Cashman, M.J., Degnan, J.R., Reddy, J.E., Martinez, A.J., and Azadpour, E., 2025, Status of water-quality conditions in the United States, 2010–20 (ver. 1.1, February 2025), chap. C of U.S. Geological Survey Integrated Water Availability Assessment—2010–20: U.S. Geological Survey Professional Paper 1894–C, 85 p., https://doi.org/10.3133/pp1894C.
ISSN: 2330-7102 (online)
Study Area
| Publication type | Report |
|---|---|
| Publication Subtype | USGS Numbered Series |
| Title | Status of water-quality conditions in the United States, 2010–20 |
| Series title | Professional Paper |
| Series number | 1894 |
| Chapter | C |
| DOI | 10.3133/pp1894C |
| Edition | Version 1.0: January 15, 2025; Version 1.1: February 5, 2025 |
| Publication Date | January 15, 2025 |
| Year Published | 2025 |
| Language | English |
| Publisher | U.S. Geological Survey |
| Publisher location | Reston, VA |
| Description | Report: ix, 85 p.; 2 Software Releases; 4 Interactive Maps |
| Country | United States |
| Other Geospatial | conterminous United States |
| Online Only (Y/N) | Y |
| Additional Online Files (Y/N) | Y |