

Climate Change and Future Water Availability in the United States
Links
- Document: Report (22.5 MB pdf) , HTML , XML
- Larger Work: This publication is Chapter E of U.S. Geological Survey Integrated Water Availability Assessment—2010–20
- NGMDB Index Page: National Geologic Map Database Index Page (html)
- Download citation as: RIS | Dublin Core
Preface
This is one chapter in a multichapter report that assesses water availability in the United States for water years 2010–20. This work was conducted as part of the fulfillment of the mandates of Subtitle F of the Omnibus Public Land Management Act of 2009 (Public Law 111-11), also known as the SECURE Water Act. As such, this work examines the spatial and temporal distribution of water quantity and quality in surface water and groundwater, as related to human and ecosystem needs and as affected by human and natural influences. Chapter A (Stets and others, 2025a) introduces the National Integrated Water Availability Assessment and provides important background and definitions for how the report characterizes water availability and its components. Chapter A also presents the key findings of Chapters B–F and thus `water supply, which is the quantity of water supplied through climatic inputs. Chapter C (Erickson and others, 2025) is a national assessment of water quality, which is the chemical and physical characteristics of water. Chapter D (Medalie and others, 2025) assesses water use including withdrawals and consumptive use in the conterminous United States. Chapter E (this report) presents an analysis of factors affecting future water availability under changing climate conditions. The National Integrated Water Availability Assessment culminates with Chapter F (Stets and others, 2025b), which is an integrated assessment of water availability that considers the amount and quality of water coupled with the suitability of that water for specific uses. Together, these six chapters constitute the National Integrated Water Availability Assessment for water years 2010–20.
Abstract
The steady rise in global temperature as a result of human activity is causing changes in Earth’s water cycle. The balance of water stored within and moving between vapor, liquid, and frozen states in the water cycle is shifting, with consequences for water availability that include increases in drought, fire weather, flooding, and heavy precipitation, as well as cryosphere decline and sea-level rise. In this chapter of the U.S. Geological Survey Integrated Water Availability Assessment—2010–20, we provide an overview of climate-change observations and projections from Earth-system model simulations that relate to future water availability, from global and national climate assessments and from the published literature. Effects of climate change on primary water-cycle components are discussed in context of how global-scale hydroclimate drivers influence regional processes within the United States. Understanding the major climate drivers impacting the water cycle is crucial to predicting future changes in water availability and developing adaptation strategies to ensure human and ecosystem water supplies. First, we provide background information on the water cycle, the climate-model ensemble simulations developed to produce projections based on warming scenarios, and attribution and certainty levels. Tipping points, self-reinforcing feedbacks, cascading effects, and compound extremes are introduced. The framework of climatic impact drivers (CIDs) outlined in the Intergovernmental Panel on Climate Change Sixth Assessment Report (IPCC AR6) is used to show primary drivers of physical change to the water cycle and to understand and predict changes in future water availability. Specific climate-change related observations and projections are discussed for water cycle components of precipitation, evapotranspiration, soil moisture, streamflow, lakes and wetlands, ice and snow, and groundwater, as well as their implications for future water availability for humans and ecosystems. The chapter concludes with a synthesis discussion of three examples of complex regional-scale hydroclimate processes that influence water availability for populations in the United States, including (1) mountain and coastal precipitation, (2) aridification and drought, and (3) the influence of forest-cover change on terrestrial water-vapor recycling.
Key Points
The following are the key points of this chapter:
-
• The steady rise in global temperature as a result of human activity is causing changes in Earth’s water cycle. The amount of water stored within and moving between vapor, liquid and frozen components of the water cycle is shifting, with significant consequences for water availability.
-
• Climatic drivers underlie regional or local changes in water supply and their socioeconomic impacts. Threats to the quantity and quality of water available for humans and ecosystems in North America include increases in drought, aridification, and fire weather; heavy precipitation and flooding; cryosphere decline; rising surface-water temperatures; and saltwater intrusion in coastal areas.
-
• An understanding of how changes in the major climatic drivers impact the water cycle and the accurate simulation of impacts in hydrological models are crucial to predicting future water availability and developing adaptation strategies to ensure human and ecosystem water supplies.
Introduction
Why We Expect Changes to the Water Cycle
Earth is undergoing fundamental changes in the atmosphere, cryosphere, biosphere, and oceans as a result of changes in the climate system driven by human (anthropogenic) activities. Climatic indicators including land and ocean temperatures, atmospheric carbon dioxide (CO2), sea-level rise, and glacier ice loss show that changes have proceeded beyond the range of natural variability (Chen and others, 2021). Carbon dioxide and other greenhouse gases (see “Glossary”) control the global energy balance, changing the radiative forcing (the balance of incoming and outgoing solar radiation) that drives increasing land, ocean, and atmospheric temperatures. Atmospheric concentrations of these greenhouse gases have risen steadily, beyond the capacity of the natural system to absorb them, and global temperatures have risen concurrently (Chen and others, 2021). This chapter describes the effects of climate change on the water cycle, with a focus on how processes occurring across the global system affect water availability in the United States.
The fresh water on Earth exists in gas, liquid, and solid (frozen) states, with ice caps and glaciers holding the greatest proportion, followed by groundwater, surface waters, and the atmosphere. Despite its small proportion in the global water budget (fig. 1), atmospheric water has an outsized influence on climate effects. As the atmosphere warms, its holding capacity for atmospheric water vapor increases, with concomitant increases in evaporation, transpiration, and precipitable water. Water vapor is also a greenhouse gas, so increasing levels can act to warm the atmosphere and further change Earth’s energy balance. Ice and snowpack melt rates increase with atmospheric warming, leading to less frozen water and more water in liquid and vapor phases (Allan and others, 2020; Stephens and others, 2020).

Earth’s water at three scales (left to right)—the total water (fresh and saline) on Earth, components of total fresh water on Earth, and components of total atmospheric and land-surface fresh water. Area of each circle is proportional to the fraction of total water within each category. Adapted from data in Shiklomanov (1993).
Global warming affects water availability directly through temperature effects on atmospheric moisture, and indirectly by driving climate change-related hazards. Over land, warmer air increases evaporative demand and plant stress during dry periods; the increasing atmospheric moisture deficit has the potential to cause further drying in arid regions and more intense droughts. Conversely, over the ocean and land areas with available water, warmer air drives increases in atmospheric moisture through evaporation and transpiration and increases the available potential energy for convective storms (Chen and others, 2020). This process leads to more frequent extreme precipitation, with higher intensity and duration of rainfall creating greater potential for flooding. Higher air temperatures change the cryosphere, with more precipitation falling as rain instead of snow, and increased melting of snowpack, permafrost, and glaciers. All these processes contribute to higher variability in the seasonal water cycle for a given region and there is ample evidence that climate zones have already shifted in many parts of the world in response to global warming (Beck and others, 2018; Intergovernmental Panel on Climate Change, 2021d).
Primary U.S. regional impacts from these process changes include sea-level rise in coastal zones, cryosphere changes (glacier retreat, permafrost thaw, more winter rain in place of snow), and aridification. Extremes such as heat waves, heavy precipitation, droughts, and tropical cyclones are projected to become more frequent and (or) intense. These climate shifts may lead to irreversible losses in cryosphere and freshwater ecosystems, severe water scarcity for increasing populations, increases in fire weather and aridity, and intensification of tropical and extratropical storms (Intergovernmental Panel on Climate Change, 2021d)
Climate Assessments—Summary of Global to Regional Perspectives
Two recurring governmental report series have become foundational in documenting observed and projected climate changes and their potential impacts: (1) the Intergovernmental Panel on Climate Change (IPCC, see “Glossary”) Assessment Reports, which summarize findings at the global level; and (2) the U.S. Global Change Research Program National Climate Assessment Reports (NCA4, NCA5, etc.; see “Glossary”), which summarize changes across the United States. These report series provide an unbiased, rigorous scientific basis for policymakers to make decisions. The assessments synthesize published science and rely especially on the Coupled Model Intercomparison Project (CMIP) results from coordinated simulations with a suite of Earth-system models to develop projections of future climate changes and their effects. In this chapter, we provide an overview of climate-change projections that relate to future water availability in the United States, primarily from the IPCC Sixth Assessment Report (IPCC AR6), the Fourth and Fifth National Climate Assessment Reports (NCA4, NCA5, respectively), and from more-recent publications in the peer-reviewed literature.
The IPCC AR6 (Intergovernmental Panel on Climate Change, 2021b, 2022) was completed during 2021–22 and incorporated early results from CMIP Phase 6 (CMIP6; Eyring and others, 2016) as well as previously unassessed results from CMIP Phase 5 (CMIP5). The report includes regions across the globe, with most of the conterminous United States (CONUS) included in three regions: Western, Central, and Eastern North America. Alaska is grouped with western Canada in North-Western North America, Puerto Rico is within Central America and the Caribbean, and Hawaii is in the global category Small Islands.
The U.S. Global Change Research Program (USGCRP) coordinates reporting of the science relating to climate change and its physical impacts with a focus on the United States. These assessments, mandated by the Global Change Research Act of 1990 (Public Law 101-606, 104 Stat. 3096), provide information to support risk assessments and decisions in response to climate change. Like the IPCC reports, they do not make policy recommendations. The NCA4 and NCA5 were published during 2017–18 (U.S. Global Change Research Program, 2017, 2018) and in 2023 (U.S. Global Change Research Program, 2023). The NCA reports focus on climate change in 10 regions: 7 across CONUS and 3 that cover Alaska, Hawaii and U.S. Pacific Islands, and the U.S. Caribbean. The NCA4 and NCA5 each have a chapter specifically on water.
The CMIP model-simulated projections of the effects of climate change use standardized climate forcing datasets and emissions scenarios to generate resultant global warming and cumulative carbon dioxide levels. Previous scenarios, the Representative Concentration Pathways (RCPs) in CMIP5, have been complemented in CMIP6 by illustrative scenarios that incorporate Shared Socioeconomic Pathways (SSPs) with the radiative forcing (see “Glossary”) resulting from the socioeconomic assumptions about levels of climate-change mitigation in each scenario in the year 2100. Scenarios start in 2015, and the core set of five scenarios discussed throughout the IPCC AR6 report include very high and high greenhouse gas emissions (SSP5-8.5 and SSP3-7.0); intermediate greenhouse gas emissions (SSP2-4.5); and low and very low greenhouse gas emissions (SSP1-2.6 and SSP1-1.9; see “Glossary”). The IPCC AR6 report compares the SSPs with the previous RCPs in terms of radiative forcing and global surface temperature (Chen and others, 2021, cross chapter box 1.4, table 1, section 1.6.1).
the CMIP scenario simulations and other process-specific model experiments are published at global and regional scales. The IPCC incorporates these projections to develop climate-change assessments under the framework of global warming levels, CO2 concentration levels, total radiative forcing, and the resultant climate impacts on physical and socioeconomic sectors. The assessments involve compiling and evaluating evidence from observations, theory, experiments, statistical analyses, and model simulations. A degree of certainty is determined based on the amount of evidence and the agreement amongst the sources of evidence. Based on this framework, the climate assessments use assessed facts, assessed confidence, and assessed likelihood statements to describe climate change. Attribution of individual climate-change phenomena to human activities is a separate evaluation that is key to the climate-change assessments. Attribution involves compiling observations, forming a hypothesis about causality, and then creating and carrying out methods to test the hypothesis. The resulting attribution assessment is used to inform climate-change projections, policies, and mitigation actions (see box 1.1, fig. 1, in Chen and others, 2021, and Cross-working group–Attribution fig. 1 in Ara Begum and others, 2022). The attribution and evidence-confidence-likelihood language in this chapter is taken directly from the international and national climate assessment reports, unless otherwise noted. We use their assessments and likelihood statements to communicate the degree of certainty of climate-change findings related to hydroclimate processes.
For the United States and its territories, the Water chapter of the NCA4 report (Lall and others, 2018; U.S. Global Change Research Program, 2018) highlighted three main findings of relevance to water availability in the United States as of 2017–18: (1) Climate-change related changes in water quantity and quality were evident across the country, with emphasis on drought, snowpack decline, heavy rainfall, groundwater depletion, surface water quality decline, and temperature increases; (2) Deteriorating water infrastructure was at risk from extreme precipitation and floods, compound extremes, and the possibility of cascading infrastructure failure; and (3) Water management under change was insufficient—planning did not address risk changes over time and although research existed, implementation was lagging. Key messages of the NCA5 report Water chapter (Payton and others, 2023) were as follows: (1) Climate change will continue to cause profound changes to the water cycle, with threats to water supply including increasing aridity and drought, declining groundwater levels, and declining snow cover. Across the nation, more frequent extreme rainfall, increased evaporation and plant water use, and increased groundwater demand are expected. Snow cover will decrease in extent and duration, with melt occurring earlier in the season. (2) Natural and human systems that adapted to historical water-cycle patterns cannot adjust quickly to rapid change, with disproportionate risk falling upon agricultural, coastal, and disadvantaged urban communities. (3) Adaptation has been uneven, with infrastructure improvements slow especially for frontline, Indigenous, and tribal communities that tend to be unrepresented in decision-making.
In the IPCC-AR6 report, the highest-confidence projections of impacts on water availability from climate change involve increases in mean temperatures, extreme heat, sea-level rise, and cryosphere decline (decreased spatial extent and duration of ice and snow). Changes in mean precipitation are also important but the magnitude and direction of effects differ across global regions (Intergovernmental Panel on Climate Change, 2021b). Across North America, the direction and magnitude of change in the foregoing components are similar to global patterns, but there is higher confidence in precipitation-related impacts, especially for heavy precipitation and floods. The IPCC AR6 Summary for Policymakers figure SPM.1(b) (Intergovernmental Panel on Climate Change, 2023) identified important climate-change impacts that were driven by compound physical factors and attributed to human influence. These impacts were as follows, in order of increasing confidence of human influence: (1) increase in agricultural and ecological drought, (2) increase in fire weather, (3) increase in compound flooding, (4) increase in heavy precipitation, (5) increase in glacier retreat, (6) global sea-level rise, (7) upper ocean acidification, and (8) increase in hot extremes.
Figure 2 shows the primary risks to freshwater resources in North America for increasing levels of warming. Risk of drought, aridification, and changes in snow and ice quantity and seasonality, especially in the American West and Alaska, will increase as global mean temperatures increase. The increased precipitable water in the atmosphere and higher energy of storms will increase rainfall intensity and duration, leading to flooding. Water-quality impacts resulting directly and indirectly from global temperature increases are spread across many sectors, including sea-level rise and saltwater intrusion in coastal aquifers, harmful algal blooms in fresh and saltwater environments, floods causing contamination of drinking water by increasing microbial pathogens and turbidity, and brackish-water storm surge in coastal areas. Later sections of this chapter further address these drivers and impacts.
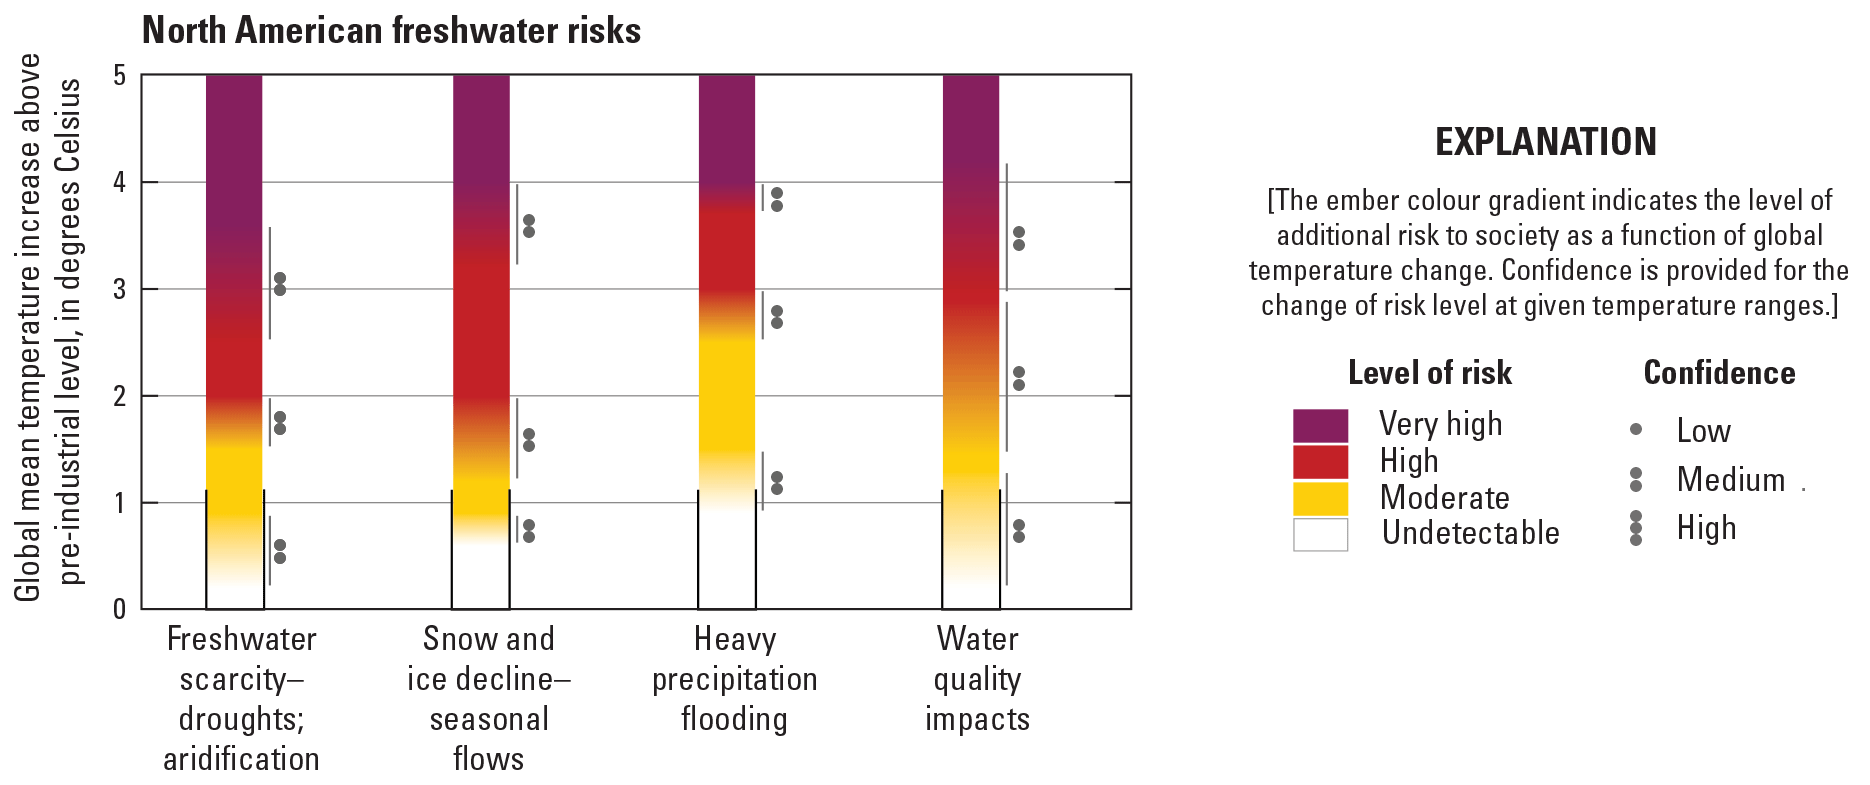
Freshwater resource risks as a function of global mean surface temperature increase relative to pre-industrial (1850–1900) levels (reproduced from Hicke and others, 2022, fig. 14.4). Estimated sensitivities are based on references cited in Hicke and others (2022, table 14.3). Used with permission.
Climatic Impact Drivers
For the Sixth Assessment Report (Intergovernmental Panel on Climate Change, 2022), a framework outlining 33 climatic impact-drivers (CIDs) was developed. CIDs are measurable physical climate system conditions with computable indices (for example, extreme heat, mean precipitation, fire weather) to recognize thresholds for impact and to summarize areas of observed and predicted change to human and natural systems. CIDs include mean states, episodic events, and extreme events, and can reflect changes in intensity or magnitude, frequency, duration, timing, and (or) spatial extent (see “Glossary”). The framework organizes the 33 CIDs into 7 typologies: (1) heat and cold, (2) wet and dry, (3) wind, (4) snow and ice, (5) coastal, (6) open ocean, and (7) other. Evidence on the probability of impact or risk driven by each CID on the following seven sectors was developed through a review of impact and risk literature: (1) terrestrial and freshwater ecosystems and their services; (2) oceans and coastal ecosystems and their services; (3) water; (4) food, fiber, and other ecosystem products; (5) cities, settlements, and key infrastructure; (6) health, well-being, and the changing structure of communities; and (7) poverty, livelihoods, and sustainable development. The CID framework is meant to be used to build specific sets of computable indices to use in regional or sectoral assessments of climate impact, and to prioritize improvements to Earth-system models that generate climate-change projections (Ruane and others, 2022).
Differential impacts across ecosystems, sectors, and geographic regions were shown in Ranasinghe and others (2021) and Ruane and others (2022). The degree of confidence in the impacts includes the total volume of evidence as well as the level of agreement across published literature. For example, areas listed as “low confidence” may be a result of less studied topics or spatially heterogeneous impacts resulting in low evidence agreement, not necessarily low likelihood of impact. Therefore, moderate and severe impacts given in Ranasinghe and others (2021) were weighted by how well-studied the impacts are and the severity of the impact, with the caveat that assets showing low impact may simply be less well-studied. Literature summarized in the IPCC AR6 report was inclusive of different models, baselines, and CID indicators. Motivation for the CID framework stems from the variable impacts that changes in climate can have on different systems. Emphasis was placed on developing an outcome-neutral term rather than one that implies only negative consequences (for example, hazards; Ruane and others, 2022). After understanding the potential context-specific impacts, CIDs can then be understood as ultimately leading to a risk or benefit to a system (Ruane and others, 2022). Therefore, CIDs do not directly equate to risk or vulnerability until taken into consideration with a system’s level of exposure, degree of sensitivity, and ability to adapt. Tables of all the CIDs, sectors and assets are available in Ranasinghe and others (2021).
We synthesized information in Ranasinghe and others (2021) to designate the water-cycle related CIDs that most strongly impact sectors related to natural water supply and human water demand (fig. 3). Our analysis examined sectoral assets by the number of climate-impact drivers they are affected by, then combined selected sectors and assets in the original report into atmospheric, natural terrestrial, and anthropogenic terrestrial water cycle components. This evaluation indicates that increased mean temperature, extreme heat, and precipitation extremes (drought and flood) are prevalent drivers of change affecting each sector. Other drivers affecting multiple water cycle components are cryosphere and sea-level related (fig. 3).
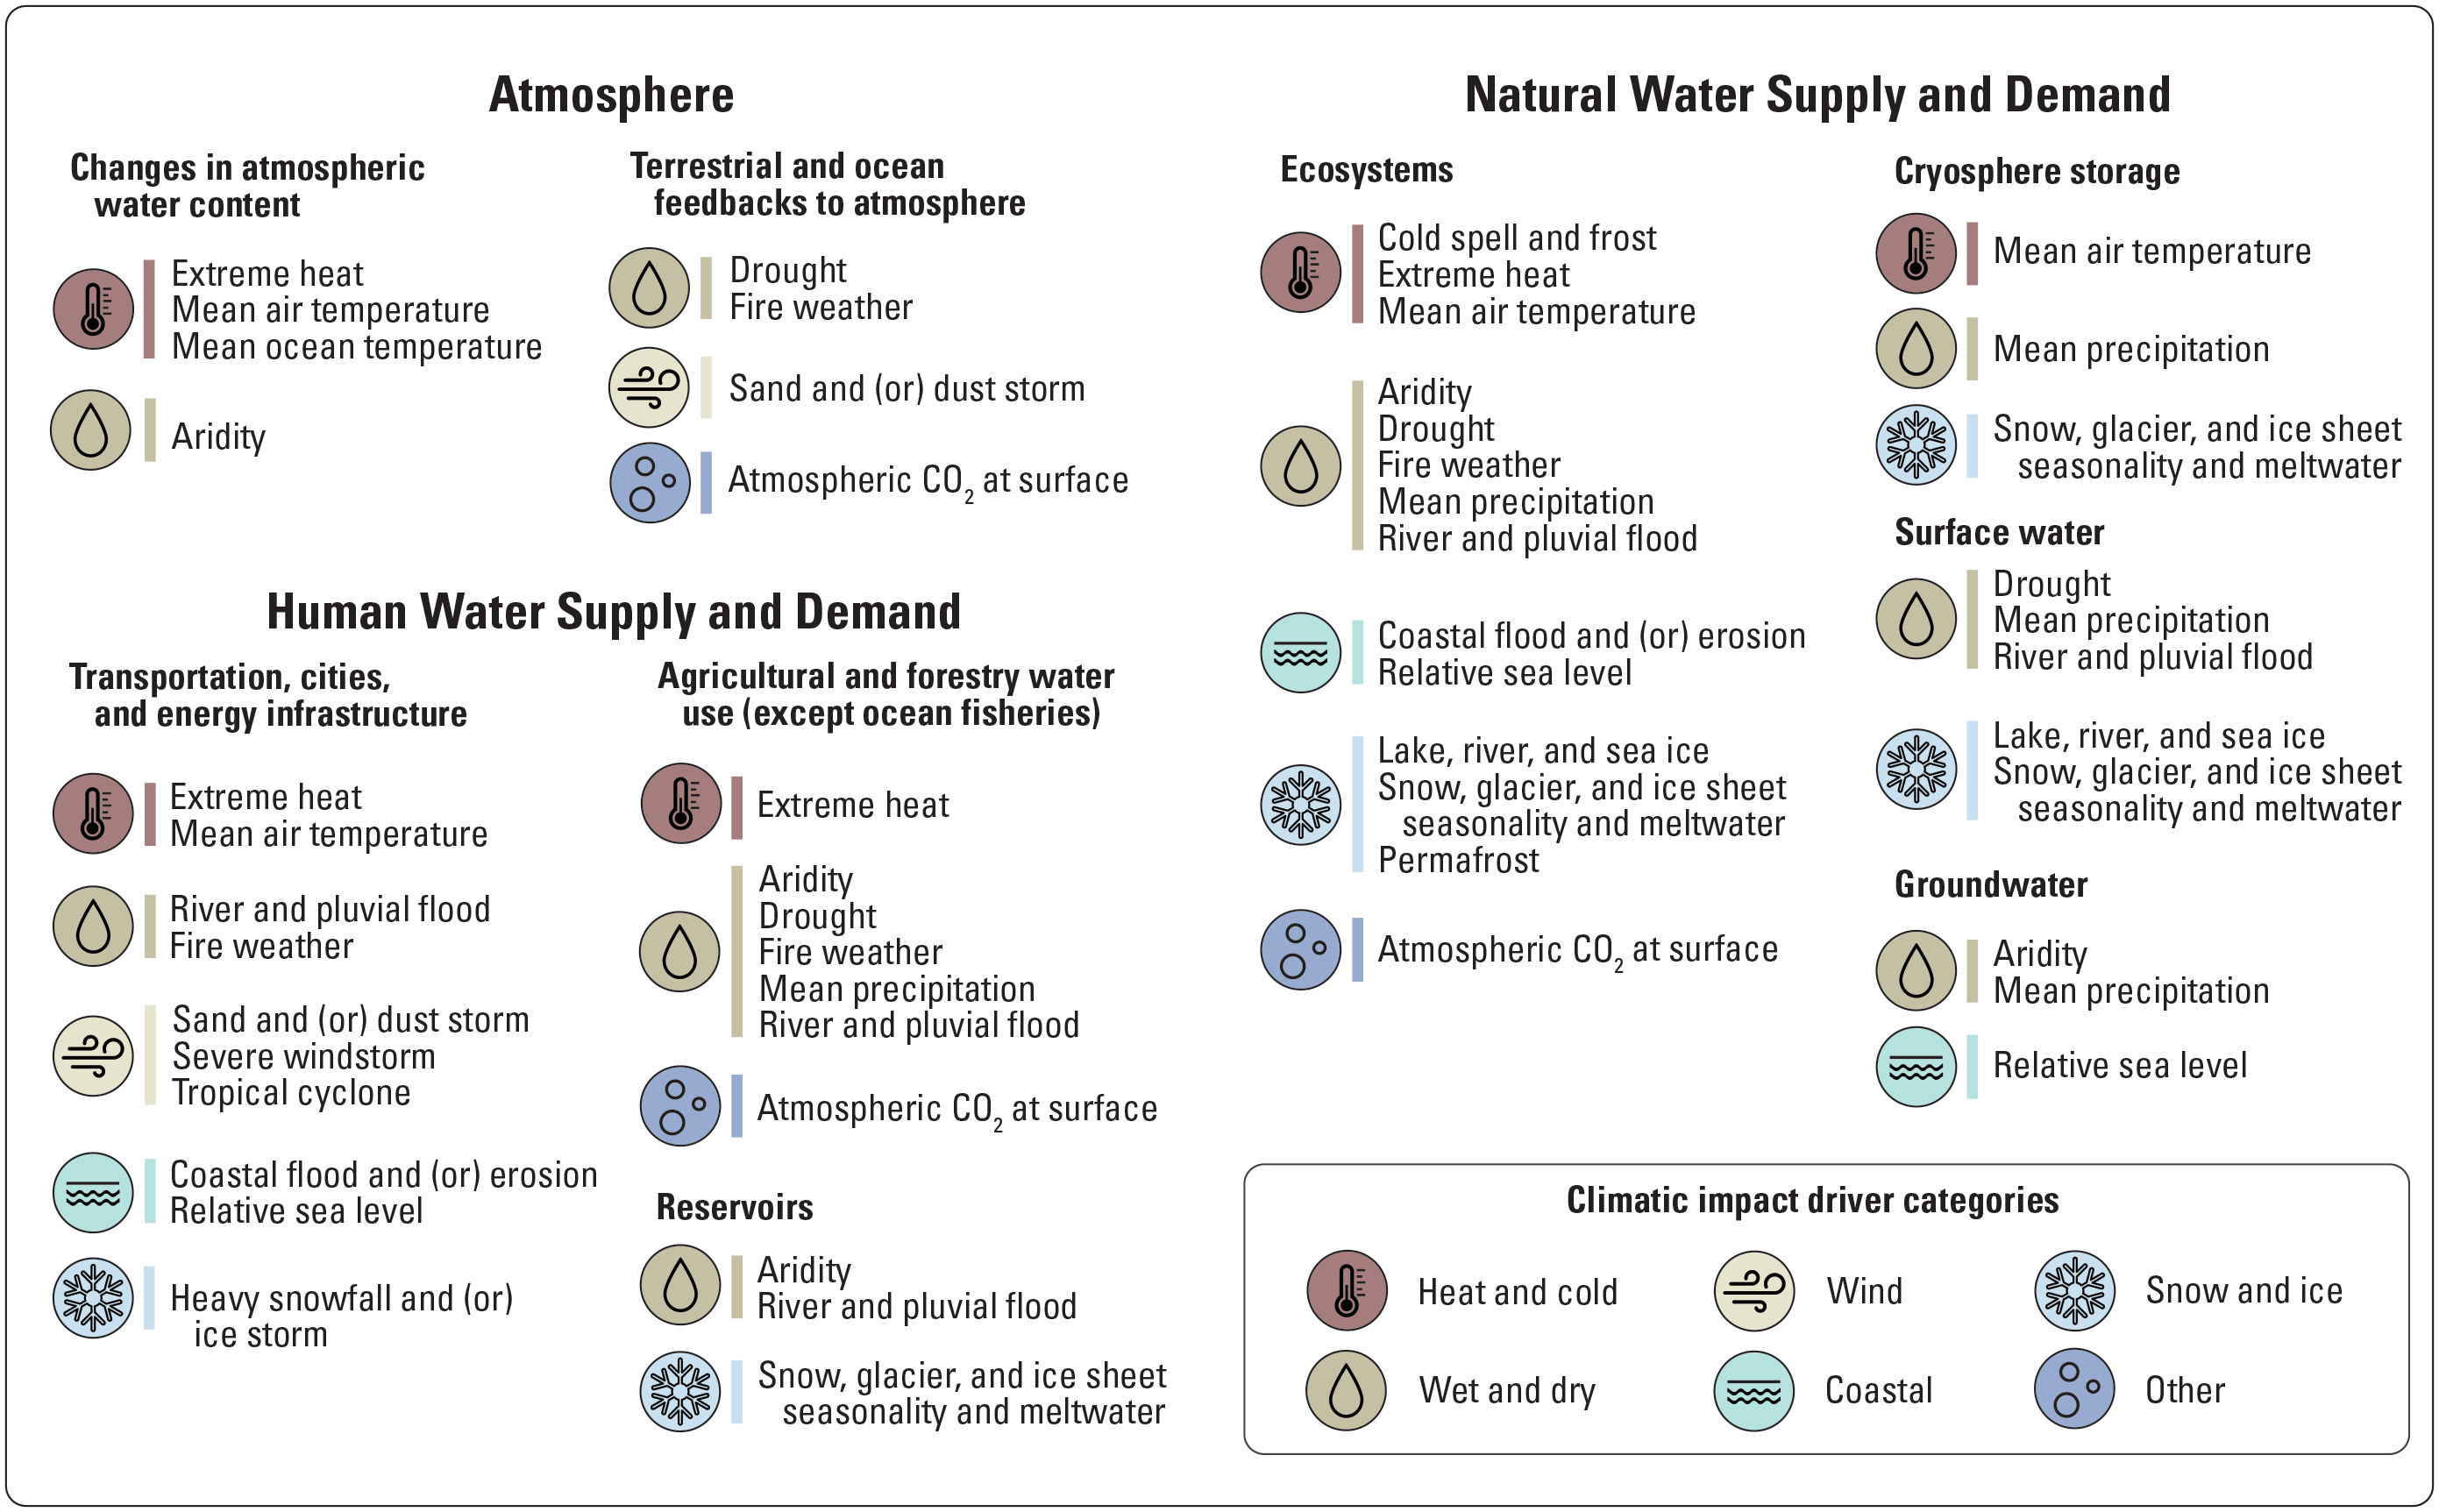
Major water-cycle related climatic impact drivers in the atmosphere and for natural and human-use categories of water supply and demand. CO2, carbon dioxide.
To show regional climatic impacts, table 1 lists selected climate-change processes and figure 4 shows primary projected water-cycle changes and the confidence associated with projections of change across North American climate regions. These processes are compiled from Hicke and others (2022, table 14.3, reproduced here as table 1), the IPCC AR6 WG-I Technical Summary (Arias and others, 2021), and the Water Cycle Components sections of this chapter. References in table 1 can be consulted for more detail on these regional impacts and projections for intermediate-to-high emission scenarios and changes that have already emerged, are likely to emerge by 2050 in high-emission scenarios, or are likely to emerge during 2050–2100 in high-emission scenarios.
Table 1.
Selected projected water resource impacts in North America.[From Hicke and others, 2022, table 14.3 (Hicke and others, 2022, section 14.5.3.2). Examples of future risks and impacts: HAB, harmful algal bloom. Location: North American Subregions CA-AT, Canada Atlantic; CA-BC, Canada British Columbia; CA-ON, Canada Ontario; CA-PR, Canada Prairies; CA-QC, Canada Quebec; US-MW, U.S. Midwest; US-NP, U.S. Northern Great Plains; US-NW, U.S. Northwest; US-SE, U.S. Southeast; US-SP, U.S. Southern Great Plains; US-SW, U.S. Southwest; MX-CE, Mexico Centre; MX-N, Mexico North; MX-NE, Mexico Northeast; MX-NW, Mexico Northwest; MX-SE, Mexico Southeast. Used with permission]
| Climate drivers and processes | Examples of future risks and impacts |
Location | References |
|---|---|---|---|
| Warming-induced reductions in mountain snow and glacial mass | Projected decreases in annual and late-summer streamflow from high-elevation reaches of snow-fed rivers, affecting stream ecology and water supplies (high confidence) | US-NW, US-SW, CA-BC, CA-PR | Jost and others, 2012; Solander and others, 2018; Bonsal and others, 2019; Milly and Dunne, 2020 |
| Earlier seasonal snowmelt runoff | Greater winter and early spring flooding risks and reduced summer surface water availability, intensifying seasonal mismatch with water demands (high confidence); increased challenges for balancing multi-purpose reservoir objectives (for example, flood management, water supply, ecological protection, and hydropower) (high confidence) | US-NW, US-SW, CA-BC, CA-PR | Cohen and others, 2015; Dettinger and others, 2015; Bonsal and others, 2019, 2020; River Management Joint Operating Committee, 2020; Bureau of Reclamation, 2021 |
| Earlier seasonal snowmelt runoff | Possible reductions in water supply security (medium confidence); reduced viability of some small-scale irrigation systems (medium confidence) | US-SW | Medellín-Azuara and others, 2015; Ullrich and others, 2018; Bai and others, 2020; Milly and Dunne, 2020; Ray and others, 2020; Bureau of Reclamation, 2021 |
| Changes in seasonal timing and (or) total annual runoff | Impacts on electric power generation (medium confidence), varying by location and type of generation | US-SW, US-NW, CA-QC | Haguma and others, 2014; Bartos and Chester, 2015; Guay and others, 2015; Turner and others, 2019; River Management Joint Operating Committee, 2020; Bureau of Reclamation, 2021 |
| Changes in seasonal timing and (or) total annual runoff | Impacts on urban water supplies | CA-QC | Foulon and Rousseau, 2018 |
| Warming-related increased imbalance between renewable surface-water supplies and consumptive water demands | Greater pressures on groundwater resources, possible increased aquifer depletion, reduced base flow into surface streams and reduced long-term water supply sustainability (medium confidence) | US-SW, US-SP, US-SE, MX-N, MX-NW | Bauer and others, 2015; Molina-Navarro and others, 2016; Russo and Lall, 2017; Brown and others, 2019; Nielsen‐Gammon and others, 2020; Bureau of Reclamation, 2021 |
| Warming-related drought amplification | Reduced water availability for human uses and ecological functioning (medium to high confidence), varying by location; increased evaporative losses from reservoirs | Widespread, especially US-SW, US-NP, US-SP, CA-PR, MX-NW, MX-N | Dibike and others, 2016; Prein and others, 2016a; Lall and others, 2018; Paredes-Tavares and others, 2018; Tam and others, 2018; Martínez-Austria and others, 2019; Martin and others, 2020; Milly and Dunne, 2020; Overpeck and Udall, 2020; Williams and others, 2020; Bureau of Reclamation, 2021 |
| Heavier and (or) prolonged rainfall events | Flooding, infrastructure and property damage (medium to high confidence), varying by location; increased erosion and debris flows with impacts on public safety, reservoir sedimentation, and stream ecology (hazards amplified in watersheds affected by wildfires) | Widespread, especially US-SE, US-NE, US-NP, US-SP, US-SW, CA-BC, MX-CE, MX-NE, MX-SE | Feng and others, 2016; Prein and others, 2016b, 2017; Emanuel, 2017; Haer and others, 2018; Kossin, 2018; Curry and others, 2019; Wobus and others, 2019; Concha Larrauri and Lall, 2020; Ball and others, 2021 |
| Heavier and (or) prolonged rainfall events | Water quality impairment, increasing HAB events due to increased sediment and nutrient loading together with warming; greatest impacts in humid areas with extensive agriculture (medium to high confidence) varying by location | US-MW, US-NE, US-SE, US-NP, US-SP, CA-ON, CA-AT, MX-NE, MX-NW | Alam and others, 2017; Chapra and others, 2017; Sinha and others, 2017; Ballard and others, 2019 |
| Increasingly variable precipitation | Highly variable precipitation poses challenges for water management, worsening water supply and flooding risks; atmospheric river events are projected to increase variability by dominating future North American west coast precipitation (medium confidence) | US-SW, US-NW, CA-BC | Gershunov and others, 2019; Huang and others, 2020 |
| Hotter summer season | Evaporative losses from reservoirs are projected to increase significantly (very high confidence) | US-SW, US-NW, US-NP | Bureau of Reclamation, 2021 |
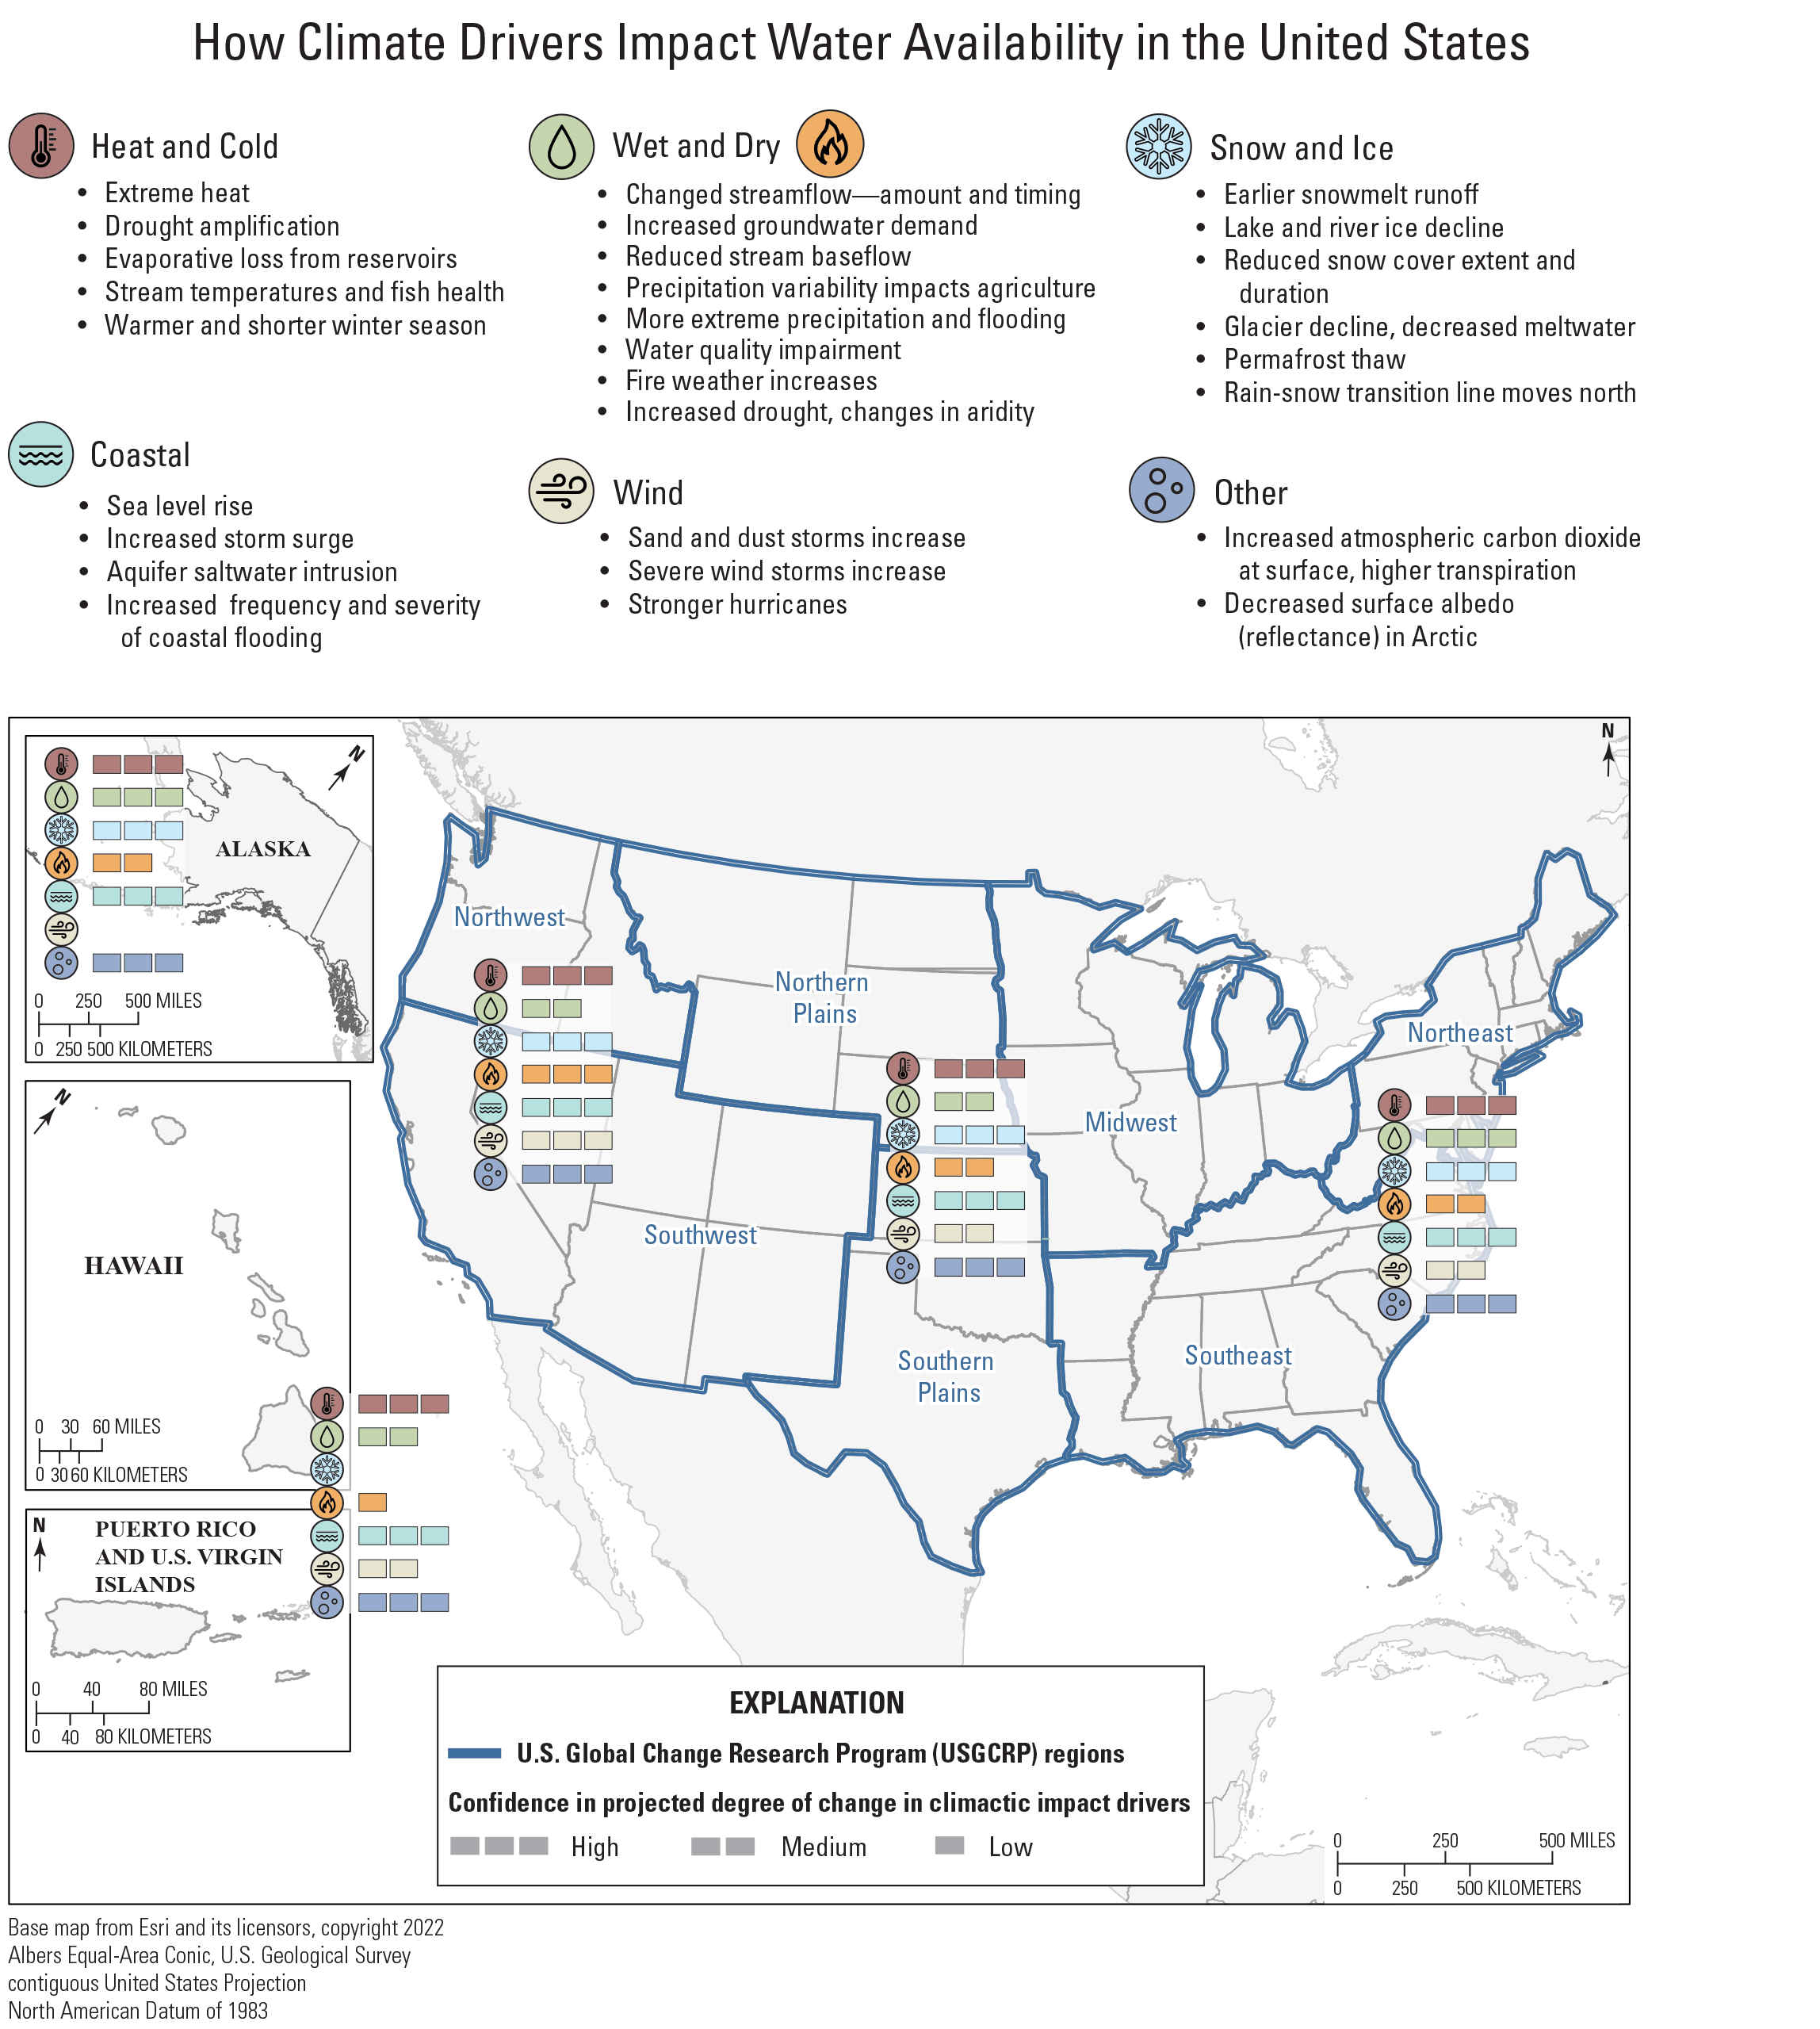
Primary water-availability impacts across the United States organized by climatic impact driver (CID) category. Bars by region on map represent confidence in projected changes in CIDs for mid-21st century under scenarios approximately corresponding to global warming levels of 2–2.4 degrees Celsius (°C), with no bars indicating not broadly relevant for the region, and one, two and three bars indicating low confidence, medium confidence, and high confidence, respectively. Information is synthesized from literature cited in this chapter, Ranasinghe and others (2021, tables 12.8 and 12.9), and table 1 (from Hicke and others, 2022, table 14.3).
The CID framework supported the IPCC AR6 central themes of risk and adaptation solutions (Ara Begum and others, 2022). Risk involves the potential for adverse consequences (see “Glossary”) whereas adaptation is how a system responds to observed or expected change to reduce risk or harm (see “Glossary”; Reisinger and others, 2020). AR6 Working Group II (Intergovernmental Panel on Climate Change, 2022) identified more than 120 key climate risks through literature review, climate-model results, and expert judgement (see Oppenheimer and others, 2014). Potentially severe risks were identified by assessing the magnitude of consequences, likelihood of adverse impacts, and the ability of society and ecosystems to respond. The magnitude of consequences entails consideration of the irreversibility of consequences, potential for reaching a tipping point, and potential for cascading effects (see sidebar 1). These potentially severe risks were then clustered into eight representative key risks summarized in O'Neill and others (2022): (1) risk to low lying areas; (2) risk to terrestrial and ocean ecosystems; (3) risk associated with critical physical infrastructure, networks and services; (4) risk to living standards; (5) risk to human health; (6) risk to food security; (7) risk to water security; and (8) risk to peace and human mobility.
Sidebar 1. Amplifying Feedbacks, Tipping Points, and Potential for Abrupt Change
Climate-sensitive elements in the Earth system can reach critical thresholds, referred to as tipping points, beyond which the system reorganizes to a new set of conditions with substantial, widespread impacts (Lenton and others, 2008; Kopp and others, 2016; Intergovernmental Panel on Climate Change, 2021b; Armstrong McKay and others, 2022). Abrupt changes in the water cycle, on regional to global scales, may follow after tipping point thresholds are reached. The crossing of tipping-point thresholds (in most cases, for temperature) is projected to generate regime shifts—abrupt, large, critical transitions in the function of natural systems that have wide socioeconomic impacts, are difficult to predict, and may be irreversible (Rocha and others, 2018). In some cases, the shift may occur rapidly, but it could also take decades, centuries, or even millennia to complete (Kopp and others, 2017). Scientists identify possible tipping elements in atmosphere-ocean circulation, the cryosphere, the carbon cycle, and ecosystems through a combination of physical models, paleoclimate models, and expert analysis (Kopp and others, 2017). Table S1.1 lists critical tipping points associated with the water cycle; some are discussed further in other sections of this chapter.
Table S1.1.
Examples of climate tipping elements relevant to the water cycle, their drivers, possible self-amplifying feedbacks, and impacts of crossing the tipping point into a new regime.[Abbreviations: CH4, methane; CO2, carbon dioxide; GHG, greenhouse gas; N2O, nitrous oxide; °C, degrees Celsius]
“There is medium confidence that the Atlantic Meridional Overturning Circulation will not collapse abruptly before 2100, but if it were to occur, it would very likely cause abrupt shifts in regional weather patterns, and large impacts on ecosystems and human activities.”—Intergovernmental Panel on Climate Change, 2023, BOX SPM.1.
Cascading effects of change, compounding of extreme events, and self-reinforcing or amplifying feedbacks between indirectly related climate elements may also cause changes in the water cycle. An example of a system of cascading effects is shown in figure S1.1, showing how climate-change driven sea-level rise impacts physical-environment and socioeconomic systems. Compound extremes are multiple events that occur either simultaneously or in rapid succession, for example increased frequency of paired extremes such as droughts and intense rainfall, or drought and extreme heat waves, or extremes existing over greater spatial or temporal scales such as drought in several major agricultural regions in the world or lasting for multiple decades. Self-reinforcing cycles produce change at rates or to an extent not predicted, for example, in the summer the Arctic Ocean has shifted from generally ice-covered to a state of nearly ice-free. Modeling has generally underestimated the rate of Arctic sea ice loss because of insufficient positive feedback in existing models.
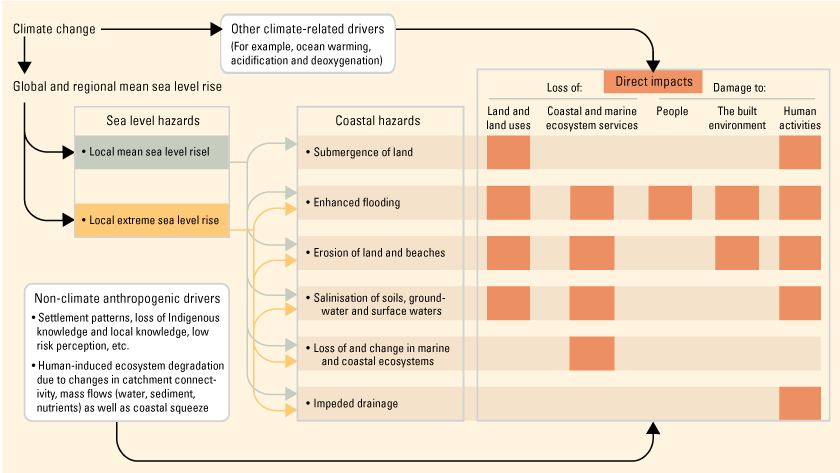
Overview of the main cascading effects of sea-level rise. From Oppenheimer and others (2022, fig. 4.13).
The Technical Summary of IPCC AR6 (Section TS.3.2.2; Arias and others, 2021) states the following: “There is potential for abrupt water cycle changes in some high emissions scenarios, but there is no overall consistency regarding the magnitude and timing of such changes. Positive land surface feedbacks, including vegetation, dust, and snow, can contribute to abrupt changes in aridity, but there is only low confidence that such changes will occur during the 21st century. Continued Amazon deforestation, combined with a warming climate, raises the probability that this ecosystem will cross a tipping point into a dry state during the 21st century (low confidence).” Temperature thresholds for tipping (that is, tipping points) are a subject of ongoing research and the most recent values are available in the current literature or the IPCC reports (Kopp and others, 2017; Lenton and others, 2019, 2023; Barnard and others, 2021). Ripple and others (2023) reported that there is high uncertainty regarding key tipping point feedback loops, including ocean circulation and large-scale losses of ice sheets, permafrost, and forests.
Climate intersects with much of the water cycle, and climate-change related events (including floods, droughts, wildfire, and snowpack depth) interact with systems such as energy, agriculture, and the financial sector. These intersections lead to complex behavior and outcomes that are difficult to predict. The complexity of feedbacks and socioeconomic factors are such that tools and frameworks to determine how human systems interact with Earth systems still work around large gaps in understanding. Importantly, self-reinforcing cycles within climate systems have the potential to accelerate human-induced climate change or its effects. Compound extreme events, abrupt changes, and non-reversing changes may cause future scenarios that have not been simulated with Earth-system models. For example, a recent reassessment of nine global climate tipping points indicates that global warming greater than 1.5-degree Celsius increases the risk of triggering multiple tipping points (Armstrong McKay and others, 2022).
The IPCC AR6 report highlights water security as a key concern, stating that water security is a “potentially severe risk because climate change could impact the hydrologic cycle in ways that would lead to substantial consequences for the health, livelihoods, property and cultures of large numbers of people” (O'Neill and others, 2022, p. 2463). Dimensions of water security include water scarcity risks, water-related hazards, and impacts on Indigenous and traditional cultures and ways of life. Altered regional patterns of precipitation and increased evapotranspiration are expected to change the quantity and timing of the available water supply. An estimated 1.6 billion people experience water scarcity globally (Gosling and Arnell, 2013), with estimates rising to 3 billion people at a 2-degree Celsius (°C) increase in global temperature, and 4 billion people at a 4 °C increase (O'Neill and others, 2022). As many as 2 billion people lack access to safely managed drinking water and as many as 3.6 billion people lack access to safely managed sanitation globally (UNESCO, 2023). Additionally, an increase in extreme precipitation events is expected to lead to greater flood risk, increasing the estimated 50 million people impacted by floods annually (Alfieri and others, 2017) to 150 million people with a 2 °C increase and more than 300 million people at a 4 °C increase (O'Neill and others, 2022). In addition to the increase in the total population affected, these changes will likely have substantial food security and financial implications, as well as impacts on livelihood choices and overall well-being.
Climate-Change Impacts on Water-Cycle Components
Precipitation—Amount, Frequency, and Intensity
Precipitation is the water-cycle process that transfers atmospheric water in vapor phase to the land or ocean surface in liquid or frozen phases, and the rates and modes of this transfer are increasingly impacted by global warming. Precipitation primarily includes rain and snow; snow processes are discussed in more detail in the “Cryosphere—Ice and Snow” section of this chapter.
Observations
Annual precipitation since the beginning of the 20th century increased across much of the Northern and Eastern United States and decreased across most of the Southern and Western United States (Walsh and others, 2015; Easterling and others, 2017; Hayhoe and others, 2018). Seasonally, increases in U.S. precipitation have been largest for the fall season (about 10 percent) whereas there have been only small increases for the winter season (about 2 percent), with drying over much of the Western United States and parts of the Southeast (Easterling and others, 2017). For the spring season, the northern CONUS has become wetter, and the southern CONUS has become drier. For the summer season, there has been a mixture of increases and decreases in precipitation across the CONUS. Additionally, annual precipitation in Alaska indicates little change (about a 1.5 percent increase); however, for all seasons, precipitation in central Alaska has decreased whereas precipitation in the Alaska panhandle has increased (Easterling and others, 2017). Annual precipitation in Hawaii decreased by more than 15 percent during 1901–2015 (Easterling and others, 2017).
Bindoff and others (2013) suggested that anthropogenic effects contributed to intensification of heavy precipitation over land regions globally. Consistent with this projection, the frequency and intensity of heavy precipitation events across the United States have increased (Easterling and others, 2017; Hayhoe and others, 2018; Kirchmeier-Young and Zhang, 2020). The largest changes in precipitation extremes have occurred in the northeastern and midwestern CONUS, where the amount of precipitation falling in the heaviest events has increased by 30 to more than 40 percent (Wang, Feng, and others, 2012; Vose and others, 2014; Perlwitz and others, 2017; Hayhoe and others, 2018). Additionally, a significant increase in the area affected by extreme precipitation in North America also has been observed (Dittus and others, 2015).
Future Water Availability
Changes in precipitation patterns are expected in association with increased atmospheric temperature. Climate-model projections of future precipitation indicate substantial increases in winter and spring precipitation for the Northern Great Plains, the Upper Midwest, and the Northeast (Easterling and others, 2017). Additionally, observed increases in the frequency and intensity of extreme precipitation events across most of the CONUS are projected to continue (Easterling and others, 2017; Prein and others, 2017; Steinschneider and Najibi, 2022).
Observed and projected increases in precipitation across the northern CONUS are due, in part, to the influence of global warming on atmospheric dynamics that results in a poleward expansion of the tropics and a northward shift in winter storm tracks in the Northern Hemisphere (Wang, Feng, and others, 2012; Collins and others, 2014; Vose and others, 2014; Easterling and others, 2017; Perlwitz and others, 2017; Hayhoe and others, 2018). Because of these shifts in the tropics and the position of winter storm tracks, high-latitude regions are generally projected to become wetter whereas areas in the subtropics (for example, from about latitude 23 to 35 degrees north) are projected to become drier.
Atmospheric rivers are narrow bands of concentrated atmospheric moisture that contribute about 30–40 percent of the precipitation including snow along the West Coast of the United States. Although they are not as important to the water supply in the Eastern United States, atmospheric rivers can be a flood hazard for both the West and East Coasts of the United States (Ralph and others, 2020). As global warming continues, the frequency and severity of atmospheric river precipitation events are likely to increase because of increasing evaporation and higher atmospheric water-vapor content and transport capacity (Dettinger, 2011; Gao and others, 2015; Wehner and others, 2017; Hayhoe and others, 2018). The potential for stronger tropical cyclones (that is, hurricanes and typhoons) is expected to increase (Bindoff and others, 2013; Camargo, 2013; Walsh and others, 2015; Wehner and others, 2018); however, the total number of tropical storms is generally projected to remain unchanged or even decrease. The most extreme storms are generally projected to increase in frequency, and the amount of precipitation associated with a given storm also is projected to increase (Knutson and others, 2015; Gutmann and others, 2018).
Observed increases in the frequency and intensity of extreme precipitation events across most of the CONUS are projected to continue (Easterling and others, 2017; Prein and others, 2017; Intergovernmental Panel on Climate Change, 2021d; Steinschneider and Najibi, 2022). How these projected increases in precipitation affect future water availability will depend on additional factors such as the effects of increased evapotranspiration on water availability. For example, in a study of projected future hydro-climatic conditions from 214 climate-model simulations for 374 National Park Service parks, Battaglin and others (2020) reported that even though precipitation is projected to increase for most parks, streamflow is projected to decrease in the parks because of temperature-driven increases in future evapotranspiration. Furthermore, the degree to which heavier precipitation results in increased streamflow (and possibly flooding) depends on the geomorphology of a river basin, the land cover and land use in the basin, the extent and duration of extreme precipitation, and how saturated the soil is before the precipitation event (Intergovernmental Panel on Climate Change, 2021b).
Evapotranspiration and Soil Moisture
Evapotranspiration is the combined total flux of evaporation and transpiration, processes that transfer terrestrial water as water vapor to the atmosphere, driven by thermal energy from the sun. As with precipitation, rates and spatial distribution of this process are impacted by global warming. Evaporation occurs from surface water bodies, bare soil, impervious surfaces, snow (as sublimation), and precipitation retained on vegetation (canopy interception). Transpiration is regulated by plants that move water from the soil rooting zone and release it to the atmosphere by evaporation from leaves. Transpiration declines during the winter, especially in deciduous systems, and is regulated by the availability of soil moisture. Soil moisture content at any time is a function of supply (precipitation, snowmelt, or irrigation) and atmospheric demand that drives evapotranspiration. Soil moisture factors into several indices for agricultural and ecological drought.
Evapotranspiration
Evapotranspiration is expressed as potential evapotranspiration (PET) and actual evapotranspiration (AET); both are useful indices, depending on context. PET is synonymous with atmospheric evaporative demand and is determined by how much water the atmosphere will hold at saturation at the specified conditions of temperature, insolation, and wind (see “Glossary”). AET is determined by availability of soil moisture and surface water to evaporate and is moderated partly by vegetation. Water-vapor holding capacity of the atmosphere increases by approximately 7 percent for each 1 °C increase in atmospheric temperature. Warmer temperatures increase evapotranspiration (Wehner and others, 2017), and although PET and AET rates may be similar in humid climates, they differ in arid regions where AET is low because of limited exposed surface water, lower soil moisture content, and sparse vegetative cover. Evapotranspiration rates (AET) for water assessments are currently obtained from ensemble methods using water balance, flux tower, and remote sensing measurements (Reitz and others, 2023) or from models that integrate satellite observations and climate variables in an energy balance for the land surface (Melton and others, 2021; Senay and others, 2022).
Observations
Globally, total water-vapor content in the atmosphere has increased since the 1980s, and near-surface specific humidity has increased over the ocean (likely) and land (very likely) since at least the 1970s, with a detectable human influence (Arias and others, 2021). Irrigation increases total evapotranspiration and thus the total amount of water vapor in the atmosphere; this process alters the energy balance, reducing growing-season surface temperatures regionally by about 1–3 °C (McDermid and others, 2023). Agricultural intensification with irrigation can also suppress local rainfall and enhance downwind precipitation (Bonfils and Lobell, 2007; Mueller and others, 2015; Pei and others, 2016; Alter and others, 2018; Zhou and others, 2019; Chen and Dirmeyer, 2020; McDermid and others, 2023). Using satellite-derived vegetation growth indices, meteorological data, and water availability indices in the Northern Hemisphere, Jiao and others (2021) reported an increasing trend in water deficits and increasing vegetation susceptibility to drought over the period 1982–2015. Several studies suggest that increasing water constraints on vegetation could offset the carbon sink of increased vegetation growth expected from rising temperatures and CO2 (Yuan and others, 2019; Jiao and others, 2021; McDermid and others, 2023).
Future Water Availability
Projections indicate with virtual certainty that evaporation will increase over the ocean and very likely over land (variable by region) with future surface warming (Arias and others, 2021). Overall, in areas where rainfall and vegetation growth increase, increased evapotranspiration will result in dampening regional warming (Jia and others, 2022). Global evapotranspiration increased from the early 1980s to 2000s, but model projections indicated constraints on further increases due to low soil moisture availability along with rising CO2 limiting stomatal opening and thus reducing transpiration (Jiao and others, 2021; Jia and others, 2022; Lesk and others, 2022). However, the effects of compound extremes of heat, drought and excess moisture on crops are poorly understood and adaptation strategies require better simulations of plant-soil-atmosphere systems (Lesk and others, 2022). In the Western United States, where shallow groundwater often supplies phreatophyte transpiration (Garcia and others, 2015), increased evaporative demand may decrease groundwater storage and stream base flow and reduce recharge (Condon and others, 2020). Warming-driven increases in evapotranspiration in the Eastern United States are projected to drive greater decreases in shallow groundwater storage relative to the already water-limited Western United States (Condon and others, 2020). Mankin and others (2019) evaluated precipitation partitioning to evapotranspiration, runoff, and storage in 16 Earth-system models and reported that runoff was reduced over large regions because of vegetation response to increasing temperatures and CO2 levels. They concluded that the role of terrestrial vegetation in future regional freshwater availability is currently unresolved.
Soil Moisture
Soil moisture is monitored closely for agriculture as an important indicator of drought conditions. The U.S. Drought Monitor (USDM; Svoboda and others, 2002) provides weekly information about drought across the United States. An important component of the USDM is the Palmer Drought Severity Index (PDSI), a locally normalized index of soil moisture availability calculated from moisture supply (precipitation) and demand (evapotranspiration). It is reported in the National Integrated Drought Information System (2023) and is also used as a target variable for proxy-based reconstructions of soil moisture. The Evaporative Stress Index (ESI) describes anomalies in evapotranspiration relative to a reference ratio (Anderson and others, 2016). ESI agrees well with the drought severity classification in the USDM archive and serves as an early indicator during flash drought events (Anderson and others, 2011; Otkin and others, 2013, 2014). Earth-observing satellites deliver spatially explicit information on precipitation, plant-available soil moisture, and evapotranspiration, depending on land cover and land use and can provide early signals of water-stressed vegetation.
Observations
There is high confidence in human influence on surface-soil moisture deficits from increased evapotranspiration caused by higher temperatures (Wehner and others, 2017). The average temperature over the United States for the period 2006–15 was 1.53 °C higher than for the period 1850–1900, and 0.66 °C higher than the equivalent global mean temperature change. These warmer temperatures (with changing precipitation patterns) have altered the start and end of growing seasons, contributed to regional crop yield reductions, reduced freshwater availability, placed biodiversity under further stress, and increased tree mortality (high confidence; Jia and others, 2022). Soil moisture is affected by evapotranspiration and precipitation and controlled by canopy density and plant rooting, with complex feedbacks between soil-plant systems and the atmosphere. There is medium confidence in evidence indicating that soil moisture conditions influence frequency and magnitude of extremes such as drought and heat waves (Jia and others, 2022).
Dry soil conditions generally favor or strengthen summer heatwave conditions through reduced evapotranspiration and increased sensible heat. By contrast, wet soil conditions from irrigation or crop management practices that maintain a cover crop all year round can dampen extreme warm events through increased evapotranspiration and reduced sensible heat. Early plant activity in a warm spring may deplete soil moisture and amplify summer heating, as a lagged effect (Hibbard and others, 2017). A suite of complementary remotely sensed moisture and vegetation-health indicators (such as evapotranspiration, vegetation indices, and precipitation anomalies) has been shown to benefit climate vulnerability assessments and drought preparedness (Anderson and others, 2011; Otkin and others, 2013, 2014; Anderson and others, 2016).
Point-based ground measurements differ from satellite-derived soil moisture (Ford and others, 2016; Yuan and Quiring, 2016) because satellite measurements are limited to the top few centimeters of soil whereas point-based measurements from sensors at various depths at one sample location usually span at least 1 meter in depth. Large-scale soil moisture measurements are rarely compared to soil moisture simulated by climate models, and these are not available for periods longer than that of the satellite record, so trends in soil moisture with warming require models, or indices that are estimated from more widely measured data such as temperature and precipitation (Cook and others, 2014).
Future Water Availability
Increased sensitivity of atmospheric response to land cover and land use may have more impact on climate in the future than today (Jia and others, 2022). As evapotranspiration increases with temperature, future decreases in surface (top 10 centimeters) soil moisture over most of the United States are likely as the climate warms. Nearly all CMIP5 ensemble model simulations indicated U.S. surface soil moisture drying at the end of the century under the higher emissions scenario (RCP8.5; Wehner and others, 2017). However, few CMIP5 land models include detailed ecological representations of evapotranspiration processes thus causing the soil moisture budgets to be poorly constrained and projections have high uncertainty in the magnitude of the change in soil moisture at all depths and all regions and seasons. A comparison of CMIP6 model simulations of shallow and deep soil moisture to reanalysis data indicated reasonable agreement in most regions of the world, but there were considerable discrepancies at high elevation and high latitudes because of the inability of models to adequately simulate freeze-thaw processes (Qiao and others, 2022).
Streamflow—Processes and Extremes
Stream and river flows (also referred to as runoff in some models) supply surface water for human and ecological needs across the United States. Streamflow is affected by the balance between natural precipitation supply and evapotranspiration demand in different regions (chap. B, Gorski and others, 2025; chap. F, Stets and others, 2025b) as well as water consumption and return flows related to drinking water, agriculture, industry, and electricity (chap. D, Medalie and others, 2025). This chapter primarily describes observed and projected climate-change findings based on streamflow minimally affected by human water management. Streamflow is monitored across the United States with a network of streamgages, mostly operated by the U.S. Geological Survey (USGS) and to a lesser extent by other agencies. The network delivers gage height and stream discharge data at 15- to 60-minute resolutions, often aggregated to daily values for annual reporting (U.S. Geological Survey, 2024).
Observations
Long-term records of streamflow allow computation of flow statistics and determination of trends and extremes to quantify droughts and floods. Network observations indicate that streamflow trends show high variability across the CONUS because of the range of variables that can influence streamflow timing and amount, including precipitation, snowmelt, temperature, land use and land cover, water withdrawal patterns, and channel characteristics (Dethier and others, 2020; Douville and others, 2021). Additionally, streamflow can be impacted by warming and drying regional climate causing an increase in groundwater withdrawals leading to streamflow capture.
Previous research indicated spatial and temporal variability in streamflow trends including daily streamflow quantities, frequency of extreme high- or low-flow events, and base-flow patterns. McCabe and Wolock (2002) examined daily streamflow at 400 sites during 1941–99 and reported an increase in annual minimum and median daily streamflow and less significant patterns in changes in annual maximum daily streamflow, with changes largely clustered in the Northeast. A more recent study assessing the frequency of extreme streamflow using mean daily discharge records at 541 streamgages indicated spatial and interannual variability in high- and low-flow events across the United States and Canada over the past 60 years (Dethier and others, 2020). The study reported a strong association between increased frequency of high-flow events and snowmelt-dominated hydro-regions, specifically the Pacific Northwest, Appalachian Mountains, Northeast and Upper Midwest, Rocky Mountain highlands, Rocky Mountains, and Midwest (Dethier and others, 2020). Using 30-year base-flow records at more than 3,200 streamgages, Ayers and others (2022) noted patterns of decreasing base-flow trends in the Southern United States, with decreases in the Southwest observed throughout the year and decreases in the Southeast most often occurring in spring. Increasing base-flow trends were observed in the Northeast, the Pacific Northwest, and the Midwest, associated with precipitation trends and with temperature (Ayers and others, 2022). There is high confidence that the timing of peak flows has shifted because of a warming climate impacting total snowfall volume and timing of melting on a global scale (Douville and others, 2021). Although streamflow generally reflects precipitation or snowmelt processes, sidebar 2 explains how quantifying trends and extremes in streamflow, and attributing them to climate change, requires long-term records.
Sidebar 2. A Century of Streamflow Variability
Here, we examine the occurrence of extreme runoff conditions during 1901–2020 across the conterminous United States (CONUS). Measured runoff (streamflow per unit area) was aggregated in 2,049 8-digit hydrologic unit codes (HUC8s) that had complete data records (U.S. Geological Survey, 2024). The 2,049 HUCs are well-distributed across the CONUS. For this analysis, the monthly runoff data for each HUC were converted to percentiles. The percentiles for each HUC were computed for each month separately to remove the effects of seasonality on the runoff percentiles. The percentiles of monthly runoff then were used to compute the percent area of the CONUS and of four U.S. aggregated hydrologic regions—West, High Plains, Northeast through Midwest, and Southeast (map in fig. S2.1A)—with monthly runoff percentiles greater than the 90th percentile (p90, extreme high runoff) or less than the 10th percentile (p10, extreme low runoff). The percentage of area was computed as the sum of the areas of the HUCs within the CONUS and each of the four aggregated hydrologic regions that met the extreme high and low runoff criteria.
This examination of long time series of CONUS and regional runoff allows for the identification of periods when an anomalously large percentage of an area of aggregated hydrologic regions had extreme monthly runoff and provides a long-term context for anomalous events. Using shorter time series could lead to improper interpretations of trends and extremes in the time series.
For the CONUS (fig. S2.1B), the time series of the percentage of area with extreme high monthly runoff indicates the early 20th-century pluvial (see “Glossary”), whereas the time series of the percentage of area with extreme low monthly runoff indicates several well-known drought conditions including the 1930s “dust bowl” drought, the 1950s drought, the 1960s drought (which resulted in the drought of record in the Delaware River Basin), the late 1980s drought (which resulted in low flow conditions of the Mississippi River), and the “turn-of-the-century drought” that began around the year 2000.
The time series for the four aggregated hydrologic regions show greater detail in extreme high and low flows where these anomalous climate events were focused. For example, the early 20th century pluvial is most evident in the figures for the West and High Plains aggregated hydrologic regions (fig. S2.1C and S2.1D), whereas the 1930s drought is apparent for the West, High Plains, and Northeast through Midwest aggregated hydrologic regions (fig. S2.1C, S2.1D, and S2.1E), and the 1950s drought is most visible for the Southeast aggregated hydrologic regions (fig. S2.1F). Another feature evident in figure S2.1E is an increase in the percentage of area with high monthly runoff after about 1970. The increase in high monthly runoff events since about 1970 coincides with an increase in precipitation that occurred primarily in the eastern CONUS at about 1970 and continues to date (2023).
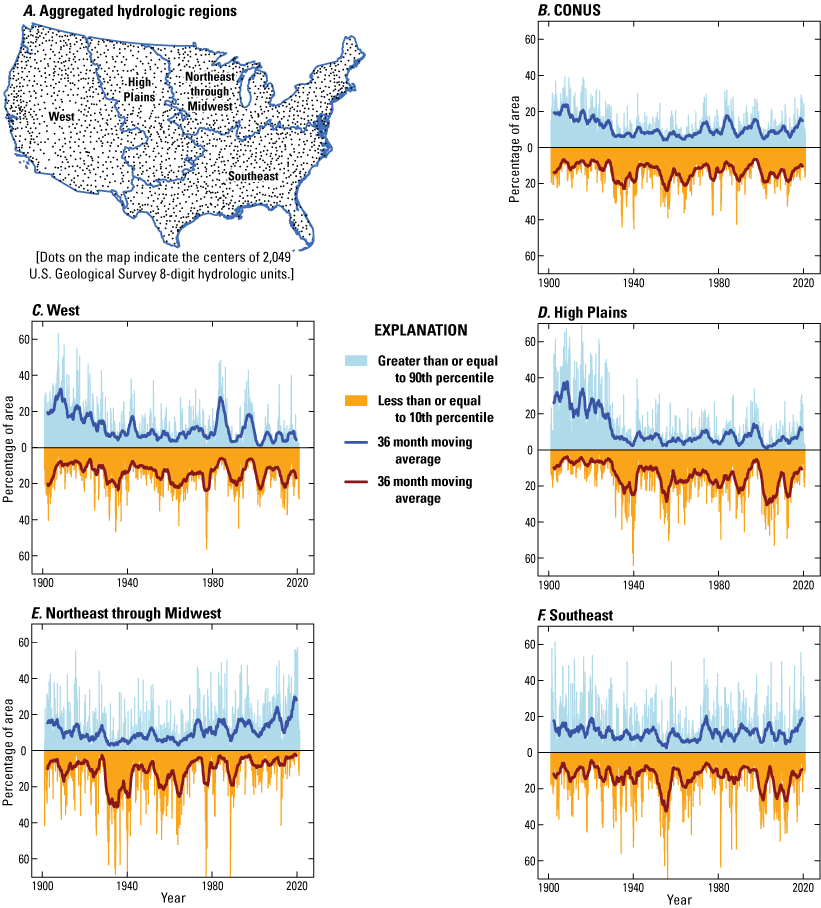
Four regions of the conterminous United States (CONUS) and time series of percentage of area with high or low flow extremes monthly across CONUS, 1901–2020. (A) Map of four aggregated hydrologic regions in CONUS indicated by boundary lines. (B–F) Time series of the percentage of area with monthly runoff percentiles greater than or equal to the 90th percentile (bars above the 0 percentage of area), and monthly runoff percentiles less than or equal to the 10th percentile (bars below the 0 percentage of area) for the (B) CONUS, (C) West, (D) High Plains, (E) Northeast through Midwest, and (F) Southeast. The thick lines in each figure indicate 36-month moving averages.
Extreme precipitation events can lead to flooding, with impacts on human infrastructure, water quality, and ecosystems. Slater and Villarini (2016) analyzed daily discharge values during 1965–2015 at 526 USGS streamgage sites across the country and reported that, on average, river floods (see “Glossary”) became larger in the Northeast and Northern Plains of the United States, and more frequent in the Northeast, Northwest, and Northern Plains during 1965–2015. Decreases in flood magnitude were generally observed in the Western United States, Southern Plains, and northern Minnesota. Mallakpour and Villarini (2015) used daily records from 774 streamgages to examine patterns in flooding magnitude and frequency across the Central United States. Although there were no significant trends in magnitude of recorded flood peaks, there were trends of decreased flood frequency in the northeast and southwest of the Central United States, and increased flood frequency elsewhere in the region. Collins and others (2022) examined the 10 largest floods over 50 years (1966–2015) at 496 streamgages across the CONUS to determine whether the occurrence of high-impact floods was increasing in response to climate change. Analysis of expected and observed large floods pooled over regional streamgage clusters defined by McCabe and Wolock (2014) yielded a complex picture with no clear increase or decrease in the frequency of large floods over the period.
Links between increased rainfall, streamflow, and flooding are not straightforward (fig. 5). There are several interactions between increased precipitation intensity, increased capacity of the soil to accept sustained rainfall, antecedent base-flow conditions (Sharma and others, 2018; Berghuijs and Slater, 2023), and regional variation. Overall, however, increases in the magnitude of extreme events because of climate change will increase flood severity in areas where flooding occurs.
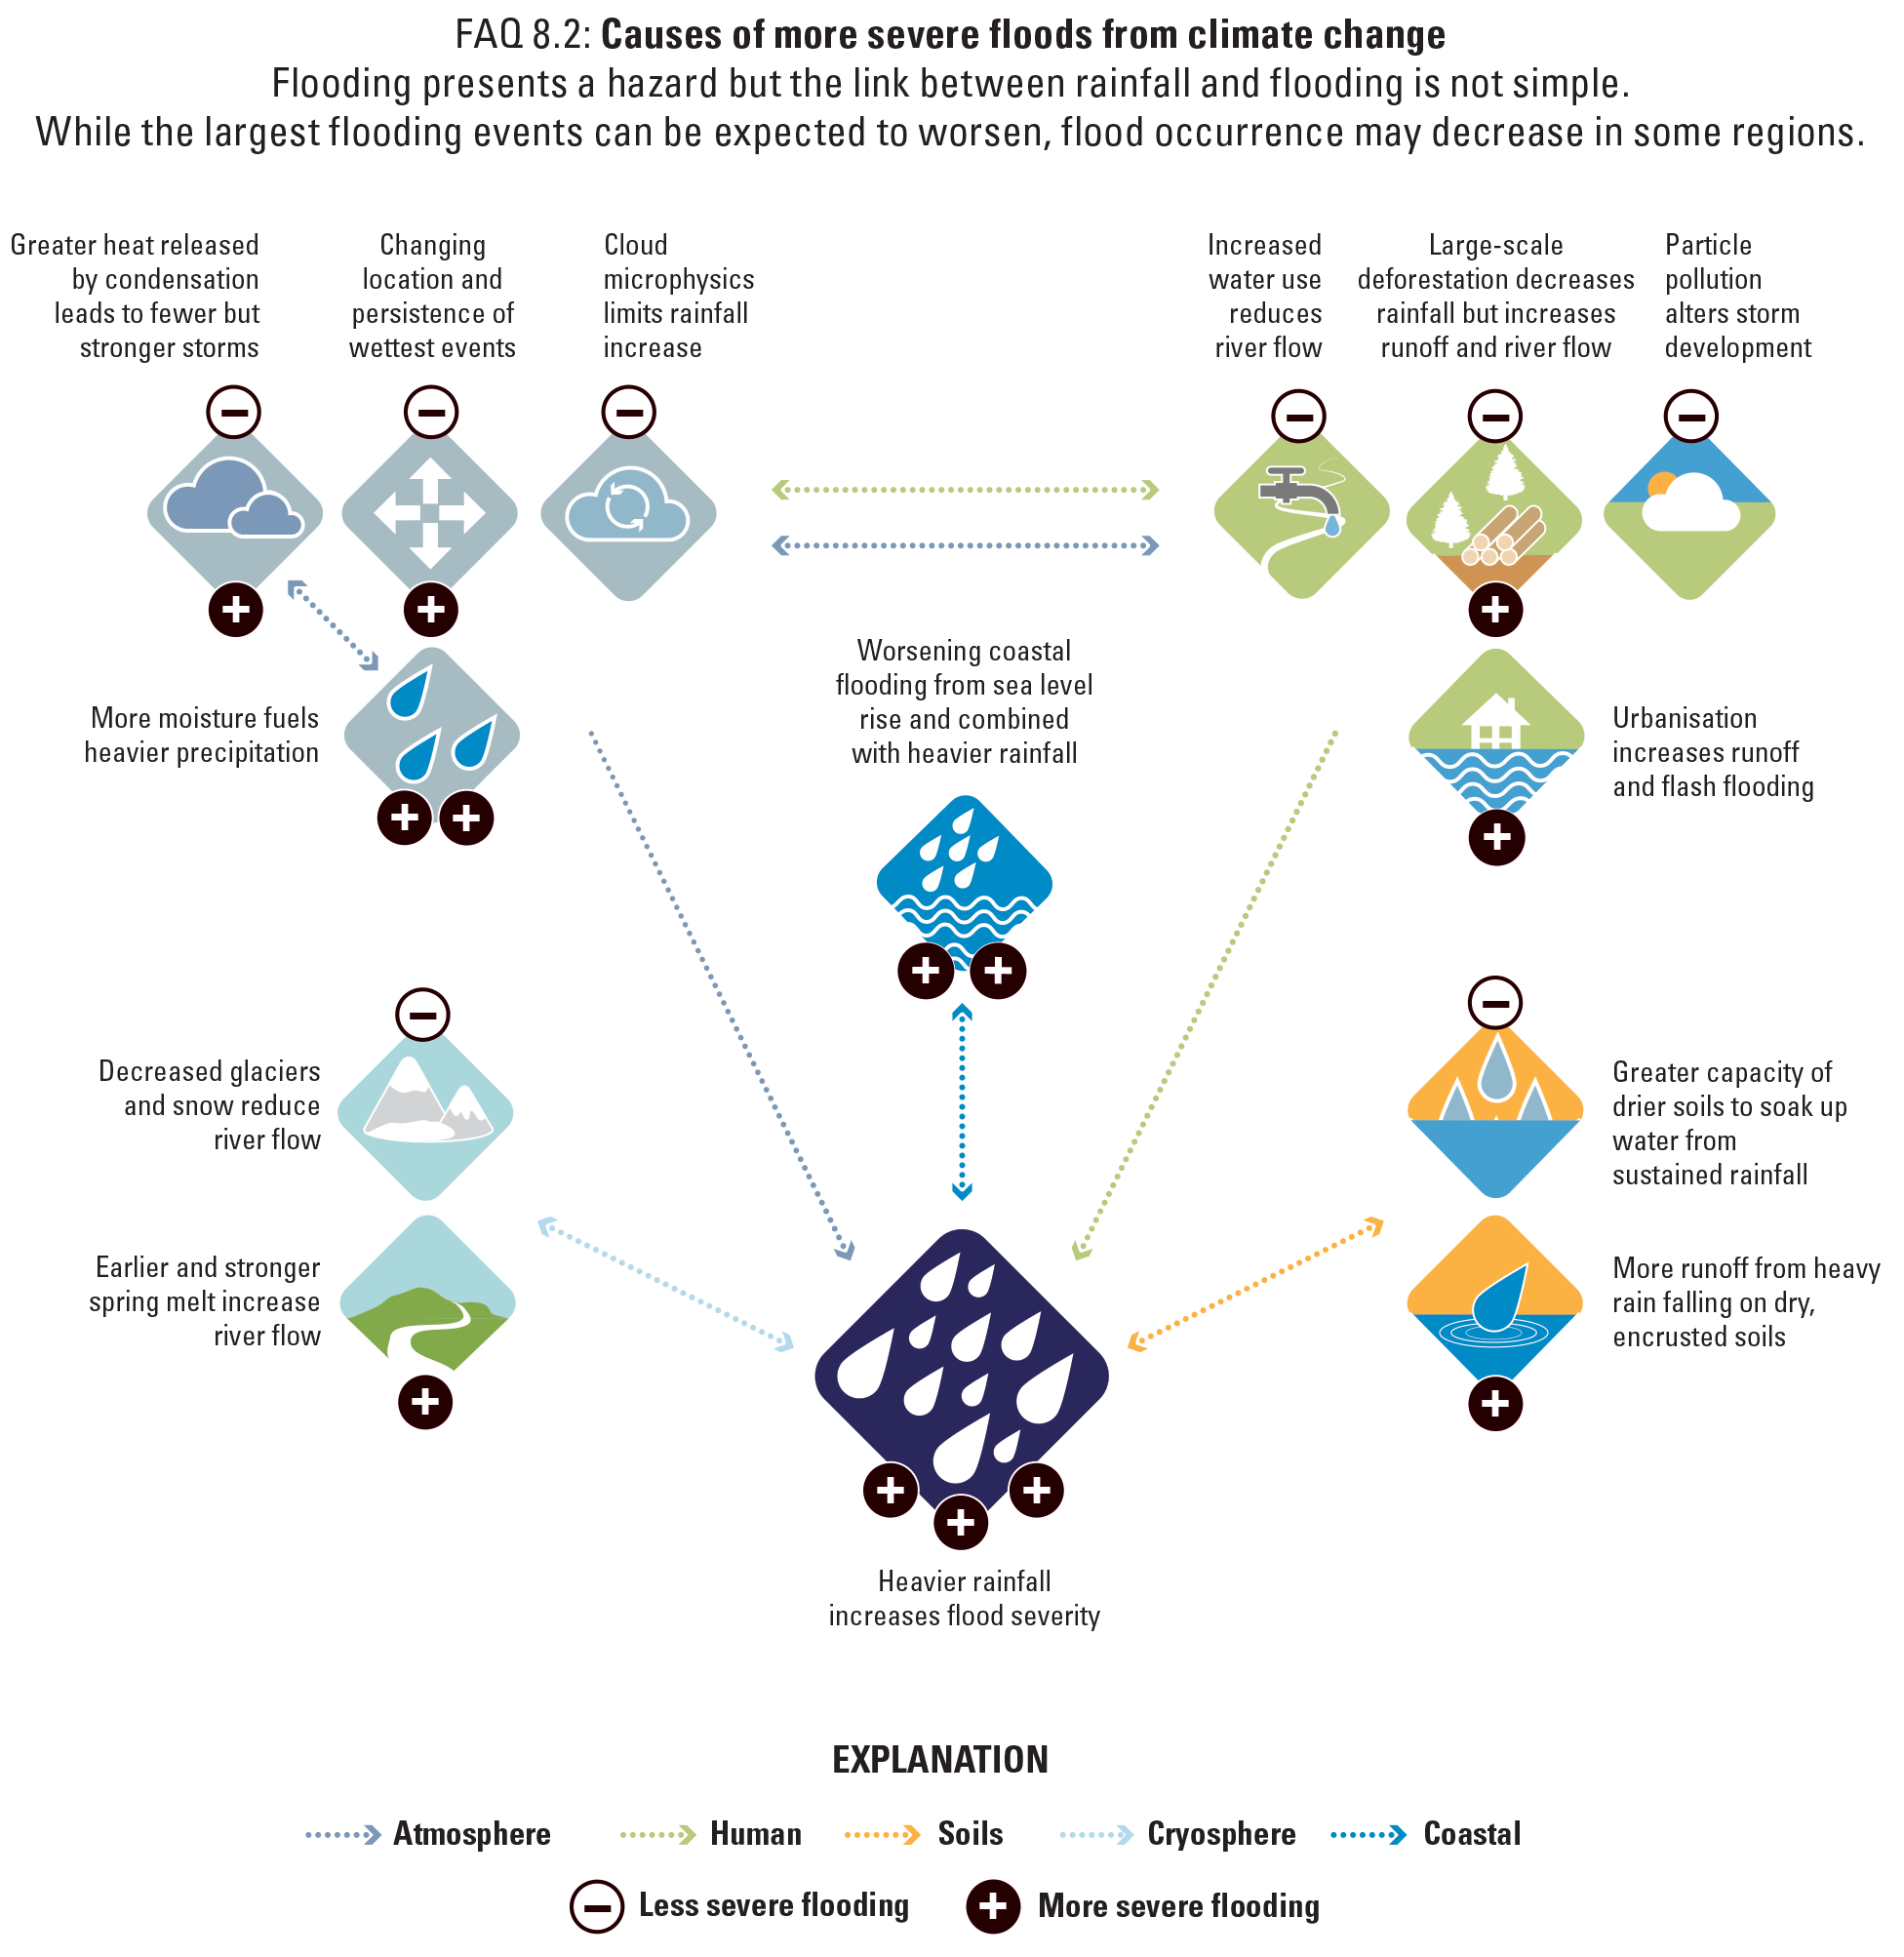
Complexity of the interactions between precipitation and flooding (from Intergovernmental Panel on Climate Change, 2021b, section FAQ 8.2). Causes of more severe floods are from climate change. Flooding presents a hazard but the link between rainfall and flooding is not simple. Although the largest flooding events can be expected to worsen, flood occurrence may decrease in some regions. Used with permission.
Future Water Availability
Given the range of variables that can influence streamflow patterns, there is a high degree of uncertainty in streamflow projections. Additionally, previous research has indicated that streamflow changes often occur in unpredictable and abrupt shifts, rather than more consistent trends (McCabe and Wolock, 2002). Expected changes in streamflow have been linked to extreme precipitation events, aridity, temperature, and changes in snow melt (Brunner and others, 2020; Douville and others, 2021; Hammond and others, 2022). The likelihood of high-flow events will increase along with short-duration extreme precipitation events, and will be moderated by surrounding land cover, and water withdrawal and management approaches (Douville and others, 2021). Greater high-flow events will in turn increase risks of flooding, pressure on existing infrastructure, and threats to social and ecological systems.
Streamflow drought and deficit have been found to be associated with aridity (Hammond and others, 2022). Thus, as the Western United States faces increasing aridification, streamflow may experience greater deficits. Additionally, as temperature increases shift the timing of snowmelt, snowmelt-influenced regions are expected to have substantial seasonal shifts in streamflow, with greater flows in winter and early spring and reduced flows in the summer (Berghuijs and others, 2014; Brunner and others, 2020).
Warming temperatures will also create a greater demand for irrigation and municipal water consumption, adding further uncertainty to streamflow projections as stream withdrawals increase to meet water needs. Streamflow depletion or “stream capture” can also occur when local groundwater pumping reduces groundwater flow to a stream channel or reverses the flow so that stream water supplies the pumping well (Konikow and Leake, 2014; Zipper and others, 2022). Measuring streamflow depletion is difficult because of the natural variability of streamflow, lack of data on subsurface aquifer properties controlling lag times for impacts, and lack of data on groundwater pumping rates (Zipper and others, 2022; this issue is discussed further in chap. B, Gorski and others, 2025). Reliable estimates of streamflow depletion are needed to develop water-management strategies to adapt to changing climate, especially in agricultural regions of the Central and Western United States.
Shifts in the timing of streamflow can potentially create a misalignment between available water and time of greatest demand. For regions with snowmelt-influenced flows, earlier and (or) greater flows in the winter and spring will increase the need for water storage capacity to meet high demand in the summer growing season. Streamflow depletion that impacts flow necessary to maintain ecosystem function is expected to become more widespread in the future and will be exacerbated by climate change (de Graaf and others, 2019). Using a global-scale groundwater-surface water simulation, de Graaf and others (2019) estimated that by 2050, streamflow levels will fall below environmental flow requirements (see “Glossary”) for approximately 42–79 percent of the watersheds in which there is groundwater pumping worldwide.
Cryosphere—Ice and Snow
Climate change has resulted in fundamental changes to the cryosphere, which contains the frozen water on Earth and is considered to include polar regions and high mountains with glaciers. In this section, we discuss permafrost and glaciers in those regions, as well as snow processes and changes in seasonally frozen soils and surface water bodies elsewhere in the United States.
Freeze/Thaw Timing
Observations
Atmospheric moisture content increases with warming temperatures and influences latent and longwave heat flux (Armstrong and Brun, 2008), and in turn, influences the timing and rate of snow and ice ablation (Hock and others, 2019). Consistent with this phenomenon, the number of unfrozen days in a year overall has increased in the conterminous United States during 1979−2021; however, trends vary across the regions of the United States (Kim and others, 2017; U.S. Environmental Protection Agency, 2023).
Lakes in the northern United States are freezing later and thawing earlier compared with the 1800s and early 1900s (Benson and others, 2012; Hodgkins, 2013). The monitoring of ice on lakes and rivers provided consistent evidence of later freezing and earlier breakup around the Northern Hemisphere from 1846 to 1995. “Over these 150 years, changes in freeze dates averaged 5.8 days per 100 years later, and changes in breakup dates averaged 6.5 days per 100 years earlier; these translate to increasing air temperatures of about 1.2 °C per 100 years. Interannual variability in both freeze and breakup dates has increased since 1950.” (Magnuson and others, 2000 [Abstract]). Since the early 1970s, all five of the Great Lakes have had a long-term decrease in the maximum area that freezes each year, but the decrease is only statistically meaningful in Lake Superior (Wang, Bai, and others, 2012). For all five lakes, the number of frozen days per year has decreased since the early 1970s (Angel and others, 2018).
Glaciers
Observations
In the United States, glaciers occur in Alaska and in the northern Rocky Mountains, where they store water and contribute to seasonal runoff and alpine lakes. Glaciers worldwide have been losing mass since at least the 1970s. The loss of glacier mass is largely attributable to increases in temperature and changes in precipitation, although mountain glacier stability is also affected by humidity, incoming radiation, and near-surface wind speed and direction. Arctic-wide glaciers have decreased in annual average ice mass every year since 1984, with especially significant losses in Alaska during the last 2 decades (Taylor and others, 2017). Comparisons of historical photographs to modern ones taken from the exact position (repeat photography; National Snow and Ice Data Center, 2002; U.S. Geological Survey, 2023) have been used to document changes in glacier extent and show Alaskan landscape evolution and North American glacier dynamics on local and regional scales. Today, satellites such as Landsat provide images for more precise analysis of changes in glaciers, their proglacial lakes, and meltwater drainage through time. Total ice mass in the Gulf of Alaska region declined during 2003–15; the National Aeronautics and Space Administration Gravity Recovery and Climate Experiment (GRACE) indicated mass loss in the Gulf of Alaska region of –36 ±4 gigatons (GT) per year from the northern part and –4 ±3 GT per year from the southern part (Taylor and others, 2017).
Changes in glacier extent have changed the amount and seasonality of runoff to glacier-fed river basins, and increased the number and area of glacier lakes, impacting water storage and water management decisions. As a greater proportion of precipitation falls as rain rather than snow, winter runoff increases (Hock and others, 2019), also impacting accumulation of permanent ice fields. Rising air temperatures in the Arctic have caused increased humidity, precipitation, and river discharge. Glacier equilibrium-line elevation has risen, land ice has melted, thickness of sea ice and spring snow cover extent and duration have decreased, and warming of permafrost has occurred. These changes have contributed to the Arctic trending toward a new state, with consequences for ecosystems, carbon emission rates, and planetary albedo (Box and others, 2019).
Future Water Availability
Glaciers are projected to continue to decline in most of the world throughout the 21st century with atmospheric warming as the primary driver for global glacial recession (Vuille and others, 2018). Moreover, many smaller glaciers are expected to disappear by 2100 regardless of emission scenarios (Hock and others, 2019). In Alaska, surface air temperatures are projected to continue increasing at the average rate of 0.3 °C per decade until the mid-21st century, outpacing global warming rates of 0.2±0.1 °C per decade and leading to an overall decline in mountain glaciers (Hock and others, 2019). Multiple datasets indicate with certainty that Alaskan glaciers have lost mass over the last 50 years and will continue to melt throughout the 21st century (Taylor and others, 2017). Retreating glaciers leave steep slopes vulnerable to landslides and rock avalanches. Increased precipitation incorporating snow, fluidized ice, loose sediment, and rocks increases downslope and downstream erosion hazards.
Permafrost
Permafrost is soil, rock, or sediment that remains frozen (below 0 °C) for 2 years or more. Alaska, with nearly 30 percent of its land area north of the Arctic Circle, has the most permafrost in the United States. In the CONUS, glaciers present in some high-elevation mountains of the West have a low-temperature climate regime underlain by permafrost (Hock and others, 2019), however, these are few and limited in extent. Except in southeastern Alaska, Kodiak Island, and the Aleutian Islands, Alaska is largely underlain by permafrost that affects landscape patterns, geomorphic processes, and surface-water and groundwater flow (Jorgenson and others, 2013). Permafrost is overlain by the active layer, the portion of the surface and subsurface that freezes and thaws in response to seasonal air temperature variations. Underneath, impermeable ice limits the area that can contain shallow groundwater flow systems. At depths where heat flow from the natural geothermal gradient keeps water liquid, groundwater circulates below the permafrost layer (McKenzie and others, 2021; Walvoord and Striegl, 2021). Walvoord and Striegl (2021) summarized the complex mechanisms and competing influences associated with permafrost thaw. Increased permafrost thaw results in land surface disturbance including ground subsidence, lake and pond formation, erosion, and differential settling. Permafrost thaw affects surface water and groundwater recharge and discharge, dynamically changing the hydrogeologic framework and watershed boundaries. Groundwater flow paths can extend deeper with new areas becoming permeable to flow. Groundwater–surface-water interactions change, affecting water availability (including water quality; fig. 6).
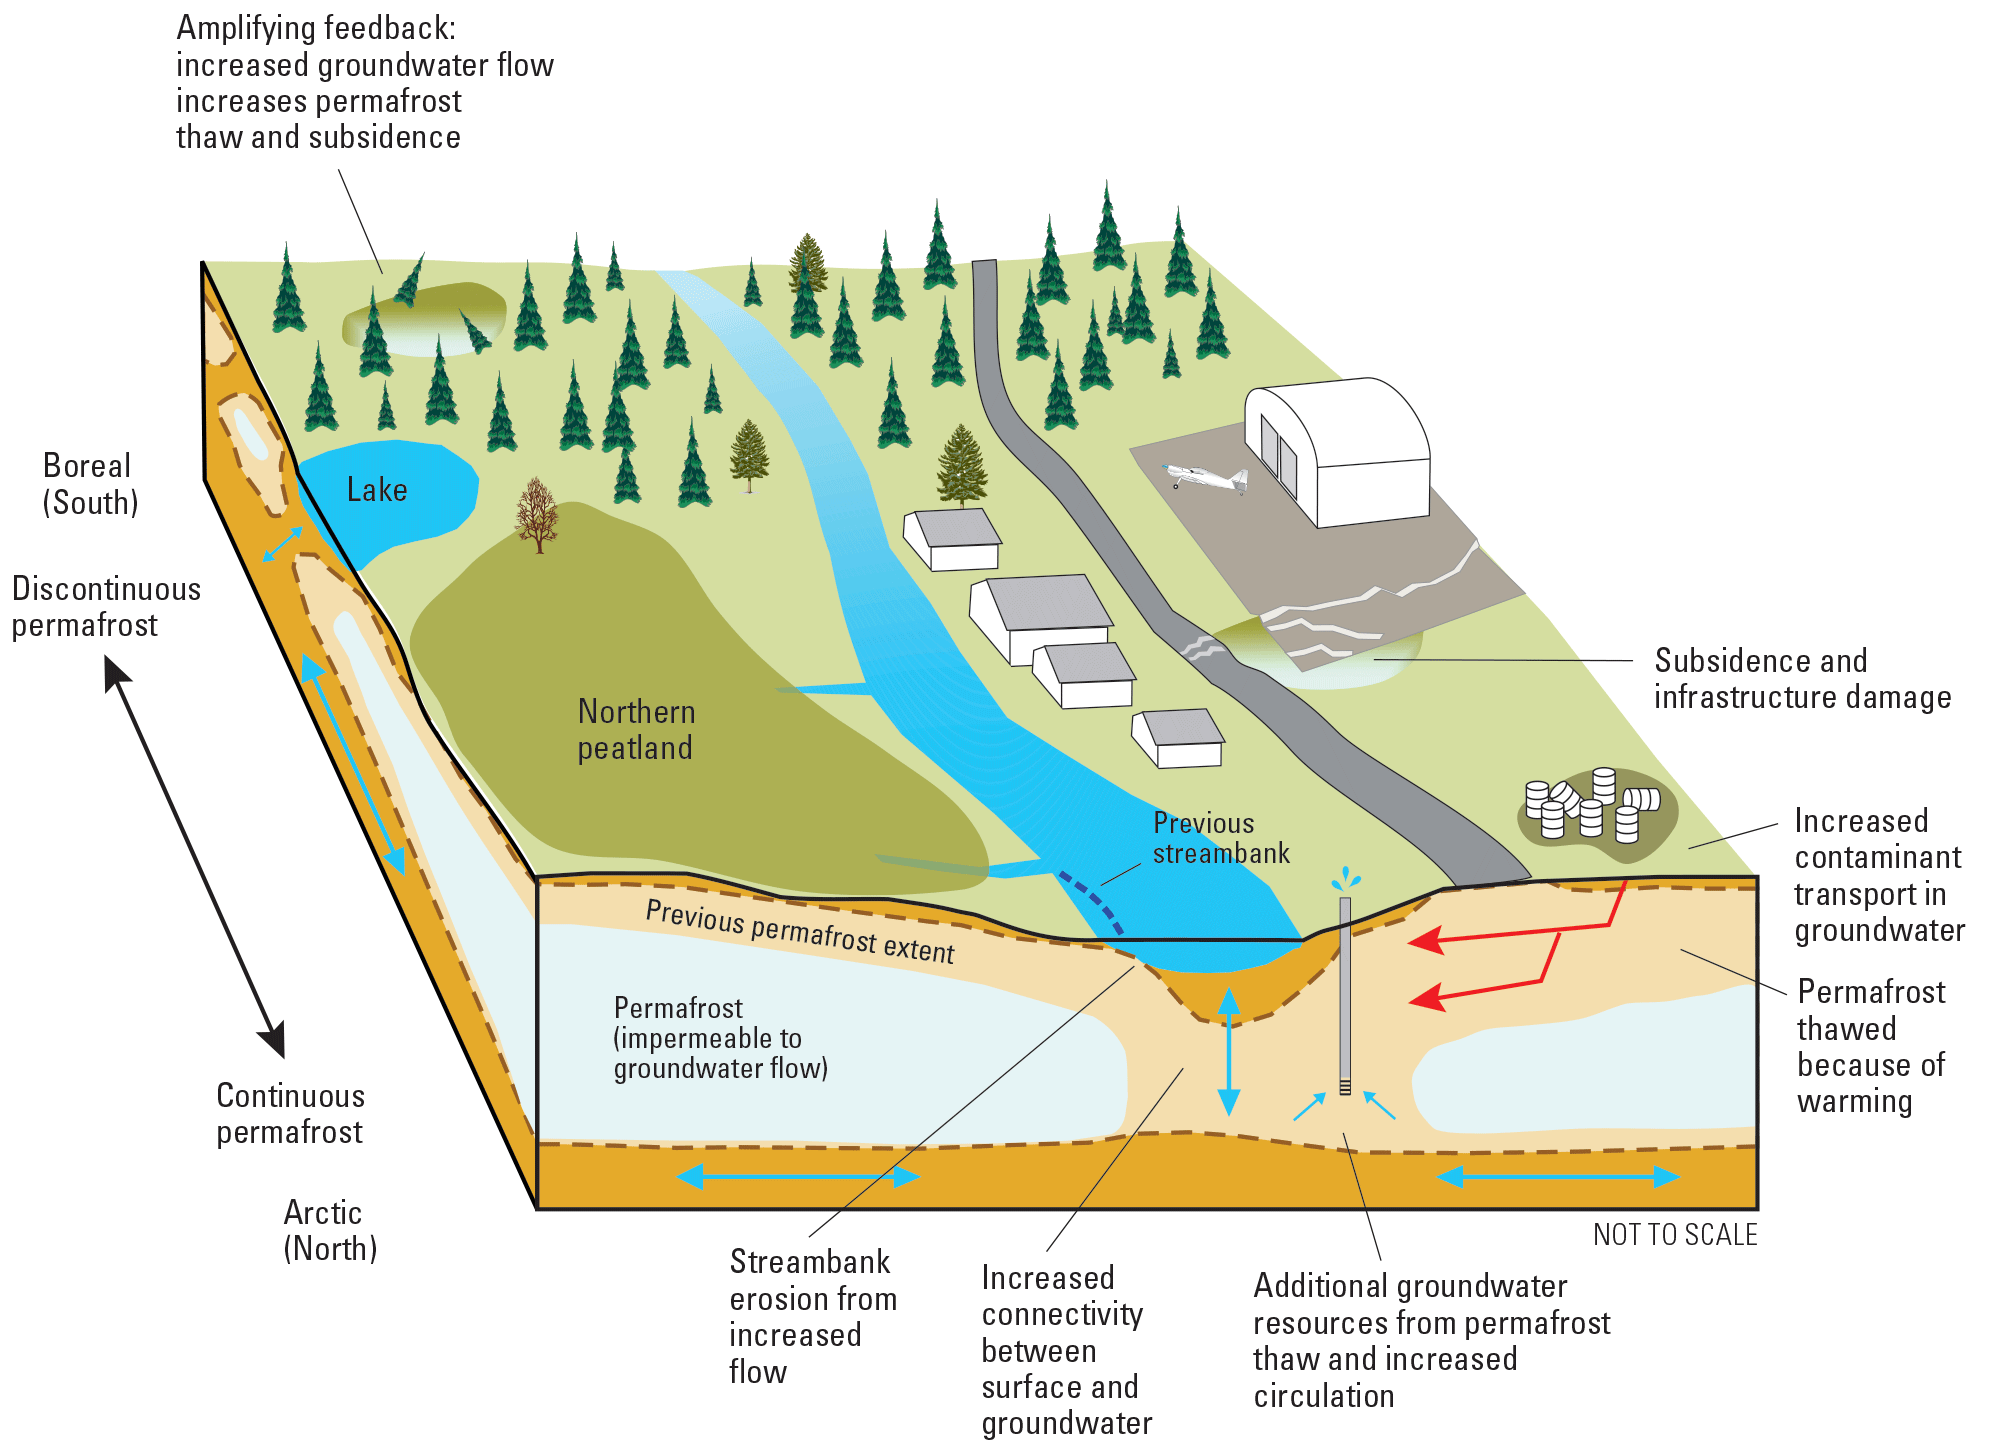
Groundwater- and permafrost-thaw driven climate-change impacts in Arctic systems. Warming causes permafrost thaw and leads to a series of changes and feedbacks, including increased groundwater flow and connectivity with surface water that lead to secondary subsidence, infrastructure damage, and riverbank erosion. Adapted from McKenzie and others (2021, fig. 1) Creative Commons Attribution 4.0 License.
Observations
Since the 1970s, Arctic and boreal regions in Alaska have had rapid rates of warming and thawing of permafrost, primarily from rising air temperatures with some influence from changes in snow cover (McKenzie and others, 2021; Walvoord and Striegl, 2021). Annual average near-surface air temperatures across the Alaskan North Slope and boreal Alaska have increased since the middle of the 20th century at a rate more than twice as fast as the global average temperature, as evidenced from multiple observation sources including land-based surface stations and available meteorological reanalysis datasets (Taylor and others, 2017; Markon and others, 2018). From 2014 to 2018, annual surface air temperatures in the central Arctic exceeded that of any year since 1900. During the winters (January–March) of 2016 and 2018, surface temperatures in the central Arctic were 6 °C greater than the 1981–2010 average, providing evidence of the coupled atmosphere-cryosphere system shifting outside the 20th century range (Meredith and others, 2019). Although permafrost warming rate varies regionally, colder permafrost is warming faster than warmer permafrost (Taylor and others, 2017). In Alaska, permafrost on the North Slope is warming more rapidly than in the interior, where depths from 12 to 20 m have warmed 0.3–1.3 °C per decade over the observational period from 1977 to 2015 (Taylor and others, 2017). Permafrost thaw is occurring faster than models have predicted because of poorly understood deep soil, ice wedge, and thermokarst processes. Process-based global models currently (2024) do not account for abrupt permafrost thaw or impacts of fire (combustion of insulating organic layer, reduced canopy shading) on permafrost, both drivers of net carbon emissions from Arctic wildfires (Natali and others, 2021). Direct observations of permafrost loss are few, but progress has been made in determining climate-sensitive processes and parameters for quantifying the response of Arctic systems to climate change (Saros and others, 2023). Historical trends of increasing stream base flow across the Arctic are a sensitive indicator of progressive permafrost thaw and can be applied at watershed-to-regional scales to monitor changes in permafrost and surrounding surface-water and groundwater systems (Saros and others, 2023).
Rapidly increasing permafrost thaw in Alaska also contributes to riverine and coastal erosion. Riverbank erosion from increasing snowmelt and permafrost thaw, particularly where rivers empty into the sea, has significantly increased from a conservative rate of 12 meters per year (m/yr) to as much as 37 m/yr, forcing remote native villages to begin moving to more sustainable locations (Markon and others, 2018). Along river reaches, thaw contributes to destabilizing riverbanks and increased lateral erosion as discharge increases. Scott (1978) examined drainages in northern Alaska during spring melt breakup to determine the effects of frozen bed and bank material on channel behavior and concluded that where permafrost existed, it was the dominant variable contributing to streambed stability when compared to non-permafrost environments. Using satellite imagery, aerial photographs, and field observations, Rowland and others (2023) concluded that permafrost thaw from climate change will likely increase erosion rates on large rivers with less impact on smaller rivers, but that more data on smaller rivers are needed to confirm this finding.
Future Water Availability
It is virtually certain that permafrost extent and volume will shrink as the global climate warms (Fox-Kemper and others, 2021). CMIP5 projections indicated that permafrost area could decrease by 69 ±20 percent by 2100 with no climate policy (RCP8.5), and by 24 ±16 percent with climate policies that aim to limit global warming to less than 2 °C (RCP2.6; Slater and Lawrence, 2013); similarly, spatial modeling suggested near-surface permafrost in Alaska will likely disappear on 16–24 percent of the landscape by the end of the 21st century (Pastick and others, 2015). The magnitude of these changes depends on climate and ground-ice conditions, where permafrost thaw generally results in drier upland habitat and wetter lowlands as tundra and forests are converted to lakes and bogs. About 20 percent of Arctic land permafrost is vulnerable to abrupt permafrost thaw and ground subsidence, which is expected to increase small lake area by more than 50 percent by 2100 for RCP8.5 (Meredith and others, 2019).
In the future, permafrost thaw resulting in subsidence is expected to significantly increase damage and maintenance costs for structures and facilities, buildings, airport runways, roads, and other infrastructure as well as loss of cultural heritage for Alaskan Indigenous people (Markon and others, 2018). By 2050, 70 percent of Arctic infrastructure will be in regions at risk from permafrost thaw and subsidence (Meredith and others, 2019). However, a warming climate may enhance water availability in some locations as permeability and recharge in previously frozen aquifers becomes sufficient to supplement domestic and municipal water supplies (Lemieux and others, 2016). Downscaled global climate models and the higher emissions scenario (RCP 8.5) project more warming in the Arctic and interior areas than in the southern areas of Alaska (Markon and others, 2018). Permafrost thaw and increasingly discontinuous spatial extent of permafrost layers leads to decomposition of previously frozen and sequestered organic carbon, releasing carbon dioxide and methane greenhouse gases to the atmosphere in addition to global anthropogenic emissions. These processes result in an amplifying feedbacks and additional global warming (Taylor and others, 2017; table S1.1). These processes are non-linear and present major challenges to predicting global average temperature increases and, in turn, the rate of further permafrost melt (Natali and others, 2021).
Snow Cover and Snow Accumulations
Snow serves as an important water source for many regions and has a substantial effect on surface energy balances, atmospheric circulation, and soil thermal conditions (Groisman and others, 1994; Frei and Robinson, 1999). Thus, variability and changes in snow accumulation, snow cover duration, and spatial extent, and the timing of snowmelt influence hydrologic and climatic conditions and are also useful indicators of climatic change (Frei and Robinson, 1999; Frei and others, 1999; Brown, 2000).
Observations
Across much of Canada and the United States, increasing temperatures have contributed to increases in winter precipitation falling as rain instead of snow, and decreases in total snow accumulations, snow extent, and duration of snow cover (Karl and others, 1993; Frei and Robinson, 1999; Frei and others, 1999; Brown, 2000; McCabe and Wolock, 2010; Pederson and others, 2011, 2013; Rupp and others, 2013; Kunkel and others, 2016; Taylor and others, 2017; Mote and others, 2018; Mudryk and others, 2018; Derksen and others, 2019; Livneh and Badger, 2020; Mudryk and others, 2020; Gutiérrez and others, 2021a, 2021b; Ranasinghe and others, 2021; Hicke and others, 2022). A decrease in fractional snow-covered area in the Arctic (Zhang and others, 2019) corresponded to reduced albedo (reflectivity), which in turn enhances regional warming. Declining snow cover is expected to continue and will be affected by the anthropogenic forcing and evolution of arctic ecosystems (Taylor and others, 2017). Taylor and others (2017) concluded that human activities have very likely contributed to observed snow-cover declines in the last 50 years. Attribution studies indicate that observed trends in Northern Hemisphere snow cover cannot be explained only by natural processes but require anthropogenic forcings, and declining snow cover is expected to continue (Rupp and others, 2013; Kunkel and others, 2016). Karl and others (1993) examined variations in the snow-covered area for North America and reported a strong association between decreases in snow-covered area and increases in North American and Northern Hemisphere temperature. Brown (2000) examined the Northern Hemisphere snow-covered area for the period 1915–97 and reported that, since 1950, the largest changes in snow-covered area have occurred during March, similar to conclusions made by Frei and others (1999). In a more recent study, Mudryk and others (2020) reported that trends in Northern Hemisphere snow extent during 1981–2018 are negative in all months and the decreasing trends exceed 50,000 square kilometers per year during November, December, March, and May.
Future Water Availability
Modeled projections for processes indicate large declines in snowpack across the Western United States and a shift to more precipitation falling as rain rather than as snow during winter months in many parts of the CONUS (U.S. Global Change Research Program, 2017). Interrelated feedbacks between the ice- and snow-cover fraction, dust deposition, and albedo are relevant in many cryosphere settings. As global warming continues, snow extent, the duration of snow cover, and snowpacks are likely to continue to decline across the CONUS (McCrary and Mearns, 2019; Hicke and others, 2022; Gutiérrez and others, 2021b; U.S. Global Change Research Program, 2023). These changes also will be associated with declines in snowmelt runoff (Li and others, 2017) and increased evaporative losses (sublimation) from snowpacks (Foster and others, 2016; Milly and Dunne, 2020), as well as increases in the frequency of rain-on-snow events (Jeong and Sushama, 2017) and increased frequency of snow drought (Harpold and others, 2017; Marshall and others, 2019). In the North American Arctic, model simulations show that future reductions in snow cover influence geochemical feedbacks and warming more strongly than changes in vegetation cover and fire (Euskirchen and others, 2016; Taylor and others, 2017). Hammond and others (2023) assessed the timing and magnitude of snow storage and meltwater as snow water equivalent (SWE) and surface water input (SWI), respectively, using a high-resolution model of snow accumulation and melt in the Upper Colorado River Basin under global warming with the RCP 8.5 scenario. Simulation results projected 14 to 45 percent reductions in SWE at elevations less than 3,000 m, with higher elevations showing little change in SWE and snowmelt SWI.
Snow Drought
For many locations in the United States, particularly areas west of 105 °W longitude, snowpack accumulations are a substantial contributor to water supplies. Changes in snowpack are useful indicators of climatic variability and change (McCabe and Wolock, 1999; 2009b; Mote, 2003; Stewart and others, 2004; McCabe and Clark, 2005; Mote and others, 2005; Knowles and others, 2006; Knowles, 2015; Harpold and others, 2017; Huning and AghaKouchak, 2020). Additionally, melt from snowpacks results in a large proportion of annual streamflow in many Western United States river basins (Cayan, 1996; Mote and others, 2005). Decreases in snowpack accumulation and melt can result in earlier snow-melt driven streamflow timing and decreases in the volume of warm-season streamflow, with implications for water supplies, ecosystem health, hydropower generation, and agriculture (McCabe and Wolock, 1999, 2009a; Dudley and others, 2017; Huning and AghaKouchak, 2020).
Fyfe and others (2017) noted that from the 1980s to the 2000s, there was a 10- to 20-percent loss in the yearly amount of water contained in the western CONUS snowpack. Using modeling experiments, they showed that observed losses of snowpack were consistent with snowpack losses simulated by climate models forced with natural and anthropogenic changes, but inconsistent with simulations forced only by natural changes. Fyfe and others (2017) further stated that additional snowpack losses of as much as 60 percent might occur within the next 30 years. These potential losses of snowpack likely will result in serious challenges for hydropower production, municipal water-supply management, and agricultural production across the western CONUS.
Siler and others (2019) reported that, since the 1980s, the decline of snowpacks in the Western United States has been slowing, even though warming has continued. The reduced decline of Western United States snowpack since the 1980s was related to changes in atmospheric circulation that resulted in enhanced zonal upper-level winds, which transported increased moisture from the North Pacific Ocean into the Western United States. They also suggested that the changes in atmospheric circulation were related, in part, to a shift in Pacific Ocean sea surface temperatures that are driven by natural variability; however, they warned that as atmospheric circulation changes, the decline in Western U.S. snowpack likely will accelerate as a result of increases in temperature.
Declines in snowpack have raised questions regarding increases in snow drought (Cooper and others, 2016; Huning and AghaKouchak, 2020). Snow drought occurs when snowpack is extremely low for a specific time of the year at a location. Snow drought can occur because of a lack of winter precipitation (that is, precipitation deficits) or because of the effects of warm conditions (positive temperature anomalies; Harpold and others, 2017). In a global study of snow drought, Huning and AghaKouchak (2020) reported that snow droughts have become more frequent, intense, and longer across the western CONUS. They identified eastern Russia, Europe, and the western CONUS as “hot spots” for snow droughts. For these locations, snow drought duration has increased by about 2, 16, and 28 percent, respectively, since about the year 2000, and the frequency of snow drought in these regions has increased by 3, 4, and 15 percent, respectively.
Warming across the United States is contributing to declines in the amount of winter precipitation falling as snow, total snow accumulations, snow extent, and the duration of snow cover. These declines in snow conditions likely will result in decreases in spring and early summer season snowmelt-driven streamflows. Additionally, as warming continues snowmelt likely will occur earlier, resulting in a shift in the timing of snowmelt-generated streamflow to earlier in the year, which will lead to further decreases in streamflow (and water availability) during the warm season (Kormos and others, 2016; Dudley and others, 2017).
Surface Water—Wetlands and Lakes
Observations
A global assessment of the largest natural lakes and reservoirs, accounting for 96 and 83 percent of surface freshwater storage, respectively, indicated that more than 50 percent of them have decreased in volume over the past 3 decades (Yao and others, 2023). Yao and others (2023) attributed the decline in natural lake storage to climate warming, increased evaporative demand, and human water consumption. The decline in reservoir storage was primarily linked to sedimentation. Although Western United States basins had some of the greatest storage declines in lake water, the northern Great Plains and the Laurentian Great Lakes of North America had precipitation-and-runoff driven gains.
Future Water Availability
Water withdrawals (surface and groundwater) can substantially impact lake and wetland water levels and connectivity with rivers and streams. There is medium confidence that inland wetland extent will decrease, and high confidence that coastal wetlands will undergo increasing saltwater intrusion (Intergovernmental Panel on Climate Change, 2021b). For coastal wetlands, projections of change in area with sea-level rise are inconclusive (Intergovernmental Panel on Climate Change, 2021b), whereas for inland wetlands, decreases in extent and areal density are projected in mountain, mid-latitude, and prairie environments.
Water quality in inland and coastal wetlands and lakes can decline because of increasing temperature. Harmful algal blooms could increase in response to the longer duration of seasonal warm water temperatures and the potential for episodic increases in nutrient loading with more extreme precipitation (U.S. Global Change Research Program, 2017; Ho and Michalak, 2019). These and other effects of warming on the water quality and biogeochemistry of lakes and reservoirs are not well understood, but recent evidence of warming in lakes worldwide indicates a need for simulations of changes in thermal structure and ice phenology to understand likely impacts (Golub and others, 2022).
Work by Yao and others (2023) documented where and why lake water storage was increasing or decreasing globally. They reported a net drying trend and concluded that “increasing temperature and PET are the chief determinants of water loss in 21 percent of drying natural lakes, a cautionary finding for a projected warmer future, underscoring the importance of accounting for climate-change impacts within future surface water resources management.” (Yao and others, 2023, p. 6)
Groundwater
Groundwater comprises 25–30 percent of freshwater reservoirs available to humans, with the rest being ice and a few percent surface water (fig. 1; chap. B, Gorski and others, 2025). Taylor and others (2013) reviewed likely impacts of climate change on groundwater resources, stating that groundwater provides more than 40 percent of all freshwater resources for domestic, agricultural, and industrial purposes (see also Taylor and others, 2013; U.S. Global Change Research Program, 2017). Changes in precipitation and evaporation that affect groundwater recharge, shifts in land cover and vegetation water demand, and changes in water withdrawals for human use are several ways in which climate directly or indirectly affects groundwater availability.
Observations
Groundwater depletion results from pumping wells at rates that reduce the volume of water in subsurface aquifer storage over time (Döll and others, 2014; Konikow and Leake, 2014; Konikow, 2015). Consequences of groundwater depletion include reduced surface-water flows, permanent aquifer subsidence, and saltwater intrusion in coastal areas (Bartolino and Cunningham, 2003). In the United States, the highest measured rates of groundwater depletion occurred in the High Plains aquifer (South Dakota to Texas panhandle and New Mexico), the Mississippi Embayment (Gulf Coastal Plain aquifer), and the Central Valley of California (Konikow, 2015). Globally, models have indicated that India, United States, Iran, Saudi Arabia, and China have undergone more than a doubling of groundwater depletion from 1960–2000 to 2000–2009 (Döll and others, 2014).
Future Water Availability
Groundwater depletion through irrigation withdrawals is projected to have a major impact on future water resources because rising air temperatures increase crop water demand and increase climate variability leading to longer or more severe drought (Döll, 2009; Taylor and others, 2013; U.S. Global Change Research Program, 2017; Intergovernmental Panel on Climate Change, 2021b; Partridge and others, 2023). When increases in air-temperature drive increased groundwater use for crop irrigation, stream base flow is reduced or gaining streams turn into losing streams (Uhl and others, 2022). This stream capture by groundwater pumping is projected to occur with higher frequency in the future (Zhang and others, 2023). Cascading effects include higher uncertainty in low-flow predictions, increased stream temperatures, acceleration of cold-water fish species decline, saltwater intrusion, infiltration of pollutants to groundwater, and decreased surface-water availability during drought.
Groundwater resources are divided into shallow and deep groundwater, each with different vulnerability to climate-change related processes affecting projected availability in the future. Municipal water supplies often rely on deeper groundwater, whereas domestic supply is generally drawn from shallow groundwater (Degnan and others, 2021).
Shallow groundwater generally comprises water-table (phreatic) aquifers with recharge and discharge on short timescales. Shallow groundwater supplies and exchanges with surface water (streams, wetlands, and lakes) and therefore is very important to ecosystem health. Cuthbert and others (2019) defined shallow groundwater as less than (<) 10 m deep, characterized by bidirectional interaction with the climate system (recharge influx, evapotranspiration outflux). Modeled sensitivity to climate change and system response time were higher in these shallow aquifers than in deeper aquifers, making prediction of climate effects less certain. To distinguish streams with predominantly shallow or deep groundwater supply, Hare and others (2021) used paired air-water temperature signals at sites across the CONUS. Of the streams supplied by groundwater, 53 percent were from shallow groundwater aquifers (in their study, <6 m below land surface) and these were more affected by warming trends and by implication, more vulnerable to drought, increased evapotranspiration, and increased groundwater extraction. Simulations by Condon and others (2020) showed that shallow groundwater storage could decline in response to warming and increased evapotranspiration across the continental United States, eventually breaking connectivity between vegetation and groundwater and thus decreasing resilience of ecosystems to drought stress. A recent study (Zhang and others, 2023) expands on the streamflow interactions using an analysis of sensitivity of streamflow to its drivers: precipitation, PET, and groundwater storage. Their analysis indicated greater declines in future streamflow than are currently projected because Earth-system models do not adequately simulate increases in evapotranspiration.
Deep groundwater includes aquifers located just below the root zone to aquifers that discharge at regional scale, at coastal or large drainage-basin discharge points. Guswa (2008) determined water-optimal root depths for a variety of soil, plant, and climate characteristics to be less than 4 m, and a compilation of measurements from around the globe (Schenk and Jackson, 2002) indicated that 95 percent of roots were located in the upper 2 m of the soil profile. Groundwater deeper than 500 m is not well-connected to the rest of the water cycle (Ferguson and others, 2023) but groundwater above that is used extensively for water supply in semiarid and arid regions. In these aquifers, recharge may be on very long timescales or occurring at lower rates than in the past, so that this water resource is “mined” as a non-renewable resource. Although this groundwater comprises a large reservoir of freshwater (fig. 1), drinking or even irrigation-quality recoverable water is a smaller fraction of this volume. The amount of groundwater that can be withdrawn from an aquifer depends on porosity, permeability, and geological structure (such as confining units) at depth, all spatially variable and relatively poorly known.
Groundwater depletion is defined as long-term, water-level decline caused by sustained groundwater pumping, reducing the volume of water in storage. The concept of sustainable yield of fresh water from an aquifer was historically based on the idea that groundwater can be safely withdrawn at a rate equivalent to the natural recharge rate. However, water availability under groundwater development cannot be based on rates of natural recharge to an aquifer system, because the water pumped may come from a combination of surface water (streamflow, lakes and wetlands) and water stored prior to development. Determining sustainable withdrawal rates involves identifying all sources of water that supply the amount withdrawn by wells, and groundwater models are often used to simulate these complex systems (Alley and others, 1999; Bredehoeft, 2002). Future water availability, especially in the arid Western States, will depend more on groundwater resources as temperatures increase atmospheric demand and irrigation requirements.
Complex Regional-Scale System Processes Affecting Water Availability
The processes of water-vapor production, transport, and precipitation are driven by the global energy balance. On land, local-to-regional processes that affect water availability include precipitation patterns, evapotranspiration and soil moisture status, streamflow dynamics, and storage reserves, including groundwater, snowpack, and reservoirs. Here, we describe three complex natural water cycle processes important to water availability in the United States that involve several interacting water cycle components. These are topics of current research in climate science because of poorly understood feedbacks, lack of observational records, and inadequate process representation in Earth-system models.
Mountain and Coastal Precipitation Processes
Global warming has the potential to significantly shift the lifting condensation level (the altitude at which clouds form), affecting precipitation in mountain and coastal systems. Mountain (orographic) precipitation is a primary interaction between land and atmospheric components of the water cycle and is fundamental to water supply worldwide. Mountains receive significantly more precipitation than surrounding land areas. The mechanisms generating this water supply (temperature lapse rates and condensation of water vapor) are affected by global warming (Siler and Roe, 2014; Immerzeel and others, 2019). Atmospheric warming may decrease the elevation range receiving orographic precipitation and may also affect processes that amplify rainfall in and near mountain systems in other types of weather systems (for example, Houze, 2012). Orographic enhancement of precipitation is a major driver of water supply for populations in the mountain ranges of the CONUS (Cascade Range, coast ranges of California, Sierra Nevada, Rocky Mountains, Appalachian Mountains) and in the Hawaiian Islands and Puerto Rico. Lowland populations are also dependent on mountain water supplies. Figure 7 shows an analysis by Viviroli and others (2020) that determined projected dependence of lowland populations on mountain water resources for the mid-21st century. Mountains were defined as “…(1) all areas more than 200 m above sea level (a.s.l.) if their relief roughness is at least 45%, (2) all areas more than 500 m a.s.l. if their relief roughness is at least 21%, (3) all areas more than 1,000 m a.s.l. if their relief roughness is at least 10% and (4) all areas more than 1,500 m a.s.l. regardless of their relief roughness” (Viviroli and others, 2020, p. 924). Projected future mountain water availability is most at risk for lowland populations in California’s Central Valley, the Southwest, and the western Great Plains (fig. 7).
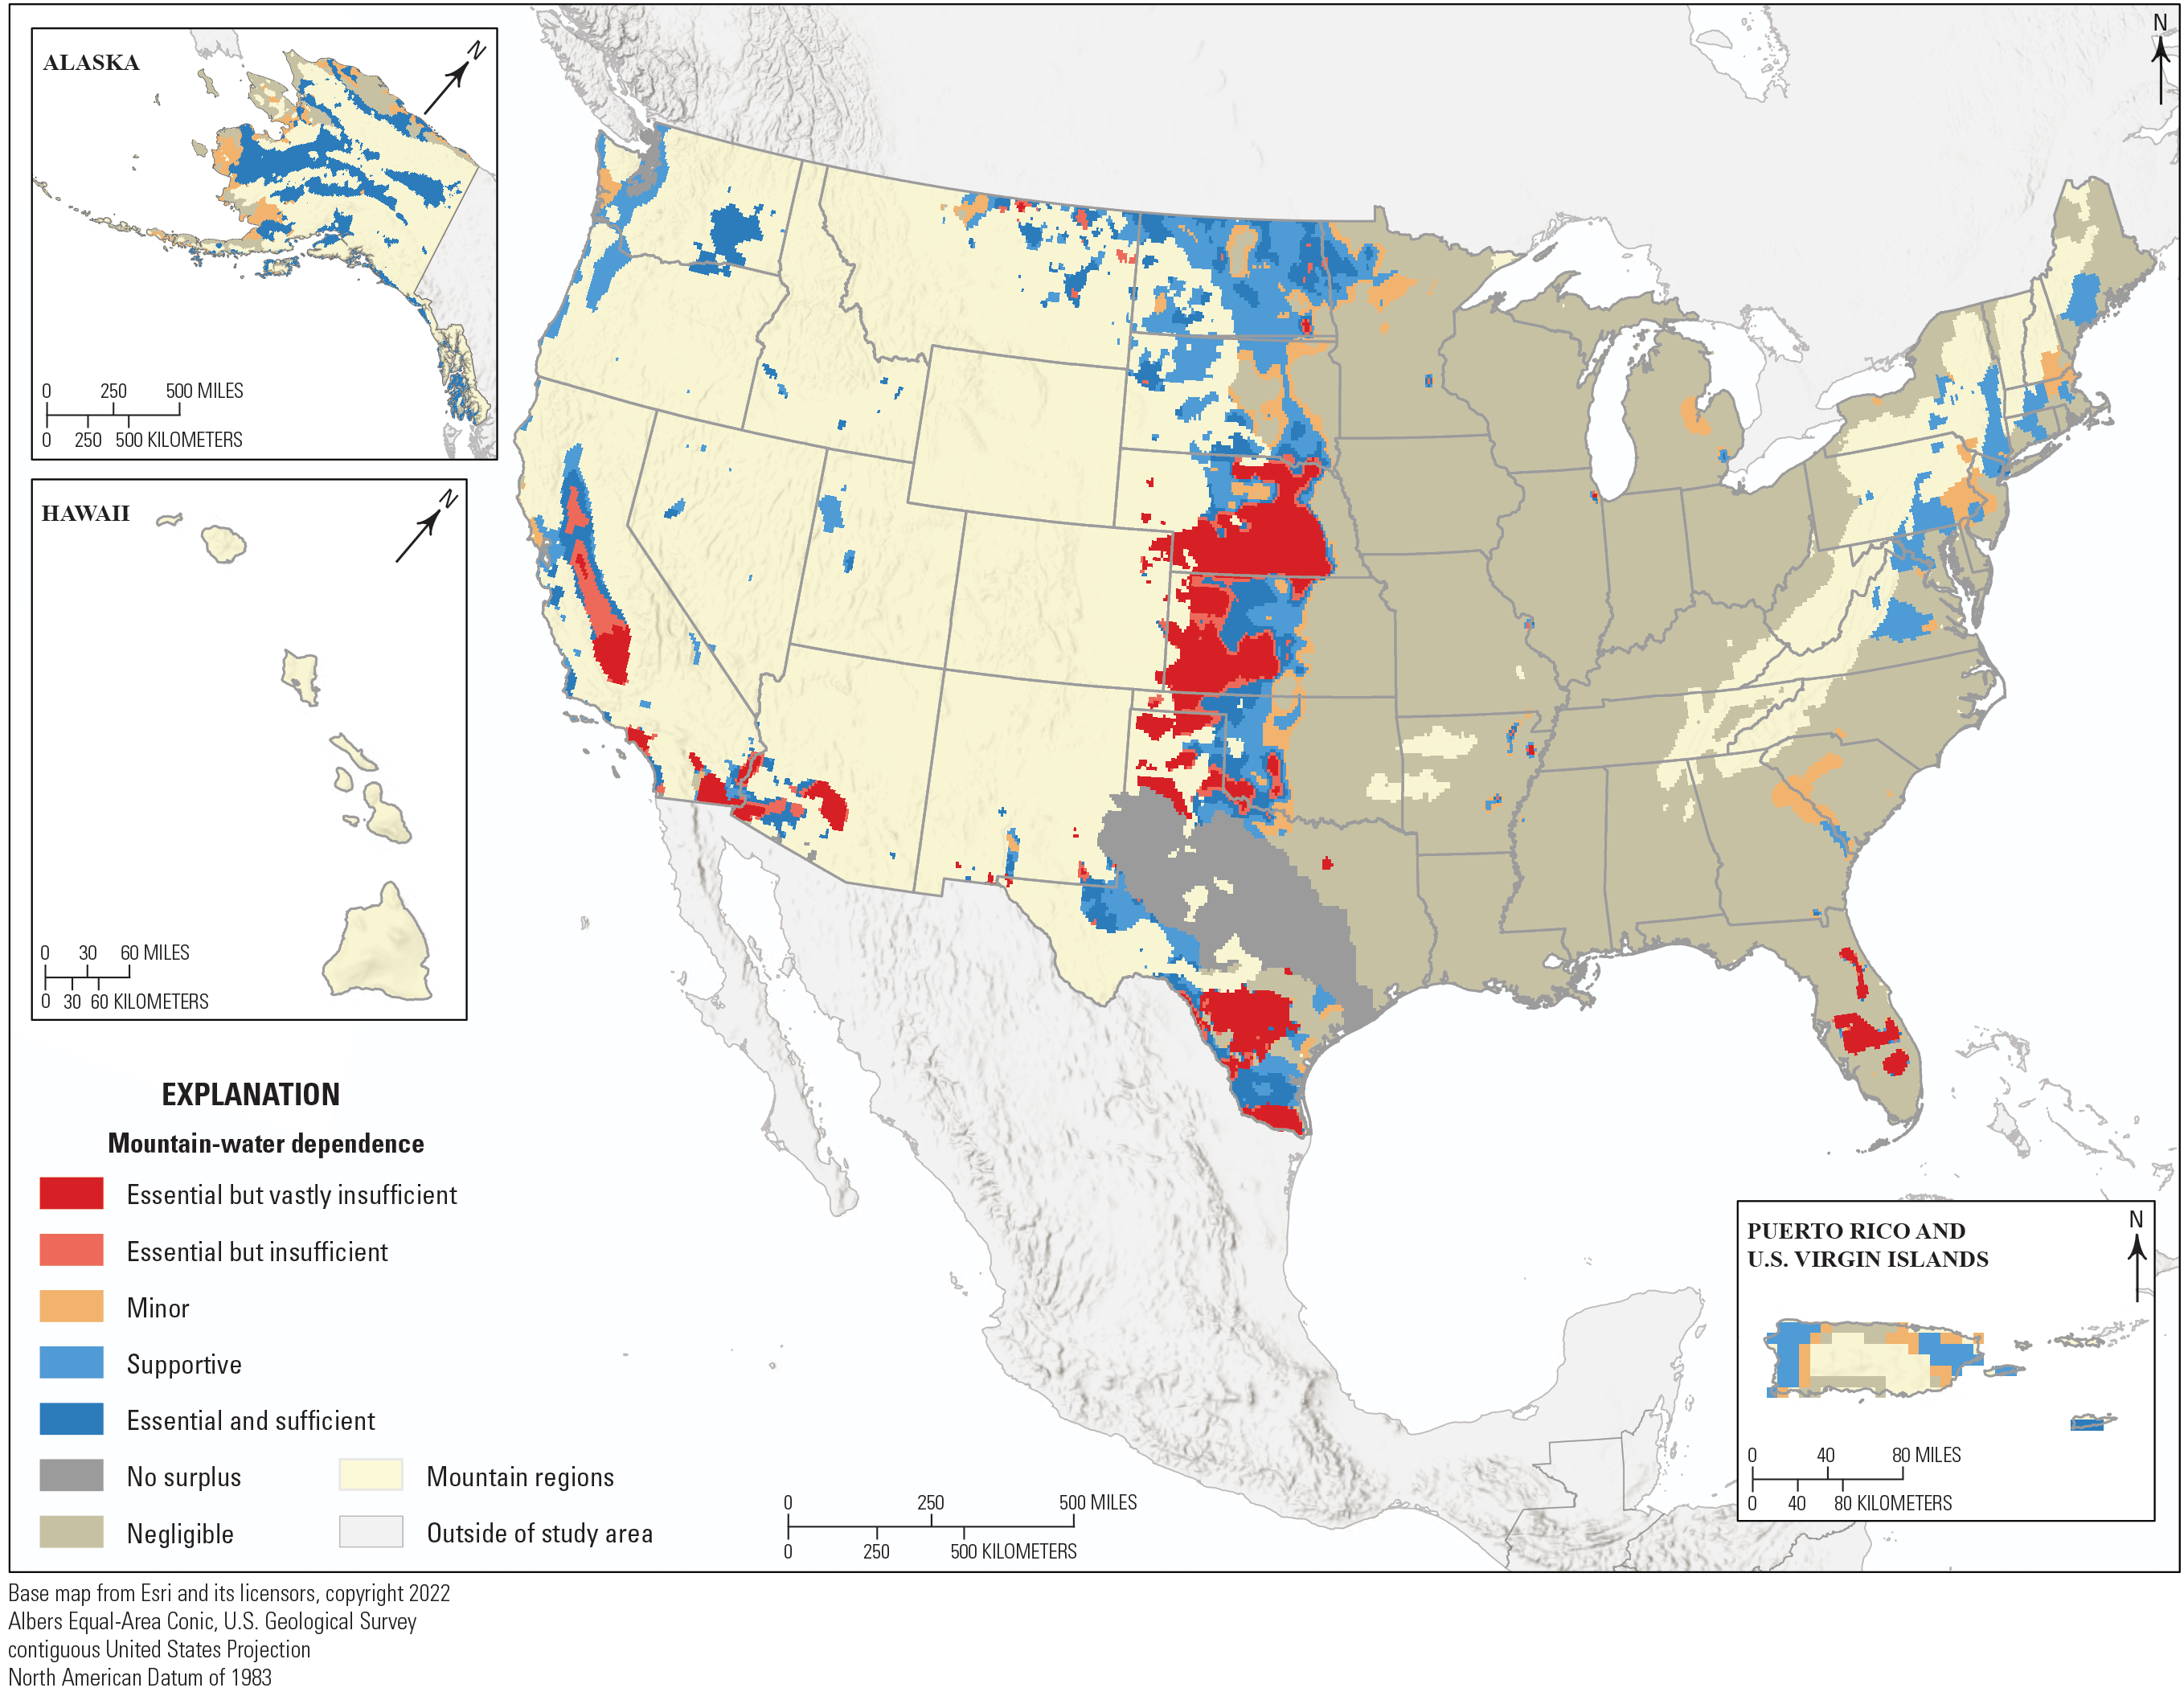
Projected dependence of lowland populations on mountain-water resources in the United States, including Puerto Rico and U.S. Virgin Islands, for the scenario combination SSP2-RCP6.0 (referred to as a “middle of the road” development scenario with stabilization of greenhouse gas emissions in 21st century) and years 2041–50 based on data provided in Viviroli and others (2020). Mountain regions shown are areas where high consumptive water use or hydroclimate conditions mean that there is no surface-water runoff surplus extending to surrounding areas; therefore, those populations were not included in the lowland projected-dependence analysis.
In the western coastal regions of the United States, the interaction between ocean-derived atmospheric moisture and the land is changing because of global warming (Johnstone and Dawson, 2010). Human habitation, agricultural systems, and natural ecosystems of the Pacific Coast benefit from marine low clouds and fog precipitation during the dry summer season; these climate characteristics modulate heat waves and suppress wildfire, and provide moisture for coastal mountain ecosystems, coastal agriculture, and fisheries (Sawaske and Freyberg, 2015; Clemesha and others, 2017; Williams and others, 2018; Torregrosa and others, 2019; Dye and others, 2020).
Changes in mountain precipitation are not well understood, as past climate assessments did not address elevation-dependent changes in precipitation. Using data starting in 1900, Pepin and others (2022) documented increased warming rates at higher elevation in some regions but this was not a consistent global trend. They suggested that storage of water (rain and snow) at high elevations may decline because of the combination of warming and reduced elevation-dependence of precipitation. Observations of declining winter snowpack in the Western United States are described in more detail in section, “Snow Cover and Snow Accumulations.”
Dye and others (2020) documented a satellite-observed decrease in coastal low clouds over a 22-year period in the Pacific Northwest, but satellite trends were not confirmed by airport observations of low-cloud frequency. Williams and others (2015) analyzed airport observations of summer marine low clouds and fog in southern California during 1948–2014 and reported a trend of decreased fog and increased cloud base height over urban areas that correlated with nighttime warming. Scholl and others (2021) noted a significant rise in orographic cloud base altitude in Puerto Rico mountains after hurricane-induced forest defoliation that increased daytime surface-temperature lapse rates on the mountain slope from −5.7 to −9.6 °C per kilometer (km). In Hawaii, Kagawa‐Viviani and Giambelluca (2020) noted a rising trend in the condensation level of orographic clouds over decades, concurrent with temperature and marine boundary layer drying consistent with global warming.
For western North American mountain ranges (Rocky Mountains and Alaska ranges), there is high confidence that the freezing altitude in mountain areas is projected to rise, which will change snow and ice conditions including snow line, glaciers, and the rain-snow transition altitude. Snow cover will decline, with virtual certainty, over most regions globally during the 21st century; this will affect water availability through declines in SWE and the extent and duration of snow cover in mountains (Mountains Fact Sheet, Intergovernmental Panel on Climate Change, 2021c). Glacier-fed streamflow is projected to decrease from small glaciers and increase from large glaciers until their mass is depleted (Mountains Fact Sheet, Intergovernmental Panel on Climate Change, 2021c). In the Eastern United States, the Appalachian Mountains are likely to be subject to a similar increase in condensation and freezing altitudes. Fernandez and Zegre (2019) projected increased precipitation in the northern Appalachian Mountains and decreased precipitation in the southwestern Appalachian Mountains. Their analysis of 20 river basins supplying large metropolitan regions of the East Coast indicated greater reliance on forested mountain watersheds as temperatures rise during the 21st century.
Extreme precipitation is projected to increase in major mountainous regions with medium-to-high confidence; however, this effect is superimposed on projected overall declines in snowpack, so net impacts on the water cycle are uncertain. Precipitation extremes (rainfall and seasonal snow accumulation) have the potential to increase frequency of floods, landslides, and failure of lake impoundments. Trends and projections of change in low marine clouds and fog or of orographic precipitation in mountains are few because low-cloud mechanisms are not well represented in Earth-system models and most satellite and ground-based observational records are not long-term.
Climate change in mountains “… will pose challenges for water supply, energy production, ecosystems integrity, agricultural and forestry production, disaster preparedness, and ecotourism.” (Mountains Fact Sheet, Intergovernmental Panel on Climate Change, 2021c). In the interior Western United States, summer precipitation is sparse and many reservoirs are associated with mountainous terrain to capture and store the water from snowmelt for agricultural and municipal water use. Declining snowpack and extreme precipitation events will impact reservoir volume and sedimentation rates, affecting water provision. Low cloud cover on mountains and in coastal regions also acts to suppress evapotranspiration, conserving soil water and suppressing development of fire conditions.
Aridity and Drought
Aridity occurs when the natural supply of water (precipitation) is less than the climatic demand for water (potential evapotranspiration). Increasing aridity in a region often is associated with the occurrence of drought. Precipitation deficits are a primary driver of aridity and drought, however, warming temperatures are becoming an increasingly important contributor (Woodhouse and others, 2016, 2021). Climate warming contributes to an increase in aridity across the Western United States, and continued warming could result in a long-term increase in aridity for the region (Cook and others, 2004; table S1.1). Two well-known 20th century droughts in the CONUS, the 1930s “dust bowl” drought and the 1950s drought, have been assessed in several studies (Hoerling and others, 2009; Heim, 2017; Cowan and others, 2020) because of their sizeable socioeconomic effects. In addition to these two drought events, a severe drought event occurred during the 1960s in the northeastern CONUS (Namias, 1966; Seager and others, 2012; Delaware River Basin Commission, 2019) and impactful drought events occurred in the central CONUS during the late 1980s and in 2012 (Changnon, 1989; Rippey, 2015). Most recently, there has been great concern regarding a persistent drought in the southwestern CONUS that started about the year 2000 (termed the turn-of-the-century drought; Heim, 2017; Williams and others, 2020; McCabe and Wolock, 2021).
In a recent analysis of the concurrent occurrence of dry and hot conditions across the CONUS, Alizadeh and others (2020) noted that the frequency of simultaneous dry and hot extremes has increased across the CONUS during recent decades. Alizadeh and others (2020) also reported that dry and hot extremes have become more extensive; and whereas precipitation deficits were the primary contributor to dry and hot events earlier in the 20th century, increased temperature has become the primary driver during recent decades.
In addition to examinations of drought frequency and severity using climate data for the instrumental period, there also have been analyses of CONUS drought using multi-century climate reconstructions such as those derived from tree-rings (Woodhouse and Overpeck, 1998; Cook and others, 1999, 2014; Stahle and others, 2000; Fye and others, 2003; Woodhouse and others, 2009; Baek and others, 2019; Burgdorf and others, 2019; Erb and others, 2020). In an analysis of CONUS drought using tree-ring based reconstructions of the PDSI, Cook and others (1999) examined the 1930s “dust bowl” CONUS drought in the context of droughts that occurred during previous centuries and reported that the 1930s drought was not only one of the worst CONUS droughts of the 20th century but also likely one of the worst droughts since 1700.
Gangopadhyay and others (2021) used CMIP5 climate projections (for 2006–99 using RCP4.5 and RCP8.5 projections) from 32 climate models to examine the effects of projected climate change on drought frequency, duration, and severity across the Western United States. They used the PDSI to define drought events for 1,255 U.S. Geological Survey 8-digit hydrologic units across the Western United States and reported that the climate-model projections for 2006–99 indicated an increase in drought duration and drought severity for the Western United States.
Increasing temperatures are contributing to increased aridity, evidenced by more extreme maximum temperatures, drier soils, and more intense and severe droughts (Overpeck and Udall, 2020). The increase in aridity is most notable in the Southwestern United States, resulting in decreases in the flows of important river basins such as the Colorado River and Rio Grande River (Vano and others, 2014; Woodhouse and others, 2016; Lehner and others, 2017; McCabe and others, 2017; Udall and Overpeck, 2017; Milly and Dunne, 2020). Increases in aridity also are contributing to an increase in wildfires across the western CONUS (Abatzoglou and Williams, 2016). Although increasing aridity is evident in the Western United States, increased aridity also is expanding eastward as warming continues (Seager and others, 2019; Overpeck and Udall, 2020).
There is high confidence that warming will continue and will contribute to widespread, prolonged, and severe dry spells (Overpeck and Udall, 2020). Continued increases in temperature likely will result in increased aridity. Warming decreases the fraction of winter precipitation that falls as snow (Berghuijs and others, 2014), reducing snowpacks and ultimately reducing land surface albedo (reflectivity), which further increases warming and evapotranspiration (Martin and others, 2020; Milly and Dunne, 2020). Additionally, increased temperatures result in longer growing seasons that contribute to increased evapotranspiration and drier soils. Subsequently, when water in soil decreases to low levels, evapotranspiration is reduced and incoming solar radiation has a larger warming impact as the cooling resulting from evaporation is reduced and excess heat accumulates and amplifies the warming and the drying impact of the warming (Miralles and others, 2014).
Climate-model projections indicate increased aridity in the United States, particularly in the Southwestern United States (Gangopadhyay and others, 2021). Increases in drought duration and drought severity (Overpeck and Udall, 2020) will coincide with increased aridity. Increases in aridity and drought will lead to decreased water availability, especially in the Southwestern United States, and continued warming will contribute to more widespread, prolonged, and severe dry spells (Overpeck and Udall, 2020).
Terrestrial Water-Vapor Recycling—The Role of Forest Cover
Terrestrial moisture recycling is a significant feedback in the water cycle, but is difficult to quantify, therefore estimates of the magnitude of recycled moisture fluxes vary. Globally, terrestrial evaporation and transpiration sources account for 40 percent of rainfall falling over land (van der Ent and others, 2010). Another global estimate indicates that evapotranspiration returns 57 percent of the rain that falls over land to the atmosphere, and 70 percent of that moisture rains back onto land (te Wierik and others, 2021). Gorski and others (2025, chap. B) estimated that about 63 percent of precipitation that falls on CONUS annually returns to the atmosphere through evapotranspiration. In the United States, the amount of terrestrial moisture that recycles within the Nation is 19 percent, with 71 percent of the total atmospheric moisture sourced from the ocean and minor amounts from Canada (2 percent), Mexico (4 percent) and other land (4 percent; Keys and others, 2017). Drought, deforestation, and land-use decisions that decrease evapotranspiration ultimately reduce the return of water vapor to the atmosphere and its transport to downwind regions. This pattern can result in less precipitation downwind, which can lead to a greater spatial range of drought conditions (Herrera-Estrada and others, 2019). In a recent review of the effects of land-use change on terrestrial moisture recycling, te Wierik and others (2021) noted that most studies have been in the tropics; a knowledge gap exists for temperate and arid regions, and the driving factors and processes are under-researched.
Forests play a key role in the water cycle, as well as regulating surface temperatures and providing critical carbon sequestration services (Bonan, 2008). Although most forest types have low surface albedo, which can contribute to warmer surface temperatures, the evaporative cooling services provided by forest can help offset absorbed energy and are often not provided by alternative high-albedo, land-cover types. Changes in forest health and composition influenced by increased evaporative demand and reduced soil moisture have introduced extreme fire risk (Holden and others, 2018; McEvoy and others, 2020; Nolan and others, 2020), which can be exacerbated by historic land-management decisions, such as fire suppression (Wehner and others, 2017). In the United States, extreme heat, drought, and wildfire are interrelated primary threats to maintaining forest cover and its ecosystem services (see sidebar 3).
Sidebar 3. Wildfire, Forests, and the Water-Energy Balance
Fire weather has increased globally and is projected to increase with continued climate change. Fire weather includes increased temperatures, prolonged drought, windy conditions, and increased aridity; these compounding climatic impact drivers (CIDs) facilitate the start and spread of wildfires. In recent decades, increasing temperature and decreasing precipitation have increased aridity, reduced soil moisture, and impacted forest health and composition. These conditions, in addition to land-management decisions, have introduced extreme fire risk and wildfires have since become more frequent, larger, and more severe globally. In the United States, the total number of fires has grown across the country, with annual fire frequency doubling in the east and west and quadrupling in the Great Plains over the past 2 decades (fig. S3.1).
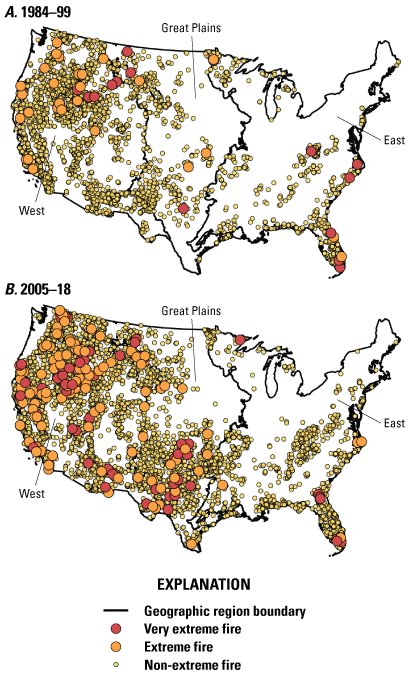
Changes in fire frequency in the conterminous United States during (A) 1984–99 and (B) 2005–18. From Iglesias and others (2022), figure 2; Creative Commons License CC BY-NC 4.0.
Although fire weather and frequency have increased, existing evidence on how the wildfires may in turn impact hydrologic processes is limited given the relatively recent changes in wildfire magnitude. Lag time between system impact and recovery limits confidence in reported trends. The impact of wildfire on regional moisture balances through loss of transpiration is difficult to determine; however, a growing body of evidence on the hydrologic impacts of wildfires has indicated changes in post-fire flows, often resulting from increased hydrophobicity of soils and changes in water quality. Elevated risks of increased streamflow, overland flow, and drinking water quality impairments can last multiple years post-fire. In addition to these impacts, wildfires can affect surface energy balance by exposing underlying land (see fig. S3.2) and depositing light-absorbing residue, such as ash, on snowpack, ultimately leading to earlier melting of snowpack and increasing rates of permafrost thaw. Effects from wildfire debris can last for more than 1 decade post-fire.
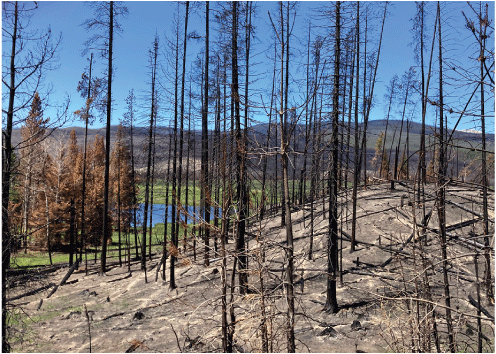
Burned area in Rocky Mountain National Park, Colorado. Photograph by Martha A. Scholl, U.S. Geological Survey, June 2021.
Based on current evidence, the continued loss of forest through increased frequency and severity of wildfires, along with drought, disease and anthropogenic land-use decisions, is likely to impact energy balance and the water cycle, with detrimental effects on critical forest ecosystem services like carbon sequestration and moisture recycling.
Forest ecosystem services:
Fire weather, the collection of CIDs that increase the probability of ignition and spread of wildfires, has increased in regions including the United States, Australia, northern Eurasia, southern Europe, and the Amazon, and is projected to increase globally with continued climate change (Abatzoglou and others, 2019; Seneviratne and others, 2021). In addition to increased fire weather, Jolly and others (2015) found evidence of an 18.7 percent increase in global mean fire-season length from 1979 to 2013 (Jolly and others, 2015). In 2020 alone, the August Complex Fires burned more than 1 million acres in California (Safford and others, 2022), and Australia lost almost 20 million acres in the Black Summer fires, one of the largest fire occurrences in global history (Godfree and others, 2021). Although fires in the United States pose the greatest threat in Western States and Alaska (Wehner and others, 2017), the total number of fires has increased across the entire United States over the past 2 decades (Iglesias and others, 2022; sidebar 3).
Although fire weather and wildfire risk are projected to increase with high confidence (Seneviratne and others, 2021), there is less certainty about how the wildfires may impact hydrologic processes in the future. Wildfires can increase hydrophobicity of soils, which has been found to have impacts on overland flow, subsurface flow, and streamflow post-fire (Havel and others, 2018; Ebel, 2020; Williams and others, 2022). In a recent review of post-fire changes in the Western United States, Williams and others (2022) noted as much as a 30 percent increase in stream runoff post-fire on average, lasting for as many as 6 years. Havel and others (2018) reported as much as 75 percent increases in stream discharge volume (measured in cubic meters per year) post-fire following the 2012 fires in northern Colorado. While examining infiltration recovery post-fire in Colorado, Ebel (2020) noted elevated excess runoff risk for as much as 5 years post-fire, with the greatest risk occurring during the first 2 years after the fire and subsequently decreasing in following years.
Residue that remains post-fire (for example, ash, black carbon, other debris) can affect surface energy balance, especially when deposited on land cover with high surface albedo such as snowpack. Gleason and others (2019) reported early melting of snowpack in the Western United States from post-fire debris decreasing snow albedo and increasing absorbed energy, with impacts potentially lasting for more than 1 decade post-fire. Wildfires have been found to increase the rate of permafrost thaw in Alaska (Brown and others, 2015) and Canada (Zhang and others, 2015; Gibson and others, 2018), leading to the expansion of thermokarst bog and increasing vulnerability to surface collapse. Wildfire activity is projected to increase for the remainder of the century across most of the Alaskan tundra and boreal regions as interactions between water, climate, and shifting vegetation patterns influence future fire intensity and frequency (Meredith and others, 2019).
Wildfires threaten not only hydrologic processes influencing quantity and water distribution but also affect water quality. Increases in runoff from charred forests can lead to greater debris flows (Ebel, 2020) and elevated turbidity and stream nitrogen (nitrate and total dissolved nitrogen) and carbon (Rhoades and others, 2018). Wildfire effects on stream nutrients have been found to continue for more than 1 decade post-fire, with implications for ecosystem health (Rhoades and others, 2018). Pennino and others (2022) reported that wildfires impair drinking water quality, finding that concentrations of nitrate, arsenic, disinfection byproducts, and volatile organic compounds violated maximum contaminant levels in public water systems located downstream from burned areas. These impacts, which were documented across the United States, can last for many years after the fire.
The degree of impact and regional change from wildfires will depend on the magnitude and severity of the fire and the size of the burned area. Extreme wildfires (in intensity or extent) may produce climate feedbacks driving drier conditions or reaching ecological tipping points, ultimately changing structure and function of vegetation post-fire; see sidebar 3, Davis and others (2019), and Godfree and others (2021). Integration of wildfires into climate models has been limited until recently and has proven to be challenging because of the variable roles of human behavior related to fire ignition, fire suppression, and other-land use factors (Teckentrup and others, 2019).
These themes have been explored more broadly in forest loss research, with strong evidence of reduced precipitation after large-scale deforestation in the tropics (Spracklen and Garcia-Carreras, 2015; Ruiz-Vásquez and others, 2020; Smith and others, 2023). There is also evidence of self-amplified forest loss with reduced precipitation and large-scale forest loss (Zemp and others, 2017) although exact tipping points are uncertain. A recent assessment examining links between changes in precipitation and global tropical forest deforestation indicated evidence of reduced precipitation with forest losses of 50-km scale or greater (Smith and others, 2023), and projected that future deforestation could cause 8–10 percent declines in precipitation over the 21st century, with an estimated rate of 0.25 millimeters per month precipitation decline for every 1 percent forest loss at or greater than the 200-km scale. Understanding these feedbacks and tipping points will be critical for improved vegetation-atmospheric coupling in climate models and to assist with climate mitigation and water security.
Summary
In this chapter, we distilled and synthesized results of the global and national climate assessments to highlight water-supply issues of particular concern to the United States, and to introduce a framework to guide and support trend analysis and modeling predictions for future water availability. This chapter aligns with the conclusions of the Water chapter of the Intergovernmental Panel on Climate Change Sixth Assessment Report that continuation of research on groundwater recharge, the role of plant physiology in land-atmosphere water exchange, land use changes, dams, and irrigation will improve future projections of the terrestrial water cycle. Our synthesis of the climate assessment reports and recent research from the published literature explains the key processes linking climate change to water availability. We compiled water-cycle-related Climatic Impact Drivers (CIDs), which can be used to develop indices and thresholds of significant change in water availability, reviewed concepts of tipping points and self-reinforcing or amplifying feedbacks, and highlighted three complex regional-scale processes that are likely to affect water availability in the United States with increasing global warming.
Increases in temperature contribute to extreme heat and increases in aridity, particularly in the Western United States, and drive most of the predominant and highest-confidence impacts on the water cycle, involving precipitation, streamflow, and cryosphere changes. The frequency and intensity of heavy precipitation events across the conterminous United States have increased, as has the land area affected by extreme precipitation. Climate-model projections suggest that the frequency and intensity of heavy precipitation events across the United States will continue to increase during the 21st century. Confidence in specific future changes in streamflow is not high, however, because in addition to precipitation and temperature changes, land- and water-use decisions factor into regional variability in streamflow amounts and timing across the United States. In the cryosphere, glaciers are projected to continue to decline and disappear as surface air temperatures continue to increase. Thawing of Artic near-surface permafrost is projected to continue throughout the century and result in increased subsidence and erosion, changes in groundwater and surface water availability, and release of the greenhouse gases carbon dioxide and methane, amplifying global warming. Climate change has substantially contributed to declines in snow extent, the duration of snow cover, and the fraction of winter precipitation that occurs as snow. As increasing temperatures drive declines in snowpack, the duration and frequency of snow droughts will increase. Streamflow patterns are expected to continue changing, although with high variability, with increasing temperature and aridity, and as extreme precipitation events and droughts become more frequent. Understanding the connection between shallow groundwater and streamflow is increasingly important as groundwater pumping changes the natural water cycle by capturing streamflow or adding water to the land surface through irrigation. Understanding water-resource sustainability and impacts of future climate change requires better quantification of fluxes between groundwater and surface-water systems.
Regional-scale, land-atmosphere interactions are difficult to observe and measure, and improving model representation of these processes can lead to insights on large-scale climate impacts on water availability and their cascading effects. The three processes discussed in this chapter are (1) mountains and coastal systems as focal points for land-atmosphere interactions important to water availability for large populations, (2) intensification of aridity and drought through climate feedbacks, and (3) rapid change in forest land cover resulting from wildfire or deforestation and its impact on water-vapor recycling and transport.
This chapter highlights the major climate-driven impacts on the water cycle and provides background information for design of hydrological modeling scenarios for future water availability. Toward that effort, an analysis of where Earth-system models are not capturing observed climate effects on the water cycle (especially amplifying feedbacks and extremes) for U.S. regions would point to priorities for scenario development. Similarly, the compilation of thresholds for adverse impact for water-availability relevant CID indices in each U.S. region and the conducting of an evaluation of current observations compared to those thresholds would allow development of an updatable assessment of future water-availability risks.
Acknowledgments
We thank U.S. Geological Survey (USGS) colleagues James Degnan, Hedeff Essaid and Trevor Partridge for comprehensive reviews of this chapter that improved it significantly. USGS colleagues Brian Ebel, Amanda Garcia, Galen Gorski, Judson Harvey, Jeni Keisman, Ted Stets, and Michelle Walvoord provided valuable subject-matter expert reviews or discussions. USGS colleagues Althea Archer and Amanda Carr contributed to figures 3 and 4 (design and layout).
References Cited
Abatzoglou, J.T., and Williams, A.P., 2016, Impact of anthropogenic climate change on wildfire across western US forests: Proceedings of the National Academy of Sciences of the United States of America, v. 113, no. 42, p. 11770–11775, accessed February 16, 2023, at https://doi.org/10.1073/pnas.1607171113.
Abatzoglou, J.T., Williams, A.P., and Barbero, R., 2019, Global emergence of anthropogenic climate change in fire weather indices: Geophysical Research Letters, v. 46, no. 1, p. 326–336, accessed July 3, 2023, at https://doi.org/10.1029/2018GL080959.
Alam, M.J., Goodall, J.L., Bowes, B.D., and Girvetz, E.H., 2017, The impact of projected climate change scenarios on nitrogen yield at a regional scale for the contiguous United States: Journal of the American Water Resources Association, v. 53, no. 4, p. 854–870, accessed December 21, 2023, at https://doi.org/10.1111/1752-1688.12537.
Alfieri, L., Bisselink, B., Dottori, F., Naumann, G., de Roo, A., Salamon, P., Wyser, K., and Feyen, L., 2017, Global projections of river flood risk in a warmer world: Earth’s Future, v. 5, no. 2, p. 171–182, accessed February 16, 2023, at https://doi.org/10.1002/2016EF000485.
Alizadeh, M.R., Adamowski, J., Nikoo, M.R., AghaKouchak, A., Dennison, P., and Sadegh, M., 2020, A century of observations reveals increasing likelihood of continental-scale compound dry-hot extremes: Science Advances, v. 6, no. 39, 11 p., accessed February 16, 2023, at https://doi.org/10.1126/sciadv.aaz4571.
Allan, R.P., Barlow, M., Byrne, M.P., Cherchi, A., Douville, H., Fowler, H.J., Gan, T.Y., Pendergrass, A.G., Rosenfeld, D., Swann, A.L.S., Wilcox, L.J., and Zolina, O., 2020, Advances in understanding large-scale responses of the water cycle to climate change: Annals of the New York Academy of Sciences, v. 1,472, no. 1, p. 49–75, accessed November 9, 2022, at https://doi.org/10.1111/nyas.14337.
Alley, W.M., Reilly, T.E., and Franke, O.L., 1999, Sustainability of ground-water resources: U.S. Geographical Survey Circular 1186, 79 p., accessed April 03, 2023, at https://doi.org/10.3133/cir1186.
Alter, R.E., Douglas, H.C., Winter, J.M., and Eltahir, E.A.B., 2018, Twentieth century regional climate change during the summer in the central United States attributed to agricultural intensification: Geophysical Research Letters, v. 45, no. 3, p. 1586–1594, accessed November 21, 2023, at https://doi.org/10.1002/2017GL075604.
Anderson, M.C., Hain, C., Wardlow, B., Pimstein, A., Mecikalski, J.R., and Kustas, W.P., 2011, Evaluation of drought indices based on thermal remote sensing of evapotranspiration over the continental United States: Journal of Climate, v. 24, no. 8, p. 2025–2044, accessed June 29, 2023, at https://doi.org/10.1175/2010JCLI3812.1.
Anderson, M.C., Zolin, C.A., Sentelhas, P.C., Hain, C.R., Semmens, K., Tugrul Yilmaz, M., Gao, F., Otkin, J.A., and Tetrault, R., 2016, The evaporative stress index as an indicator of agricultural drought in Brazil—An assessment based on crop yield impacts: Remote Sensing of Environment, v. 174, p. 82–99, accessed June 29, 2023, at https://doi.org/10.1016/j.rse.2015.11.034.
Angel, J.R., Swanson, C., Boustead, B.M., Conlon, K., Hall, K.R., Jorns, J.L., Kunkel, K.E., Lemos, M.C., Lofgren, B.M., Ontl, T., Posey, J., Stone, K., Takle, E., and Todey, D., 2018, Midwest, chap. 21 of Reidmiller, D.R., Avery, C.W., Easterling, D.R., Kunkel, K.E., Lewis, K.L.M, Maycock, T.K., and Stewart, B.C., eds., Fourth National Climate Assessment, v. II—Impacts, risks, and adaptation in the United States: Washington, D.C., U.S. Global Change Research Program, 69 p., accessed July 20, 2023, at https://doi.org/10.7930/NCA4.2018.CH21.
Ara Begum, R., Lempert, R., Ali, E., Benjaminsen, T.A., Bernauer, T., Cramer, W., Cui, X., Mach, K., Nagy, G., Stenseth, N.C., Sukumar, R., and Wester, P., 2022, Point of departure and key concepts, chap. 1 of Pörtner, H.O., Roberts, D.C., Tignor, M., Poloczanska, E.S., Mintenbeck, K., Alegría, A., Craig, M., Langsdorf, S., Löschke, S., Möller, V., Okem, A., and Rama, B., eds., Contribution of Working Group II to the Sixth Assessment Report of the Intergovernmental Panel on Climate Change: Cambridge, United Kingdom, and New York, New York, Cambridge University Press, Sixth Assessment Report of the Intergovernmental Panel on Climate Change, p. 121–196, accessed February 16, 2023, at https://doi.org/10.1017/9781009325844.003.
Arias, P.A., Bellouin, N., Coppola, E., Jones, R.G., Krinner, G., Marotzke, J., Naik, V., Palmer, M.D., Plattner, G.-K., Rogelj, J., Rojas, M., Sillmann, J., Storelvmo, T., Thorne, P.W., Trewin, B., Achuta Rao, K., Adhikary, B., Allan, R.P., Armour, K., Bala, G., Barimalala, R., Berger, S., Canadell, J.G., Cassou, C., Cherchi, A., Collins, W., Collins, W.D., Connors, S.L., Corti, S., Cruz, F., Dentener, F.J., Dereczynski, C., Di Luca, A., Diongue Niang, A.N.D.-R., Dosio, A., Douville, H., Engelbrecht, F., Eyring, V., Fischer, E., Forster, P., Fox-Kemper, B., Fuglestvedt, J.S., Fyfe, J.C., Gillett, N.P., Goldfarb, L., Gorodetskaya, I., Gutierrez, J.M., Hamdi, R., Hawkins, E., Hewitt, H.T., Hope, P., Islam, A.S., Jones, C., Kaufman, D.S., Kopp, R.E., Kosaka, Y., Kossin, J., Krakovska, S., Lee, J.-Y., Li, J., Mauritsen, T., Maycock, T.K., Meinshausen, M., Min, S.-K., Monteiro, P.M.S., Ngo-Duc, T., Otto, F., Pinto, I., Pirani, A., Raghavan, K., Ranasinghe, R., Ruane, A.C., Ruiz, L., Sallée, J.-B., Samset, B.H., Sathyendranath, S., Seneviratne, S.I., Sörensson, A.A., Szopa, S., Takayabu, I., Tréguier, A.-M., van den Hurk, B., Vautard, R., von Schuckmann, K., Zaehle, S., Zhang, X., and Zickfeld, K., 2021, Technical summary, in Masson-Delmotte, V., Zhai, P., Pirani, A., Connors, S.L., Péan, C., Berger, S., Caud, N., Chen, Y., Goldfarb, L., Gomis, M.I., Huang, M., Leitzell, K., Lonnoy, E., Matthews, J.B.R., Maycock, T.K., Waterfield, T., Yelekçi, O., Yu, R., and Zhou, B., eds., Climate change 2021—The physical science basis—Contribution of Working Group I to the Sixth Assessment Report of the Intergovernmental Panel on Climate Change: Cambridge, United Kingdom, and New York, New York, Cambridge University Press, p. 33–144, accessed July 4, 2023, at https://doi.org/10.1017/9781009157896.002.
Armstrong McKay, D.I., Staal, A., Abrams, J.F., Winkelmann, R., Sakschewski, B., Loriani, S., Fetzer, I., Cornell, S.E., Rockström, J., and Lenton, T.M., 2022, Exceeding 1.5°C global warming could trigger multiple climate tipping points: Science, v. 377, no. 6,611, 10 p., accessed October 19, 2022, at https://doi.org/10.1126/science.abn7950.
Ayers, J.R., Villarini, G., Schilling, K., Jones, C., Brookfield, A., Zipper Samuel, C., and Farmer, W.H., 2022, The role of climate in monthly baseflow changes across the continental United States: Journal of Hydrologic Engineering, v. 27, no. 5, 13 p., accessed May 24, 2023, at https://doi.org/10.1061/(ASCE)HE.1943-5584.0002170.
Baek, S.H., Steiger, N.J., Smerdon, J.E., and Seager, R., 2019, Oceanic drivers of widespread summer droughts in the United States over the Common Era: Geophysical Research Letters, v. 46, no. 14, p. 8271–8280, accessed February 16, 2023, at https://doi.org/10.1029/2019GL082838.
Bai, Y., Fernald, A., Tidwell, V., and Gunda, T., 2020, Reduced and earlier snowmelt runoff impacts traditional irrigation systems: Journal of Contemporary Water Research & Education, v. 168, no. 1, p. 10–28, accessed October 9, 2023, at https://doi.org/10.1111/j.1936-704X.2019.03318.x.
Ball, G., Regier, P., González-Pinzón, R., Reale, J., and Van Horn, D., 2021, Wildfires increasingly impact western U.S. fluvial networks: Nature Communications, v. 12, no. 2,484, 8 p., accessed October 04, 2023, at https://doi.org/10.1038/s41467-021-22747-3.
Ballard, T.C., Sinha, E., and Michalak, A.M., 2019, Long-term changes in precipitation and temperature have already impacted nitrogen loading: Environmental Science & Technology, v. 53, no. 9, p. 5080–5090, accessed October 04, 2023, at https://doi.org/10.1021/acs.est.8b06898.
Barnard, P.L., Dugan, J.E., Page, H.M., Wood, N.J., Hart, J.A.F., Cayan, D.R., Erikson, L.H., Hubbard, D.M., Myers, M.R., Melack, J.M., and Iacobellis, S.F., 2021, Multiple climate change-driven tipping points for coastal systems: Scientific Reports, v. 11, no. 15,560, 13 p., accessed April 04, 2023, at https://doi.org/10.1038/s41598-021-94942-7.
Bartolino, J.R., and Cunningham, W.L., 2003, Ground-water depletion across the Nation: U.S. Geological Survey Fact Sheet 103–03, 4 p., accessed July 03, 2023, at https://doi.org/10.3133/fs10303.
Bartos, M.D., and Chester, M.V., 2015, Impacts of climate change on electric power supply in the Western United States: Nature Climate Change, v. 5, no. 8, p. 748–752, accessed December 21, 2023, at https://doi.org/10.1038/nclimate2648.
Battaglin, W., Hay, L., Lawrence, D., McCabe, G., and Norton, P., 2020, Baseline conditions and projected future hydro-climatic change in national parks in the conterminous United States: Water, v. 12, no. 6, 24 p., accessed June 29, 2023, at https://doi.org/10.3390/w12061704.
Bauer, S., Olson, J., Cockrill, A., van Hattem, M., Miller, L., Tauzer, M., and Leppig, G., 2015, Impacts of surface water diversions for marijuana cultivation on aquatic habitat in four northwestern California watersheds: PLoS One, v. 10, no. 3, 25 p., accessed December 21, 2023, at https://doi.org/10.1371/journal.pone.0120016.
Beck, H.E., Zimmermann, N.E., McVicar, T.R., Vergopolan, N., Berg, A., and Wood, E.F., 2018, Present and future Köppen-Geiger climate classification maps at 1-km resolution: Scientific Data, v. 5, no. 180,214, 12 p., accessed September 20, 2023, at https://doi.org/10.1038/sdata.2018.214.
Benson, B.J., Magnuson, J.J., Jensen, O.P., Card, V.M., Hodgkins, G., Korhonen, J., Livingstone, D.M., Stewart, K.M., Weyhenmeyer, G.A., and Granin, N.G., 2012, Extreme events, trends, and variability in Northern Hemisphere lake-ice phenology (1855–2005): Climatic Change, v. 112, no. 2, p. 299–323, accessed June 30, 2023, at https://doi.org/10.1007/s10584-011-0212-8.
Berghuijs, W.R., and Slater, L.J., 2023, Groundwater shapes North American river floods: Environmental Research Letters, v. 18, no. 3, 10 p., accessed November 28, 2023, at https://doi.org/10.1088/1748-9326/acbecc.
Berghuijs, W.R., Woods, R.A., and Hrachowitz, M., 2014, A precipitation shift from snow towards rain leads to a decrease in streamflow: Nature Climate Change, v. 4, no. 7, p. 583–586, accessed February 16, 2023, at https://doi.org/10.1038/nclimate2246.
Beven, K.J., 2012, Rainfall-runoff modelling (2d ed.): Hoboken, New Jersey, Wiley-Blackwell, 488 p., accessed July 17, 2023, at https://doi.org/10.1002/9781119951001.
Bindoff, N.L., Stott, P.A., AchutaRao, K.M., Allen, M.R., Gillett, N., Gutzler, D.S., Hansingo, K., Hegerl, G.C., Hu, Y., Jain, S., Mokhov, I.I., Overland, J.E., Perlwitz, J., Sebbari, R., and Zhang, X., 2013, Detection and attribution of climate change—From global to regional, chap. 10 of Stockner, T.F., Qin, D., Plattner, G.-K., Tignor, M., Allen, S.K., Doschung, J., Nauels, A., Xia, Y., Bex, V., and Midgley, P.M., eds., Climate change 2013—The physical science basis—Contribution of Working Group I to the Fifth Assessment Report of the Intergovernmental Panel on Climate Change: Cambridge, United Kingdom, and New York, New York, Cambridge University Press, p. 867–952, accessed June 29, 2023, at https://doi.org/10.1017/CBO9781107415324.022.
Bonan, G.B., 2008, Forests and climate change—Forcings, feedbacks, and the climate benefits of forests: Science, v. 320, no. 5882, p. 1444–1449, accessed April 06, 2023, at https://doi.org/10.1126/science.1155121.
Bonfils, C., and Lobell, D., 2007, Empirical evidence for a recent slowdown in irrigation-induced cooling: Proceedings of the National Academy of Sciences of the United States of America, v. 104, no. 34, p. 13582–13587, accessed August 9, 2023, at https://doi.org/10.1073/pnas.0700144104.
Bonsal, B., Liu, Z., Wheaton, E., and Stewart, R., 2020, Historical and projected changes to the stages and other characteristics of severe Canadian prairie droughts: Water, v. 12, no. 12, 16 p., accessed October 09, 2023, at https://doi.org/10.3390/w12123370.
Box, J.E., Colgan, W.T., Christensen, T.R., Schmidt, N.M., Lund, M., Parmentier, F.-J.W., Brown, R., Bhatt, U.S., Euskirchen, E.S., Romanovsky, V.E., Walsh, J.E., Overland, J.E., Wang, M., Corell, R.W., Meier, W.N., Wouters, B., Mernild, S., Mård, J., Pawlak, J., and Olsen, M.S., 2019, Key indicators of Arctic climate change: 1971–2017: Environmental Research Letters, v. 14, no. 4, accessed June 2, 2023 at accessed June 02, 2023, at https://doi.org/10.1088/1748-9326/aafc1b.
Bredehoeft, J.D., 2002, The water budget myth revisited—Why hydrogeologists model: Ground Water, v. 40, no. 4, p. 340–345, accessed July 03, 2023, at https://doi.org/10.1111/j.1745-6584.2002.tb02511.x.
Brown, D.R.N., Jorgenson, M.T., Douglas, T.A., Romanovsky, V.E., Kielland, K., Hiemstra, C., Euskirchen, E.S., and Ruess, R.W., 2015, Interactive effects of wildfire and climate on permafrost degradation in Alaskan lowland forests: Journal of Geophysical Research Biogeosciences, v. 120, no. 8, p. 1619–1637, accessed July 20, 2023, at https://doi.org/10.1002/2015JG003033.
Brown, R.D., 2000, Northern hemisphere snow cover variability and change, 1915–97: Journal of Climate, v. 13, no. 13, p. 2339–2355, accessed July 20, 2023, at https://journals.ametsoc.org/view/journals/clim/13/13/1520-0442_2000_013_2339_nhscva_2.0.co_2.xml.
Brown, T.C., Mahat, V., and Ramirez, J.A., 2019, Adaptation to future water shortages in the United States caused by population growth and climate change: Earth’s Future, v. 7, no. 3, p. 219–234, accessed July 20, 2023, at https://doi.org/10.1029/2018EF001091.
Brunner, M.I., Melsen, L.A., Newman, A.J., Wood, A.W., and Clark, M.P., 2020, Future streamflow regime changes in the United States—Assessment using functional classification: Hydrology and Earth System Sciences, v. 24, no. 8, p. 3951–3966, accessed May 23, 2023, at https://doi.org/10.5194/hess-24-3951-2020.
Bureau of Reclamation, 2021, Water reliability in the West—2021 SECURE Water Act report: Prepared for the United States Congress, 2021 SECURE Water Act Report to Congress, 60 p., accessed October 9, 2023, at https://www.usbr.gov/climate/secure/.
Burgdorf, A.-M., Brönnimann, S., and Franke, J., 2019, Two types of North American droughts related to different atmospheric circulation patterns: Climate of the Past, v. 15, no. 6, p. 2053–2065, accessed February 16, 2023, at https://doi.org/10.5194/cp-15-2053-2019.
Camargo, S.J., 2013, Global and regional aspects of tropical cyclone activity in the CMIP5 models: Journal of Climate, v. 26, no. 24, p. 9880–9902, accessed April 06, 2023, at https://doi.org/10.1175/JCLI-D-12-00549.1.
Cayan, D.R., 1996, Interannual climate variability and snowpack in the Western United States: Journal of Climate, v. 9, no. 5, p. 928–948, accessed February 16, 2023, at https://journals.ametsoc.org/view/journals/clim/9/5/1520-0442_1996_009_0928_icvasi_2_0_co_2.xml.
Changnon, S.A., 1989, The 1988 drought, barges, and diversion: Bulletin of the American Meteorological Society, v. 70, no. 9, p. 1092–1104, accessed July 13, 2023, at https://ui.adsabs.harvard.edu/abs/1989BAMS...70.1092C/abstract.
Chapra, S.C., Boehlert, B., Fant, C., Bierman, V.J., Jr., Henderson, J., Mills, D., Mas, D.M.L., Rennels, L., Jantarasami, L., Martinich, J., Strzepek, K.M., and Paerl, H.W., 2017, Climate change impacts on harmful algal blooms in U.S. freshwaters—A screening-level assessment: Environmental Science & Technology, v. 51, no. 16, p. 8933–8943, accessed December 21, 2023, at https://doi.org/10.1021/acs.est.7b01498.
Chen, D., Rojas, M., Samset, B.H., Cobb, K., Diongue Niang, A., Edwards, P., Emori, S., Faria, S.H., Hawkins, E., Hope, P., Huybrechts, P., Meinshausen, M., Mustafa, S.K., Plattner, G.-K., and Tréguier, A.-M., 2021, Framing, context, and methods, chap. 1 of Masson-Delmotte, V., Zhai, P., Pirani, A., Connors, S.L., Péan, C., Berger, S., Caud, N., Chen, Y., Goldfarb, L., Gomis, M.I., Huang, M., Leitzell, K., Lonnoy, E., Matthews, J.B.R., Maycock, T.K., Waterfield, T., Yelekçi, O., Yu, R., and Zhou, B., eds., Climate change 2021—The physical science basis—Contribution of Working Group I to the Sixth Assessment Report of the Intergovernmental Panel on Climate Change: Cambridge, United Kingdom, and New York, New York, Cambridge University Press, p. 147–286, accessed July 5, 2023, at https://doi.org/10.1017/9781009157896.003.
Chen, J., Dai, A., Zhang, Y., and Rasmussen, K.L., 2020, Changes in convective available potential energy and convective inhibition under global warming: Journal of Climate, v. 33, no. 6, p. 2025–2050, accessed July 05, 2023, at https://doi.org/10.1175/JCLI-D-19-0461.1.
Chen, L., and Dirmeyer, P.A., 2020, Distinct impacts of land use and land management on summer temperatures: Frontiers in Earth Science, v. 8, no. 245, 12 p., accessed July 05, 2023, at https://doi.org/10.3389/feart.2020.00245.
Clemesha, R.E.S., Guirguis, K., Gershunov, A., Small, I.J., and Tardy, A., 2017, California heat waves—Their spatial evolution, variation, and coastal modulation by low clouds: Climate Dynamics, v. 50, nos. 11–12, p. 4285–4301, accessed May 22, 2023, at https://doi.org/10.1007/s00382-017-3875-7.
Cohen, S., Koshida, G., and Mortsch, L., 2015, Climate and water availability indicators in Canada—Challenges and a way forward—Part III—Future scenarios: Canadian Water Resources Journal/Revue canadienne des ressources hydriques, v. 40, no. 2, p. 160–172, accessed October 04, 2023, at https://doi.org/10.1080/07011784.2015.1006021.
Collins, M., Knutti, R., Arblaster, J., Dufresne, J.-L., Fichefet, T.F., Gao, X., Gutowski, W.J., Johns, T., Krinner, G.S., M., Tebaldi, C., Weaver, A.J., and Wehner, M., 2014, Long-term climate change—Projections, commitments and irreversibility chap. 12 of Stockner, T.F., Qin, D., Plattner, G.-K., Tignor, M., Allen, S.K., Doschung, J., Nauels, A., Xia, Y., Bex, V., and Midgley, P.M., eds., Climate change 2013—The physical science basis—Contribution of Working Group I to the Fifth Assessment Report of the Intergovernmental Panel on Climate Change: Cambridge, United Kingdom, and New York, New York, Cambridge University Press, p. 1029–1136, accessed June 29, 2023, at https://doi.org/10.1017/CBO9781107415324.024.
Collins, M.J., Hodgkins, G.A., Archfield, S.A., and Hirsch, R.M., 2022, The occurrence of large floods in the United States in the modern hydroclimate regime—Seasonality, trends, and large-scale climate associations: Water Resources Research, v. 58, no. 2, 22 p., accessed June 29, 2023, at https://doi.org/10.1029/2021WR030480.
Condon, L.E., Atchley, A.L., and Maxwell, R.M., 2020, Evapotranspiration depletes groundwater under warming over the contiguous United States: Nature Communications, v. 11, no. 1, 8 p., accessed July 03, 2023, at https://doi.org/10.1038/s41467-020-14688-0.
Cook, B.I., Smerdon, J.E., Seager, R., and Cook, E.R., 2014, Pan-continental droughts in North America over the last millennium: Journal of Climate, v. 27, no. 1, p. 383–397, accessed February 16, 2023, at https://doi.org/10.1175/JCLI-D-13-00100.1.
Cook, E.R., Meko, D.M., Stahle, D.W., and Cleaveland, M.K., 1999, Drought reconstructions for the continental United States: Journal of Climate, v. 12, no. 4, p. 1145–1162, accessed February 16, 2023, at https://journals.ametsoc.org/view/journals/clim/12/4/1520-0442_1999_012_1145_drftcu_2.0.co_2.xml.
Cook, E.R., Woodhouse, C.A., Eakin, C.M., Meko, D.M., and Stahle, D.W., 2004, Long-term aridity changes in the Western United States: Science, v. 306, no. 5698, p. 1015–1018, accessed July 3, 2023, at https://doi.org/10.1126/science.1102586.
Cooper, M.G., Nolin, A.W., and Safeeq, M., 2016, Testing the recent snow drought as an analog for climate warming sensitivity of Cascades snowpacks: Environmental Research Letters, v. 11, no. 8, 11 p., accessed December 07, 2022, at https://doi.org/10.1088/1748-9326/11/8/084009.
Cowan, T., Hegerl, G.C., Schurer, A., Tett, S.F.B., Vautard, R., Yiou, P., Jézéquel, A., Otto, F.E.L., Harrington, L.J., and Ng, B., 2020, Ocean and land forcing of the record-breaking Dust Bowl heatwaves across central United States: Nature Communications, v. 11, no. 2,870, 9 p., accessed February 16, 2023, at https://doi.org/10.1038/s41467-020-16676-w.
Curry, C.L., Islam, S.U., Zwiers, F.W., and Déry, S.J., 2019, Atmospheric rivers increase future flood risk in western Canada’s largest Pacific river: Geophysical Research Letters, v. 46, no. 3, p. 1651–1661, accessed December 21, 2023, at https://doi.org/10.1029/2018GL080720.
Cuthbert, M.O., Gleeson, T., Moosdorf, N., Befus, K.M., Schneider, A., Hartmann, J., and Lehner, B., 2019, Global patterns and dynamics of climate–groundwater interactions: Nature Climate Change, v. 9, no. 2, p. 137–141, accessed February 09, 2023, at https://doi.org/10.1038/s41558-018-0386-4.
Davis, K.T., Dobrowski, S.Z., Higuera, P.E., Holden, Z.A., Veblen, T.T., Rother, M.T., Parks, S.A., Sala, A., and Maneta, M.P., 2019, Wildfires and climate change push low-elevation forests across a critical climate threshold for tree regeneration: Proceedings of the National Academy of Sciences of the United States of America, v. 116, no. 13, p. 6193–6198, accessed April 6, 2023, at https://doi.org/10.1073/pnas.1815107116.
de Graaf, I.E.M., Gleeson, T., van Beek, L.P.H., Sutanudjaja, E.H., and Bierkens, M.F.P., 2019, Environmental flow limits to global groundwater pumping: Nature, v. 574, no. 7,776, p. 90–94, accessed May 23, 2023, at https://doi.org/10.1038/s41586-019-1594-4.
Degnan, J.R., Kauffman, L.J., Erickson, M.L., Belitz, K., and Stackelberg, P.E., 2021, Depth of groundwater used for drinking-water supplies in the United States: U.S. Geological Survey Scientific Investigations Report 2021–5069, 69 p., accessed July 5, 2023, at https://doi.org/10.3133/sir20215069.
Delaware River Basin Commission, 2019, An overview of drought in the Delaware River Basin: Delaware River Basin Commission, 21 p., accessed July 3, 2023, at https://www.nj.gov/drbc/library/documents/drought/DRBdrought-overview_feb2019.pdf.
Derksen, C., Burgess, D., Duguay, C., Howell, S., Mudryk, L., Smith, S., Thackeray, C., and Kirchmeier-Young, M.C., 2019, Changes in snow, ice, and permafrost across Canada, chap. 5 of Bush, E., and Lemmen, D.S., eds., Canada’s changing climate report: Ottawa, Ontario, Government of Canada, p. 194–260, accessed July 2, 2023, at https://natural-resources.canada.ca/sites/www.nrcan.gc.ca/files/energy/Climate-change/pdf/CCCR-Chapter5-ChangesInSnowIcePermafrostAcrossCanada.pdf.
Dethier, E.N., Sartain, S.L., Renshaw, C.E., and Magilligan, F.J., 2020, Spatially coherent regional changes in seasonal extreme streamflow events in the United States and Canada since 1950: Science Advances, v. 6, no. 49, 8 p., accessed May 23, 2023, at https://doi.org/10.1126/sciadv.aba5939.
Dettinger, M., 2011, Climate change, atmospheric rivers, and floods in California—A multimodel analysis of storm frequency and magnitude changes: Journal of the American Water Resources Association, v. 47, no. 3, p. 514–523, accessed April 06, 2023, at https://doi.org/10.1111/j.1752-1688.2011.00546.x.
Dettinger, M., Udall, B., and Georgakakos, A., 2015, Western water and climate change: Ecological Applications, v. 25, no. 8, p. 2069–2093, accessed April 06, 2023, at https://doi.org/10.1890/15-0938.1.
Dibike, Y., Prowse, T., Bonsal, B., and O’Neil, H., 2016, Implications of future climate on water availability in the western Canadian river basins: International Journal of Climatology, v. 37, no. 7, p. 3247–3263, accessed December 21, 2023, at https://doi.org/10.1002/joc.4912.
Dittus, A.J., Karoly, D.J., Lewis, S.C., and Alexander, L.V., 2015, A multiregion assessment of observed changes in the areal extent of temperature and precipitation extremes: Journal of Climate, v. 28, no. 23, p. 9206–9220, accessed June 29, 2023, at https://doi.org/10.1175/JCLI-D-14-00753.1.
Döll, P., 2009, Vulnerability to the impact of climate change on renewable groundwater resources—A global-scale assessment: Environmental Research Letters, v. 4, no. 3, 12 p., accessed October 19, 2022, at https://doi.org/10.1088/1748-9326/4/3/035006.
Döll, P., Müller Schmied, H., Schuh, C., Portmann, F.T., and Eicker, A., 2014, Global-scale assessment of groundwater depletion and related groundwater abstractions—Combining hydrological modeling with information from well observations and GRACE satellites: Water Resources Research, v. 50, no. 7, p. 5698–5720, accessed October 19, 2022, at https://doi.org/10.1002/2014WR015595.
Douville, H., Raghavan, K., Renwick, J., Allan, R.P., Arias, P.A., Barlow, M., Cerezo-Mota, R., Cherchi, A., Gan, T.Y., Gergis, J., Jiang, D., Khan, A., Pokam Mba, W., Rosenfeld, D., Tierney, J., and Zolina, O., 2021, Water cycle changes, chap. 8 of Matthews, J.B.R., Maycock, T.K., Waterfield, T., Yelekçi, O., Yu, R., Zhou, B., Masson-Delmotte, V., Zhai, P., Pirani, A., Connors, S.L., Péan, C., Berger, S., Caud, N., Chen, Y., Goldfarb, L., Gomis, M.I., Huang, M., Leitzell, K., and Lonnoy, E., eds., Climate change 2021—The physical science basis—Contribution of Working Group I to the Sixth Assessment Report of the Intergovernmental Panel on Climate Change: Cambridge, United Kingdom, and New York, New York, Cambridge University Press, p. 1055–1210, accessed June 30, 2023, at https://doi.org/10.1017/9781009157896.010.
Dudley, R.W., Hodgkins, G.A., McHale, M.R., Kolian, M.J., and Renard, B., 2017, Trends in snowmelt-related streamflow timing in the conterminous United States: Journal of Hydrology, v. 547, p. 208–221, accessed May 23, 2023, at https://doi.org/10.1016/j.jhydrol.2017.01.051.
Dye, A.W., Rastogi, B., Clemesha, R.E.S., Kim, J.B., Samelson, R.M., Still, C.J., and Williams, A.P., 2020, Spatial patterns and trends of summertime low cloudiness for the Pacific Northwest, 1996–2017: Geophysical Research Letters, v. 47, no. 16, 12 p., accessed May 22, 2023, at https://doi.org/10.1029/2020GL088121.
Easterling, D.R., Kunkel, K.E., Arnold, J.R., Knutson, T., LeGrande, A.N., Leung, L.R., Vose, R.S., Waliser, D.E., and Wehner, M.F., 2017, Precipitation change in the United States, chap. 7 of Wuebbles, D.J., Fahey, D.W., Hibbard, K.A., Dokken, D.J., Stewart, B.C., and Maycock, T.K., eds., Climate science special report—Fourth National Climate Assessment, v. I: Washington, D.C., U.S. Global Change Research Program, p. 207–230, accessed April 6, 2023, at https://doi.org/10.7930/J0H993CC.
Ebel, B.A., 2020, Temporal evolution of measured and simulated infiltration following wildfire in the Colorado Front Range, USA—Shifting thresholds of runoff generation and hydrologic hazards: Journal of Hydrology, v. 585,16 p., accessed April 6, 2023, at https://doi.org/10.1016/j.jhydrol.2020.124765.
Emanuel, K., 2017, Assessing the present and future probability of Hurricane Harvey’s rainfall: Proceedings of the National Academy of Sciences of the United States of America, v. 114, no. 48, p. 12681–12684, accessed December 21, 2023, at https://doi.org/10.1073/pnas.1716222114.
Erb, M.P., Emile-Geay, J., Hakim, G.J., Steiger, N., and Steig, E.J., 2020, Atmospheric dynamics drive most interannual U.S. droughts over the last millennium: Science Advances, v. 6, no. 32, 12 p., accessed April 6, 2023, at https://doi.org/10.1126/sciadv.aay7268.
Erickson, M.L, Miller, O.L, Cashman, J.J., Degnan, J.R., Reddy, J.E., Martinez, A.J., and Azadpour, E, 2025, Status of water-quality conditions in the United States, 2010–20 (ver. 1.1, February 2025), chap. C of U.S. Geological Survey Integrated Water Availability Assessment—2010–20: U.S. Geological Survey Professional Paper 1894–C, 85 p., https://doi.org/10.3133/pp1894C.
Euskirchen, E.S., Bennett, A.P., Breen, A.L., Genet, H., Lindgren, M.A., Kurkowski, T.A., McGuire, A.D., and Rupp, T.S., 2016, Consequences of changes in vegetation and snow cover for climate feedbacks in Alaska and northwest Canada: Environmental Research Letters, v. 11, no. 10, 19 p., accessed May 24, 2023, at https://doi.org/10.1088/1748-9326/11/10/105003.
Eyring, V., Bony, S., Meehl, G.A., Senior, C.A., Stevens, B., Stouffer, R.J., and Taylor, K.E., 2016, Overview of the Coupled Model Intercomparison Project Phase 6 (CMIP6) experimental design and organization: Geoscientific Model Development, v. 9, no. 5, p. 1937–1958, accessed March 6, 2023, at https://doi.org/10.5194/gmd-9-1937-2016.
Feng, Z., Leung, L.R., Hagos, S., Houze, R.A., Burleyson, C.D., and Balaguru, K., 2016, More frequent intense and long-lived storms dominate the springtime trend in central U.S. rainfall: Nature Communications, v. 7, no. 1, 8 p., accessed May 24, 2023, at https://doi.org/10.1038/ncomms13429.
Ferguson, G., McIntosh, J.C., Jasechko, S., Kim, J.-H., Famiglietti, J.S., and McDonnell, J.J., 2023, Groundwater deeper than 500 m contributes less than 0.1% of global river discharge: Communications Earth & Environment, v. 4, no. 1, 8 p., accessed March 2, 2023, at https://doi.org/10.1038/s43247-023-00697-6.
Fernandez, R., and Zegre, N., 2019, Seasonal changes in water and energy balances over the Appalachian region and beyond throughout the twenty-first century: Journal of Applied Meteorology and Climatology, v. 58, no. 5, p. 1079–1102, accessed May 22, 2023, at https://doi.org/10.1175/JAMC-D-18-0093.1.
Ford, T.W., Wang, Q., and Quiring, S.M., 2016, The observation record length necessary to generate robust soil moisture percentiles: Journal of Applied Meteorology and Climatology, v. 55, no. 10, p. 2131–2149, accessed October 19, 2022, at https://doi.org/10.1175/JAMC-D-16-0143.1.
Foster, L.M., Bearup, L.A., Molotch, N.P., Brooks, P.D., and Maxwell, R.M., 2016, Energy budget increases reduce mean streamflow more than snow–rain transitions—Using integrated modeling to isolate climate change impacts on Rocky Mountain hydrology: Environmental Research Letters, v. 11, no. 4, 10 p., accessed April 6, 2023, at https://doi.org/10.1088/1748-9326/11/4/044015.
Foulon, É., and Rousseau, A.N., 2018, Surface water quantity for drinking water during low flows—Sensitivity assessment solely from climate data: Water Resources Management, v. 33, no. 1, p. 369–385, accessed December 21, 2023, at https://doi.org/10.1007/s11269-018-2107-1.
Fox-Kemper, B., Hewitt, H.T., Xiao, C., Aðalgeirsdóttir, G.D., Drijfhout, S.S., Edwards, T.L., Golledge, N.R., Hemer, M., Kopp, R.E., Krinner, G., Mix, A., Notz, D., Nowicki, S., Nurhati, I.S., Ruiz, L., Sallée, J.-B., Slangen, A.B.A., and Yu, Y., 2021, Ocean, cryosphere and sea level change, chap. 9 of Masson-Delmotte, V., Zhai, P., Pirani, A., Connors, S.L., Péan, C., Berger, S., Caud, N., Chen, Y., Goldfarb, L., Gomis, M.I., Huang, M., Leitzell, K., Lonnoy, E., Matthews, J.B.R., Maycock, T.K., Waterfield, T., Yelekçi, O., Yu, R., and Zhou, B., eds., Climate change 2021—The physical science basis—Contribution of Working Group I to the Sixth Assessment Report of the Intergovernmental Panel on Climate Change: Cambridge, United Kingdom, and New York, New York, Cambridge University Press, p. 1211–1362, accessed December 27, 2023, at https://doi.org/10.1017/9781009157896.011.
Frei, A., and Robinson, D.A., 1999, Northern Hemisphere snow extent—Regional variability 1972–1994: International Journal of Climatology, v. 19, no. 14, p. 1535–1560, accessed April 6, 2023, at https://rmets.onlinelibrary.wiley.com/doi/abs/10.1002/%28SICI%291097-0088%2819991130%2919%3A14%3C1535%3A%3AAID-JOC438%3E3.0.CO%3B2-J.
Frei, A., Robinson, D.A., and Hughes, M.G., 1999, North American snow extent—1900–1994: International Journal of Climatology, v. 19, no. 14, p. 1517–1534, accessed April 6, 2023, at https://rmets.onlinelibrary.wiley.com/doi/abs/10.1002/%28SICI%291097-0088%2819991130%2919%3A14%3C1517%3A%3AAID-JOC437%3E3.0.CO%3B2-I.
Fye, F.K., Stahle, D.W., and Cook, E.R., 2003, Paleoclimatic analogs to twentieth-century moisture regimes across the United States: Bulletin of the American Meteorological Society, v. 84, no. 7, p. 901–910, accessed May 24, 2023, at https://doi.org/10.1175/BAMS-84-7-901.
Fyfe, J.C., Derksen, C., Mudryk, L., Flato, G.M., Santer, B.D., Swart, N.C., Molotch, N.P., Zhang, X., Wan, H., Arora, V.K., Scinocca, J., and Jiao, Y., 2017, Large near-term projected snowpack loss over the western United States: Nature Communications, v. 8, no. 1, no. 14,996, 7 p., accessed May 24, 2023, at https://doi.org/10.1038/ncomms14996.
Gangopadhyay, S., McCabe, G., Pruitt, T., and House, B., 2021, West-wide drought analysis: U.S. Bureau of Reclamation Technical Memorandum No. ENV-2021-001, p. 129–182, accessed April 6, 2023, at https://www.usbr.gov/climate/secure/docs/2021secure/westwidesecurereport.pdf.
Gao, Y., Lu, J., Leung, L.R., Yang, Q., Hagos, S., and Qian, Y., 2015, Dynamical and thermodynamical modulations on future changes of landfalling atmospheric rivers over western North America: Geophysical Research Letters, v. 42, no. 17, p. 7179–7186, accessed April 6, 2023, at https://doi.org/10.1002/2015GL065435.
Garcia, C.A., Huntington, J.M., Buto, S.G., Moreo, M.T., Smith, J.L., and Andraski, B.J., 2015, Groundwater discharge by evapotranspiration, Dixie Valley, west-central Nevada, March 2009–September 2011: U.S. Geological Survey Professional Paper 1805, 90 p., accessed October 4, 2023, at https://doi.org/10.3133/pp1805.
Gershunov, A., Shulgina, T., Clemesha, R.E.S., Guirguis, K., Pierce, D.W., Dettinger, M.D., Lavers, D.A., Cayan, D.R., Polade, S.D., Kalansky, J., and Ralph, F.M., 2019, Precipitation regime change in western North America—The role of atmospheric rivers: Scientific Reports, v. 9, no. 1, no. 9,944, 11 p., accessed October 9, 2023, at https://doi.org/10.1038/s41598-019-46169-w.
Gibson, C.M., Chasmer, L.E., Thompson, D.K., Quinton, W.L., Flannigan, M.D., and Olefeldt, D., 2018, Wildfire as a major driver of recent permafrost thaw in boreal peatlands: Nature Communications, v. 9, no. 1, 9 p., accessed April 6, 2023, at https://doi.org/10.1038/s41467-018-05457-1.
Gleason, K.E., McConnell, J.R., Arienzo, M.M., Chellman, N., and Calvin, W.M., 2019, Four-fold increase in solar forcing on snow in western U.S. burned forests since 1999: Nature Communications, v. 10, no. 1, 8 p., accessed April 6, 2023, at https://doi.org/10.1038/s41467-019-09935-y.
Godfree, R.C., Knerr, N., Encinas-Viso, F., Albrecht, D., Bush, D., Christine Cargill, D., Clements, M., Gueidan, C., Guja, L.K., Harwood, T., Joseph, L., Lepschi, B., Nargar, K., Schmidt-Lebuhn, A., and Broadhurst, L.M., 2021, Implications of the 2019–2020 megafires for the biogeography and conservation of Australian vegetation: Nature Communications, v. 12, no. 1, 13 p., accessed April 6, 2023, at https://doi.org/10.1038/s41467-021-21266-5.
Golub, M., Thiery, W., Marcé, R., Pierson, D., Vanderkelen, I., Mercado-Bettin, D., Woolway, R.I., Grant, L., Jennings, E., Kraemer, B.M., Schewe, J., Zhao, F., Frieler, K., Mengel, M., Bogomolov, V.Y., Bouffard, D., Côté, M., Couture, R.-M., Debolskiy, A.V., Droppers, B., Gal, G., Guo, M., Janssen, A.B.G., Kirillin, G., Ladwig, R., Magee, M., Moore, T., Perroud, M., Piccolroaz, S., Raaman Vinnaa, L., Schmid, M., Shatwell, T., Stepanenko, V.M., Tan, Z., Woodward, B., Yao, H., Adrian, R., Allan, M., Anneville, O., Arvola, L., Atkins, K., Boegman, L., Carey, C., Christianson, K., de Eyto, E., DeGasperi, C., Grechushnikova, M., Hejzlar, J., Joehnk, K., Jones, I.D., Laas, A., Mackay, E.B., Mammarella, I., Markensten, H., McBride, C., Özkundakci, D., Potes, M., Rinke, K., Robertson, D., Rusak, J.A., Salgado, R., van der Linden, L., Verburg, P., Wain, D., Ward, N.K., Wollrab, S., and Zdorovennova, G., 2022, A framework for ensemble modelling of climate change impacts on lakes worldwide—The ISIMIP lake sector: Geoscientific Model Development, v. 15, no. 11, p. 4597–4623, accessed October 19, 2022, at https://doi.org/10.5194/gmd-15-4597-2022
Gorski, G., Stets, E., Scholl, M.A., Degnan, J.R., Mullaney, J.R., Galanter, A.E., Martinez, A.J., Padilla, J., LaFontaine, J.H., Corson-Dosch, H.R., and Shapiro, A.M., 2025, Water supply in the conterminous United States, Alaska, Hawaii, and Puerto Rico, water years 2010–20 (ver. 1.1, January 17, 2025), chap. B of U.S. Geological Survey Integrated Water Availability Assessment—2010–20 (ver. 1.1, January 17, 2025): U.S. Geological Survey Professional Paper 1894–B, 60 p., https://doi.org/10.3133/pp1894B.
Gosling, S.N., and Arnell, N.W., 2013, A global assessment of the impact of climate change on water scarcity: Climatic Change, v. 134, no. 3, p. 371–385, accessed April 6, 2023, at https://doi.org/10.1007/s10584-013-0853-x.
Groisman, P.Y., Karl, T.R., Knight, R.W., and Stenchikov, G.L., 1994, Changes of snow cover, temperature, and radiative heat balance over the Northern Hemisphere: Journal of Climate, v. 7, no. 11, p. 1633–1656, accessed February 16, 2023, at https://journals.ametsoc.org/view/journals/clim/7/11/1520-0442_1994_007_1633_coscta_2_0_co_2.xml.
Guay, C., Minville, M., and Braun, M., 2015, A global portrait of hydrological changes at the 2050 horizon for the province of Québec: Canadian Water Resources Journal/Revue canadienne des ressources hydriques, v. 40, no. 3, p. 285–302, accessed October 4, 2023, at https://doi.org/10.1080/07011784.2015.1043583.
Guswa, A.J., 2008, The influence of climate on root depth—A carbon cost-benefit analysis: Water Resources Research, v. 44, no. 2, 11 p., accessed September 21, 2023, at https://doi.org/10.1029/2007WR006384.
Gutiérrez, J.M., Jones, R.G., Narisma, G.T., Alves, L.M., Amjad, M., Gorodetskaya, I.V., Grose, M., Klutse, N.A.B., Krakovska, S., Li, J., Martínez- Castro, D., Mearns, L.O., Mernild, S.H., Ngo-Duc, T., van den Hurk, B., and Yoon, J.-H., 2021a, Atlas, in Masson-Delmotte, V., P. Zhai, A. Pirani, S.L. Connors, C. Péan, S. Berger, N. Caud, Y. Chen, L. Goldfarb, M.I. Gomis, M. Huang, K. Leitzell, E. Lonnoy, J.B.R. Matthews, T.K. Maycock, T. Waterfield, O. Yelekçi, R. Yu, and B. Zhou, eds., Climate change 2021—The physical science basis—Contribution of Working Group I to the Sixth Assessment Report of the Intergovernmental Panel on Climate Change: Cambridge, United Kingdom, and New York, New York, Cambridge University Press, p. 1927–2058, accessed February 16, 2023, at https://doi.org/10.1017/9781009157896.021 and https://www.ipcc.ch/report/ar6/wg1/chapter/atlas/.
Gutiérrez, J.M., Ranasinghe, R., Ruane, A.C., and Vautard, R., 2021b, Annex VI—Climatic impact-driver and extreme indices, in Masson-Delmotte, V., P. Zhai, A. Pirani, S.L. Connors, C. Péan, S. Berger, N. Caud, Y. Chen, L. Goldfarb, M.I. Gomis, M. Huang, K. Leitzell, E. Lonnoy, J.B.R. Matthews, T.K. Maycock, T. Waterfield, O. Yelekçi, R. Yu, and B. Zhou, eds., Climate change 2021—The physical science basis—Contribution of Working Group I to the Sixth Assessment Report of the Intergovernmental Panel on Climate Change: Cambridge, United Kingdom, and New York, New York, Cambridge University Press, p. 2205–2214, , accessed April 10, 2023, at https://doi.org/10.1017/9781009157896.020 and https://www.ipcc.ch/report/ar6/wg1/downloads/report/IPCC_AR6_WGI_AnnexVI.pdf.
Gutmann, E.D., Rasmussen, R.M., Liu, C., Ikeda, K., Bruyere, C.L., Done, J.M., Garrè, L., Friis-Hansen, P., and Veldore, V., 2018, Changes in hurricanes from a 13-yr convection-permitting pseudo–global warming simulation: Journal of Climate, v. 31, no. 9, p. 3643–3657, accessed July 19, 2023, at https://doi.org/10.1175/JCLI-D-17-0391.1.
Haer, T., Botzen, W.J.W., van Roomen, V., Connor, H., Zavala-Hidalgo, J., Eilander, D.M., and Ward, P.J., 2018, Coastal and river flood risk analyses for guiding economically optimal flood adaptation policies—A country-scale study for Mexico: Philosophical Transactions—Royal Society. Mathematical, Physical, and Engineering Sciences, v. 376, no. 2121, 17 p., accessed December 21, 2023, at https://doi.org/10.1098/rsta.2017.0329.
Haguma, D., Leconte, R., Côté, P., Krau, S., and Brissette, F., 2014, Optimal hydropower generation under climate change conditions for a northern water resources system: Water Resources Management, v. 28, no. 13, p. 4631–4644, accessed December 21, 2023, at https://doi.org/10.1007/s11269-014-0763-3.
Hammond, J.C., Sexstone, G.A., Putman, A.L., Barnhart, T.B., Rey, D.M., Driscoll, J.M., Liston, G.E., Rasmussen, K.L., McGrath, D., Fassnacht, S.R., and Kampf, S.K., 2023, High resolution SnowModel simulations reveal future elevation‐dependent snow loss and earlier, flashier surface water input for the Upper Colorado River Basin: Earth’s Future, v. 11, no. 2, 23 p., accessed September 21, 2023, at https://doi.org/10.1029/2022EF003092.
Hammond, J.C., Simeone, C., Hecht, J.S., Hodgkins, G.A., Lombard, M., McCabe, G., Wolock, D., Wieczorek, M., Olson, C., Caldwell, T., Dudley, R., and Price, A.N., 2022, Going beyond low flows—Streamflow drought deficit and duration illuminate distinct spatiotemporal drought patterns and trends in the U.S. during the last century: Water Resources Research, v. 58, no. 9, 20 p., accessed September 21, 2023, at https://doi.org/10.1029/2022WR031930.
Hare, D.K., Helton, A.M., Johnson, Z.C., Lane, J.W., and Briggs, M.A., 2021, Continental-scale analysis of shallow and deep groundwater contributions to streams: Nature Communications, v. 12, no. 1, 10 p., accessed February 9, 2023, at https://doi.org/10.1038/s41467-021-21651-0.
Harpold, A., Dettinger, M., and Rajagopal, S., 2017, Defining snow drought and why it matters: Eos, v. 98, accessed October 21, 2022 at https://doi.org/10.1029/2017EO068775.
Havel, A., Tasdighi, A., and Arabi, M., 2018, Assessing the hydrologic response to wildfires in mountainous regions: Hydrology and Earth System Sciences, v. 22, no. 4, p. 2527–2550, accessed April 6, 2023, at https://doi.org/10.5194/hess-22-2527-2018.
Hayhoe, K., Wuebbles, D.J., Easterling, D.R., Fahey, D.W., Doherty, S., Kossin, J.P., Sweet, W.V., Vose, R.S., and Wehner, M.F., 2018, Our changing climate, chap. 2 of Reidmiller, D.R., Avery, C.W., Easterling, D.R., Kunkel, K.E., Lewis, K.L.M., Maycock, T.K., and Stewart, B.C., eds., Fourth National Climate Assessment, v. II—Impacts, risks, and adaptation in the United States—Fourth National Climate Assessment v. II: Washington, D.C., U.S. Global Change Research Program, p. 72–144, accessed April 6, 2023, at https://doi.org/10.7930/NCA4.2018.CH2.
Heim, R.R., Jr., 2017, A comparison of the early twenty-first century drought in the United States to the 1930s and 1950s drought episodes: Bulletin of the American Meteorological Society, v. 98, no. 12, p. 2579–2592, accessed April 6, 2023, at https://doi.org/10.1175/BAMS-D-16-0080.1.
Herrera-Estrada, J.E., Martinez, J.A., Dominguez, F., Findell, K.L., Wood, E.F., and Sheffield, J., 2019, Reduced moisture transport linked to drought propagation across North America: Geophysical Research Letters, v. 46, no. 10, p. 5243–5253, accessed December 8, 2022, at https://doi.org/10.1029/2019GL082475.
Hibbard, K.A., Hoffman, F.M., Huntzinger, D., and West, T.O., 2017, Changes in land cover and terrestrial biogeochemistry, chap. 10 of Wuebbles, D.J., Fahey, D.W., Hibbard, K.A., Dokken, D.J., Stewart, B.C., and Maycock, T.K., eds., Climate science special report—Fourth National Climate Assessment, v. I: Washington, D.C., U.S. Global Change Research Program, p. 277–302, accessed November 29, 2023, at https://doi.org/10.7930/J0416V6X.
Hicke, J.A., Lucatello, S., Mortsch, L.D., Dawson, J., Domínguez Aguilar, M., Enquist, C.A.F., Gilmore, E.A., Gutzler, D.S., Harper, S., Holsman, K., Jewett, E.B., Kohler, T.A., and Miller, K.A., 2022, North America, chap. 14 of Pörtner, H.O., Roberts, D.C., Tignor, M., Poloczanska, E.S., Mintenbeck, K., Alegría, A., Craig, M., Langsdorf, S., Löschke, S., Möller, V., Okem, A., and Rama, B., eds., Climate change 2022—Impacts, adaptation, and vulnerability—Contribution of Working Group II to the Sixth Assessment Report of the Intergovernmental Panel on Climate Change: Cambridge, United Kingdom, and New York, New York, Cambridge University Press, p. 1929–2042, accessed February 16, 2023, at https://www.ipcc.ch/report/ar6/wg2/chapter/chapter-14/.
Ho, J.C., and Michalak, A.M., 2019, Exploring temperature and precipitation impacts on harmful algal blooms across continental U.S. lakes: Limnology and Oceanography, v. 65, no. 5, p. 992–1009, accessed October 9, 2023, at https://doi.org/10.1002/lno.11365.
Hock, R., G. Rasul, C. Adler, B. Cáceres, S. Gruber, Y. Hirabayashi, M. Jackson, A. Kääb, S. Kang, S. Kutuzov, Al. Milner, U. Molau, S. Morin, B. Orlove, and H. Steltzer, 2019: High mountain areas chap. 2 of Pörtner, H.-O, Roberts, D.C., Masson-Delmotte, V., Zhai, P., Tignor, M. Poloczanska, E. Mintenbeck, K. Alegría, A. Nicolai, M. Okem, A. Petzold, J. Rama, B. Weyer, N.M., eds., Intergovernmental Panel on Climate Change Special Report on the Ocean and Cryosphere in a Changing Climate: Cambridge, United Kingdom, and New York, New York, Cambridge University Press, p. 131–202, accessed April 10, 2023, at https://www.ipcc.ch/site/assets/uploads/sites/3/2022/03/04_SROCC_Ch02_FINAL.pdf.
Hodgkins, G.A., 2013, The importance of record length in estimating the magnitude of climatic changes—An example using 175 years of lake ice-out dates in New England: Climatic Change, v. 119, nos. 3–4, p. 705–718, accessed July 5, 2023, at https://doi.org/10.1007/s10584-013-0766-8.
Hoerling, M., Quan, X.-W., and Eischeid, J., 2009, Distinct causes for two principal U.S. droughts of the 20th century: Geophysical Research Letters, v. 36, no. 19, 6 p., accessed April 6, 2023, at https://doi.org/10.1029/2009GL039860.
Holden, Z.A., Swanson, A., Luce, C.H., Jolly, W.M., Maneta, M., Oyler, J.W., Warren, D.A., Parsons, R., and Affleck, D., 2018, Decreasing fire season precipitation increased recent western US forest wildfire activity: Proceedings of the National Academy of Sciences of the United States of America, v. 115, no. 36, 9 p., accessed April 10, 2023, at https://doi.org/10.1073/pnas.1802316115.
Houze, R.A., Jr., 2012, Orographic effects on precipitating clouds: Reviews of Geophysics, v. 50, no. 1, 47 p., accessed July 3, 2023, at https://doi.org/10.1029/2011RG000365.
Huang, X., Swain, D.L., and Hall, A.D., 2020, Future precipitation increase from very high resolution ensemble downscaling of extreme atmospheric river storms in California: Science Advances, v. 6, no. 29, 13 p., accessed October 4, 2023, at https://doi.org/10.1126/sciadv.aba1323.
Huning, L.S., and AghaKouchak, A., 2020, Global snow drought hot spots and characteristics: Proceedings of the National Academy of Sciences of the United States of America, v. 117, no. 33, p. 19753–19759, accessed February 16, 2023, at https://doi.org/10.1073/pnas.1915921117.
Iglesias, V., Balch, J.K., and Travis, W.R., 2022, U.S. fires became larger, more frequent, and more widespread in the 2000s: Science Advances, v. 8, no. 11, 10 p., accessed July 3, 2023, at https://doi.org/10.1126/sciadv.abc0020.
Immerzeel, W.W., Lutz, A.F., Andrade, M., Bahl, A., Biemans, H., Bolch, T., Hyde, S., Brumby, S., Davies, B.J., Elmore, A.C., Emmer, A., Feng, M., Fernández, A., Haritashya, U., Kargel, J.S., Koppes, M., Kraaijenbrink, P.D.A., Kulkarni, A.V., Mayewski, P.A., Nepal, S., Pacheco, P., Painter, T.H., Pellicciotti, F., Rajaram, H., Rupper, S., Sinisalo, A., Shrestha, A.B., Viviroli, D., Wada, Y., Xiao, C., Yao, T., and Baillie, J.E.M., 2019, Importance and vulnerability of the world’s water towers: Nature, v. 577, no. 7790, p. 364–369, accessed October 19, 2022, at https://doi.org/10.1038/s41586-019-1822-y.
Intergovernmental Panel on Climate Change, 2021a, Annex VII—Glossary, in Masson-Delmotte, V., Zhai, P., Pirani, A., Connors, S.L., Péan, C., Berger, S., Caud, N., Chen, Y., Goldfarb, L., Gomis, M.I., Huang, M., Leitzell, K., Lonnoy, E., Matthews, J.B.R., Maycock, T.K., Waterfield, T., Yelekçi, O., Yu, R., and Zhou, B. eds., Climate change 2021—The physical science basis—Contribution of Working Group I to the Sixth Assessment Report of the Intergovernmental Panel on Climate Change: Cambridge, United Kingdom, and New York, New York, Cambridge University Press, p. 2215–2256, accessed July 3, 2023, at https://www.ipcc.ch/report/ar6/wg1/downloads/report/IPCC_AR6_WGI_AnnexVII.pdf.
Intergovernmental Panel on Climate Change, 2021b, Climate change 2021—The physical science basis, in Masson-Delmotte, V., Zhai, P., Pirani, A., Connors, S.L., Péan, C., Berger, S., Caud, N., Chen, Y., Goldfarb, L., Gomis, M.I., Huang, M., Leitzell, K., Lonnoy, E., Matthews, J.B.R., Maycock, T.K., Waterfield, T., Yelekçi, O., Yu, R., and Zhou, B., eds., Contribution of Working Group I to the Sixth Assessment Report of the Intergovernmental Panel on Climate Change: Cambridge, United Kingdom, and New York, New York, Cambridge University Press, 2392 p., accessed July 3, 2023, at https://www.ipcc.ch/report/ar6/wg1/.
Intergovernmental Panel on Climate Change, 2021c, Fact sheets, in Masson-Delmotte, V., Zhai, P., Pirani, A., Connors, S.L., Péan, C., Berger, S., Caud, N., Chen, Y., Goldfarb, L., Gomis, M.I., Huang, M., Leitzell, K., Lonnoy, E., Matthews, J.B.R., Maycock, T.K., Waterfield, T., Yelekçi, O., Yu, R., and Zhou, B., eds., Climate change 2021—The physical science basis—Contribution of Working Group I to the Sixth Assessment Report of the Intergovernmental Panel on Climate Change: Cambridge, United Kingdom, and New York, New York, Cambridge University Press, accessed July 3, 2023, at https://www.ipcc.ch/report/ar6/wg1/resources/factsheets.
Intergovernmental Panel on Climate Change, 2021d, Summary for policymakers, in Masson-Delmotte, V., Zhai, P., Pirani, A., Connors, S.L., Péan, C., Berger, S., Caud, N., Chen, Y., Goldfarb, L., Gomis, M.I., Huang, M., Leitzell, K., Lonnoy, E., Matthews, J.B.R., Maycock, T.K., Waterfield, T., Yelekçi, O., Yu, R., and Zhou, B., eds., Climate change 2021—The physical science basis—Contribution of Working Group I to the sixth Assessment Report of the Intergovernmental Panel on Climate Change: Cambridge, United Kingdom, and New York, New York, Cambridge University Press, p. 3–32, accessed October 6, 2023, at https://www.ipcc.ch/report/ar6/wg1/chapter/summary-for-policymakers/.
Intergovernmental Panel on Climate Change, 2022, Climate change 2022—Impacts, adaptation, and vulnerability, in Pörtner, H.-O., Roberts, D.C., Tignor, M., Poloczanska, E.S., Mintenbeck, K., Alegría, A., Craig, M., Langsdorf, S., Löschke, S., Möller, V., Okem, A., and Rama, B., eds., Contribution of Working Group II to the Sixth Assessment Report of the Intergovernmental Panel on Climate Change: Cambridge: United Kingdom, and New York, New York, Cambridge University Press, 3056 p., accessed July 3, 2023, at https://www.ipcc.ch/report/ar6/wg2/.
Intergovernmental Panel on Climate Change, 2023, Summary for policymakers, in The Core Writing Team, Lee, H., and Romero, J., eds., Climate change 2023—Synthesis report—Contribution of Working Groups I, II and III to the Sixth Assessment Report of the Intergovernmental Panel on Climate Change: Geneva, Switzerland, Intergovernmental Panel on Climate Change, p. 1–34, accessed October 6, 2023, at https://www.ipcc.ch/report/ar6/syr/.
Jeong, D.I., and Sushama, L., 2017, Rain-on-snow events over North America based on two Canadian regional climate models: Climate Dynamics, v. 50, nos. 1–2, p. 303–316, accessed February 16, 2023, at https://doi.org/10.1007/s00382-017-3609-x.
Jia, G., Shevliakova, E., Artaxo, P., De Noblet-Ducoudré, N., Houghton, R., House, J., Kitajima, K., Lennard, C., Popp, A., Sirin, A., Sukumar, R., and Verchot, L., 2022, Land–climate interactions, in Shukla, P.R., Skea, J., Calvo Buendia, E., Masson-Delmotte, V., Pörtner, H.-O., Roberts, D.C., Zhai, P., Slade, R., Connors, S., van Diemen, R., Ferrat, M., Haughey, E., Luz, S., Neogi, S., Pathak, M., Petzold, J., Portugal Pereira, J., Vyas, P., Huntley, E., Kissick, K., Belkacemi, M., and Malley, J., eds., Climate change and land—Intergovernmental Panel on Climate Change special report on climate change, desertification, land degradation, sustainable land management, food security, and greenhouse gas fluxes in terrestrial ecosystems: Cambridge, United Kingdom, and New York, New York, Cambridge University Press, p. 131–248, accessed August 6, 2023, at https://www.ipcc.ch/srccl/.
Jiao, W., Wang, L., Smith, W.K., Chang, Q., Wang, H., and D’Odorico, P., 2021, Observed increasing water constraint on vegetation growth over the last three decades: Nature Communications, v. 12, no. 1, 9 p., accessed August 6, 2023, at https://doi.org/10.1038/s41467-021-24016-9.
Johnstone, J.A., and Dawson, T.E., 2010, Climatic context and ecological implications of summer fog decline in the coast redwood region: Proceedings of the National Academy of Sciences of the United States of America, v. 107, no. 10, p. 4533–4538, accessed May 24, 2023, at https://doi.org/10.1073/pnas.0915062107.
Jolly, W.M., Cochrane, M.A., Freeborn, P.H., Holden, Z.A., Brown, T.J., Williamson, G.J., and Bowman, D.M.J.S., 2015, Climate-induced variations in global wildfire danger from 1979 to 2013: Nature Communications, v. 6, no. 1, 11 p., accessed May 22, 2023, at https://doi.org/10.1038/ncomms8537.
Jorgenson, M.T., Harden, J., Kanevskiy, M., O’Donnell, J., Wickland, K., Ewing, S., Manies, K., Zhuang, Q., Shur, Y., Striegl, R., and Koch, J., 2013, Reorganization of vegetation, hydrology and soil carbon after permafrost degradation across heterogeneous boreal landscapes: Environmental Research Letters, v. 8, no. 3, 13 p., accessed July 20, 2023, at https://doi.org/10.1088/1748-9326/8/3/035017.
Jost, G., Moore, R.D., Menounos, B., and Wheate, R., 2012, Quantifying the contribution of glacier runoff to streamflow in the upper Columbia River Basin, Canada: Hydrology and Earth System Sciences, v. 16, no. 3, p. 849–860, accessed October 4, 2023, at https://doi.org/10.5194/hess-16-849-2012.
Kagawa‐Viviani, A.K., and Giambelluca, T.W., 2020, Spatial patterns and trends in surface air temperatures and implied changes in atmospheric moisture across the Hawaiian islands, 1905–2017: Journal of Geophysical Research. Atmospheres, v. 125, no. 2, 17 p., accessed July 3, 2023, at https://doi.org/10.1029/2019JD031571.
Karl, T.R., Groisman, P.Y., Knight, R.W., and Heim, R.R., Jr., 1993, Recent variations of snow cover and snowfall in North America and their relation to precipitation and temperature variations: Journal of Climate, v. 6, no. 7, p. 1327–1344, accessed May 22, 2023, at https://journals.ametsoc.org/view/journals/clim/6/7/1520-0442_1993_006_1327_rvosca_2_0_co_2.xml.
Keys, P.W., Wang-Erlandsson, L., Gordon, L.J., Galaz, V., and Ebbesson, J., 2017, Approaching moisture recycling governance: Global Environmental Change, v. 45, p. 15–23, accessed October 21, 2022, at https://doi.org/10.1016/j.gloenvcha.2017.04.007.
Kim, Y., Kimball, J.S., Glassy, J., and Du, J., 2017, An extended global Earth system data record on daily landscape freeze–thaw status determined from satellite passive microwave remote sensing: Earth System Science Data, v. 9, no. 1, p. 133–147, accessed August 8, 2023, at https://doi.org/10.5194/essd-9-133-2017.
Kirchmeier-Young, M.C., and Zhang, X., 2020, Human influence has intensified extreme precipitation in North America: Proceedings of the National Academy of Sciences of the United States of America, v. 117, no. 24, p. 13308–13313, accessed May 22, 2023, at https://doi.org/10.1073/pnas.1921628117.
Knowles, N., 2015, Trends in snow cover and related quantities at weather stations in the conterminous United States: Journal of Climate, v. 28, no. 19, p. 7518–7528, accessed May 22, 2023, at https://doi.org/10.1175/JCLI-D-15-0051.1.
Knowles, N., Dettinger, M.D., and Cayan, D.R., 2006, Trends in snowfall versus rainfall in the Western United States: Journal of Climate, v. 19, no. 18, p. 4545–4559, accessed May 22, 2023, at https://doi.org/10.1175/JCLI3850.1.
Knutson, T.R., Sirutis, J.J., Zhao, M., Tuleya, R.E., Bender, M., Vecchi, G.A., Villarini, G., and Chavas, D., 2015, Global projections of intense tropical cyclone activity for the late twenty-first century from dynamical downscaling of CMIP5/RCP4.5 scenarios: Journal of Climate, v. 28, no. 18, p. 7203–7224, accessed May 23, 2023, at https://doi.org/10.1175/JCLI-D-15-0129.1.
Konikow, L.F., 2015, Long-term groundwater depletion in the United States: Groundwater, v. 53, no. 1, p. 2–9, accessed February 14, 2023, at https://doi.org/10.1111/gwat.12306.
Konikow, L.F., and Leake, S.A., 2014, Depletion and capture—Revisiting “The source of water derived from wells”: Groundwater, v. 52, no. S1, p. 100–111, accessed February 14, 2023, at https://doi.org/10.1111/gwat.12204.
Kopp, R.E., Easterling, D.R., Hall, T., Hayhoe, K., Horton, R., Kunkel, K.E., and LeGrande, A.N., 2017, Potential surprises—Compound extremes and tipping elements, chap. 15 of Wuebbles, D.J., Fahey, D.W., Hibbard, K.A., Dokken, D.J., Stewart, B.C., and Maycock, T.K., eds., Climate science special report—Fourth National Climate Assessment, v. I: Washington, D.C., U.S. Global Change Research Program, p. 411–429, accessed July 4, 2023, at https://doi.org/10.7930/J0GB227J.
Kopp, R.E., Shwom, R.L., Wagner, G., and Yuan, J., 2016, Tipping elements and climate–economic shocks—Pathways toward integrated assessment: Earth’s Future, v. 4, no. 8, p. 346–372, accessed July 4, 2023, at https://doi.org/10.1002/2016EF000362.
Kormos, P.R., Luce, C.H., Wenger, S.J., and Berghuijs, W.R., 2016, Trends and sensitivities of low streamflow extremes to discharge timing and magnitude in Pacific Northwest mountain streams: Water Resources Research, v. 52, no. 7, p. 4990–5007, accessed May 23, 2023, at https://doi.org/10.1002/2015WR018125.
Kossin, J.P., 2018, A global slowdown of tropical-cyclone translation speed: Nature, v. 558, no. 7708, p. 104–107, accessed December 21, 2023, at https://doi.org/10.1038/s41586-018-0158-3.
Kunkel, K.E., Robinson, D.A., Champion, S., Yin, X., Estilow, T., and Frankson, R.M., 2016, Trends and extremes in Northern Hemisphere snow characteristics: Current Climate Change Reports, v. 2, no. 2, p. 65–73, accessed May 23, 2023, at https://doi.org/10.1007/s40641-016-0036-8.
Lall, U., Johnson, T., Colohan, P., Aghakouchak, A., Arumugam, S., Brown, C., McCabe, G., Pulwarty, R., and Sankarasubramanian, A., 2018, Water, chap. 3 of Reidmiller, D.R., Avery, C.W., Easterling, D.R., Kunkel, K.E., Lewis, K.L.M., Maycock, T.K., and Stewart, B.C., eds., Fourth National Climate Assessment, v. II—Impacts, risks, and adaptation in the United States: Washington, D.C., U.S. Global Change Research Program, p. 145–173, accessed December 11, 2023, at https://doi.org/10.7930/NCA4.2018.CH3.
Lehner, F., Wahl, E.R., Wood, A.W., Blatchford, D.B., and Llewellyn, D., 2017, Assessing recent declines in Upper Rio Grande runoff efficiency from a paleoclimate perspective: Geophysical Research Letters, v. 44, no. 9, p. 4124–4133, accessed May 23, 2023, at https://doi.org/10.1002/2017GL073253.
Lemieux, J.-M., Fortier, R., Talbot-Poulin, M.-C., Molson, J., Therrien, R., Ouellet, M., Banville, D., Cochand, M., and Murray, R., 2016, Groundwater occurrence in cold environments—Examples from Nunavik, Canada: Hydrogeology Journal, v. 24, no. 6, p. 1497–1513, accessed December 7, 2023, at https://doi.org/10.1007/s10040-016-1411-1.
Lenton, T.M., Armstrong McKay, D.I., Loriani, S., Abrams, J.F., Lade, S.J., Donges, J.F., Milkoreit, M., Powell, T., Smith, S.R., Zimm, C., Buxton, J.E., Bailey, E., Laybourn, L., Ghadiali, A., and Dyke, J.G., 2023, The global tipping points report 2023: Exeter, United Kingdom, University of Exeter, accessed December 27, 2023, at https://global-tipping-points.org/.
Lenton, T.M., Held, H., Kriegler, E., Hall, J.W., Lucht, W., Rahmstorf, S., and Schellnhuber, H.J., 2008, Tipping elements in the Earth’s climate system: Proceedings of the National Academy of Sciences of the United States of America, v. 105, no. 6, p. 1786–1793, accessed May 23, 2023, at https://doi.org/10.1073/pnas.0705414105.
Lenton, T.M., Rockström, J., Gaffney, O., Rahmstorf, S., Richardson, K., Steffen, W., and Schellnhuber, H.J., 2019, Climate tipping points—Too risky to bet against: Nature, v. 575, no. 7784, p. 592–595, accessed May 23, 2023, at https://doi.org/10.1038/d41586-019-03595-0.
Lesk, C., Anderson, W., Rigden, A., Coast, O., Jägermeyr, J., McDermid, S., Davis, K.F., and Konar, M., 2022, Compound heat and moisture extreme impacts on global crop yields under climate change: Nature Reviews Earth & Environment, v. 3, no. 12, p. 872–889, accessed November 29, 2023, at https://doi.org/10.1038/s43017-022-00368-8.
Li, D., Wrzesien, M.L., Durand, M., Adam, J., and Lettenmaier, D.P., 2017, How much runoff originates as snow in the western United States, and how will that change in the future?: Geophysical Research Letters, v. 44, no. 12, p. 6163–6172, accessed May 23, 2023, at https://doi.org/10.1002/2017GL073551.
Livneh, B., and Badger, A.M., 2020, Drought less predictable under declining future snowpack: Nature Climate Change, v. 10, no. 5, p. 452–458, accessed August 9, 2023, at https://doi.org/10.1038/s41558-020-0754-8.
Magnuson, J.J., Robertson, D.M., Benson, B.J., Wynne, R.H., Livingstone, D.M., Arai, T., Assel, R.A., Barry, R.G., Card, V., Kuusisto, E., Granin, N.G., Prowse, T.D., Stewart, K.M., and Vuglinski, V.S., 2000, Historical trends in lake and river ice cover in the Northern Hemisphere: Science, v. 289, no. 5,485, p. 1743–1746, accessed December 8, 2022, at https://doi.org/10.1126/science.289.5485.1743.
Mallakpour, I., and Villarini, G., 2015, The changing nature of flooding across the central United States: Nature Climate Change, v. 5, no. 3, p. 250–254, accessed October 21, 2022, at https://doi.org/10.1038/nclimate2516.
Mankin, J.S., Seager, R., Smerdon, J.E., Cook, B.I., and Williams, A.P., 2019, Mid-latitude freshwater availability reduced by projected vegetation responses to climate change: Nature Geoscience, v. 12, no. 12, p. 983–988, accessed November 29, 2023, at https://doi.org/10.1038/s41561-019-0480-x.
Markon, C., Gray, S., Berman, M., Eerkes-Medrano, L., Hennessy, T., Huntington, H.P., Littell, J., McCammon, M., Thoman, R., and Trainor, S.F., 2018, Alaska, chap. 26 of Reidmiller, D.R., Avery, C.W., Easterling, D.R., Kunkel, K.E., Lewis, K.L.M., Maycock, T.K., and Stewart, B.C., eds., Fourth National Climate Assessment, v. II—Impacts, risks, and adaptation in the United States: Washington, D.C., U.S. Global Change Research Program, p. 1185–1241, accessed December 8, 2022, at https://doi.org/10.7930/NCA4.2018.CH26.
Marshall, A.M., Abatzoglou, J.T., Link, T.E., and Tennant, C.J., 2019, Projected changes in interannual variability of peak snowpack amount and timing in the Western United States: Geophysical Research Letters, v. 46, no. 15, p. 8882–8892, accessed May 23, 2023, at https://doi.org/10.1029/2019GL083770.
Martin, J.T., Pederson, G.T., Woodhouse, C.A., Cook, E.R., McCabe, G.J., Anchukaitis, K.J., Wise, E.K., Erger, P.J., Dolan, L., McGuire, M., Gangopadhyay, S., Chase, K.J., Littell, J.S., Gray, S.T., St. George, S., Friedman, J.M., Sauchyn, D.J., St-Jacques, J.-M., and King, J., 2020, Increased drought severity tracks warming in the United States’ largest river basin: Proceedings of the National Academy of Sciences of the United States of America, v. 117, no. 21, p. 11328–11336, accessed December 21, 2023, at https://doi.org/10.1073/pnas.1916208117.
Martínez-Austria, P.F., Vargas-Hidalgo, A., and Patiño-Gómez, C., 2019, Dynamic modelling of the climate change impact in the Conchos River basin water management: Tecnología y Ciencias del Agua, v. 10, no. 1, p. 207–233, accessed December 21, 2023, at https://www.scielo.org.mx/scielo.php?script=sci_arttext&pid=S2007-24222019000100207.
McCabe, G.J., and Clark, M.P., 2005, Trends and variability in snowmelt runoff in the Western United States: Journal of Hydrometeorology, v. 6, no. 4, p. 476–482, accessed August 9, 2023, at https://doi.org/10.1175/JHM428.1.
McCabe, G.J., and Wolock, D.M., 1999, General-circulation-model simulations of future snowpack in the Western United States: Journal of the American Water Resources Association, v. 35, no. 6, p. 1473–1484, accessed August 9, 2023, at https://doi.org/10.1111/j.1752-1688.1999.tb04231.x.
McCabe, G.J., and Wolock, D.M., 2002, A step increase in streamflow in the conterminous United States: Geophysical Research Letters, v. 29, no. 24, p. 38-31–38-34, accessed August 9, 2023, at https://doi.org/10.1029/2002GL015999.
McCabe, G.J., and Wolock, D.M., 2009a, Long-term variability in Northern Hemisphere snow cover and associations with warmer winters: Climatic Change, v. 99, nos. 1–2, p. 141–153, accessed August 9, 2023, at https://doi.org/10.1007/s10584-009-9675-2.
McCabe, G.J., and Wolock, D.M., 2009b, Recent declines in western U.S. snowpack in the context of twentieth-century climate variability: Earth Interactions, v. 13, no. 12, p. 1–15, accessed August 9, 2023, at https://doi.org/10.1175/2009EI283.1.
McCabe, G.J., and Wolock, D.M., 2010, Long-term variability in Northern Hemisphere snow cover and associations with warmer winters: Climatic Change, v. 99, nos. 1–2, p. 141–153, accessed August 9, 2023, at https://doi.org/10.1007/s10584-009-9675-2.
McCabe, G.J., and Wolock, D.M., 2014, Spatial and temporal patterns in conterminous United States streamflow characteristics: Geophysical Research Letters, v. 41, no. 19, p. 6889–6897, accessed August 9, 2023, at https://doi.org/10.1002/2014GL061980.
McCabe, G.J., and Wolock, D.M., 2021, Water balance of the turn-of-the-century drought in the Southwestern United States: Environmental Research Letters, v. 16, no. 4, 9 p., accessed August 9, 2023, at https://doi.org/10.1088/1748-9326/abbfc1.
McCabe, G.J., Wolock, D.M., Pederson, G.T., Woodhouse, C.A., and McAfee, S., 2017, Evidence that recent warming is reducing Upper Colorado River flows: Earth Interactions, v. 21, no. 10, p. 1–14, accessed August 9, 2023, at https://doi.org/10.1175/EI-D-17-0007.1.
McCrary, R.R., and Mearns, L.O., 2019, Quantifying and diagnosing sources of uncertainty in midcentury changes in North American snowpack from NARCCAP: Journal of Hydrometeorology, v. 20, no. 11, p. 2229–2252, accessed May 23, 2023, at https://doi.org/10.1175/JHM-D-18-0248.1.
McDermid, S., Nocco, M., Lawston-Parker, P., Keune, J., Pokhrel, Y., Jain, M., Jägermeyr, J., Brocca, L., Massari, C., Jones, A.D., Vahmani, P., Thiery, W., Yao, Y., Bell, A., Chen, L., Dorigo, W., Hanasaki, N., Jasechko, S., Lo, M.-H., Mahmood, R., Mishra, V., Mueller, N.D., Niyogi, D., Rabin, S.S., Sloat, L., Wada, Y., Zappa, L., Chen, F., Cook, B.I., Kim, H., Lombardozzi, D., Polcher, J., Ryu, D., Santanello, J., Satoh, Y., Seneviratne, S., Singh, D., and Yokohata, T., 2023, Irrigation in the Earth system: Nature Reviews. Earth & Environment, v. 4, no. 7, p. 435–453, accessed November 28, 2023, at https://doi.org/10.1038/s43017-023-00438-5.
McEvoy, D.J., Pierce, D.W., Kalansky, J.F., Cayan, D.R., and Abatzoglou, J.T., 2020, Projected changes in reference evapotranspiration in California and Nevada—Implications for drought and wildland fire danger: Earth’s Future, v. 8, no. 11, 17 p., accessed May 23, 2023, at https://doi.org/10.1029/2020EF001736.
McKenzie, J.M., Kurylyk, B.L., Walvoord, M.A., Bense, V.F., Fortier, D., Spence, C., and Grenier, C., 2021, Invited perspective—What lies beneath a changing Arctic?: The Cryosphere, v. 15, no. 1, p. 479–484, accessed December 7, 2023, at https://doi.org/10.5194/tc-15-479-2021.
Medalie, L., Galanter, A.E., Martinez, A.J., Archer, A.A., Luukkonen, C.L., Harris, M.A., and Haynes, J.V., 2025, Water use across the conterminous United States, water years 2010–20, chap. D of U.S. Geological Survey Integrated Water Availability Assessment—2010–20: U.S. Geological Survey Professional Paper 1894–D, 56 p., https://doi.org/10.3133/pp1894D.
Medellín-Azuara, J., MacEwan, D., Howitt, R.E., Koruakos, G., Dogrul, E.C., Brush, C.F., Kadir, T.N., Harter, T., Melton, F., and Lund, J.R., 2015, Hydro-economic analysis of groundwater pumping for irrigated agriculture in California’s Central Valley, USA: Hydrogeology Journal, v. 23, no. 6, p. 1205–1216, accessed October 9, 2023, at https://doi.org/10.1007/s10040-015-1283-9.
Melton, F.S., Huntington, J., Grimm, R., Herring, J., Hall, M., Rollison, D., Erickson, T., Allen, R., Anderson, M., Fisher, J.B., Kilic, A., Senay, G.B., Volk, J., Hain, C., Johnson, L., Ruhoff, A., Blankenau, P., Bromley, M., Carrara, W., Daudert, B., Doherty, C., Dunkerly, C., Friedrichs, M., Guzman, A., Halverson, G., Hansen, J., Harding, J., Kang, Y., Ketchum, D., Minor, B., Morton, C., Ortega‐Salazar, S., Ott, T., Ozdogan, M., ReVelle, P.M., Schull, M., Wang, C., Yang, Y., and Anderson, R.G., 2021, OpenET—Filling a critical data gap in water management for the Western United States: JAWRA Journal of the American Water Resources Association, v. 58, no. 6, p. 971–994, accessed July 19, 2024, at https://doi.org/10.1111/1752-1688.12956.
Meredith, M., Sommerkorn, M., Cassotta, S., Derksen, C., Ekaykin, A., Hollowed, A., Kofinas, G., Mackintosh, A., Melbourne-Thomas, J., Muelbert, M.M.C., Ottersen, G., Pritchard, H., and Schuur, E.A.G., 2019, Polar regions, chap. 3 of Pörtner, H.-O., Roberts, D.C., Masson-Delmotte, V., Zhai, P., Tignor, M., Poloczanska, E., Mintenbeck, K., Alegría, A., Nicolai, M., Okem, A., Petzold, J., Rama, B., and Weyer, N.M., eds., Intergovernmental Panel on Climate Change special report on the ocean and cryosphere in a changing climate: Cambridge, United Kingdom and New York, New York, Cambridge University Press, p. 203–320, accessed July 3, 2023, at https://doi.org/10.1017/9781009157964.005.
Milly, P.C.D., and Dunne, K.A., 2020, Colorado River flow dwindles as warming-driven loss of reflective snow energizes evaporation: Science, v. 367, no. 6,483, p. 1252–1255, accessed August 17, 2023, at https://doi.org/10.1126/science.aay9187.
Miralles, D.G., Teuling, A.J., van Heerwaarden, C.C., and Vilà-Guerau de Arellano, J., 2014, Mega-heatwave temperatures due to combined soil desiccation and atmospheric heat accumulation: Nature Geoscience, v. 7, no. 5, p. 345–349, accessed May 23, 2023, at https://doi.org/10.1038/ngeo2141.
Molina-Navarro, E., Hallack-Alegría, M., Martínez-Pérez, S., Ramírez-Hernández, J., Mungaray-Moctezuma, A., and Sastre-Merlín, A., 2016, Hydrological modeling and climate change impacts in an agricultural semiarid region—Case study—Guadalupe River Basin, Mexico: Agricultural Water Management, v. 175, p. 29–42, accessed December 21, 2023, at https://doi.org/10.1016/j.agwat.2015.10.029.
Mote, P.W., 2003, Trends in snow water equivalent in the Pacific Northwest and their climatic causes: Geophysical Research Letters, v. 30, no. 12, 4 p., accessed May 23, 2023, at https://doi.org/10.1029/2003GL017258.
Mote, P.W., Hamlet, A.F., Clark, M.P., and Lettenmaier, D.P., 2005, Declining mountain snowpack in Western North America: Bulletin of the American Meteorological Society, v. 86, no. 1, p. 39–50, accessed May 23, 2023, at https://doi.org/10.1175/BAMS-86-1-39.
Mote, P.W., Li, S., Lettenmaier, D.P., Xiao, M., and Engel, R., 2018, Dramatic declines in snowpack in the western US: Climate and Atmospheric Science, v. 1, no. 1, 6 p., accessed May 23, 2023, at https://doi.org/10.1038/s41612-018-0012-1.
Mudryk, L., Santolaria-Otín, M., Krinner, G., Ménégoz, M., Derksen, C., Brutel-Vuilmet, C., Brady, M., and Essery, R., 2020, Historical Northern Hemisphere snow cover trends and projected changes in the CMIP6 multi-model ensemble: The Cryosphere, v. 14, no. 7, p. 2495–2514, accessed May 23, 2023, at https://doi.org/10.5194/tc-14-2495-2020.
Mudryk, L.R., Derksen, C., Howell, S., Laliberté, F., Thackeray, C., Sospedra-Alfonso, R., Vionnet, V., Kushner, P.J., and Brown, R., 2018, Canadian snow and sea ice—Historical trends and projections: The Cryosphere, v. 12, no. 4, p. 1157–1176, accessed May 23, 2023, at https://doi.org/10.5194/tc-12-1157-2018.
Mueller, N.D., Butler, E.E., McKinnon, K.A., Rhines, A., Tingley, M., Holbrook, N.M., and Huybers, P., 2015, Cooling of US Midwest summer temperature extremes from cropland intensification: Nature Climate Change, v. 6, no. 3, p. 317–322, accessed August 09, 2023, at https://doi.org/10.1038/nclimate2825.
Namias, J., 1966, Nature and possible causes of the Northeastern United States drought during 1962–65: Monthly Weather Review, v. 94, no. 9, p. 543–554, accessed July 3, 2023, at https://journals.ametsoc.org/view/journals/mwre/94/9/1520-0493_1966_094_0543_napcot_2_3_co_2.xml.
Natali, S.M., Holdren, J.P., Rogers, B.M., Treharne, R., Duffy, P.B., Pomerance, R., and MacDonald, E., 2021, Permafrost carbon feedbacks threaten global climate goals: Proceedings of the National Academy of Sciences of the United States of America, v. 118, no. 21, 3 p., accessed May 23, 2023, at https://doi.org/10.1073/pnas.2100163118.
National Integrated Drought Information System, 2023, U.S. drought portal: National Oceanic and Atmospheric Administration website, accessed September, 12, 2023, at https://www.drought.gov/.
National Snow and Ice Data Center, 2002, Glacier photograph collection, version 1: Boulder, Colorado, National Snow and Ice Data Center digital glacier photograph database, accessed October 10, 2023, at https://doi.org/10.7265/N5/NSIDC-GPC-2009-12.
Nielsen‐Gammon, J.W., Banner, J.L., Cook, B.I., Tremaine, D.M., Wong, C.I., Mace, R.E., Gao, H., Yang, Z.L., Gonzalez, M.F., Hoffpauir, R., Gooch, T., and Kloesel, K., 2020, Unprecedented drought challenges for Texas water resources in a changing climate—What do researchers and stakeholders need to know?: Earth’s Future, v. 8, no. 8, 20 p., accessed December 21, 2023, at https://doi.org/10.1029/2020EF001552.
Nolan, R.H., Boer, M.M., Collins, L., Resco de Dios, V., Clarke, H., Jenkins, M., Kenny, B., and Bradstock, R.A., 2020, Causes and consequences of eastern Australia’s 2019–20 season of mega‐fires: Global Change Biology, v. 26, no. 3, p. 1039–1041, accessed August 28, 2023, at https://doi.org/10.1111/gcb.14987.
O'Neill, B., van Aalst, M., Zaiton Ibrahim, Z.B.F., L., Bhadwal, S., Buhaug, H., Diaz, D., Frieler, K., Garschagen, M., Magnan, A., Midgley, G., Mirzabaev, A., Thomas, A., and Warren, R., 2022, Key risks across sectors and regions, chap. 16 of Pörtner, H.O., Roberts, D.C., Tignor, M., Poloczanska, E.S., Mintenbeck, K., Alegría, A., Craig, M., Langsdorf, S., Löschke, S., Möller, V., Okem, A., and Rama, B., eds., Climate change 2022—Impacts, adaptation and vulnerability—Contribution of Working Group II to the Sixth Assessment Report of the Intergovernmental Panel on Climate Change: Cambridge, United Kingdom, and New York, New York, Cambridge University Press, p. 2411–2538, accessed June 29, 2023, at https://doi.org/10.1017/9781009325844.025.
Oppenheimer, M., Campos, M., Warren, R., Birkmann, J., Luber, G., O’Neill, B., and Takahashi, K., 2014, Emergent risks and key vulnerabilities, in Field, C.B., Barros, V.R., Dokken, D.J., Mach, K.J., Mastrandrea, M.D., Bilir, T.E., Chatterjee, M., Ebi, K.L., Estrada, Y.O., Genova, R.C., Girma, B., Kissel, E.S., Levy, A.N., MacCracken, S., Mastrandrea, P.R., and White, L.L., eds., Climate change 2014—Impacts, adaptation, and vulnerability—Part A—Global and sectoral aspects—Contribution of Working Group II to the Fifth Assessment Report of the Intergovernmental Panel on Climate Change: Cambridge, United Kingdom, and New York, New York, Cambridge University Press, p. 1039–1099.
Oppenheimer, M., Glavovic, B.C., Hinkel, J., van de Wal, R., Magnan, A., Abd-Elgawad, A., Cai, R., Cifuentes-Jara, M., DeConto, R.M., Ghosh, T., Hay, J., Isla, F., Marzeion, B., Meyssignac, B., and Sebesvari, Z., 2022, Sea level rise and implications for low-lying islands, coasts and communities, chap. 4 of Pörtner, H.-O., Roberts, D.C., Masson-Delmotte, V., Zhai, P., Tignor, M., Poloczanska, E., Mintenbeck, K., Alegría, A., Nicolai, M., Okem, A., Petzold, J., Rama, B., and Weyer, N.M., eds., Intergovernmental Panel on Climate Change special report on the ocean and cryosphere in a changing climate: Cambridge, United Kingdom and New York, New York, Cambridge University Press, p. 321–445, accessed January 16, 2024, at https://doi.org/10.1017/9781009157964.006.
Otkin, J.A., Anderson, M.C., Hain, C., Mladenova, I.E., Basara, J.B., and Svoboda, M., 2013, Examining rapid onset drought development using the thermal infrared–based evaporative stress index: Journal of Hydrometeorology, v. 14, no. 4, p. 1057–1074, accessed July 20, 2023, at https://doi.org/10.1175/JHM-D-12-0144.1.
Otkin, J.A., Anderson, M.C., Hain, C., and Svoboda, M., 2014, Examining the relationship between drought development and rapid changes in the evaporative stress index: Journal of Hydrometeorology, v. 15, no. 3, p. 938–956, accessed July 20, 2023, at https://doi.org/10.1175/JHM-D-13-0110.1.
Overpeck, J.T., and Udall, B., 2020, Climate change and the aridification of North America: Proceedings of the National Academy of Sciences of the United States of America, v. 117, no. 22, p. 11856–11858, accessed February 24, 2023, at https://doi.org/10.1073/pnas.2006323117.
Paredes-Tavares, J., Gómez-Albores, M., Mastachi-Loza, C., Díaz-Delgado, C., Becerril-Piña, R., Martínez-Valdés, H., and Bâ, K., 2018, Impacts of climate change on the irrigation districts of the Rio Bravo Basin: Water, v. 10, no. 3, 20 p., accessed December 21, 2023, at https://doi.org/10.3390/w10030258.
Parmesan, C., Morecroft, M.D., Trisurat, Y., Adrian, R., Anshari, G.Z., Arneth, A., Gao, Q., Gonzalez, P., Harris, R., Price, J., Stevens, N., and Talukdarr, G.H., 2023, Terrestrial and freshwater ecosystems and their services, chap 2. of Pörtner, H.O., Roberts, D.C., Tignor, M., Poloczanska, E.S., Mintenbeck, K., Alegría, A., Craig, M., Langsdorf, S., Löschke, S., Möller, V., Okem, A., and Rama, B., eds., Climate change 2022—Impacts, adaptation, and vulnerability—Contribution of Working Group II to the Sixth Assessment Report of the Intergovernmental Panel on Climate Change: Cambridge, United Kingdom, and New York, New York, Cambridge University Press, p. 197–377, accessed September 19, 2023, at https://doi.org/10.1017/9781009325844.004.
Partridge, T., Winter, J., Kendall, A., Basso, B., Pei, L., and Hyndman, D., 2023, Irrigation benefits outweigh costs in more US croplands by mid-century: Communications Earth & Environment, v. 4, no. 1, 15 p., accessed November 29, 2023, at https://doi.org/10.1038/s43247-023-00889-0.
Pastick, N.J., Jorgenson, M.T., Wylie, B.K., Nield, S.J., Johnson, K.D., and Finley, A.O., 2015, Distribution of near-surface permafrost in Alaska—Estimates of present and future conditions: Remote Sensing of Environment, v. 168, p. 301–315, accessed May 23, 2023, at https://doi.org/10.1016/j.rse.2015.07.019.
Payton, E.A., Pinson, A.O., Asefa, T., Condon, L.E., Dupigny-Giroux, L.-A.L., Harding, B.L., Kiang, J., Lee, D.H., McAfee, S.A., Pflug, J.M., Rangwala, I., Tanana, H.J., and Wright, D.B., 2023, Water, chap. 4 of Crimmins, A.R., Avery, C.W., Easterling, D.R., Kunkel, K.E., Stewart, B.C., and Maycock, T.K., eds., Fifth National Climate Assessment: Washington, D.C., U.S. Global Change Research Program, 46 p., accessed November 14, 2023, at https://doi.org/10.7930/NCA5.2023.CH4.
Pederson, G.T., Betancourt, J.L., and McCabe, G.J., 2013, Regional patterns and proximal causes of the recent snowpack decline in the Rocky Mountains, U.S: Geophysical Research Letters, v. 40, no. 9, p. 1811–1816, accessed August 9, 2023, at https://doi.org/10.1002/grl.50424.
Pederson, G.T., Gray, S.T., Woodhouse, C.A., Betancourt, J.L., Fagre, D.B., Littell, J.S., Watson, E., Luckman, B.H., and Graumlich, L.J., 2011, The unusual nature of recent snowpack declines in the North American Cordillera: Science, v. 333, no. 6,040, p. 332–335, accessed August 9, 2023, at https://doi.org/10.1126/science.1201570.
Pei, L., Moore, N., Zhong, S., Kendall, A.D., Gao, Z., and Hyndman, D.W., 2016, Effects of irrigation on summer precipitation over the United States: Journal of Climate, v. 29, no. 10, p. 3541–3558, accessed November 21, 2023, at https://doi.org/10.1175/JCLI-D-15-0337.1.
Pennino, M.J., Leibowitz, S.G., Compton, J.E., Beyene, M.T., and LeDuc, S.D., 2022, Wildfires can increase regulated nitrate, arsenic, and disinfection byproduct violations and concentrations in public drinking water supplies: Science of the Total Environment, v. 804, p. 149890, accessed March 24, 2023, at https://doi.org/10.1016/j.scitotenv.2021.149890.
Pepin, N.C., Arnone, E., Gobiet, A., Haslinger, K., Kotlarski, S., Notarnicola, C., Palazzi, E., Seibert, P., Serafin, S., Schöner, W., Terzago, S., Thornton, J.M., Vuille, M., and Adler, C., 2022, Climate changes and their elevational patterns in the mountains of the world: Reviews of Geophysics, v. 60, no. 1, 40 p., accessed May 22, 2023, at https://doi.org/10.1029/2020RG000730.
Perlwitz, J., Knutson, T., Kossin, J.P., and LeGrande, A.N., 2017, Large-scale circulation and climate variability, chap. 5 of Wuebbles, D.J., Fahey, D.W., Hibbard, K.A., Dokken, D.J., Stewart, B.C., and Maycock, T.K., eds., Climate science special report—Fourth National Climate Assessment, v. I: Washington, D.C., U.S. Global Change Research Program, p. 161–184, accessed June 29, 2023, at https://doi.org/10.7930/J0RV0KVQ.
Prein, A.F., Holland, G.J., Rasmussen, R.M., Clark, M.P., and Tye, M.R., 2016a, Running dry—The U.S. Southwest’s drift into a drier climate state: Geophysical Research Letters, v. 43, no. 3, p. 1272–1279, accessed October 24, 2023, at https://doi.org/10.1002/2015GL066727.
Prein, A.F., Liu, C., Ikeda, K., Trier, S.B., Rasmussen, R.M., Holland, G.J., and Clark, M.P., 2017, Increased rainfall volume from future convective storms in the US: Nature Climate Change, v. 7, no. 12, p. 880–884, accessed October 24, 2023, at https://doi.org/10.1038/s41558-017-0007-7.
Prein, A.F., Rasmussen, R.M., Ikeda, K., Liu, C., Clark, M.P., and Holland, G.J., 2016b, The future intensification of hourly precipitation extremes: Nature Climate Change, v. 7, no. 1, p. 48–52, accessed October 24, 2023, at https://doi.org/10.1038/nclimate3168.
Qiao, L., Zuo, Z., and Xiao, D., 2022, Evaluation of soil moisture in CMIP6 simulations: Journal of Climate, v. 35, no. 2, p. 779–800, accessed October 19, 2022, at https://doi.org/10.1175/JCLI-D-20-0827.1.
Ralph, F.M., Dettinger, M.D., Rutz, J.J., and Waliser, D.E., eds., 2020, Atmospheric rivers: Springer Nature Switzerland AG, 252 p., accessed July 05, 2023, at https://doi.org/10.1007/978-3-030-28906-5.
Ranasinghe, R., Ruane, A.C., Vautard, R., Arnell, N., Coppola, E., Cruz, F.A., Dessai, S., Islam, A.S., Rahimi, M., Ruiz Carrascal, D., Sillman, J., Sylla, M.B., Tebaldi, C., Wang, W., and Zaaboul, R., 2021, Climate change information for regional impact and for risk assessment, chap. 12 of Masson-Delmotte, V., P. Zhai, A. Pirani, S.L. Connors, C. Péan, S. Berger, N. Caud, Y. Chen, L. Goldfarb, M.I. Gomis, M. Huang, K. Leitzell, E. Lonnoy, J.B.R. Matthews, T.K. Maycock, T. Waterfield, O. Yelekçi, R. Yu, and B. Zhou, eds., Climate change 2021—The physical science basis—Contribution of Working Group I to the Sixth Assessment Report of the Intergovernmental Panel on Climate Change: Cambridge, United Kingdom, and New York, New York, Cambridge University Press, p. 1767–1926, accessed December 8, 2022, at https://www.ipcc.ch/report/ar6/wg1/chapter/chapter-12/.
Ray, P., Wi, S., Schwarz, A., Correa, M., He, M., and Brown, C., 2020, Vulnerability and risk—Climate change and water supply from California’s Central Valley water system: Climatic Change, v. 161, no. 1, p. 177–199, accessed October 9, 2023, at https://doi.org/10.1007/s10584-020-02655-z.
Reisinger, A., Garschagen, M., Mach, K.J., Pathak, M., Poloczanska, E., van Aalst, M., Ruane, A.C., Hoden, M., Hurlber, M., Mintenbeck, K., Pedace, R., Rojas Corradi, M., Viner, D., Vera, C., Kreibiehl, S., O’Neill, B., Pörtner, H.-O., Sillmann, J., Jones, R., and Ranasinghe, R., 2020, The concept of risk in the IPCC Sixth Assessment Report—A summary of cross-working group discussions—Guidance for IPCC authors: Intergovernmental Panel on Climate Change Geneva, Switzerland, 15 p., accessed July 5, 2023, at https://www.ipcc.ch/site/assets/uploads/2021/02/Risk-guidance-FINAL_15Feb2021.pdf.
Reitz, M., Sanford, W.E., and Saxe, S., 2023, Ensemble estimation of historical evapotranspiration for the conterminous U.S: Water Resources Research, v. 59, no. 6, 23 p., accessed October 4, 2023, at https://doi.org/10.1029/2022WR034012.
Rhoades, C.C., Chow, A.T., Covino, T.P., Fegel, T.S., Pierson, D.N., and Rhea, A.E., 2018, The legacy of a severe wildfire on stream nitrogen and carbon in headwater catchments: New York, New York, Ecosystems, v. 22, no. 3, p. 643–657, accessed May 23, 2023, at https://doi.org/10.1007/s10021-018-0293-6.
Rippey, B.R., 2015, The U.S. drought of 2012: Weather and Climate Extremes, v. 10, p. 57–64, accessed November 29, 2023, at https://doi.org/10.1016/j.wace.2015.10.004.
Ripple, W.J., Wolf, C., Lenton, T.M., Gregg, J.W., Natali, S.M., Duffy, P.B., Rockström, J., and Schellnhuber, H.J., 2023, Many risky feedback loops amplify the need for climate action: One Earth, v. 6, no. 2, p. 86–91, accessed November 29, 2023, at https://doi.org/10.1016/j.oneear.2023.01.004.
River Management Joint Operating Committee, 2020, Climate and hydrology datasets for RMJOC long-term planning studies—Second Edition (RMJOC-II) Part II: U.S. Army Corps of Engineers datasets, Portland, Oregon, Columbia River Reservoir Regulation and Operations, Modeling and Analysis, accessed October 09, 2023, at https://usace.contentdm.oclc.org/digital/collection/p266001coll1/id/9936/rec/7.
Rocha, J.C., Peterson, G., Bodin, Ö., and Levin, S., 2018, Cascading regime shifts within and across scales: Science, v. 362, no. 6421, p. 1379-1383, accessed July 17, 2024, at https://doi.org/10.1126/science.aat7850. NA
Rowland, J.C., Schwenk, J.P., Shelef, E., Muss, J., Ahrens, D., Stauffer, S., Pilliouras, A., Crosby, B., Chadwick, A., Douglas, M.M., Kemeny, P.C., Lamb, M.P., Li, G.K., and Vulis, L., 2023, Scale‐dependent influence of permafrost on riverbank erosion rates: Journal of Geophysical Research, Earth Surface, v. 128, no. 7, 26 p., accessed July 20, 2023, at https://doi.org/10.1029/2023JF007101.
Ruane, A.C., Vautard, R., Ranasinghe, R., Sillmann, J., Coppola, E., Arnell, N., Cruz, F.A., Dessai, S., Iles, C.E., Islam, A.K.M.S., Jones, R.G., Rahimi, M., Carrascal, D.R., Seneviratne, S.I., Servonnat, J., Sörensson, A.A., Sylla, M.B., Tebaldi, C., Wang, W., and Zaaboul, R., 2022, The climatic impact‐driver framework for assessment of risk‐relevant climate information: Earth’s Future, v. 10, no. 11, 15 p., accessed January 26, 2023, at https://doi.org/10.1029/2022EF002803.
Ruiz-Vásquez, M., Arias, P.A., Martínez, J.A., and Espinoza, J.C., 2020, Effects of Amazon basin deforestation on regional atmospheric circulation and water vapor transport towards tropical South America: Climate Dynamics, v. 54, nos. 9-10, p. 4169–4189, accessed July 20, 2023, at https://doi.org/10.1007/s00382-020-05223-4.
Rupp, D.E., Mote, P.W., Bindoff, N.L., Stott, P.A., and Robinson, D.A., 2013, Detection and attribution of observed changes in Northern Hemisphere spring snow cover: Journal of Climate, v. 26, no. 18, p. 6904–6914, accessed May 23, 2023, at https://doi.org/10.1175/JCLI-D-12-00563.1.
Russo, T.A., and Lall, U., 2017, Depletion and response of deep groundwater to climate-induced pumping variability: Nature Geoscience, v. 10, no. 2, p. 105–108, accessed December 21, 2023, at https://doi.org/10.1038/ngeo2883.
Safford, H.D., Paulson, A.K., Steel, Z.L., Young, D.J.N., and Wayman, R.B., 2022, The 2020 California fire season—A year like no other, a return to the past or a harbinger of the future?: Global Ecology and Biogeography, v. 31, no. 10, p. 2005–2025, accessed May 23, 2023, at https://doi.org/10.1111/geb.13498.
Saros, J.E., Arp, C.D., Bouchard, F., Comte, J., Couture, R.-M., Dean, J.F., Lafrenière, M., MacIntyre, S., McGowan, S., Rautio, M., Prater, C., Tank, S.E., Walvoord, M., Wickland, K.P., Antoniades, D., Ayala-Borda, P., Canario, J., Drake, T.W., Folhas, D., Hazuková, V., Kivilä, H., Klanten, Y., Lamoureux, S., Laurion, I., Pilla, R.M., Vonk, J.E., Zolkos, S., and Vincent, W.F., 2023, Sentinel responses of Arctic freshwater systems to climate—Linkages, evidence, and a roadmap for future research: Arctic Science, v. 9, no. 2, p. 356–392, accessed December 7, 2023, at https://doi.org/10.1139/as-2022-0021.
Sawaske, S.R., and Freyberg, D.L., 2015, Fog, fog drip, and streamflow in the Santa Cruz Mountains of the California Coast Range: Ecohydrology, v. 8, no. 4, p. 695–713, accessed May 22, 2023, at https://doi.org/10.1002/eco.1537.
Schenk, H.J., and Jackson, R.B., 2002, The global biogeography of roots: Ecological Monographs, v. 72, no. 3, p. 311–328, accessed September 21, 2023, at https://doi.org/10.1890/0012-9615(2002)072[0311:TGBOR]2.0.CO;2.
Scholl, M.A., Bassiouni, M., and Torres-Sánchez, A.J., 2021, Drought stress and hurricane defoliation influence mountain clouds and moisture recycling in a tropical forest: Proceedings of the National Academy of Sciences of the United States of America, v. 118, no. 7, 8 p., accessed July 3, 2023, at https://doi.org/10.1073/pnas.2021646118.
Scott, K.M., 1978, Effects of permafrost on stream channel behavior in Arctic Alaska: U.S. Geological Survey Professional Paper 1068, 19 p., accessed July 20, 2023, at https://doi.org/10.3133/pp1068.
Seager, R., Nakamura, J., and Ting, M., 2019, Mechanisms of seasonal soil moisture drought onset and termination in the southern Great Plains: Journal of Hydrometeorology, v. 20, no. 4, p. 751–771, accessed July 20, 2023, at https://doi.org/10.1175/JHM-D-18-0191.1.
Seager, R., Pederson, N., Kushnir, Y., Nakamura, J., and Jurburg, S., 2012, The 1960s drought and the subsequent shift to a wetter climate in the Catskill Mountains region of the New York City watershed: Journal of Climate, v. 25, no. 19, p. 6721–6742, accessed July 20, 2023, at https://doi.org/10.1175/JCLI-D-11-00518.1.
Senay, G.B., Friedrichs, M., Morton, C., Parrish, G.E.L., Schauer, M., Khand, K., Kagone, S., Boiko, O., and Huntington, J., 2022, Mapping actual evapotranspiration using Landsat for the conterminous United States—Google Earth Engine implementation and assessment of the SSEBop model: Remote Sensing of Environment, v. 275, 52 p., accessed October 5, 2023, at https://doi.org/10.1016/j.rse.2022.113011.
Seneviratne, S.I., Zhang, X., Adnan, M., Badi, W., Dereczynski, C., Di Luca, A., Ghosh, S., Iskandar, I., Kossin, J., Lewis, S., Otto, F., Pinto, I., Satoh, M., Vicente-Serrano, S.M., Wehner, M., and Zhou, B., 2021, Weather and climate extreme events in a changing climate, chap. 11 of Masson-Delmotte, V., Zhai, P., Pirani, A., Connors, S.L., Péan, C., Berger, S., Caud, N., Chen, Y., Goldfarb, L., Gomis, M.I., Huang, M., Leitzell, K., Lonnoy, E., Matthews, J.B.R., Maycock, T.K., Waterfield, T., Yelekçi, O., Yu, R., and Zhou, B., eds., Climate change 2021—The physical science basis—Contribution of Working Group I to the Sixth Assessment Report of the Intergovernmental Panel on Climate Change: Cambridge, United Kingdom, and New York, New York, Cambridge University Press, p. 1513–1766, accessed November 21, 2023, at https://doi.org/10.1017/9781009157896.013.
Sharma, A., Wasko, C., and Lettenmaier, D.P., 2018, If precipitation extremes are increasing, why aren’t floods?: Water Resources Research, v. 54, no. 11, p. 8545–8551, accessed November 15, 2023, at https://doi.org/10.1029/2018WR023749.
Siler, N., Proistosescu, C., and Po‐Chedley, S., 2019, Natural variability has slowed the decline in Western U.S. snowpack since the 1980s: Geophysical Research Letters, v. 46, no. 1, p. 346–355, accessed May 21, 2023, at https://doi.org/10.1029/2018GL081080.
Siler, N., and Roe, G., 2014, How will orographic precipitation respond to surface warming? An idealized thermodynamic perspective: Geophysical Research Letters, v. 41, no. 7, p. 2606–2613, accessed May 21, 2023, at https://doi.org/10.1002/2013GL059095.
Sinha, E., Michalak, A.M., and Balaji, V., 2017, Eutrophication will increase during the 21st century as a result of precipitation changes: Science, v. 357, no. 6,349, p. 405–408, accessed October 4, 2023, at https://doi.org/10.1126/science.aan2409.
Slater, A.G., and Lawrence, D.M., 2013, Diagnosing present and future permafrost from climate models: Journal of Climate, v. 26, no. 15, p. 5608–5623, accessed December 27, 2023, at https://doi.org/10.1175/JCLI-D-12-00341.1.
Slater, L.J., and Villarini, G., 2016, Recent trends in U.S. flood risk: Geophysical Research Letters, v. 43, no. 24, p. 12428–12436, accessed December 27, 2023, at https://doi.org/10.1002/2016GL071199.
Smith, C., Baker, J.C.A., and Spracklen, D.V., 2023, Tropical deforestation causes large reductions in observed precipitation: Nature, v. 615, no. 7,951, p. 270–275, accessed May 23, 2023, at https://doi.org/10.1038/s41586-022-05690-1.
Solander, K.C., Bennett, K.E., Fleming, S.W., Gutzler, D.S., Hopkins, E.M., and Middleton, R.S., 2018, Interactions between climate change and complex topography drive observed streamflow changes in the Colorado River Basin: Journal of Hydrometeorology, v. 19, no. 10, p. 1637–1650, accessed October 4, 2023, at https://doi.org/10.1175/JHM-D-18-0012.1.
Spracklen, D.V., and Garcia-Carreras, L., 2015, The impact of Amazonian deforestation on Amazon basin rainfall: Geophysical Research Letters, v. 42, no. 21, p. 9546–9552, accessed May 23, 2023, at https://doi.org/10.1002/2015GL066063.
Stahle, D.W., Cook, E.R., Cleaveland, M.K., Therrell, M.D., Meko, D.M., Grissino-Mayer, H.D., Watson, E., and Luckman, B.H., 2000, Tree-ring data document 16th century megadrought over North America: Eos, v. 81, no. 12, p. 121–125, accessed May 23, 2023, at https://doi.org/10.1029/00EO00076.
Steinschneider, S., and Najibi, N., 2022, Observed and projected scaling of daily extreme precipitation with dew point temperature at annual and seasonal scales across the northeastern United States: Journal of Hydrometeorology, v. 23, no. 3, p. 403–419, accessed July 5, 2023, at https://doi.org/10.1175/JHM-D-21-0183.1.
Stephens, G.L., Slingo, J.M., Rignot, E., Reager, J.T., Hakuba, M.Z., Durack, P.J., Worden, J., and Rocca, R., 2020, Earth’s water reservoirs in a changing climate: Proceedings of the Royal Society A—Mathematical, Physical and Engineering Sciences, v. 476, 34 p., accessed October 19, 2022, at https://doi.org/10.1098/rspa.2019.0458.
Stets, E., Archer, A.A., Degnan, J.R., Erickson, M.L., Gorski, G., Medalie, L, and Scholl, M.A., 2025a, The national integrated water availability assessment, water years 2010–20, chap. A of U.S. Geological Survey Integrated Water Availability Assessment—2010–20: U.S. Geological Survey Professional Paper 1894–A, 24 p., https://doi.org/10.3133/pp1894A.
Stets, E., Cashman, M.J., Miller, O.L., and Powlen, K.A., 2025b, Integrated water availability in the conterminous United States, 2010–20, chap. F of U.S. Geological Survey Integrated Water Availability Assessment—2010–20: U.S. Geological Survey Professional Paper 1894–F, 41 p., https://doi.org/10.3133/pp1894F.
Stewart, I.T., Cayan, D.R., and Dettinger, M.D., 2004, Changes in snowmelt runoff timing in western North America under a ‘business as usual’ climate change scenario: Climatic Change, v. 62, nos. 1–3, p. 217–232, accessed May 23, 2023, at https://doi.org/10.1023/B:CLIM.0000013702.22656.e8.
Svoboda, M., LeComte, D., Hayes, M., Heim, R., Gleason, K., Angel, J., Rippey, B., Tinker, R., Palecki, M., Stooksbury, D., Miskus, D., and Stephens, S., 2002, The drought monitor: Bulletin of the American Meteorological Society, v. 83, no. 8, p. 1181–1190, accessed July 20, 2023, at https://doi.org/10.1175/1520-0477-83.8.1181.
Tam, B.Y., Szeto, K., Bonsal, B., Flato, G., Cannon, A.J., and Rong, R., 2018, CMIP5 drought projections in Canada based on the Standardized Precipitation Evapotranspiration Index: Canadian Water Resources Journal/Revue canadienne des ressources hydriques, v. 44, no. 1, p. 90–107, accessed December 21, 2023, at https://doi.org/10.1080/07011784.2018.1537812.
Taylor, P.C., Maslowski, W., Perlwitz, J., and Wuebbles, D.J., 2017, Arctic changes and their effects on Alaska and the rest of the United States, chap. 11 of Wuebbles, D.J., Fahey, D.W., Hibbard, K.A., Dokken, D.J., Stewart, B.C., and Maycock, T.K., eds., Climate science special report—Fourth National Climate Assessment, v. I: Washington, D.C., U.S. Global Change Research Program, p. 303–332, accessed June 30, 2023, at https://doi.org/10.7930/J00863GK.
Taylor, R.G., Scanlon, B., Döll, P., Rodell, M., van Beek, R., Wada, Y., Longuevergne, L., Leblanc, M., Famiglietti, J.S., Edmunds, M., Konikow, L., Green, T.R., Chen, J., Taniguchi, M., Bierkens, M.F.P., MacDonald, A., Fan, Y., Maxwell, R.M., Yechieli, Y., Gurdak, J.J., Allen, D.M., Shamsudduha, M., Hiscock, K., Yeh, P.J.F., Holman, I., and Treidel, H., 2013, Ground water and climate change: Nature Climate Change, v. 3, no. 4, p. 322–329, accessed June 30, 2023, at https://doi.org/10.1038/nclimate1744.
te Wierik, S.A., Cammeraat, E.L.H., Gupta, J., and Artzy‐Randrup, Y.A., 2021, Reviewing the impact of land use and land‐use change on moisture recycling and precipitation patterns: Water Resources Research, v. 57, no. 7, 19 p., accessed October 21, 2022, at https://doi.org/10.1029/2020WR029234.
Teckentrup, L., Harrison, S.P., Hantson, S., Heil, A., Melton, J.R., Forrest, M., Li, F., Yue, C., Arneth, A., Hickler, T., Sitch, S., and Lasslop, G., 2019, Response of simulated burned area to historical changes in environmental and anthropogenic factors—A comparison of seven fire models: Biogeosciences, v. 16, no. 19, p. 3883–3910, accessed May 23, 2023, at https://doi.org/10.5194/bg-16-3883-2019.
Torregrosa, A., Flint, L.E., and Flint, A.L., 2019, Hydrologic resilience from summertime fog and recharge—A case study for coho salmon recovery planning: Journal of the American Water Resources Association, v. 56, no. 1, p. 134–160, accessed May 22, 2023, at https://doi.org/10.1111/1752-1688.12811.
Turner, S.W.D., Voisin, N., Fazio, J., Hua, D., and Jourabchi, M., 2019, Compound climate events transform electrical power shortfall risk in the Pacific Northwest: Nature Communications, v. 10, no. 1, 8 p., accessed December 21, 2023, at https://doi.org/10.1038/s41467-018-07894-4.
Udall, B., and Overpeck, J., 2017, The twenty-first century Colorado River hot drought and implications for the future: Water Resources Research, v. 53, no. 3, p. 2404–2418, accessed May 23, 2023, at https://doi.org/10.1002/2016WR019638.
Uhl, A., Hahn, H.J., Jäger, A., Luftensteiner, T., Siemensmeyer, T., Döll, P., Noack, M., Schwenk, K., Berkhoff, S., Weiler, M., Karwautz, C., and Griebler, C., 2022, Making waves—Pulling the plug—Climate change effects will turn gaining into losing streams with detrimental effects on groundwater quality: Water Research, v. 220, 5 p., accessed December 07, 2022, at https://doi.org/10.1016/j.watres.2022.118649.
Ullrich, P.A., Xu, Z., Rhoades, A.M., Dettinger, M.D., Mount, J.F., Jones, A.D., and Vahmani, P., 2018, California’s drought of the future—A midcentury recreation of the exceptional conditions of 2012–2017: Earth’s Future, v. 6, no. 11, p. 1568–1587, accessed October 9, 2023, at https://doi.org/10.1029/2018EF001007.
U.S. Drought Monitor, 2023, U.S. drought monitor tutorial: National Drought Mitigation Center, University of Nebraska-Lincoln, accessed September 14, 2023, at https://drought.unl.edu/Education/Tutorials/Usdm.aspx.
U.S. Environmental Protection Agency, 2023, Climate change indicators—Freeze-thaw conditions: U.S. Environmental Protection Agency USEPA Climate Change Indicators, accessed May 14, 2023, at https://www.epa.gov/climate-indicators/climate-change-indicators-freeze-thaw-conditions.
U.S. Geological Survey, 2023, Repeat photography project: U.S. Geological Survey Northern Rocky Mountain Science Center web page, accessed October 10, 2023, at https://www.usgs.gov/centers/norock/science/repeat-photography-project.
U.S. Geological Survey, 2024, USGS water data for the Nation, U.S. Geological Survey, accessed August 2, 2024, at https://waterdata.usgs.gov/nwis.
U.S. Global Change Research Program, 2017, Climate science special report—Fourth National Climate Assessment, v. I, in Wuebbles, D.J., Fahey, D.W., Hibbard, K.A., Dokken, D.J., Stewart, B.C., and Maycock, T.K., eds.: Washington, D.C., U.S. Global Change Research Program, 470 p., accessed October 21, 2022, at https://science2017.globalchange.gov/.
U.S. Global Change Research Program, 2018, Fourth National Climate Assessment, v. II, in Reidmiller, D.R., Avery, C.W., Easterling, D.R., Kunkel, K.E., Lewis, K.L.M., Maycock, T.K., and Stewart, B.C., eds., Impacts, risks, and adaptation in the United States—Fourth National Climate Assessment, v. II: Washington, D.C., U.S. Global Change Research Program, 1526 p., accessed August 11, 2023, at https://doi.org/10.7930/NCA4.2018.
U.S. Global Change Research Program, 2023, Fifth National Climate Assessment, in Crimmins, A.R., Avery, C.W., Easterling, D.R., Kunkel, K.E., Stewart, B.C., and Maycock, T.K., eds., Fifth National Climate Assessment: Washington, D.C., U.S. Global Change Research Program, accessed September 22, 2023, at https://doi.org/10.7930/NCA5.2023.
van der Ent, R.J., Savenije, H.H.G., Schaefli, B., and Steele-Dunne, S.C., 2010, Origin and fate of atmospheric moisture over continents: Water Resources Research, v. 46, no. 9, 12 p., accessed July 3, 2023, at https://doi.org/10.1029/2010WR009127.
Vano, J.A., Udall, B., Cayan, D.R., Overpeck, J.T., Brekke, L.D., Das, T., Hartmann, H.C., Hidalgo, H.G., Hoerling, M., McCabe, G.J., Morino, K., Webb, R.S., Werner, K., and Lettenmaier, D.P., 2014, Understanding uncertainties in future Colorado River streamflow: Bulletin of the American Meteorological Society, v. 95, no. 1, p. 59–78, accessed May 23, 2023, at https://doi.org/10.1175/BAMS-D-12-00228.1.
Viviroli, D., Kummu, M., Meybeck, M., Kallio, M., and Wada, Y., 2020, Increasing dependence of lowland populations on mountain water resources: Nature Sustainability, v. 3, no. 11, p. 917–928, accessed December 8, 2023, at https://doi.org/10.1038/s41893-020-0559-9.
Vose, R.S., Applequist, S., Squires, M., Durre, I., Menne, M.J., Williams, C.N., Fenimore, C., Gleason, K., and Arndt, D., 2014, Improved historical temperature and precipitation time series for U.S. climate divisions: Journal of Applied Meteorology and Climatology, v. 53, no. 5, p. 1232–1251, accessed June 29, 2023, at https://doi.org/10.1175/JAMC-D-13-0248.1.
Vuille, M., Carey, M., Huggel, C., Buytaert, W., Rabatel, A., Jacobsen, D., Soruco, A., Villacis, M., Yarleque, C., Elison Timm, O., Condom, T., Salzmann, N., and Sicart, J.-E., 2018, Rapid decline of snow and ice in the tropical Andes—Impacts, uncertainties and challenges ahead: Earth-Science Reviews, v. 176, p. 195–213, accessed May 23, 2023, at https://doi.org/10.1016/j.earscirev.2017.09.019.
Walsh, K.J.E., Camargo, S.J., Vecchi, G.A., Daloz, A.S., Elsner, J., Emanuel, K., Horn, M., Lim, Y.-K., Roberts, M., Patricola, C., Scoccimarro, E., Sobel, A.H., Strazzo, S., Villarini, G., Wehner, M., Zhao, M., Kossin, J.P., LaRow, T., Oouchi, K., Schubert, S., Wang, H., Bacmeister, J., Chang, P., Chauvin, F., Jablonowski, C., Kumar, A., Murakami, H., Ose, T., Reed, K.A., Saravanan, R., Yamada, Y., Zarzycki, C.M., Vidale, P.L., Jonas, J.A., and Henderson, N., 2015, Hurricanes and climate—The U.S. CLIVAR working group on hurricanes: Bulletin of the American Meteorological Society, v. 96, no. 6, p. 997–1017, accessed May 23, 2023, at https://doi.org/10.1175/BAMS-D-13-00242.1.
Walvoord, M.A., and Striegl, R.G., 2021, Complex vulnerabilities of the water and aquatic carbon cycles to permafrost thaw: Frontiers in Climate, v. 3, 15 p., accessed December 7, 2023, at https://doi.org/10.3389/fclim.2021.730402.
Wang, J., Bai, X., Hu, H., Clites, A., Colton, M., and Lofgren, B., 2012, Temporal and spatial variability of Great Lakes ice cover, 1973–2010: Journal of Climate, v. 25, no. 4, p. 1318–1329, accessed August 8. 2023, at https://doi.org/10.1175/2011JCLI4066.1.
Wang, X.L., Feng, Y., Compo, G.P., Swail, V.R., Zwiers, F.W., Allan, R.J., and Sardeshmukh, P.D., 2012, Trends and low frequency variability of extra-tropical cyclone activity in the ensemble of twentieth century reanalysis: Climate Dynamics, v. 40, nos. 11–12, p. 2775–2800, accessed May 23, 2023, at https://doi.org/10.1007/s00382-012-1450-9.
Wehner, M.F., Arnold, J.R., Knutson, T., Kunkel, K.E., and LeGrande, A.N., 2017, Droughts, floods, and wildfires, chap. 8 of Wuebbles, D.J., Fahey, D.W., Hibbard, K.A., and Dokken, D.J., eds., Climate science special report—Fourth National Climate Assessment, v. I: Washington, D.C., U.S. Global Change Research Program, p. 231–256, accessed October 19, 2022, at https://doi.org/10.7930/J0CJ8BNN.
Wehner, M.F., Reed, K.A., Loring, B., Stone, D., and Krishnan, H., 2018, Changes in tropical cyclones under stabilized 1.5 and 2.0 °C global warming scenarios as simulated by the Community Atmospheric Model under the HAPPI protocols: Earth System Dynamics, v. 9, no. 1, p. 187–195, accessed October 19, 2022, at https://doi.org/10.5194/esd-9-187-2018.
Williams, A.P., Cook, E.R., Smerdon, J.E., Cook, B.I., Abatzoglou, J.T., Bolles, K., Baek, S.H., Badger, A.M., and Livneh, B., 2020, Large contribution from anthropogenic warming to an emerging North American megadrought: Science, v. 368, no. 6,488, p. 314–318, accessed October 19, 2022, at https://doi.org/10.1126/science.aaz9600.
Williams, A.P., Gentine, P., Moritz, M.A., Roberts, D.A., and Abatzoglou, J.T., 2018, Effect of reduced summer cloud shading on evaporative demand and wildfire in coastal southern California: Geophysical Research Letters, v. 45, no. 11, p. 5653–5662, accessed October 19, 2022, at https://doi.org/10.1029/2018GL077319.
Williams, A.P., Livneh, B., McKinnon, K.A., Hansen, W.D., Mankin, J.S., Cook, B.I., Smerdon, J.E., Varuolo-Clarke, A.M., Bjarke, N.R., Juang, C.S., and Lettenmaier, D.P., 2022, Growing impact of wildfire on western US water supply: Proceedings of the National Academy of Sciences of the United States of America, v. 119, no. 10, 8 p., accessed October 19, 2022, at https://doi.org/10.1073/pnas.2114069119.
Williams, A.P., Schwartz, R.E., Iacobellis, S., Seager, R., Cook, B.I., Still, C.J., Husak, G., and Michaelsen, J., 2015, Urbanization causes increased cloud base height and decreased fog in coastal southern California: Geophysical Research Letters, v. 42, no. 5, p. 1527–1536, accessed October 19, 2022, at https://doi.org/10.1002/2015GL063266.
Wobus, C., Zheng, P., Stein, J., Lay, C., Mahoney, H., Lorie, M., Mills, D., Spies, R., Szafranski, B., and Martinich, J., 2019, Projecting changes in expected annual damages from riverine flooding in the United States: Earth’s Future, v. 7, no. 5, p. 516–527, accessed December 21, 2023, at https://doi.org/10.1029/2018EF001119.
Woodhouse, C.A., and Overpeck, J.T., 1998, 2000 years of drought variability in the central United States: Bulletin of the American Meteorological Society, v. 79, no. 12, p. 2693–2714, accessed May 23, 2023, at https://journals.ametsoc.org/view/journals/bams/79/12/1520-0477_1998_079_2693_yodvit_2_0_co_2.xml.
Woodhouse, C.A., Pederson, G.T., Morino, K., McAfee, S.A., and McCabe, G.J., 2016, Increasing influence of air temperature on upper Colorado River streamflow: Geophysical Research Letters, v. 43, no. 5, p. 2174–2181, accessed May 23, 2023, at https://doi.org/10.1002/2015GL067613.
Woodhouse, C.A., Russell, J.L., and Cook, E.R., 2009, Two modes of North American drought from instrumental and paleoclimatic data: Journal of Climate, v. 22, no. 16, p. 4336–4347, accessed May 23, 2023, at https://doi.org/10.1175/2009JCLI2705.1.
Woodhouse, C.A., Smith, R.M., McAfee, S.A., Pederson, G.T., McCabe, G.J., Miller, W.P., and Csank, A., 2021, Upper Colorado River Basin 20th century droughts under 21st century warming—Plausible scenarios for the future: Climate Services, v. 21, 11 p., accessed May 23, 2023, at https://doi.org/10.1016/j.cliser.2020.100206.
Yao, F., Livneh, B., Rajagopalan, B., Wang, J., Crétaux, J.-F., Wada, Y., and Berge-Nguyen, M., 2023, Satellites reveal widespread decline in global lake water storage: Science, v. 380, no. 6,646, p. 743–749, accessed May 21, 2023, at https://doi.org/10.1126/science.abo2812.
Yuan, S., and Quiring, S.M., 2016, Comparison of three methods of interpolating soil moisture in Oklahoma: International Journal of Climatology, v. 37, no. 2, p. 987–997, accessed October 19, 2022, at https://doi.org/10.1002/joc.4754.
Yuan, W., Zheng, Y., Piao, S., Ciais, P., Lombardozzi, D., Wang, Y., Ryu, Y., Chen, G., Dong, W., Hu, Z., Jain, A.K., Jiang, C., Kato, E., Li, S., Lienert, S., Liu, S., Nabel, J.E.M.S., Qin, Z., Quine, T., Sitch, S., Smith, W.K., Wang, F., Wu, C., Xiao, Z., and Yang, S., 2019, Increased atmospheric vapor pressure deficit reduces global vegetation growth: Science Advances, v. 5, no. 8, 12 p., accessed October 19, 2022, at https://doi.org/10.1126/sciadv.aax1396.
Zemp, D.C., Schleussner, C.-F., Barbosa, H.M.J., Hirota, M., Montade, V., Sampaio, G., Staal, A., Wang-Erlandsson, L., and Rammig, A., 2017, Self-amplified Amazon forest loss due to vegetation-atmosphere feedbacks: Nature Communications, v. 8, no. 1, 10 p., accessed July 4, 2023, at https://doi.org/10.1038/ncomms14681.
Zhang, R., Wang, H., Fu, Q., Rasch, P.J., and Wang, X., 2019, Unraveling driving forces explaining significant reduction in satellite-inferred Arctic surface albedo since the 1980s: Proceedings of the National Academy of Sciences of the United States of America, v. 116, no. 48, p. 23947–23953, accessed November 13, 2022, at https://doi.org/10.1073/pnas.1915258116.
Zhang, Y., Wolfe, S.A., Morse, P.D., Olthof, I., and Fraser, R.H., 2015, Spatiotemporal impacts of wildfire and climate warming on permafrost across a subarctic region, Canada: Journal of Geophysical Research. Earth Surface, v. 120, no. 11, p. 2338–2356, accessed November 13, 2022, at https://doi.org/10.1002/2015JF003679.
Zhang, Y., Zheng, H., Zhang, X., Leung, L.R., Liu, C., Zheng, C., Guo, Y., Chiew, F.H.S., Post, D., Kong, D., Beck, H.E., Li, C., and Blöschl, G., 2023, Future global streamflow declines are probably more severe than previously estimated: Nature Water, v. 1, no. 3, p. 261–271, accessed November 13, 2022, at https://doi.org/10.1038/s44221-023-00030-7.
Zhou, S., Williams, A.P., Berg, A.M., Cook, B.I., Zhang, Y., Hagemann, S., Lorenz, R., Seneviratne, S.I., and Gentine, P., 2019, Land–atmosphere feedbacks exacerbate concurrent soil drought and atmospheric aridity: Proceedings of the National Academy of Sciences of the United States of America, v. 116, no. 38, p. 18848–18853, accessed November 15, 2023, at https://doi.org/10.1073/pnas.1904955116.
Zipper, S.C., Farmer, W.H., Brookfield, A., Ajami, H., Reeves, H.W., Wardropper, C., Hammond, J.C., Gleeson, T., and Deines, J.M., 2022, Quantifying streamflow depletion from groundwater pumping—A practical review of past and emerging approaches for water management: Journal of the American Water Resources Association, v. 58, no. 2, p. 289–312, accessed May 23, 2023, at https://doi.org/10.1111/1752-1688.12998.
Glossary
- Adaptation
“In human systems, the process of adjustment to actual or expected climate and its effects, in order to moderate harm or exploit beneficial opportunities. In natural systems, the process of adjustment to actual climate and its effects; human intervention may facilitate adjustment to expected climate and its effects.” (Intergovernmental Panel on Climate Change [IPCC] Glossary; Intergovernmental Panel on Climate Change, 2021b, p. 2216.)
- Aridity
The degree to which a regional climate is characterized by a lack of available water necessary to promote life, measured by long-term average precipitation supply and evapotranspiration demand.
- Atmospheric Evaporative Demand
(also PET; atmospheric demand) is the amount of water vapor that the atmosphere can hold at saturation for a specific temperature and pressure. It is calculated with an evapotranspiration formulation that generally includes a reference crop coefficient, and temperature, humidity, wind speed, and incoming solar radiation.
- Attribution
Attribution is defined as the process of evaluating the relative contributions of multiple causal factors to a change or event with an assessment of confidence (see “Confidence” entry; from Intergovernmental Panel on Climate Change, 2021a).
- CID
Climatic impact driver. These are physical-climate system conditions such as means, extremes, or events that can impact humans and (or) ecosystems across system elements, regions, and societal sectors. There are seven CID types: (1) heat and cold; (2) wet and dry; (3) wind; (4) snow and ice; (5) coastal; (6) open ocean, and (7) other. Several of these types directly relate to the water cycle. For example, some of the wet and dry type CIDs are mean precipitation, fire weather, and agricultural and ecosystem drought. Example sectors include (1) terrestrial and freshwater ecosystems and their services; (2) water; and (3) cities, settlements, and key infrastructure (Ranasinghe and others, 2021, table 12.2).
- Climate prediction
A climate prediction or climate forecast is the result of an attempt to produce (starting from a particular state of the climate system) an estimate of the actual evolution of the climate in the future; for example, at seasonal, interannual or decadal time scales. Because the future evolution of the climate system may be highly sensitive to initial conditions, has chaotic elements, and is subject to natural variability, such predictions are usually probabilistic in nature (from Intergovernmental Panel on Climate Change, 2021a).
- Climate projection
Simulated response of the climate system to a scenario of future emissions or concentrations of greenhouse gases and aerosols and changes in land use, generally derived using climate models. Climate projections are distinguished from climate predictions by their dependence on the emission/concentration/radiative forcing scenario used, which is in turn based on assumptions concerning, for example, future socioeconomic and technological developments that may or may not be realized (from Intergovernmental Panel on Climate Change, 2021a).
- CMIP6
Coupled Model Intercomparison Project Phase 6. A climate modelling activity from the World Climate Research Programme, which coordinates and archives climate model simulations based on shared model inputs by modelling groups from around the world. The CMIP Phase 3 (CMIP3) multi-model dataset includes projections using Special Report on Emissions Scenarios. The CMIP Phase 5 (CMIP5) dataset includes projections using the Representative Concentration Pathways (RCPs). The CMIP6 phase involves a suite of common model experiments as well as an ensemble of CMIP-endorsed Model Intercomparison Projects (MIPs; from Intergovernmental Panel on Climate Change, 2021a). CMIP6 produces higher resolutions in the atmosphere and oceans, better represents physics and aerosols, and improves climate sensitivity than in CMIP5 models.
- Confidence
The robustness of a finding based on the type, amount, quality and consistency of evidence (for example, mechanistic understanding, theory, data, models, expert judgement) and on the degree of agreement across multiple lines of evidence. In the IPCC AR6 report and for IPCC findings summarized in the present chapter, confidence is expressed qualitatively (from Intergovernmental Panel on Climate Change, 2021a).
- CONUS
The conterminous United States of America, not including Alaska, Hawaii, and the U.S. territories of Puerto Rico, U.S. Virgin Islands, and U.S. Pacific Islands.
- Drought
Drought is an extended period of decreased precipitation and streamflow long enough to cause water shortage for people and natural systems. The following definitions for types of drought are all available at https://drought.unl.edu/Education/Tutorials/Usdm.aspx (U.S. Drought Monitor, 2023):
- Agricultural drought
This type of drought links the characteristics of meteorological drought to agriculture or landscapes. Agricultural drought focuses on precipitation shortages, evaporative demand, and soil moisture deficits. This type of drought is also dependent upon plant type, stage of growth, and soil properties.
- Ecological drought
This type of drought results from prolonged and widespread deficit in naturally available water supplies that creates multiple stresses across ecosystems.
- Flash Drought
Rapid onset, intensification, and severity of drought occurring over a relatively short timescale, usually within a few days or weeks.
- Hydrological drought
Hydrological drought is associated with the effects of rain and snow shortfalls on streamflow, reservoir and lake levels, and groundwater. Because it takes longer for precipitation deficiencies to show up in other components of the hydrological system, this type of drought can be out of phase with the other types of drought.
- Meteorological drought
Meteorological drought is determined by the lack of precipitation and how conditions such as temperature and winds affect the amount of moisture. It is expressed in relation to the average conditions for a region. Meteorological drought is region-specific since precipitation is highly variable from region to region. For example, a location in Florida may receive more rainfall during a drought than a location in New Mexico receives during an entire year.
- Socioeconomic drought
Socioeconomic drought includes the impact of drought on the economy related to supply and demand. Although people typically think of agricultural products, drought can also affect hydroelectric energy generation, ethanol production, and numerous other items. Additionally, drought impacts tourism, public health, infrastructure, and many other components of society.
- Environmental Flow Requirement
The flow conditions found to be important to sustaining thriving populations of an aquatic species are called the environmental flow requirements. Flow regime is a major determinant of the physical habitat of surface water bodies, which in turn heavily influences the biotic composition of those ecosystems.
- Evapotranspiration
The sum of evaporation and transpiration, the processes through which liquid water or ice is transferred as water vapor to the atmosphere from open water, ice surfaces, bare soil, and vegetation on the Earth’s surface. Potential evapotranspiration (PET) is the potential rate of water loss from wet soils and from plant surfaces; it is synonymous with atmospheric demand. Actual evapotranspiration (AET) is limited by water supply.
- Exposure
The presence of people; livelihoods; species or ecosystems; environmental functions, services, and resources; infrastructure; or economic, social, or cultural assets in places and settings that could be adversely affected (from Intergovernmental Panel on Climate Change, 2021a)
- Greenhouse gases
Gaseous constituents of the atmosphere, both natural and anthropogenic, that absorb and emit radiation at specific wavelengths within the spectrum of radiation emitted by the Earth’s surface, by the atmosphere itself, and by clouds. This property causes the greenhouse effect. Water vapor (H2O), carbon dioxide (CO2), nitrous oxide (N2O), methane (CH4) and ozone (O3) are the primary greenhouse gases in the Earth’s atmosphere. Humanmade greenhouse gases include sulfur hexafluoride (SF6), hydrofluorocarbons (HFCs), chlorofluorocarbons (CFCs), and perfluorocarbons (PFCs); several of these are also O3-depleting and are regulated under the Montreal Protocol (from Intergovernmental Panel on Climate Change, 2021a).
- IPCC
The Intergovernmental Panel on Climate Change (IPCC) is an international body within the United Nations for the scientific, technical and socioeconomic assessment of climate change on Earth.
- IPCC AR6
The IPCC prepares comprehensive Assessment Reports about the state of scientific, technical and socioeconomic knowledge on climate change including observations and trends, impacts and future risks, and strategies for reducing the rate at which climate change is taking place. The AR6 (Sixth Assessment Report) is the most recent set completed during 2021–23.
- NCA4, NCA5
The National Climate Assessments are quadrennial reports required by the Global Change Research Act of 1990 integrating program findings including effects of global change and a trend assessment, produced by the USGCRP (see “Glossary” entry). The fourth assessment, NCA4, was delivered in two volumes: (1) the Climate Science Special Report, in 2017; and (2) Impacts, Risks, and Adaptation in the United States, in 2018 The fifth assessment was published in late 2023 (U.S. Global Change Research Program, 2017, 2018, 2023290291).
- Overland flow
Rainfall that does not infiltrate and flows over land until it reaches a surface depression (wetland, pond, lake), storm drain, or stream channel. There are two subtypes: (1) saturation excess overland flow (soil pores are full and cannot accept more water) and (2) infiltration excess overland flow (rain is falling at a rate much higher than the infiltration rate). Flow over impervious surfaces (cityscapes, bare rock) is included in the definition and can be termed urban runoff.
- PDSI
Palmer Drought Severity Index is a standardized regional drought index used to study the areal extent and severity of drought events at various levels of wetness and dryness. Precipitation and temperature data are used to estimate relative dryness and evaluate moisture demand and supply from a simple water balance model. The index was not designed for high relief landscapes but can be effective for determining long-term drought in low and middle latitudes.
- Pluvial
Usually refers to an interval of relatively high precipitation within a timeframe of decades to thousands of years. Pluvials are often associated with glacial stages of the Quaternary, particularly in the Western United States.
- Radiative forcing
The change in the net, downward minus upward, radiative flux (expressed in W m–2) due to a change in an external driver of climate change, such as a change in the concentration of carbon dioxide (CO2), the concentration of volcanic aerosols, or the output of the Sun. The stratospherically adjusted radiative forcing is computed with all tropospheric properties held fixed at their unperturbed values, and after allowing for stratospheric temperatures, if perturbed, to readjust to radiative-dynamical equilibrium. Radiative forcing is called instantaneous if no change in stratospheric temperature is accounted for. The radiative forcing once both stratospheric and tropospheric adjustments are accounted for is termed the effective radiative forcing (from Intergovernmental Panel on Climate Change, 2021a).
- RCP
Representative Concentration Pathway. The RCP is a greenhouse gas concentration trajectory adopted by the IPCC (Intergovernmental Panel on Climate Change). Four pathways (RCP2.6, RCP4.5, RCP6 and RCP8.5) describing different climate futures, were used for climate modeling and research for the IPCC AR5 and the National Climate Assessments Four and Five. These labels come from a possible range of radiative forcing values for the year 2100. Additional pathways are being considered. Mid- and late-21st century projections of global warming and global mean sea-level rise have been evaluated. For further information see Chen and others (2021) and Intergovernmental Panel on Climate Change (2021b).
- Risk
The probability of a negative or harmful event occurring, its probable frequency, and the magnitude of resulting damages. This includes the potential for adverse consequences for human or ecological systems, recognizing the diversity of values and objectives associated with such systems. In the context of climate change, risks can arise from potential impacts of climate change as well as human responses to climate change. Relevant adverse consequences include those on lives, livelihoods, health and well-being, economic, social and cultural assets and investments, infrastructure, services (including ecosystem services), ecosystems and species. (from Intergovernmental Panel on Climate Change, 2021a)
- Runoff
A term generally understood in water budgets and watershed hydrology to mean water that leaves the basin through stream channels rather than by evapotranspiration or groundwater flow. It can also mean stream discharge divided by drainage basin area, yielding flow in units of length per unit of time. Runoff may include (1) overland flow (downslope flow of water on the surface of the soil); (2) storm runoff (streamflow from a rainfall event over and above the discharge that would have occurred without a rainfall event, which may involve surface and subsurface flow processes and “new” event and “old” stored groundwater contributions); and (3) surface runoff (the contribution to streamflow from overland flow; Beven, 2012).
- Sensitivity
In the context of climate variability and change, the degree to which a system or species is affected positively or negatively. The effect may be direct in response to a change in a parameter such as temperature or indirect such as damages caused by increasing frequency of coastal flooding from sea-level rise (Intergovernmental Panel on Climate Change, 2021a).
- SWE
Snow water equivalent (SWE) is the depth of water that would cover the ground if the snow was liquid water. SWE is estimated by various methods including melted water content of a volume of snow taken as a core of known length, by weight of accumulated snow on a sensor, or by airborne remote sensing combined with ground-based, snow-density measurements.
- SSPs
Shared Socioeconomic Pathways are five future scenarios reflecting varying levels of development, inequality, and regional competition used in climate model projections to account for policy decisions and other socioeconomic developments. Descriptions of the scenarios are adapted from Chen and others (2021, cross chapter box 1.4):
- SSP1-1.9
Holds warming to approximately 1.5 degrees Celsius (°C) above 1850–1900 in 2100 after slight overshoot (median) and implied net zero CO2 emissions around the middle of the century.
- SSP1-2.6
Stays below 2.0 °C warming relative to 1850–1900 (median) with implied net zero CO2 emissions in the second half of the century.
- SSP2-4.5
Scenario approximately in line with the upper end of aggregate Nationally Determined Contribution (NDC) emissions levels by 2030. CO2 emissions remaining around current levels until the middle of the century. The SR1.5 assessed temperature projections for NDCs to be from 2.7 to 3.4 °C by 2100, corresponding to the upper half of projected warming under SSP2-4.5. New or updated NDCs by the end of 2020 did not significantly change the emissions projections by 2030, although more countries adopted 2050 net zero targets in line with SSP1-1.9 or SSP1-2.6. The SSP2-4.5 scenario deviates mildly from a “no-additional-climate-policy” reference scenario, resulting in a best-estimate warming around 2.7 °C by the end of the 21st century relative to 1850–1900.
- SSP3-7.0
An intermediate-to-high reference scenario resulting from no additional climate policy under the SSP3 socioeconomic development narrative. CO2 emissions roughly double from current levels by 2100. SSP3-7.0 has particularly high non-CO2 emissions, including high aerosol emissions. Projected global warming levels could exceed 3 °C relative to the 1850–1900 baseline by the end of the 21st century (Chen and others, 2021).
- SSP5-8.5
A high-reference scenario with no additional climate policy. CO2 emissions roughly double from current levels by 2050. Emissions levels as high as SSP5-8.5 are not obtained by integrated assessment models (IAMs) under any of the SSPs other than the fossil-fueled SSP5 socioeconomic development pathway. Projected global warming occurs at a faster rate than with other scenarios and could exceed 4 °C relative to the 1850–1900 baseline by the end of the 21st century (Chen and others, 2021).
- Streamflow
A general term for water flowing in a natural channel of any size, from small headwaters to large rivers.
- Stream discharge
Streamflow measured as volume per unit time. U.S. Geological Survey streamgages report discharge in cubic feet per second or cubic meters per second.
- Specific discharge
Stream discharge divided by drainage basin area to yield units of flow in length (millimeters [mm]), for use in water balance calculations with rainfall, snow water equivalent, evapotranspiration, etc.; also measured in mm.
- Tipping point
A critical threshold beyond which a system reorganizes, often abruptly and(or) irreversibly (Intergovernmental Panel on Climate Change, 2021a).
- USGCRP
The U.S. Global Change Research Program is a Congressionally mandated Federal program that coordinates research and investments across the Federal government to understand, assess, predict, and respond to forces shaping global change, both human and natural, and the impacts on society. It is overseen by the National Science and Technology Council of the Office of the President.
- Vulnerability
The propensity or predisposition to be adversely affected. Vulnerability encompasses a variety of concepts and elements including sensitivity or susceptibility to harm and lack of capacity to cope and adapt (from Intergovernmental Panel on Climate Change, 2021a).
Conversion Factors
International System of Units to U.S. customary units
Temperature in degrees Celsius (°C) may be converted to degrees Fahrenheit (°F) as follows:
°F = (1.8 × °C) + 32.
Datums
Vertical coordinate information is referenced to the North American Vertical Datum of 1988 (NAVD 88).
Horizontal coordinate information is referenced to the North American Datum of 1983 (NAD 83).
Elevation, as used in this report, refers to distance above the vertical datum.
Supplemental Information
A water year is the 12-month period from October 1 through September 30 of the following year and is designated by the calendar year in which it ends.
HUC2, HUC4, HUC6, HUC8, HUC10, HUC12 are hydrologic unit codes (HUCs) with the numbers representing the number of digits in the code. HUCs are an addressing system for identifying catchments in the United States. HUC catchments are nested, with more digits indicating progressively smaller hydrologic units in terms of the area they cover.
Abbreviations
CO2
carbon dioxide
AET
actual evapotranspiration
CID
climatic impact driver. See “Glossary.”
CMIP
Coupled Model Intercomparison Project. See “Glossary.”
CONUS
conterminous United States of America, excluding Alaska, Hawaii and U.S. territories of Puerto Rico, U.S. Virgin Islands, and U.S. Pacific Islands.
ESI
Evaporative Stress Index
HUC
hydrologic unit code
HUC8
8-digit hydrologic unit code
IPCC
Intergovernmental Panel on Climate Change.
IPCC AR6
Intergovernmental Panel on Climate Change Sixth Assessment Report. See “Glossary” and “References Cited.”
NCA4, NCA5
U.S. Global Change Research Program Fourth and Fifth National Climate Assessment Reports. See “Glossary” and “References Cited.”
PDSI
Palmer Drought Severity Index. See “Glossary.”
PET
potential evapotranspiration
RCP
Representative Concentration Pathway. See “Glossary.”
SSP
Shared Socioeconomic Pathway. See “Glossary.”
SWE
snow water equivalent
SWI
surface water input
USGCRP
U.S. Global Change Research Program. See “Glossary.”
USDM
U.S. Drought Monitor
USGS
U.S. Geological Survey
For more information concerning the research in this report, contact the
National_IWAAs@usgs.gov, Water Resources Mission Area
U.S. Geological Survey
12201 Sunrise Valley Drive
Reston, Virginia 20192
Manuscript approved on December 4, 2025
Publishing support provided by the U.S. Geological Survey
Science Publishing Network, Tacoma and Rolla Publishing Service Centers
Edited by John Osias and Vanessa Ball
Illustration by Althea Archer and Amanda Carr
Design and layout by Guadalupe Stratman
Disclaimers
Any use of trade, firm, or product names is for descriptive purposes only and does not imply endorsement by the U.S. Government.
Although this information product, for the most part, is in the public domain, it also may contain copyrighted materials as noted in the text. Permission to reproduce copyrighted items must be secured from the copyright owner.
Suggested Citation
Scholl, M.A., McCabe, G.J., Olson, C.G., and Powlen, K.A., 2025, Climate change and future water availability in the United States, chap. E of U.S. Geological Survey Integrated Water Availability Assessment—2010–20: U.S. Geological Survey Professional Paper 1894–E, 60 p., https://doi.org/10.3133/pp1894E.
ISSN: 2330-7102 (online)
Study Area
| Publication type | Report |
|---|---|
| Publication Subtype | USGS Numbered Series |
| Title | Climate change and future water availability in the United States |
| Series title | Professional Paper |
| Series number | 1894 |
| Chapter | E |
| DOI | 10.3133/pp1894E |
| Publication Date | January 15, 2025 |
| Year Published | 2025 |
| Language | English |
| Publisher | U.S. Geological Survey |
| Publisher location | Reston, VA |
| Contributing office(s) | WMA - Earth System Processes Division |
| Description | viii, 60 p. |
| Country | United States |
| Online Only (Y/N) | Y |
| Additional Online Files (Y/N) | N |