

Integrated Water Availability in the Conterminous United States, 2010–20
Links
- Document: Report (6.58 MB pdf) , HTML , XML
- Larger Work: This publication is Chapter F of U.S. Geological Survey Integrated Water Availability Assessment—2010–20
- NGMDB Index Page: National Geologic Map Database Index Page (html)
- Download citation as: RIS | Dublin Core
Preface
This is one chapter in a multichapter report that assesses water availability in the United States for water years 2010–20. This work was conducted as part of the fulfillment of the mandates of Subtitle F of the Omnibus Public Land Management Act of 2009 (Public Law 111-11), also known as the SECURE Water Act. As such, this work examines the spatial and temporal distribution of water quantity and quality in surface water and groundwater, as related to human and ecosystem needs and as affected by human and natural influences. Chapter A (Stets and others, 2025a) introduces the National Integrated Water Availability Assessment and provides important background and definitions for how the report characterizes water availability and its components. Chapter A also presents the key findings of Chapters B–F and thus acts as a summary of the entire report. Chapter B (Gorski and others, 2025) is a national assessment of water supply, which is the quantity of water supplied through climatic inputs. Chapter C (Erickson and others, 2025) is a national assessment of water quality, which is the chemical and physical characteristics of water. Chapter D (Medalie and others, 2025) assesses water use including withdrawals and consumptive use in the conterminous United States. Chapter E (Scholl and others, 2025) presents an analysis of factors affecting future water availability under changing climate conditions. The National Integrated Water Availability Assessment culminates with Chapter F (this report), which is an integrated assessment of water availability that considers the amount and quality of water coupled with the suitability of that water for specific uses. Together, these six chapters constitute the National Integrated Water Availability Assessment for water years 2010–20.
Abstract
Water availability is defined as the spatial and temporal distribution of water quantity and quality as it relates to the needs of humans and ecosystems. Broad assessment of water availability requires the consideration of multiple indicators because water users have different sensitivities to the degradation of water conditions. This chapter draws upon estimates of water supply, water use, and water quality to develop an integrated assessment of water availability in the conterminous United States (CONUS) for water years 2010–2020. The surface water-supply and use index (SUI) was used to express limitation arising from high water consumption in relation to water supply. Ecological stress was also assessed using indicators of ecologically detrimental flow alteration. Benchmarks of human and ecological health were used to assess water quality in relation to several key uses nationwide. In all, we find that 10 of 18 hydrologic regions have severe water stress in at least 1 indicator. Furthermore, it was common for regions to have high or severe stress in more than one indicator, which emphasizes that limitations often co-occur. For example, regions with high SUIs may also have an increased tendency to experience water quality degradation or ecologically detrimental flow alteration. Furthermore, we compared the spatial distribution of water availability against the Centers for Disease Control Social Vulnerability Index (SVI) to examine the relative distribution of socially vulnerable populations in relation to limitations on water availability. We found a tendency for an increasing segment of the population exposed to elevated SUI or water-quality degradation to be from socially vulnerable groups, as defined by SVI. This finding is similar to other studies that have noted greater water-availability limitations among socially vulnerable groups. By considering multiple indicators of water availability as a whole, greater insight into the distribution of limitations affecting water availability was gained and contributed to a more comprehensive assessment.
Key Points
The following are the key points of this chapter:
-
• At the national scale, water supply is much higher than human demand, but regions with lower water supply show smaller differences and greater potential for imbalances in supply relative to demand.
-
• Eight percent of the conterminous United States (CONUS) population (26.7 million people) live in areas with chronic stress from water-supply and use imbalances.
-
• The Southern High Plains, Texas, Central High Plains, and Mississippi Embayment hydrologic regions had the most widespread coverage of 12-digit hydrologic unit code (HUC12) watersheds with water stress from supply-use limitations.
-
• Several fish species of conservation concern have large proportions of their habitat range in areas with chronic imbalances between surface-water supply and human use.
-
• Streams with elevated nutrient concentrations greater than reference conditions were widespread across the CONUS.
-
• Limitation of ecological water availability occurred even in humid areas of the CONUS without water-supply and use imbalances, primarily because of flow alterations associated with urban areas, other land uses, and water-management and infrastructure.
-
• The California–Nevada, Southwest Desert, Central High Plains, Southern High Plains, Texas, Mississippi Embayment, and Florida hydrologic regions showed high or severe stress in multiple aspects of water availability.
-
• A high proportion of the population living in areas with water-availability limitations are considered to be socially vulnerable, although this is a small percentage of the total CONUS population.
Introduction
Water availability is a broadly encompassing concept and is defined as the “spatial and temporal distribution of water quantity and quality, as related to human and ecosystem needs” (Evenson and others, 2013, p. 1). Water availability is a function of the conditions of quality and quantity, as well as the sensitivity of the user to those conditions. Therefore, it is useful to differentiate between factors that determine the conditions of water resources and those that relate to the sensitivity of users to those conditions (Turner and others, 2003). A wide range of natural and anthropogenic drivers (including climate, geology, water use, and land use) affect the conditions of water quantity and quality for groundwater and surface water. Whether or not those conditions are sufficient for human and ecosystem needs is dependent upon the use because different uses have different sensitivities to the condition of the resources. Therefore, the integration of multiple indicators of water stress are required for a comprehensive assessment of water availability.
Most water-availability studies focus on water quantity, and findings are often expressed using terminology that communicates its relative lack or abundance, such as water stress, water scarcity, water adequacy, etc. (reviewed in Liu and others, 2017a). The quantity of water available for human and ecosystem use is commonly assessed by comparing the amount of naturally supplied water, in the form of precipitation or runoff, with estimates of water consumption or needs for human or ecosystem well-being (Liu and others, 2017a). Globally, about 0.5 billion people experience chronic, year-round water scarcity (Mekonnen and Hoekstra, 2016). However, a much larger number of people experience at least 1 month of water stress per year, with estimates ranging from 2 to 4 billion people (Mekonnen and Hoekstra, 2016; Vanham and others, 2018; Koncagül and Connor, 2023). About 40 percent of nations (76 out of 180) have ongoing water scarcity (less than [<] 1,700 cubic meters annual per capita), a number that is expected to rise to nearly 50 percent by 2050 (Mekonnen and Hoekstra, 2016; Baggio and others, 2021). When water quantity is limited, its scarcity can restrict socioeconomic development and its impacts can propagate through multiple economic pathways (Dolan and others, 2021). Tensions between human water withdrawals and the maintenance of flows to sustain ecosystems are common, with large proportions of global human water use, especially irrigation, occurring at the expense of environmental flows (Vörösmarty and others, 2010; Jägermeyr and others, 2017). These competing needs are projected to increase because of future global population growth and increasing food demands, as well as climatic changes, which could further aggravate the imbalance between human water uses and environmental flow requirements. These outcomes are likely to have consequences for global trade and socioeconomic systems (Pastor and others, 2019).
Water quality also influences availability, in that a wide range of natural and anthropogenic substances can limit water suitability for different uses. Various water-quality benchmarks for human and ecological health have been established at local, regional, and national scales—and different intended uses can have different water-quality standards—making them vulnerable to water-quality degradation in unique ways (reviewed in chap. C, Erickson and others, 2025). For example, drinking water is much more sensitive to water-quality degradation than irrigation; therefore, most drinking water-quality standards are more stringent than standards for irrigation water. If these uses are subject to the same water-quality conditions in an area, water availability for drinking water may be more limited than for irrigation. Additionally, not all uses have defined or quantified standards, yet use can still be affected by degraded water quality.
The adaptive capacity of a community determines its overall vulnerability to water-availability limitations. Adaptive capacity refers to the ability of a community to respond to limitations in water availability and is often related to community characteristics such as access to resources, mobility, or other factors. Low adaptive capacity can be associated with greater vulnerability. This concept applies to human and ecological communities although we primarily focus on the human aspects in this chapter. Social and economic factors, water agreements, and other governance structures can increase or decrease access to water that is theoretically available for a particular beneficial use. Physical infrastructure (such as household-level plumbing, reservoirs, and diversions) is critical for delivering supplies to meet local demands. Communities with few public and financial resources have difficulty accessing clean water, maintaining aging infrastructure needed for water delivery, seeking alternative water sources, or developing technological solutions to reduce water needs. Such communities may also be vulnerable to other hazards. Problems with water access and drinking-water contamination have been reported to be greater in marginalized populations, including those with lower education rates or economic status and insecure housing, than in other populations (Meehan and others, 2020; Mueller and Gasteyer, 2021; Scanlon and others, 2023). Water-availability issues persist across the United States in rural (Allaire and others, 2018; Scanlon and others, 2022) and urban areas (Meehan and others, 2020).
In this chapter, we examine water availability from an integrated perspective. In doing so, we consider a range of indicators of water availability, including water quality, water quantity, human use, ecological flow requirements, and the broad patterns of social vulnerability as they relate to water availability. We describe patterns of each indicator using indicator-specific metrics at the conterminous United States (CONUS) and regional scale (fig. 1) and identify areas where high stress for each metric indicates possible water-availability limitations for one or more uses. We draw information on indicators and their metrics from published literature and analyses from other chapters in this assessment report, and synthesize this information into a broad, multifaceted assessment of water availability in the CONUS.
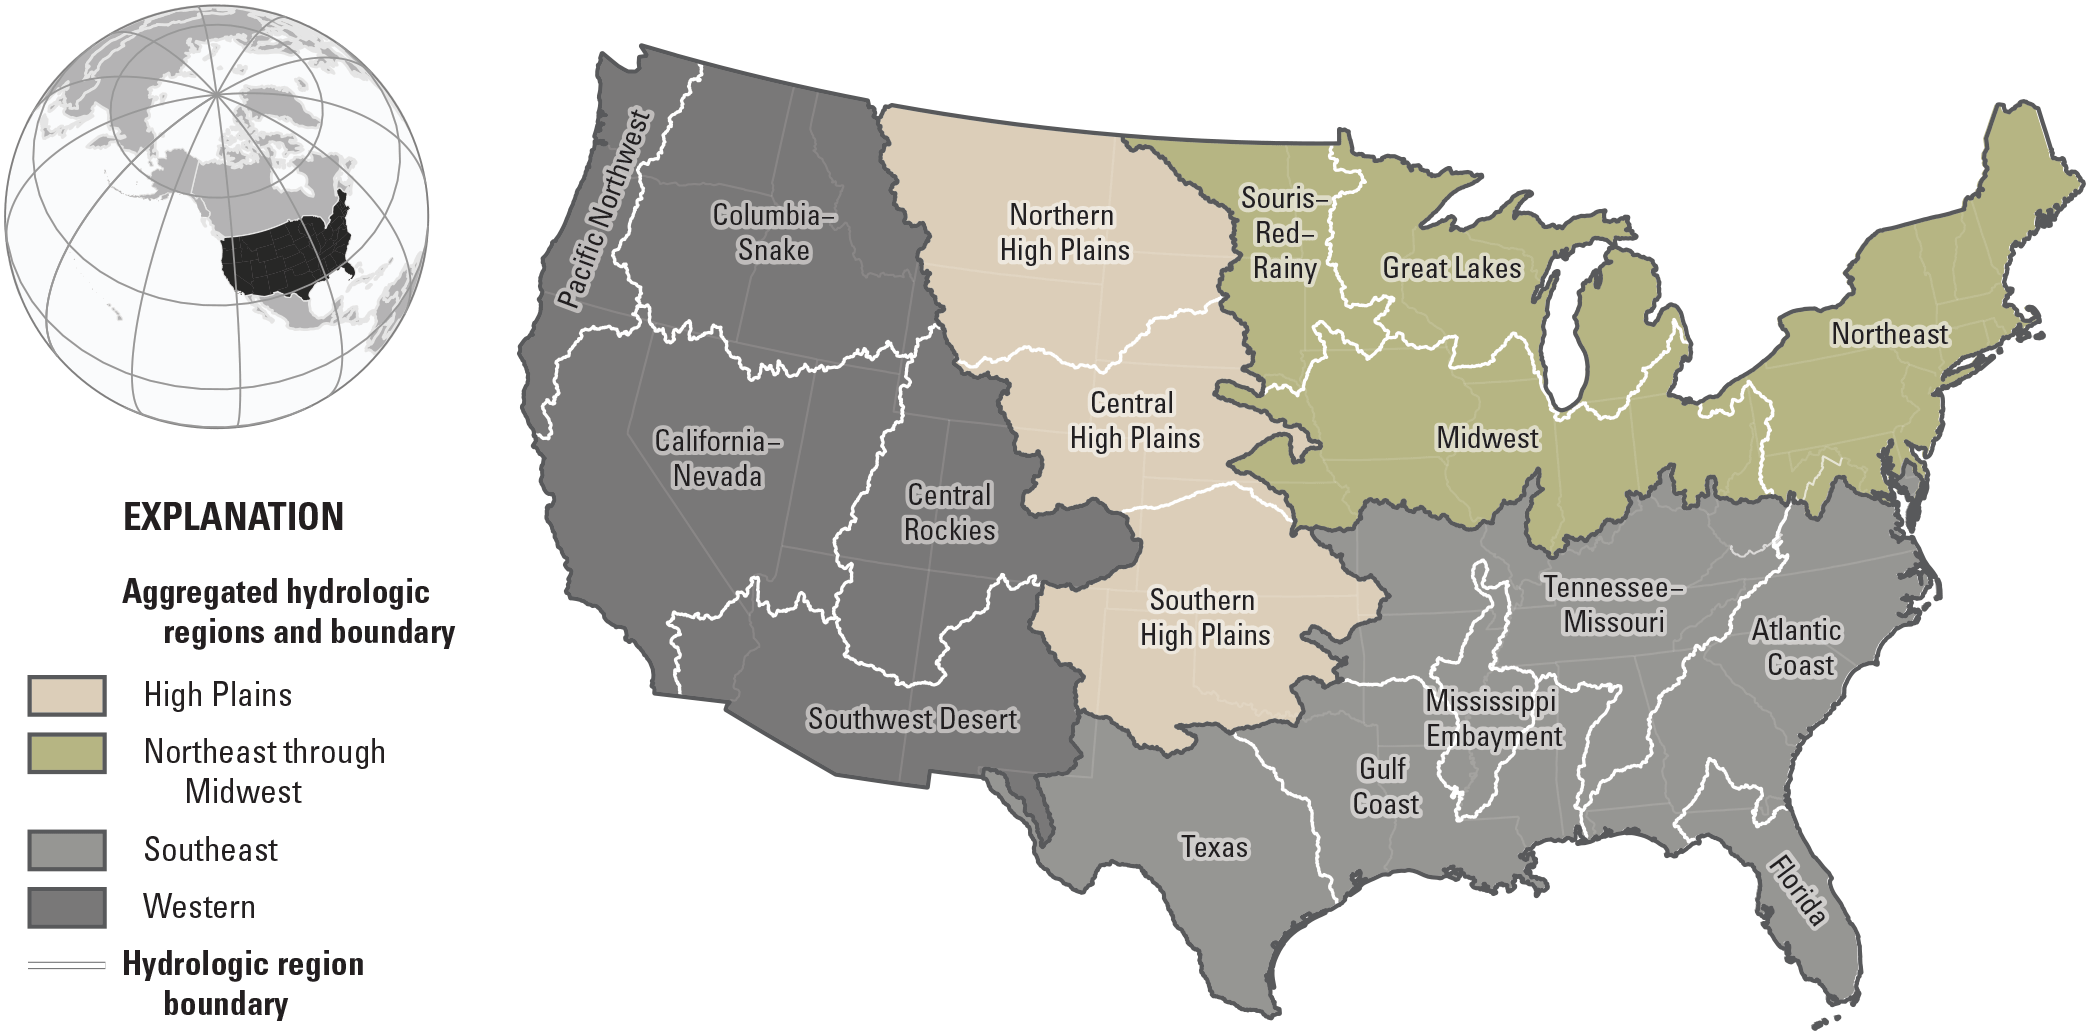
Hydrologic regions and aggregated hydrologic regions in the conterminous United States used in this report.
Water-Quantity Components of Water Availability
Previous studies assessing the balance of water supply and demand in the CONUS have noted strong and persistent regional patterns. Indicators of water availability or its relative scarcity are described from published literature with particular emphasis on the metric, surface water-supply and use index (SUI; Stets and others, 2025b). The SUI metric was developed to express surface water-supply and use imbalances within 12-digit hydrologic unit code (HUC12) catchments arising from climatic variability and human consumptive uses. It compares long-term average surface-water supply with monthly water supply, the latter of which varies over time because of climatic conditions and human consumptive water use. A high index value indicates that a high proportion of the average supply is either consumed by human use or unavailable because of climatic variation, leading to high water stress (Stets and others, 2025b).
At a national scale, water supply (defined as runoff from base flow and overland flow) is much larger than human water use (254 compared to 12 millimeters per year [mm/yr]; Stets and others, 2025b). However, the non-mountainous regions of the Western United States are susceptible to water shortages due to the combination of low water supply and high withdrawals, primarily for agricultural irrigation (U.S. Water Resources Council, 1978; Sabo and others, 2010; figs. 2, 3). Additionally, even in regions where long-term average supply is greater than demand, temporal and spatial variation can result in water shortages during droughts or dry seasons, or in particularly susceptible areas. In all, about 8 percent of the CONUS population, or 26.7 million people, live in catchments where human water use routinely meets or exceeds renewable water supply (Stets and others, 2025b). During drought or unusually dry periods, the geographic extent of water shortages expands, with a substantial number of watersheds having high levels of imbalance between supply and use in dry seasons or dry years (Brauman and others, 2016; Stets and others, 2025b). Likewise, consecutive dry years increase the depletion of water storage, even when drought intensity is moderate. The areal coverage of watersheds in the CONUS at risk of multiyear drought effects extends broadly from the Central Rockies hydrologic region into the western portions of the Northeast hydrologic region, and includes significant parts of the California–Nevada, Texas, and Florida hydrologic regions (Devineni and others, 2015; see fig. 1 and Van Metre and others, 2020, for images of the hydrologic regions).
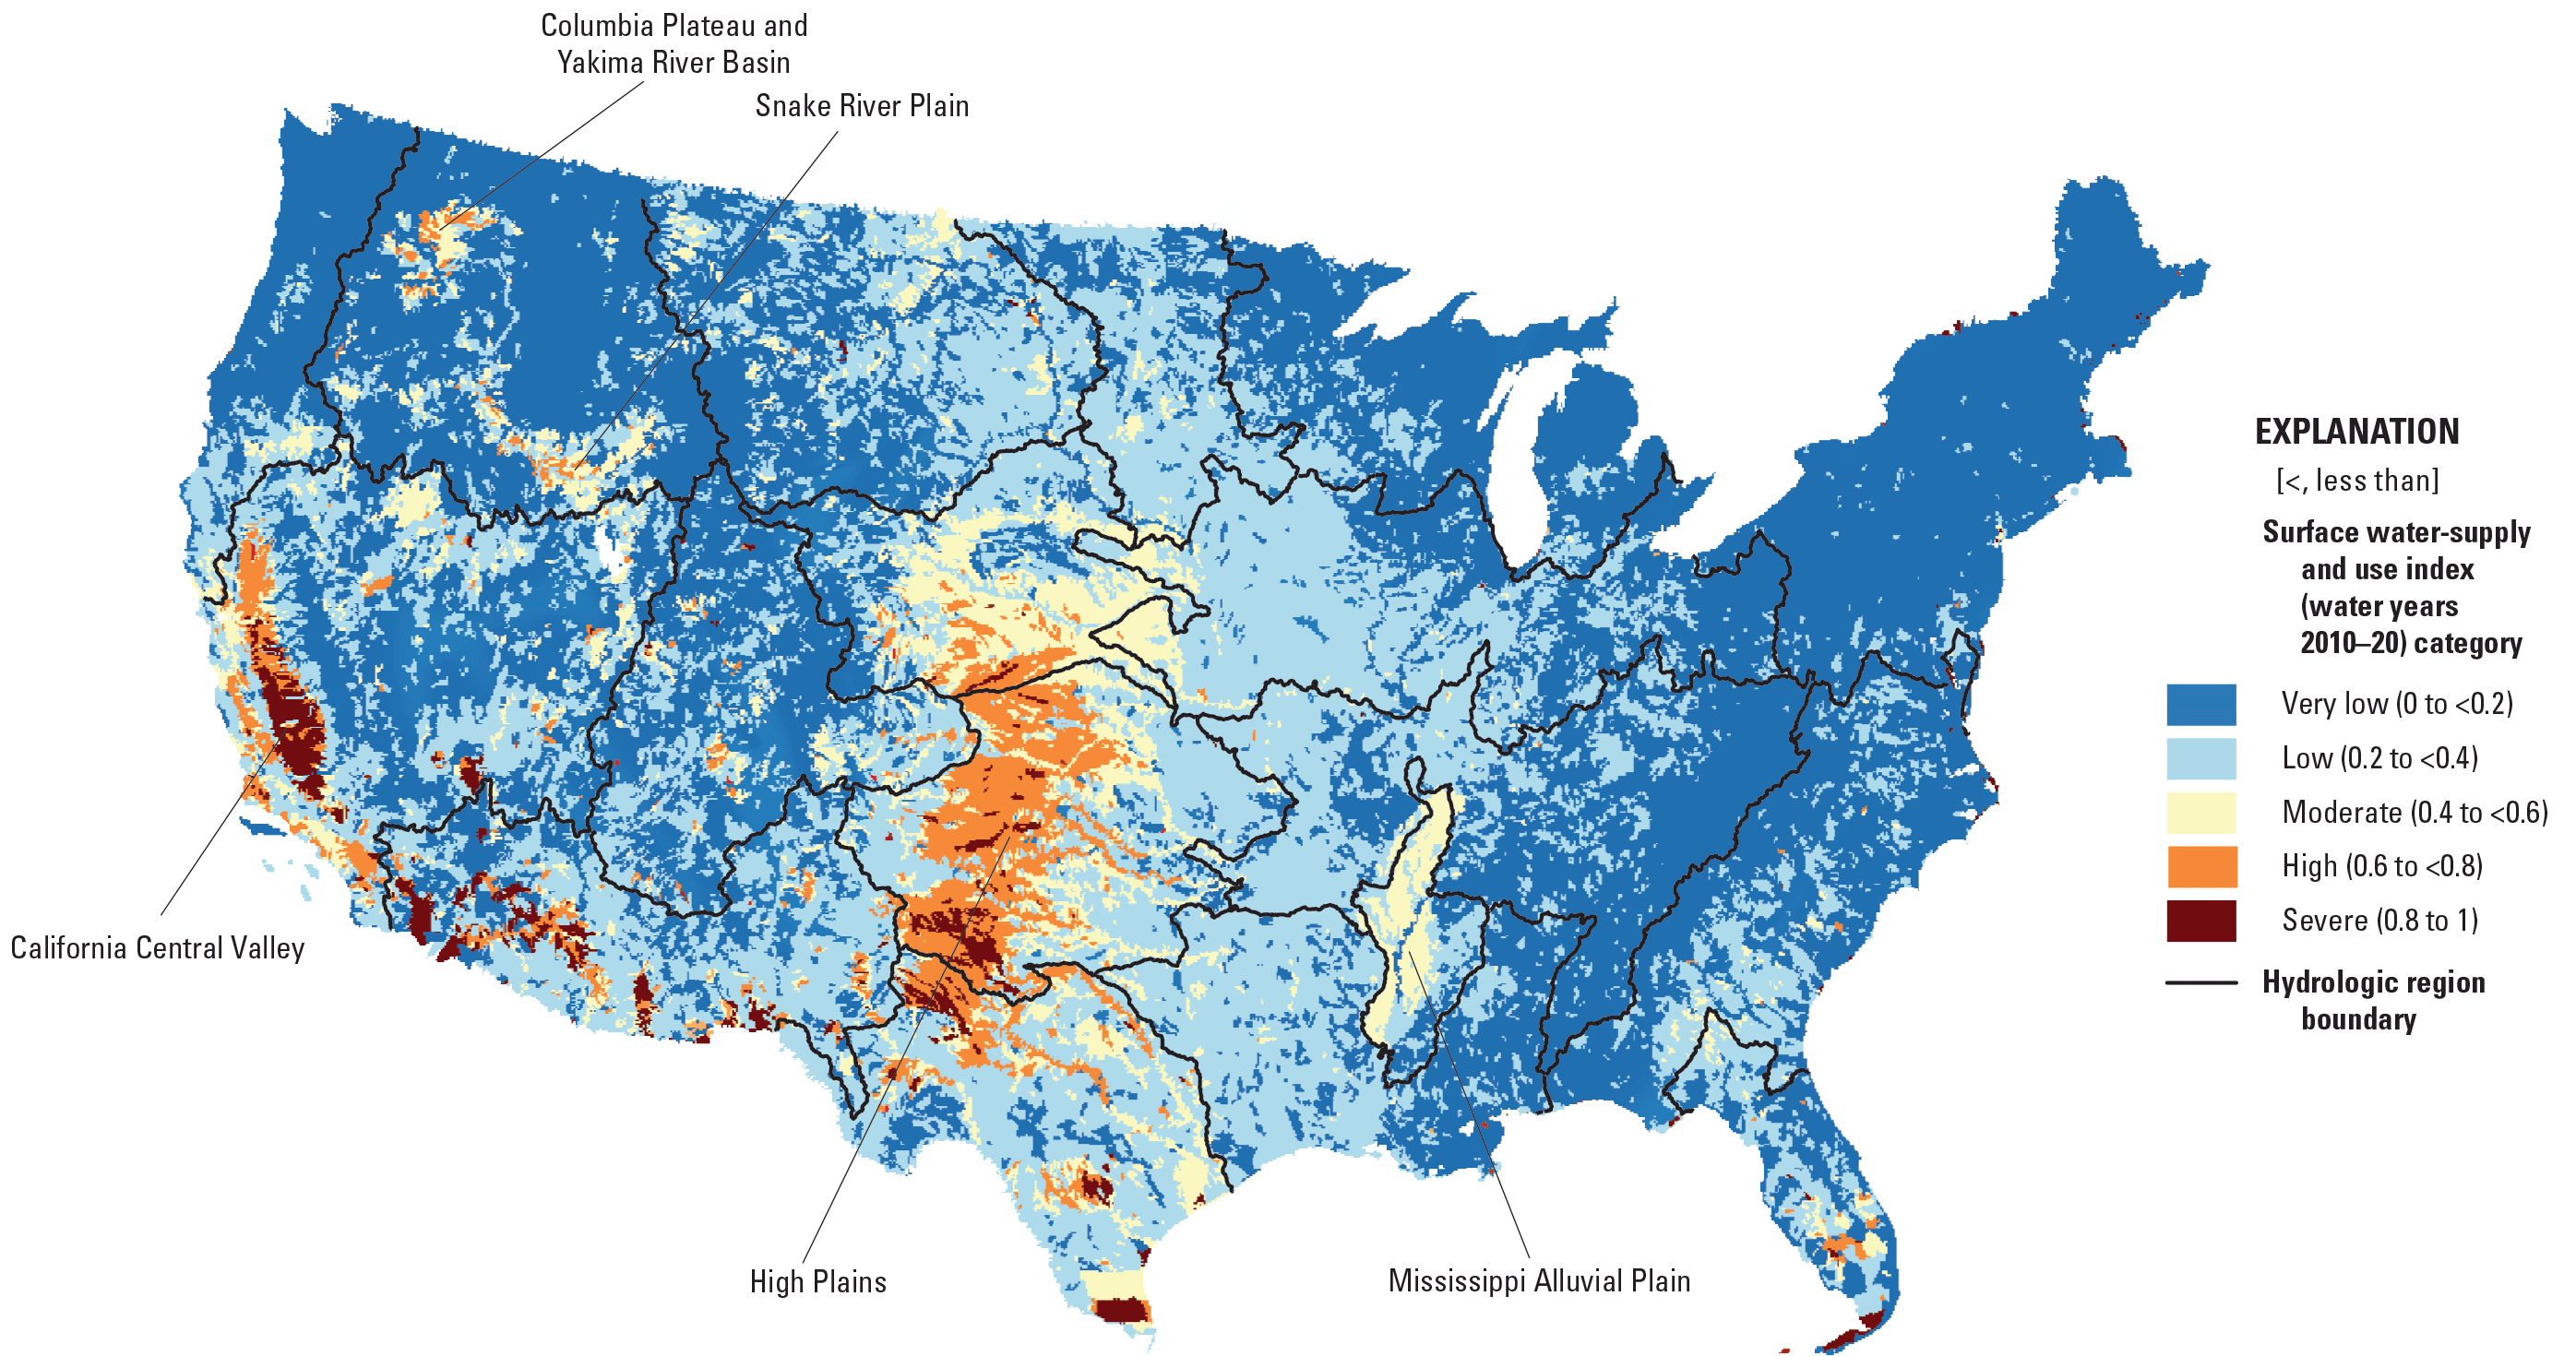
Average decadal surface water-supply and use index by 12-digit hydrologic unit code, which expresses the imbalance between surface water-supply and consumptive uses in the conterminous United States, water years 2010–20. Figure recreated from Stets and others (2025b).
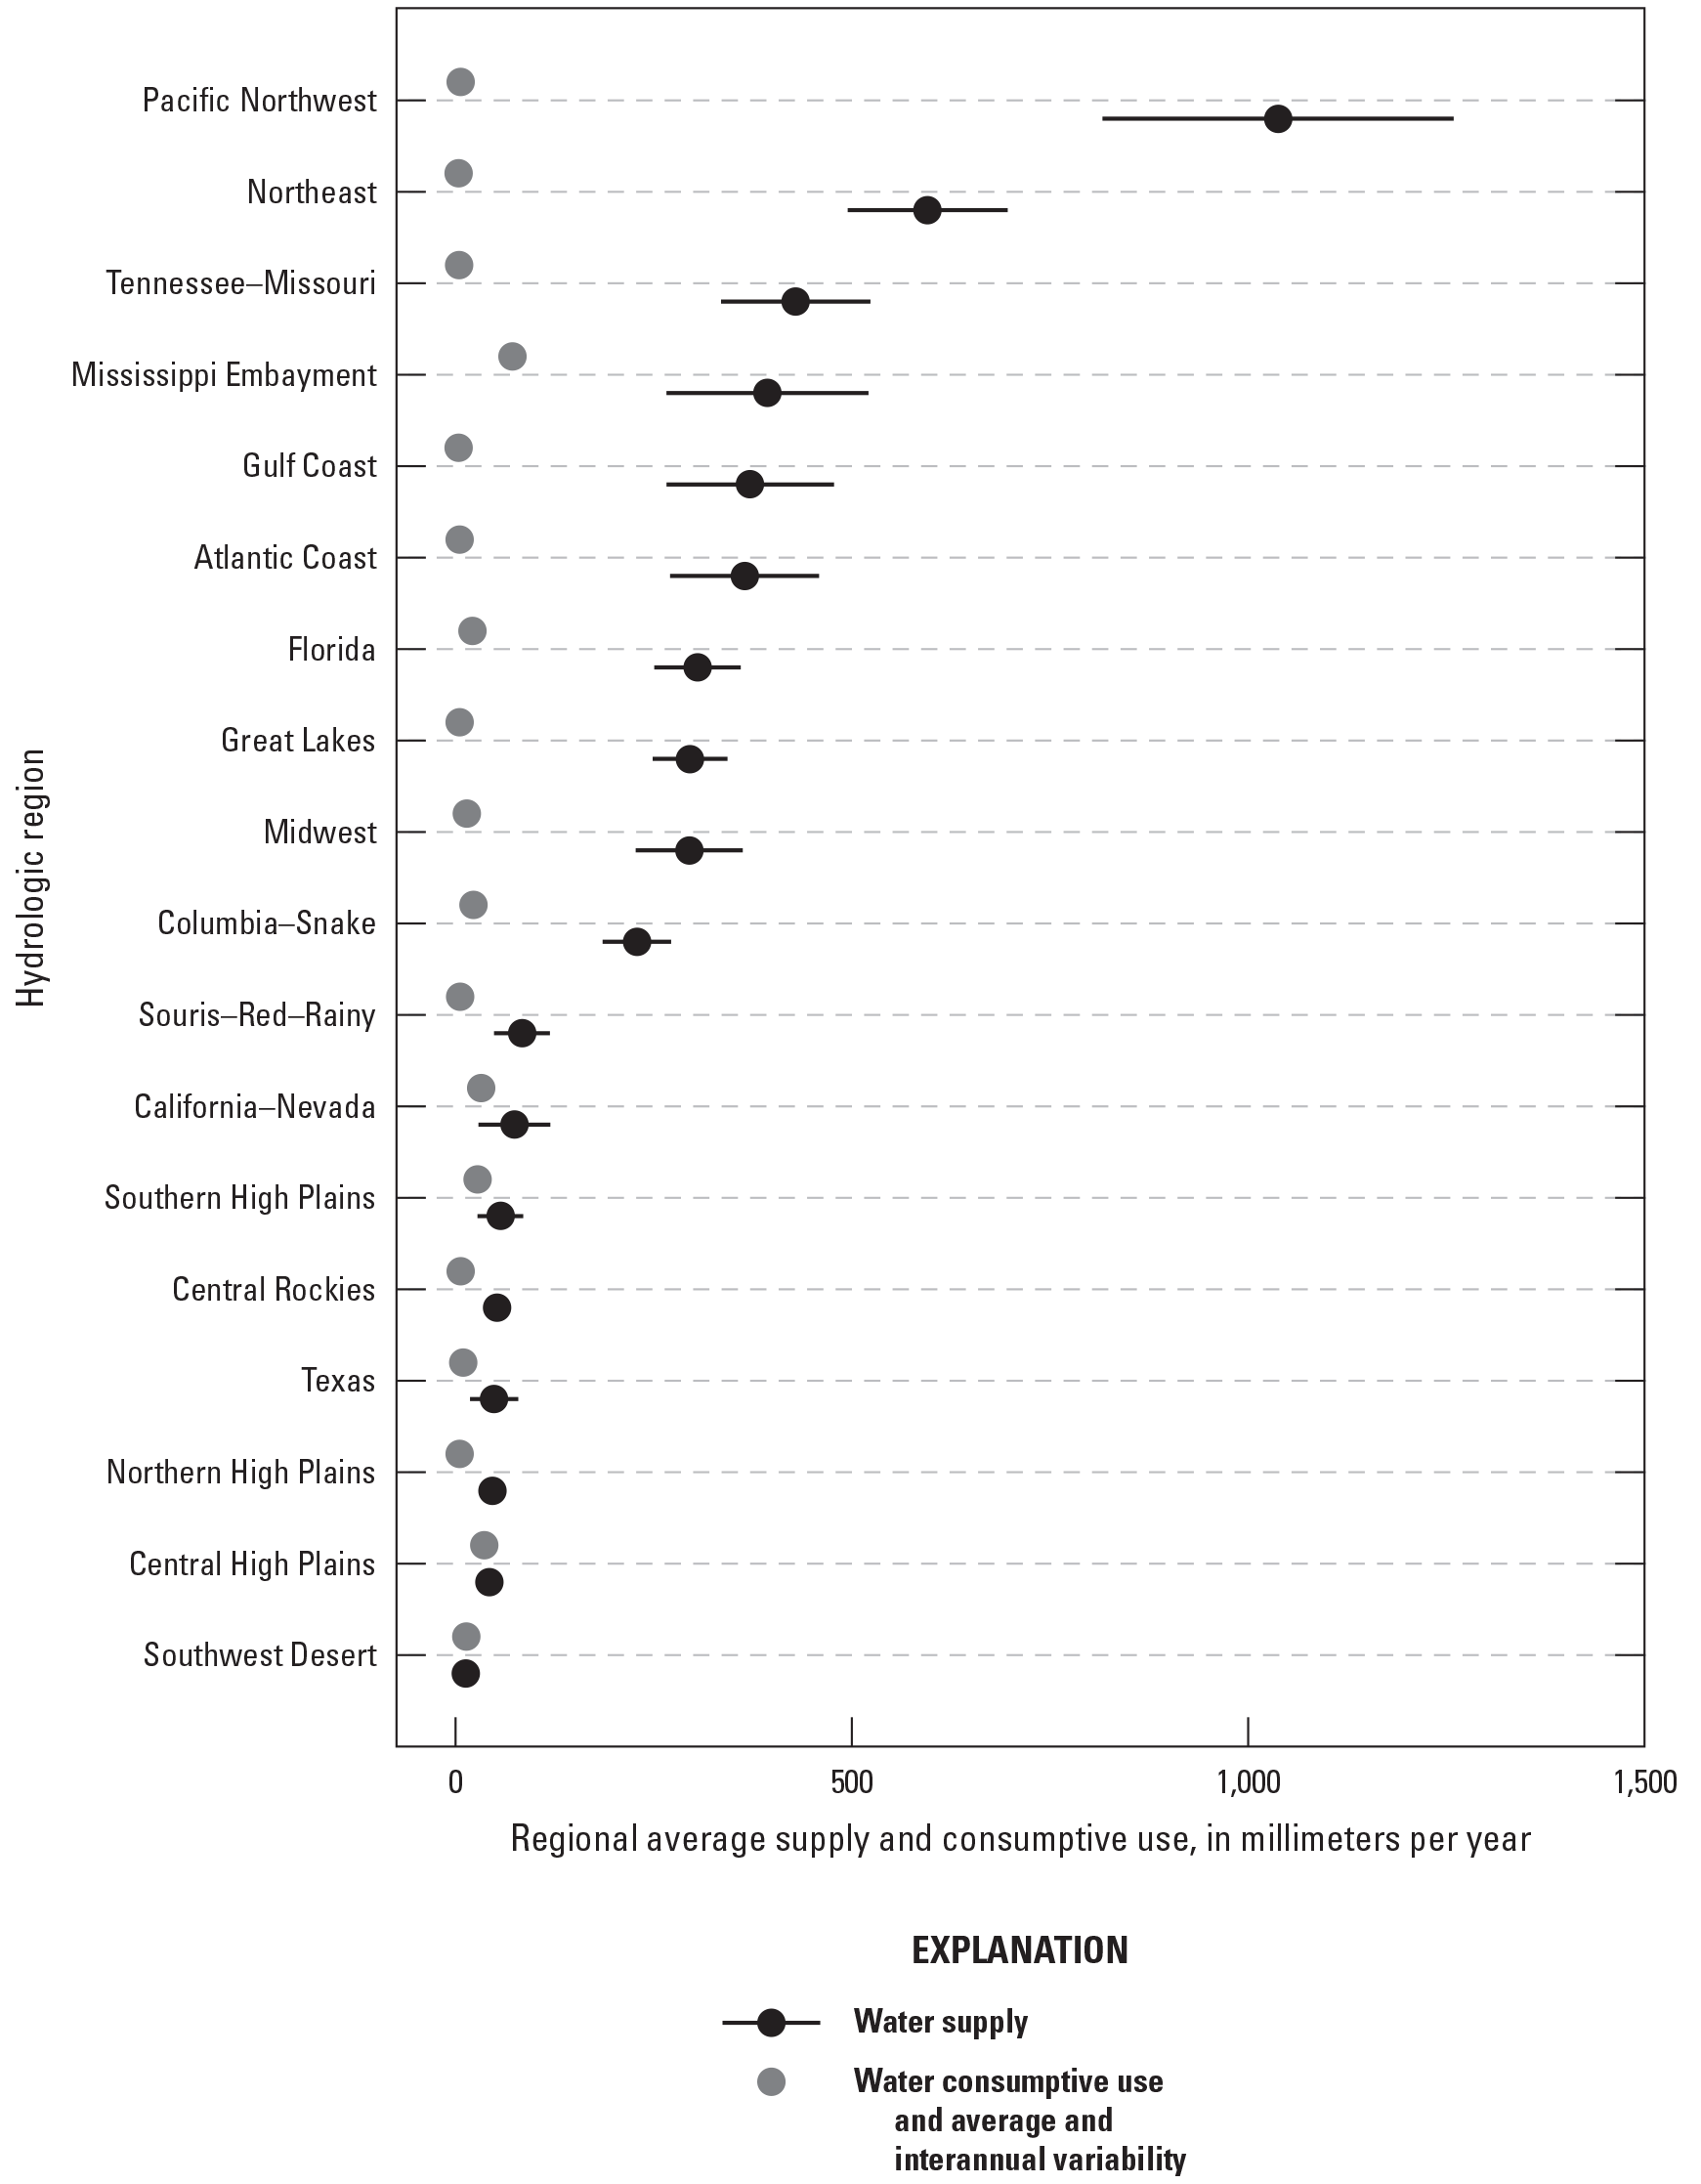
Average and interannual variability (standard deviation) of water supply and consumptive use by hydrologic region (shown in fig. 1), in the conterminous United States, water years 2010–20. For most regions, error bars on consumptive use estimates are smaller than the symbol. Water supply was calculated as the sum of annual runoff for all 12-digit hydrologic unit code (HUC12) catchments in the region divided by the area of the region. Consumptive use was calculated as the sum of water consumed for crop irrigation, thermoelectric power, and public supply within all HUC12 catchments in the region divided by the area of the region. Data source: Miller and others (2024).
During water years 2010–20, the Southern High Plains hydrologic region had the highest coverage of areas with persistently elevated SUI followed by the Texas, Central High Plains, Mississippi Embayment, and Southwest Desert hydrologic regions (fig. 4). The Northeast, Great Lakes, Pacific Northwest, and Atlantic Coast hydrologic regions had the lowest time-averaged coverage of areas with similarly elevated SUI. Ongoing water-availability problems stemming from imbalances in water supply and consumptive use are particularly acute in the High Plains, California Central Valley, Snake River Plain, Columbia Plateau, Yakima River Basin, and Mississippi Alluvial Plain (Stets and others, 2025b; fig. 2). These findings are matched by local and regional studies focusing on specific areas of the CONUS with known water-availability issues (Lindholm, 1996; Fuhrer and others, 2004; Gurdak and others, 2009; Vaccaro and others, 2009; Clark and others, 2011; Vaccaro and others, 2015). Water stress is likely to be underestimated in several of the hydrologic regions, particularly in the Western United States where drought conditions persisted for most of the analysis period and therefore limited the ability to define climate normal conditions using the relatively short time window (water years 2010–20). The so-called turn-of-the-century drought in the Western United States has been identified for the period 1999–2015 and potentially longer in the southwestern U.S. (McCabe and others, 2023; McCabe and Wolock, 2021). Runoff, which forms the basis of climate normal calculations for SUI, was determined to be abnormally low during this period in the Western United States (McCabe and others, 2023). Therefore, SUI as presented in this analysis likely does not properly characterize the long-term departures from climate normal in the areas most affected by this prolonged and well-described drought (particularly in the California–Nevada, Southwest Desert, and Central Rockies hydrologic regions; Udall and Overpeck, 2017; fig. 4). Each area presents a complex picture of limited water availability, but their commonalities are high water use reliant on external sources, such as interbasin transfers or groundwater pumping in excess of local short-term recharge rates, which results in an elevated SUI (Stets and others, 2025b).
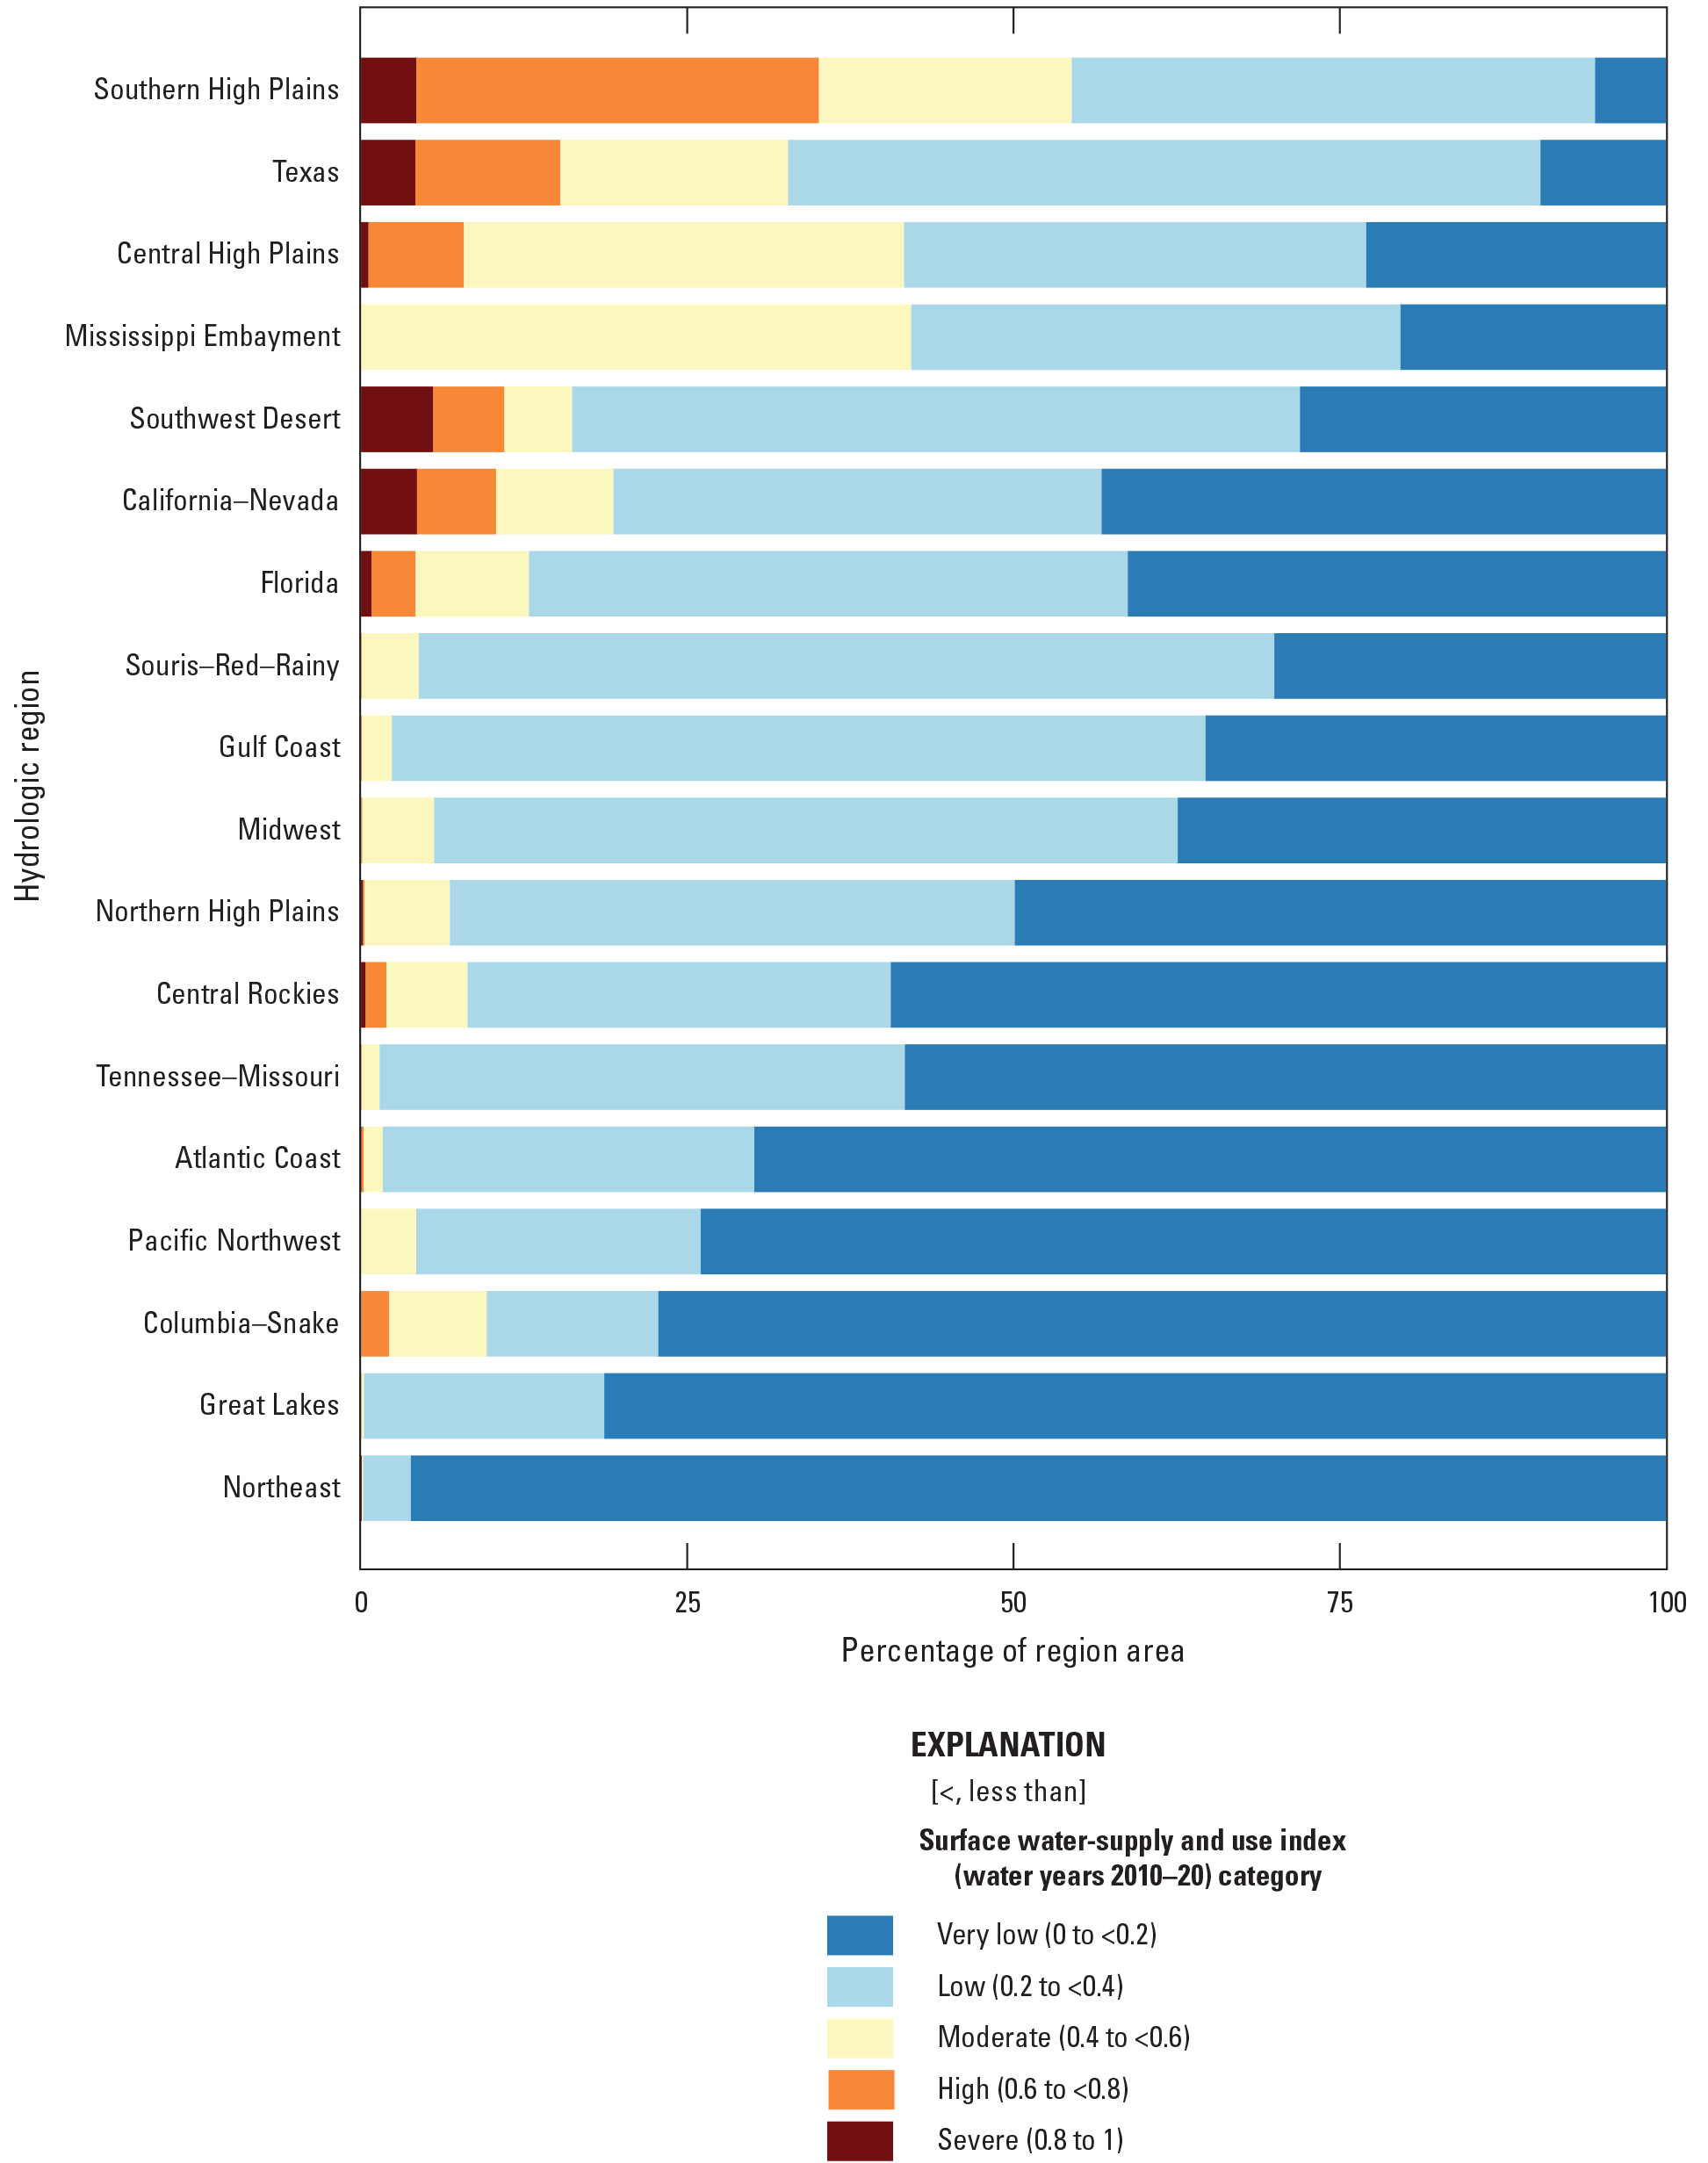
Decadal average (water years 2010–20) percentage of area within different surface water-supply and use index (SUI) categories calculated by hydrologic region, arranged in descending order of the region’s SUI. Data source: Miller and others (2024).
The balance between water supply and use changes temporally in response to climate variation, changes in human consumptive water use, and depletion of local water stores. Crop irrigation is typically a large percentage of total water use (Brauman and others, 2016; Rushforth and Ruddell, 2018) and irrigation practices are modified to buffer crop production during droughts and other climate extremes (Troy and others, 2015). Therefore, imbalances between water supply and use can be aggravated during dry periods by the combined effects of reduced water supply and increased water consumption (Stets and others, 2025b). For example, the areal extent of imbalances between water supply and use in the CONUS peaked during a notable widespread drought in 2012–13 (fig. 5; chap. B, Gorski and others, 2025; chap. D, Medalie and others, 2025). The tendency for water consumption to increase during dry periods causes increasing burden on water resources as local water stores are depleted during prolonged droughts (Devineni and others, 2015).
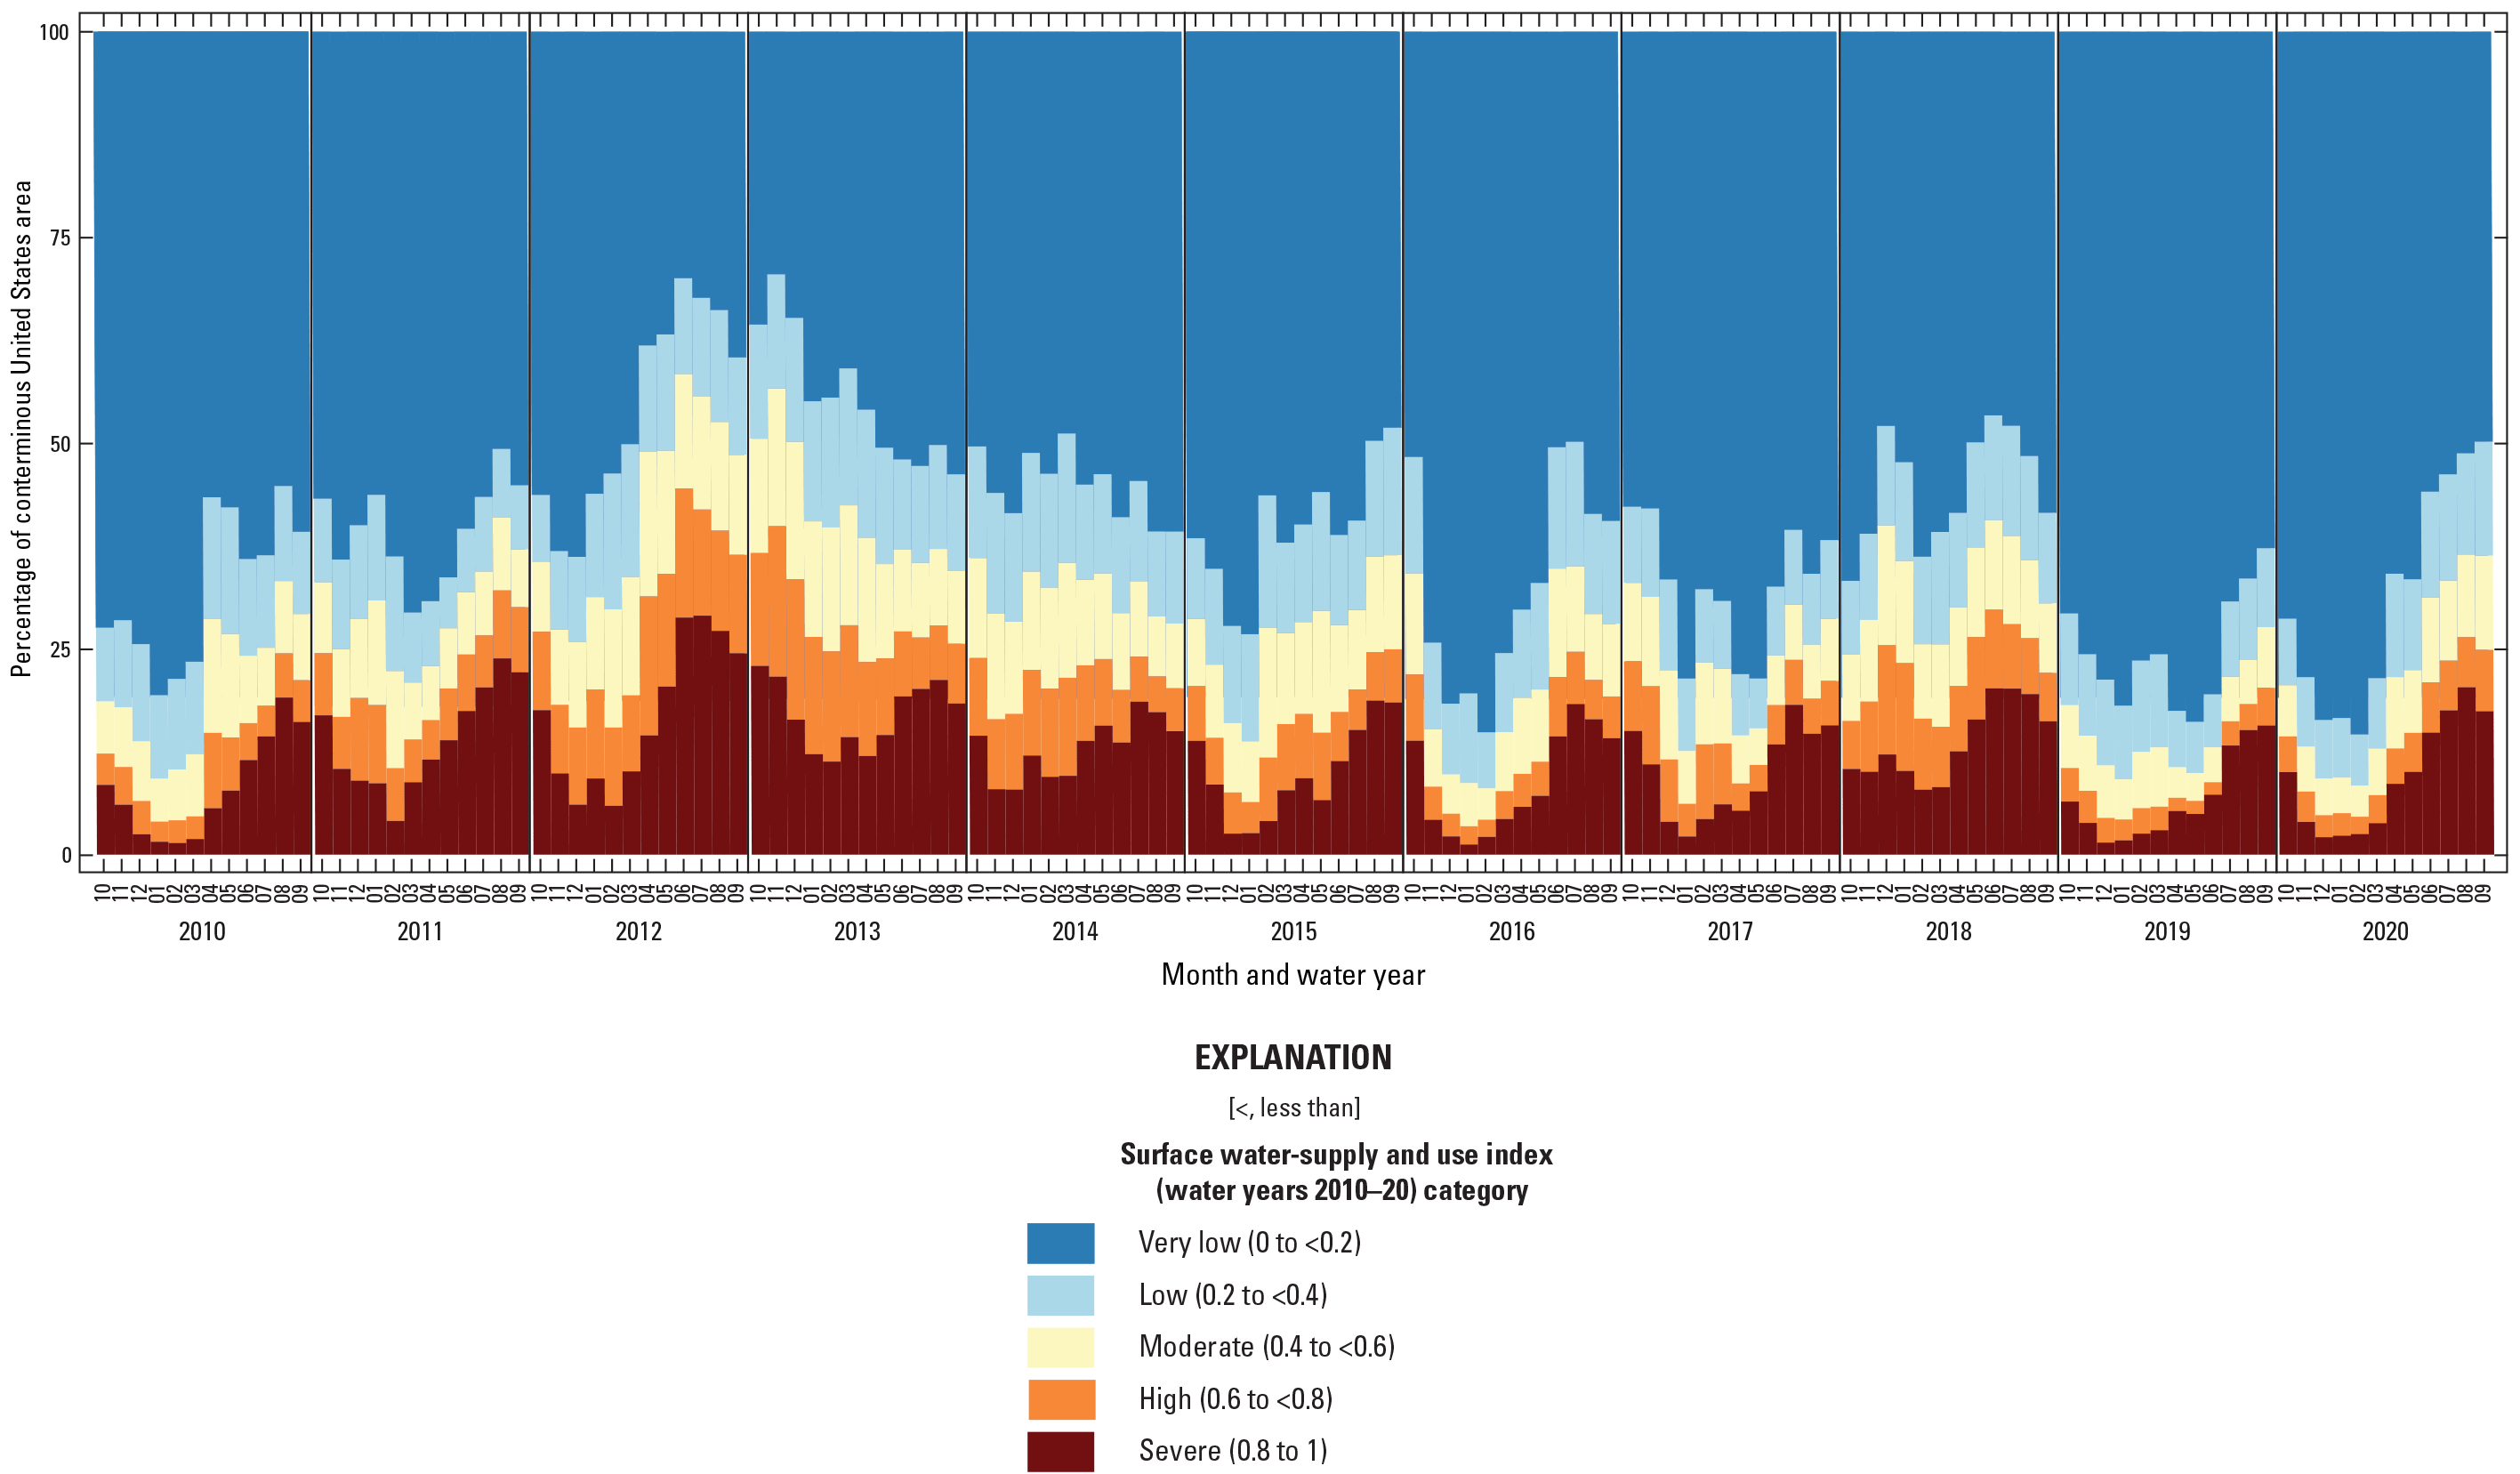
Percentage of the conterminous United States area within different surface water-supply and use index classes, by month of year, for water years 2010–20. Figure recreated from Stets and others (2025b).
Elevated SUI is most common in watersheds with limited water supply and high human consumptive water use. During the water years 2010–20, HUC12 watersheds in the CONUS with chronically imbalanced supply and use (in which average SUI was greater than [>] 0.6) had much higher water consumption and lower supply than the average HUC12 (Stets and others, 2025b). Nearly 90 percent of these HUC12 watersheds were dominated by consumptive use for crop irrigation; much smaller percentages were dominated by either public supply or thermoelectric consumptive use (Stets and others, 2025b). The finding of elevated water stress in agriculture-dominated areas is replicated in other studies (Konar and Marston, 2020).
Densely populated areas often do not show direct water shortages, but they do rely on indirect water use, which is the consumption of energy, agricultural goods, or industrial products that were produced with water in another geographic region. This concept is also known as “virtual water” (Garcia and Mejia, 2019). Virtual water transfers occur at many different scales, usually remaining within a region, although inter-regional and international transfers can also be important (Garcia and Mejia, 2019). In urban areas of the CONUS, indirect water consumption is as much as 20 times larger than direct water consumption (Chini and others, 2017). Broadly encompassing estimates of water consumption through direct and indirect means suggest that more than one-half of total water consumption in the United States occurs in cities (Rushforth and Ruddell, 2018). This finding emphasizes that populated areas can have greater exposure to water availability problems than is initially evident from analysis of direct water consumption as is typically done in water availability assessments.
Seasonal cycles in SUI are commonly observed because of seasonal drying and increased need for crop irrigation water during specific times of the year (Mekonnen and Hoekstra, 2016). In many parts of the CONUS, consumptive water use peaks during dry summer months when crop irrigation demands are at their maximum and outdoor use of public-supply water is highest (chap. D, Medalie and others, 2025). Thus, lower supply is often matched with increased use, which increases SUI (fig. 6; Stets and others, 2025b). In many catchments, short-term water stress due to supply and use imbalance is mitigated by water storage in local reservoirs or by switching sources during droughts. In the Western United States, snowpack serves as a perennial water source, which sustains ecosystems and human populations during dry summer and autumn seasons (Dettinger, 2005). In other cases, interbasin transfers (IBTs) are used to supplement local water supplies either seasonally or year-round.
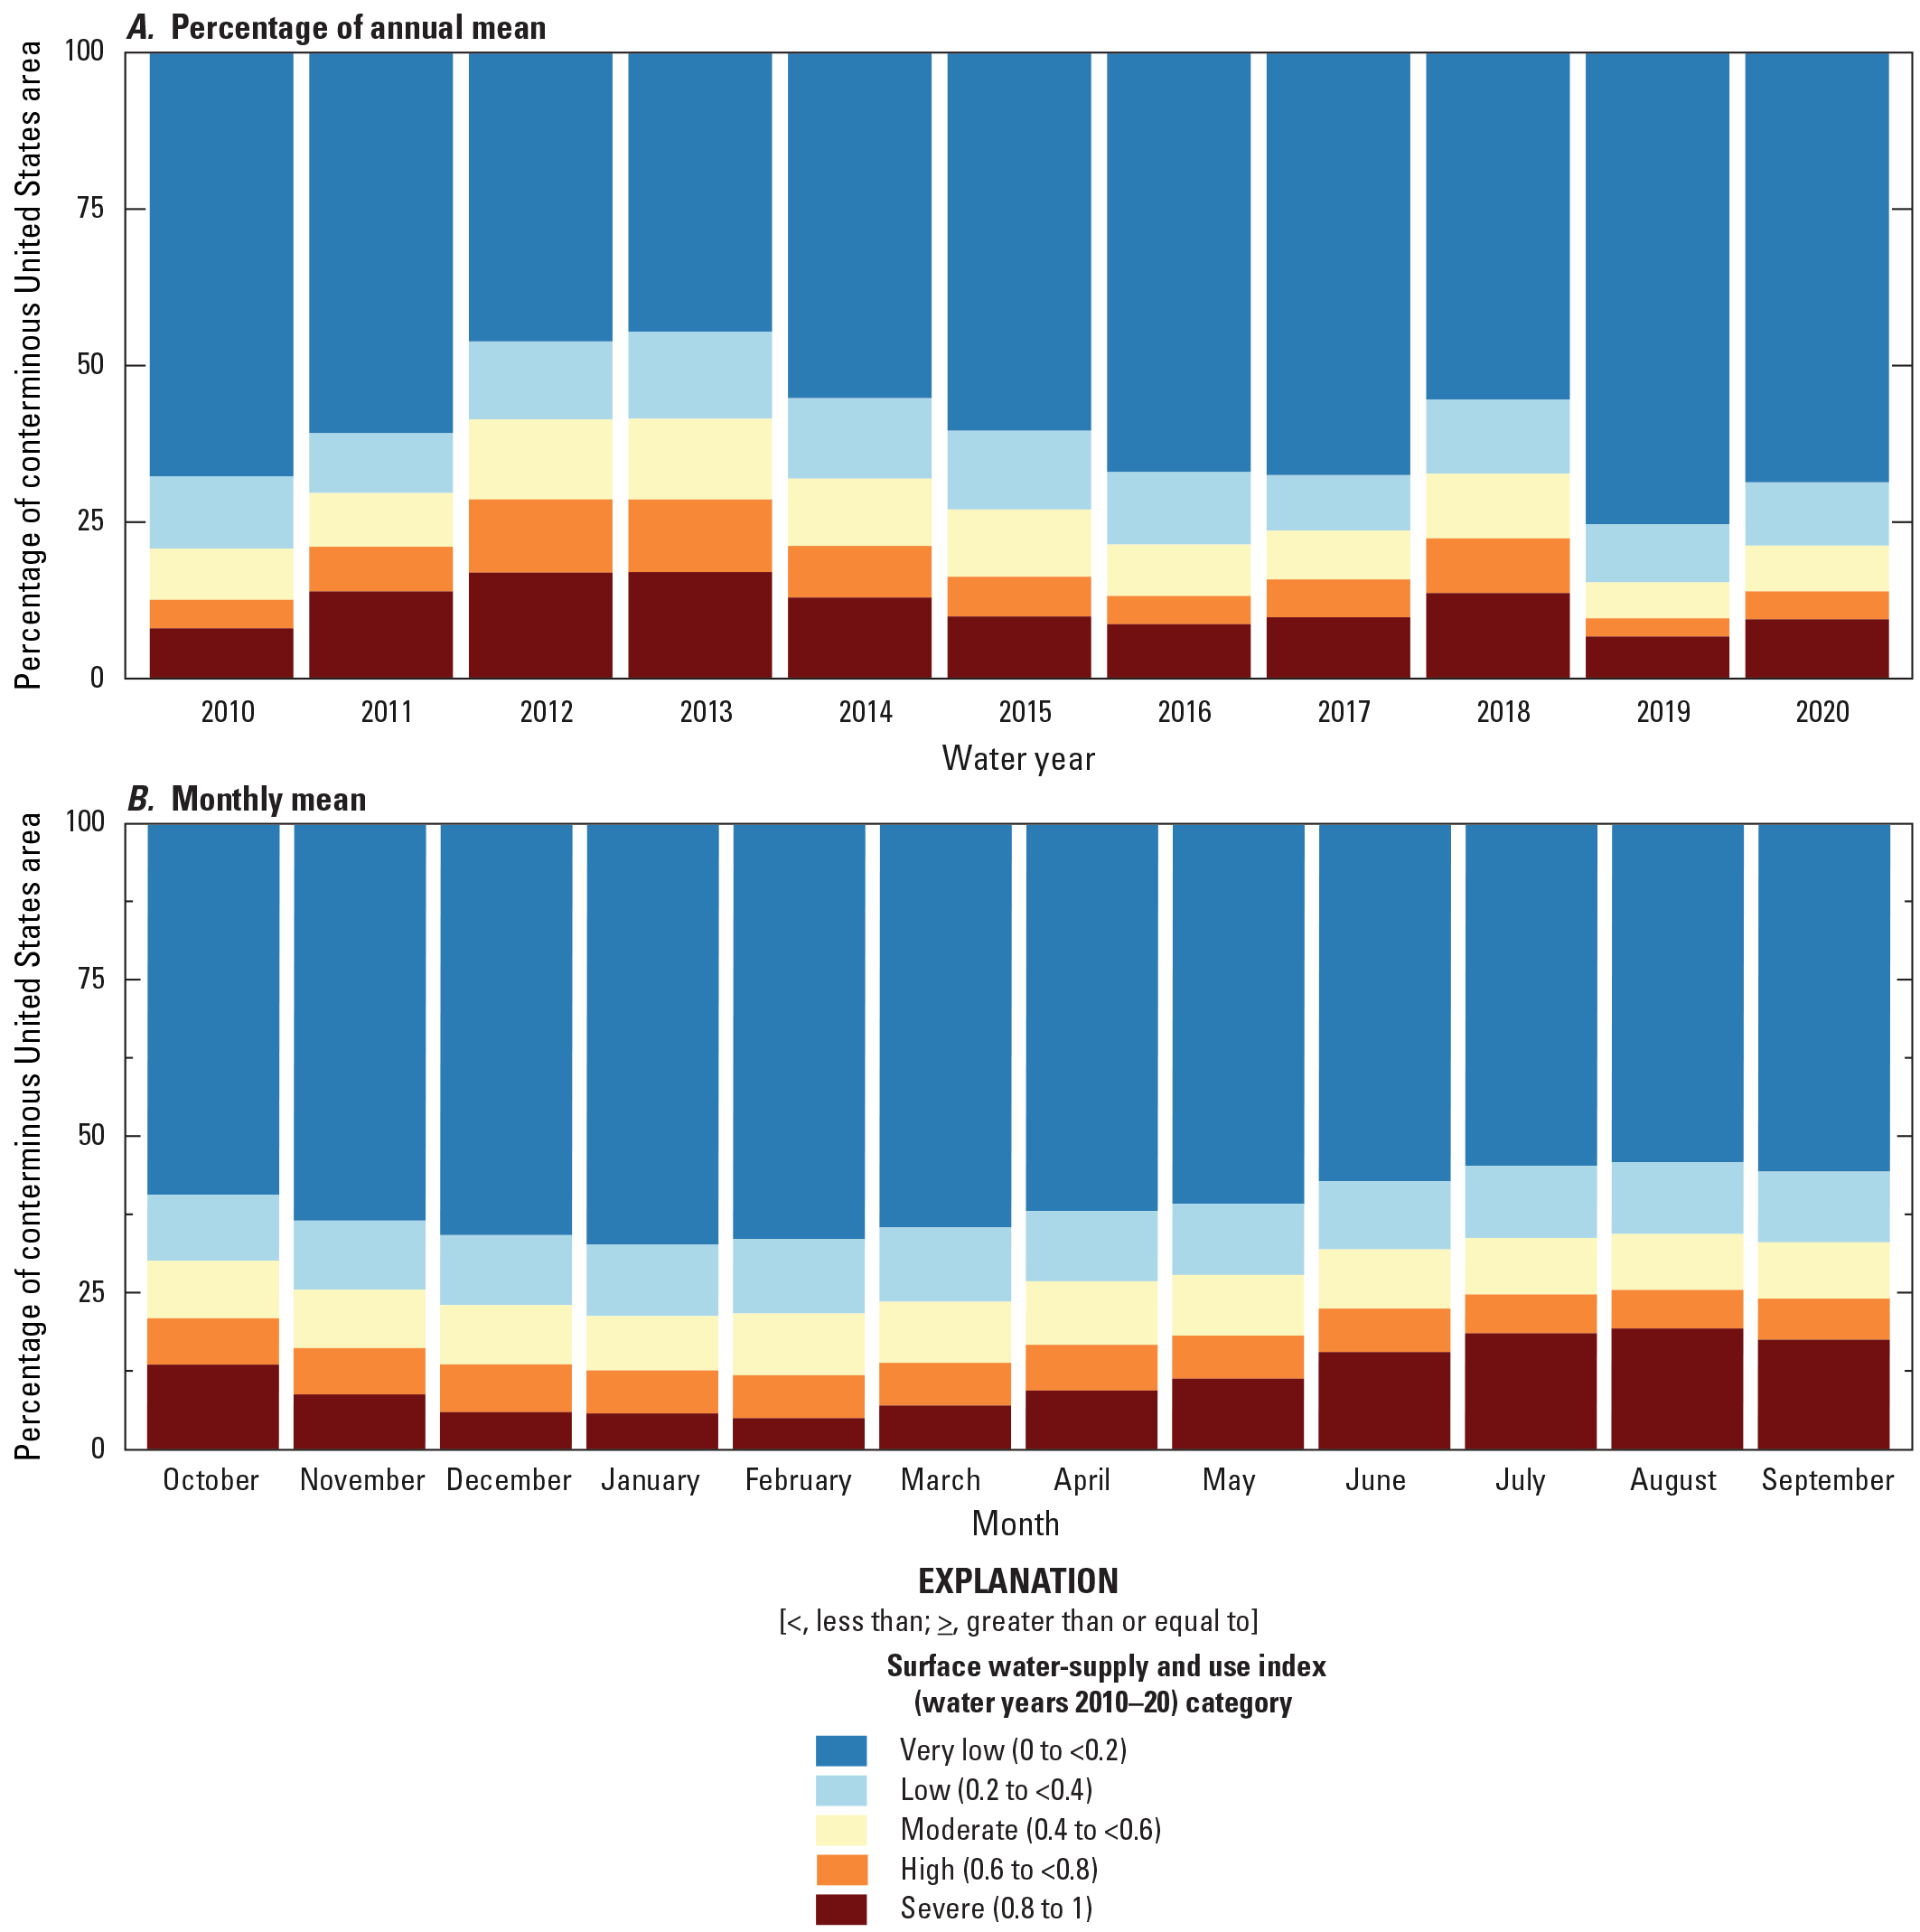
(A) Annual mean percent coverage of different surface water-supply and use index (SUI) categories and (B) monthly mean percent coverage of different SUI categories; and boxplots showing (C) comparison of indexed water use, water supply, and SUI by year; and (D) comparison of indexed water use, water supply, and SUI values by month, in the conterminous United States, water years 2010–20. Elements of this figure appear in Stets and others (2025b). Calculation of indexed water-supply and water-use values is described in appendix 1.
IBTs are an important factor in meeting water demands where supply is low. Throughout the CONUS, billions of cubic meters of water are transferred between basin boundaries and can be a substantial fraction of annual streamflow in some cases (Emanuel and others, 2015). Basins receiving water from an IBT gain water supplies that exceed natural inputs, which can alleviate water shortages or support consumption in excess of natural supply. Public water utilities commonly rely on IBTs to provide high-quality water from more remote, but often more pristine watersheds (Liu and others, 2022). However, the reliance on IBTs can leave the receiving basin vulnerable in situations where the donor basin also has a water shortage during dry periods. IBTs are often located between basins that have similar climate characteristics, which may reduce the resilience provided by the IBT in prolonged droughts (Emanuel and others, 2015).
Despite the importance of IBTs, a comprehensive, high-resolution national database monitoring these water transfers does not currently exist (chap. D, Medalie and others, 2025). Compilations of IBTs have existed for decades (Mooty and Jeffcoat, 1986; Petsch, 1989), although the limitations of these efforts have been noted in recent studies (Dickson and Dzombak, 2017; Dobbs and others, 2023). Updates to IBT databases include (1) a national database of water transfer infrastructure (for example, artificial paths, canals and pipelines) at the 6-digit hydrologic unit code (HUC6) level, excluding volumetric information (Dickson and Dzombak, 2017); (2) a CONUS-scale database of public water-supply IBTs at the 8-digit hydrologic unit code (HUC8) scale with volumetric information (Dobbs and others, 2023); and (3) a U.S. and Canada database of irrigation, public-supply or multipurpose IBT at 4-digit hydrologic unit code (HUC4) level with some flow volume data (Siddik and others, 2023). Construction of a comprehensive database has proven to be difficult given the range of institutions involved in establishing IBTs and the sensitivity of the information, often requiring extensive efforts to gather data from multiple interviews, document analysis, and requests through the Freedom of Information Act. Although records have improved, a database at the appropriate scale (in other words, HUC12) with transfer volume information, did not exist at the time of this assessment and therefore was not included.
Flow Limitations to Ecological Water Availability
Environmental flow requirements (EFRs) are defined as the quantity, timing, and quality of water flows required to sustain freshwater and estuarine ecosystems and the human livelihoods and well-being that depend on these ecosystems (Arthington and others, 2018, p. 1,023). The natural flow regime consists of a diverse set of flow conditions responsible for habitat creation and persistence (Poff and others, 1997; Poff and others 2010; Yarnell and others, 2020). Natural flow regimes vary across the country because of topographic, geologic, and climatological drivers (Archfield and others, 2014). The ecological communities in these environments are composed of species with life-history requirements that are compatible with the local flow conditions (Lennox and others, 2019; Freeman and others, 2022). Alterations to the natural flow regime therefore have the potential to limit ecological water availability through numerous mechanisms, reflecting the myriad ways in which flow and ecological condition are linked. Limitations include direct stress on organisms (Bipa and others, 2024), mismatches to life-history requirements (Arthington and Balcombe, 2011; Amtstaetter and others, 2021), and changes to the functional flows necessary to create and sustain required habitats (Wharton and others, 2017; Lennox and others, 2019; Hitt and others, 2020; Comte and others, 2021; Kemp and Kemp, 2023; Cashman and others, 2024). Changes in flow can also indirectly alter ecosystems by altering hydrologic connectivity and biogeochemical processing in the river corridor (Colangelo, 2014; Harvey and others, 2019).
Multiple conceptual approaches exist to create quantitative thresholds for EFRs to evaluate where ecological water availability is limited (Tharme, 2003; Acreman and Dunbar, 2004; Poff and others, 2010). However, many approaches lack a grounding in empirically based flow-ecology relationships and instead leave environmental sensitivity factors unaddressed (Davies and others, 2014). In large regional and global water-availability assessments, empirically derived EFRs are often difficult to define because of the complex and variable ecosystem responses to flow alteration, and the inherent variability in natural flow regimes and ecological sensitivity across large spatial areas (Vanham and others, 2021; Freeman and others, 2022). Additionally, large-scale hydrologic models are not usually developed or calibrated to accurately reproduce ecologically relevant aspects of the flow regime (Parker and others, 2019), or do not quantify alterations from natural conditions at spatial and temporal scales relevant to evaluate ecological impacts (Murphy and others, 2013; Vanham and others, 2021).
Instead, many water-availability assessments use simplified assumptions about EFRs using a concept known as a presumptive standard, an approach that allocates a proportion of volumetric water supply to environmental flows; flows less than this threshold indicate a presumed ecological impact (Richter and others, 2012; Pastor and others, 2014; Mekonnen and Hoekstra, 2016; Liu and others, 2017a). Presumptive standards can be calculated at annual, seasonal, monthly, or daily timesteps and, depending on the method, may vary allocations based on season or different qualitative ecological targets. However, there can be large variability and uncertainty across existing presumptive-based EFR methods because of the numerous existing methodologies and lack of data-driven validation, which can result in a wide range of potential metric values—and inferred water stress—from the results of water-budget analyses (Liu and others, 2017a; Liu and others, 2021; Stets and others, 2025b). For example, some presumptive standards recommend that 80–90 percent of natural flows are needed year-round to sustain aquatic ecosystems (Richter and others, 2012), which would imply that large areas of the CONUS currently shown in figure 2 to have low SUI actually have water shortages, from an environmental flows perspective, because water use reduces flows below these presumptive standards.
A variation of the presumptive standards approach was used to identify numerous common native fish species, recreationally important fish species, and fish species of conservation concern (in other words, species contained in the Species of Greatest Conservation Need national database [U.S. Geological Survey, 2024a]), with large proportions of their habitat ranges exposed to supply and use imbalances during physiologically sensitive spawning seasons (fig. 7; Stets and others, 2025b). The Arkansas river shiner (Notropis girardi), a federally listed species, was determined to have >50 percent of its habitat range in severe supply and use imbalance (defined as <20 percent of natural flow volume remaining) during its spawning season (fig. 7). The plains killifish (Fundulus zebrinus) and Utah sucker (Catostomus ardens) were each reported to have >40 percent of their habitat range in high or severe supply and use imbalance (fig. 7). Numerous other State-identified fishes of conservation concern were also identified as being exposed to high levels of supply and use imbalance in spawning seasons, including the plains minnow (Hybognathus placitus), with more than 25 percent of its habitat range in either high or severe supply and use imbalance (fig. 7).
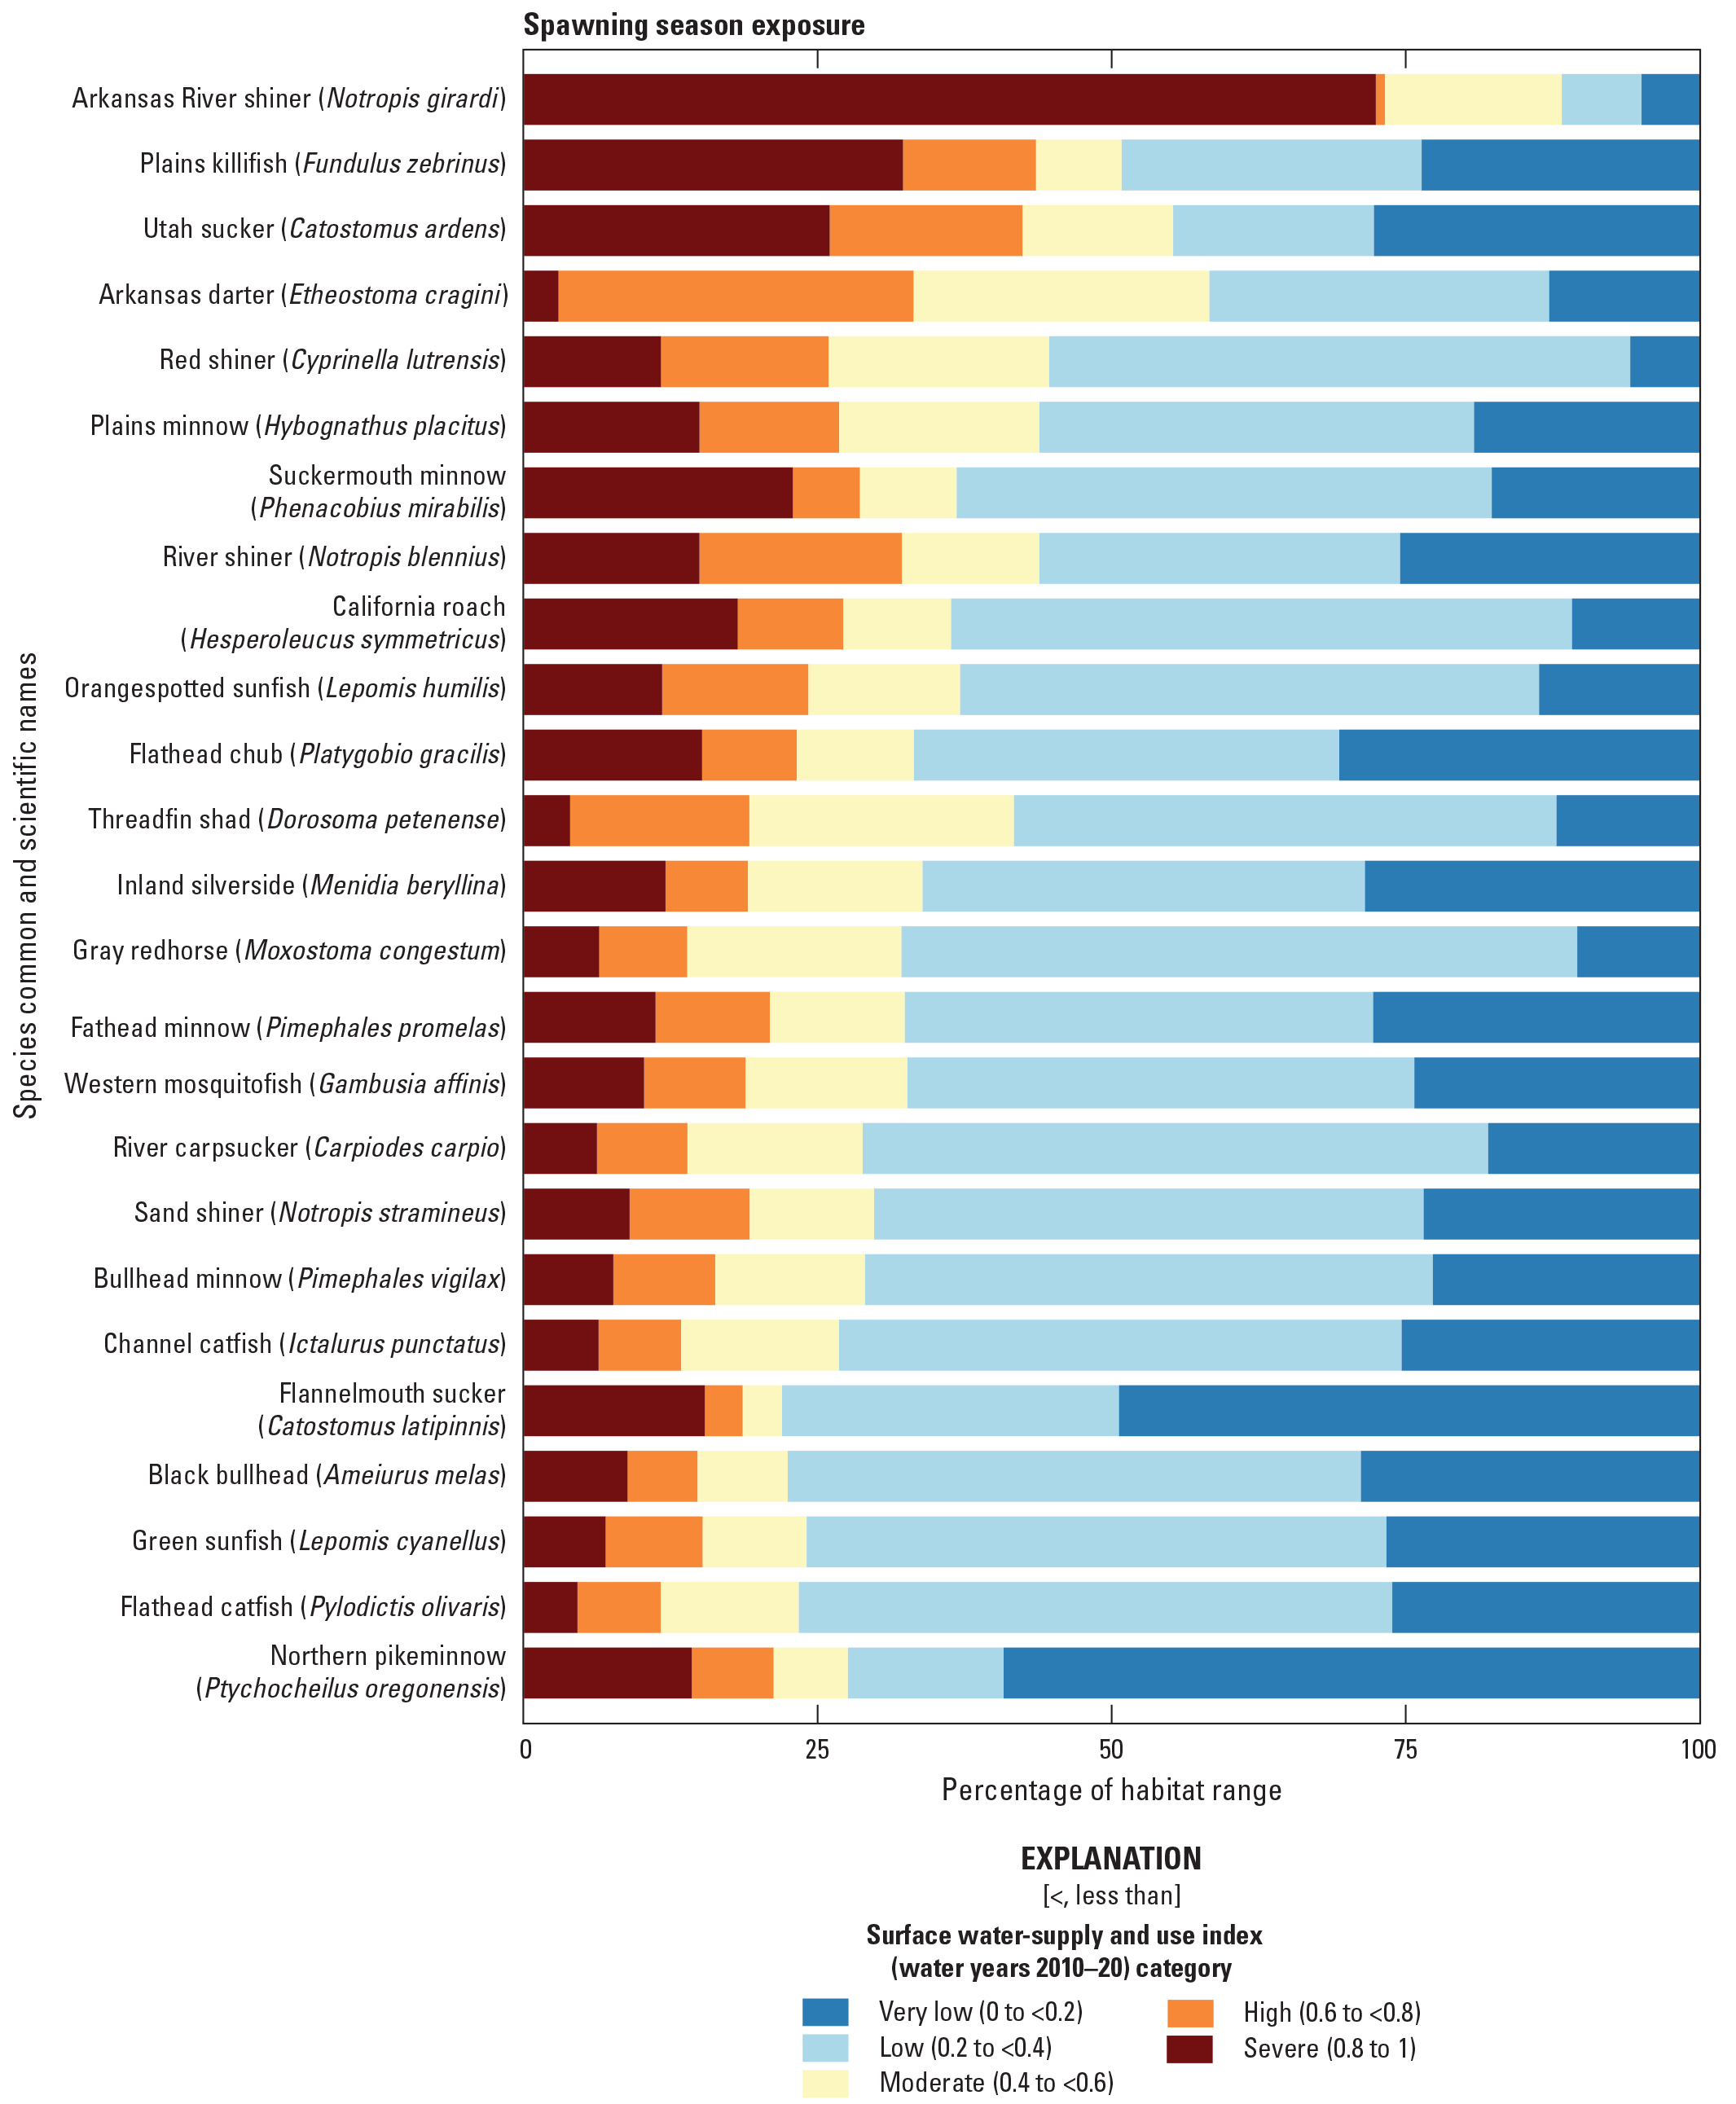
Top 25 exposed fish species, ordered according to their average surface water-supply and use index (SUI) in their habitat range, disaggregated by proportion of their respective habitats in each SUI class during their spawning months. Figure from Stets and others (2025b).
Presumptive standards, however, mask the more complex reality of how flow-regime alterations can affect ecological condition and limit ecological water availability, even when volumetric flows appear otherwise “unaltered.” Analyses of the flow regime and ecological flows at the CONUS scale have identified widespread alteration to flow magnitude, timing, duration, frequency, variability, and rate of change at high and low flows (Carlisle and others, 2019; Eng and others, 2019; McManamay and others, 2022). Flow alterations were commonly determined to limit ecological water availability across the CONUS (fig. 8) even though the specifics of flow-ecosystem responses varied geographically (Carlisle and others, 2017, 2019; George and others, 2021). Flow alteration can limit ecological water availability in areas with adequate total water supply, such as in the humid Eastern United States (fig. 3), which might be otherwise overlooked by presumptive EFR analyses. In particular, the Northeast hydrologic region was identified as having the greatest percentage of river miles altered for ecological flows (fig. 8B), due to high regional sensitivity within the ecological community (Carlisle and others, 2019) and exposure to many altered aspects of the flow regime. Overall, altered long-term flow regimes across the CONUS are predominantly due to anthropogenic land use and water management, although climate-induced changes are also a factor in flow-regime alteration when examined at near-reference U.S. Geological Survey (USGS) streamgages (Carlisle and others, 2019).
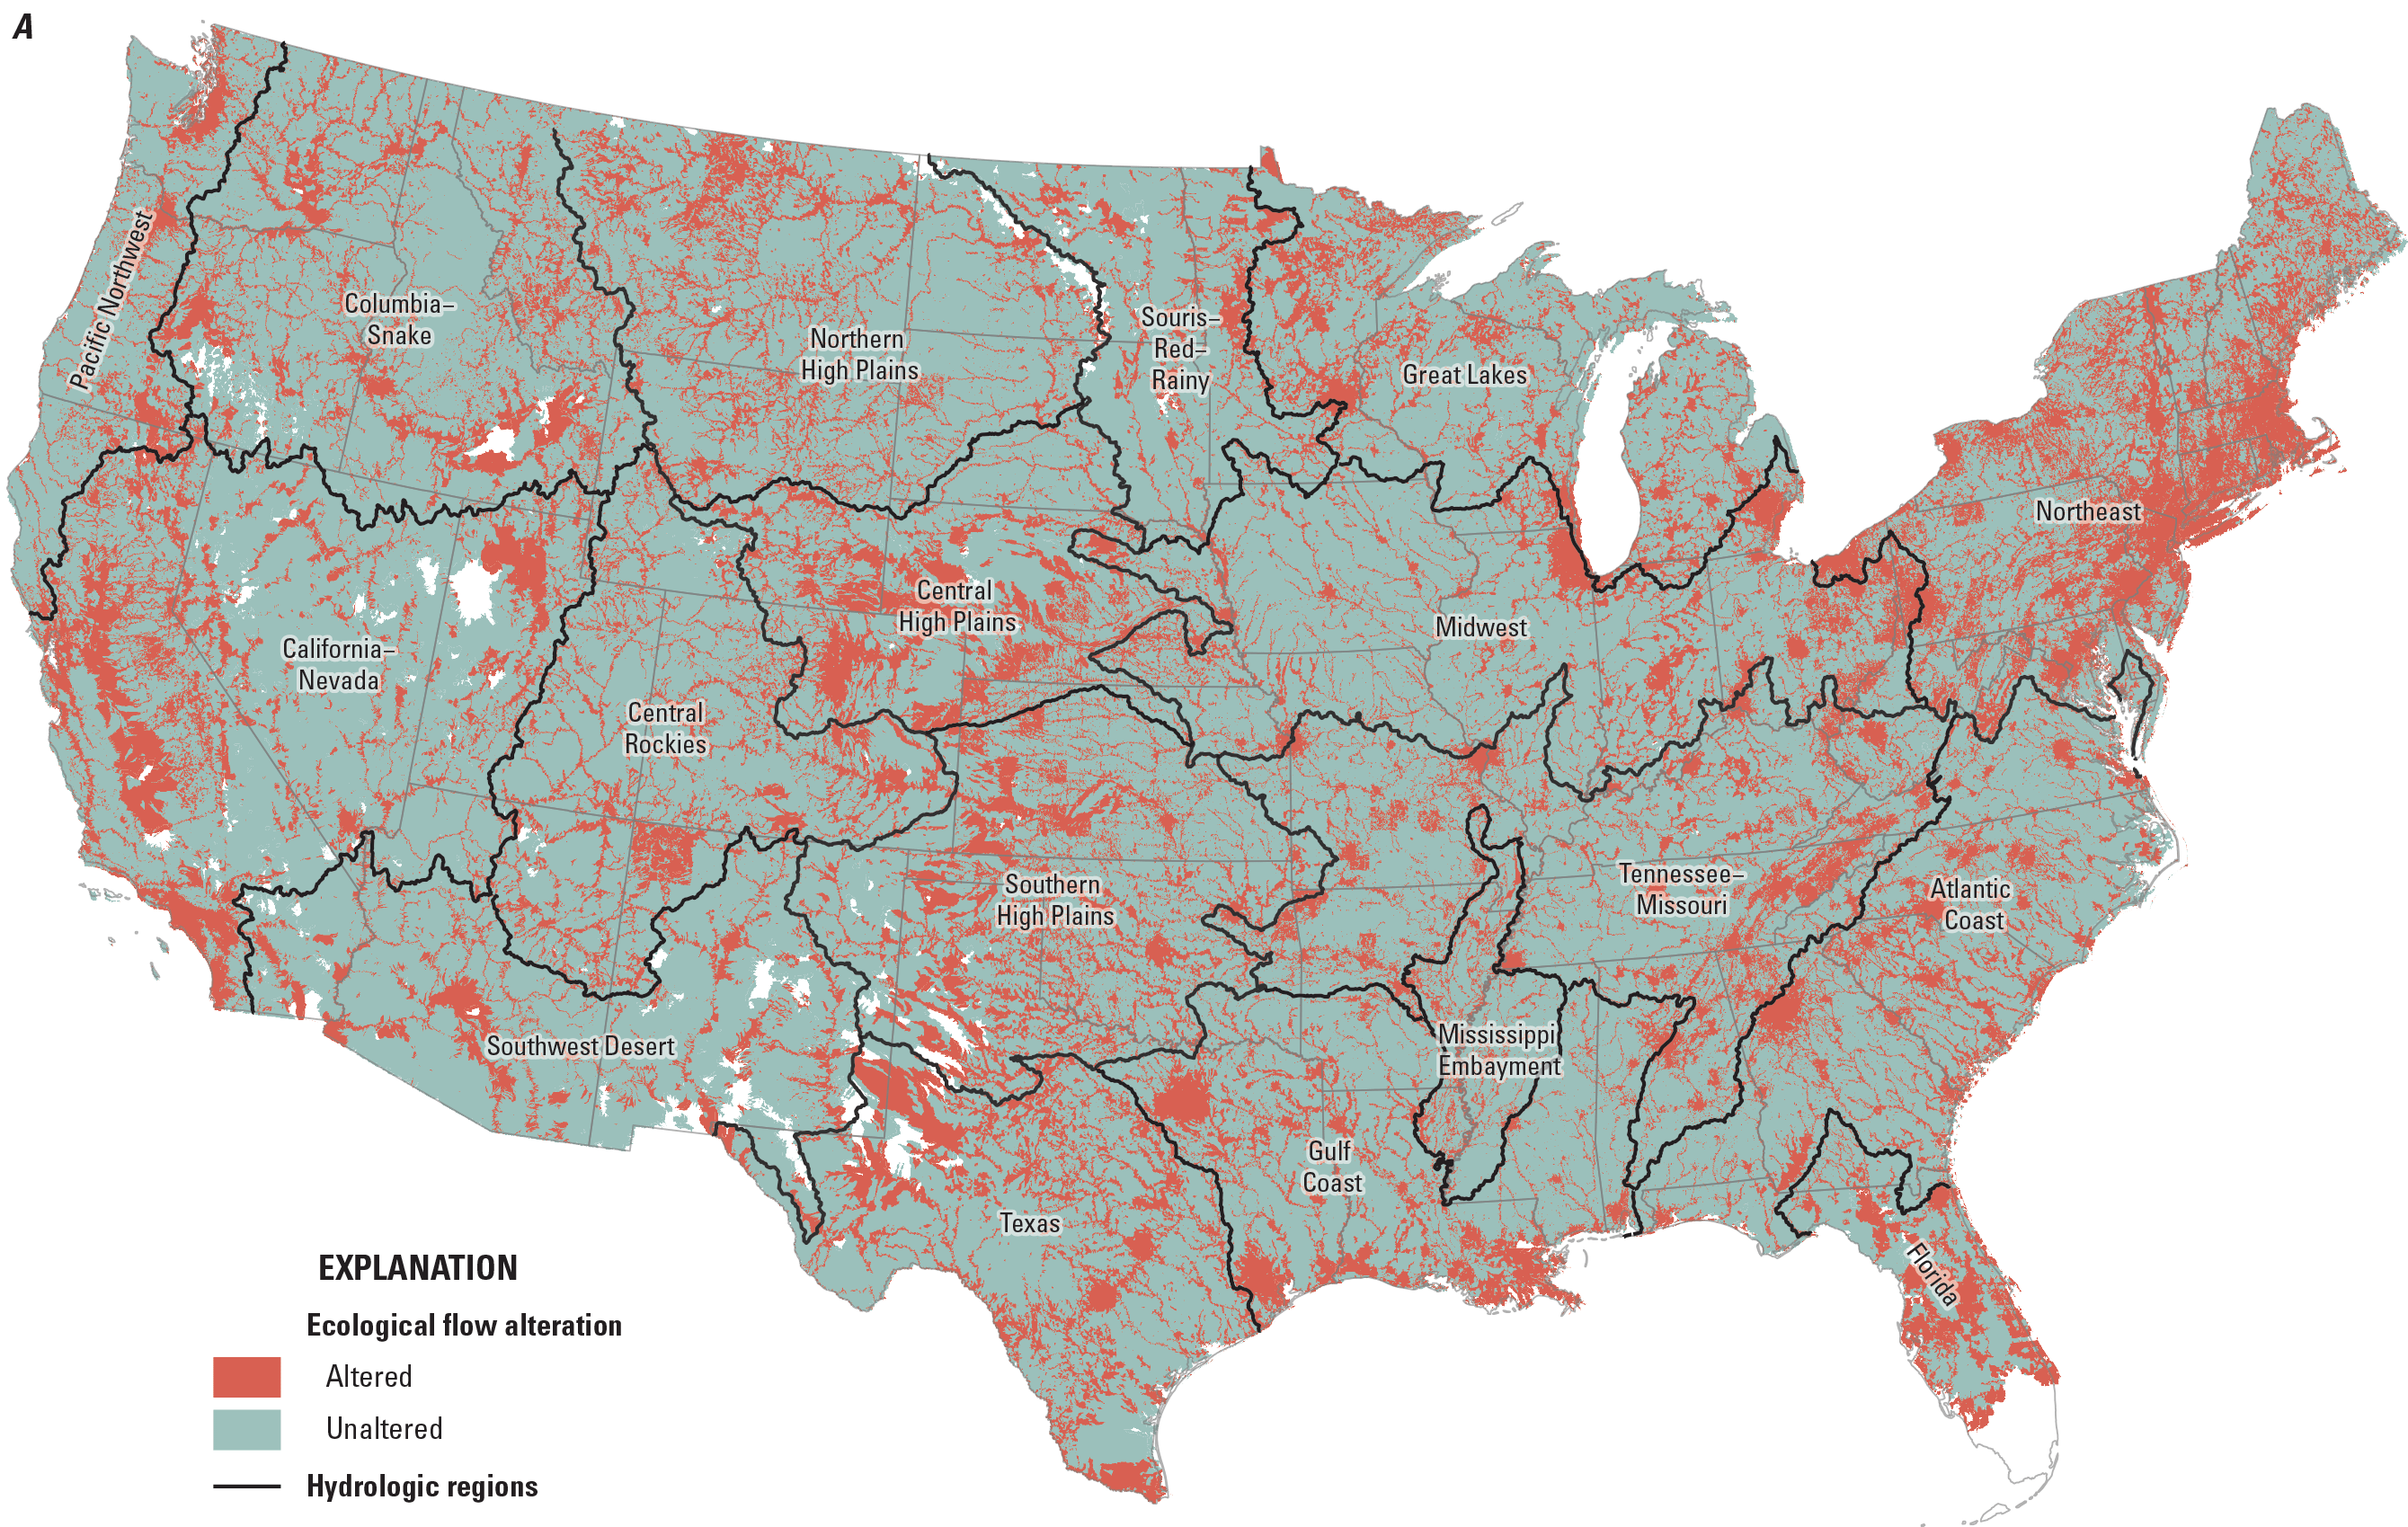
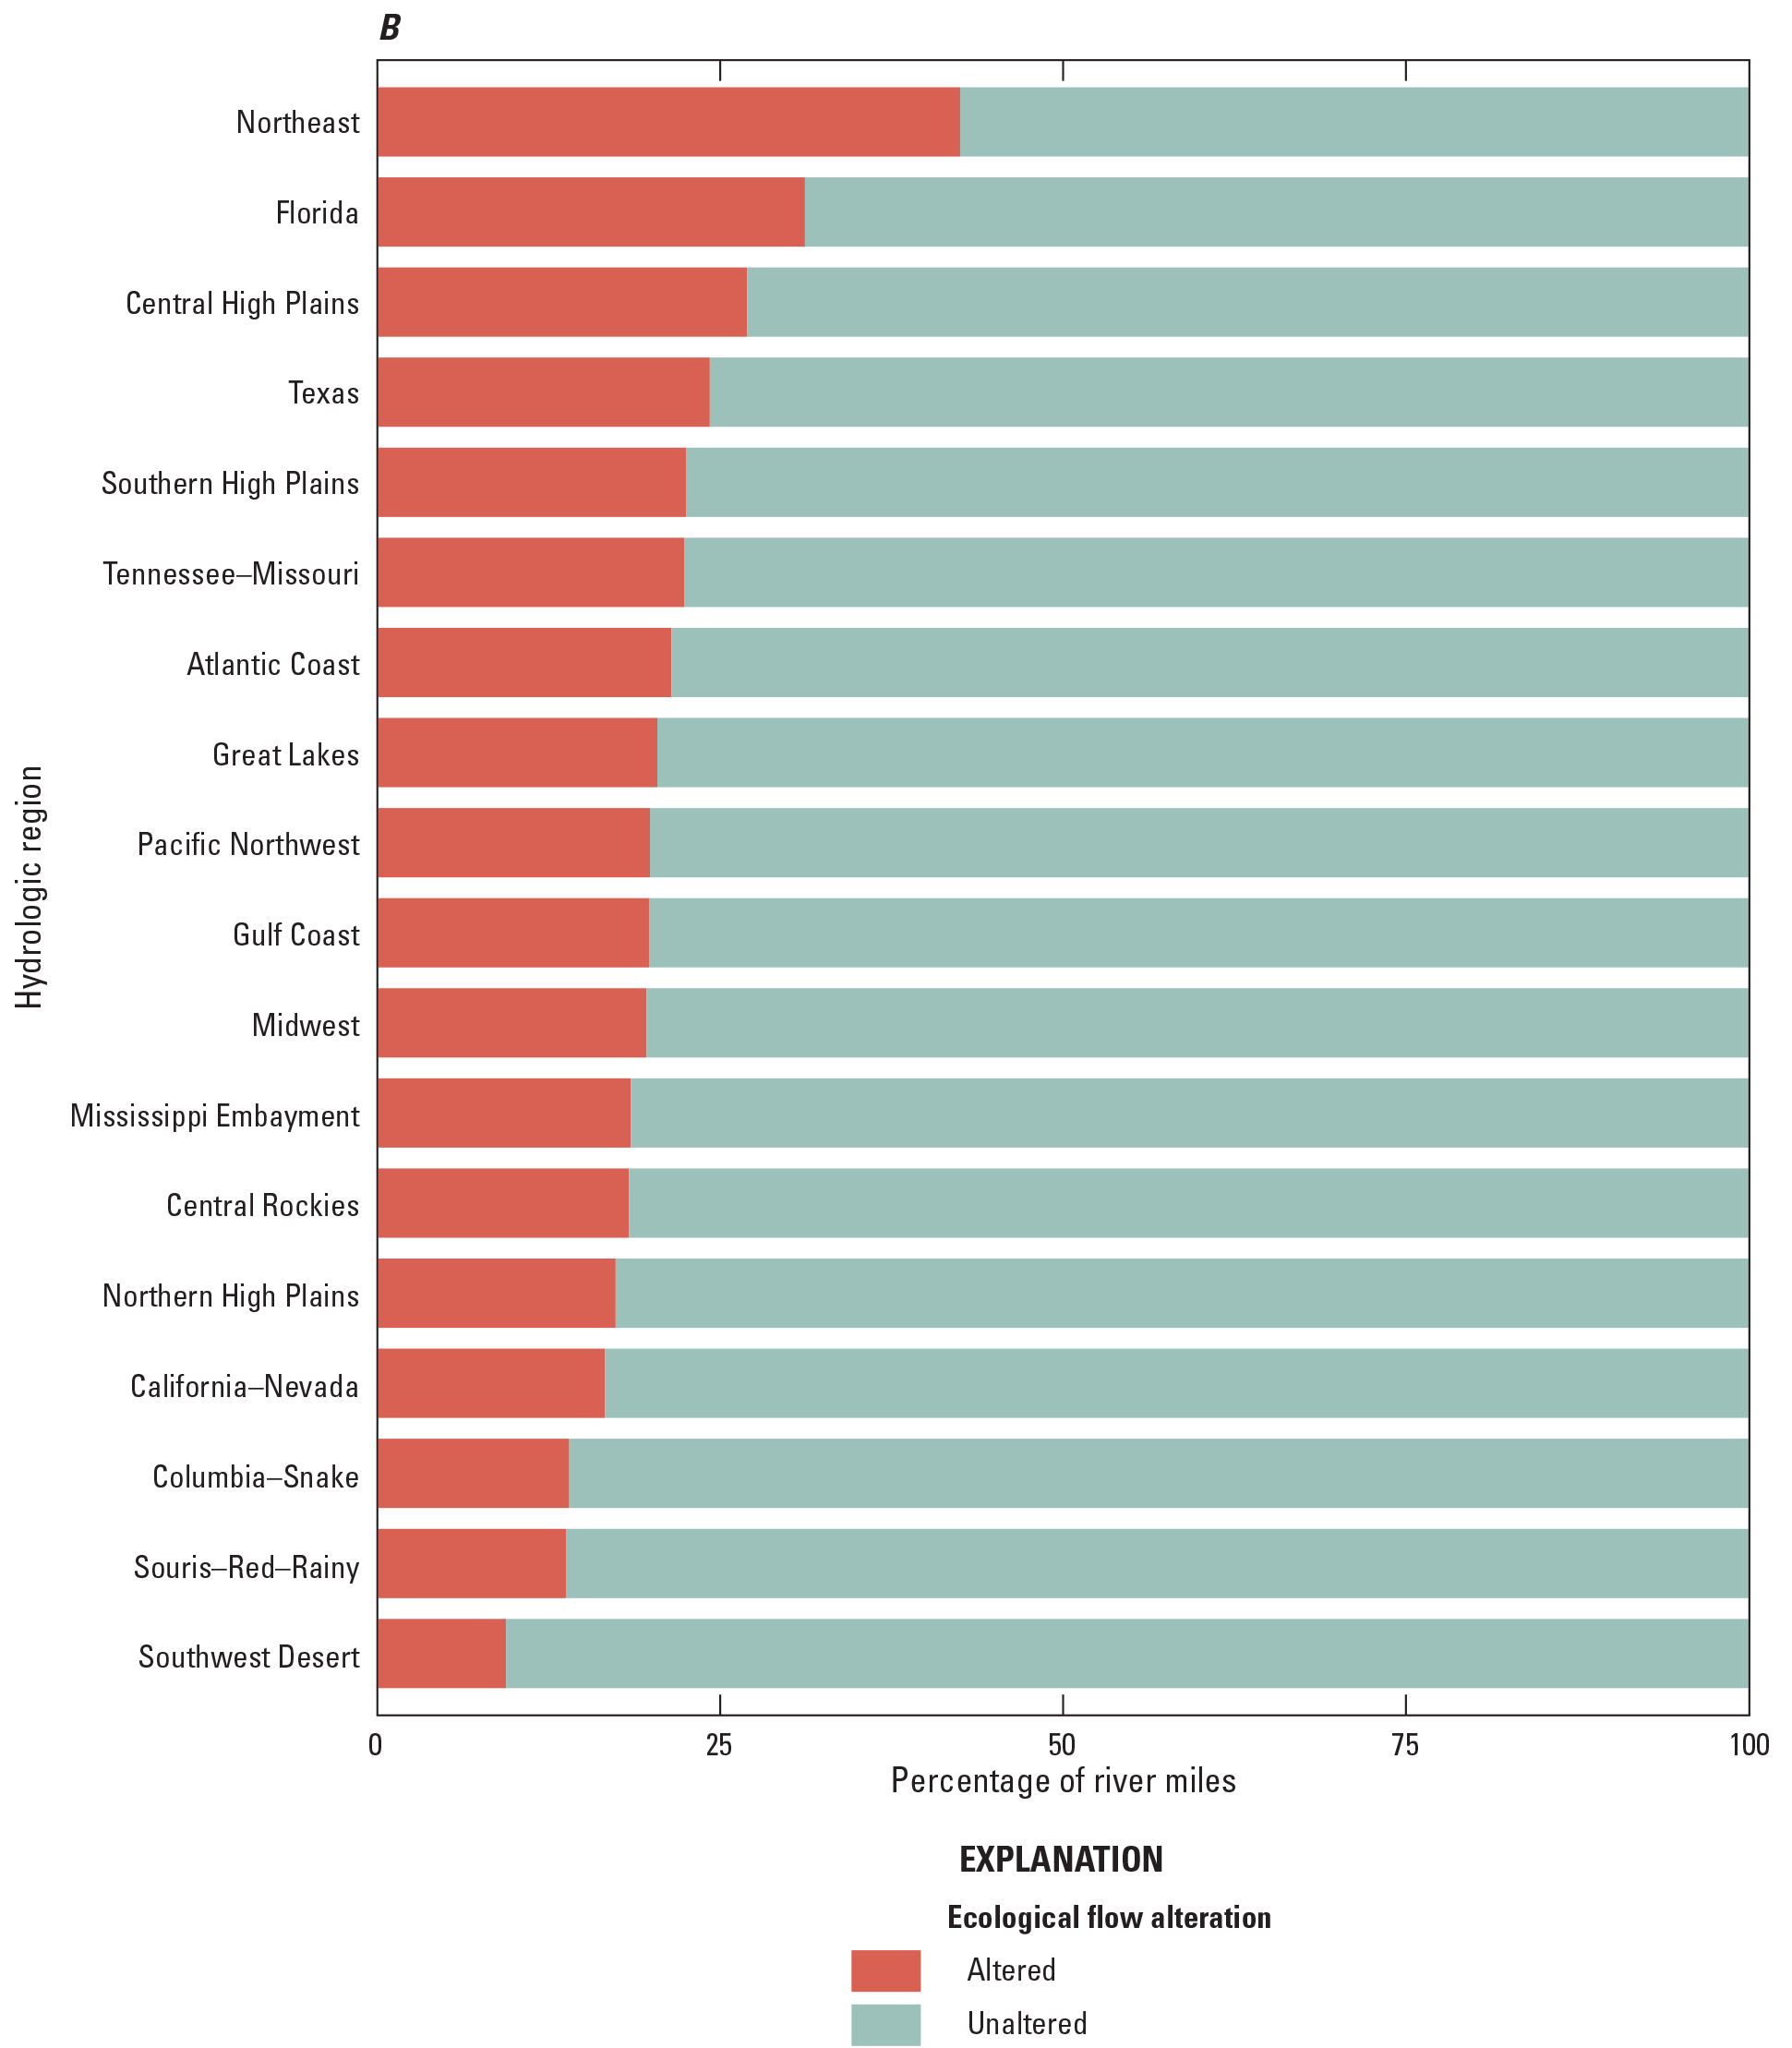
(A) Ecological water availability for the conterminous United States, represented by predictions of altered flow regime metrics—low and high flow magnitude, duration, and variability—determined to be regionally relevant to ecological conditions by Carlisle and others (2019). “Unaltered” does not indicate that there is no predicted hydrologic alteration in that area but that there were no flow attributes that were altered and determined to be related to regional ecological condition. (B) Percentage of all river miles within each hydrologic region of the conterminous United States with ecologically relevant flow alteration. White areas within the map were excluded from analysis.
Across the humid and arid parts of the United States, reservoirs, impoundments, and diversions are operated for hydroelectric power, flood control, drinking water, crop irrigation, and other purposes. These water-management structures can affect the flow regime through water storage and releases affecting the timing, seasonality, frequency, and (or) rate of change of flows (Kennedy and others, 2016; Eng and others, 2019; Moreira and others, 2019), even if total flow volume remains equivalent. The capture of snowmelt runoff in spring and release in low-flow summers can alter seasonal patterns in timing, reduce peak flow and variability, and result in increased flows during low-flow seasons (Eng and others, 2019). Hydropeaking, the sudden release of water from reservoirs for hydroelectric generation or other purposes (Bipa and others, 2024), can have strong negative impacts on ecosystems in downstream tailwaters, as the increase in variability and sudden release and change in flows can cause physical dislodgement and increase aquatic organism energy expenditure. Water-storage decisions can therefore have large impacts on local ecosystems and downstream fisheries (Dibble and others, 2021), and their longitudinal effects on down-river systems can be seen in the dendritic patterns of flow alteration along major river systems across the CONUS (fig. 8).
Anthropogenic land cover, such as urban areas and impervious surfaces, can also affect flow attributes by increasing the rate of runoff, resulting in greater high flow magnitudes and high flow frequency, while decreasing flow durations (Eng and others, 2019). Major metropolitan areas are particularly evident across the CONUS as spatial clusters of limited ecological water availability (fig. 8), because altered flows can cause channel instability and alter habitat (Kaufmann and others, 2022; Cashman and others, 2024). Agricultural areas also have the potential to alter multiple aspects of the flow regime, not only by expected changes from water withdrawals to low-flow magnitude and variability, but also by potentially resulting in the diminished high-flow magnitude and changes to skew in the distribution of daily flows across the entire hydrograph (Eng and others, 2019).
Water-Quality Components of Water Availability
Water quality is defined here as a “measure of the suitability of water for a particular use based on selected physical, chemical, and biological characteristics” (Cordy, 2001, p. 1). Natural and human factors—including sources, processes, and their interactions—influence water quality; natural factors include climate, hydrology, land cover, geology, and soils, whereas human influences include land and water use and management. Climate determines the amount and rates of water available to dilute or transport constituents, as well as water temperatures, which in turn affect bacterial and phytoplankton growth rates (Michalak, 2016). Flow influences water quality, with constituent concentrations either increasing or decreasing with changes in flow, depending on the dominant sources in a particular stream reach; other direct effects such as flow turbulence increase dissolved oxygen (chap. C, Erikson and others, 2025). Groundwater flow, residence time, and physicochemical setting similarly influence water quality through reactive or nonreactive transport of constituents through the subsurface (chap. C, Erickson and others, 2025). Interactions between natural and human factors are important too; for example, climate influences water management, water use, and land use, which in turn impact water quality. Interactions between multiple constituents and between different water sources (for example, groundwater and surface water) can also influence water quality. Mixtures of multiple constituents can also have compounding effects, as different users may have elevated sensitivity when exposed to multiple water-quality issues at once (Kaushal and others, 2018b; Waite and others, 2019, 2021).
Water use influences water quality through the introduction of contaminants and the alteration of other water-quality conditions (for example, temperature). Water use can transport constituents to waterbodies and alter temperatures through return flows and enhanced groundwater recharge. Irrigation can adversely affect water quality—through introduction and transport of contaminants, including nutrients, salinity, sediment, pesticides, pharmaceuticals, and microbial pathogens—in surface and subsurface water systems (chap. C, Erickson and others, 2025). Discharge of wastewater from public-supply facilities introduces a wide range of constituents, including pharmaceuticals and endocrine-disrupting pollutants, that can substantially reduce water availability due to harmful effects in some areas (Carey and Migliaccio, 2009; Siddiqui and others, 2020) and particularly for effluent-dominated stream systems during low-flow conditions (Rice and Westerhoff, 2017; Wolfand and others, 2022). Disinfectants and disinfection byproducts introduced during the water-treatment process are the leading cause of health-based violations for community water systems (U.S. Environmental Protection Agency, 2019; Scanlon and others, 2022). Thermoelectric power plants discharge large volumes of warm water, and such thermal pollution can negatively affect aquatic communities (Logan and Stillwell, 2018; Chini and others, 2020).
Water use can also impact water quality through alteration of water quantity (both increases and decreases), including the timing, magnitude, and location of water. Use can reduce the amount of relatively unpolluted water relative to degraded water and volumetric losses from water consumption can reduce the amount of water available to dilute contaminants (Kaushal and others, 2023). Water use can also require storage and translocation, which can alter the timing, magnitude, and location of water. Subsequent impacts include altered biogeochemical processes that can improve or degrade water quality, including retention and flushing in soils and sediment, biological uptake, and ecosystem composition and metabolism (Brooks and others, 2006; Fornarelli and Antenucci, 2011; Caldwell and others, 2012; Kuriqi and others, 2021).
Degraded water quality can limit water availability for multiple uses, each with its own water-quality requirements and consequences for failing to meet standards. Degraded water quality can result in threats to human or ecological health, loss of aesthetic or recreational uses, increased socioeconomic costs for use or maintenance, or complete limitations on water use. Corrosion of infrastructure, reduced crop yields, poor taste, impeded navigation, and economic impacts can all result from poor water quality (chap. C, Erickson and others, 2025). Drinking water can be affected by high concentrations of constituents with geologic sources including arsenic, manganese, strontium, radionuclides, fluoride, and lithium, as well as salinity and nitrogen in groundwater. Harmful algal blooms, sediment, salinity, nitrogen, pathogens, pesticides, and metals commonly limit suitability of surface water for drinking water as well, often requiring expensive treatment (chap. C, Erickson and others, 2025). Agricultural irrigation and thermoelectric power generation have lower water-quality requirements than many other uses, but poor water quality can result in reduced crop yields, infrastructure damage, and reduced economic returns. Ecological water uses are commonly affected by nutrients, sediment, temperature, and pathogens, as well as salinity, pesticides, metals, low dissolved oxygen, and contaminants of emerging concern (Schmidt and others, 2019; Waite and others, 2021; chap. C, Erickson and others, 2025). Further discussion of water-quality limitations of ecological and human uses is covered elsewhere in this report (chap. C, Erickson and others, 2025).
CONUS-scale modeling of surface water and groundwater quality provides important insights into the spatial distribution of water-quality limitations of water availability. Models of total nitrogen and total phosphorus in streams and nitrate and arsenic in groundwater reveal spatial variations in the percentage of a region with concentrations greater than benchmarks that are used here to indicate a use sensitivity to water-quality conditions. The surface-water and groundwater analyses pertain to likely potential limitations affecting a common water use for each resource. For surface water it is ecological water use and for groundwater it is drinking-water uses. However, they have different sensitivities and criteria thresholds, including for evaluation of regulatory and health impacts.
We compared CONUS-wide stream nutrient concentrations predicted using the SPAtially Referenced Regressions On Watershed attributes (SPARROW; Ator, 2019; Hoos and Roland, 2019; Robertson and Saad, 2019; Wise, 2019; Wise and others, 2019) model to the U.S. Environmental Protection Agency (EPA) National Rivers and Streams Assessment (NRSA) regional “Good” water-quality criteria for near-reference, least disturbed ecological conditions (U.S. Environmental Protection Agency, 2020; chap. C, Erickson and others, 2025). We compared predicted groundwater nitrate and arsenic concentrations to their respective EPA drinking water Maximum Contaminant Levels (MCLs) and Maximum Contaminant Level Goals (MCLGs). The MCLG is a non-enforceable goal that considers only public health and is the maximum level in drinking water at which no known or anticipated health human health effect is likely to occur. In contrast, the MCL is a regulatory enforceable standard that is set as close to the MCLG as feasible but evaluated through a health-reduction and cost-risk analysis given cost and technological limitations. For nitrate, the MCL and MCLG are equivalent, whereas for arsenic, the MCLG is set at zero (in other words, any concentration may have health impacts).
Nutrient concentrations predicted from regional SPARROW models in streams that exceeded near-reference conditions were widespread (fig. 9). Mean annual nutrient concentrations in streams are estimated to be four or more times the EPA NRSA near-reference “Good” benchmark in more than 50 percent of the Souris–Red–Rainy, Midwest, Central High Plains, Southern High Plains, Northern High Plains, Mississippi Embayment, Tennessee–Missouri, and Central Rockies hydrologic regions (fig. 9). Application of fertilizer and manure for agriculture is a major source of nutrients to streams and groundwater in these regions (chap. C, Erickson and others, 2025). Hydrologic regions with relatively lower total nitrogen concentrations include Florida, Gulf Coast, and Great Lakes, each of which had concentrations less than or equal to (≤) 2 times near-reference conditions across most of their area. Likewise for total phosphorus, only the Florida, Great Lakes, and Texas hydrologic regions had concentrations ≤2 times near-reference conditions in most of their area.
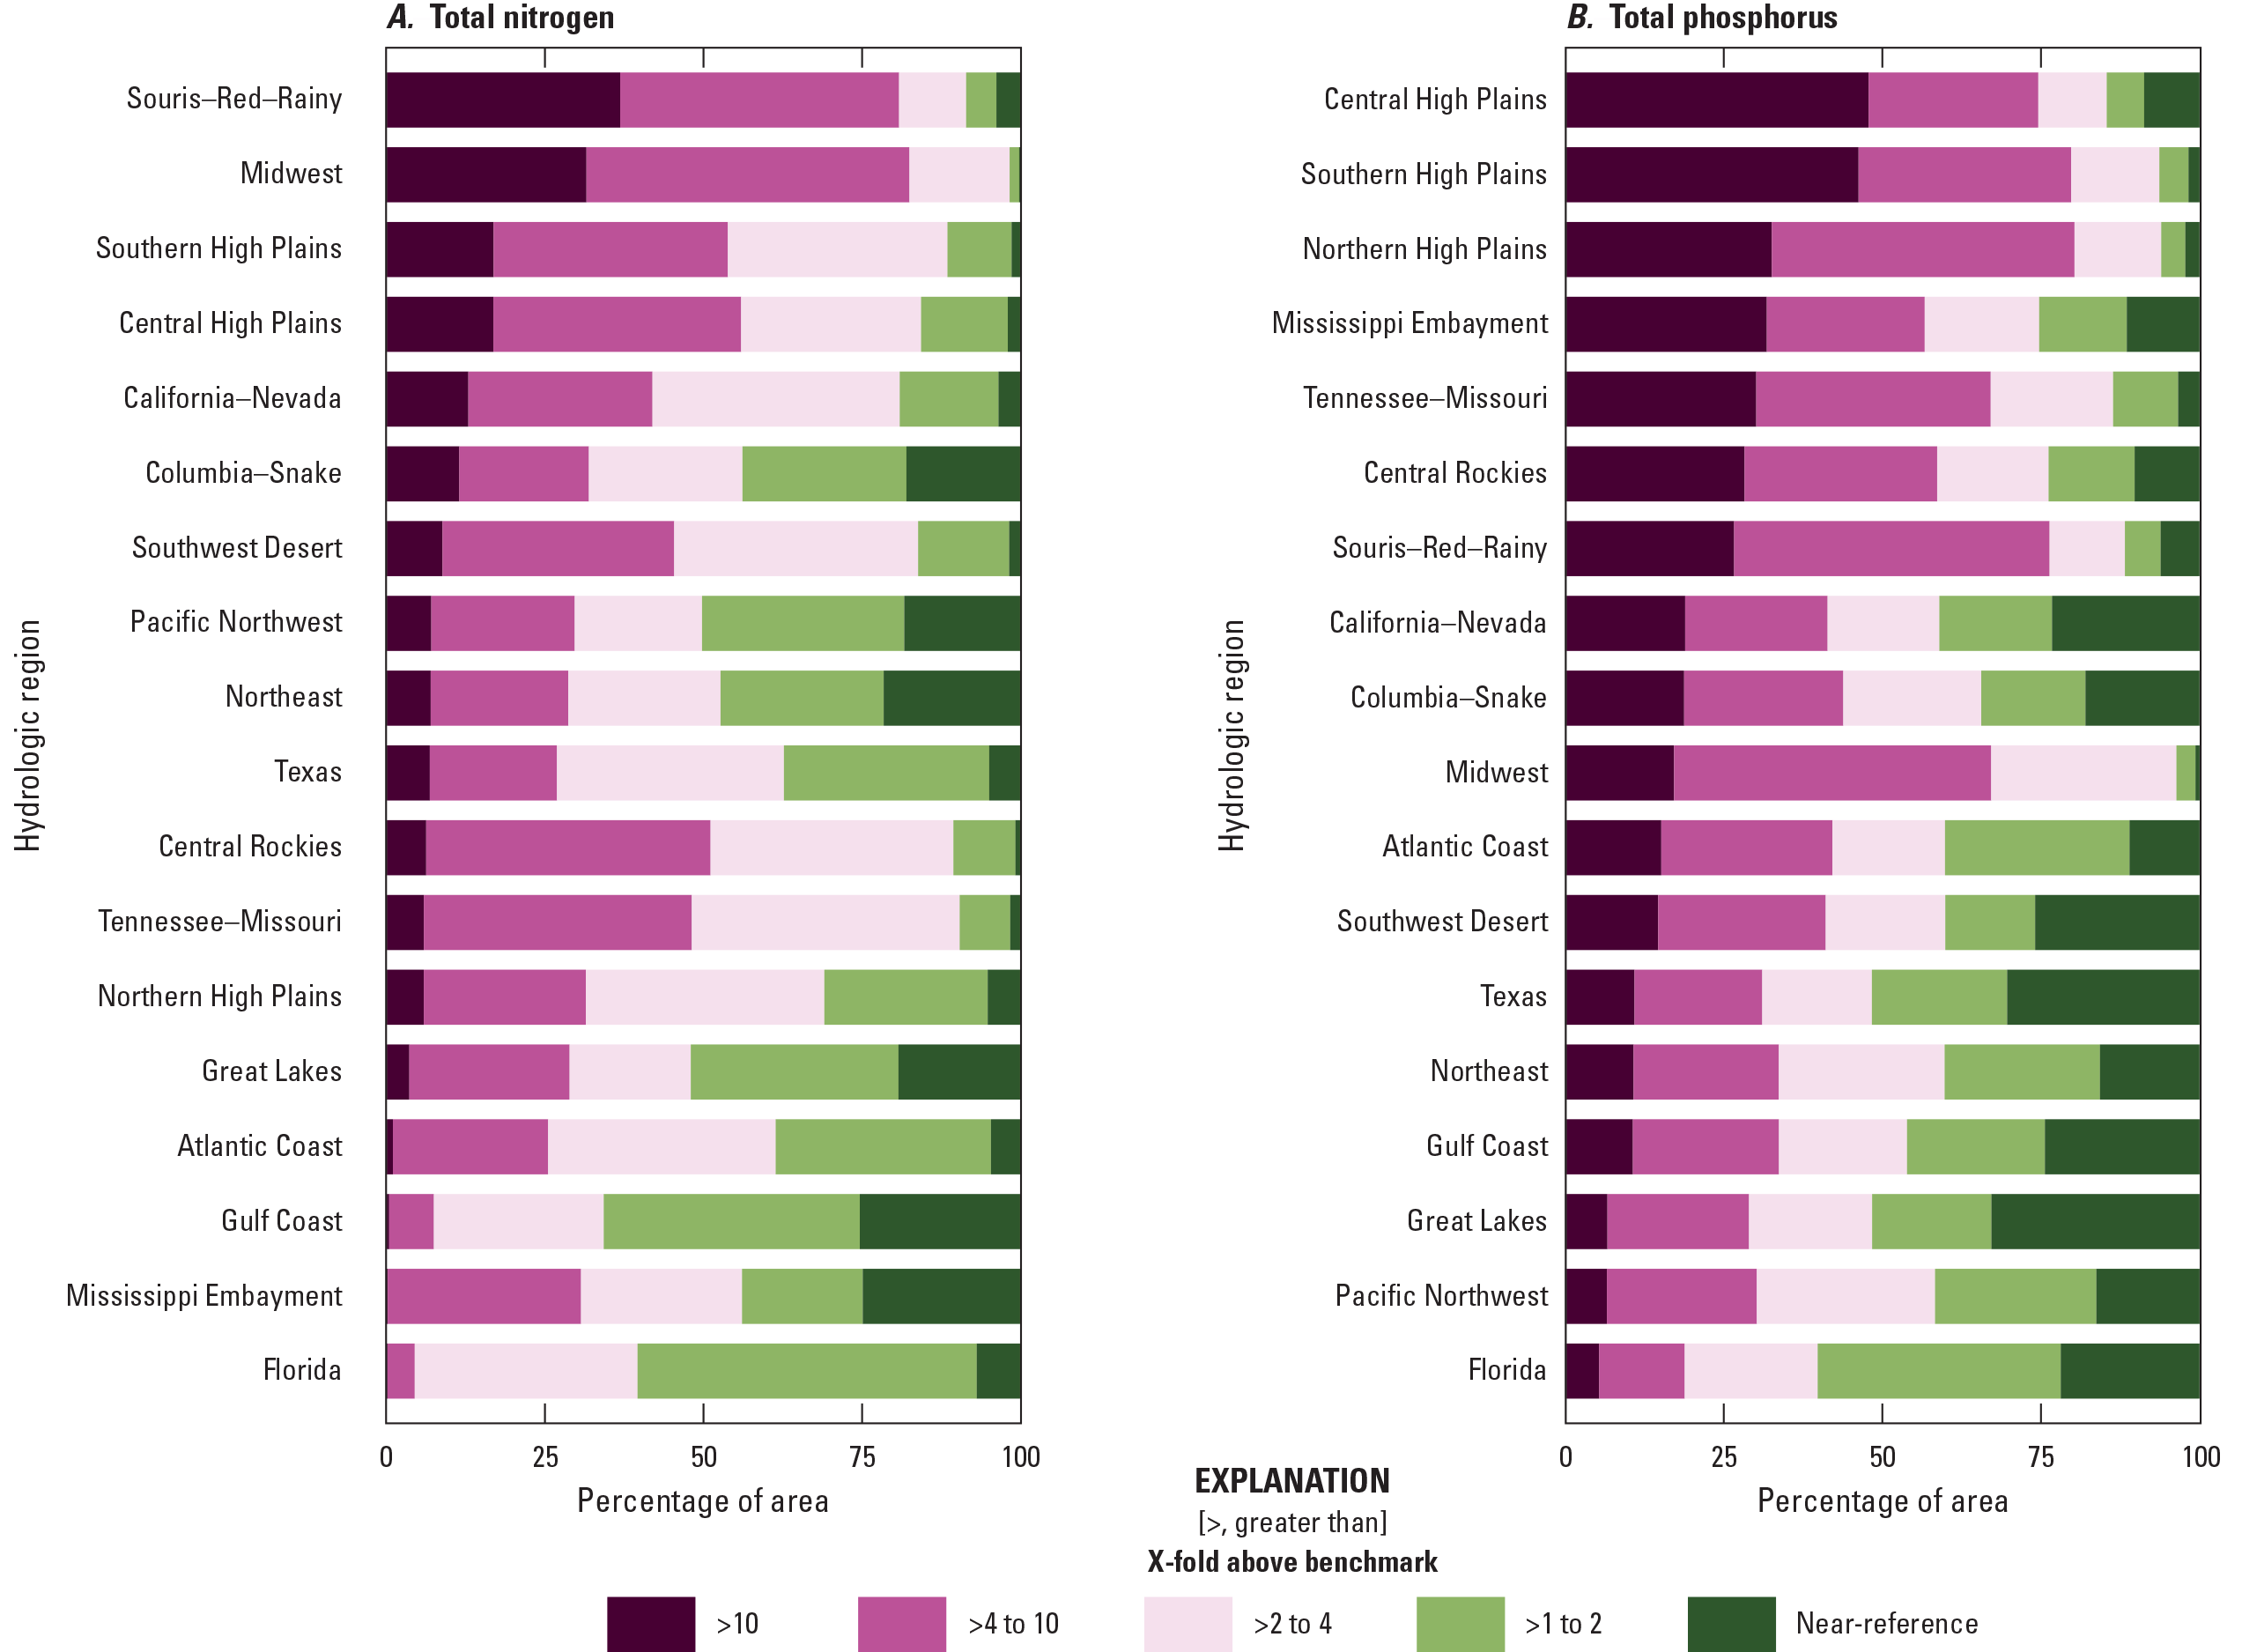
Areal percentage of each hydrologic region with mean annual concentrations for (A) total nitrogen and (B) total phosphorus in the conterminous United States, referenced to the Environmental Protection Agency National Rivers and Streams Assessment Near-Reference “Good” Benchmark (U.S. Environmental Protection Agency, 2020).
More areas of the CONUS have groundwater with low predicted arsenic and nitrate concentrations (<1 micrograms per liter [µg/L] or <1 milligrams per liter [mg/L], respectively; Lombard and others, 2021; Ransom and others, 2022) than surface water with near-reference concentrations. When compared with the drinking water MCL for these contaminants, modeled nitrate concentrations in groundwater are estimated to be less than the MCL (10 mg/L) in more than 95 percent of the hydrologic region in all hydrologic regions except the Southern High Plains (fig. 10). Arsenic concentrations in groundwater are less than the MCL (10 µg/L) in more than 95 percent of the region in all regions except the Southwest Desert and California–Nevada hydrologic regions (fig. 10). Most of the area within a majority of the hydrologic regions has concentrations well below the MCLs, with <1 mg/L nitrate and <1 ug/L arsenic in groundwater. Exceptions for nitrate include the Southern High Plains (only 23 percent of the area has <1 mg/L nitrate), Central High Plains (50 percent), and Southwest Desert (49 percent) hydrologic regions. Exceptions for arsenic include the Southwest Desert (only 22 percent of the area has <1 ug/L arsenic), California–Nevada (28 percent), Texas (47 percent), Southern High Plains (39 percent), and Central High Plains (38 percent) hydrologic regions. Although the MCL for arsenic is 10 µg/L, the MCLG is 0 µg/L, indicating potential health effects at nearly any exposure in drinking water, even if those levels are not enforceable. Therefore, those regions with elevated concentrations, even if not greater than the enforceable MCL, may still have limitations on drinking water uses from an exclusive evaluation of potential human-health impacts.
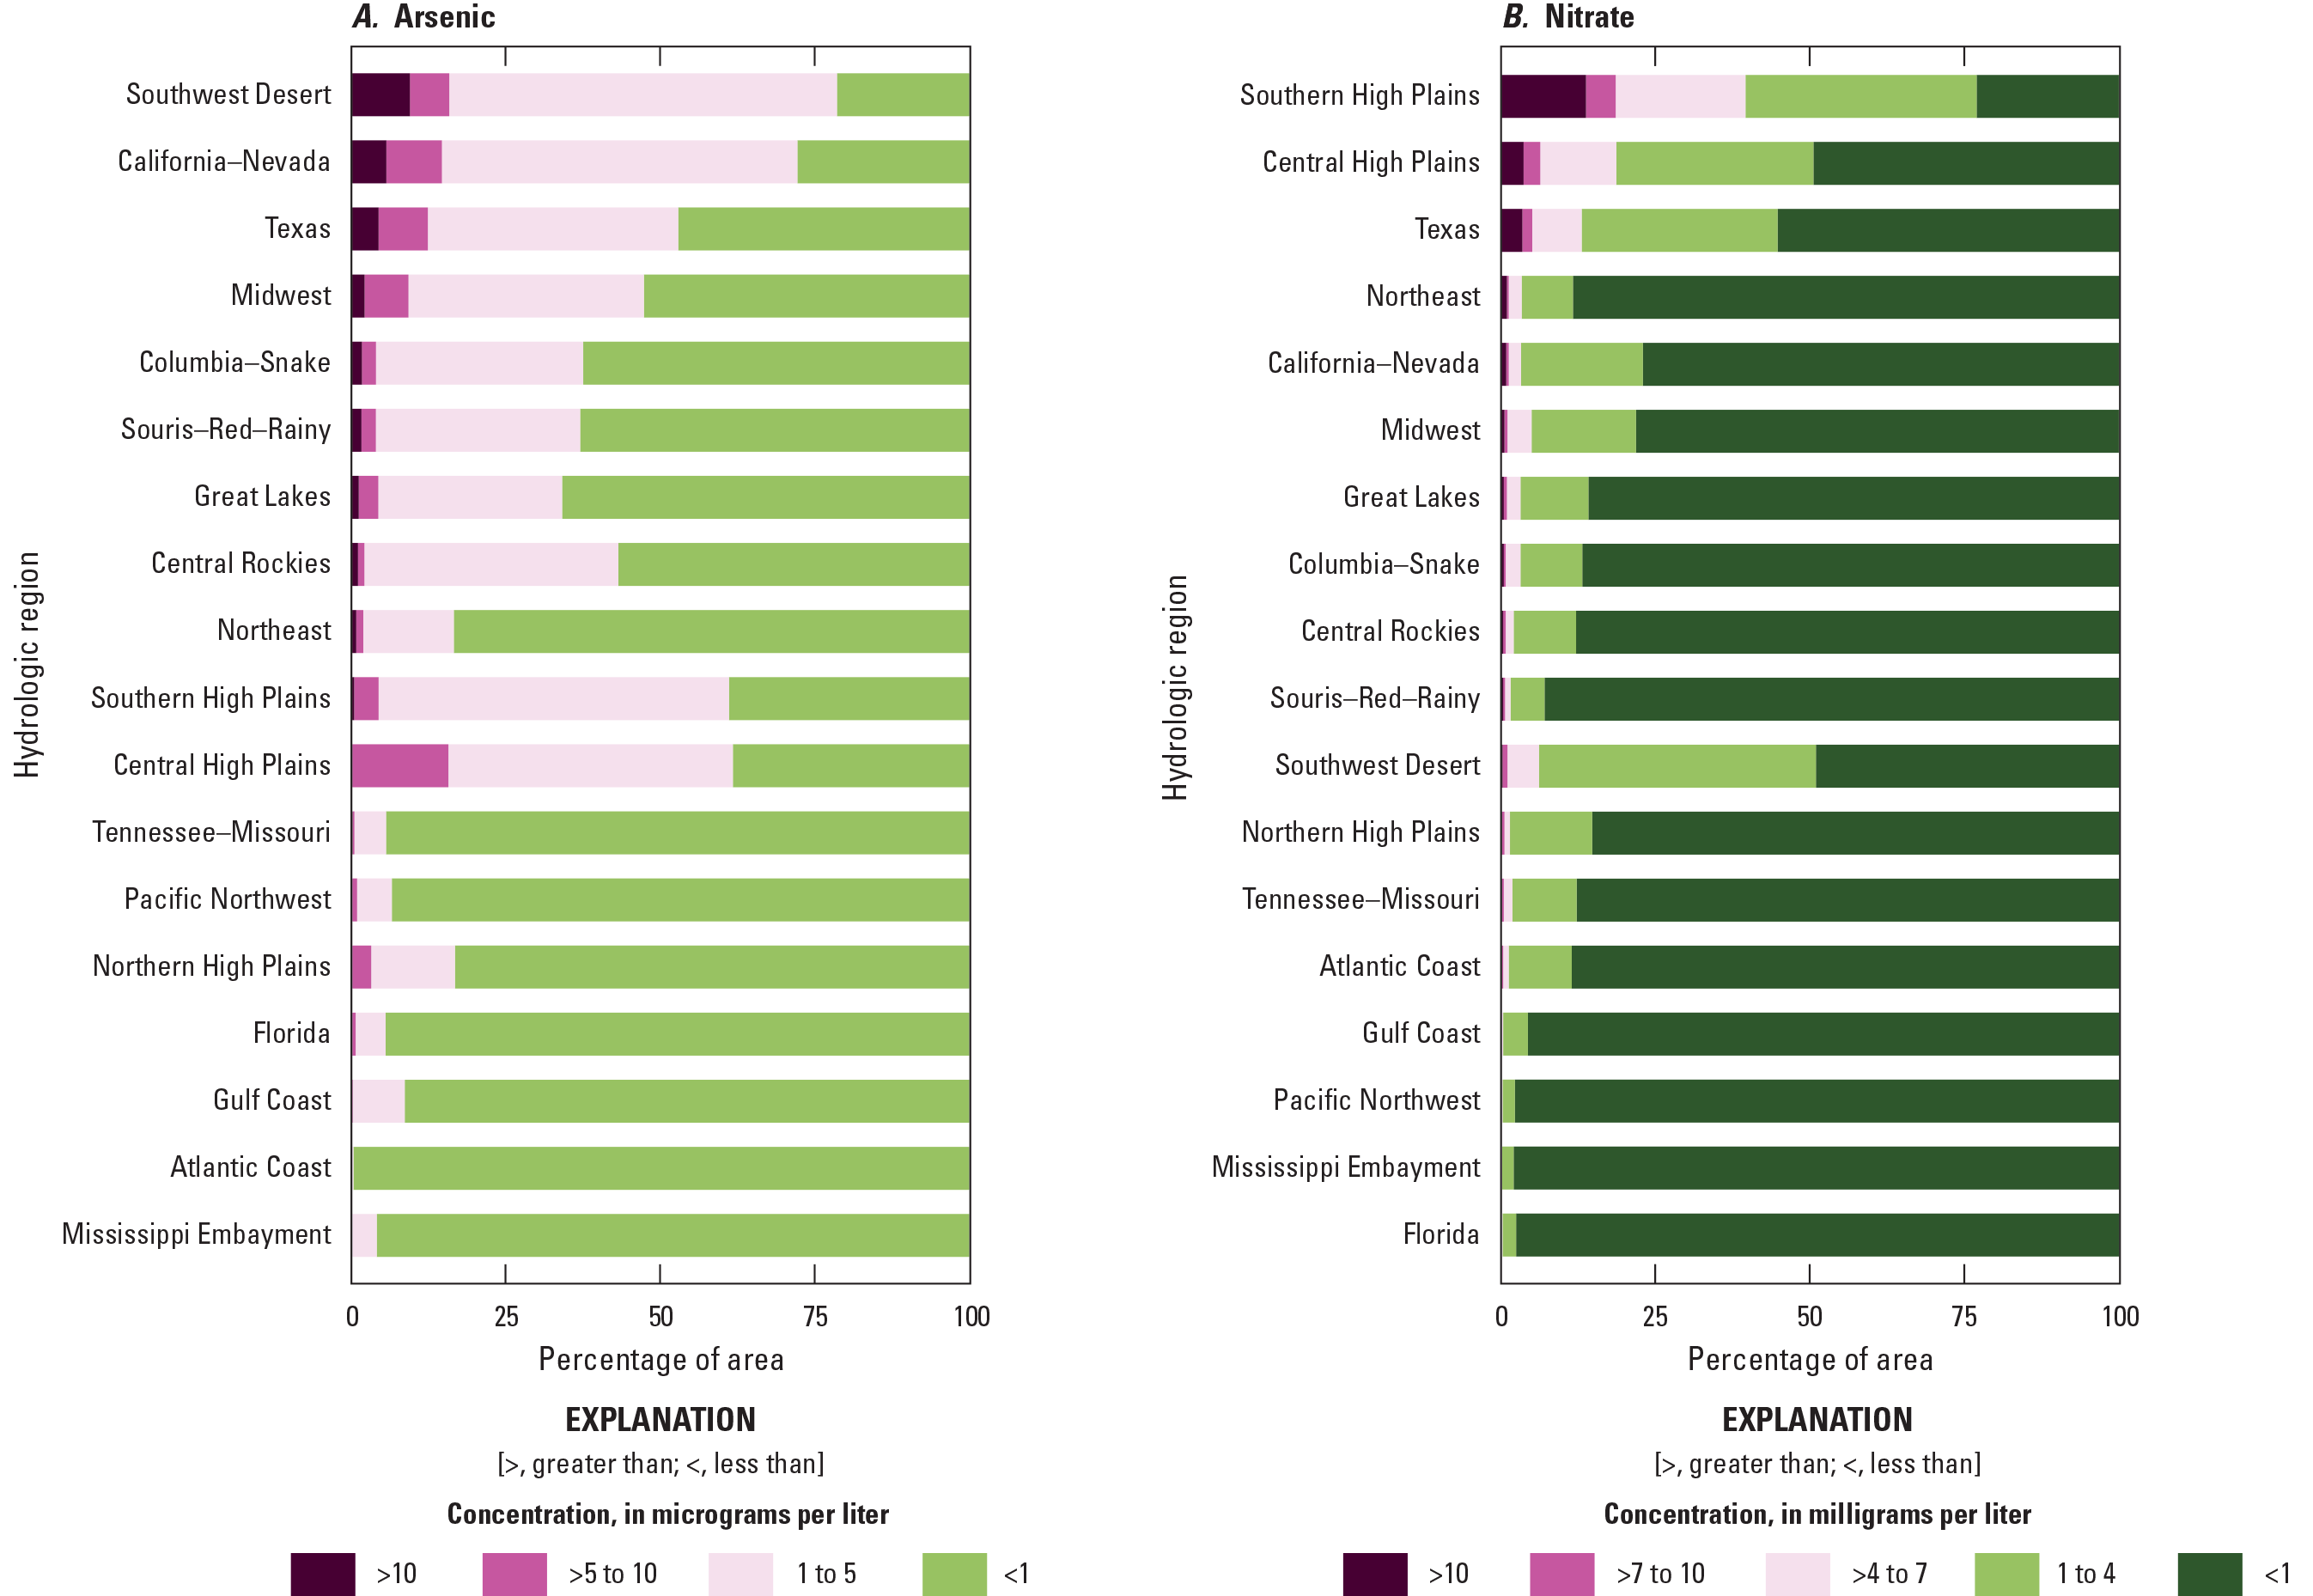
Groundwater (A) arsenic and (B) nitrate model estimates of the areal percentage of each hydrologic region underlain by groundwater in various concentration categories in the conterminous United States. Percentage of area covered by arsenic represents area with greater than or equal to 50 percent probability of being in the specified range. The nitrate model addresses water from the depth of public-supply wells (Ransom and others, 2022) and the arsenic model estimates are for domestic-supply wells (Lombard and others, 2021).
Water-Use Sensitivities and Effects on Water Availability
Human water use has dual effects on water availability. On the one hand, ensuring safe, reliable sources of water for human needs is a primary objective of water management. On the other hand, water withdrawals decrease availability for downstream users and local stream ecosystems. Therefore, areas with more intense water use have higher needs and a higher tendency to degrade the resource than areas with less intense water use. Of the three major human water uses considered here (crop irrigation, public supply, and thermoelectric), crop irrigation, as the largest consumer of water, has the largest effects on water availability through direct reductions in quantity and through introduction of a wide range of contaminants to waterbodies across large areas with long-lasting impacts (Tesoriero and others, 2013; Van Meter and others, 2016; Konar and Marston, 2020; chap. C, Erickson and others, 2025).
Public-supply withdrawals and return flows are locally important, although the volume of withdrawals and consumptive use for public supplies is low compared to crop irrigation, and extensive treatment of return flows at wastewater treatment facilities can mitigate effects on water quality (table 1). Nevertheless, local effects on water quantity and quality—including alteration of flows and flow timing, as well as introduction of disinfection byproducts and other constituents not removed from treated wastewater—can be substantial (Symonds and others, 2015; Eppehimer and others, 2021). In dry regions, discharge from wastewater treatment facilities can dominate base flow, and contaminants like pharmaceutical products, which are more recalcitrant to wastewater treatment, can reach high concentrations (Rice and Westerhoff, 2017). In areas with combined sewers, large storms can cause overflows of untreated sewage directly into downstream waters. Diversions for public supply can remove substantial amounts of water from streams, which limits the dilution of pollutants and compounds water-quality problems (Murphy and others, 2024).
Table 1.
Water-availability sensitivities; requirements of the water use, and effects; and the ways in which water availability may be altered, for the three largest water use categories across the conterminous United States.Water-availability effects from thermoelectric power are typically lower than for crop irrigation or public supply because of low consumptive use (table 1). Withdrawals for thermoelectric power generation are large, and therefore can alter flow magnitudes, timing, and location through diversion and return flow location differences. However, consumptive use is small, so thermoelectric water use has smaller effects on water quantity than crop irrigation or public supply (Stets and others, 2025b). Thermoelectric water use can degrade water quality through temperature pollution, exceeding or decreasing natural water temperatures; this impact can be substantial, particularly for ecosystem uses (Raptis and others, 2016; Chini and others, 2020).
Different human water uses also have different sensitivities to water-availability limitation. For example, water use for thermoelectric power generation has a high requirement for sufficient water quantity but lower water-quality requirements than public-supply water. Table 1 outlines the relative water-availability sensitivities and impacts of the three largest water-use categories across the CONUS. The descriptions of high, medium, and low are based on the spatial extent, magnitudes, severity, and number of constituents for water quality of demands and impacts.
Integrated Water Availability
Multiple factors contribute to water availability, and the co-occurrence of stressors can cause additional limitations. Limited water supply can result in water-quality degradation, further affecting water availability. Likewise, intense water use often results in water-quality degradation due to inputs of sediment, nutrients, salinity, and other constituents through return flow (Lin and Garcia, 2012; Park and others, 2018). Globally, the factors affecting human water security are highly correlated; the infrastructure that allows elevated water use also promotes water-quality degradation and decreases biotic integrity (Vörösmarty and others, 2010).
Model predictions of nitrogen and phosphorus in surface water and nitrate and arsenic in groundwater were combined with the SUI and alteration of ecological flows to assess the combined factors of water quality, water quantity, and compromised ecological flows on overall water availability. Within each indicator, high stress indicates areas where water quality or quantity conditions exceed the requirements, or sensitivity, for a particular use. The approaches are described in both “Water-Quantity Components of Water Availability” sections and in appendix 1; they are briefly summarized here. For the surface water-quality indicator, surface water total nitrogen and total phosphorus were compared to the NRSA “Good” benchmark. For the groundwater-quality indicator, predicted nitrate and arsenic concentrations were compared to the regulatory enforceable drinking water MCLs. For the surface-water quantity indicator, the SUI was used. For the ecological flow alteration indicator, predicted alteration of different aspects of the flow regime were compared to those aspects of the flow regime that have been shown to affect regional ecological health.
Co-occurring limitations of water availability are evident when multiple potential stressors are examined concurrently (fig. 11). Hydrologic regions with elevated water stress in multiple indicators may pose the greatest challenges to resource managers addressing their water-availability limitations. The Central High Plains, Southern High Plains, and California–Nevada hydrologic regions show high or severe levels of water stress from quantity limitation (as SUI), surface-water quality, groundwater quality, and ecological flow alteration. Likewise, the seven hydrologic regions with SUI in the high or severe category (California–Nevada, Southwest Desert, Central High Plains, Southern High Plains, Texas, Mississippi Embayment, and Florida) also have high or severe stress in at least one additional category (fig. 11). Surface-water and groundwater-quality stress are high to severe in the California–Nevada, Southwest Desert, Central High Plains, and Southern High Plains hydrologic regions, which emphasizes the connection between these resources in these areas. Prolonged drought in the Western United States may result in an underestimate of water stress as measured by the SUI. In particular, the calculated SUI in the Central Rockies hydrologic region was likely underestimated, given the known drought in that region (Udall and Overpeck, 2017; McCabe and Wolock, 2021; McCabe and others, 2023). No hydrologic region had very low stress in all four categories. The ability to better describe the specific ways in which water-availability limitations interact is vital and presents an important path forward in improving future water-availability assessments. Nevertheless, our findings emphasize that high water demand for human activities combined with limited supply often co-occurs with elevated water stress from other factors.
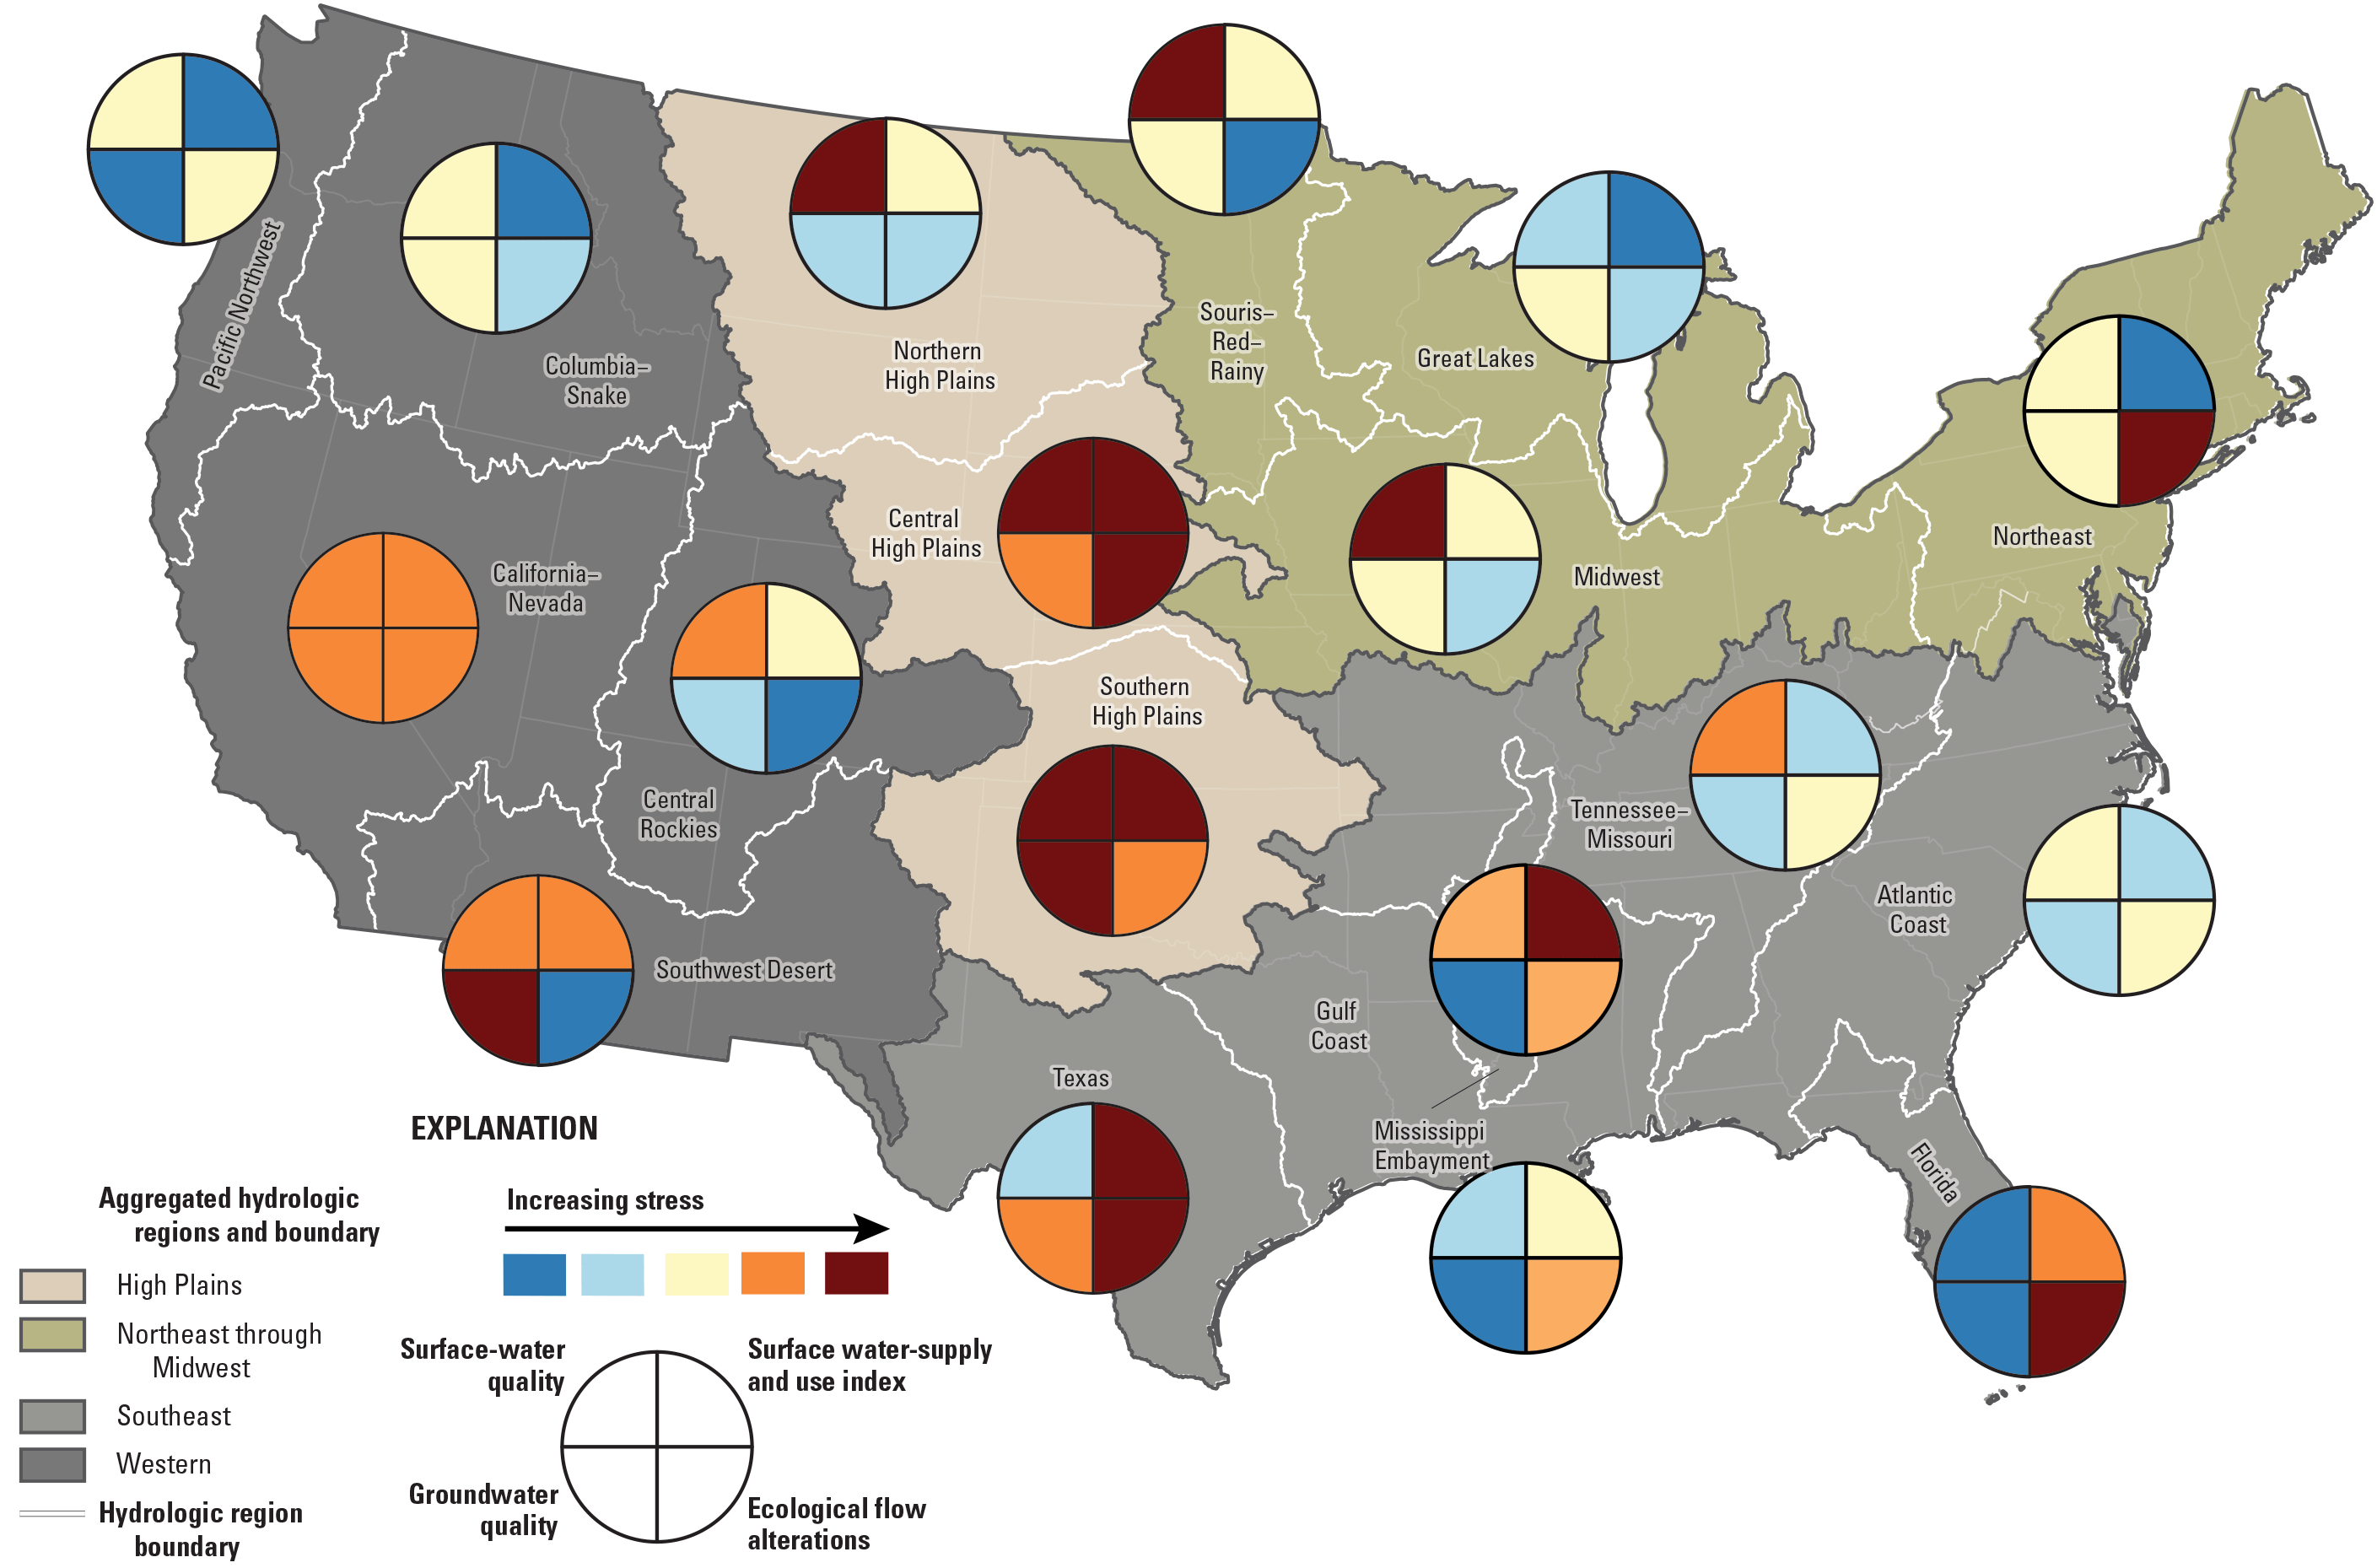
Assessment of relative stress on water availability in four different categories for each hydrologic region within the conterminous United States. Categories include the water stress as supply-demand imbalance (surface water-supply and use index; Stets and others, 2025b); surface-water quality from model estimates of total nitrogen and total phosphorus; groundwater quality from models of nitrate and arsenic (Ransom and others, 2022; Lombard and others, 2021); and percentage of river miles in each region with ecological flow alterations, adapted from Carlisle (2019). Development of the stress categories is described in appendix 1.
Agricultural practices are a major contributor to combined impacts of water-quantity and water-quality degradation resulting in reduced water availability. High consumptive water use and agricultural practices that can degrade surface and groundwater quality, including fertilizer and manure application, contribute to reduced water availability in regions with high and severe stress from multiple drivers (chap. C., Erickson and others, 2025; Stets and others, 2025b). Likewise, flow alteration for storage, crop irrigation, flood control, and hydroelectric power can have substantial effects on local freshwater ecosystems.
Socioeconomic Limitations Affecting Water Availability
Water availability for human uses is often affected by socioeconomic factors (which are not captured purely by hydrologic or water-quality modeling) including the existence of, or ability to construct and maintain, physical infrastructure and legal agreements (Caretta and others, 2022). For example, physical infrastructure, such as public-supply (or self-supply) facilities, household-level plumbing, wells, dams, reservoirs, and diversions, are critical for meeting local water demands. Treaties, water compacts, and other legal agreements also determine access at multiple scales from household and municipal to internationally shared water resources. Additionally, characteristics of a community, such as socioeconomic status or access to resources and public services, can determine a community’s adaptive capacity, and ultimately how vulnerable or resilient a community may be when faced with water-availability limitations.
Despite tremendous gains throughout the 20th century, water access and quality limitations persist in the United States and are often clustered in communities that are marginalized in other ways (Meehan and others, 2020; Mueller and Gasteyer, 2021; Scanlon and others, 2023). Water-availability limitations due to incomplete plumbing affect 0.5–1.0 million individuals in the United States, a large fraction of whom live in large metropolitan areas (Meehan and others, 2020). Cases of incomplete plumbing have been reported to be associated with communities of color, high poverty levels, low average income, low education rates, and renter-dominated communities (Deitz and Meehan, 2019; Meehan and others, 2020; Mueller and Gasteyer, 2021). During 2014–18, almost 2.5 percent of community water systems nationwide were “serious violators” of the Safe Drinking Water Act (42 U.S.C. §300f et seq.) and 3.4 percent of permittees in the 39 States assessed were noncompliant with the Clean Water Act (33 U.S.C. §§ 1251 et seq.; Mueller and Gasteyer, 2021). An estimated 81 million Americans and 153 million Americans live in counties where >1 percent of community water systems were serious violators and significant noncompliers, respectively (Mueller and Gasteyer, 2021). The number of individuals exposed to these exceedances is likely to be much smaller, but this analysis highlights that numerous Americans live close to sources of potential drinking water problems. Drinking-water violations and the reoccurrence of violations have also been determined to be more prevalent in socially vulnerable communities when considering socioeconomic status, race, language, and demographic and housing characteristics in the United States (Scanlon and others, 2023).
The cost of building and maintaining water infrastructure is an important factor affecting availability. The restoration of aging water infrastructure has drawn much attention, and the EPA has estimated in 2018 that capital improvement needs for drinking water will surpass $400 billion over the following 20 years (U.S. Environmental Protection Agency, 2018). Additionally, almost 12 percent of households across the United States have been paying more than 4.5 percent of median household income, the EPA threshold for affordability, on water-related bills (Mack and Wrase, 2017). Therefore, although pricing can be used to encourage water conservation, it may result in an increased cost burden and greater vulnerability for low-income households.
Communities that rely on fishing for a larger proportion of their dietary intake can be particularly vulnerable to the effects of limited water availability on ecosystems and fish communities. Remote communities are more likely to use subsistence fishing for their diet (Gillespie and others, 2018). American Indian and Arctic Native communities have a high dependence on wild-caught fish and are more likely to experience health effects from mercury pollution (Arctic Monitoring and Assessment Programme, 2009). Low-income populations and those with English as a second language can also be particularly vulnerable to contaminated fish from heavy metals, organics, and other factors because of communication barriers reducing the effectiveness of fish-consumption advisories (Bruce Lauber and others, 2017).
The differential effects of limited water availability on communities based on broader socioeconomic factors highlights the need to examine relations between these factors and indicators of water availability (Vörösmarty and others, 2010; Damkjaer and Taylor, 2017; Liu and others, 2017a). Including social, demographic, and economic factors can help to improve water availability assessments by accounting for a local population’s capacity to access water resources and respond to changes in those resources. Coverage of socioeconomic data at appropriate scale for model comparison or integration is often a limiting factor in addressing these issues.
To examine the relation between socioeconomic factors and greater vulnerability to a supply imbalance or degraded water quality in this chapter, we use the Centers for Disease Control (CDC) Social Vulnerability Index (SVI; Centers for Disease Control, 2022). The SVI, developed in the early 2000s, includes indicators reflecting community characteristics and composition that may lead to differential effects from hazard exposures (Flanagan and others, 2011). We use SVI data from 2020, based on the latest framework, which includes 16 individual variables categorized into four themes: (1) Socioeconomic status, (2) Household characteristics, (3) Racial and ethnic minority status, and (4) Housing type and transportation. The SVI provides a percentile ranking of all census tracts on a scale from 0 to 1 based on the variables in the four themes, as well as an overall SVI ranking, which is calculated using the rankings of the four themes. Higher values across all rankings indicate higher vulnerability. Rankings from the overall SVI and the four themes were compared with several indicators of water availability including the SUI, as well as predicted total nitrogen and total phosphorus concentrations from SPARROW (chap. C, Erickson and others, 2025; Stets and others, 2025a).
Most of the CONUS population lives in HUC12 watersheds with SUI in the very low category (56 percent) and the proportion of population affected decreases with increasing SUI (fig. 12). However, a disproportionate number of people living in areas of potential water shortages may be considered socially vulnerable by SVI metrics. While only 2.9 percent of the total CONUS population (9 million individuals) lived in HUC12 catchments with average SUI in the severe category, more than one-half of this population (about 4.7 million) were determined to be in the highest quartile of SVI. Among the specific themes in SVI, theme 1 (Socioeconomic status) and theme 3 (Racial and ethnic minority status), showed a similar pattern, with 47 and 51 percent of the population, respectively, living in areas with severe SUI also in the highest quartile for SVI (fig. 12). In the other two themes, the population in the “high” vulnerability category (50–75th percentile of SVI) constitute the larger proportion of the population living in HUC12 catchments in the severe SUI category.
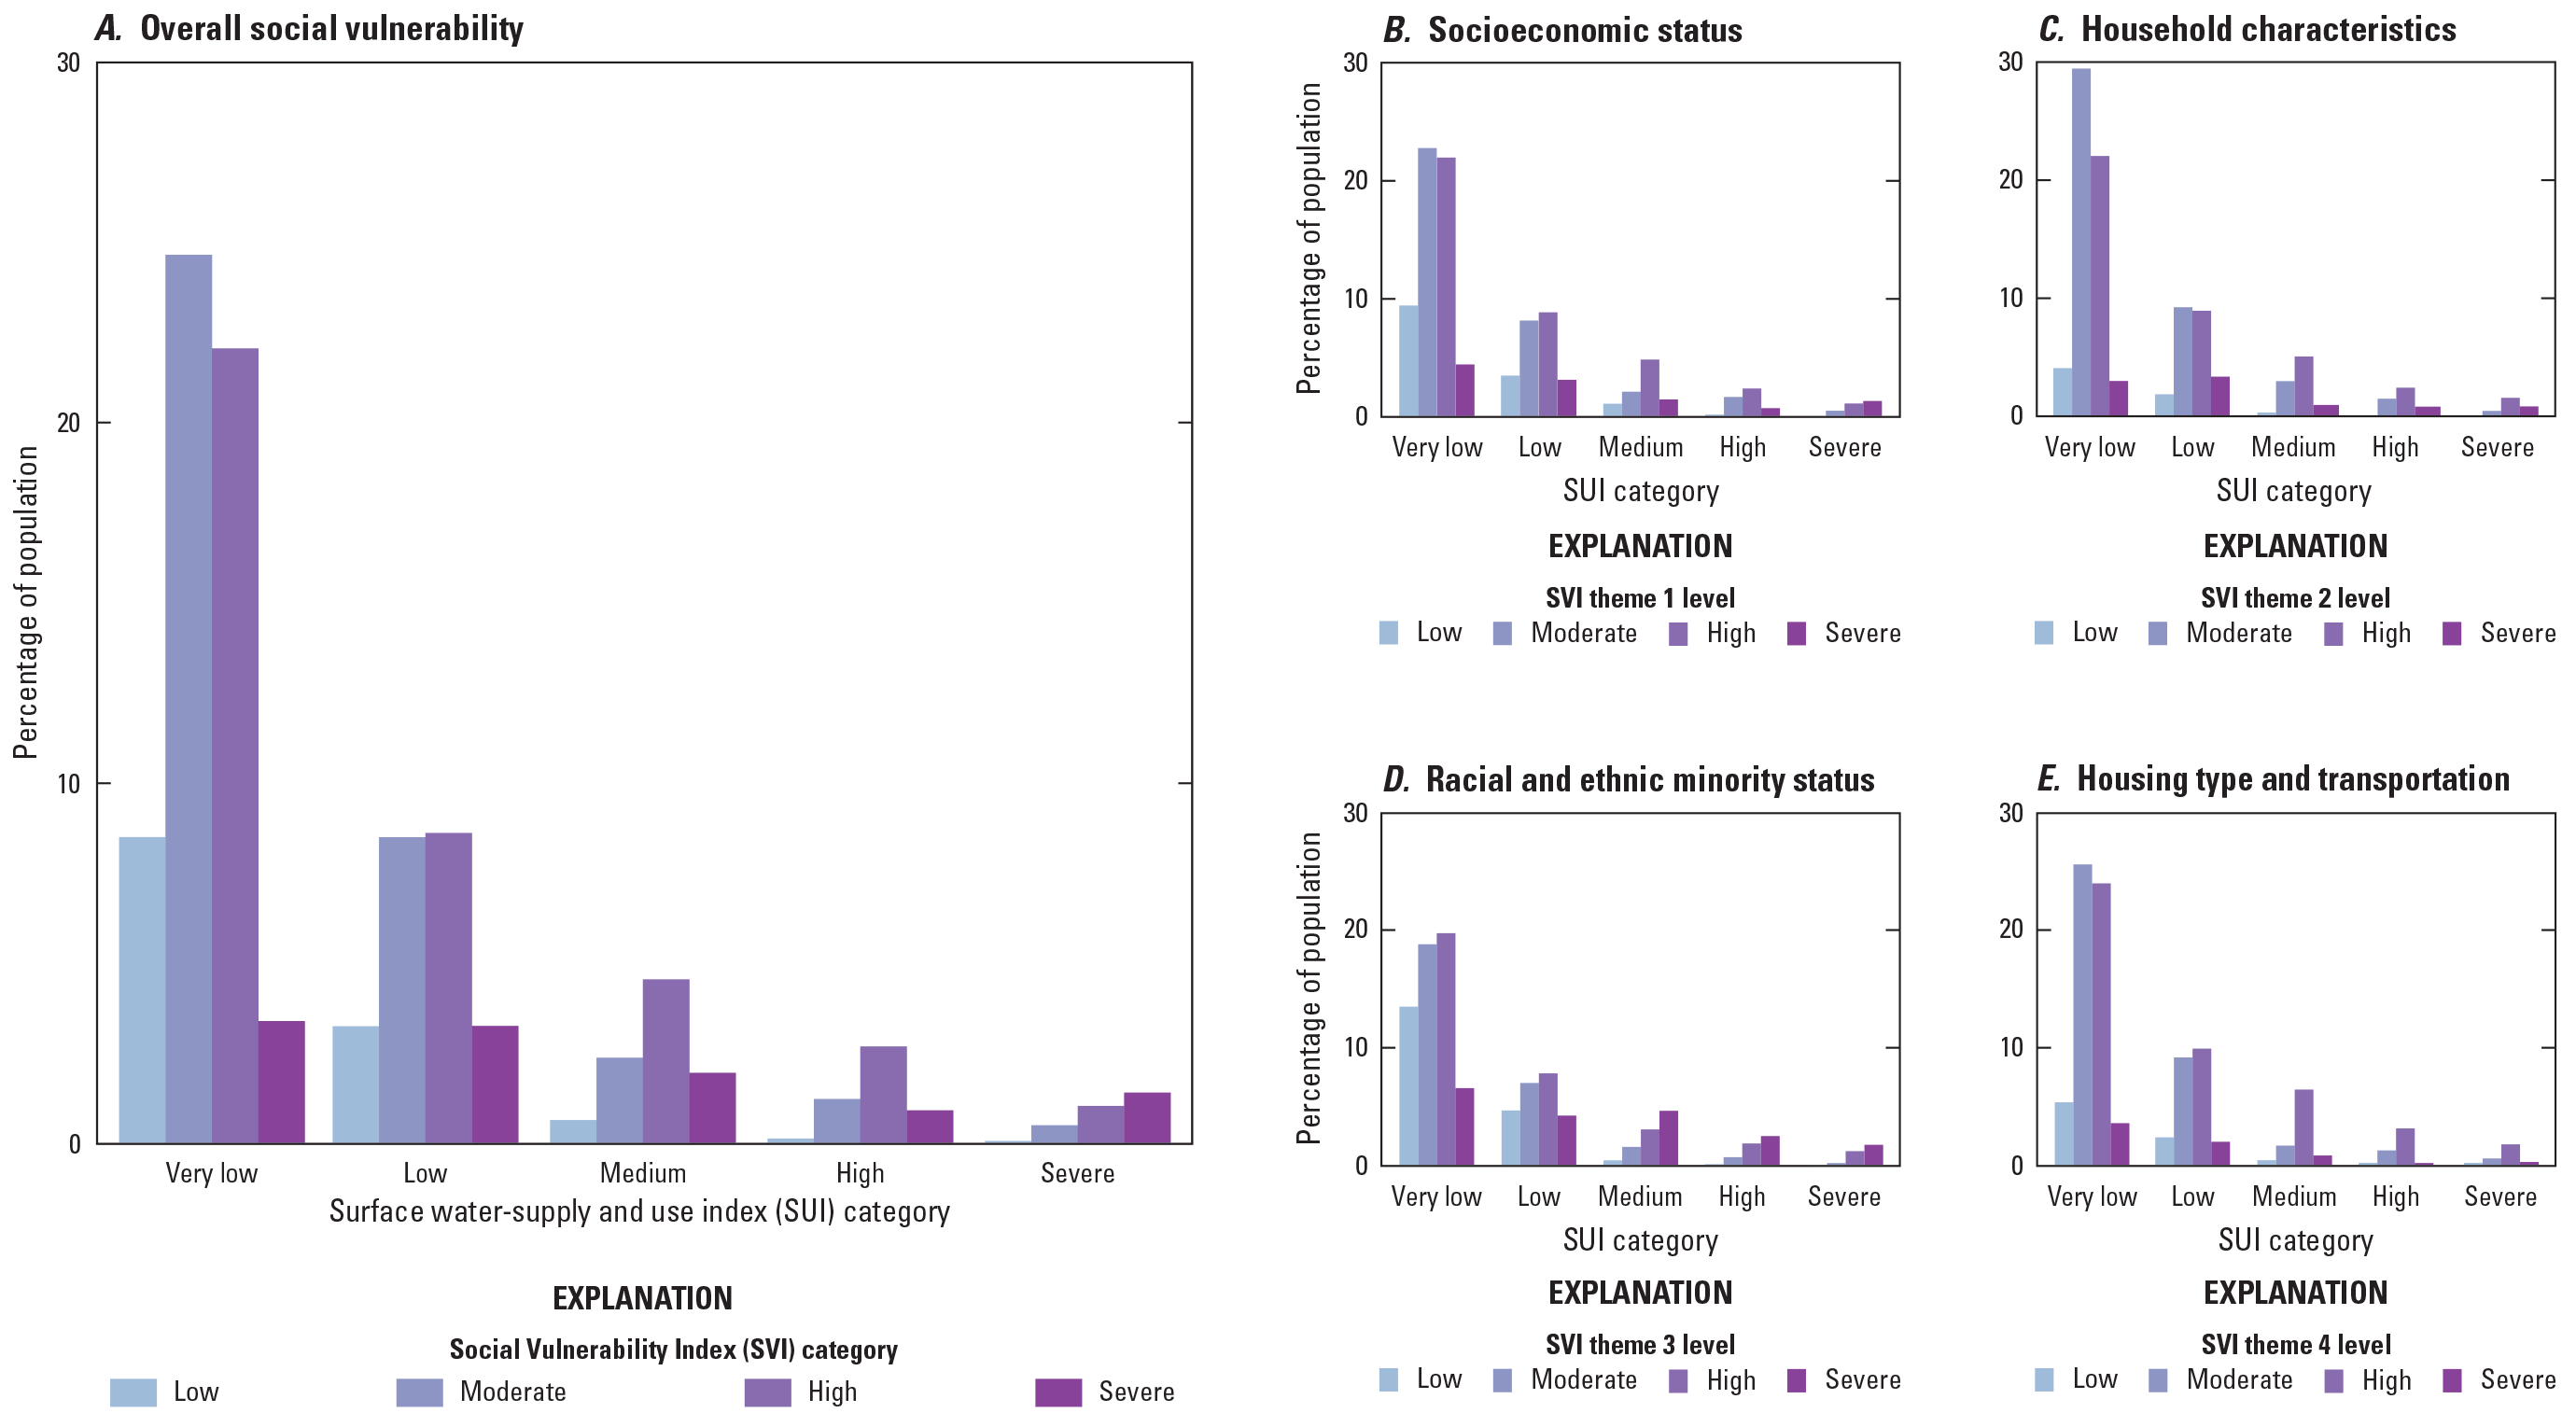
Percentage of the conterminous United States population in each surface water-supply and use index category and Social Vulnerability Index quartiles (SVI). Results are summarized for the overall SVI score and the four SVI themes; see text for description.
The SUI differences were determined to be statistically significant across the overall SVI ranking categories and categories for all four SVI themes (Kruskal-Wallis X2, p<0.001). However, given the potential influence of the large sample size on test significance, we focus on broad patterns and descriptive statistics.
The proportion of individuals with the highest SVI increased with increasing modeled concentrations of total nitrogen and total phosphorus in streams (fig. 13), although the overall patterns were different from what was observed for SUI. Most of the CONUS population (>60 percent for each constituent) lives in HUC12 catchments with total nitrogen and total phosphorus 4–10 times higher than the EPA NRSA “Good” benchmark (fig. 13), underscoring the broad geographic distribution of elevated nitrogen and phosphorus concentrations. However, in the highest concentration category (>10 times NRSA benchmarks), a relatively large proportion of the population is distributed in the top quartile for SVI (fig. 13). The pattern is particularly striking for SVI theme 3 (Racial and ethnic minority status) in which the top SVI quartile is the largest group in the >10 times NRSA benchmark category for total nitrogen and total phosphorus (fig. 13). The HUC12 catchments in the highest concentration category and with the top quartile of SVI theme 3 were relatively limited in spatial extent and had high population density (262 and 160 people/km2 for total nitrogen and total phosphorus, respectively), which emphasizes the contribution of highly developed, human-dominated HUC12 catchments to this result.
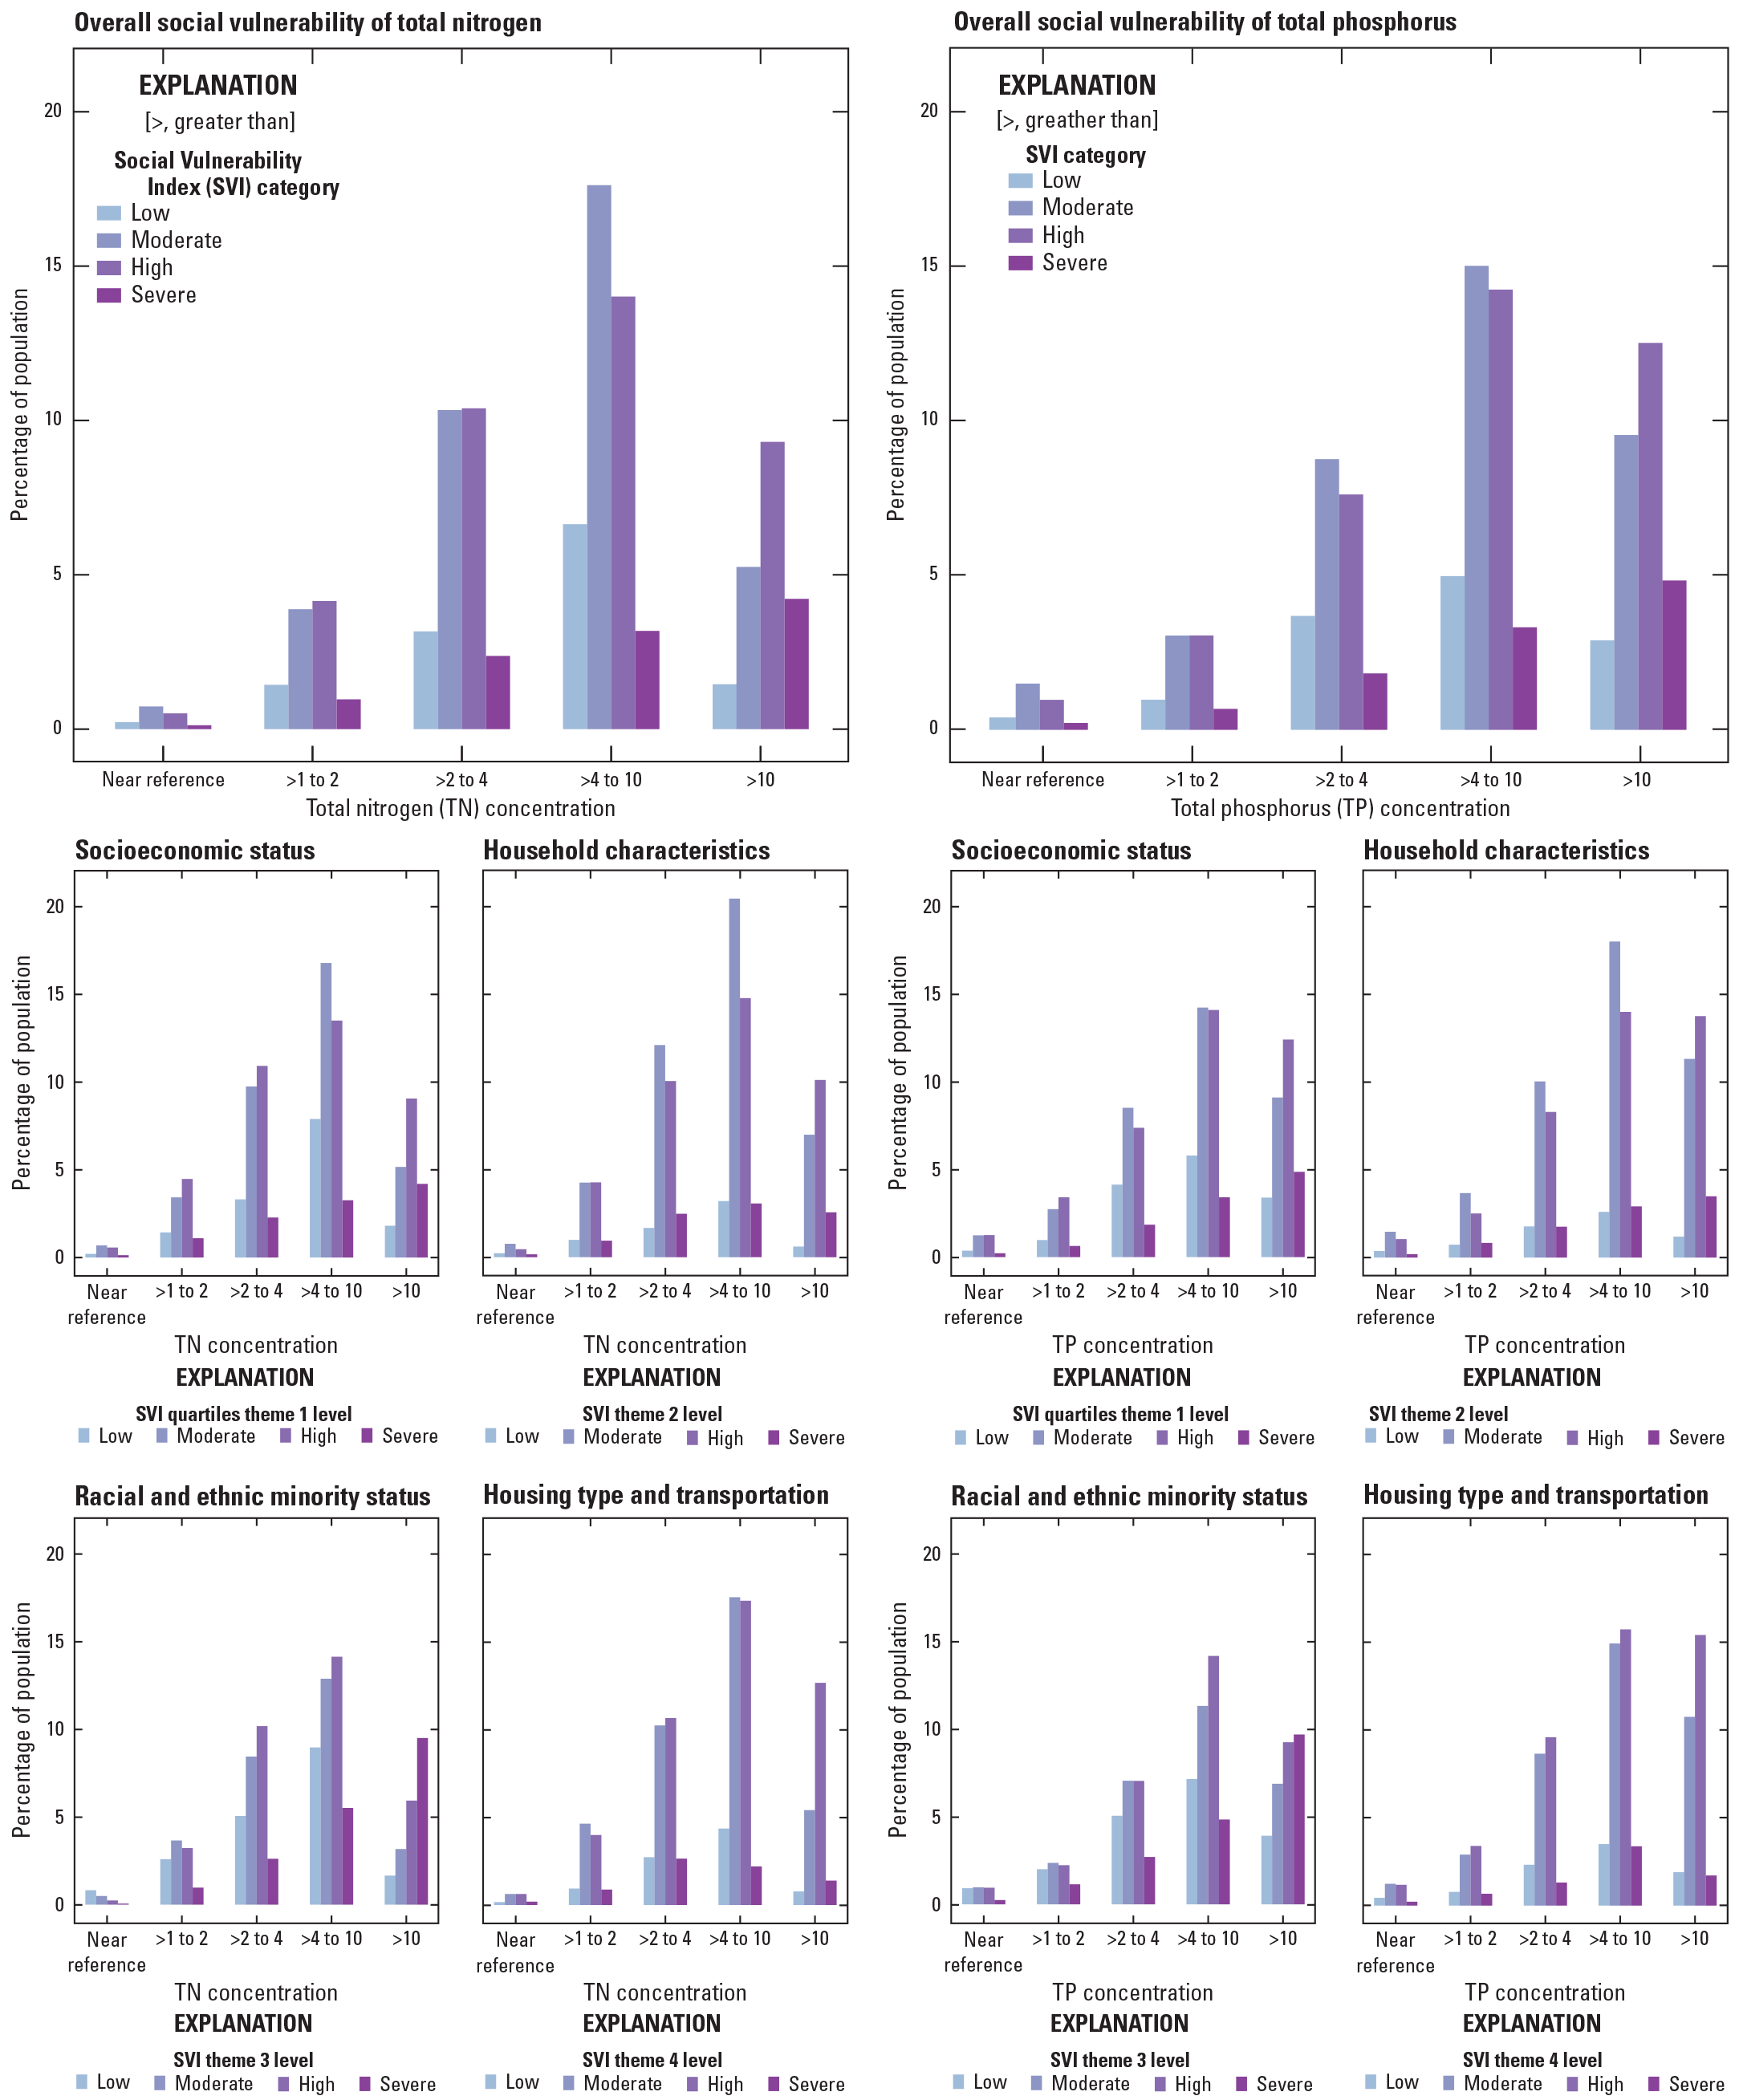
Percentage of the conterminous United States population residing in areas with increasing total nitrogen and total phosphorus concentration exceedances and further classified by Social Vulnerability Index (SVI) quartiles. Results are summarized for the overall SVI score and the four SVI themes. Total nitrogen and total phosphorus concentrations are referenced to the Environmental Protection Agency National Rivers and Streams Assessment Near-Reference “Good” Benchmark; see “Water-Quality Components of Water Availability” sections for more details.
The mean and median total nitrogen and total phosphorus differences were statistically significant across the overall SVI categories and all four SVI themes were at the p < 0.001 level, except for total phosphorus exceedances and SVI theme 4, Housing Type and Transportation (Kruskal-Wallis X2, p<0.05).
Future Water-Availability Considerations
Future challenges to water availability will depend on changing socioeconomic factors such as human water use as well as the distribution and composition of future populations. In this chapter, we have discussed how these factors relate to water availability—such as the cascading effects of water use on water quality highlighted in table 1 or how socioeconomic drivers interact with quantity- and quality-based assessments. Uncertainty in future climatic conditions presents additional uncertainty in the future of water availability.
Climate is a dominant influence on patterns of water-supply and use imbalance (Stets and others, 2025b) and projected changes in multiple Climatic Impact Drivers are expected to have substantial impacts on the water cycle, leading to further changes in water availability in the United States (chap. E, Scholl and others, 2025). Interannual water-supply patterns may become more inconsistent with increased frequency of severe precipitation events (Easterling and others, 2017; Steinschneider and Najibi, 2022) and droughts (Alizadeh and others, 2020; Gangopadhyay and others, 2021). Additionally, warmer temperatures have led to an observed decrease in total snow accumulations, as a greater proportion of winter precipitation falls as rain (Taylor and others, 2017; Ranasinghe and others, 2023). This changing pattern is likely to have important effects on the timing of water availability in snow water-dependent regions, with substantial alteration to the timing, duration, and magnitude of snowmelt pulses (Dettinger, 2005; Milly and Dunne, 2020). Reduced flows in warmer months could pose risks to human and ecosystem water needs and could increase the reliance on water-storage infrastructure to ensure access to sufficient quantities year-round to meet water demands.
Parts of the United States, especially in the West, are likely to have depleted soil moisture and increasing aridity resulting from increases in temperatures and decreases in precipitation (Cook and others, 2004; Woodhouse and others, 2021). Warming temperatures have the potential to lengthen growing seasons; however, warmer and drier conditions would also require greater irrigation water inputs to maintain crop yields when crop water demand is not met by precipitation. Given that much of the high to severe water-supply and use imbalance for the areas identified in Stets and others (2025b) was related to crop irrigation, greater aridity could further strain water supplies in these areas and could introduce the risk of new hazards such as wildfires (Abatzoglou and Williams, 2016). The effects of extreme events, especially wildfire, on water availability is an area of active research by the USGS (sidebar 1).
Sidebar 1. Effects of Wildfire and Extreme Events on Water Availability
Extreme events—such as wildfire, hurricanes, and flooding—disrupt water supplies, infrastructure, and ecosystems, and can have longer-lasting effects on long-term surface-water quality and watershed response to subsequent storm events (Michalak, 2016; Murphy and others, 2018; Ryberg and Chanat, 2022). The changing frequency, intensity, and distribution of extreme events may require adaptations for water providers (Khan and others, 2015). Despite their critical importance, extreme events and their impacts on water supplies are challenging to measure and model because of their unpredictability and extreme watershed response, and the lack of preexisting data to which the response can be compared. Adequate assessment of extreme events often requires modeling and targeted sampling at high temporal resolution (Murphy and others, 2015; Kaushal and others, 2018a) to capture water quality and quantity response (Van Kempen and others, 2021). The U.S. Geological Survey (USGS) is working to provide actionable guidance for how extreme events impact water availability through short-term changes in water quantity and quality. Initially, the USGS is focusing on the extreme event of wildfire, and how it impacts our Nation’s water supplies.
Millions of acres of land are burned by wildfires in the United States each year, including important water-supply watersheds. Wildfire effects can modify how and when water flows through the landscape, altering infiltration, runoff, groundwater recharge, and erosion (fig. S1.1; Murphy and others, 2018; Ebel and others, 2022). Surface water quality responses to wildfire can include contamination with ash, increased sediment concentrations, altered stream temperature, and mobilization of legacy contaminants such as mine tailings in nearby receiving waters (Murphy and others, 2020; Chen and Chang, 2022). Effects of wildfire on surface water last for years and can be either acute, associated specifically with intense storms, or chronic and experienced at a range of flows (Murphy and others, 2015; Emelko and others, 2016). Groundwater quality can also be affected by wildfire (Mansilha and others, 2020), although few measurements of post-fire groundwater quality exist.
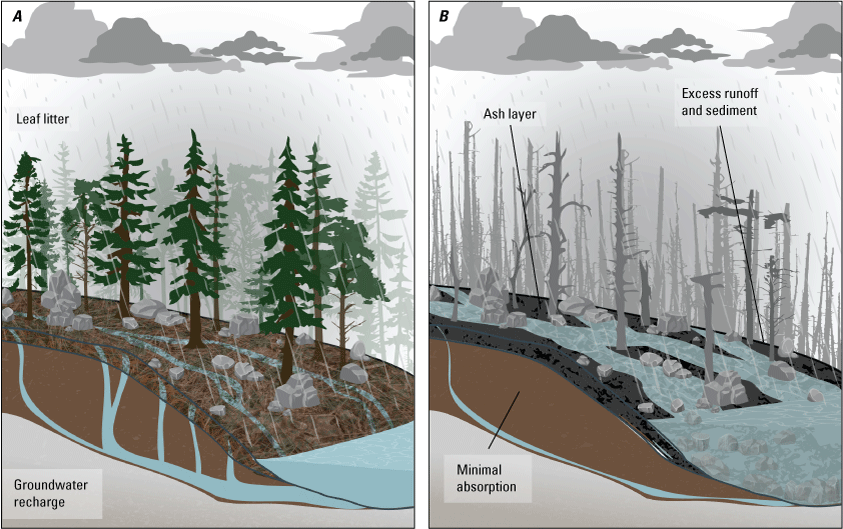
Forested watershed’s ability to absorb and filter precipitation as a key aspect of sustainable water supplies. Before a fire (A), leaf litter and organic soil layers promote infiltration, water retention, and groundwater recharge. After a fire (B), the ground cover, soil properties, and water flow patterns change and can significantly degrade water supplies from the affected watershed. From U.S. Geological Survey (2024b).
The USGS is focusing on improving assessment and prediction of the water-availability effects of wildfire in combination with extreme events through increased hydrologic monitoring of burned watersheds in the western United States. Improving assessment and prediction of post-fire water quantity and quality effects requires (1) high-frequency, in situ sensors for key water-quality constituents; (2) discrete storm timescale sampling of water quality; and (3) rainfall data from within the burned part of the watershed (Murphy and others, 2023). A review and synthesis of post-wildfire hydrologic response models pointed to opportunities for improving model performance by developing methods to represent fire effects and recovery on model parameters, building new approaches for spatially variable rainfall forcing data where rain gages are sparse or nonexistent, and incorporating more advanced representation of subsurface flow into model structure (Ebel and others, 2023).
Although national and global climate assessments project future changes to some aspects of water availability with high confidence, the complex interactions of climate variability, land-use change, and other human modifications are much more difficult to predict and have more uncertainty. These dynamics are further discussed in the “Climate Change and Future Water Availability in the United States” chapter of this report (chap. E, Scholl and others, 2025). Accounting for this uncertainty in future assessments requires a portfolio of modeled scenarios; for example, examining changes from multiple global circulation, land surface, and hydrological models under multiple representative concentration pathways (van Vuuren and others, 2011) and shared socioeconomic pathways (O’Neill and others, 2014).
Human response and adaptation to changes in water availability can add another layer of uncertainty. Management decisions and adoption of new water conservation practices are difficult to predict, and often changes to water governance policies can be much slower than the response needed (Cosgrove and Loucks, 2015). A multisectoral approach to providing water availability has been promoted in existing literature (Cosgrove and Loucks, 2015). Within the agricultural sector, water availability can be improved while continuing to meet food demands by implementing practices such as the introduction of buffer strips, drought-resilient crop varieties, improved irrigation technology, and shifting agriculture to rain-fed lands (Liu and others, 2017b; Pastor and others, 2019). In urban areas, new water-reclamation technologies and expansion of treatment facilities could help meet growing municipal water demands (Gude, 2017). Reducing overall water consumption could help lessen water stress in some areas. However, changing water use can be challenging because it is often embedded within cultural norms that are linked to human health, livelihood, perceived intrinsic values for natural resources, and economic development (Herman-Mercer and others, 2023). Multiple solutions, including developing new water-efficient technologies across sectors and lowering water demands, will likely be required to address water security in the future.
Conclusions
Water availability can be limited by multiple factors depending on the beneficial uses being considered. The surface water-supply and use index (SUI) was low in areas with high water supply, suggesting that water supply was adequate for consumptive uses. However, water availability could also be limited in these areas by ecological flow alteration or degraded water quality. Individual limitations on water availability can also interact, for example, in situations in which water quality is degraded either by low supply thereby decreasing dilution of contaminants or high water use that promotes pollutant mobilization into local water supplies (table 1). Therefore, the consideration of multiple indicators provided a fuller picture of the potential ways in which water availability could be limited across the conterminous United States (CONUS).
Elevated values for SUI were the most widespread the Southern High Plains, Texas, Central High Plains, and Mississippi Embayment hydrologic regions. Elevated SUI was most closely related to high withdrawals for crop irrigation. The ability to calculate output at the HUC12 scale also enabled greater resolution in the SUI, showing elevated values specifically within the High Plains, California Central Valley, Mississippi Alluvial Plain, and Snake River Plain, areas that have been previously identified as having water-availability limitations. However, SUI was dynamic, expanding seasonally and during dry years with peak areal coverage during the widespread 2012–13 drought.
Areas with elevated SUI also contain fish species of conservation concern that have large parts of their habitat ranges exposed to elevated supply and use imbalances during their spawning seasons. More than 50 percent of the habitat range of the Arkansas River shiner (Notropis girardi), a federally listed species, was reported to have severely limited supply relative to demand, with less than 20 percent of natural streamflow volume remaining, during spawning season.
CONUS-scale model simulations of surface water and groundwater quality reveal the spatial distribution of several water-quality limitations affecting water availability. Elevated concentrations of nitrogen and phosphorus in surface waters relative to environmental benchmarks were widespread. Groundwater models for nitrate and arsenic indicated much more limited areal coverage of exceedances than surface water, although the human-health, drinking-water concentrations used for comparison were much higher than the surface-water environmental benchmarks. This finding emphasizes how different beneficial uses can be subject to much different water-availability limitations.
Multiple factors contribute to water availability and co-occurrence of stressors can compound impacts from any single cause. Combined limitations on water availability are evident when multiple stressors—including water quantity (as SUI), surface-water and groundwater quality, and ecologically substantial alterations to flow characteristics—were examined simultaneously. The Central High Plains, Southern High Plains, and California–Nevada hydrologic regions show high or severe stress from all four of the indicators of water availability examined. Four additional hydrologic regions have high or severe water stress in multiple indicator categories. These regions may face the greatest challenges addressing their water-availability limitations because they have multiple simultaneous limitations and may have reduced capacity to address impediments to water availability.
Social factors are also important determinants of water access. Access to adequate water of sufficient quality is often mediated by the existence of physical infrastructure and social phenomena, which extend beyond measures of quantity and quality. Despite tremendous gains, limitations affecting clean-water access persist in the United States and are often clustered in communities that are marginalized in other ways. Twelve-digit hydrologic unit code (HUC12) catchments with elevated SUI or more severe water-quality degradation were also found to have higher percentages of their populations considered socially vulnerable. Drinking-water violations and the reoccurrence of violations are more prevalent in socially vulnerable communities. The cost of building and maintaining water infrastructure can also disproportionately burden socially vulnerable communities. Marginalized communities reliant on ecosystem services can be particularly vulnerable to the effects of water availability on ecosystems and fish communities.
Acknowledgments
We are grateful for the assistance of U.S. Geological Survey staff Lori Sprague, Jeni Keisman, Jared Smith, and Dan Wise, who provided valuable comments and follow-up discussion in their review of this chapter.
References Cited
Abatzoglou, J.T., and Williams, A.P., 2016, Impact of anthropogenic climate change on wildfire across western US forests: Proceedings of the National Academy of Sciences of the United States of America, v. 113, no. 42, p. 11770–11775, accessed January 27, 2024, at https://doi.org/10.1073/pnas.1607171113.
Acreman, M.C., and Dunbar, M.J., 2004, Defining environmental river flow requirements—A review: Hydrology and Earth System Sciences, v. 8, no. 5, p. 861–876, accessed January 15, 2024, at https://doi.org/10.5194/hess-8-861-2004.
Alizadeh, M.R., Adamowski, J., Nikoo, M.R., AghaKouchak, A., Dennison, P., and Sadegh, M., 2020, A century of observations reveals increasing likelihood of continental-scale compound dry-hot extremes: Science Advances, v. 6, no. 39, 11 p., accessed January 19, 2024, at https://doi.org/10.1126/sciadv.aaz4571.
Allaire, M., Wu, H., and Lall, U., 2018, National trends in drinking water quality violations: Proceedings of the National Academy of Sciences of the United States of America, v. 115, no. 9, p. 2078–2083, accessed January 8, 2024, at https://doi.org/10.1073/pnas.1719805115.
Amtstaetter, F., Tonkin, Z., O’Connor, J., Stuart, I., and Koster, W.M., 2021, Environmental flows stimulate the upstream movement of juvenile diadromous fishes: Marine and Freshwater Research, v. 72, no. 7, p. 1019–1026, accessed March 21, 2024, at https://doi.org/10.1071/MF20222.
Archfield, S.A., Kennen, J.G., Carlisle, D.M., and Wolock, D.M., 2014, An objective and parsimonious approach for classifying natural flow regimes at a continental scale: River Research and Applications, v. 30, no. 9, p. 1166–1183, accessed March 21, 2024, at https://doi.org/10.1002/rra.2710.
Arctic Monitoring and Assessment Programme, 2009, AMAP assessment 2009—Human health in the Arctic: Oslo, Norway, Arctic Monitoring and Assessment Programme (AMAP), 254 p., accessed January 19, 2024, at https://www.amap.no/documents/doc/amap-assessment-2009-human-health-in-the-arctic/98.
Arthington, A.H., and Balcombe, S.R., 2011, Extreme flow variability and the ‘boom and bust’ ecology of fish in arid-zone floodplain rivers—A case history with implications for environmental flows, conservation and management: Ecohydrology, v. 4, no. 5, p. 708–720, accessed January 15, 2024, at https://doi.org/10.1002/eco.221.
Arthington, A.H., Kennen, J.G., Stein, E.D., and Webb, J.A., 2018, Recent advances in environmental flows science and water management—Innovation in the Anthropocene: Freshwater Biology, v. 63, no. 8, p. 1022–1034, accessed January 15, 2024, at https://doi.org/10.1111/fwb.13108.
Ator, S.W., 2019, Spatially referenced models of streamflow and nitrogen, phosphorus, and suspended-sediment loads in streams of the northeastern United States: U.S. Geological Survey Scientific Investigations Report 2019–5118, 57 p., accessed January 15, 2024, at https://doi.org/10.3133/sir20195118.
Baggio, G., Qadir, M., and Smakhtin, V., 2021, Freshwater availability status across countries for human and ecosystem needs: Science of the Total Environment, v. 792, 11 p., accessed January 2, 2024, at https://doi.org/10.1016/j.scitotenv.2021.148230.
Bipa, N.J., Stradiotti, G., Righetti, M., and Pisaturo, G.R., 2024, Impacts of hydropeaking: A systematic review: Science of The Total Environment, v. 912, 19 p., accessed January 15, 2024, at https://www.sciencedirect.com/science/article/pii/S0048969723078816.
Brauman, K.A., Richter, B.D., Postel, S., Malsy, M., and Flörke, M., 2016, Water depletion—An improved metric for incorporating seasonal and dry-year water scarcity into water risk assessments: Elementa, v. 4, 12 p., accessed December 5, 2022, at https://online.ucpress.edu/elementa/article/doi/10.12952/journal.elementa.000083/112909/Water-depletion-An-improved-metric-for.
Brooks, B.W., Riley, T.M., and Taylor, R.D., 2006, Water quality of effluent-dominated ecosystems—Ecotoxicological, hydrological, and management considerations: Hydrobiologia, v. 556, no. 1, p. 365–379, accessed January 19, 2024, at https://doi.org/10.1007/s10750-004-0189-7.
Bruce Lauber, T., Connelly, N.A., Niederdeppe, J., and Knuth, B.A., 2017, Urban anglers in the Great Lakes region—Fish consumption patterns, influences, and responses to advisory messages: Science of the Total Environment, v. 590–591, p. 495–501, accessed January 17, 2024, at https://doi.org/10.1016/j.scitotenv.2017.02.189.
Caldwell, P.V., Sun, G., McNulty, S.G., Cohen, E.C., and Moore Myers, J.A., 2012, Impacts of impervious cover, water withdrawals, and climate change on river flows in the conterminous US: Hydrology and Earth System Sciences, v. 16, no. 8, p. 2839–2857, accessed January 15, 2024, at https://doi.org/10.5194/hess-16-2839-2012.
Caretta, A.M.M.A., Arfanuzzaman, R.B.M., Morgan, S.M.R., and Kumar, M., 2022, Water, in Climate change 2022—Impacts, adaptation, and vulnerability: Contribution of Working Group II to the Sixth Assessment Report of the Intergovernmental Panel on Climate Change, 1,042 p., accessed May 21, 2023, at https://www.ipcc.ch/site/assets/uploads/2018/03/WGII_TAR_full_report-2.pdf.
Carey, R.O., and Migliaccio, K.W., 2009, Contribution of wastewater treatment plant effluents to nutrient dynamics in aquatic systems—A review: Environmental Management, v. 44, no. 2, p. 205–217, accessed January 15, 2024, at https://doi.org/10.1007/s00267-009-9309-5.
Carlisle, D.M., 2019, Predicted streamflow modification for NHD stream reaches of the conterminous United States (1980–2015): U.S. Geological Survey data release, accessed February 23, 2024, at https://doi.org/10.5066/P9R4FFGG.
Carlisle, D., Wolock, D., Konrad, C., McCabe, G., Eng, K., Grantham, T., and Mahler, B., 2019, Flow modification in the Nation’s streams and rivers: U.S. Geological Survey Circular 1461, 75 p., accessed July 10, 2023, at https://doi.org/10.3133/cir1461.
Carlisle, D.M., Grantham, T.E., Eng, K., and Wolock, D.M., 2017, Biological relevance of streamflow metrics—Regional and national perspectives: Freshwater Science, v. 36, no. 4, p. 927–940, accessed July 10, 2023, at https://doi.org/10.1086/694913.
Cashman, M.J., Lee, G, Staub, L., Katoski, M., and Maloney, K., 2024., It's not just sediment: multi-dimensional measures of physical habitat reveal added insight for river management: Journal of Environmental Management, v. 371, no. 123139, p. 1-19, accessed December, 2024, at https://doi.org/10.1016/j.jenvman.2024.123139.
Centers for Disease Control, 2022, CDC SVI documentation 2020: Centers for Disease Control, accessed March 10, 2024, at https://www.atsdr.cdc.gov/placeandhealth/svi/data_documentation_download.html.
Chen, J., and Chang, H., 2022, A review of wildfire impacts on stream temperature and turbidity across scales: Progress in Physical Geography, v. 47, no. 3, p. 369–394, accessed May 25, 2023, at https://doi.org/10.1177/03091333221118363.
Chini, C.M., Konar, M., and Stillwell, A.S., 2017, Direct and indirect urban water footprints of the United States: Water Resources Research, v. 53, no. 1, p. 316–327, accessed January 11, 2024, at https://doi.org/10.1002/2016WR019473.
Chini, C.M., Logan, L.H., and Stillwell, A.S., 2020, Grey water footprints of U.S. thermoelectric power plants from 2010–2016: Advances in Water Resources, v. 145, 9 p., accessed January 11, 2024, at https://doi.org/10.1016/j.advwatres.2020.103733.
Clark, B.R., Hart, R.M., and Gurdak, J.J., 2011, Groundwater availability of the Mississippi embayment: U.S. Geological Survey Professional Paper 1785, 62 p., accessed April 3, 2023, at https://doi.org/10.3133/pp1785.
Colangelo, D.J., 2014, Interim response of dissolved oxygen to reestablished flow in the Kissimmee River, Florida, U.S.A: Restoration Ecology, v. 22, no. 3, p. 376–387, accessed March 21, 2024, at https://doi.org/10.1111/rec.12058.
Comte, L., Grantham, T., and Ruhi, A., 2021, Human stabilization of river flows is linked with fish invasions across the USA: Global Ecology and Biogeography, v. 30, no. 3, p. 725–737, accessed March 21, 2024, at https://doi.org/10.1111/geb.13258.
Cook, E.R., Woodhouse, C.A., Eakin, C.M., Meko, D.M., and Stahle, D.W., 2004, Long-term aridity changes in the western United States: Science, v. 306, no. 5698, p. 1015–1018, accessed January 27, 2024, at https://doi.org/10.1126/science.1102586.
Cordy, G.E., 2001, A primer on water quality: U.S. Geological Survey Fact Sheet FS-027-01, accessed January 9, 2024, at https://pubs.usgs.gov/fs/fs-027-01/.
Cosgrove, W.J., and Loucks, D.P., 2015, Water management—Current and future challenges and research directions: Water Resources Research, v. 51, no. 6, p. 4823–4839, accessed January 27, 2024, at https://doi.org/10.1002/2014WR016869.
Damkjaer, S., and Taylor, R., 2017, The measurement of water scarcity—Defining a meaningful indicator: Ambio, v. 46, no. 5, p. 513–531, accessed December 5, 2022, at https://doi.org/10.1007/s13280-017-0912-z.
Davies, P.M., Naiman, R.J., Warfe, D.M., Pettit, N.E., Arthington, A.H., and Bunn, S.E., 2014, Flow–ecology relationships—Closing the loop on effective environmental flows: Marine and Freshwater Research, v. 65, no. 2, p. 133–141, accessed January 15, 2024, at https://doi.org/10.1071/MF13110.
Deitz, S., and Meehan, K., 2019, Plumbing poverty—Mapping hot spots of racial and geographic inequality in US household water insecurity: Annals of the American Association of Geographers, v. 109, no. 4, p. 1092–1109, accessed May 25, 2023, at https://doi.org/10.1080/24694452.2018.1530587.
Dettinger, M., 2005, Changes in streamflow timing in the western United States in recent decades: U.S. Geological Survey Fact Sheet 2005–3018, 4 p., accessed July 25, 2023, at https://doi.org/10.3133/fs20053018.
Devineni, N., Lall, U., Etienne, E., Shi, D., and Xi, C., 2015, America’s water risk—Current demand and climate variability: Geophysical Research Letters, v. 42, no. 7, p. 2285–2293, accessed February 20, 2023, at https://doi.org/10.1002/2015GL063487.
Dibble, K.L., Yackulic, C.B., Kennedy, T.A., Bestgen, K.R., and Schmidt, J.C., 2021, Water storage decisions will determine the distribution and persistence of imperiled river fishes: Ecological Applications, v. 31, no. 2, 9 p., accessed March 14, 2024 at https://esajournals.onlinelibrary.wiley.com/doi/abs/10.1002/eap.2279.
Dickson, K.E., and Dzombak, D.A., 2017, Inventory of interbasin transfers in the United States: Journal of the American Water Resources Association, v. 53, no. 5, p. 1121–1132, accessed July 12, 2023, at https://doi.org/10.1111/1752-1688.12561.
Dobbs, G.R., Liu, N., Caldwell, P.V., Miniat, C.F., Sun, G., Duan, K., and Bolstad, P.V., 2023, Inter-basin surface water transfers database for public water supplies in conterminous United States, 1986–2015: Scientific Data, v. 10, no. 1, 12 p., accessed July 12, 2023, at https://doi.org/10.1038/s41597-023-02148-5.
Dolan, F., Lamontagne, J., Link, R., Hejazi, M., Reed, P., and Edmonds, J., 2021, Evaluating the economic impact of water scarcity in a changing world: Nature Communications, v. 12, no. 1, 10 p., accessed January 12, 2024, at https://doi.org/10.1038/s41467-021-22194-0.
Easterling, D.R., Arnold, J.R., Knutson, T., Kunkel, K.E., LeGrande, A.N., Leung, L.R., Vose, R.S., Waliser, D.E., and Wehner, M.F., 2017, Precipitation change in the United States—Fourth National Climate Assessment, v. I: Washington, D.C., U.S. Global Change Research Program, chap. 7, accessed January 19, 2024, at https://doi.org/10.7930/J0H993CC.
Ebel, B.A., Moody, J.A., and Martin, D.A., 2022, Post-fire temporal trends in soil-physical and-hydraulic properties and simulated runoff generation—Insights from different burn severities in the 2013 Black Forest Fire, CO, USA: Science of the Total Environment, v. 802, 44 p., accessed May 25, 2023, at https://doi.org/10.1016/j.scitotenv.2021.149847.
Ebel, B.A., Shephard, Z.M., Walvoord, M.A., Murphy, S.F., Partridge, T.F., and Perkins, K.S., 2023, Modeling post‐wildfire hydrologic response—Review and future directions for applications of physically based distributed simulation: Earth's Future, v. 11, no. 2, 23 p., accessed May 25, 2023, at https://doi.org/10.1029/2022EF003038.
Emanuel, R.E., Buckley, J.J., Caldwell, P.V., McNulty, S.G., and Sun, G., 2015, Influence of basin characteristics on the effectiveness and downstream reach of interbasin water transfers—Displacing a problem: Environmental Research Letters, v. 10, no. 12, 10 p., accessed December 5, 2022, at https://doi.org/10.1088/1748-9326/10/12/124005.
Emelko, M.B., Stone, M., Silins, U., Allin, D., Collins, A.L., Williams, C.H., Martens, A.M., and Bladon, K.D., 2016, Sediment‐phosphorus dynamics can shift aquatic ecology and cause downstream legacy effects after wildfire in large river systems: Global Change Biology, v. 22, no. 3, p. 1168–1184, accessed May 25, 2023, at https://doi.org/10.1111/gcb.13073.
Eng, K., Carlisle, D., Grantham, T.E., Wolock, D.M., and Eng, R.L., 2019, Severity and extent of alterations to natural streamflow regimes based on hydrologic metrics in the conterminous United States, 1980–2014: U.S. Geological Survey Scientific Investigations Report 2019–5001, 25 p., accessed March 21, 2024, at https://doi.org/10.3133/sir20195001.
Eppehimer, D.E., Enger, B.J., Ebenal, A.E., Rocha, E.P., and Bogan, M.T., 2021, Daily flow intermittence in an effluent-dependent river—Impacts of flow duration and recession rate on fish stranding: River Research and Applications, v. 37, no. 10, p. 1376–1385, accessed January 19, 2024, at https://doi.org/10.1002/rra.3850.
Erickson, M.L, Miller, O.L, Cashman, J.J., Degnan, J.R., Reddy, J.E., Martinez, A.J., and Azadpour, E, 2025, Status of water-quality conditions in the United States, 2010–20 (ver. 1.1, February 2025), chap. C of U.S. Geological Survey Integrated Water Availability Assessment—2010–20: U.S. Geological Survey Professional Paper 1894–C, 85 p., https://doi.org/10.3133/pp1894C.
Evenson, E.J., Orndorff, R.C., Blome, C.D., Böhlke, J.K., Hershberger, P.K., Langenheim, V.E., McCabe, G.J., Morlock, S.E., Reeves, H.W., Verdin, J.P., Weyers, H.S., and Wood, T.M., 2013, U.S. Geological Survey water science strategy—Observing, understanding, predicting, and delivering water science to the Nation: U.S. Geological Survey Circular 1383–G, 49 p., accessed February 20, 2023, at https://doi.org/10.3133/cir1383G.
Flanagan, B.E., Gregory, E.W., Hallisey, E.J., Heitgerd, J.L., and Lewis, B., 2011, A social vulnerability index for disaster management: Journal of Homeland Security and Emergency Management, v. 8, no. 1, accessed February 6, 2024, at https://doi.org/10.2202/1547-7355.1792.
Fornarelli, R., and Antenucci, J.P., 2011, The impact of transfers on water quality and the disturbance regime in a reservoir: Water Research, v. 45, no. 18, p. 5873–5885, accessed January 19, 2024, at https://doi.org/10.1016/j.watres.2011.08.048.
Freeman, M.C., Bestgen, K.R., Carlisle, D., Frimpong, E.A., Franssen, N.R., Gido, K.B., Irwin, E., Kanno, Y., Luce, C., Kyle McKay, S., Mims, M.C., Olden, J.D., LeRoy Poff, N., Propst, D.L., Rack, L., Roy, A.H., Stowe, E.S., Walters, A., and Wenger, S.J., 2022, Toward improved understanding of streamflow effects on freshwater fishes: Fisheries, v. 47, no. 7, p. 290–298, accessed May 15, 2024, at https://doi.org/10.1002/fsh.10731.
Fuhrer, G.J., Morace, J.L., Johnson, H.M., Rinella, J.F., Ebbert, J.C., Embrey, S.S., Waite, I.R., Carpenter, K.D., Wise, D.R., and Hughes, C.A., 2004, Water quality in the Yakima River Basin, Washington, 1999–2000: U.S. Geological Survey Circular 1237, 44 p., accessed April 3, 2023, at https://doi.org/10.3133/cir1237.
Gangopadhyay, S., McCabe, G.J., Pruitt, T., and House, B., 2021, West-wide drought analysis 4: Bureau of Reclamation, 129–182 p., accessed January 19, 2024, at https://www.usbr.gov/climate/secure/2021secure.html.
Garcia, S., and Mejia, A., 2019, Characterizing and modeling subnational virtual water networks of US agricultural and industrial commodity flows: Advances in Water Resources, v. 130, p. 314–324, accessed January 13, 2024, at https://doi.org/10.1016/j.advwatres.2019.06.013.
George, R., McManamay, R., Perry, D., Sabo, J., and Ruddell, B.L., 2021, Indicators of hydro-ecological alteration for the rivers of the United States: Ecological Indicators, v. 120, 9 p., accessed February 22, 2023, at https://doi.org/10.1016/j.ecolind.2020.106908.
Gillespie, N., Epstein, J., Alexander, S., Bowker, J.M., Medel, R., Leonard, M., and Thoms, A., 2018, Socioeconomic benefits of recreational, commercial, and subsistence fishing associated with national forests: Fisheries, v. 43, no. 9, p. 432–439, accessed January 15, 2024, at https://doi.org/10.1002/fsh.10127.
Gorski, G., Stets, E.G., Scholl, M.A., Degnan, J.R., Mullaney, J.R., Galanter, A.E., Martinez, A.J., Padilla, J., LaFontaine, J.H., Corson-Dosch, H.R., and Shapiro, A.M., 2025, Water supply in the conterminous United States, Alaska, Hawaii, and Puerto Rico, water years 2010–20 (ver. 1.1, January 17, 2025), chap. B of U.S. Geological Survey Integrated Water Availability Assessment—2010–20: U.S. Geological Survey Professional Paper 1894–B, 60, https://doi.org/10.3133/pp1894B.
Gude, V.G., 2017, Desalination and water reuse to address global water scarcity: Reviews in Environmental Science and Biotechnology, v. 16, no. 4, p. 591–609, accessed January 27, 2024, at https://doi.org/10.1007/s11157-017-9449-7.
Gurdak, J.J., McMahon, P.B., Dennehy, K., and Qi, S.L., 2009, Water quality in the High Plains aquifer, Colorado, Kansas, Nebraska, New Mexico, Oklahoma, South Dakota, Texas, and Wyoming, 1999–2004: U.S. Geological Survey Circular 1337, 63 p., accessed March 30, 2023, at https://pubs.usgs.gov/circ/1337/.
Harvey, J., Gomez-Velez, J., Schmadel, N., Scott, D., Boyer, E., Alexander, R., Eng, K., Golden, H., Kettner, A., Konrad, C., Moore, R., Pizzuto, J., Schwarz, G., Soulsby, C., and Choi, J., 2019, How hydrologic connectivity regulates water quality in river corridors: Journal of the American Water Resources Association, v. 55, no. 2, p. 369–381, accessed March 21, 2024, at https://doi.org/10.1111/1752-1688.12691.
Herman-Mercer, N.M., Bair, L., Hines, M., Restrepo-Osorio, D., Romero, V., and Lyde, A., 2023, Human factors used to estimate and forecast water supply and demand in the Upper Colorado River Basin: U.S. Geological Survey Scientific Investigations Report 2023–5015, 46 p., accessed January 27, 2024, at https://doi.org/10.3133/sir20235015.
Hitt, N.P., Rogers, K.M., Kelly, Z.A., Henesy, J., and Mullican, J.E., 2020, Fish life history trends indicate increasing flow stochasticity in an unregulated river: Ecosphere, v. 11, no. 2, 17 p., accessed March 21, 2024, at https://doi.org/10.1002/ecs2.3026.
Hoos, A.B., and Roland, V.L., II, 2019, Spatially referenced models of streamflow and nitrogen, phosphorus, and suspended-sediment loads in the southeastern United States: U.S. Geological Survey Scientific Investigations Report 2019–5135, 87 p., accessed January 15, 2024, at https://doi.org/10.3133/sir20195135.
Jägermeyr, J., Pastor, A., Biemans, H., and Gerten, D., 2017, Reconciling irrigated food production with environmental flows for sustainable development goals implementation: Nature Communications, v. 8, 9 p., accessed August 23, 2023, at https://doi.org/10.1038/ncomms15900.
Kaufmann, P.R., Hughes, R.M., Paulsen, S.G., Peck, D.V., Seeliger, C.W., Weber, M.H., and Mitchell, R.M., 2022, Physical habitat in conterminous US streams and rivers, Part 1—Geoclimatic controls and anthropogenic alteration: Ecological Indicators, v. 141, 21 p., accessed March 14, 2024, at https://www.sciencedirect.com/science/article/pii/S1470160X22005179.
Kaushal, S.S., Gold, A.J., Bernal, S., Johnson, T.A.N., Addy, K., Burgin, A., Burns, D.A., Coble, A.A., Hood, E., Lu, Y., Mayer, P., Minor, E.C., Schroth, A.W., Vidon, P., Wilson, H., Xenopoulos, M.A., Doody, T., Galella, J.G., Goodling, P., Haviland, K., Haq, S., Wessel, B., Wood, K.L., Jaworski, N., and Belt, K.T., 2018b, Watershed ‘chemical cocktails’—Forming novel elemental combinations in Anthropocene fresh waters: Biogeochemistry, v. 141, no. 3, p. 281–305, accessed January 9, 2024, at https://doi.org/10.1007/s10533-018-0502-6.
Kaushal, S.S., Gold, A.J., Bernal, S., and Tank, J.L., 2018a, Diverse water quality responses to extreme climate events—An introduction: Biogeochemistry, v. 141, no. 3, p. 273–279, accessed May 25, 2023, at https://doi.org/10.1007/s10533-018-0527-x.
Kaushal, S.S., Maas, C.M., Mayer, P.M., Newcomer-Johnson, T.A., Grant, S.B., Rippy, M.A., Shatkay, R.R., Leathers, J., Gold, A.J., Smith, C., McMullen, E.C., Haq, S., Smith, R., Duan, S., Malin, J., Yaculak, A., Reimer, J.E., Delaney Newcomb, K., Sides Raley, A., Collison, D.C., Galella, J.G., Grese, M., Sivirichi, G., Doody, T.R., Vikesland, P., Bhide, S.V., Krauss, L., Daugherty, M., Stavrou, C., Etheredge, M., Ziegler, J., Kirschnick, A., England, W., and Belt, K.T., 2023, Longitudinal stream synoptic monitoring tracks chemicals along watershed continuums—A typology of trends: Frontiers in Environmental Science, v. 11, 28 p., accessed May 25, 2023, at https://doi.org/10.3389/fenvs.2023.1122485.
Kemp, S.J., and Kemp, M.J., 2023, A flooded future for river chub?—Future impacts of climate change and urbanization on reproduction of a keystone native fish species: Transactions of the American Fisheries Society, v. 152, no. 5, p. 594–609, accessed March 21, 2024, at https://doi.org/10.1002/tafs.10420.
Kennedy, T.A., Muehlbauer, J.D., Yackulic, C.B., Lytle, D.A., Miller, S.W., Dibble, K.L., Kortenhoeven, E.W., Metcalfe, A.N., and Baxter, C.V., 2016, Flow management for hydropower extirpates aquatic insects, undermining river food webs: Bioscience, v. 66, no. 7, p. 561–575, accessed January 15, 2024, at https://doi.org/10.1093/biosci/biw059.
Khan, S.J., Deere, D., Leusch, F.D., Humpage, A., Jenkins, M., and Cunliffe, D., 2015, Extreme weather events—Should drinking water quality management systems adapt to changing risk profiles?: Water Research, v. 85, p. 124–136, accessed May 25, 2023, at https://doi.org/10.1016/j.watres.2015.08.018.
Konar, M., and Marston, L., 2020, The water footprint of the United States: Water, v. 12, no. 11, 21 p., accessed February 20, 2023, at https://doi.org/10.3390/w12113286.
Koncagül, E., and Connor, R., 2023, The United Nations World Water Development Report 2023—Partnerships and cooperation for water; facts, figures and action examples: UNESCO World Water Assessment Programme, 15 p., accessed January 18, 2024, at https://policycommons.net/artifacts/10611945/the-united-nations-world-water-development-report-2023/11518985/.
Kuriqi, A., Pinheiro, A.N., Sordo-Ward, A., Bejarano, M.D., and Garrote, L., 2021, Ecological impacts of run-of-river hydropower plants—Current status and future prospects on the brink of energy transition: Renewable & Sustainable Energy Reviews, v. 142, 17 p., accessed January 19, 2024, at https://doi.org/10.1016/j.rser.2021.110833.
Lennox, R.J., Crook, D.A., Moyle, P.B., Struthers, D.P., and Cooke, S.J., 2019, Toward a better understanding of freshwater fish responses to an increasingly drought-stricken world: Reviews in Fish Biology and Fisheries, v. 29, no. 1, p. 71–92, accessed July 12, 2023, at https://doi.org/10.1007/s11160-018-09545-9.
Lin, Y., and Garcia, L.A., 2012, Assessing the impact of irrigation return flow on river salinity for Colorado’s Arkansas River Valley: Journal of Irrigation and Drainage Engineering, v. 138, no. 5, p. 406–415, accessed May 9, 2024, at https://doi.org/10.1061/(ASCE)IR.1943-4774.0000410.
Lindholm, G.F., 1996, Summary of the Snake River Plain regional aquifer-system analysis in Idaho and eastern Oregon: U.S. Geological Survey Professional Paper 1408–A, 59 p., accessed April 3, 2023, at https://doi.org/10.3133/pp1408A.
Liu, J., Yang, H., Gosling, S.N., Kummu, M., Flörke, M., Pfister, S., Hanasaki, N., Wada, Y., Zhang, X., Zheng, C., Alcamo, J., and Oki, T., 2017a, Water scarcity assessments in the past, present, and future: Earth’s Future, v. 5, no. 6, p. 545–559, accessed January 15, 2024, at https://doi.org/10.1002/2016EF000518.
Liu, N., Dobbs, G.R., Caldwell, P.V., Miniat, C.F., Sun, G., Duan, K., Nelson, S.A.C., Bolstad, P.V., and Carlson, C.P., 2022, Inter-basin transfers extend the benefits of water from forests to population centers across the conterminous U.S: Water Resources Research, v. 58, no. 5, 19 p., accessed January 15, 2024, at https://doi.org/10.1029/2021WR031537.
Liu, X., Liu, W., Liu, L., Tang, Q., Liu, J., and Yang, H., 2021, Environmental flow requirements largely reshape global surface water scarcity assessment: Environmental Research Letters, v. 16, no. 10, 13 p., accessed January 15, 2024, at https://doi.org/10.1088/1748-9326/ac27cb.
Liu, Y., Engel, B.A., Flanagan, D.C., Gitau, M.W., McMillan, S.K., and Chaubey, I., 2017b, A review on effectiveness of best management practices in improving hydrology and water quality—Needs and opportunities: Science of the Total Environment, v. 601–602, p. 580–593, accessed January 15, 2024, at https://doi.org/10.1016/j.scitotenv.2017.05.212.
Logan, L.H., and Stillwell, A.S., 2018, Probabilistic assessment of aquatic species risk from thermoelectric power plant effluent—Incorporating biology into the energy-water nexus: Applied Energy, v. 210, p. 434–450, accessed January 15, 2024, at https://doi.org/10.1016/j.apenergy.2017.09.027.
Lombard, M.A., Bryan, M.S., Jones, D.K., Bulka, C., Bradley, P.M., Backer, L.C., Focazio, M.J., Silverman, D.T., Toccalino, P., Argos, M., Gribble, M.O., and Ayotte, J.D., 2021, Machine learning models of arsenic in private wells throughout the conterminous United States as a tool for exposure assessment in human health studies: Environmental Science & Technology, v. 55, no. 8, p. 5012–5023, accessed January 15, 2024, at https://doi.org/10.1021/acs.est.0c05239.
Mack, E.A., and Wrase, S., 2017, A burgeoning crisis? A nationwide assessment of the geography of water affordability in the United States: PLoS One, v. 12, no. 1, 10 p., accessed May 25, 2023, at https://doi.org/10.1371/journal.pone.0169488.
Mansilha, C., Melo, A., Martins, Z.E., Ferreira, I., Pereira, A.M., and Marques, J.E., 2020, Wildfire effects on groundwater quality from springs connected to small public supply systems in a peri-urban forest area (Braga Region, NW Portugal): Water, v. 12, no. 4, 16 p., accessed May 25, 2023, at https://doi.org/10.3390/w12041146.
McCabe, G.J., and Wolock, D.M., 2021, Water balance of the turn-of-the-century drought in the southwestern United States: Environmental Research Letters, v. 16, no. 4, 10 p., accessed May 23, 2023, at https://doi.org/10.1088/1748-9326/abbfc1.
McCabe, G.J., Wolock, D.M., Lombard, M., Dudley, R.W., Hammond, J.C., Hecht, J.S., Hodgkins, G.A., Olson, C., Sando, R., Simeone, C., and Wieczorek, M., 2023, A hydrologic perspective of major U.S. droughts: International Journal of Climatology, v. 43, no. 3, p. 1234–1250, accessed March 29, 2023, at https://doi.org/10.1002/joc.7904.
McManamay, R.A., George, R., Morrison, R.R., and Ruddell, B.L., 2022, Mapping hydrologic alteration and ecological consequences in stream reaches of the conterminous United States: Scientific Data, v. 9, no. 1, 13 p., accessed May 24, 2023, at https://doi.org/10.1038/s41597-022-01566-1.
Medalie, L., Galanter, A.E., Martinez, A.J., and Archer, A.A., Luukkonen, C.L., Harris, M.A., and Haynes, J.V., 2025, Water use across the conterminous United States, water years 2010–20, chap. D of U.S. Geological Survey Integrated Water Availability Assessment—2010–20: U.S. Geological Survey Professional Paper 1894–D, 56 p., https://doi.org/10.3133/pp1894D.
Meehan, K., Jurjevich, J.R., Chun, N.M., and Sherrill, J., 2020, Geographies of insecure water access and the housing–water nexus in US cities: Proceedings of the National Academy of Sciences of the United States of America, v. 117, no. 46, p. 28700–28707, accessed May 25, 2023, at https://doi.org/10.1073/pnas.2007361117.
Mekonnen, M.M., and Hoekstra, A.Y., 2016, Four billion people facing severe water scarcity: Science Advances, v. 2, no. 2, 6 p., accessed December 5, 2022, at https://doi.org/10.1126/sciadv.1500323.
Michalak, A.M., 2016, Study role of climate change in extreme threats to water quality: Nature, v. 535, no. 7612, p. 349–350, accessed January 17, 2024, at https://doi.org/10.1038/535349a.
Miller, O.L., Martinez, A.J., Cashman, M.J., Powlen, K.A., Padilla, J.A., and Stets, E.G., 2024, Water budget results for a water availability assessment across the conterminous United States for water years 2010–2020: U.S. Geological Survey data release, accessed December 9, 2024, at https://doi.org/10.5066/P1CFYEHO.
Milly, P.C.D., and Dunne, K.A., 2020, Colorado River flow dwindles as warming-driven loss of reflective snow energizes evaporation: Science, v. 367, no. 6483, p. 1252–1255, accessed January 19, 2024, at https://doi.org/10.1126/science.aay9187.
Mooty, W.S., and Jeffcoat, H.H., 1986, Inventory of interbasin transfer of water in the Eastern United States: U.S. Geological Survey Open-File Report 86–148, accessed January 5, 2024, at https://pubs.usgs.gov/of/1986/0148/report.pdf.
Moreira, M., Hayes, D.S., Boavida, I., Schletterer, M., Schmutz, S., and Pinheiro, A., 2019, Ecologically-based criteria for hydropeaking mitigation—A review: Science of the Total Environment, v. 657, p. 1508–1522, accessed January 15, 2024, at https://doi.org/10.1016/j.scitotenv.2018.12.107.
Mueller, J.T., and Gasteyer, S., 2021, The widespread and unjust drinking water and clean water crisis in the United States: Nature Communications, v. 12, no. 1, 8 p., accessed May 25, 2023, at https://doi.org/10.1038/s41467-021-23898-z.
Murphy, J.C., Knight, R.R., Wolfe, W.J., and Gain, W.S., 2013, Predicting ecological flow regime at ungaged sites—A comparison of methods: River Research and Applications, v. 29, no. 5, p. 660–669, accessed May 25, 2023, at https://doi.org/10.1002/rra.2570.
Murphy, S.F., Alpers, C.N., Anderson, C.W., Banta, J.R., Blake, J.M., Carpenter, K.D., Clark, G.D., Clow, D.W., Hempel, L.A., Martin, D.A., Meador, M.R., Mendez, G.O., Mueller-Solger, A.B., Stewart, M.A., Payne, S.E., Peterman, C.L., and Ebel, B.A., 2023, A call for strategic water-quality monitoring to advance assessment and prediction of wildfire impacts on water supplies: Frontiers in Water, v. 5, 9 p., accessed May 25, 2023, at https://doi.org/10.3389/frwa.2023.1144225.
Murphy, S.F., McCleskey, R.B., Martin, D.A., Holloway, J.M., and Writer, J.H., 2020, Wildfire-driven changes in hydrology mobilize arsenic and metals from legacy mine waste: Science of the Total Environment, v. 743, 15 p., accessed May 25, 2023, at https://doi.org/10.1016/j.scitotenv.2020.140635.
Murphy, S.F., McCleskey, R.B., Martin, D.A., Writer, J.H., and Ebel, B.A., 2018, Fire, flood, and drought—Extreme climate events alter flow paths and stream chemistry: Journal of Geophysical Research. Biogeosciences, v. 123, no. 8, p. 2513–2526, accessed May 25, 2023, at https://doi.org/10.1029/2017JG004349.
Murphy, S.F., Runkel, R.L., Stets, E.G., Nolan, A.J., and Repert, D.A., 2024, Urbanization and water management control stream water quality along a mountain to plains transition: Water Resources Research, v. 60, no. 2, 19 p., accessed March 15, 2024, at https://doi.org/10.1029/2023WR035633.
Murphy, S.F., Writer, J.H., McCleskey, R.B., and Martin, D.A., 2015, The role of precipitation type, intensity, and spatial distribution in source water quality after wildfire: Environmental Research Letters, v. 10, no. 8, 15 p., accessed May 25, 2023, at https://doi.org/10.1088/1748-9326/10/8/084007.
O’Neill, B.C., Kriegler, E., Riahi, K., Ebi, K.L., Hallegatte, S., Carter, T.R., Mathur, R., and van Vuuren, D.P., 2014, A new scenario framework for climate change research: the concept of shared socioeconomic pathways: Climatic Change, v. 122, no. 3, p. 387–400, accessed May 15, 2024, at https://doi.org/10.1007/s10584-013-0905-2.
Park, Y., Kim, Y., Park, S.-K., Shin, W.-J., and Lee, K.-S., 2018, Water quality impacts of irrigation return flow on stream and groundwater in an intensive agricultural watershed: Science of the Total Environment, v. 630, p. 859–868, accessed January 19, 2024, at https://doi.org/10.1016/j.scitotenv.2018.02.113.
Parker, S.R., Adams, S.K., Lammers, R.W., Stein, E.D., and Bledsoe, B.P., 2019, Targeted hydrologic model calibration to improve prediction of ecologically-relevant flow metrics: Journal of Hydrology, v. 573, p. 546–556, accessed March 21, 2024, at https://doi.org/10.1016/j.jhydrol.2019.03.081.
Pastor, A.V., Ludwig, F., Biemans, H., Hoff, H., and Kabat, P., 2014, Accounting for environmental flow requirements in global water assessments: Hydrology and Earth System Sciences, v. 18, no. 12, p. 5041–5059, accessed August 23, 2023, at https://doi.org/10.5194/hess-18-5041-2014.
Pastor, A.V., Palazzo, A., Havlik, P., Biemans, H., Wada, Y., Obersteiner, M., Kabat, P., and Ludwig, F., 2019, The global nexus of food–trade–water sustaining environmental flows by 2050: Nature Sustainability, v. 2, no. 6, p. 499–507, accessed August 23, 2023, at https://doi.org/10.1038/s41893-019-0287-1.
Petsch, H.E., Jr., 1989, Inventory of interbasin transfers of water in the western conterminous United States, US: Geological Survey Open-File Report 85–166, 45 p., accessed January 5, 2024, at https://doi.org/10.3133/ofr85166.
Poff, N.L., Allan, J.D., Bain, M.B., Karr, J.R., Prestegaard, K.L., Richter, B.D., Sparks, R.E., and Stromberg, J.C., 1997, The Natural flow regime: Bioscience, v. 47, no. 11, p. 769–784, accessed March 21, 2024, at https://doi.org/10.2307/1313099.
Poff, N.L., Richter, B.D., Arthington, A.H., Bunn, S., Naiman, R.J., Kendy, E., Acreman, M., Apse, C., Bledsoe, B.P., Freeman, M.C., Henriksen, J., Jacobson, R.B., Kennen, J.G., Merritt, D.M., O’Keeffe, J.H., Olden, J.D., Rogers, K., Tharme, R., and Warner, A., 2010, The ecological limits of hydrologic alteration (ELOHA)—A new framework for developing regional environmental flow standards: Freshwater Biology, v. 55, no. 1, p. 147–170, accessed January 15, 2024, at https://doi.org/10.1111/j.1365-2427.2009.02204.x.
Ranasinghe, R., Ruane, A.C., Vautard, R., Arnell, N., Coppola, E., Cruz, F.A., Dessai, S., Saiful Islam, A., Rahimi, M., and Carrascal, D.R., 2023, Climate change information for regional impact and for risk assessment, accessed January 19, 2024, at https://doi.org/10.1017/9781009157896.014.
Ransom, K.M., Nolan, B.T., Stackelberg, P.E., Belitz, K., and Fram, M.S., 2022, Machine learning predictions of nitrate in groundwater used for drinking supply in the conterminous United States: Science of the Total Environment, v. 807, 11 p., accessed January 15, 2024, at https://doi.org/10.1016/j.scitotenv.2021.151065.
Raptis, C.E., van Vliet, M.T.H., and Pfister, S., 2016, Global thermal pollution of rivers from thermoelectric power plants: Environmental Research Letters, v. 11, no. 10, 10 p., accessed January 19, 2024, at https://doi.org/10.1088/1748-9326/11/10/104011.
Rice, J., and Westerhoff, P., 2017, High levels of endocrine pollutants in US streams during low flow due to insufficient wastewater dilution: Nature Geoscience, v. 10, no. 8, p. 587–591, accessed January 15, 2024, at https://doi.org/10.1038/ngeo2984.
Richter, B.D., Davis, M.M., Apse, C., and Konrad, C., 2012, A presumptive standard for environmental flow protection: River Research and Applications, v. 28, no. 8, p. 1312–1321, accessed February 21, 2023, at https://doi.org/10.1002/rra.1511.
Robertson, D.M., and Saad, D.A., 2019, Spatially referenced models of streamflow and nitrogen, phosphorus, and suspended-sediment loads in streams of the midwestern United States: U.S. Geological Survey Scientific Investigations Report 2019–5114, 74 p., accessed January 15, 2024, at https://doi.org/10.3133/sir20195114.
Rushforth, R.R., and Ruddell, B.L., 2018, A spatially detailed blue water footprint of the United States economy: Hydrology and Earth System Sciences, v. 22, no. 5, p. 3007–3032, accessed January 5, 2024, at https://doi.org/10.5194/hess-22-3007-2018.
Ryberg, K.R., and Chanat, J.G., 2022, Climate extremes as drivers of surface-water-quality trends in the United States: Science of the Total Environment, v. 809, 12 p., accessed May 25, 2023, at https://doi.org/10.1016/j.scitotenv.2021.152165.
Sabo, J.L., Sinha, T., Bowling, L.C., Schoups, G.H., Wallender, W.W., Campana, M.E., Cherkauer, K.A., Fuller, P.L., Graf, W.L., Hopmans, J.W., Kominoski, J.S., Taylor, C., Trimble, S.W., Webb, R.H., and Wohl, E.E., 2010, Reclaiming freshwater sustainability in the Cadillac Desert: Proceedings of the National Academy of Sciences of the United States of America, v. 107, no. 50, p. 21263–21269, accessed May 4, 2023, at https://doi.org/10.1073/pnas.1009734108.
Scanlon, B.R., Fakhreddine, S., Reedy, R.C., Yang, Q., and Malito, J.G., 2022, Drivers of spatiotemporal variability in drinking water quality in the United States: Environmental Science & Technology, v. 56, no. 18, p. 12965–12974, accessed January 15, 2024, at https://doi.org/10.1021/acs.est.1c08697.
Scanlon, B.R., Reedy, R.C., Fakhreddine, S., Yang, Q., and Pierce, G., 2023, Drinking water quality and social vulnerability linkages at the system level in the United States: Environmental Research Letters, v. 18, no. 9, 13 p., accessed January 15, 2024, at https://doi.org/10.1088/1748-9326/ace2d9.
Schmidt, T.S., Van Metre, P.C., and Carlisle, D.M., 2019, Linking the agricultural landscape of the midwest to stream health with structural equation modeling: Environmental Science & Technology, v. 53, no. 1, p. 452–462, accessed January 9, 2024, at https://doi.org/10.1021/acs.est.8b04381.
Scholl, M.A., McCabe, G.J., Olson, C.G., and Powlen, K.A., 2025, Climate change and future water availability in the United States, chap. E of U.S. Geological Survey Integrated Water Availability Assessment—2010–20: U.S. Geological Survey Professional Paper 1894–E, 60 p., https://doi.org/10.3133/pp1894E.
Siddik, M.A.B., Dickson, K.E., Rising, J., Ruddell, B.L., and Marston, L.T., 2023, Interbasin water transfers in the United States and Canada: Scientific Data, v. 10, no. 1, 9 p., accessed July 12, 2023, at https://doi.org/10.1038/s41597-023-01935-4.
Siddiqui, S., Conkle, J.L., Scarpa, J., and Sadovski, A., 2020, An analysis of U.S. wastewater treatment plant effluent dilution ratio—Implications for water quality and aquaculture: Science of the Total Environment, v. 721, 10 p., accessed January 15, 2024, at https://doi.org/10.1016/j.scitotenv.2020.137819.
Steinschneider, S., and Najibi, N., 2022, Observed and projected scaling of daily extreme precipitation with dew point temperature at annual and seasonal scales across the northeastern United States: Journal of Hydrometeorology, v. 23, no. 3, p. 403–419, accessed January 19, 2024, at https://doi.org/10.1175/JHM-D-21-0183.1.
Stets, E.G., Archer, A.A., Degnan, J.R., Erickson, M.L., Gorski, G., Medalie, L, and Scholl, M.A., 2025a, The national integrated water availability assessment, water years 2010–20, chap. A of U.S. Geological Survey Integrated Water Availability Assessment—2010–20: U.S. Geological Survey Professional Paper 1894–A, 24 p., https://doi.org/10.3133/pp1894A.
Stets, E.G., M. Cashman, O.L. Miller, K.A. Powlen, A. Martinez, and J. Padilla, 2025b, Local water use and climate effects on water stress over the conterminous US with substantial impacts to fish species of greatest conservation need: ESS Open Archive, accessed January 11, 2025, at https://doi.org/10.22541/essoar.173655431.12049152/v1.
Symonds, E.M., Cook, M.M., McQuaig, S.M., Ulrich, R.M., Schenck, R.O., Lukasik, J.O., Van Vleet, E.S., and Breitbart, M., 2015, Reduction of nutrients, microbes and personal care products in domestic wastewater by a benchtop electrocoagulation unit: Scientific Reports, v. 5, no. 1, 8 p., accessed May 13, 2024, at https://doi.org/10.1038/srep09380.
Taylor, P.C., Maslowski, W., Perlwitz, J., and Wuebbles, D.J., 2017, Arctic changes and their effects on Alaska and the rest of the United States, in, Wuebbles, D.J., Fahey, D.W., Hibbard, K.A., Dokken, D.J., Steward, B.C., and Maycock, T.K., eds., Climate science special report—Fourth National Climate Assessment, v. I: Washington, D.C., U.S. Global Change Research Program, p. 303–332, accessed May 15, 2024, at https://doi.org/10.7930/J00863GK.
Tesoriero, A.J., Duff, J.H., Saad, D.A., Spahr, N.E., and Wolock, D.M., 2013, Vulnerability of streams to legacy nitrate sources: Environmental Science & Technology, v. 47, no. 8, p. 3623–3629, accessed January 19, 2024, at https://doi.org/10.1021/es305026x.
Tharme, R.E., 2003, A global perspective on environmental flow assessment—Emerging trends in the development and application of environmental flow methodologies for rivers: River Research and Applications, v. 19, nos. 5–6, p. 397–441, accessed January 15, 2024, at https://doi.org/10.1002/rra.736.
Troy, T.J., Kipgen, C., and Pal, I., 2015, The impact of climate extremes and irrigation on US crop yields: Environmental Research Letters, v. 10, no. 5, 11 p., accessed January 3, 2024, at https://doi.org/10.1088/1748-9326/10/5/054013.
Turner, B.L., II, Kasperson, R.E., Matson, P.A., McCarthy, J.J., Corell, R.W., Christensen, L., Eckley, N., Kasperson, J.X., Luers, A., Martello, M.L., Polsky, C., Pulsipher, A., and Schiller, A., 2003, A framework for vulnerability analysis in sustainability science: Proceedings of the National Academy of Sciences of the United States of America, v. 100, no. 14, p. 8074–8079, accessed May 15, 2024, at https://doi.org/10.1073/pnas.1231335100.
Udall, B., and Overpeck, J., 2017, The twenty-first century Colorado River hot drought and implications for the future: Water Resources Research, v. 53, no. 3, p. 2404–2418, accessed May 22, 2024, at https://doi.org/10.1002/2016WR019638.
U.S. Environmental Protection Agency, 2018, Drinking water infrastructure needs survey and assessment—Sixth report to Congress: U.S. Environmental Protection Agency Office of Water and Office of Ground Water and Drinking Water, Report Number EPA 816‐K‐17‐002, 76 p., accessed January 19, 2024, at https://www.epa.gov/sites/default/files/2018-10/documents/corrected_sixth_drinking_water_infrastructure_needs_survey_and_assessment.pdf.
U.S. Environmental Protection Agency, 2019, Stage 2 Disinfectants and Disinfection Byproducts Rule (DBPR) and consecutive in-depth analysis, EPA 815-R-19-001: U.S. Environmental Protection Agency Office of Water, 35 p., accessed June 12, 2024 at https://nepis.epa.gov/Exe/ZyPDF.cgi/P100X0T6.PDF?Dockey=P100X0T6.PDF.
U.S. Environmental Protection Agency, 2020, National rivers and streams assessment 2013–2014 technical supporting document, EPA 843-R-19-001: U.S. Environmental Protection Agency Office of Water and Office of Research and Development, 179 p., accessed January 19, 2024, at https://www.epa.gov/national-aquatic-resource-surveys/nrsa.
U.S. Geological Survey, 2024b, How wildfires threaten U.S. water supplies: U.S. Geological Survey Water Resources Mission area web page, accessed February 2023, at https://labs.waterdata.usgs.gov/visualizations/fire-hydro/index.html#/.
U.S. Geological Survey, 2024a, State wildlife action plans, species of greatest conservation need (SGCN) national database, species conservation analysis tool, version 1.3.1: U.S. Geological Survey website, accessed March 13, 2024, at https://www1.usgs.gov/csas/swap.
Vaccaro, J.J., Jones, M.A., Ely, D.M., Keys, M.E., Olsen, T.D., Welch, W.B., and Cox, S.E., 2009, Hydrogeologic framework of the Yakima River Basin aquifer system, Washington: U.S. Geological Survey Scientific Investigations Report 2009–5152, 107 p., accessed January 13, 2024, at https://doi.org/10.3133/sir20095152.
Vaccaro, J.J., Kahle, S.C., Ely, D.M., Burns, E.R., Snyder, D.T., Haynes, J.V., Olsen, T.D., Welch, W.B., and Morgan, D.S., 2015, Groundwater availability of the Columbia Plateau regional aquifer system, Washington, Oregon, and Idaho: U.S. Geological Survey Professional Paper 1817, 87 p., accessed January 13, 2024, at https://doi.org/10.3133/pp1817.
Vanham, D., Alfieri, L., Flörke, M., Grimaldi, S., Lorini, V., de Roo, A., and Feyen, L., 2021, The number of people exposed to water stress in relation to how much water is reserved for the environment—A global modelling study: The Lancet Planetary Health, v. 5, no. 11, p. e766–e774, accessed May 10, 2023, at https://doi.org/10.1016/S2542-5196(21)00234-5.
Vanham, D., Hoekstra, A.Y., Wada, Y., Bouraoui, F., de Roo, A., Mekonnen, M.M., van de Bund, W.J., Batelaan, O., Pavelic, P., Bastiaanssen, W.G.M., Kummu, M., Rockström, J., Liu, J., Bisselink, B., Ronco, P., Pistocchi, A., and Bidoglio, G., 2018, Physical water scarcity metrics for monitoring progress towards SDG target 6.4—An evaluation of indicator 6.4.2 “Level of water stress”: Science of the Total Environment, v. 613–614, p. 218–232, accessed May 10, 2023, at https://doi.org/10.1016/j.scitotenv.2017.09.056.
Van Kempen, G., Van Der Wiel, K., and Melsen, L.A., 2021, The impact of hydrological model structure on the simulation of extreme runoff events: Natural Hazards and Earth System Sciences, v. 21, no. 3, p. 961–976, accessed May 25, 2023, at https://doi.org/10.5194/nhess-21-961-2021.
Van Meter, K.J., Basu, N.B., Veenstra, J.J., and Burras, C.L., 2016, The nitrogen legacy—Emerging evidence of nitrogen accumulation in anthropogenic landscapes: Environmental Research Letters, v. 11, no. 3, 13 p., accessed January 19, 2024, at https://doi.org/10.1088/1748-9326/11/3/035014.
Van Metre, P.C., Qi, S., Deacon, J., Dieter, C., Driscoll, J.M., Fienen, M., Kenney, T., Lambert, P., Lesmes, D., Mason, C.A., Mueller-Solger, A., Musgrove, M., Painter, J., Rosenberry, D., Sprague, L., Tesoriero, A.J., Windham-Myers, L., and Wolock, D., 2020, Prioritizing river basins for intensive monitoring and assessment by the U.S. Geological Survey: Environmental Monitoring and Assessment, v. 192, no. 7, 17 p., accessed August 26, 2023, at https://doi.org/10.1007/s10661-020-08403-1.
van Vuuren, D.P., Edmonds, J., Kainuma, M., Riahi, K., Thomson, A., Hibbard, K., Hurtt, G.C., Kram, T., Krey, V., Lamarque, J.-F., Masui, T., Meinshausen, M., Nakicenovic, N., Smith, S.J., and Rose, S.K., 2011, The representative concentration pathways: an overview: Climatic Change, v. 109, no. 1, 27 p., accessed March 15, 2024, at https://doi.org/10.1007/s10584-011-0148-z.
Vörösmarty, C.J., McIntyre, P.B., Gessner, M.O., Dudgeon, D., Prusevich, A., Green, P., Glidden, S., Bunn, S.E., Sullivan, C.A., Liermann, C.R., and Davies, P.M., 2010, Global threats to human water security and river biodiversity: Nature, v. 467, no. 7315, p. 555–561, accessed February 20, 2023, at https://doi.org/10.1038/nature09440.
Waite, I.R., Munn, M.D., Moran, P.W., Konrad, C.P., Nowell, L.H., Meador, M.R., Van Metre, P.C., and Carlisle, D.M., 2019, Effects of urban multi-stressors on three stream biotic assemblages: Science of the Total Environment, v. 660, p. 1472–1485, accessed January 9, 2024, at https://doi.org/10.1016/j.scitotenv.2018.12.240.
Waite, I.R., Van Metre, P.C., Moran, P.W., Konrad, C.P., Nowell, L.H., Meador, M.R., Munn, M.D., Schmidt, T.S., Gellis, A.C., Carlisle, D.M., Bradley, P.M., and Mahler, B.J., 2021, Multiple in-stream stressors degrade biological assemblages in five U.S. regions: Science of the Total Environment, v. 800, 16 p., accessed January 9, 2024, at https://doi.org/10.1016/j.scitotenv.2021.149350.
Wharton, G., Mohajeri, S.H., and Righetti, M., 2017, The pernicious problem of streambed colmation—A multi-disciplinary reflection on the mechanisms, causes, impacts, and management challenges: WIREs Water, v. 4, no. 5, p. e1231, accessed March 21, 2024, at https://doi.org/10.1002/wat2.1231.
White House Council on Environmental Quality, 2022, Climate and economic justice screening tool (version 1.0): White House Council on Environmental Quality website, accessed January 10, 2024, at https://screeningtool.geoplatform.gov/.
Wise, D.R., 2019, Spatially referenced models of streamflow and nitrogen, phosphorus, and suspended-sediment loads in streams of the Pacific region of the United States: U.S. Geological Survey Scientific Investigations Report 2019–5112, 64 p., accessed January 15, 2024, at https://doi.org/10.3133/sir20195112.
Wise, D.R., Anning, D.W., and Miller, O.L., 2019, Spatially referenced models of streamflow and nitrogen, phosphorus, and suspended-sediment transport in streams of the southwestern United States: U.S. Geological Survey Scientific Investigations Report 2019–5106, 66 p., accessed January 15, 2024, at https://doi.org/10.3133/sir20195106.
Wolfand, J.M., Sytsma, A., Hennon, V.L., Stein, E.D., and Hogue, T.S., 2022, Dilution and pollution—Assessing the impacts of water reuse and flow reduction on water quality in the Los Angeles River Basin: ACS ES&T Water, v. 2, no. 8, p. 1309–1319, accessed January 19, 2024, at https://doi.org/10.1021/acsestwater.2c00005.
Woodhouse, C.A., Smith, R.M., McAfee, S.A., Pederson, G.T., McCabe, G.J., Miller, W.P., and Csank, A., 2021, Upper Colorado River Basin 20th century droughts under 21st century warming—Plausible scenarios for the future: Climate Services, v. 21, 11 p., accessed January 27, 2024, at https://doi.org/10.1016/j.cliser.2020.100206.
Yarnell, S.M., Stein, E.D., Webb, J.A., Grantham, T., Lusardi, R.A., Zimmerman, J., Peek, R.A., Lane, B.A., Howard, J., and Sandoval-Solis, S., 2020, A functional flows approach to selecting ecologically relevant flow metrics for environmental flow applications: River Research and Applications, v. 36, no. 2, p. 318–324, accessed January 8, 2024, at https://doi.org/10.1002/rra.3575.
Appendix 1. Methods Supporting the Integrated Water Availability Assessment
Conversion Factors
Supplemental Information
Concentrations of chemical constituents in water are in either milligrams per liter (mg/L) or micrograms per liter (µg/L).
A water year is the 12-month period from October 1 through September 30 of the following year and is designated by the calendar year in which it ends.
HUC2, HUC4, HUC6, HUC8, HUC10, HUC12 are hydrologic unit codes (HUCs) with the numbers representing the number of digits in the code. HUCs are an addressing system for identifying catchments in the United States. HUC catchments are nested, with more digits indicating progressively smaller hydrologic units in terms of the area they cover.
Abbreviations
CDC
Centers for Disease Control
CEJST
Climate and Economic Justice Screening Tool
CONUS
conterminous United States (48 States excluding Alaska, Hawaii, and other U.S. territories)
EFR
environmental flow requirement
EPA
U.S. Environmental Protection Agency
HUC4
4-digit hydrologic unit code
HUC6
6-digit hydrologic unit code
HUC8
8-digit hydrologic unit code
HUC12
12-digit hydrologic unit code (50–100 square kilometers)
IBT
interbasin transfer
MCL
Maximum Contaminant Level
MCLG
Maximum Contaminant Level Goal
NRSA
National Rivers and Streams Assessment
SPARROW
SPAtially Referenced Regressions On Watershed attributes
SUI
surface water-supply and use index
SVI
Social Vulnerability Index
USGS
U.S. Geological Survey
For more information concerning the research in this report, contact the
National_IWAAs@usgs.gov, Water Resources Mission Area
U.S. Geological Survey
12201 Sunrise Valley Drive
Reston, Virginia 20192
Manuscript approved November 22, 2024
Publishing support provided by the U.S. Geological Survey
Science Publishing Network, Tacoma and Rolla Publishing Service Centers
Edited by John Osias and Vanessa Ball
Design and layout by Guadalupe Stratman
Disclaimers
Any use of trade, firm, or product names is for descriptive purposes only and does not imply endorsement by the U.S. Government.
Although this information product, for the most part, is in the public domain, it also may contain copyrighted materials as noted in the text. Permission to reproduce copyrighted items must be secured from the copyright owner.
Suggested Citation
Stets, E.G., Cashman, M.J., Miller, O.L., and Powlen, K.A., 2025, Integrated water availability in the conterminous United States, 2010–20, chap. F of U.S. Geological Survey Integrated Water Availability Assessment—2010–20: U.S. Geological Survey Professional Paper 1894–F, 41 p., https://doi.org/10.3133/pp1894F.
ISSN: 2330-7102 (online)
Study Area
| Publication type | Report |
|---|---|
| Publication Subtype | USGS Numbered Series |
| Title | Integrated water availability in the conterminous United States, 2010–20 |
| Series title | Professional Paper |
| Series number | 1894 |
| Chapter | F |
| DOI | 10.3133/pp1894F |
| Publication Date | January 15, 2025 |
| Year Published | 2025 |
| Language | English |
| Publisher | U.S. Geological Survey |
| Publisher location | Reston, VA |
| Contributing office(s) | WMA - Earth System Processes Division |
| Description | viii, 41 p. |
| Country | United States |
| Other Geospatial | conterminous United States |
| Online Only (Y/N) | Y |
| Additional Online Files (Y/N) | N |