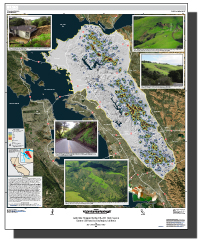
Landslides Triggered by the 2016–2017 Storm Season, Eastern San Francisco Bay Region, California
Links
- Document: Report (35 MB pdf)
- Data Release: Mapped polygons of landslides triggered by the 2016–2017 storm season, eastern San Francisco Bay region, California
- NGMDB Index Page: National Geologic Map Database Index Page (html)
- Download citation as: RIS | Dublin Core
Discussion
The winter rainy season of 2016–2017 brought abundant rainfall to the State of California and to the San Francisco Bay region. In January and February of 2017, intense rainfall from strong winter storms saturated soils in the region and triggered thousands of shallow landslides. The highest concentration of these landslides was in the eastern part of the bay region, where landslides in the hills east of the Cities of Richmond, Berkeley, Oakland, Hayward, and Fremont (see main map for locations) damaged homes, displaced a major electrical transmission-line tower, and blocked several heavily traveled roadways.
This map shows 8,928 landslides manually mapped from rectified high-resolution (0.25-meter [m]) satellite imagery (March 11, 2017, from Google Earth) in a three-dimensional geographic information system (GIS) framework. The map area encompasses approximately 1,050 square kilometers (km2), bounded by the Carquinez Strait and San Francisco Bay to the north and west, respectively, and extending to the Interstate Highway 680 corridor to the south and east. Individual landslides were mapped as polygons, but for ease of display, they are shown here as points denoting the highest elevation of each landslide headscarp. The greatest calculated landslide concentration (measured as the total number of landslides per unit area) exceeded 80 landslides per 0.25 km2 in the hills east of the City of Berkeley. This zone is illustrated on the map in red, a color which denotes areas of greater than or equal to 30 landslides per 0.25 km2. The source area and deposit polygon datasets are available as a data release (Corbett and Collins, 2023). Complementary field investigations at more than 150 landslides of those displayed here indicate that most mapped landslides are shallow (less than 1 m deep) debris slides and debris flows. Although most landslides occurred in undeveloped areas (for example, parks and open space), about 1,400 landslides, or 16 percent of the total number, affected structures or infrastructure (including paved and dirt roads) in some way. The inset figures (figs. 1–5) show photographs taken in January and February 2017 that depict some areas of damage that occurred during and after the storms; the locations of where these photographs were taken are shown on the map.
In the San Francisco Bay region, landslides usually take place each year during the winter rainy season, but widespread, intense rainfall events such as those whose effects are depicted here typically occur as a result of considerably above-average precipitation conditions. Although the landslides of early 2017 are not the most damaging to affect the region historically, they are still a potent reminder of the potential for landslide hazards present in the San Francisco Bay region.
Suggested Citation
Corbett, S.C., and Collins, B.D., 2023, Landslides triggered by the 2016–2017 storm season, eastern San Francisco Bay region, California: U.S. Geological Survey Scientific Investigations Map 3503, scale 1:75,000, https://doi.org/10.3133/sim3503.
ISSN: 2329-132X (online)
Study Area
| Publication type | Report |
|---|---|
| Publication Subtype | USGS Numbered Series |
| Title | Landslides triggered by the 2016–2017 storm season, eastern San Francisco Bay region, California |
| Series title | Scientific Investigations Map |
| Series number | 3503 |
| DOI | 10.3133/sim3503 |
| Publication Date | May 23, 2023 |
| Year Published | 2023 |
| Language | English |
| Publisher | U.S. Geological Survey |
| Publisher location | Reston, VA |
| Contributing office(s) | Geology, Minerals, Energy, and Geophysics Science Center |
| Description | 1 Plate: 37.12 x 44.88 inches; Data Release |
| Country | United States |
| State | California |
| Other Geospatial | eastern San Francisco Bay region |


