

Seabed Maps Showing Topography, Ruggedness, Backscatter Intensity, Sediment Mobility, and the Distribution of Geologic Substrates in Quadrangle 5 of the Stellwagen Bank National Marine Sanctuary Region Offshore of Boston, Massachusetts
Links
- Document: Pamphlet (2.27 MB pdf) , HTML , XML
- Sheets:
- Map A (11.4 MB pdf) - Sun-Illuminated Topography and Boulder Ridges
- Map B (1.72 MB pdf) - Seabed Ruggedness
- Map C (26.1 MB pdf) - Backscatter Intensity and Sun-Illuminated Topography
- Map D, Sheet 1 (2.33 MB pdf) - Distribution of Geologic Substrates: Seabed geology and station data types
- Map D, Sheet 2 (11.9 MB pdf) - Distribution of Geologic Substrates: Seabed geology and sun-illuminated topography
- Map E (1.51 MB pdf) - Sediment Mobility
- Map F (1.51 MB pdf) - Distribution of Fine- and Coarse-Grained Sand, Mud, and Boulder Ridges
- Map G (1.53 MB pdf) - Distribution of Substrate Mud Content and Boulder Ridges
- Related Works:
- Scientific Investigations Map 3341 - Seabed maps showing topography, ruggedness, backscatter intensity, sediment mobility, and the distribution of geologic substrates in Quadrangle 6 of the Stellwagen Bank National Marine Sanctuary Region offshore of Boston, Massachusetts
- Scientific Investigations Map 3530 - Seabed Maps Showing Topography, Ruggedness, Backscatter Intensity, Sediment Mobility, and the Distribution of Geologic Substrates in Quadrangle 2 of the Stellwagen Bank National Marine Sanctuary Region Offshore of Boston, Massachusetts
- Scientific Investigations Map 3544 - Seabed Maps Showing Topography, Ruggedness, Backscatter Intensity, Sediment Mobility, and the Distribution of Geologic Substrates in Quadrangle 3 of the Stellwagen Bank National Marine Sanctuary Region Offshore of Boston, Massachusetts
- Data Release: USGS data release - Geospatial datasets of seabed topography, sediment mobility, and the distribution of geologic substrates in quadrangle 5 of the Stellwagen Bank National Marine Sanctuary region offshore of Boston, Massachusetts
- NGMDB Index Page: National Geologic Map Database Index Page (html)
- Download citation as: RIS | Dublin Core
Abstract
The U.S. Geological Survey, in cooperation with the National Marine Sanctuary Program of the National Oceanic and Atmospheric Administration, has conducted seabed mapping and related research in the Stellwagen Bank National Marine Sanctuary (SBNMS) region since 1993. The area being mapped using geophysical and geological data includes the SBNMS and the surrounding region, which totals approximately 3,700 square kilometers (km2) and is subdivided into 18 quadrangles. The seabed is a glaciated terrain that is topographically and texturally diverse. Quadrangle 5, the subject of this scientific investigations map, has an area of 211 km2 and has water depths that range from 23 meters (m) on the Stellwagen Bank crest to 105 m in the Stellwagen Basin. Seven map types, each at a scale of 1:25,000, depict seabed topography, ruggedness, backscatter intensity, distribution of geologic substrates, sediment mobility, distribution of fine- and coarse-grained sand, and substrate mud content. These maps show the distribution of geologic substrates on the crest and western flank of the south-central part of Stellwagen Bank and in Stellwagen Basin to the west. Interpretations of multibeam sonar bathymetric and seabed backscatter imagery, photographs, video imagery, and grain-size analyses were used to create the geology-based maps. Data from 729 stations were analyzed, including 620 sediment samples. The geologic substrate maps of quadrangle 5 show the distribution of 20 substrates that represent a wide range of textures, such as mobile and rippled sand, immobile sand, sand that partially veneers gravel, boulder ridges, and mud. Mapped substrates are characterized by sediment grain-size composition, surface morphology, substrate layering, the mobility or immobility of substrate surfaces, and water depth range. This scientific investigations map portrays the major geological elements (substrates, topographic features, and processes) of environments in quadrangle 5. It is intended to provide a foundation for research into present and past sediment transport processes in a complex terrain, provide insights into the ecological requirements of invertebrate and vertebrate species that utilize the various substrates, and to support seabed management in the region.
Introduction
The U.S. Geological Survey and the National Marine Sanctuary Program of the National Oceanic and Atmospheric Administration have been cooperating to research and map the Stellwagen Bank National Marine Sanctuary (SBNMS) region since 1993. The SBNMS region lies offshore of Boston, Massachusetts, and extends from Race Point Channel in the south to the southern part of Jeffreys Ledge in the north (fig. 1). This region is subdivided into 18 quadrangles with a combined area of approximately 3,700 square kilometers (km2). This scientific investigations map (SIM) presents maps of quadrangle 5 at a scale of 1:25,000 (1 centimeter [cm] on the map represents 250 meters [m] on the seabed) that show the physical characteristics of the seabed. Geospatial datasets of seabed topography, sediment mobility, and distribution of geologic substrates for quadrangle 5 are provided in a data release associated with this report (Valentine and Cross, 2024a). The mapped area (211 km2) is the south-central part of Stellwagen Bank (about 23 m minimum water depth), which includes the bank crest, the upper eastern and western flanks of the bank, the lower western flank of the bank, and the southeastern part of Stellwagen Basin (about 105 m maximum water depth).
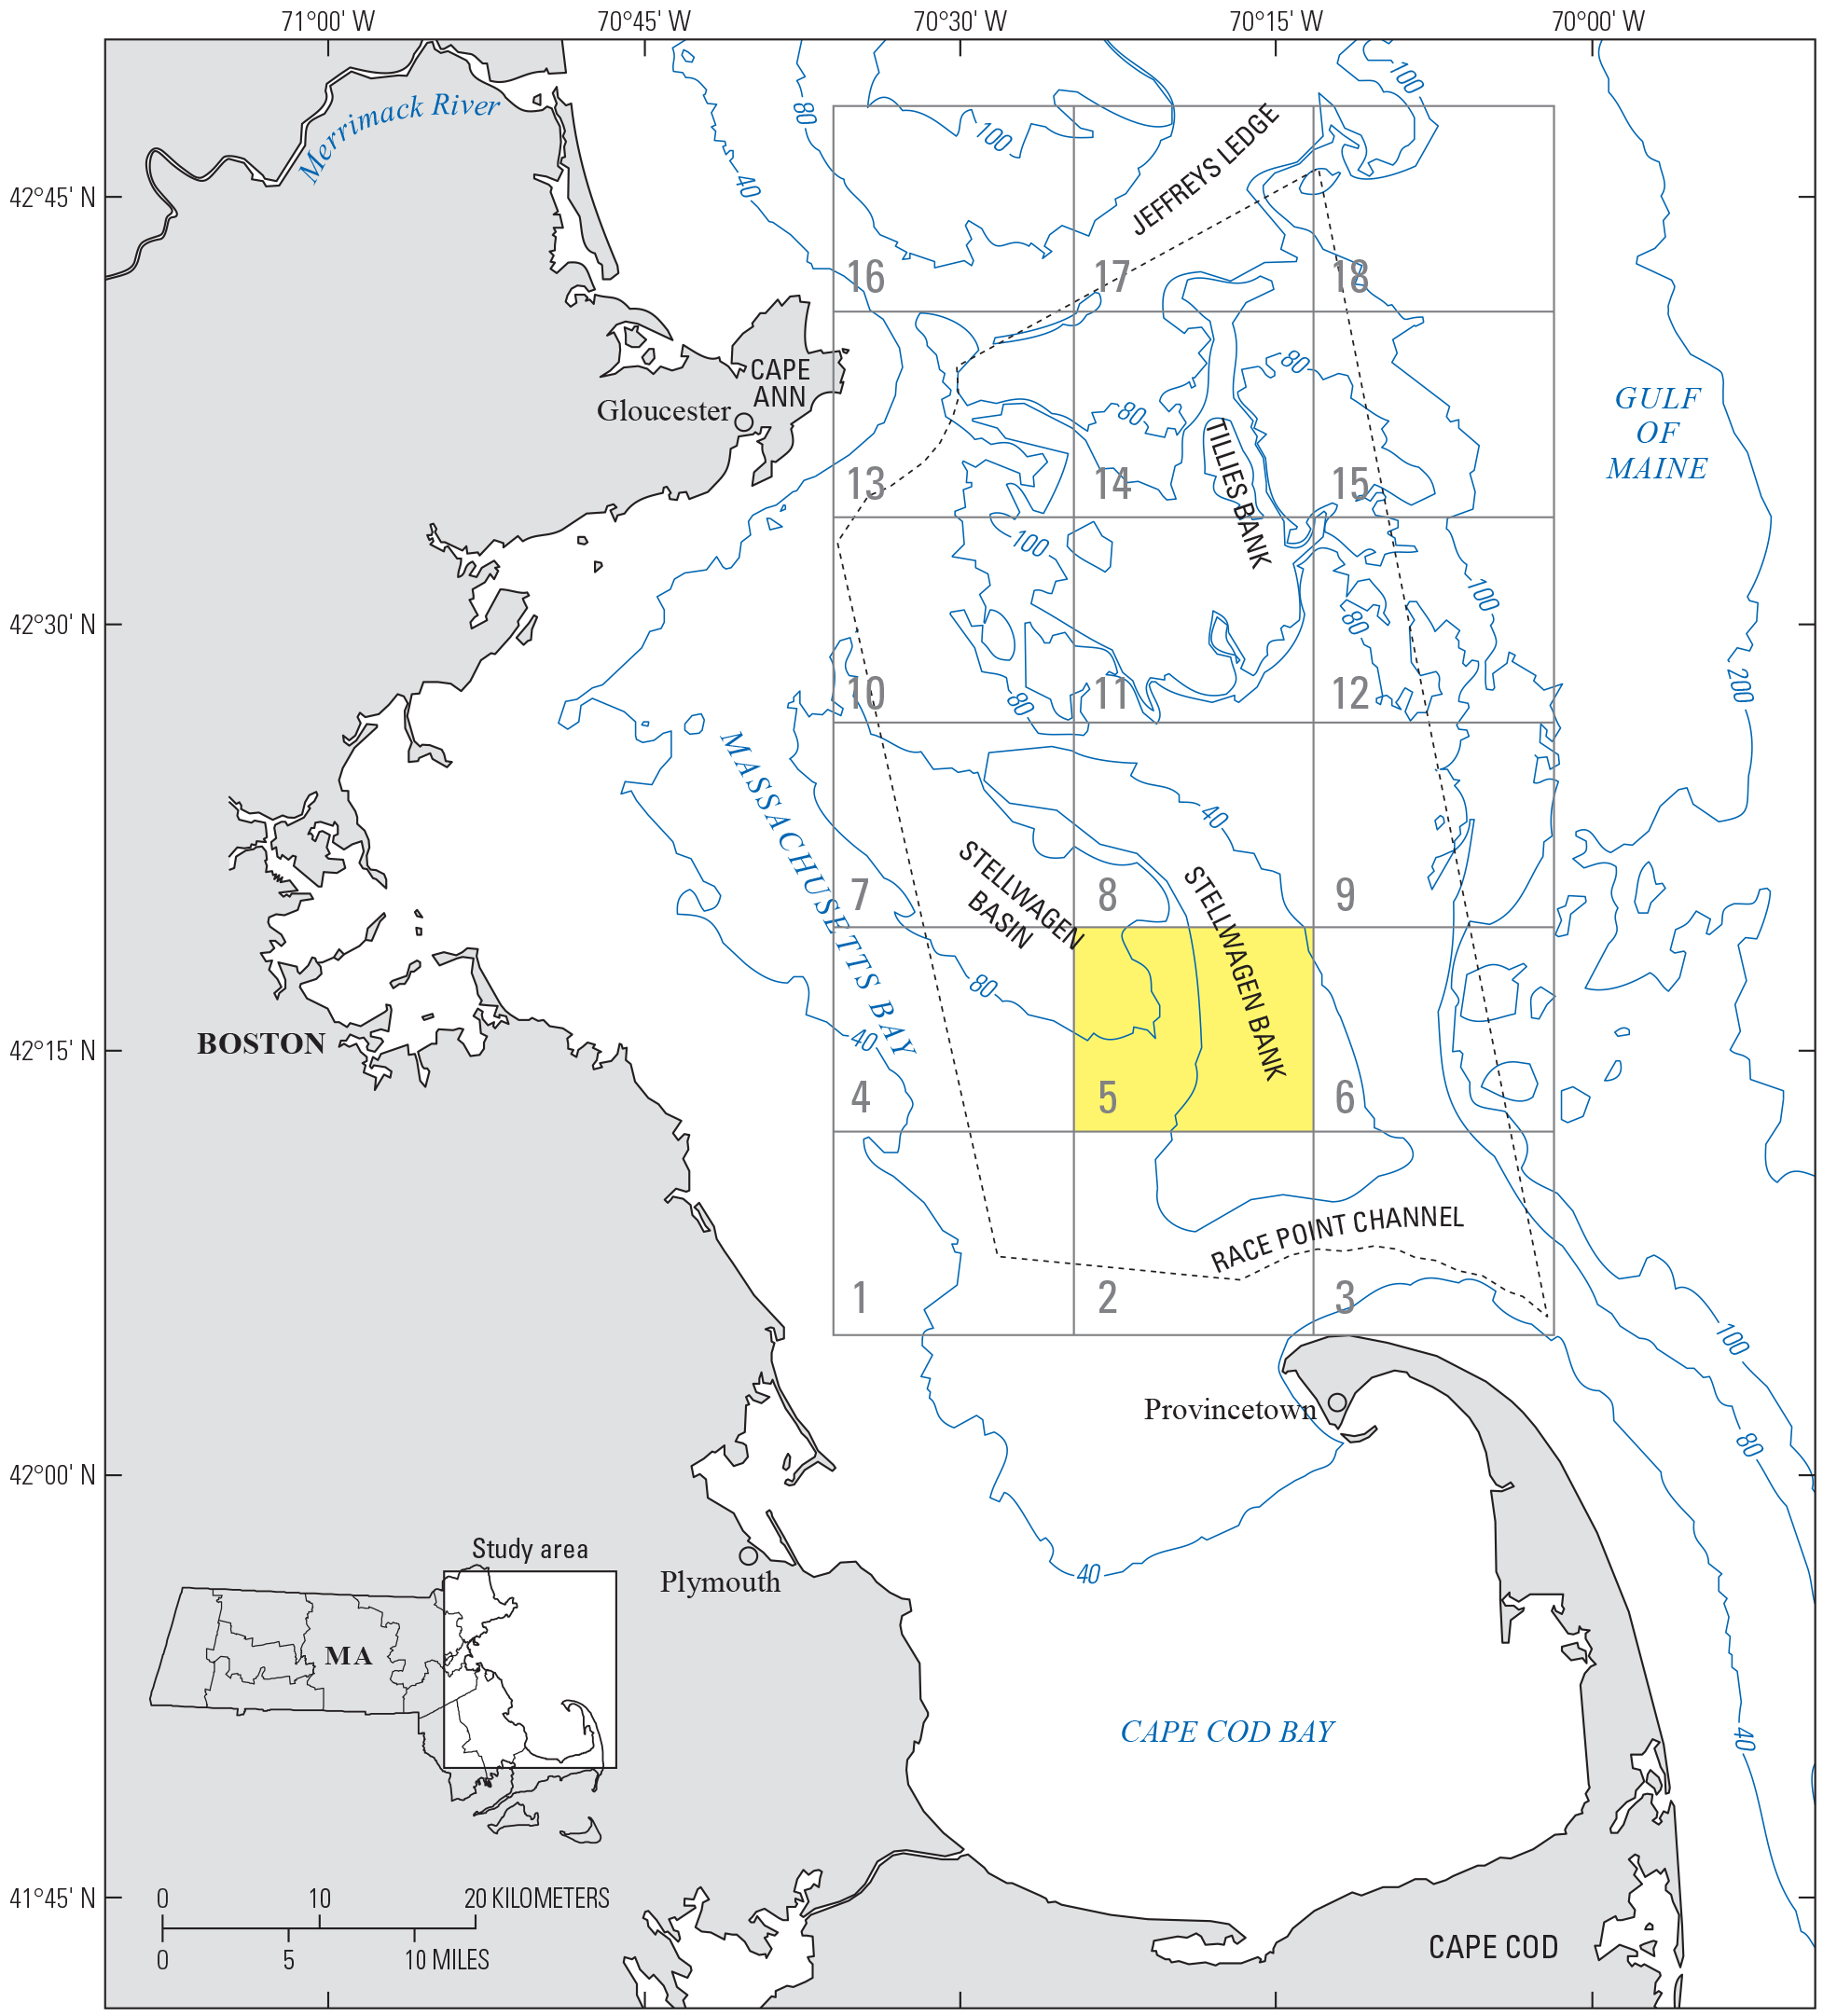
Map showing the location of quadrangle 5 (highlighted in yellow) of the Stellwagen Bank National Marine Sanctuary region offshore of Boston, Massachusetts. The numbered grid indicates the 18 quadrangles of the U.S. Geological Survey multibeam sonar substrate-mapping project. The dashed line represents the Stellwagen Bank National Marine Sanctuary boundary. Bathymetric contours are labeled in meters and the contour interval is variable. Base from Valentine and Gallea (2015).
The Stellwagen Bank region is a glaciated terrain and, as described in Valentine (2019), bank sediments have been reworked during several episodes of submergence and emergence by rising and falling sea level since the Last Glacial Maximum. Present processes of erosion and transport are the result of currents generated by large storms from the northeast (Butman and others, 2008; Warner and others, 2008) that produce bedforms on the seabed of the bank down to about 50 m water depth. Tidal currents are generally too weak (Butman and others, 2007) to move the coarse-grained sand on the bank. Quadrangle 5 lies approximately 35 kilometers (km) east of the Massachusetts coast and, at present, no sediment is transported from land to the map area.
A geologic substrate is a surface or volume of sediment or rock material where physical and biological processes occur, such as the movement and deposition of sediment, the formation of bedforms, and the attachment, burrowing, feeding, reproduction, and sheltering of organisms (Valentine, 2019). A sedimentary substrate is characterized and identified by sediment composition (mud, sand, and gravel), the distribution of grain diameters, seabed structures (for example, ripples, burrows, and attached organisms), substrate layering (for example, finer sediment partly veneering coarser sediment), sediment movement, and water depth range. Substrates in quadrangle 5 range in composition from rippled, coarse-grained sand (on the crest and upper eastern and western flanks of the bank) to muddy, fine- and coarse-grained sand (as water depth increases on the lower western flank) to sandy mud and mud (at depth in the basin). Some substrates are layered, generally in the form of a sand substrate that partially veneers a gravel substrate.
Seabed properties of quadrangle 5 are shown in a series of seven map types. Three maps show seabed topography (map A), ruggedness (map B), and backscatter intensity (map C). The other maps are interpretive and show the distribution of 20 geologic substrates (map D), the mobility or immobility of substrates (map E), the dominance of fine- or coarse-grained sand in substrates (map F), and the mud content of substrates (map G). This SIM follows the design of a companion SIM that shows the same seabed properties for quadrangle 6 (Valentine and Gallea, 2015), which bounds quadrangle 5 to the east.
Several of the map types in this SIM (A, B, and C) have been published previously as parts of regional maps at a scale of 1:60,000 (Valentine, 2005); they are presented here at higher resolution (1:25,000). Map A was previously published at a scale of 1:25,000 (Valentine and others, 1999, 2010), but it did not show the distribution of boulder ridges. Maps D–G show new interpretations of geologic substrate composition, substrate mobility, sand content, and mud content.
The purpose of this SIM is to provide a range of information about the distribution of physical attributes of the seabed in the SBNMS region at a scale (1:25,000) that is appropriate for the density of data. High-resolution substrate maps can serve as a foundation for further study of seabed processes (such as present and past sediment transport), support ecological studies of vertebrate and invertebrate species that use these substrates as habitat, and support planning and managing usage of the seabed.
Methods
The process of mapping geologic substrates in quadrangle 5 followed the principles of substrate characterization and identification as described in Valentine (2019). Geologic substrates were identified by analyzing video imagery, multibeam sonar and backscatter imagery of the seabed, and grain sizes of sediment samples. The collection and processing of the multibeam sonar bathymetric and backscatter data presented here are described in Valentine (2005). The locations of stations (areas where data such as sediment samples or video imagery were collected) were digitally plotted on a multibeam sonar image of sun-illuminated seabed topography in Portable Document Format (PDF) format. The boundaries of geologic substrates were digitally drawn by hand on this image based on the interpretation of the data described in this SIM. After the geologic substrates were identified, they were digitized in a geographic information system (GIS) and were then used to create three other interpretive maps. These maps characterize the substrates on the basis of the mobility or immobility of their surfaces, the dominance of fine- or coarse-grained sand, and the mud content. Table 1.1 in appendix 1 lists new data layers and previously published data that were used to compile the maps for quadrangle 5.
Grain-size classifications for sediment as used in this study are given in table 1. Composite grain-size classifications for sediment as used in this study are given in table 2.
Table 1.
Grain-size classifications for sediment used in this study of quadrangle 5 of the Stellwagen Bank National Marine Sanctuary region offshore of Boston, Massachusetts.[To convert particle diameter (D) in millimeters (mm) to phi units (φ): φ = − log2D = −3.3219 log10D. To convert particle diameter (D) in phi units (φ) to mm: D = 2–φ]
Described in Udden (1914), Wentworth (1922), Folk (1954), and Blair and McPherson (1999).
Described in Krumbein (1936).
Table 2.
Composite grain-size classifications for sediment used in this study of quadrangle 5 of the Stellwagen Bank National Marine Sanctuary region offshore of Boston, Massachusetts.[To convert particle diameter (D) in millimeters (mm) to phi units (φ): φ = − log2D = −3.3219 log10D. To convert particle diameter (D) in phi units (φ) to mm: D = 2–φ]
Naming and abbreviation conventions for components of sediment and nonsediment classes and the mobility and layering properties of substrates are given in table 3 and are described below (from Valentine [2019], table 5). A sediment class based on grain-size analysis contains one or more aggregates and (or) composite grades (Valentine, 2019, table 1). For example, a muddy, gravelly, coarse-grained sand (mgcgS) is a sediment class containing three components: mud (an aggregate), gravel (an aggregate), and coarse-grained sand (a composite grade), in order of increasing weight percent. A sediment class based on a visual analysis of seabed imagery would be, for example, a pebble, cobble gravel (pcG), a sediment class consisting of pebbles and cobbles (each a composite grade), not in order of increasing abundance. A nonsediment class, also based on a visual analysis of seabed imagery, contains components such as shell deposits, rock outcrops, or semiconsolidated mud. Properties of seabed mobility (presence or absence of ripples) and substrate layering are also based on a visual analysis of seabed imagery. An unlayered substrate contains one sediment class (for example, muddy, fine-grained sand [mfgS]) or one nonsediment class (for example, rock outcrop [R]). Layered substrates contain at least two sediment classes or a sediment class and a nonsediment class (for example, a rippled, coarse-grained sand; partial veneer on immobile, semiconsolidated mud [r_cgS / i_scM]). In the present approach to substrate identification, the need to construct two-part names that are both informative and brief can produce names for two (or more) substrates in which substrate symbols are unique but the descriptive parts of the names are identical.
Table 3.
Naming and abbreviation conventions for components of sediment and nonsediment classes and the mobility and layering properties of substrates in quadrangle 5 of the Stellwagen Bank National Marine Sanctuary region offshore of Boston, Massachusetts.[Not all of the terms in this table are applicable to quadrangle 5. Table from Valentine (2019, table 5). Terms: >, greater than; ≥, greater than or equal to; <, less than; ≤, less than or equal to]
Map A. Sun-Illuminated Topography and Boulder Ridges
Map A shows seabed topographic imagery of quadrangle 5, which is a glaciated terrain modified by postglacial sediment-transport processes. This imagery is derived from multibeam sonar bathymetric data contoured at a 5‑m interval. Water depths range from about 23 m on the crest of Stellwagen Bank to about 105 m in Stellwagen Basin to the west. Individual boulder ridges are subdivided into two groups (<1 m and ≥1 m in height) and are shown as semitransparent polygons that overlie topography. The boulder ridges represent an area of 0.4 km2 in this quadrangle (table 4).
Table 4.
Area of the seabed mapped as boulder ridges in quadrangle 5 of the Stellwagen Bank National Marine Sanctuary region offshore of Boston, Massachusetts.[Boulder ridges are segregated into two height categories, <1 meter (m) in height and ≥1 m in height. Data in columns 3 and 4 are rounded to one decimal place. Areas of the seabed mapped as boulder ridges and bedrock outcrops in all 18 quadrangles in the Stellwagen Bank National Marine Sanctuary region are listed in table 1 of map F of Valentine (2005). Terms: ≥, greater than or equal to; <, less than; km2, square kilometer]
The Stellwagen Bank crest is oriented approximately north to south. The spacing of bathymetric contours shows the western flank of the bank to be steeper than the eastern flank. See map A of quadrangle 6 (to the east of this quadrangle) for topography of the eastern flank (Valentine and Gallea, 2015). Two major physiographic features extend from the western flank of Stellwagen Bank into Stellwagen Basin. Southwestern Spur is a long, low, linear feature that lies at depths of 50–70 m. It is 7 km in length in quadrangle 5 and extends westward out of quadrangle 5. Western Spur is a relatively short, squarish feature with a surface that lies at depths of 60–80 m; it is a westward extension of Stellwagen Bank into Stellwagen Basin. It has three steep sides that each measure approximately 2.5 km in length, and it is separated by a narrow valley from the small Fifteen Bank that lies to the west in Stellwagen Basin. The Western Edge lies at the top of the steepest flank of the bank in quadrangle 5, and it extends from Western Spur northward out of quadrangle 5. Seabed surface features that are visible in the multibeam topographic imagery include boulder ridges and mounds, sand hummocks, irregular leading edges of sand sheets that are interpreted to have formed by episodic sediment transport, and long wavelength (40–50 m) sand ripples. To view maps and descriptions of glacial and postglacial seabed topography and the distribution of boulder ridges and bedrock outcrops in the entire SBNMS region, see maps A, B, and F of Valentine (2005). For further description of topographic features in this quadrangle, see a map and explanation of sun-illuminated topography in Valentine and others (1999, 2010).
Topographic contours were generated at 5‑m and 1‑m intervals from bathymetric data collected by a Simrad EM1000 multibeam sonar echo sounder that was used in the mapping survey (Valentine and others, 1998). The 5‑m contours accurately represent the morphology of topographic features such as large and small banks, valleys, and some of the boulder ridges. However, because they do not adequately show the irregular relief of the seabed in some areas, they are supplemented by 1‑m contours on maps B and D–G where small boulder ridges, small sediment mounds, bedforms, and edges of sand sheets are present. In areas of relatively featureless seabed where only minor changes in water depths occur, the 1‑m contours are not shown because the process of contouring produces incoherent patterns of lines that misrepresent the topographic complexity (Valentine, 2019).
Map B. Seabed Ruggedness
Map B shows the results of an analysis of multibeam bathymetric data to calculate seabed ruggedness, which is a measure of changes in elevation (water depth) over small areas. This kind of analysis is useful for identifying steep features where ruggedness values increase rapidly over short distances, and for delineating features in relatively smooth areas that are subtly expressed by seabed topography. The seabed ruggedness measure is based on a terrain ruggedness index (TRI) developed by Riley and others (1999) to quantify topographic heterogeneity on land. The TRI of Riley and others (1999) measures the sum change in elevation between a central grid cell (pixel) and its eight neighboring grid cells, which is computed by squaring the eight differences in elevation, summing the squared differences, and taking the square root of the sum. Here, a seabed ruggedness index is used to measure changes in elevation more directly by calculating the average change in elevation between a central pixel and its eight neighbors, which is computed by averaging the absolute values of the eight differences in elevation (see map D of Valentine [2005]). Comparing the two methods, a central pixel (representing a positive feature) with an elevation (water depth) value of 10 m and eight neighboring pixels with values of 15 m would have a TRI sum change value of 14.1 m using the method of Riley and others (1999), and a seabed ruggedness of 5.0 m using the method employed here.
For map B, seabed ruggedness values were calculated as the average change in water depth between a central 13‑m pixel and the eight pixels that surround it, an area measuring 39 × 39 m. Subsequently, a smoothing filter was applied to the ruggedness index image. This filter calculated the mean of the seabed TRI value of each pixel and its eight neighboring pixels. On map B, the seabed ruggedness index values are represented by 13 colors ranging from lavender to dark red. Map colors represent the average change in elevation, in centimeters, and are shown in 10-cm increments in the >30–100-cm range (7 colors), in 50-cm increments in the >100–200-cm range (2 colors), and in 100-cm increments in the >200–600-cm range (4 colors). Average changes in elevation of less than or equal to 30 cm are not shown in color. For example, on the map, dark blue represents central pixels having an average elevation change of >70–80 cm with respect to their surrounding eight-pixel areas.
Table 5 shows the area of seabed that is represented by four ruggedness intervals. Ruggedness values in the 0–30-cm range represent an area of 206.6 km2 (98 percent) of the total 211 km2 area of the quadrangle. Seabed ruggedness reaches a high of 200–300 cm in very small areas (<0.1 percent) on the northern and western flanks of Western Spur, on the Western Edge, and on the northern flank of Fifteen Bank. The ruggedness analysis successfully identified changes in elevation related to the transition from bank to basin, but it identified only parts of some low or narrow boulder ridges or missed them altogether (compare map B and map D, sheet 1). To view maps and a description of seabed ruggedness and slope angle of the entire SBNMS region, see maps D and E, respectively, of Valentine (2005).
Table 5.
Area of the seabed represented by ruggedness intervals in quadrangle 5 of the Stellwagen Bank National Marine Sanctuary region offshore of Boston, Massachusetts.[Areas of seabed are represented by four ruggedness intervals of 0–30 centimeters (cm), >30–100 cm, >100–200 cm, and >200–300 cm. Data in columns 3 and 4 are rounded to one decimal place. Areas of seabed represented by ruggedness intervals in all 18 quadrangles of the Stellwagen Bank National Marine Sanctuary region are listed in table 1 of map D of Valentine (2005). Terms: >, greater than; km2, square kilometer]
Map C. Backscatter Intensity and Sun-Illuminated Topography
Map C shows imagery of seabed backscatter intensity and sun-illuminated topography derived from multibeam sonar data. Backscatter intensity is a measure of the strength of sound waves reflected from the seabed. When color coded and mapped, backscatter intensity reveals patterns that are a useful preliminary guide for delineating the geographic extent of substrates. On map C, the backscatter intensity index shows values represented by an eight-color range from blue to red (1–8). Values from 1 to 3 (blue to blue-green) represent relatively soft substrates, values from 3 to 6 (blue-green to yellow) represent substrates of intermediate hardness, and values from 6 to 8 (yellow to red) represent relatively hard substrates. Backscatter intensity patterns, when used in concert with sediment grain-size analyses and interpretations of video and photographic imagery of the seabed, can be used to characterize and identify geologic substrates. It is not possible to recognize the substrates mapped in quadrangle 5 by relying on backscatter intensity alone.
The highest backscatter values are located on the upper eastern and western flanks of Stellwagen Bank and represent a rippled, coarse-grained sand substrate. The alternating bands of high and intermediate values in this region are aligned with the direction of the multibeam survey lines and the strike of the bank crest (north-northwest to south-southeast) and are oriented normal to the direction of wave currents generated by winter storms (nor’easters) from the northeast. Some of the consistently narrow bands are artifacts of the multibeam survey and were possibly caused by ship motion that was not fully accounted for by the attitude sensors of the sonar system. The irregular, broad bands of high backscatter intensity are interpreted to be areas of rippled, coarse sand substrate that resulted from the segregation of grain sizes by sediment transport processes during storms from the northeast. The broad bands themselves are not ripple features.
Substrates on the middle and lower western flank of Stellwagen Bank have intermediate backscatter values that generally decrease as water depth increases; this decrease indicates an increase in weight percent of fine-grained sand and mud. However, there are some areas in the western flank region on Southwestern Spur, Western Spur, and Fifteen Bank where substrates of muddy sand partially veneer gravel substrates that cause a relatively high backscatter signal. Near the base of the bank in Stellwagen Basin both north and south of Southwestern Spur, the seabed displays low backscatter values that represent fine-grained sandy mud. In Stellwagen Basin, below about 80 m water depth, low backscatter values represent a mud seabed.
Map D. Distribution of Geologic Substrates
Map D shows the distribution of 20 geologic substrates characterized by grain-size composition, the distribution of grain diameters in the sediment, surface morphology, substrate layering, the mobility or immobility of the substrate surfaces, and water depth range. Bathymetric contours are drawn at 5‑m intervals, except in some areas of complex seabed with low relief where they are drawn at 1‑m intervals.
Data from 729 stations were analyzed, including 620 sediment samples. Map D, sheet 1 shows the distribution of geologic substrates and the locations (magenta dot symbols) of stations where sediment samples were collected, or locations of the ends of video drifts if no sediment was collected. Sediment was usually collected at the end of video drifts. Map D, sheet 2 shows the distribution of geologic substrates and sun-illuminated topography, but not the locations of data stations. Data from these stations were used to identify and map the substrate polygons.
See Valentine and Cross (2024b) for the results of grain-size analyses of sediment samples and the assignment of stations to substrates. See tables 6 and 7 (which follow the “References Cited”) for descriptions and comparisons of substrate properties, water depth ranges, and substrate areas. See Valentine (2019) for a complete description of the methodology developed for sediment classification and for substrate characterization, identification, and mapping.
The geologic substrates of quadrangle 5 were formed by the glacial processes of erosion and deposition, were subsequently modified by the effects of rising postglacial sea level, and are presently affected by storm-wave generated currents (Valentine, 2019). A discussion of the morphology and origin of topographic features in this quadrangle can be found in Valentine and others (1999, 2010).
Substrates range widely in character in quadrangle 5 and include the following: ridges of piled boulders; rippled, coarse-grained sand; muddy, fine-grained sand; mud; and sand that partially veneers gravel. The shallow crest and upper eastern and western flanks of Stellwagen Bank are covered by relatively coarse sediments, including coarse-grained sand, complex substrates of sand that partially veneer gravel, and several boulder ridges. The middle and lower western flank of the bank is a transition zone where substrates become increasingly fine-grained with increasing water depth. The deep Stellwagen Basin is floored by sandy mud along its margins and mud in the basin proper.
The surface of Stellwagen Bank is largely covered by sheets of sand with irregular leading edges (red lines on maps A and D–G) that indicate episodic sediment movement from east to west on the crest of the bank and into deeper water on the western flank of the bank. The movements of substrate A3, and possibly A1, are recent and are likely caused by storm-generated currents. However, the timing of the movements of the presumably older substrates H and I, which are located lower on the western flank and are overridden by substrate A1, is not known.
The quality of substrate identification and mapping depends on the spatial density of samples and observations available to interpret multibeam sonar imagery. Fewer samples are required to identify substrates where the substrate boundaries align with topographic features and sonar backscatter intensity patterns. More samples are required where multibeam imagery indicates seabed features and substrates are complex, and also where they are relatively uniform but are present in an area of changing water depths.
Substrates are mapped in three ways, depending on the density of the data. First, substrates are mapped as irregular-sided polygons if the density of data allows for their extent to be mapped with some confidence. In quadrangle 5, 14 of the 20 substrates are mapped as irregular-sided polygons. Second, substrates are mapped as straight-sided polygons if transitions between substrates are ambiguous because data are sparse. The straight-sided polygons alert the user that there is uncertainty as to the areal extents of the substrates. The distribution of substrate A3 is represented by a straight-sided polygon containing stations that represent both substrates A1 and A3 (map D). The distribution of layered substrates B (a partial veneer of coarse-grained sand on gravel) and V (a partial veneer of fine-grained, sandy mud on gravel) are also depicted as straight-sided polygons. Contacts are not drawn for irregular-sided or straight-sided polygons because contacts indicate a degree of certainty that is usually not warranted in substrate mapping. Third, deposits of six substrates (A1, A3, N, O, U, and W) that occur within the bounds of other mapped substrates and that are too few to be mapped as coherent units at 1:25,000 scale are shown as magenta square symbols on map D, sheet 1. Substrates N, O, and W are only shown as magenta square symbols whereas substrates A1, A3, and U are mapped as coherent units in some locations.
Description of Map Units (Substrates)
[The grain sizes of sediment samples collected from each substrate are given as mean weight percents for each aggregate (mud, sand, and gravel) and composite grade (fine-grained sand, coarse-grained sand, gravel1, and gravel2). See Valentine (2019) for descriptions of aggregates and composite grades. Weight percent values were rounded and may not add up to 100 or other summed values, for example, sand, 94 (fgS, 3; cgS, 90). Aggregates and composite grades are abbreviated and given in order of increasing weight percent in the name of each substrate. For example, a muddy, fine-grained sand (mfgS) contains more fine-grained sand than mud. Sand is divided into two composite grades: fine-grained sand (fgS; 0.062 to <0.25 millimeters [mm]) and coarse-grained sand (cgS; 0.25 to <2 mm). Fine-grained sand (3 and 4 phi combined) is transported as suspended load, and coarse-grained sand (0, 1, and 2 phi combined) is transported as bed load (Valentine, 2019). Gravel is also divided into two composite grades: gravel1 (G1; 2 to <8 mm) and gravel2 (G2; 8 to <64 mm). Gravel (in the form of pebbles, cobbles, and boulders) and nonsediment substrates (semiconsolidated mud) that could not be sampled were identified using visual analysis of video and photographic imagery. Grain-size characteristics for seven layered substrates (B, J, M, Q, T, V, and W) represent the sampled sediment that partially veneers gravel or semiconsolidated mud. Substrate unit names describe the mobility or immobility of their surfaces, sediment grain-size composition, and sediment layering. For example, the notation “r_cgS / i_pcbG” means “rippled, coarse-grained sand; partial veneer on immobile, pebble, cobble, boulder gravel.” See table 3 for further explanation]
A1 r_cgS—Rippled, coarse-grained sand.—Substrate A1 is a mobile, coarse-grained sand deposit that lies on the crest and upper western flank of Stellwagen Bank in quadrangle 5. Substrate A1 is very widespread on the bank. It also occurs on the eastern flank of the bank in quadrangle 6 (Valentine and Gallea, 2015) to the east. The irregular, digitated margin of the downslope edge of A1 in quadrangle 5 suggests that the substrate there represents a sheet of sand that was transported westward onto the western flank from the bank crest. The nature of transport is not known. The water depths of the stations range from 24 to 53 m and the water depth of the mapped substrate ranges from 24 to 55 m. Substrate A1 is equivalent to the upper mobile layer of substrate B, which lies within the region occupied by substrate A1. Mean weight percents of aggregates and composite grades are as follows: mud, <1; sand, 94 (fgS, 3; cgS, 90); and gravel, 6 (G1, 5; G2, 1). Substrate A1 is dominantly coarse-grained sand and is very low in mud and fine-grained sand content. This substrate has a surface that is covered with storm-generated sand ripples with wavelengths from 0.5 to 1.0 m, and the orientation of ripple crests varies from north-south to northwest-southeast. The ripples are symmetrical and well shaped (sometimes with narrow, sharply defined crests and sometimes with broad crests hosting secondary ripples) when first formed by storm wave currents, but are subsequently rounded by faunal disturbance and flattened by bottom-tending fishing gear, such as dredges and trawls. These relatively large bedforms are not discernible in multibeam topographic imagery. Substrate A1 has a mud and sand content that is similar to substrate A3 and lies at similar water depths. However, substrate A3 contains much more fine-grained sand (22 weight percent). Each sample from A3 generally contains 10 weight percent or more of fine-grained sand, mostly as 3‑phi sand, and the surface of substrate A3 is covered with smaller ripples. Some samples of substrate A1 were collected from within the bounds of other mapped substrates; the locations of these samples are shown by magenta square symbols on map D, sheet 1, and are identified in Valentine and Cross (2024b).
A3 r_cgS—Rippled, coarse-grained sand.—Substrate A3 is a mobile, coarse-grained sand deposit that lies on the crest and upper western flank of Stellwagen Bank. The water depths of the stations range from 23 to 53 m. Mean weight percents of aggregates and composite grades are as follows: mud, <1; sand, 98 (fgS, 22; cgS, 76); and gravel, 1 (G1, 1; G2 <1). Substrate A3 is similar to substrate A1 in that it is composed of coarse-grained sand and has a very low mud content. It differs from A1 in that samples of A3 generally contain 10 weight percent or more of fine-grained sand (mostly as 3‑phi sand) and the surface ripples on A3 are much smaller than those on A1, with ripple wavelengths on A3 ranging from 10 to 20 cm. Substrate A3 is also similar to substrate A2, which lies on the far eastern flank of Stellwagen Bank in quadrangle 6 (Valentine and Gallea, 2015) but is not present in quadrangle 5. Substrates A2 and A3 both contain more fine-grained sand than substrate A1, but A2 is immobile, has less fine-grained sand than A3, and lies at deeper water depths (53–77 m). In quadrangle 5, substrate A3 occurs in large and small deposits, and most deposits are not mappable as coherent units at 1:25,000 scale. Some deposits form irregular hummocks that are visible in multibeam topographic imagery; deposits of substrate A1 occur between these hummocks. Deposits of substrate A3 also occur intermittently along the deep western edge of substrate A1. Substrate A3 deposits are texturally equivalent to substrate K, which lies at deeper depths, but A3 deposits are geographically separated from substrate K by substrates A1 and H. The largest deposit of A3 occurs in an area of hummocky seabed (observed in multibeam topographic imagery) on the bank crest within a straight-sided polygon (map D, sheet 2). Some stations that represent substrate A1 occur within this A3 polygon. Some samples of substrate A3 occur within the bounds of other mapped substrates; the locations of these samples are shown by magenta square symbols on map D, sheet 1, and are identified in Valentine and Cross (2024b).
B r_cgS / i_cbG—Rippled, coarse-grained sand; partial veneer on immobile, cobble, boulder gravel.—Substrate B is a layered substrate of mobile, coarse-grained sand that partially veneers the immobile margins of gravel mounds and substrate C (boulder ridges) and is surrounded by substrate A1 on the crest and upper eastern flank of Stellwagen Bank. Sixteen straight-sided polygons centered on gravel features show the approximate distribution of substrate B. The water depth of the mapped substrate ranges from 30 to 44 m. The rippled, coarse-grained sand upper layer of substrate B is equivalent to substrate A1. For mean weight percents of aggregates and composite grades of this upper layer of substrate B, see substrate A1. The substrate also occurs on the eastern flank of the bank in the adjacent quadrangle 6 (Valentine and Gallea, 2015). The gravel features of substrate B were identified based on video, photographic, and multibeam topographic imagery.
C i_cbG—Immobile, cobble, boulder gravel.—Substrate C is immobile gravel that forms topographic ridges where cobbles and boulders are piled upon one another and are separated by voids. The water depth of the mapped substrate ranges from 30 to 65 m. Substrate C was identified based on video and photographic images of mapped topographic ridges (Valentine, 2005), and is shown as boulder ridges <1 m and ≥1 m high on maps A and D–G. It is present in three areas in quadrangle 5: on the upper eastern flank and crest of Stellwagen Bank where it occurs with substrate B, on Western Spur where it occurs with substrate L, and on Southwestern Spur where it occurs with substrate Q. Substrate C occurs more commonly in the adjacent quadrangle 6 on the eastern flank of Stellwagen Bank and on the tops of the Ninety Meter Banks (Valentine and Gallea, 2015).
H r_fgS—Rippled, fine-grained sand.—Substrate H is a mobile, fine-grained sand deposit that lies on the lower western flank of Stellwagen Bank in the southern part of quadrangle 5. The water depths of the stations range from 38 to 52 m and the water depth of the mapped substrate ranges from 35 to 52 m. Mean weight percents of aggregates and composite grades are as follows: mud, 2; sand, 98 (fgS, 83; cgS, 15); and gravel, <1 (G1, <1; G2, 0). The surface of substrate H is characterized by low, long-wavelength (approximately 40–50 m) ripples that are visible in multibeam topographic imagery and are depicted by 1‑m contours; shell deposits are present in ripple troughs. The substrates on the western flank of Stellwagen Bank display irregular, downslope margins in topographic imagery, which are interpreted to represent the leading edges of mobile sand sheets. Substrate H, a rippled, fine-grained sand, is bounded upslope to the east and appears to be overridden by substrate A1, a rippled, coarse-grained sand. Substrate H is bounded downslope to the west and appears to override substrate K, a rippled, coarse-grained sand. Substrate H now separates two coarse-grained sand substrates (A1 and K), which suggests that the long-wavelength ripples that form the surface of substrate H are relict and that the substrate may not be mobile at present. The timing of these postulated mass movements is not known. Part of substrate H is bounded downslope to the west by substrate L; these two substrates have a similar ratio of fine- to coarse-grained sand content, but H contains less mud than L. Some stations that are within the area mapped as substrate H represent deposits of substrate A1 that are not mappable at 1:25,000 scale.
I i_fgcgS—Immobile, fine- and coarse-grained sand.—Substrate I is an immobile, fine- and coarse-grained sand deposit that forms a hummocky surface on the lower western flank of Stellwagen Bank. The water depths of the stations range from 44 to 71 m and the water depth of the mapped substrate ranges from 40 to 75 m. Mean weight percents of aggregates and composite grades are as follows: mud, 7; sand, 92 (fgS, 42; cgS, 49); and gravel, 1 (G1, 1; G2, <1). This substrate is bounded to the east in shallower water by substrate A1, to the south by substrates H and L, to the north by substrate L, and to the west by substrate R. Substrate I is similar in grain-size content to the upper layer of substrate J, which it surrounds. The hummocky surface of substrate I is visible in multibeam topographic imagery, is depicted by 1‑m contours, and has a digitated southwestern margin that is similar to the topography of the adjacent western margin of substrate A1. These features suggest that substrate I represents an older coarse-grained sand sheet (not unlike A1) that is now overlain by a thin layer of fine-grained sand, like adjacent substrates H and L. Little video imagery was collected in the area identified as substrate I. Where video imagery was taken, it showed that some stations displayed ripples; these stations were all located in shallow parts of the area mapped as substrate I (less than 60 m water depth). It is likely that the shallow part of the substrate is mobile and the deep part is not, but more data are required to resolve this issue.
J r_cgfgS / i_pcbG—Rippled, coarse- and fine-grained sand; partial veneer on immobile, pebble, cobble, boulder gravel.—Substrate J is a layered substrate of mobile, coarse- and fine-grained sand that partially veneers immobile, pebble, cobble, boulder gravel in a depression surrounded by substrate I on the lower western flank of Stellwagen Bank. The water depths of the stations range from 48 to 55 m and the water depth of the mapped substrate ranges from 46 to 59 m. Mean weight percents of aggregates and composite grades of the sediment partial veneer that overlies gravel are as follows: mud, 4; sand, 92 (fgS, 47; cgS, 45); and gravel, 4 (G1, 2; G2, 2). Substrate J lies in an area with high multibeam backscatter intensity values centered on about 42°15.5′ N. and about 70°19.6′ W. (map C). The upper layer of substrate J is similar to substrate I in mud, sand, and gravel content.
K r_cgS—Rippled, coarse-grained sand.—Substrate K is a mobile, coarse-grained sand deposit that lies on the lower flank of Stellwagen Bank southeast of the eastern end of Southwestern Spur. The water depths of the stations range from 42 to 50 m and the water depth of the mapped substrate ranges from 40 to 50 m. Mean weight percents of aggregates and composite grades are as follows: mud, 1; sand, 98; (fgS, 24; cgS, 75); and gravel, <1 (G1, <1; G2, 0). Substrate K is dominantly coarse-grained sand and is low in mud content, but it contains an appreciable amount of fine-grained sand (3‑phi sand is more abundant than 4‑phi sand). It is texturally equivalent to substrate A3. To the northeast and east, substrate K is bounded by substrate H and, based on multibeam topographic imagery, the digitated boundary of substrate H suggests it has encroached upon substrate K during a mass-movement event. To the west, in deeper water, substrate K is bounded by substrate L. Thus, substrate K (a coarse-grained sand) lies between fine-grained sand substrates H and L, indicating that it was not deposited by present sedimentary transport processes and that its depositional history is unclear.
L i_mfgS—Immobile, muddy, fine-grained sand.—Substrate L is an immobile, muddy, fine-grained sand deposit that is present in three areas on the lowermost western flank of Stellwagen Bank and on the eastern part of Western Spur. The water depths of the stations range from 50 to 77 m and the water depth of the mapped substrate ranges from 44 to 77 m. Mean weight percents of aggregates and composite grades are as follows: mud, 10; sand, 89 (fgS 73; cgS, 17); and gravel, 1 (G1, 1; G2, 0). Substrate L lies in a region where mud content (2–33 weight percent) increases with increases in water depth from bank to basin. Substrate L in quadrangle 5 is texturally equivalent to substrate G1 that occurs off the eastern flank of Stellwagen Bank in quadrangle 6 (Valentine and Gallea, 2015), but substrate G1 lies in much deeper water (85–171 m water depth). Some stations that are within the area mapped as substrate L represent deposits of substrates N and O that are not mappable at 1:25,000 scale.
The distribution of substrate L along the lower western flank of Stellwagen Bank is interrupted in the south by northwest- to southeast-trending substrate Q of Southwestern Spur and farther north by substrate I. South of Southwestern Spur, substrate L is bounded to the east in shallower water by substrate K, which has a lower mud content (1 weight percent). To the west, at the basin boundary, substrate L is separated by a very low scarp from substrate P, which has a much higher mud content (29 weight percent).
North of Southwestern Spur, substrate L is bounded to the east by substrate H (which has a lower mud content [2 weight percent]) and is bounded to the east and north by substrate I (which has a slightly lower mud content [7 weight percent]). To the west, at the edge of the basin, a low scarp separates substrate L from substrate R (which has a much higher mud content [58 weight percent]). In a part of substrate L, along the basin boundary between 42°14′ N. and 42°15′ N. latitude, the seabed is characterized by hummocky topography that is visible in multibeam topographic imagery and is depicted by 1‑m contours. Grain-size analyses indicate the presence of three substrates in this small area: substrate L (muddy, fine-grained sand), substrate N (muddy, coarse-grained sand), and substrate O (muddy, fine- and coarse-grained sand). The mud contents of the three substrates are similar (L, 10 weight percent; N, 11 weight percent; O, 15 weight percent). These relations suggest that, in some places, a younger substrate L has combined with an older, coarser-grained substrate N to produce substrate O.
North of substrate I, substrate L extends along the lower flank of Stellwagen Bank and onto the eastern part of Western Spur, where the complex topography of a small basin is visible in multibeam topographic imagery and is depicted by 1‑m contours. To the east, south of Western Spur, substrate L is bounded by substrate A1, which has a low mud content (<1 weight percent). To the west, a low scarp at the base of the bank separates substrate L from substrate R (which has a higher mud content [58 weight percent]). The scarp is low in the south and increases in height northward to form the relatively steep margin between the southeastern flank of Western Spur and Stellwagen Basin. On Western Spur, substrate L is bounded to the east by substrate A1 and to the west by substrate M, which is a hummocky, layered substrate of muddy, coarse-grained sand with a mud content of 22 weight percent that partially veneers pebble, cobble, boulder gravel.
M i_mcgS / pcbG—Immobile, muddy, coarse-grained sand; partial veneer on pebble, cobble, boulder gravel.—Substrate M is a layered substrate of immobile, muddy, coarse-grained sand that partially veneers pebble, cobble, boulder gravel. It forms the hummocky surface of the western part of Western Spur, a westward extension of Stellwagen Bank into Stellwagen Basin. The water depths of the stations range from 59 to 68 m and the water depth of the mapped substrate ranges from 56 to 69 m. Mean weight percents of aggregates and composite grades of the sediment partial veneer that overlies gravel are as follows: mud, 22; sand, 73 (fgS, 13; cgS, 60); and gravel, 5 (G1, 4; G2, 1). The upper layer of substrate M is dominantly coarse-grained sand with less fine-grained sand (3‑phi sand is more abundant than 4‑phi sand) and mud. The irregular surface of the substrate indicates the presence of partly buried gravel features that are visible in multibeam topographic imagery and are depicted by 1‑m contours. The upper layer of substrate M somewhat resembles the upper layer of substrate Q, which forms the hummocky surface of Southwestern Spur in slightly deeper water to the south. The upper layer of substrate Q has a similar mud content (24 weight percent) to that of substrate M but, unlike substrate M, it is a muddy, fine-grained sand. Substrate M is bounded in shallower water to the east by substrate L (mud content is 10 weight percent) and in deeper water to the west by substrate T (mud content is 34 weight percent) on the flank of Western Spur.
N i_mcgS—Immobile, muddy, coarse-grained sand.—Substrate N is an immobile, muddy, coarse-grained sand deposit that is associated with substrates L and O in an area of hummocky topography on the lower flank of Stellwagen Bank northeast of Southwestern Spur. This is an area of high backscatter intensity (map C), which suggests that substrate N is underlain by coarser sediment, possibly gravel. The water depths of the stations range from 58 to 65 m. Mean weight percents of aggregates and composite grades are as follows: mud, 11; sand, 73 (fgS, 10; cgS, 63); and gravel, 15 (G1, 10; G2, 5). See also the description of substrate L with which substrates N and O are associated. Stations identified as containing deposits of substrate N occur in the area occupied by substrate L, but they are not mappable as a coherent unit at 1:25,000 scale. These station locations are shown by magenta square symbols on map D, sheet 1, and are identified in Valentine and Cross (2024b).
O i_mfgcgS—Immobile, muddy, fine- and coarse-grained sand.—Substrate O is an immobile, muddy, fine- and coarse-grained sand deposit that is associated with substrates L and N in an area of hummocky topography on the lower flank of Stellwagen Bank northeast of Southwestern Spur. This is an area of high backscatter intensity (map C), which suggests that substrate O is underlain by coarser sediment, possibly gravel. The water depths of the stations range from 55 to 64 m. Mean weight percents of aggregates and composite grades are as follows: mud, 15; sand, 82 (fgS, 41; cgS, 41); and gravel, 4 (G1, 4; G2, 0). Substrate O is likely a mixture of substrates L and N; see the description of substrate L with which substrates N and O are associated. Stations identified as containing deposits of substrate O occur in the area occupied by substrate L, but they are not mappable as a coherent unit at 1:25,000 scale. These station locations are shown by magenta square symbols on map D, sheet 1, and are identified in Valentine and Cross (2024b).
P i_mfgS—Immobile, muddy, fine-grained sand.—Substrate P is an immobile, muddy, fine-grained sand deposit that lies at the base of Stellwagen Bank in two areas of Stellwagen Basin, north and south of Southwestern Spur. The water depths of the stations and the mapped substrate range from 59 to 69 m. Mean weight percents of aggregates and composite grades are as follows: mud, 29; sand, 69 (fgS, 60; cgS, 10); and gravel, 1 (G1, 1; G2, <1). The two areas of substrate P are separated by substrate Q, a layered, muddy, fine-grained sand that partially veneers pebble, cobble, boulder gravel on Southwestern Spur. Substrate P (mud content is 29 weight percent) is very similar texturally to the upper layer of substrate Q (mud content is 24 weight percent). Although the mud content of both substrates is almost equal and both are dominated by fine-grained sand, the upper layer of substrate Q overlies gravel and contains more coarse-grained sand than substrate P. Substrate P has greater mud content than substrate L (which lies in shallower water to the east and has 10 weight percent mud) but much less mud content than substrate R (which lies in deeper water to the west and has 58 weight percent mud). As mud content increases westward from substrates L to P to R (from the base of the bank into the basin), fine-grained sand content decreases, especially the 3‑phi sand. As observed in multibeam topographic imagery, the somewhat hummocky surface of substrate P where it borders Southwestern Spur indicates the presence of buried gravel features that are exposed in substrate Q on the spur.
Q i_mfgS / pcbG—Immobile, muddy, fine-grained sand; partial veneer on pebble, cobble, boulder gravel.—Substrate Q is a layered substrate of immobile, muddy, fine-grained sand that partially veneers pebble, cobble, boulder gravel. It forms the hummocky surface of Southwestern Spur, an elongate feature that extends northwestward into Stellwagen Basin from the lower western flank of Stellwagen Bank. The water depths of the stations range from 54 to 73 m and the water depth of the mapped substrate ranges from 49 to 81 m. Mean weight percents of aggregates and composite grades of the sediment partial veneer that overlies gravel are as follows: mud, 24; sand, 69 (fgS, 42; cgS, 26); and gravel, 7 (G1, 4; G2, 3). The deeper parts of substrate Q in the west are bounded by mud substrates S (mud content is 94 weight percent) and R (mud content is 58 weight percent), whereas the shallower parts in the east are bounded by sand substrates L (mud content is 10 weight percent) and P (mud content is 29 weight percent). The upper layer of substrate Q is dominantly fine-grained sand (3‑phi sand is more abundant than 4‑phi sand); mud and coarse-grained sand are present in equal amounts. The irregular surface of boulder ridges and of partly buried gravel features is visible in multibeam topographic imagery and is depicted by 1‑m contours.
R i_fgsM—Immobile, fine-grained sandy mud.—Substrate R is an immobile, fine-grained sandy mud deposit that occupies two areas in Stellwagen Basin: one adjacent to the southern margin of Southwestern Spur and the other along the base of the western flank of Stellwagen Bank. The water depths of the stations range from 71 to 88 m and the water depth of the mapped substrate ranges from 67 to 88 m. Substrate R texturally resembles the upper layer of substrate V, which it surrounds. Mean weight percents of aggregates and composite grades are as follows: mud, 58; sand, 42 (fgS, 38; cgS, 3); and gravel, <1 (G1, <1; G2, 0). Substrate R is bounded by sand substrates with lower mud content (I, L, P, and Q) that lie in shallower water on the lower western flank of Stellwagen Bank and on the flanks of Southwestern Spur and Western Spur. It is bounded in a deeper part of Stellwagen Basin by substrate S, which has a higher mud content. Substrate R is characterized by the presence of fish and crab burrows.
S i_M—Immobile mud.—Substrate S is an immobile mud deposit that occupies much of Stellwagen Basin. The water depths of the stations range from 82 to 103 m and the water depth of the mapped substrate ranges from 82 to 105 m. The video transect at station 1736 began on substrate T near the top of Fifteen Bank at a water depth of 71 m and ended on substrate S in Stellwagen Basin at a much deeper water depth of 95 m (where the sediment sample was collected). The station water depth of 71 m that is recorded in Valentine and Cross (2024b) represents the starting point of the transect, not the depth at which the sample at station 1736 was collected.
Mean weight percents of aggregates and composite grades are as follows: mud, 94; sand, 6 (fgS, 5; cgS, 1); and gravel, 0 (G1, 0; G2, 0). Substrate S is bounded to the east along the basin margin by substrate R (mud content is 58 weight percent). Elsewhere, substrate S is bounded to the south by substrate Q (upper layer mud content is 24 weight percent) on Southwestern Spur, and to the north by substrate T (upper layer mud content is 34 weight percent) on the flanks of Fifteen Bank and Western Spur. Substrate S is characterized by the presence of fish and crab burrows.
T i_mcgS / pcbG—Immobile, muddy, coarse-grained sand; partial veneer on pebble, cobble, boulder gravel.—Substrate T is a layered substrate of immobile, muddy, coarse-grained sand that partially veneers pebble, cobble, boulder gravel. It forms a somewhat hummocky seabed on the top and flanks of Fifteen Bank and on the westward-facing flank of the adjacent Western Spur. The water depths of the stations and the mapped substrate range from 70 to 103 m. Mean weight percents of aggregates and composite grades of the sediment partial veneer that overlies gravel are as follows: mud, 34; sand, 52 (fgS, 14; cgS, 37); and gravel, 14 (G1, 10; G2, 4).
U i_pcG—Immobile, pebble, cobble gravel.—Substrate U is an immobile gravel pavement. Video imagery at two stations revealed it to be closely packed pebbles and cobbles with little to no sand veneer. Substrate U is represented by stations 1644 and 1646. Station 1644 was the only station to be sampled; this sample was collected at a water depth of 62 m, but it plots at a water depth of 59 m on map D, sheet 1. The sample is a mixture of the gravel pavement that forms the seabed (cobbles were observed but not collected) and the underlying sandy sediment. Based on multibeam topographic and backscatter imagery, the substrate extends northward along the Western Edge at 56 to 60 m water depth out of quadrangle 5. Mean weight percents of aggregates and composite grades collected from this station are as follows: mud, 10; sand, 44 (fgS, 11; cgS, 33); and gravel, 46 (G1, 10; G2, 36).
Station 1646 is located at 35 m water depth in the area occupied by substrate A1. Station 1646 could not be mapped as a coherent unit at 1:25,000 scale; it lies in an area of high backscatter intensity values centered on about 42°19.3′ N. and about 70°18.6′ W. (map C) that likely represents a gravel pavement. The location of this station is shown by a magenta square symbol on map D, sheet 1, and it is identified in Valentine and Cross (2024b).
V i_fgsM / cbG—Immobile, fine-grained sandy mud; partial veneer on cobble, boulder gravel.—Substrate V is a layered substrate of immobile, fine-grained sandy mud that partially veneers cobble, boulder gravel. Substrate V was only observed in two areas in Stellwagen Basin, both of which are surrounded by substrate R. The water depths of the stations and the mapped substrate range from 72 to 82 m. The upper layer of substrate V texturally resembles substrate R. Mean weight percents of aggregates and composite grades of the sediment partial veneer that overlies gravel are as follows: mud, 68; sand, 32 (fgS, 30; cgS, 2); and gravel, 0 (G1, 0; G2, 0). The underlying cobbles and boulders represent the tops of almost-buried mounds of gravel that produce a hummocky surface that is visible in multibeam topographic imagery and is depicted by 1‑m contours. The cobbles and boulders are exposed in depressions that are interpreted to be formed by the scouring activities of the large fish that were observed to occupy them in video imagery.
W r_cgS / i_scM—Rippled, coarse-grained sand; partial veneer on immobile, semiconsolidated mud.—Substrate W is a layered substrate of rippled, coarse-grained sand that partially veneers outcrops of semiconsolidated mud, and occurs in the area occupied by substrate A1. Substrate W was observed at three locations on the Stellwagen Bank crest in quadrangle 5. The water depths of the stations range from 31 to 35 m. Mean weight percents of aggregates and composite grades of the sediment partial veneer that overlies semiconsolidated mud are as follows: mud, <1; sand, 88 (fgS, 10; cgS, 78); and gravel, 12 (G1, 11; G2, 1). Visual analysis of video imagery revealed the lower substrate to be an irregular, burrowed, and fragment-strewn surface; it is interpreted to represent an outcrop of semiconsolidated mud that has been burrowed by benthic organisms. The rippled, coarse-grained sand partial upper layer is texturally very similar to substrates A1 and A3 and it was sampled without disturbing the lower clay layer. Stations identified as deposits of substrate W in the area occupied by substrate A1 are not mappable as a coherent unit at 1:25,000 scale. These station locations are shown by magenta square symbols on map D, sheet 1, and are identified in Valentine and Cross (2024b).
Map E. Sediment Mobility
Map E shows the distribution of 20 geologic substrates of map D grouped into five substrates based on surface mobility, as determined by the presence or absence of sand ripples observed in video, photographic, and multibeam topographic imagery (tables 6 and 7; Valentine and Cross, 2024b). The five mapped substrates are (1) mobile sediment (unlayered sand substrates with rippled surfaces), (2) immobile sediment (unlayered sand or mud substrates with immobile surfaces), (3) mobile and immobile sediment (layered substrates with mobile sand that partially veneers immobile gravel), (4) boulder ridges <1 m in height, and (5) boulder ridges ≥1 m in height.
Some stations have been fished using otter trawls and scallop dredges. These activities temporarily disturb and flatten sand ripples so that video and photographic imagery sometimes show no evidence of sand ripples at the time of acquisition. The sand ripples are later re-formed by storm-wave generated currents. The presence of broken shells is often an indicator of fishing disturbance. When a site that occurred within an area mapped as a rippled substrate did not display ripples at the time of imaging due to fishing disturbance, that site is still interpreted to be a rippled substrate under natural conditions.
In quadrangle 5, substrate mobility decreases with increasing water depth westward from Stellwagen Bank to Stellwagen Basin. The boundary between mobile and immobile sediment on the western flank of the bank lies at 50–55 m water depth, approximately along the downslope margins of substrates A1, H, and K.
The four unlayered substrates with mobile surfaces are substrates A1, A3, H, and K. Substrate A1 is a rippled, coarse-grained sand (24–55 m water depth) that occupies the Stellwagen Bank crest and upper western and eastern flanks and extends eastward into quadrangle 6 to a water depth of about 50 m (Valentine and Gallea, 2015). Substrate A3 is also a rippled, coarse-grained sand (23–53 m water depth) that is present in the area occupied by A1 in quadrangle 5. Substrate H is a rippled, fine-grained sand (35–52 m water depth) that lies downslope of substrate A1. Substrate K is a rippled, coarse-grained sand (40–50 m water depth) that lies on the western flank of Stellwagen Bank in the southern part of the quadrangle. It is possible that the shallow part of substrate I is rippled; see the comments in the description of substrate I in the previous section of this report.
The three layered substrates that have an upper mobile substrate that partially veneers a lower immobile substrate are substrates B, J, and W. Substrate B is a rippled, coarse-grained sand that partially veneers immobile cobble and boulder gravel (30–44 m water depth) that occurs at the margins of boulder ridges and mounds within the area occupied by substrate A1. The rippled sand component of substrate B is texturally equivalent to the rippled sand of substrate A1. Substrate B also occurs in quadrangle 6 on the upper eastern flank of the bank (Valentine and Gallea, 2015). Substrate J is a rippled, coarse- and fine-grained sand that partially veneers pebble, cobble, boulder gravel (46–59 m water depth). Substrate W is a rippled, coarse-grained sand that partially veneers semiconsolidated mud (31–35 m water depth).
The twelve substrates that have immobile surfaces are substrate U (a pebble and cobble pavement; 35 and 62 m water depth) and 11 unlayered or layered substrates (I, L, M, N, O, P, Q, R, S, T, and V) that lie in water depths of 40–105 m and have surface sediments that include muddy, fine- and coarse-grained sands, muds, and mixtures of fine- and coarse-grained sand (tables 6 and 7). However, see the comments in the description of substrate I in the previous section of this report.
Substrate C is separated into two units on map E, boulder ridges <1 m in height and boulder ridges ≥1 m in height. These boulder ridges are large, mappable features of piled cobbles and boulders at 30–65 m water depth.
Map F. Distribution of Fine- and Coarse-Grained Sand, Mud, and Boulder Ridges
Map F shows the distribution of fine- and coarse-grained sand that characterize the composition of unlayered (or the upper layer of layered) geologic substrates shown on map D. There are two substrate groups in which either fine- or coarse-grained sand dominate the sand fraction, and a third group where fine- and coarse-grained sand are present in subequal portions of the sand fraction (table 6).
The coarse-grained sand group consists of eight substrates (A1, A3, B, K, M, N, T, and W) that have ≥50 mean weight percent sand, of which the largest portion is coarse-grained sand (0, 1, and 2 phi combined). These substrates occur primarily on the crest and upper eastern and western flanks of Stellwagen Bank. Two of these substrates, M (56–69 m water depth) and T (70–103 m water depth), lie in relatively deep water on Western Spur and Fifteen Bank, respectively, and the sand content of their muddy upper layers is predominantly coarse-grained sand, which was likely derived from their gravelly lower layers.
The fine-grained sand group consists of four substrates (H, L, P, and Q) that have ≥50 mean weight percent sand, of which the largest portion is fine-grained sand (3 and 4 phi combined). These substrates occur primarily on the lower western flank of Stellwagen Bank and on part of the eastern margin of Stellwagen Basin. Substrates R and V that occur in the eastern part of Stellwagen Basin are also mapped in this group (even though they are sandy muds) to draw attention to their fine-grained sand content (38 and 30 weight percent, respectively) and their likely transport from Stellwagen Bank.
The group where fine- and coarse-grained sand occur in subequal portions consists of three substrates (I, J, and O) that have ≥50 mean weight percent sand, and portions of fine- and coarse-grained sand that vary by ≤7 weight percent. These substrates occur in a relatively small area on the lower western flank of the bank.
Also shown on the map are substrate S (a mud with only 6 weight percent sand in Stellwagen Basin), substrate C (boulder ridges), and substrate U (a gravel pavement).
Most substrates in quadrangle 5 display an increase of fine-grained sand and mud content with increasing water depth; this increase is interpreted to be the result of fine-grained sediments winnowed from coarse-grained sediments on Stellwagen Bank being transported downslope into Stellwagen Basin. Substrate K (a coarse-grained sand; 40–50 m water depth) is an exception to this observation because it lies downslope of substrate H (a fine-grained sand; 35–52 m water depth); this relation indicates that substrate K is an older deposit that was not formed by present-day sedimentary transport processes.
Map G. Distribution of Substrate Mud Content and Boulder Ridges
Map G shows the mud content of 18 sedimentary substrates of map D grouped using a seven-tier scale based on mean weight percent mud content (table 6). The seven ranges of mud content, in mean weight percent, are as follows: <1; 1 to <5; 5 to <10; 10 to <20; 20 to <50; 50 to <90; and ≥90. Along latitude 42°17′ N., a distance of about 5.5 km, mud content increases from <1 to 94 weight percent with increasing water depth westward from the crest of Stellwagen Bank (about 30 m water depth) into Stellwagen Basin (about 90 m water depth). Also shown on the map are two units of boulder ridges (equivalent to substrate C) and a unit of gravel pavement (equivalent to substrate U).
Substrate mud contents and their equivalent geologic substrates from map D, water depths, and locations are listed below:
-
• Substrates containing <1 weight percent mud (A1, A3, B, and W; 23–55 m water depth) occupy the shallow crest and upper eastern and western flanks of the Stellwagen Bank.
-
• Substrates containing 1 to <5 weight percent mud (H, J, and K; 35–59 m water depth) and 5 to <10 weight percent mud (I; 40–75 m water depth) occupy the middle western flank of the bank south of latitude 42°17′ N.
-
• Substrates containing 10 to <20 weight percent mud (L, N, and O; 44–77 m water depth) occur on the lower western flank of the bank near the eastern margin of Stellwagen Basin and extend onto the eastern part of Western Spur.
-
• Substrates containing 20 to <50 weight percent mud (M, P, Q, and T; 49–103 m water depth) occur on Southwestern and Western Spurs, on Fifteen Bank, and in Stellwagen Basin adjacent to Southwestern Spur.
-
• Substrates containing 50 to <90 weight percent mud (R and V; 67–88 m water depth) and ≥90 weight percent mud (S; 82–105 m water depth) occur in Stellwagen Basin and are characterized by the presence of fish and crab burrows.
-
• Substrate U, a gravel pavement, is represented by just one sample (62 m water depth) with a mud content of 10 weight percent. The mud content of substrate U is likely part of the sediment underlying the gravel, and therefore the substrate is mapped as a gravel pavement and is not assigned to a mud content group.
-
• Substrate C contains 0 weight percent mud and is shown as two units on map G, boulder ridges <1 m in height and boulder ridges ≥1 m in height.
References Cited
Blair, T.C., and McPherson, J.G., 1999, Grain-size and textural classification of coarse sedimentary particles: Journal of Sedimentary Research, v. 69, no. 1, p. 6–19. [Also available at https://doi.org/10.2110/jsr.69.6.]
Butman, B., Sherwood, C.R., and Dalyander, P.S., 2008, Northeast storms ranked by wind stress and wave-generated bottom stress observed in Massachusetts Bay, 1990–2006: Continental Shelf Research, v. 28, nos. 10–11, p. 1231–1245. [Also available at https://doi.org/10.1016/j.csr.2008.02.010.]
Butman, B., Signell, R.P., Warner, J.C., and Alexander, P.S., 2007, Oceanographic setting, in Bothner, M.H., and Butman, B., eds., Processes influencing the transport and fate of contaminated sediments in the coastal ocean—Boston Harbor and Massachusetts Bay: U.S. Geological Survey Circular 1302, p. 26–33. [Also available at https://doi.org/10.3133/cir1302.]
Folk, R.L., 1954, The distinction between grain size and mineral composition in sedimentary-rock nomenclature: Journal of Geology, v. 62, no. 4, p. 344 –359. [Also available at https://www.jstor.org/stable/30065016.]
Krumbein, W.C., 1936, Application of logarithmic moments to size frequency distributions of sediments: Journal of Sedimentary Petrology, v. 6, no. 1, p. 35–47. [Also available at https://doi.org/10.1306/D4268F59-2B26-11D7-8648000102C1865D.]
Riley, S.J., DeGloria, S.D., and Elliot, R., 1999, A terrain ruggedness index that quantifies topographic heterogeneity: Intermountain Journal of Sciences, v. 5, nos. 1–4, p. 23–27. [Also available at http://download.osgeo.org/qgis/doc/reference-docs/Terrain_Ruggedness_Index.pdf.]
Udden, J.A., 1914, Mechanical composition of clastic sediments: Bulletin of the Geological Society of America, v. 25, no. 1, p. 655–744. [Also available at https://doi.org/10.1130/GSAB-25-655.]
Valentine, P.C., ed., 2005, Sea floor image maps showing topography, sun-illuminated topography, backscatter intensity, ruggedness, slope, and the distribution of boulder ridges and bedrock outcrops in the Stellwagen Bank National Marine Sanctuary region off Boston, Massachusetts: U.S. Geological Survey Scientific Investigations Map 2840, 12 sheets, scale 1:60,000, 1 DVD-ROM. [Also available at https://doi.org/10.3133/sim2840.]
Valentine, P.C., 2019, Sediment classification and the characterization, identification, and mapping of geologic substrates for the glaciated Gulf of Maine seabed and other terrains, providing a physical framework for ecological research and seabed management: U.S. Geological Survey Scientific Investigations Report 2019–5073, 37 p., accessed June 14, 2023, at https://doi.org/10.3133/sir20195073.
Valentine, P.C., Baker, J.L., Unger, T.S., and Polloni, C., 1998, Sea floor topographic map and perspective view-imagery of Quadrangles 1-18, Stellwagen Bank National Marine Sanctuary off Boston, Massachusetts: U.S. Geological Survey Open-File Report 98–138, 1 CD-ROM. [Also available at https://doi.org/10.3133/ofr98138.]
Valentine, P.C., and Cross, V.A., 2024a, Geospatial datasets of seabed topography, sediment mobility, and the distribution of geologic substrates in quadrangle 5 of the Stellwagen Bank National Marine Sanctuary region offshore of Boston, Massachusetts: U.S. Geological Survey data release, https://doi.org/10.5066/P9W9BN3S.
Valentine, P.C., and Cross, V.A., 2024b, Station locations in quadrangle 5 in Stellwagen Bank National Marine Sanctuary offshore of Boston, Massachusetts where video, photographs and sediment samples were collected by the U.S. Geological Survey from 1993-2015 - includes sediment sample analyses and interpreted geologic substrate, in Geospatial datasets of seabed topography, sediment mobility, and the distribution of geologic substrates in quadrangle 5 of the Stellwagen Bank National Marine Sanctuary region offshore of Boston, Massachusetts: U.S. Geological Survey data release, https://www.sciencebase.gov/catalog/item/63a09185d34e0de3a1f27734.
Valentine, P.C., and Gallea, L.B., 2015, Seabed maps showing topography, ruggedness, backscatter intensity, sediment mobility, and the distribution of geologic substrates in quadrangle 6 of the Stellwagen Bank National Marine Sanctuary region offshore of Boston, Massachusetts: U.S. Geological Survey Scientific Investigations Map 3341, 10 sheets, scale 1:25,000, 21-p. pamphlet, accessed June 14, 2023, at https://doi.org/10.3133/sim3341.
Valentine, P.C., Gallea, L.B., Blackwood, D.S., and Twomey, E.R., 2010, Seabed photographs, sediment texture analyses, and sun-illuminated sea floor topography in the Stellwagen Bank National Marine Sanctuary region off Boston, Massachusetts: U.S. Geological Survey Data Series DS–469, accessed June 14, 2023, at https://doi.org/10.3133/ds469.
Valentine, P.C., Unger, T.S., and Baker, J.L., 1999, Sun-illuminated sea floor topography of quadrangle 5 in the Stellwagen Bank National Marine Sanctuary off Boston, Massachusetts: U.S. Geological Survey Geologic Investigations Series Map I–2705, 1 sheet, scale 1:25,000. [Also available at https://doi.org/10.3133/i2705.]
Warner, J.C., Butman, B., and Dalyander, P.S., 2008, Storm-driven sediment transport in Massachusetts Bay: Continental Shelf Research, v. 28, no. 2, p. 257–282. [Also available at https://doi.org/10.1016/j.csr.2007.08.008.]
Wentworth, C.K., 1922, A scale of grade and class terms for clastic sediments: Journal of Geology, v. 30, no. 5, p. 377–392. [Also available at https://www.jstor.org/stable/30063207.]
Tables 6 and 7
Table 6.
Properties of geologic substrates in quadrangle 5 of the Stellwagen Bank National Marine Sanctuary region offshore of Boston, Massachusetts.[Textural properties for unlayered substrates (A1, A3, H, I, K, L, N, O, P, R, S, and U) are based on grain-size analysis. Textural properties for layered substrates (B, J, M, Q, T, V, and W) are based on grain-size analysis of the upper substrate that partially veneers the lower substrates. The lower substrates are identified based on video imagery and are combinations of pebble, cobble, and boulder gravel, and semiconsolidated mud. Weight percent values may not add to 100 due to rounding; <1 means >0 and ≤0.5 weight percent. A sand (0, 1, 2, 3, and 4 phi), mud (>4 phi), or gravel (G1, G2) grain size is termed “significant” in a substrate if its mean weight percent for all samples of a substrate type is ≥10. See tables 1 and 2 for grain-size classifications for sediment. Sediment components of an unlayered substrate (or the upper substrate of a layered substrate) are listed in order of increasing weight percent in the sediment class name. Sediment components of the lower substrate indicate presence/absence and are not listed in order of increasing areal coverage in the sediment class name. See table 3 for an explanation of characters used in substrate names to describe their physical attributes. For stations that represent substrates that could not be mapped as coherent units (N, O, and W), the water depth range of stations is the same as that of the mapped substrate. See Valentine and Cross (2024b) for the results of grain-size analyses of sediment samples and the assignment of stations to substrates. Grain-size abbreviations: cgS, coarse-grained sand (0, 1, and 2 phi combined); fgS, fine-grained sand (3 and 4 phi combined); G1, gravel1 (−1 and −2 phi combined); G2, gravel2 (−3, −4, and −5 phi combined). Other terms: ~, approximately; >, greater than; ≥, greater than or equal to; <, less than; ≤, less than or equal to; φ, phi; All, total number of stations; m, meter; max, maximum; min, minimum; mm, millimeter; NS, number of stations with only video or photograph imagery; S, number of stations with sediment grain-size analysis]
Table 7.
Geologic substrate symbols, names, areas, and brief comparisons to other substrates in quadrangle 5 of the Stellwagen Bank National Marine Sanctuary region offshore of Boston, Massachusetts.[See table 3 for an explanation of characters used in substrate names to describe their physical attributes. Areas were calculated from substrate polygons (Valentine and Cross, 2024a) using Esri’s ArcMap program, version 10.8.1. Areas could not be determined for substrates N, O, and W because they are represented by few samples and are not mappable as coherent units at 1:25,000 scale. Quadrangle 5 has a total area of 211 km2. Terms: <, less than; km2, square kilometer; m, meter; nd, no data; wt. pct., weight percent]
| Geologic substrate symbol | Substrate name | Substrate name translation | Area of substrate in quadrangle 5 (km2) | Area of substrate in quadrangle 5 (percent) | Brief description and (or) comparison to other substrates |
|---|---|---|---|---|---|
| A1 | A1 r_cgS | A1—Rippled, coarse-grained sand | 97.4 | 46.2 | Substrate A1 (24–55 m water depth) also occurs in quadrangle 6 to the east (Valentine and Gallea, 2015) and is equivalent to the mobile portion of substrate B, which is present in quadrangles 5 and 6. The downslope margin of substrate A1 in quadrangle 5 represents the leading edge of a sand sheet that has overridden substrates H, I, and L. Some small deposits of substrate A1 that occur within the areas occupied by substrates A3 and B could not be mapped as coherent units and are shown by magenta square symbols on map D, sheet 1 (see Valentine and Cross, 2024b). Substrate A1 is texturally somewhat similar to mobile substrate A3, which has a higher content of fine-grained sand (22 wt. pct.) than A1 (3 wt. pct.). Substrate A1 is texturally similar to immobile substrate A2, which lies at deeper water depths (53–77 m) on the lower eastern flank of Stellwagen Bank in quadrangle 6 (Valentine and Gallea, 2015) and contains more fine-grained sand (11 wt. pct.). |
| A3 | A3 r_cgS | A3—Rippled, coarse-grained sand | 7.0 | 3.3 | Substrate A3 (23–53 m water depth) is texturally somewhat similar to mobile substrate A1. Substrate A3 has a higher fine-grained sand content than A1 (see above). Substrate A3 is present in the form of hummocky and linear deposits. A large deposit (7.0 km2) is mapped on the Stellwagen Bank crest, but small deposits that occur within the areas occupied by substrates A1 and B could not be mapped as coherent units and are shown by magenta square symbols on map D, sheet 1 (see Valentine and Cross, 2024b). Texturally, substrate A3 is equivalent to substrate K, which lies in a deeper water depth range (40–50 m). |
| B | B r_cgS / i_cbG | B—Rippled, coarse-grained sand; partial veneer on immobile, cobble, boulder gravel | 4.9 | 2.3 | Substrate B (30–44 m water depth) is a layered substrate composed of an upper layer of rippled sand equivalent to substrates A1 and A3 that partially veneers cobbles and boulders associated with boulder ridges (substrate C) and gravel mounds. It is a mixture of mobile and immobile substrates. |
| C | C i_cbG | C—Immobile, cobble, boulder gravel | 0.4 | 0.2 | Substrate C (30–65 m water depth) is present as boulder ridges on the crest and upper western flank of Stellwagen Bank where it occurs with substrate B, on Western Spur where it occurs with substrate L, and on Southwestern Spur where it occurs with substrate Q. |
| H | H r_fgS | H—Rippled, fine-grained sand | 6.8 | 3.2 | Substrate H (35–52 m water depth) lies downslope of mobile substrate A1 and appears to have been overridden by it. Mud weight percent is low in both substrates (A1, <1; H, 2), but H has a much higher fine-grained sand content (83 wt. pct.) than A1 (3 wt. pct.). The northern part of substrate H lies upslope of immobile substrate L, which has a higher mud and 4‑phi sand content than H. The southern part of substrate H (a mobile, fine-grained sand) lies upslope of substrate K (a mobile, coarse-grained sand). The downslope margin of this southern part of substrate H represents the leading edge of a sand sheet that has overridden substrate K. |
| I | I i_fgcgS | I—Immobile, fine- and coarse-grained sand | 3.4 | 1.6 | Substrate I (40–75 m water depth) contains subequal amounts of fine- and coarse-grained sand and, as it extends downslope, it bisects the northward-trending substrate L in which fine-grained sand dominates. The presence of a large amount of coarse-grained sand in substrate I is possibly due to the presence of an underlying, previously mobile, coarse-grained sand deposit that is texturally similar to substrate A1. Substrate I is texturally similar to the upper layer of substrate J, which it surrounds. Limited video imagery was collected in the area identified as substrate I. It is likely that the shallow part of the substrate is mobile and the deep part is not, but more data are required to resolve this issue. |
| J | J r_cgfgS / i_pcbG | J—Rippled, coarse- and fine-grained sand; partial veneer on immobile, pebble, cobble, boulder gravel | 0.5 | 0.2 | Substrate J (46–59 m water depth) is a layered substrate that lies in a depression surrounded by substrate I. Its upper layer is texturally similar to substrate I. |
| K | K r_cgS | K—Rippled, coarse-grained sand | 3.6 | 1.7 | Substrate K (40–50 m water depth) is texturally equivalent to substrate A3. It lies between two fine-grained sand substrates (H and L) on the western flank of Stellwagen Bank. The northern and upslope margins of substrate K have been overridden by the sand sheet of substrate H. |
| L | L i_mfgS | L—Immobile, muddy, fine-grained sand | 19.4 | 9.2 | Substrate L (44–77 m water depth) occurs in three areas along the lower western flank of Stellwagen Bank and represents the transition from shallower sand substrates (A1, H, and K) that have lower contents of 4‑phi sand and mud to a deeper mud substrate (R) in Stellwagen Basin with a much higher content of 4‑phi sand and mud. The upslope margins of the northern and central parts of substrate L have been overridden by the sand sheets of substrates A1 and I. |
| M | M i_mcgS / pcbG | M—Immobile, muddy, coarse-grained sand; partial veneer on pebble, cobble, boulder gravel | 2.7 | 1.3 | Substrate M (56–69 m water depth) is a layered substrate that lies on the deeper western part of Western Spur. This substrate, in some respects, resembles substrate Q, which overlies Southwestern Spur (49–81 m water depth) to the south. Substrates M and Q are both layered in hummocky terrain, but the sand in M is dominantly coarse grained and the sand in Q is dominantly fine grained. |
| N | N i_mcgS | N—Immobile, muddy, coarse-grained sand | nd | nd | Substrate N (58–65 m water depth) is present as individual deposits associated with hummocky topography within the deeper part of the area of substrate L. Deposits of substrate N could not be mapped as a coherent unit and are shown by magenta square symbols on map D, sheet 1 (see Valentine and Cross, 2024b). Substrates N and L have similar mud content, but L is a fine-grained sand. |
| O | O i_mfgcgS | O—Immobile, muddy, fine- and coarse-grained sand | nd | nd | Substrate O (55–64 m water depth) is present as individual deposits associated with hummocky topography within the deeper part of the area of substrate L. Deposits of substrate O could not be mapped as a coherent unit and are shown by magenta square symbols on map D, sheet 1 (see Valentine and Cross, 2024b). Substrates O and L have similar mud content, but the sand content of substrate O suggests it is a mixture of substrates L and N. |
| P | P i_mfgS | P—Immobile, muddy, fine-grained sand | 9.9 | 4.7 | Substrate P (59–69 m water depth) occurs in two areas between substrate L (a muddy, fine-grained sand) on the lower flank of Stellwagen Bank and substrate R (a mud) lying in Stellwagen Basin to the west. Substrates L and P are both muddy, fine-grained sands, but P has a higher mud content (29 wt. pct.) than L (10 wt. pct.). The two areas of substrate P are separated by substrate Q, which overlies Southwestern Spur. Substrate P and the upper layer of substrate Q are both muddy, fine-grained sands, but P contains a greater portion of fine-grained sand. |
| Q | Q i_mfgS / pcbG | Q—Immobile, muddy, fine-grained sand; partial veneer on pebble, cobble, boulder gravel | 5.8 | 2.7 | Substrate Q (49–81 m water depth) is a layered substrate that lies on Southwestern Spur. Its upper layer is very similar to substrate P, which lies in two areas north and south of the spur. Mud content of substrates P and Q are similar, but the substrates differ in that Q veneers gravel and contains more coarse-grained sand than P. Substrates Q and M occur in similar settings, but differ texturally in that the upper layer of M is a muddy, coarse-grained sand. |
| R | R i_fgsM | R—Immobile, fine-grained sandy mud | 16.3 | 7.7 | Substrate R (67–88 m water depth) occurs in two areas in the eastern part of Stellwagen Basin. It contains a higher mud content (58 wt. pct.) than all substrates that lie to the east in shallower water on the western flank of Stellwagen Bank and it separates the sand substrates of the bank from the mud (substrate S) of the basin. Substrate R is equivalent to the upper layer of substrate V, which it surrounds. Fish and crab burrows are present. |
| S | S i_M | S—Immobile mud | 29.6 | 14.0 | Substrate S (82–105 m water depth) is a homogeneous mud (94 wt. pct.) that lies in the deep part of Stellwagen Basin. Fish and crab burrows are present. |
| T | T i_mcgS / pcbG | T—Immobile, muddy, coarse-grained sand; partial veneer on pebble, cobble, boulder gravel | 1.9 | 0.9 | Substrate T (70–103 m water depth) is a layered substrate that occurs in two areas, one on the western flank of Western Spur and the other on nearby Fifteen Bank. It resembles substrate M, which lies on outer Western Spur and is also layered. Substrate T lies at deeper depths and contains more mud (34 wt. pct.) and gravel (14 wt. pct.), and substrate M contains more coarse-grained sand (60 wt. pct.). |
| U | U i_pcG | U—Immobile, pebble, cobble gravel | 0.1 | <0.1 | Substrate U (56–60 m water depth) occurs on the Western Edge of Stellwagen Bank. It also occurs at one location within the area occupied by substrate A1 on the bank crest (35 m water depth) where it is shown by a magenta square symbol on map D, sheet 1 (see Valentine and Cross, 2024b). It is a gravel pavement of closely packed pebbles and cobbles with little to no sand veneer. |
| V | V i_fgsM / cbG | V—Immobile, fine-grained sandy mud; partial veneer on cobble, boulder gravel | 1.1 | 0.5 | Substrate V (72–82 m water depth) is a layered substrate that occurs in two areas in Stellwagen Basin surrounded by substrate R. It comprises an upper layer equivalent to substrate R that partially veneers cobbles and boulders. The underlying cobbles and boulders represent almost-buried mounds of gravel that are exposed in depressions formed by the scouring activities of large fish. |
| W | W r_cgS / i_scM | W—Rippled, coarse-grained sand; partial veneer on immobile, semiconsolidated mud | nd | nd | Substrate W (31–35 m water depth) is a layered substrate that occurs at 3 locations near the Stellwagen Bank crest in the area occupied by substrate A1. Deposits of substrate W could not be mapped as a coherent unit and are shown by magenta square symbols on map D, sheet 1 (see Valentine and Cross, 2024b). The upper mobile coarse-grained sand layer is texturally similar to substrates A1 and A3. The lower semiconsolidated mud layer is burrowed and partially overlain by mud fragments. |
Appendix 1. Data Layers and Data for Quadrangle 5
Table 1.1.
Data layers and data used to compile maps for quadrangle 5 of the Stellwagen Bank National Marine Sanctuary region offshore of Boston, Massachusetts.[Terms: ≥, greater than or equal to; <, less than; CSV, comma separated values; JPEG, Joint Photographic Experts Group; m, meter; NAD 83, North American Datum of 1983; TIFF, tagged image file format]
| Data-layer name and (or) description |
Location of data and associated metadata | Source |
|---|---|---|
| q5_geologic_interp—Polygon shapefile of the geologic substrate interpretation of the seabed in quadrangle 5. Attribute fields can be used to symbolically illustrate the seven maps presented in this publication | https://www.sciencebase.gov/catalog/item/63a09167d34e0de3a1f27731 | Valentine and Cross (2024a) |
| q5_1m_contours—Polyline shapefile of the 1‑m contours in quadrangle 5. These contours are used in some areas to reveal small features not shown by 5‑m contours | https://www.sciencebase.gov/catalog/item/63a091a6d34e0de3a1f27738 | Valentine and Cross (2024a) |
| q5_13mbathy—Esri binary grid of the 13- × 13‑m cell-size bathymetry of quadrangle 5 used as a basis for the generation of the 1‑m contours and the terrain ruggedness analyses | https://www.sciencebase.gov/catalog/item/63a09196d34e0de3a1f27736 | Valentine and Cross (2024a) |
| q5_stations_geology—Point shapefile of station locations and Excel and CSV files of sediment grain-size analyses and assignment of stations to substrate types | https://www.sciencebase.gov/catalog/item/63a09185d34e0de3a1f27734 | Valentine and Cross (2024b) |
| 2013-044-FA_video_driftlines.zip—Video transects of the sea floor on Stellwagen Bank during U.S. Geological Survey field activity 2013-044-FA, aboard the R/V Auk, November 5, 15, and 21, 2013 | https://doi.org/10.5066/P9N8YJL1 | Valentine and Cross (2019) |
| 2014-015-FA_video_driftlines.zip—Video transects of the sea floor on Stellwagen Bank during U.S. Geological Survey field activity 2014-015-FA, aboard the R/V Auk, May 22–23 and 29–30, 2014 | https://doi.org/10.5066/P93OZR8C | Valentine and Cross (2020b) |
| 2014-066-FA_video_driftlines.zip—Video transects of the sea floor on Stellwagen Bank during U.S. Geological Survey field activity 2014-066-FA, aboard the R/V Auk, November 10, 2014 | https://doi.org/10.5066/P9EQM8MK | Valentine and Cross (2020d) |
| 2015-017-FA_video_driftlines.zip—Video transects of the sea floor on Stellwagen Bank during U.S. Geological Survey field activity 2015-017-FA, aboard the R/V Auk, May 18–19, 29, and June 3, 2015 | https://doi.org/10.5066/P9BG490P | Valentine and Cross (2020c) |
| 2015-062-FA_video_driftlines.zip—Video transects of the sea floor on Stellwagen Bank during U.S. Geological Survey field activity 2015-062-FA, aboard the R/V Auk, October 21–22 and November 3–4, 2015 | https://dx.doi.org/10.5066/F7N015FS | Valentine and Cross (2017) |
| 2016-038-FA_video_driftlines.zip—Video transects of the sea floor on Stellwagen Bank during U.S. Geological Survey field activity 2016-038-FA, aboard the R/V Auk, September 16 and 19, 2016 | https://doi.org/10.5066/P91MNNSN | Valentine and Cross (2020e) |
| 2019-008-FA_video_driftlines.zip—Video transects of the sea floor on Stellwagen Bank during U.S. Geological Survey field activity 2019-008-FA, aboard the R/V Auk, July 30–31 and August 1, 2019 | https://doi.org/10.5066/P93ATKSC | Valentine and Cross (2020a) |
| Seabed observation stations—Video drift track locations, Stellwagen Bank National Marine Sanctuary region | https://doi.org/10.3133/sim2840 | Valentine (2005) |
| Seabed observation stations—Sediment sample locations and Excel file of grain-size analyses, Stellwagen Bank National Marine Sanctuary region | https://doi.org/10.3133/sim2840 | Valentine (2005) |
| Photographic images of the seabed—Locations of individual photographs, Stellwagen Bank National Marine Sanctuary region | https://pubs.usgs.gov/ds/469/DataCatalog/sb_photolocs.zip | Valentine and others (2010) |
| JPEG images of the seabed from quadrangles 1–18 in medium and high resolution, Stellwagen Bank National Marine Sanctuary region | https://pubs.usgs.gov/ds/469/html/DataCatalog.html | Valentine and others (2010) |
| Sun-illuminated sea-floor topography and TIFF world file, Stellwagen Bank National Marine Sanctuary region | https://doi.org/10.3133/sim2840 | Valentine (2005) |
| Bathymetric contours, Stellwagen Bank National Marine Sanctuary region | https://doi.org/10.3133/sim2840 | Valentine (2005) |
| Backscatter intensity, sun-illuminated sea-floor topography, and TIFF world file, Stellwagen Bank National Marine Sanctuary region | https://doi.org/10.3133/sim2840 | Valentine (2005) |
| Sea-floor ruggedness and TIFF world file, Stellwagen Bank National Marine Sanctuary region | https://doi.org/10.3133/sim2840 | Valentine (2005) |
| Esri binary grid used as the basis for the terrain rugged analyses, Stellwagen Bank National Marine Sanctuary region | https://doi.org/10.3133/sim2840 | Valentine (2005) |
| Sea-floor slope and TIFF world file, Stellwagen Bank National Marine Sanctuary region | https://doi.org/10.3133/sim2840 | Valentine (2005) |
| Boulder ridges <1 meter in height, Stellwagen Bank National Marine Sanctuary region | https://doi.org/10.3133/sim2840 | Valentine (2005) |
| Boulder ridges ≥1 meter in height, Stellwagen Bank National Marine Sanctuary region | https://doi.org/10.3133/sim2840 | Valentine (2005) |
| Bedrock outcrops, Stellwagen Bank National Marine Sanctuary region | https://doi.org/10.3133/sim2840 | Valentine (2005) |
| Boundary, Stellwagen Bank National Marine Sanctuary | https://doi.org/10.3133/sim2840 | Valentine (2005) |
| Quadrangle boundaries, Stellwagen Bank National Marine Sanctuary region | https://doi.org/10.3133/sim2840 | Valentine (2005) |
References Cited
Valentine, P.C., ed., 2005, Sea floor image maps showing topography, sun-illuminated topography, backscatter intensity, ruggedness, slope, and the distribution of boulder ridges and bedrock outcrops in the Stellwagen Bank National Marine Sanctuary region off Boston, Massachusetts: U.S. Geological Survey Scientific Investigations Map 2840, 12 sheets, scale 1:60,000, 1 DVD-ROM. [Also available at https://doi.org/10.3133/sim2840.]
Valentine, P.C., and Cross, V.A., 2017, Sea floor sediment samples, seabed imagery, and CTD data collected in Stellwagen Bank National Marine Sanctuary, MA in 2015, U.S. Geological Survey Field Activity 2015-062-FA: U.S. Geological Survey data release, accessed June 14, 2023, at https://doi.org/10.5066/F7N015FS.
Valentine, P.C., and Cross, V.A., 2019, Sea-floor sediment samples, seabed imagery, and CTD instrument data collected on Stellwagen Bank in November, 2013, U.S. Geological Survey Field Activity 2013-044-FA: U.S. Geological Survey data release, accessed June 14, 2023, at https://doi.org/10.5066/P9N8YJL1.
Valentine, P.C., and Cross, V.A., 2020a, Sea-floor sediment samples, seabed imagery, and CTD instrument data collected on Stellwagen Bank in July and August, 2019, U.S. Geological Survey Field Activity 2019-008-FA (ver. 1.1, May 2023): U.S. Geological Survey data release, accessed June 14, 2023, at https://doi.org/10.5066/P93ATKSC.
Valentine, P.C., and Cross, V.A., 2020b, Sea-floor sediment samples, seabed imagery, and CTD instrument data collected on Stellwagen Bank in May, 2014, U.S. Geological Survey Field Activity 2014-015-FA: U.S. Geological Survey data release, accessed June 14, 2023, at https://doi.org/10.5066/P93OZR8C.
Valentine, P.C., and Cross, V.A., 2020c, Sea-floor sediment samples, seabed imagery, and CTD instrument data collected on Stellwagen Bank in May and June, 2015, U.S. Geological Survey Field Activity 2015-017-FA: U.S. Geological Survey data release, accessed June 14, 2023, at https://doi.org/10.5066/P9BG490P.
Valentine, P.C., and Cross, V.A., 2020d, Sea-floor sediment samples, seabed imagery, and CTD instrument data collected on Stellwagen Bank in November, 2014, U.S. Geological Survey Field Activity 2014-066-FA: U.S. Geological Survey data release, accessed June 14, 2023, at https://doi.org/10.5066/P9EQM8MK.
Valentine, P.C., and Cross, V.A., 2020e, Station information, seabed and sample imagery, and CTD instrument data collected on Stellwagen Bank in September, 2016, U.S. Geological Survey Field Activity 2016-038-FA: U.S. Geological Survey data release, accessed June 14, 2023, at https://doi.org/10.5066/P91MNNSN.
Valentine, P.C., and Cross, V.A., 2024a, Geospatial datasets of seabed topography, sediment mobility, and the distribution of geologic substrates in quadrangle 5 of the Stellwagen Bank National Marine Sanctuary region offshore of Boston, Massachusetts: U.S. Geological Survey data release, https://doi.org/10.5066/P9W9BN3S.
Valentine, P.C., and Cross, V.A., 2024b, Station locations in quadrangle 5 in Stellwagen Bank National Marine Sanctuary offshore of Boston, Massachusetts where video, photographs and sediment samples were collected by the U.S. Geological Survey from 1993-2015 - includes sediment sample analyses and interpreted geologic substrate, in Geospatial datasets of seabed topography, sediment mobility, and the distribution of geologic substrates in quadrangle 5 of the Stellwagen Bank National Marine Sanctuary region offshore of Boston, Massachusetts: U.S. Geological Survey data release, https://www.sciencebase.gov/catalog/item/63a09185d34e0de3a1f27734.
Valentine, P.C., Gallea, L.B., Blackwood, D.S., and Twomey, E.R., 2010, Seabed photographs, sediment texture analyses, and sun-illuminated sea floor topography in the Stellwagen Bank National Marine Sanctuary region off Boston, Massachusetts: U.S. Geological Survey Data Series DS–469, accessed June 14, 2023, at https://doi.org/10.3133/ds469.
Conversion Factors
International System of Units to U.S. customary units
For more information, please contact:
Director, Woods Hole Coastal and Marine Science Center
U.S. Geological Survey
384 Woods Hole Road
Quissett Campus
Woods Hole, MA 02543–1598
WHSC_science_director@usgs.gov
508–548–8700
Or visit our website at:
https://www.usgs.gov/centers/whcmsc
Publishing support provided by the USGS, Science Publishing Network, Reston Publishing Service Center
Edited by Zachary P. Younger
Cartography by D. Paul Mathieux
Layout by Cathy Knutson
Web support by Molly Newbrough
Disclaimers
Any use of trade, firm, or product names is for descriptive purposes only and does not imply endorsement by the U.S. Government.
Although this information product, for the most part, is in the public domain, it also may contain copyrighted materials as noted in the text. Permission to reproduce copyrighted items must be secured from the copyright owner.
Suggested Citation
Valentine, P.C., and Cross, V.A., 2024, Seabed maps showing topography, ruggedness, backscatter intensity, sediment mobility, and the distribution of geologic substrates in quadrangle 5 of the Stellwagen Bank National Marine Sanctuary region offshore of Boston, Massachusetts: U.S. Geological Survey Scientific Investigations Map 3515, 8 sheets, scale 1:25,000, 27-p. pamphlet, https://doi.org/10.3133/sim3515.
ISSN: 2329-132X (online)
Study Area
| Publication type | Report |
|---|---|
| Publication Subtype | USGS Numbered Series |
| Title | Seabed maps showing topography, ruggedness, backscatter intensity, sediment mobility, and the distribution of geologic substrates in quadrangle 5 of the Stellwagen Bank National Marine Sanctuary region offshore of Boston, Massachusetts |
| Series title | Scientific Investigations Map |
| Series number | 3515 |
| DOI | 10.3133/sim3515 |
| Publication Date | March 21, 2024 |
| Year Published | 2024 |
| Language | English |
| Publisher | U.S. Geological Survey |
| Publisher location | Reston, VA |
| Contributing office(s) | Woods Hole Coastal and Marine Science Center |
| Description | Pamphlet: v, 27 p.; 8 Sheets: 26.96 × 32.43 inches or smaller; Data Release |
| Country | United States |
| State | Massachusetts |
| Online Only (Y/N) | Y |
| Additional Online Files (Y/N) | Y |