

Altitude of the Potentiometric Surface and Depth to Water in the Mississippi River Valley Alluvial Aquifer, Spring 2022
Links
- Document: Pamphlet (14 MB pdf) , HTML , XML
- Sheets:
- Dataset: USGS National Water Information System database - USGS water data for the Nation
- Data Release: USGS data release - Datasets used to map the potentiometric surface and depth to water, Mississippi River Valley alluvial aquifer, spring 2022
- NGMDB Index Page: National Geologic Map Database Index Page (html)
- Download citation as: RIS | Dublin Core
Acknowledgments
This report is the culmination of efforts by personnel from the Arkansas Department of Health; Arkansas Geological Survey; Arkansas Department of Agriculture; Mississippi Department of Environmental Quality; Missouri Department of Natural Resources; U.S. Army Corps of Engineers; U.S. Department of Agriculture’s Natural Resources Conservation Service; U.S. Geological Survey’s Central Midwest, Lower Mississippi-Gulf, Oklahoma-Texas, and Nebraska Water Science Centers; and Yazoo Mississippi Delta Joint Water Management District, who collected, compiled, organized, analyzed, and verified the groundwater- and surface-water-altitude data. In addition to the authors, who primarily were responsible for ensuring that the information used in this report was accurate and complete, the following individuals contributed substantially to the review of the water-level data and associated potentiometric-surface map:
Blake Forrest (Arkansas Department of Agriculture, Natural Resources Division),
Madison Kymes and Kay Whittington (Mississippi Department of Environmental Quality), and
HiDon Christy (Yazoo Mississippi Delta Joint Water Management District).
Introduction
The Mississippi River Valley alluvial aquifer (MRVA) is an important surficial aquifer in the Mississippi Alluvial Plain (MAP) area (fig. 1). The MRVA generally is considered an unconfined aquifer (Clark and others, 2011), and withdrawals are primarily used for irrigation (Lovelace and others, 2020). Groundwater withdrawals have resulted in substantial areas of water-level decline in parts of the aquifer. Concerns about declining water levels and the sustainability of the MRVA prompted the U.S. Geological Survey (USGS), as part of the USGS Water Availability and Use Science Program, with assistance from other Federal, State, and local agencies, to undertake a regional water-availability study to increase hydrologic understanding of the MRVA. This study included creating potentiometric-surface maps of the MRVA for spring (generally April) 2016, 2018, 2020 (McGuire and others, 2019, 2020, and 2021), and 2022 (this report). These maps provide information to water managers to inform their decisions about resource allocations and aquifer sustainability.
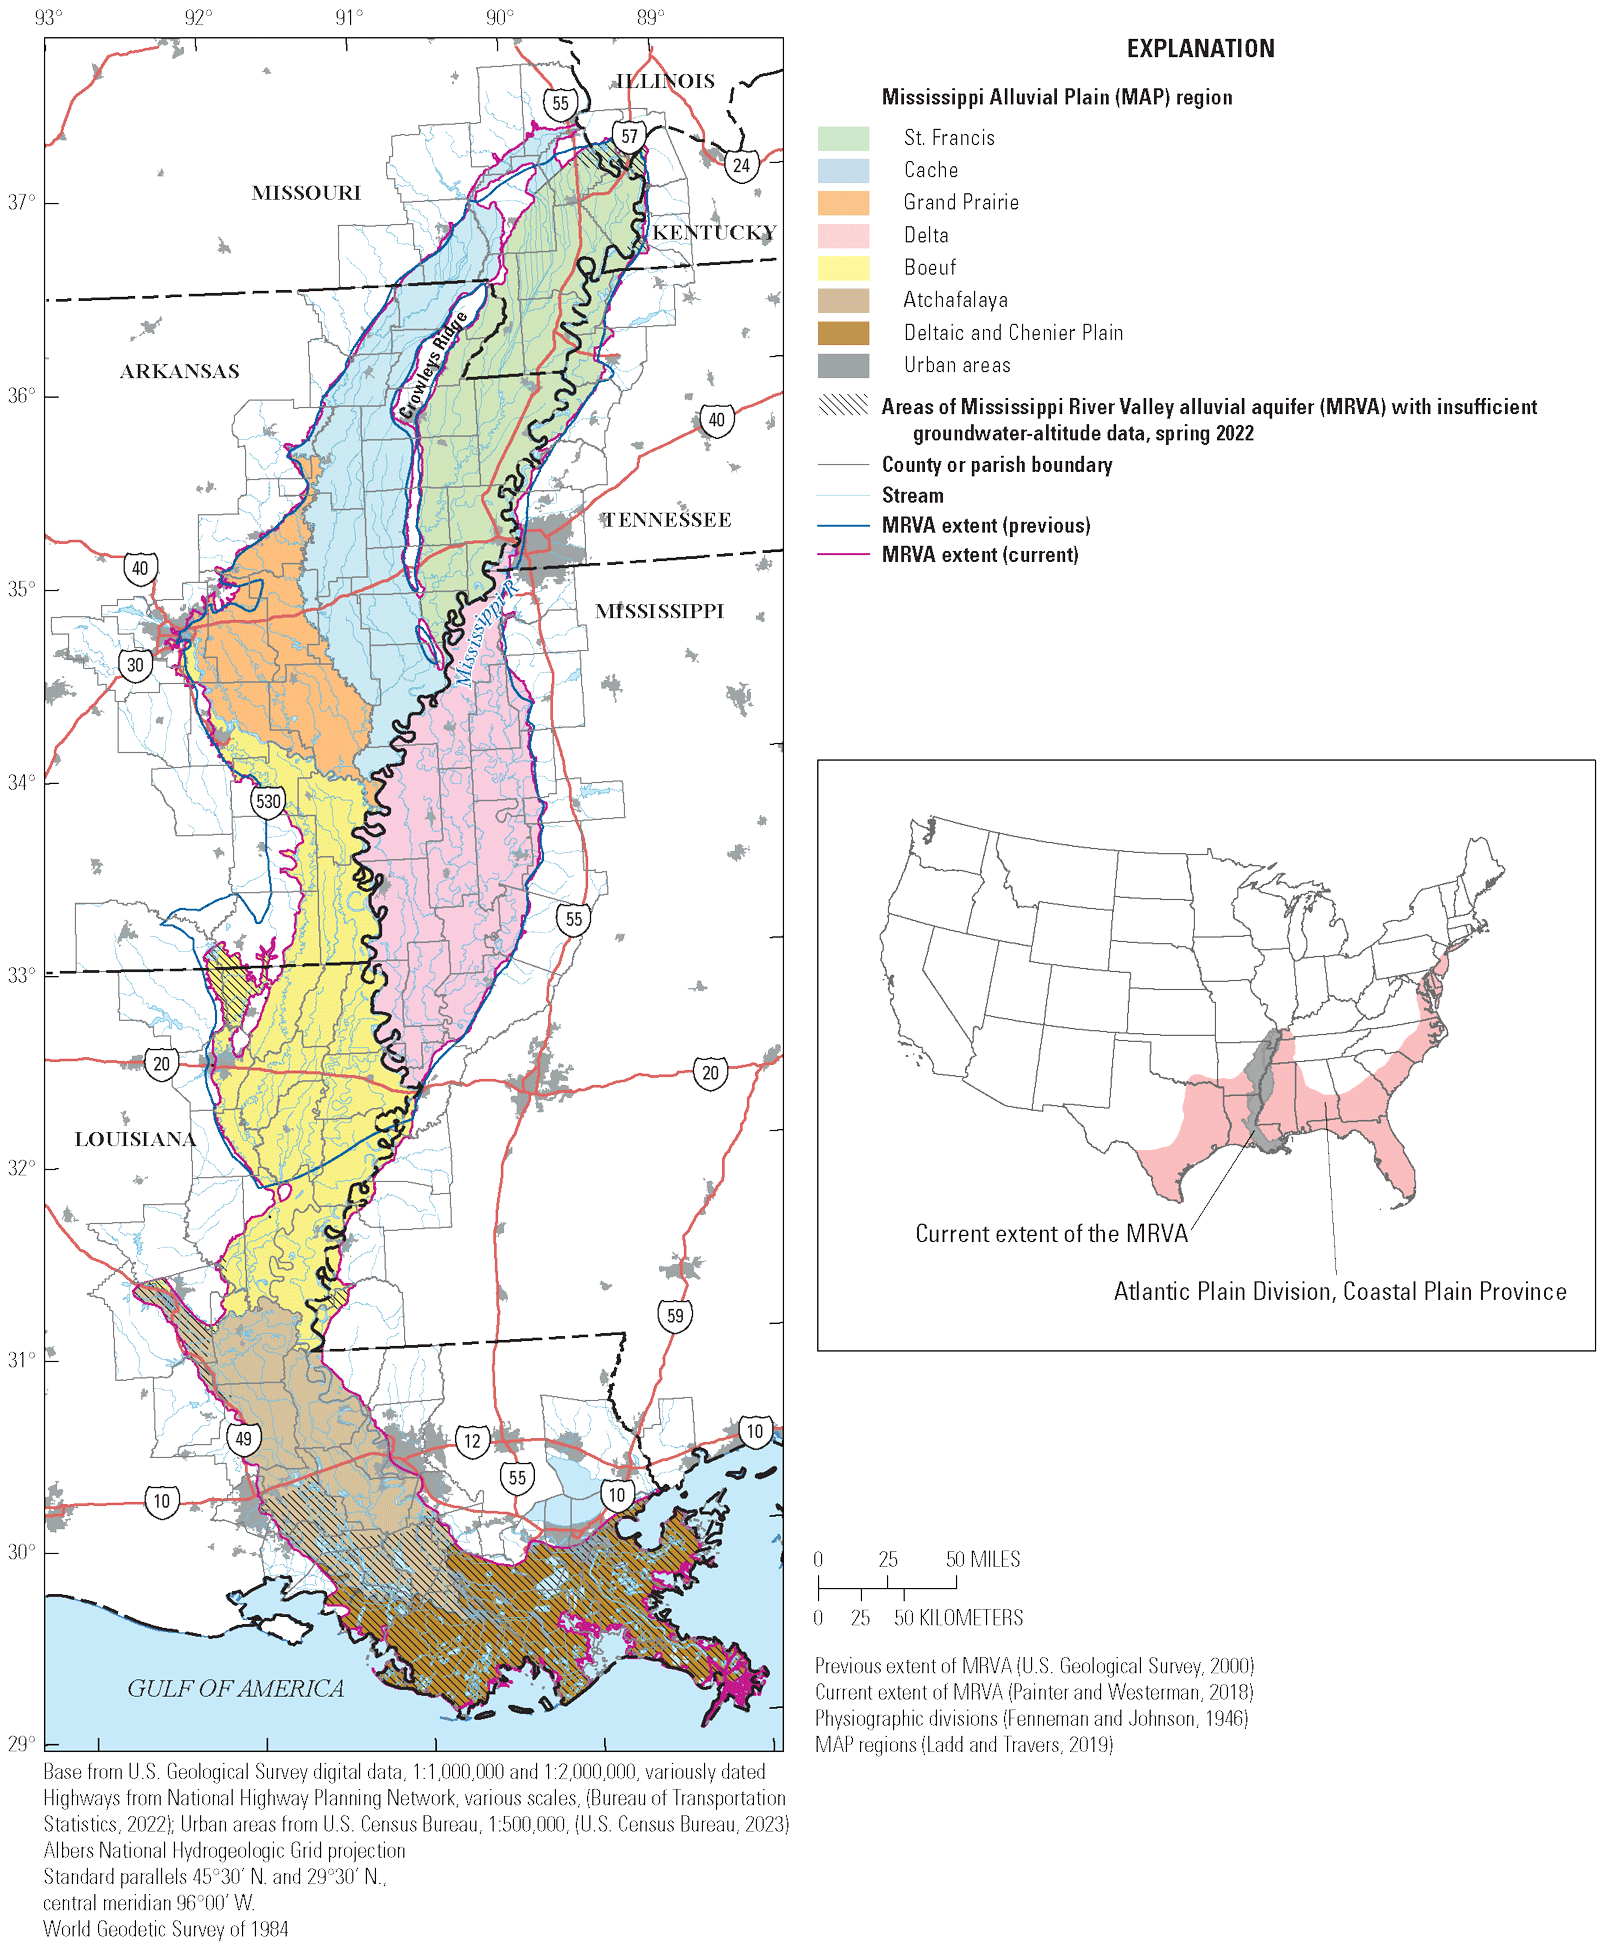
Map showing regions of the Mississippi Alluvial Plain, areas of the Mississippi River Valley alluvial aquifer with insufficient groundwater-altitude data to map its potentiometric surface for spring 2022, and the previous and current extent of the Mississippi River Valley alluvial aquifer.
The purposes of this report are to present potentiometric-surface and depth-to-water maps for spring 2022 in the MRVA. The source data for the maps were land-surface and groundwater-altitude data from wells measured manually or continuously generally in spring 2022. The source data for the potentiometric-surface map also included the altitude of the top of the water surface (hereinafter referred to as “surface-water altitude”) measured in early April 2022, in rivers and streams in the area.
The term “potentiometric surface” is applicable for maps of the groundwater-altitude surface in unconfined, semiconfined, and confined aquifers (Lohman, 1972). James and Minsley (2021) used geophysical data to map low-permeability units in the MRVA from land surface to 50 feet (ft) below land surface from the northern boundary of the MRVA to about the middle of Louisiana. The MRVA generally exhibits characteristics of unconfined conditions but exhibits characteristics of confined or semiconfined conditions in some areas (James and Minsley, 2021).
Previously published potentiometric-surface maps for a substantial part of the MRVA include maps from water levels measured from 1953 to 1961 (Krinitzsky and Wire, 1964), for 1964 (Boswell and others, 1968), and for 2016, 2018, and 2020 (McGuire and others, 2019, 2020, and 2021). Previously published potentiometric-surface maps for parts of the MRVA include maps for the Grand Prairie region in Arkansas in 1929, 1939, and 1959 (Engler and others, 1963) and selected counties in northeastern and central Arkansas in 1965 and 1966 (Albin and others, 1967; Plebuch and Hines, 1967); the entire aquifer area in Arkansas for 1972, 1980, 1983, 1984, 1985, 1986, 1987, 1989, 1992, 1994, 1996, 1998, 2000, 2002, 2004, 2006, 2008, and 2012 (Edds and Fitzpatrick, 1984; Plafcan and Edds, 1986; Plafcan and Fugitt, 1987; Ackerman, 1989; Plafcan and Remsing, 1989; Westerfield, 1990; Westerfield and Gonthier, 1993; Westerfield and Poynter, 1994; Stanton and others, 1998; Joseph, 1999; Schrader, 2001, 2006, 2008, 2010, 2015; Reed, 2004); the aquifer area in northwestern Mississippi for various years including 1976, 1980, 1981, 1982, and 1983 (Dalsin, 1978; Wasson, 1980; Darden, 1981, 1982a, 1982b, 1983; Sumner, 1984, 1985; James Hoffmann, Mississippi Department of Environmental Quality, written commun., 2018); the entire aquifer area in Missouri for 1976 (Miller and Appel, 1997); and the part of the aquifer in northeastern Louisiana for 1990 (Seanor and Smoot, 1995). Previously published potentiometric-surface maps used in this study included Seanor and Smoot (1995), Miller and Appel (1997), Schrader (2015), and McGuire and others (2019, 2020, and 2021). Previously published depth-to-water data for 2016, 2018, and 2020 are in McGuire and others (2023).
Study Area Description
The study area includes the current (2022) extent of the MRVA, which was defined using the same boundary as the MAP physiographic division (Painter and Westerman, 2018) and was used in the potentiometric-surface maps for 2016, 2018, and 2020 (McGuire and others, 2019, 2020, and 2021). The current MRVA extent is a revision of the aquifer extent used in previous studies (fig. 1; Ackerman, 1996; U.S. Geological Survey, 2000; Clark and others, 2011).
The MRVA underlies an area of approximately 43,800 square miles (mi2) in parts of seven States: Arkansas, Illinois, Kentucky, Louisiana, Mississippi, Missouri, and Tennessee (fig. 1; Painter and Westerman, 2018). Groundwater withdrawals from the MRVA in 2015 were 12,100 million gallons per day, making it the second most heavily pumped aquifer in the United States. In 2015, 97 percent of total withdrawals were for irrigation (Lovelace and others, 2020).
The MRVA primarily underlies the MAP section within the Atlantic Plain Division, Coastal Plain Province (fig. 1; Fenneman and Johnson, 1946). The MRVA extends about 560 miles (mi) north to south from southeastern Missouri and Illinois and southwestern Kentucky to the southern boundary of Louisiana. The width of the MRVA ranges from about 35 mi in northeastern Louisiana and southwestern Mississippi to 134 mi in southern Louisiana. The Mississippi River (fig. 1) is within the MRVA boundary except in southeastern Louisiana, where the river is north of the MRVA boundary and instead overlies aquifers in deposits of Pleistocene age in Louisiana (Smoot, 1986). Where the Mississippi River is within the MRVA boundary, the river is along the eastern boundary of the northern and southern part of the aquifer; in the central part of the MRVA, the Mississippi River curves toward the middle of the aquifer at the northwestern boundary of Mississippi before curving back toward the eastern boundary of the aquifer about 50 mi south of the northeastern boundary of Louisiana (fig. 1).
The MRVA is contained in sand, gravel, silt, and clay deposits of Quaternary age overlying deposits of Tertiary age (Hosman and Weiss, 1991; Saucier, 1994; Clark and others, 2011). In some areas, the MRVA is overlain by a confining unit of silt and clay of Quaternary age; where present, this confining unit impedes recharge to the MRVA (Boswell and others, 1968; Ackerman, 1989; Kleiss and others, 2000; James and Minsley, 2021).
Data and Methods
To best represent hydrologic conditions in the MRVA, the groundwater altitudes used to create the 2022 potentiometric-surface and depth-to-water maps would be measured in a representative set of wells screened only in the MRVA, during static climatic conditions, and in a short timeframe of days or 1 or 2 week(s). A subset of the representative wells should be well nests, with short (5 to 10 ft) screens, installed near the top, in the middle, and near the bottom of the aquifer to indicate vertical flow components in the MRVA (Freeze and Cherry, 1979; Fetter, 2001). However, for this study, it was not possible to achieve these requirements. Instead, the measurement timing for many wells was determined by the needs and schedules of the entities doing the measurements. Also, many of the measured wells have longer (greater than 10 ft) screens; water-level measurements from wells with longer screens tend to represent an average hydraulic head in the aquifer for that location (Fetter, 2001). Recognizing the limitations of the available data for this report, we decided to assess all available groundwater-altitude data from wells measured from January 1 to May 31, 2022, regardless of screen length and placement and surface-water altitude data from streamgages measured on the median measurement date or nearest earlier measurement date of the wells used. This decision means that the resultant potentiometric-surface and depth-to-water maps would then represent the generalized central tendency for spring 2022, which could be used to inform management decisions, but would be limited for some purposes, such as for calibration of a groundwater-flow model for early April 2022.
The data selected for the 2022 potentiometric-surface and depth-to-water maps were interpolated into raster datasets, hereinafter referred to as “rasters,” using a geographic information system (GIS) software (Esri ArcGIS Pro, version 3.1.2; Esri, 2023). The resulting rasters and other spatial files are in Albers equal-area conic projection in meters using the World Geodetic Survey of 1984 horizontal datum and the potentiometric-surface altitude is expressed relative to the North American Vertical Datum of 1988 (NAVD 88). The rasters have a uniform cell area of about 0.39 mi2 or 1 square kilometer (km2). Each cell side is about 0.62 mi, or 1,000 meters (m), and the cells are aligned with the National Hydrologic Grid (Clark and others, 2018).
The 2022 potentiometric surface was created by interpolating the selected groundwater-altitude data from wells and surface-water-altitude data from streamgages into a raster, converting the resultant raster to contours, if necessary, manually modifying some of the contours, and regenerating raster with the revised contours. Interpolation was done with the GIS tool, topo to raster (Esri, 2023), which was the same method used for the 2016, 2018, and 2020 potentiometric-surface map (McGuire and others, 2019, 2020, 2021). The topo to raster tool (Esri, 2023) is based on the ANUDEM program, version 5.3 (Hutchinson, 1988, 1989, 1996, and 2000; Hutchinson and others, 2011). The GIS tool, point density, was used to determine areas where the contours were designated as “estimated” for the 2022 potentiometric-surface map (Esri, 2023), which is the same method used in 2020 map construction (McGuire and others, 2021).
The 2022 depth-to-water raster was created by calculating depth to water using land-surface altitude at wells and water-level altitude for the same wells used in the potentiometric-surface map. Where depth to water was negative, indicating that groundwater altitude was above land surface, depth to water was set to zero. For the streamgages used in the potentiometric-surface map, depth to water was assumed to be zero. The depth-to-water values were interpolated using the topo to raster tool (Esri, 2023). This is the same method used to generate the depth-to-water rasters for 2016, 2018, and 2020 (McGuire and others, 2023).
The GIS data sets of input well and streamgage point data and potentiometric-surface contours and of output potentiometric-surface and depth-to-water rasters are available in McGuire and others (2024). The point shapefiles of groundwater- and surface-water-altitude and depth-to-water data includes wells and streamgages, which were used and not used in the potentiometric-surface and depth-to-water maps. The status of each well and streamgage with regards to the 2022 potentiometric-surface and depth-to-water maps is indicated by a field (USE_2022) in the respective point shapefile.
Water-Level Data
Water-level data were from groundwater and surface-water measurements. Groundwater-altitude data were compiled (table 1; U.S. Geological Survey, 2023a; McGuire and others, 2025) from 1,183 wells completed in the MRVA and measured either manually as discrete events during the period from January 1 to May 31, 2022, or continuously (with the use of a recording transducer) during all or part of the period from January 1 to May 31, 2022. Groundwater-altitude data in wells that were manually measured one or more times are hereinafter referred to as “manually measured.” The groundwater-altitude data in wells that were measured continuously for all or part of the period are hereinafter referred to as “continuously measured.” Wells were measured as part of a regular water-level monitoring program by the Arkansas Natural Resources Commission, Missouri Department of Natural Resources, U.S. Department of Agriculture’s Natural Resources Conservation Service, USGS, and Yazoo Mississippi Delta Joint Water Management District. Water-level data recorded by drillers in well completion logs in Missouri were included in the data used to map the potentiometric surface for the MRVA in 2016 (McGuire and others, 2019) but were not included for the 2022 potentiometric-surface map because the data from 2022 were not yet available (September 2023).
Table 1.
Total number of wells completed in the Mississippi River Valley alluvial aquifer and measured manually one or more times or continuously for spring 2022, and the subset of the wells with groundwater-altitude data used to generate the potentiometric-surface map for the Mississippi River Valley alluvial aquifer, spring 2022, by Mississippi Alluvial Plain region (Ladd and Travers, 2019; U.S. Geological Survey, 2023a).[MAP, Mississippi Alluvial Plain; --, no data]
Manually and continuously measured water levels for wells screened in the MRVA were stored in the USGS National Water Information System database (U.S. Geological Survey, 2023a) as depth to water below land surface and as water-level altitude relative to the National Geodetic Vertical Datum of 1929 (NGVD 29) or the NAVD 88. For the manually and continuously measured wells, the land-surface altitude, in feet, with the associated vertical datum and depth to water from land surface were retrieved for each well. For each well, if the land-surface altitude datum was NGVD 29, the land-surface altitude was converted to NAVD 88 using the National Geodetic Survey’s VERTCON computer program (Miller, 1999), and the measured groundwater altitude or daily mean groundwater altitude with respect to the NAVD 88 was calculated. Groundwater altitudes and depth-to-water measurements were assumed accurate to 0.02 ft, recognizing that the measurements are less accurate under certain conditions.
All groundwater-altitude data were reviewed to identify and exclude groundwater-altitude values that appeared affected by current or recent pumping or that were generally different from the groundwater altitudes in nearby wells, possibly because of local or seasonal conditions (Asquith and others, 2019). Other considerations for excluding data were apparent discrepancies between the spatial location of the well and the legal description or well identifier and (or) suspected inaccuracy in the land-surface altitude value. In addition, groundwater-altitude data from wells were not used for (1) wells that were flowing and could not be measured or (2) wells that were dry.
Wells with water-level measurements during the period from January 1 to May 31, 2022, were considered for the 2022 potentiometric-surface map. For manually measured wells with one measurement in the specified timeframe, the only available measurement was selected as the groundwater altitude to consider for use to create the potentiometric-surface map. For the 139 manually measured wells with more than one measurement, only one of these measurements were used in the 2022 potentiometric-surface map. The measurement used was generally the maximum (highest) groundwater altitude for each well. The difference between the maximum and minimum (lowest) groundwater-altitude values for these 139 wells ranged from 0.01 to 9.14 ft, with a median difference of 0.76 ft (fig. 2). The number of wells with more than one measurement by region were Atchafalaya (1 well), Boeuf (13 wells), Cache (11 wells), Delta (79 wells), Grand Prairie (27 wells), and St. Francis (8 wells); the number of wells with more than one measurement by State were Arkansas (47 wells), Louisiana (13 wells), and Mississippi (79 wells). For the wells with more than one manual measurement, the number of days between the minimum and maximum measurement dates and range of groundwater-altitude values are described as follows:
-
• Multiple measurements for 4 wells were on the same day; the differences between the minimum and maximum groundwater altitudes for these wells were from 0.05 to 1.58 ft.
-
• Multiple measurements for 12 wells were less than 10 days apart, but not on the same day; the differences between the minimum and maximum groundwater altitudes for these wells were from 0.02 to 6.73 ft.
-
• Multiple measurements for 123 wells were 10 days to 112 days apart; the differences between the minimum and maximum groundwater altitudes for these wells were from 0.01 to 9.14 ft.
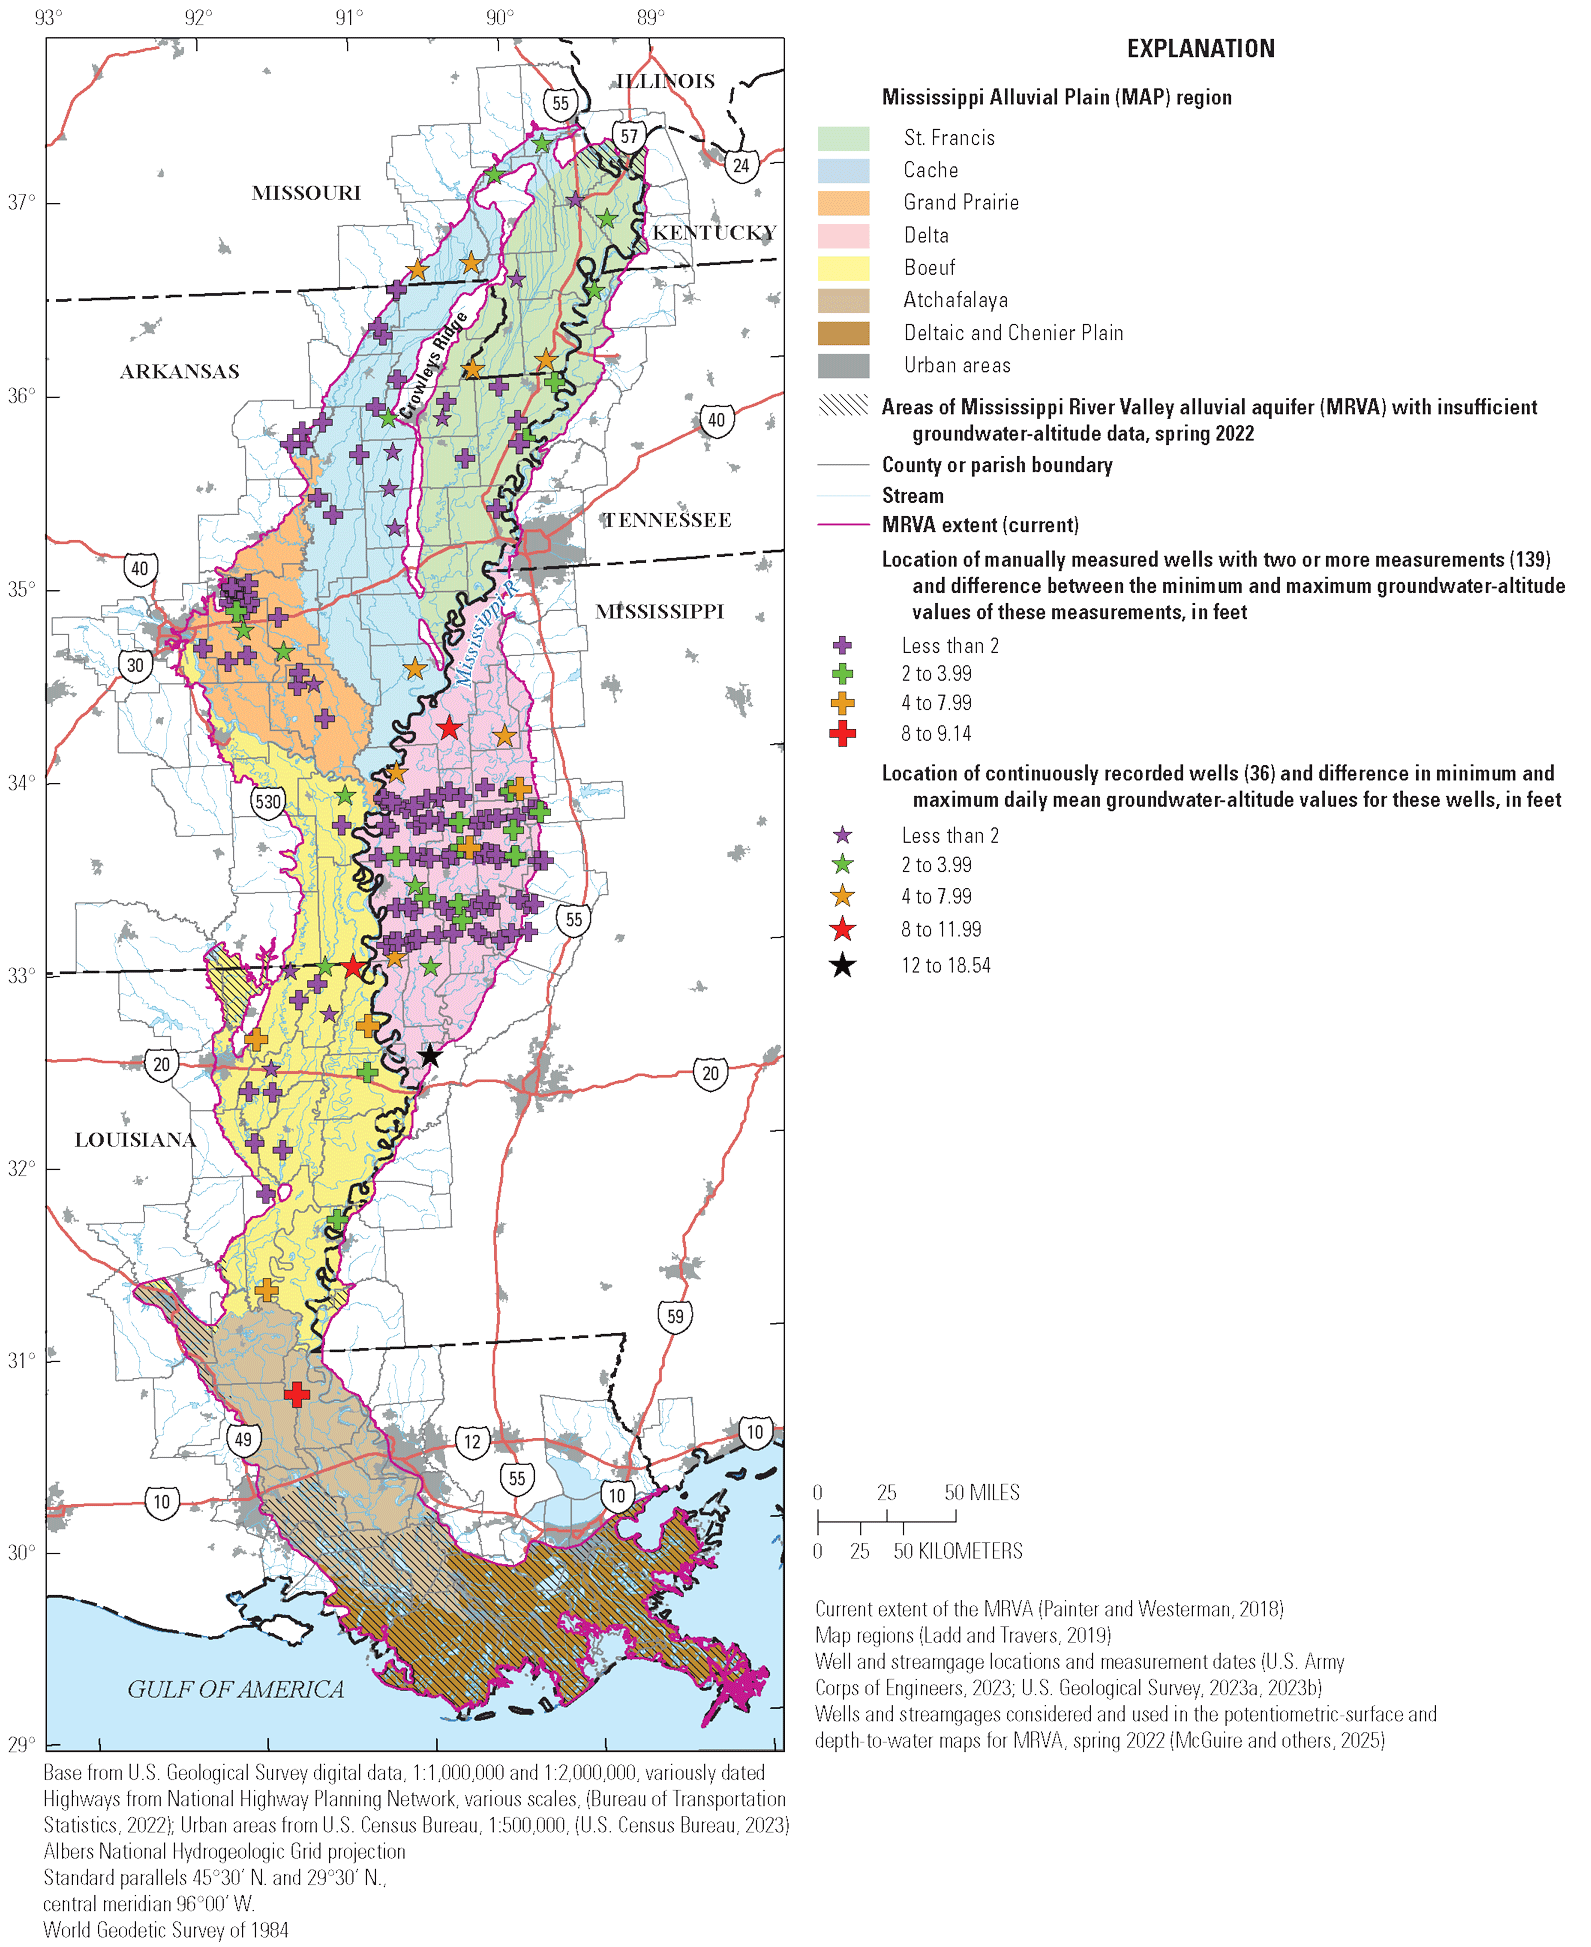
Map showing location of manually and continuously measured wells screened in the Mississippi River Valley alluvial aquifer (MRVA) with two or more groundwater-altitude values for spring 2022 and the difference between the minimum and maximum groundwater-altitude values for these wells in this period.
Water-level data for 38 continuously measured wells screened in the MRVA were retrieved from the USGS National Water Information System (U.S. Geological Survey, 2023a). The location and number of continuously measured wells by region were Boeuf (6 wells), Cache (9 wells), Delta (10 wells), Grand Prairie (6 wells), and St. Francis (7 wells). The location and number of continuously measured wells by State were Arkansas (13 wells), Louisiana (5 wells), Mississippi (10 wells), Missouri (9 wells), and Tennessee (1 well). Two of the 38 continuously measured wells were not used in the potentiometric-surface and depth-to-water maps—one in the Grand Prairie region in Arkansas and one in the Delta region in Mississippi. These 2 continuously measured wells were not used because the water-level altitude in these wells was substantially higher than the water-level altitudes in nearby wells. For the 36 continuously measured wells that were used, the difference between the maximum and minimum groundwater altitude from January 1 to May 31, 2022, ranged from 0.30 ft to 18.54 ft (fig. 2; McGuire and others, 2025). For the 36 continuously measured wells that were used in the potentiometric-surface map for 2022, the date of the water-level measurement used in the potentiometric-surface map for 2022 was April 8, 2022. For the 36 continuously measured wells that were used in the potentiometric-surface map for 2022, the date of the minimum measurement in these wells from January 1 to May 31, 2022, ranged from February 17 to May 31, 2022, and the date of the maximum measurement in these wells from January 1 to May 31, 2022, ranged from January 15 to May 31, 2022. The number of days between the minimum and maximum measurement for each well ranged from 26 to 150 days.
From the total of 1,183 wells considered, groundwater-altitude data from 1,136 wells were used in the spring 2022 potentiometric-surface map (table 1; fig. 3). The minimum, maximum, average, and median distances between the 1,136 wells were 0 ft, 18 mi, 3 mi, and 2 mi, respectively. These wells included 961 manually measured wells, which were measured one time; 139 manually measured wells, which were measured two or more times; and 36 continuously measured wells (McGuire and others, 2025). The median measurement date for the selected manually and continuously measured water levels was April 8, 2022 (table 2). For continuously measured wells, the mean, and not the maximum, daily groundwater-altitude values were selected or calculated because that was the daily statistic that was publicly available for most continuously measured wells (U.S. Geological Survey, 2023a). Groundwater-altitude data from 45 of 1,145 manually measured wells and 2 of 38 continuously measured wells were not used in the 2022 potentiometric-surface map (table 1; fig. 4; McGuire and others, 2025).
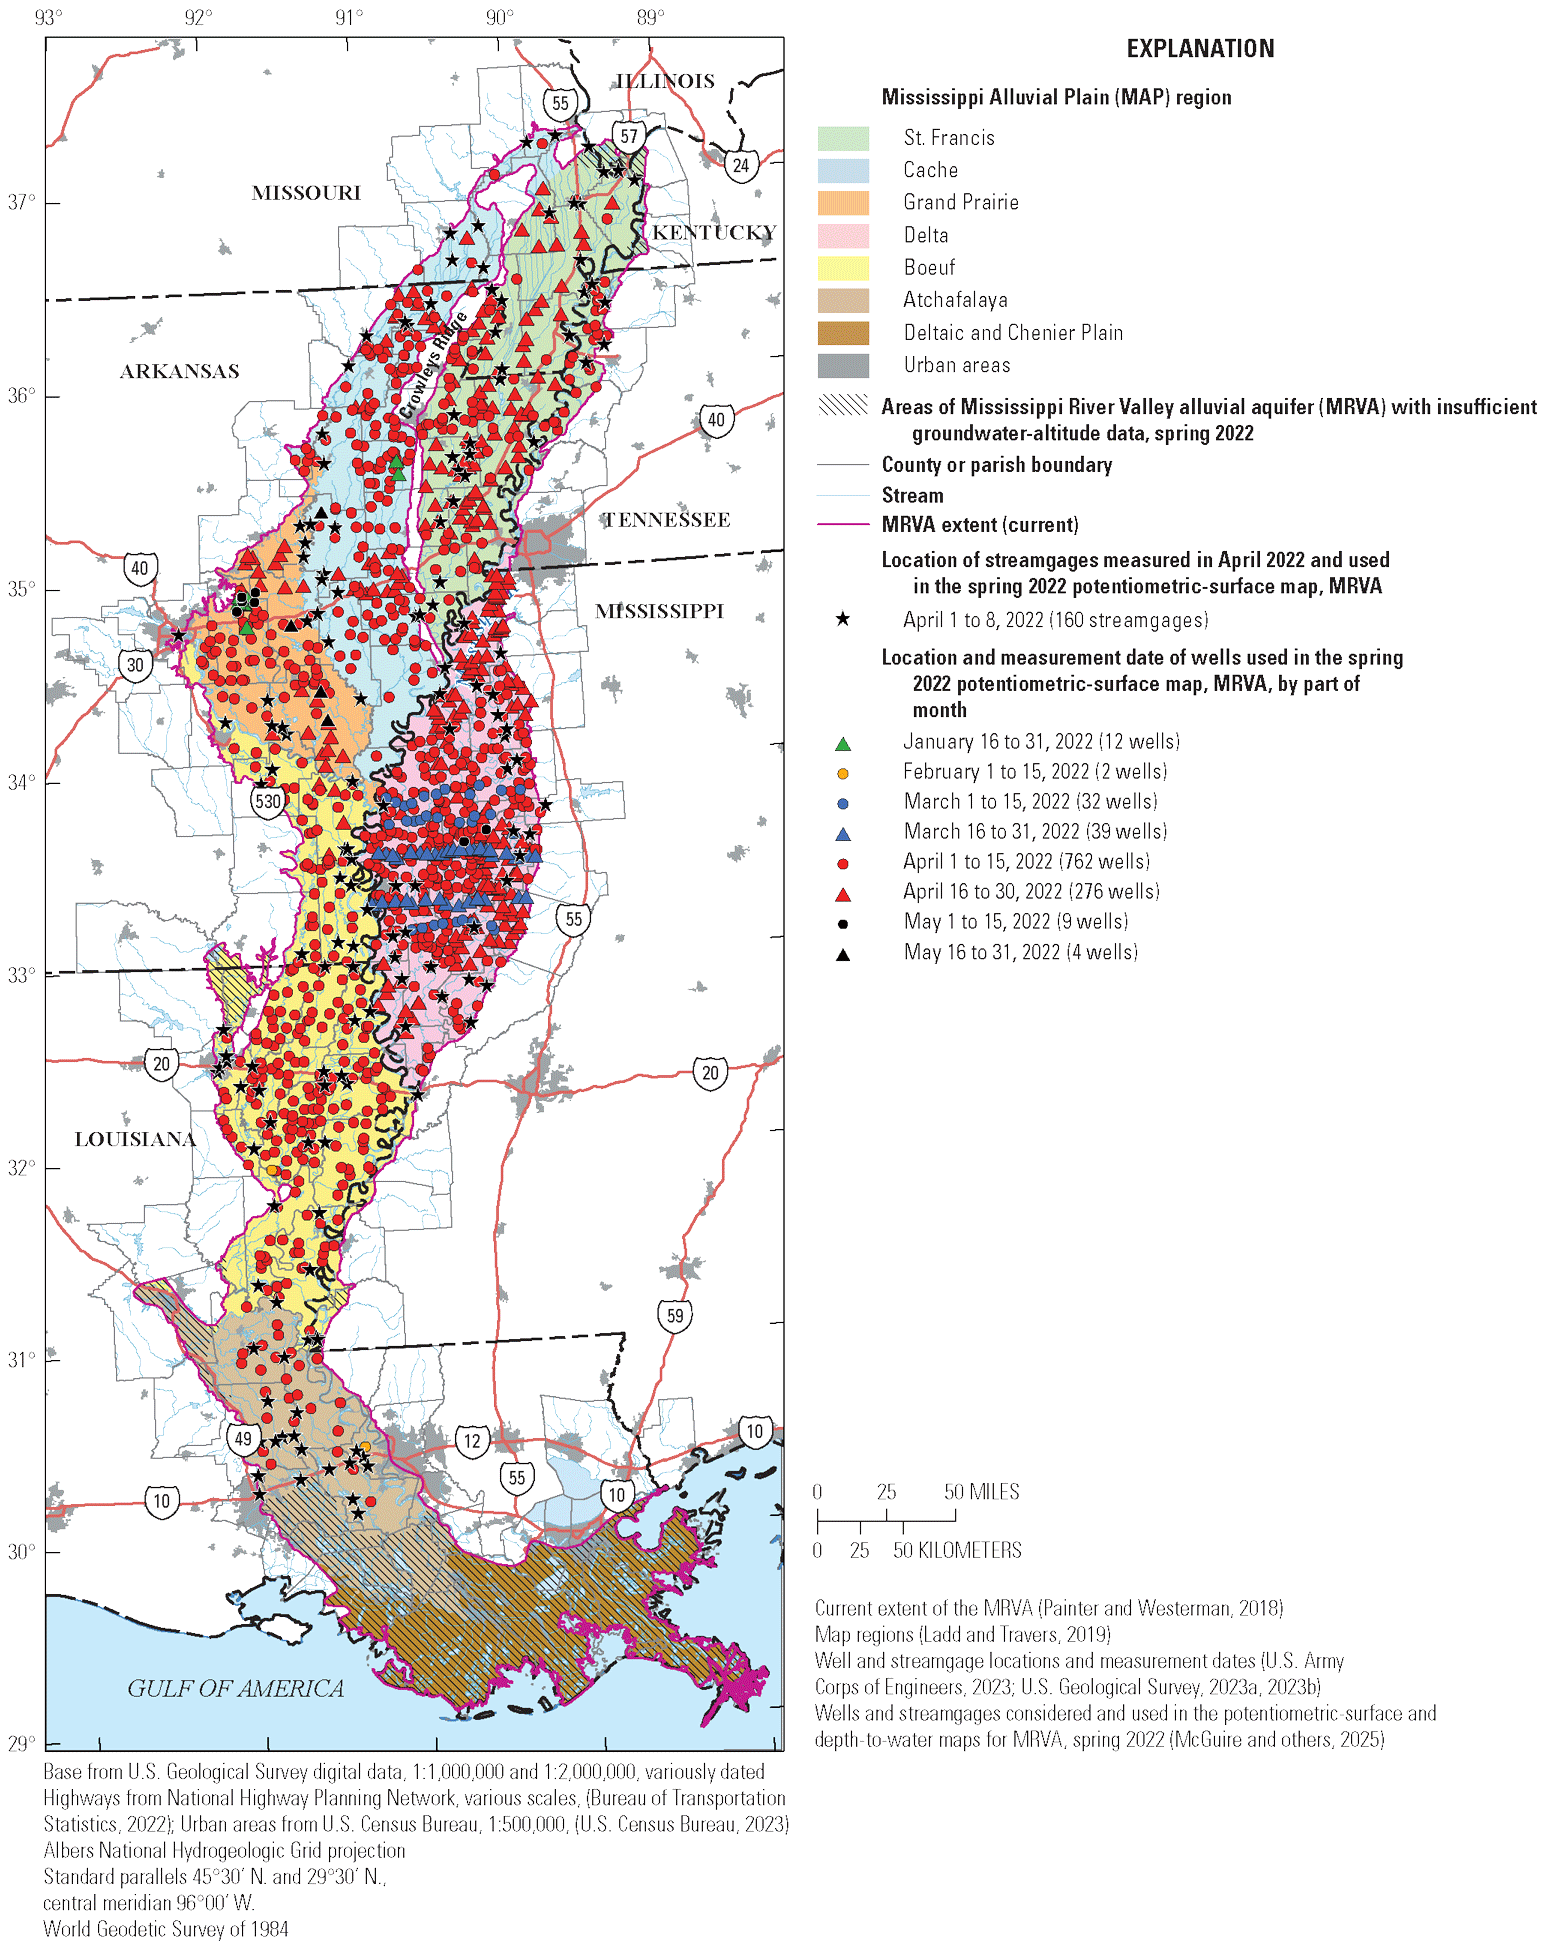
Map showing location of wells with groundwater-altitude values and streamgages with surface-water-altitude values used to create the potentiometric-surface map of the Mississippi River Valley alluvial aquifer (MRVA), spring 2022, and the part of the measurement month for the selected water-level-altitude value.
Table 2.
Summary statistics for water-level measurement dates of water levels used in the spring 2022 potentiometric-surface map for wells that were completed in the Mississippi River Valley alluvial aquifer and measured manually one or more times or continuously as part of groundwater monitoring networks for spring 2022, by Mississippi Alluvial Plain region (Ladd and Travers, 2019; U.S. Geological Survey, 2023a).[MAP, Mississippi Alluvial Plain; minimum, maximum, and median columns are shown in YYYYMMDD format; YYYY, year; MM, month; DD, day; --, no data]
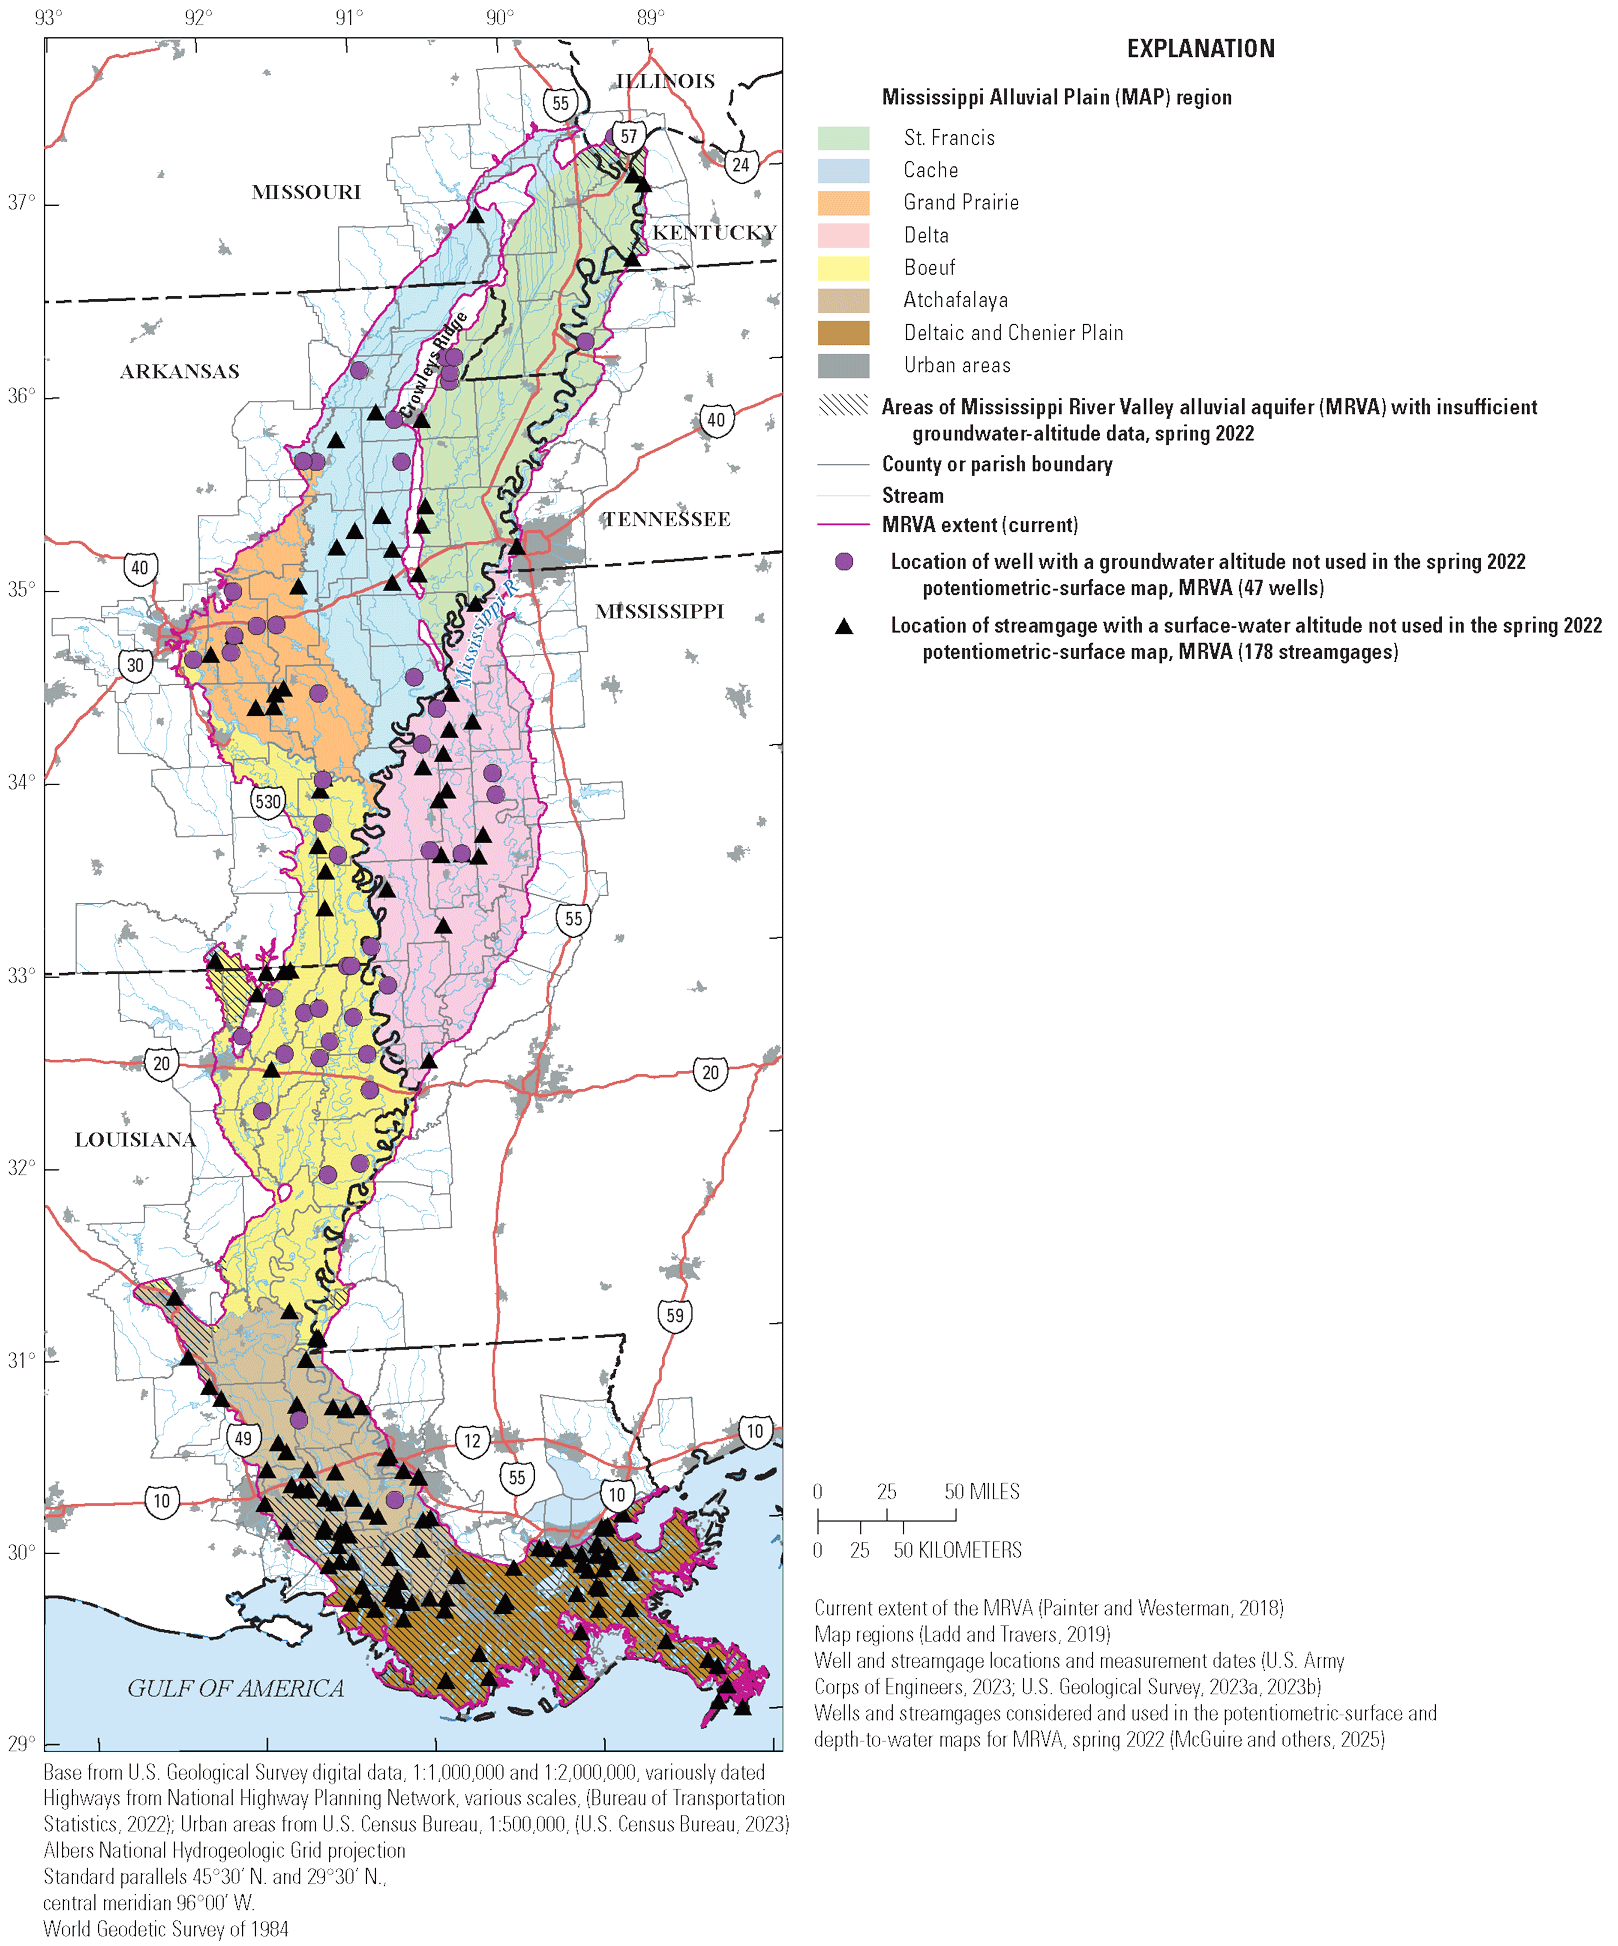
Map showing location of wells with groundwater-altitude values and streamgages with surface-water-altitude values for spring 2022 that were not used to create the potentiometric-surface map of the Mississippi River Valley alluvial aquifer (MRVA), spring 2022.
The distribution of measurement dates for the selected groundwater-altitude values ranged from 0 wells for the first 15 days in January 2022 and for February 16–28, 2022, to 762 wells in the first 15 days of April 2022 (fig. 3). Areas of insufficient groundwater data, which were defined as areas without groundwater-measurement data within a 20 km (12.4 mi) radius of the center of a raster cell, were determined quantitatively. These areas were manually reviewed and modified to exclude small slivers and to include isolated aquifer areas. The distribution of measurement dates (fig. 3) indicated that if only data recorded in a short timeframe, such as the first 15 days in April 2022, were used in the maps then the maps would have had larger areas with insufficient groundwater-altitude data.
Daily mean surface-water-altitude data for 338 streamgages routinely operated by the U.S. Army Corps of Engineers (USACE) and the USGS in the MRVA area were used to create the potentiometric-surface map (table 3; U.S. Army Corps of Engineers, 2023; U.S. Geological Survey, 2023b; McGuire and others, 2025). Streamgage data used to compute water levels at each streamgage included the following: the streamgage altitude, in feet; the associated vertical datum (NGVD 29 or NAVD 88); and, if available, the daily mean river stage on April 8, 2022, for the U.S. Army Corps of Engineers (USACE) and USGS streamgages. If an April 8, 2022, value was not available, then the first available value prior to April 8, 2022, was used. If the vertical datum associated with the streamgage altitude was NGVD 29, the streamgage altitude was converted to NAVD 88 using National Geodetic Survey’s VERTCON program (Miller, 1999).
Table 3.
Total number of streamgages in the Mississippi Alluvial Plain with surface-water-altitudes for spring 2022, and number of surface-water-altitude values, generally for April 8, 2022, used to generate the potentiometric-surface map, spring 2022, for the Mississippi River Valley alluvial aquifer by Mississippi Alluvial Plain region (Ladd and Travers, 2019; U.S. Army Corps of Engineers, 2023; U.S. Geological Survey, 2023b).[MAP, Mississippi Alluvial Plain; MRVA, Mississippi River Valley alluvial aquifer]
Of the 338 streamgages considered for use in the potentiometric-surface map (table 3), a total of 178 streamgages were not used for the 2022 potentiometric-surface map (fig. 4; McGuire and others, 2025). The 178 streamgages were not used for the following reasons:
-
• 103 streamgages were in areas with insufficient groundwater data to substantiate that the surface-water altitude was representative of the groundwater altitude in the area,
-
• 51 streamgages had surface-water altitudes that were much higher than the nearby wells screened in the MRVA, likely either because the surface-water altitude was affected by precipitation events or the MRVA was not connected to the surface water at these locations,
-
• 19 streamgages had surface-water altitude values that were about 10 ft higher than water-level altitudes in nearby wells or streamgages, possibly because the surface-water altitude was affected by precipitation events,
-
• 4 streamgages had surface-water elevations that likely were affected substantially by control structures, and
-
• 1 streamgage with data collected by the U.S. Army Corps of Engineers was not used because those data were also available from the USGS (U.S. Army Corps of Engineers, 2023; U.S. Geological Survey, 2023b). The identification codes [referred to as the site badge in McGuire and others (2024)] for this streamgage are USCE:CE3EB344, which is assigned by the USACE, and USGS:07288000, which is the USGS agency code and site number.
There were 160 streamgages used to create the 2022 potentiometric-surface map (fig. 3; McGuire and others, 2025). These streamgages had nearby groundwater-altitude data for 2022 and were assumed to be hydrologically connected to the aquifer. The daily mean surface-water altitude value was retrieved or computed for April 2, 2022, for one streamgage and April 8, 2022, for 159 streamgages. Surface-water-altitudes were considered approximations of the groundwater altitudes at the river locations.
Characterizing the 2022 Potentiometric-Surface Raster and Contours
The potentiometric-surface raster and contours were generated using source files of selected groundwater- and surface-water-altitude data for spring 2022 (tables 1, 3; McGuire and others, 2025). About 83 percent of the aquifer area had sufficient groundwater data for 2022 (fig. 1) to create a potentiometric-surface map for spring 2022. Five potentiometric maps were created from the raster data: one for the entire MRVA; one for the St. Francis and Cache MAP regions in the north; one for the Boeuf and Grand Prairie MAP regions in the west-central area; one for the Delta MAP region in the east-central area; and one for the Atchafalaya, Deltaic, and Chenier Plains MAP regions in the south. The maps are scaled to 1:625,000 to allow for the display of water-level altitudes.
The potentiometric-surface raster was compared to a digital elevation model (DEM) of land surface with a cell size of 10 m2 (U.S. Geological Survey, 2021). The objective of this process was to identify areas in the DEM where the potentiometric-surface raster was above the DEM and then to qualitatively review these areas. It was expected that, in some areas, the potentiometric-surface raster would be above the DEM primarily because of differences in the resolution of these rasters. Refer to section “Potentiometric-Surface Map, Spring 2022” for the results of this comparison.
James and Minsley (2021) used geophysical methods to map the existence and thickness of confining units from land surface to about 50 ft below land surface for 100 percent of the MRVA area, excluding the areas of insufficient groundwater data. James and Minsley (2021) found confining units in 48 percent of the evaluated MRVA area. The potentiometric-surface raster for 2022 was compared to the altitude of the bottom of these confining units to identify areas where the potentiometric surface was above or below the altitude of the bottom of the confining unit. No changes were made to the potentiometric-surface raster for 2022 because of this comparison. Results of this comparison are discussed in the “Potentiometric-Surface Map, Spring 2022” section.
The potentiometric-surface raster was also compared to a raster of the aquifer base altitude from Torak and Painter (2019) to identify potential areas where the potentiometric-surface raster was below the aquifer-base raster. Refer to section “Potentiometric-Surface Map, Spring 2022” for the results of this comparison.
Potentiometric-surface raster cell values based on interpolation may be different than corresponding groundwater- and surface-water-altitude values based on measurements. This difference is partly because the cell values represent the interpolated value for the cell area, and the measured values are values at specific locations within the area represented by the cell.
To assess the uncertainty in the final potentiometric-surface raster and contours, the water-level-altitude values for the 1,136 wells used in the potentiometric-surface map and the 47 wells not used to generate the potentiometric-surface raster were compared to the potentiometric-surface raster value corresponding to the well location (McGuire and others, 2025). For each unused well, the root mean square error (RMSE) and bias were calculated for the difference between the manually measured water-level altitude and the value extracted from the potentiometric-surface raster generated using the contours and point values (Helsel and Hirsch, 2002). Results of this comparison are discussed in the “Potentiometric-Surface Map, Spring 2022” section.
Characterizing the 2022 Depth-to-Water Raster
The depth-to-water raster for the MRVA for spring 2022 was generated using the same source files of selected groundwater- and surface-water altitudes that were used for the 2022 potentiometric-surface map, along with the land-surface altitudes for these wells (tables 1, 3; McGuire and others, 2025). For the selected wells, depth to water was calculated by subtracting groundwater altitude from land-surface altitude. For the selected streamgages, depth to water was assumed to be zero. The depth-to-water raster was not defined in areas with insufficient groundwater data for 2022 calculated as discussed in the “Data and Methods” section (fig. 1). Cell values in the depth-to-water raster were zero or negative when the estimated water level was at or above land surface. Cell values in the depth-to-water raster are positive when the estimated water level was below land surface.
Depth-to-water raster cell values based on interpolation may be different than collocated groundwater- and surface-water-altitude values based on measurements in wells and the assumed depth to water of zero for streamgages. This difference is partly because the cell values represent the interpolated value for the cell area, and the measured or assumed values are values at a well or streamgage within the area represented by the cell.
To assess the uncertainty in the final depth-to-water raster, the depth-to-water values, derived from land-surface and water-level altitudes for the 1,136 wells used in the depth-to-water map and the 47 wells not used to generate the depth-to-water raster were compared to the depth-to-water raster value in the cell where the unused well was located (McGuire and others, 2025). Refer to the “Water-Level Data” section for a discussion of why water-level measurements were excluded from the potentiometric-surface and depth-to-water maps. For each unused well, the RMSE and bias were calculated for the differences between the depth-to-water values calculated from the manually measured water-level altitudes and the values extracted from the depth-to-water raster generated using the point values (Helsel and Hirsch, 2002).
Potentiometric-Surface Map, Spring 2022
The potentiometric-surface map for the MRVA (sheet 1, available for download at https://doi.org/10.3133/sim3532) for spring 2022 had contours that ranged from 0 to 340 ft above NAVD 88. The regional direction of the groundwater gradient was to the south-southwest, except in areas of groundwater-altitude depressions (sheet 1, available for download at https://doi.org/10.3133/sim3532), where the groundwater gradient was into the depression. Near rivers, the direction of groundwater gradient generally was parallel to the rivers. However, in some areas, the groundwater gradient was from the aquifer into the river or from the river into the aquifer.
The 2022 potentiometric surface was above land surface in 9 percent of the aquifer area, not including the areas of insufficient groundwater data. The areas where the potentiometric surface was above land surface were primarily in river valleys (fig. 5).
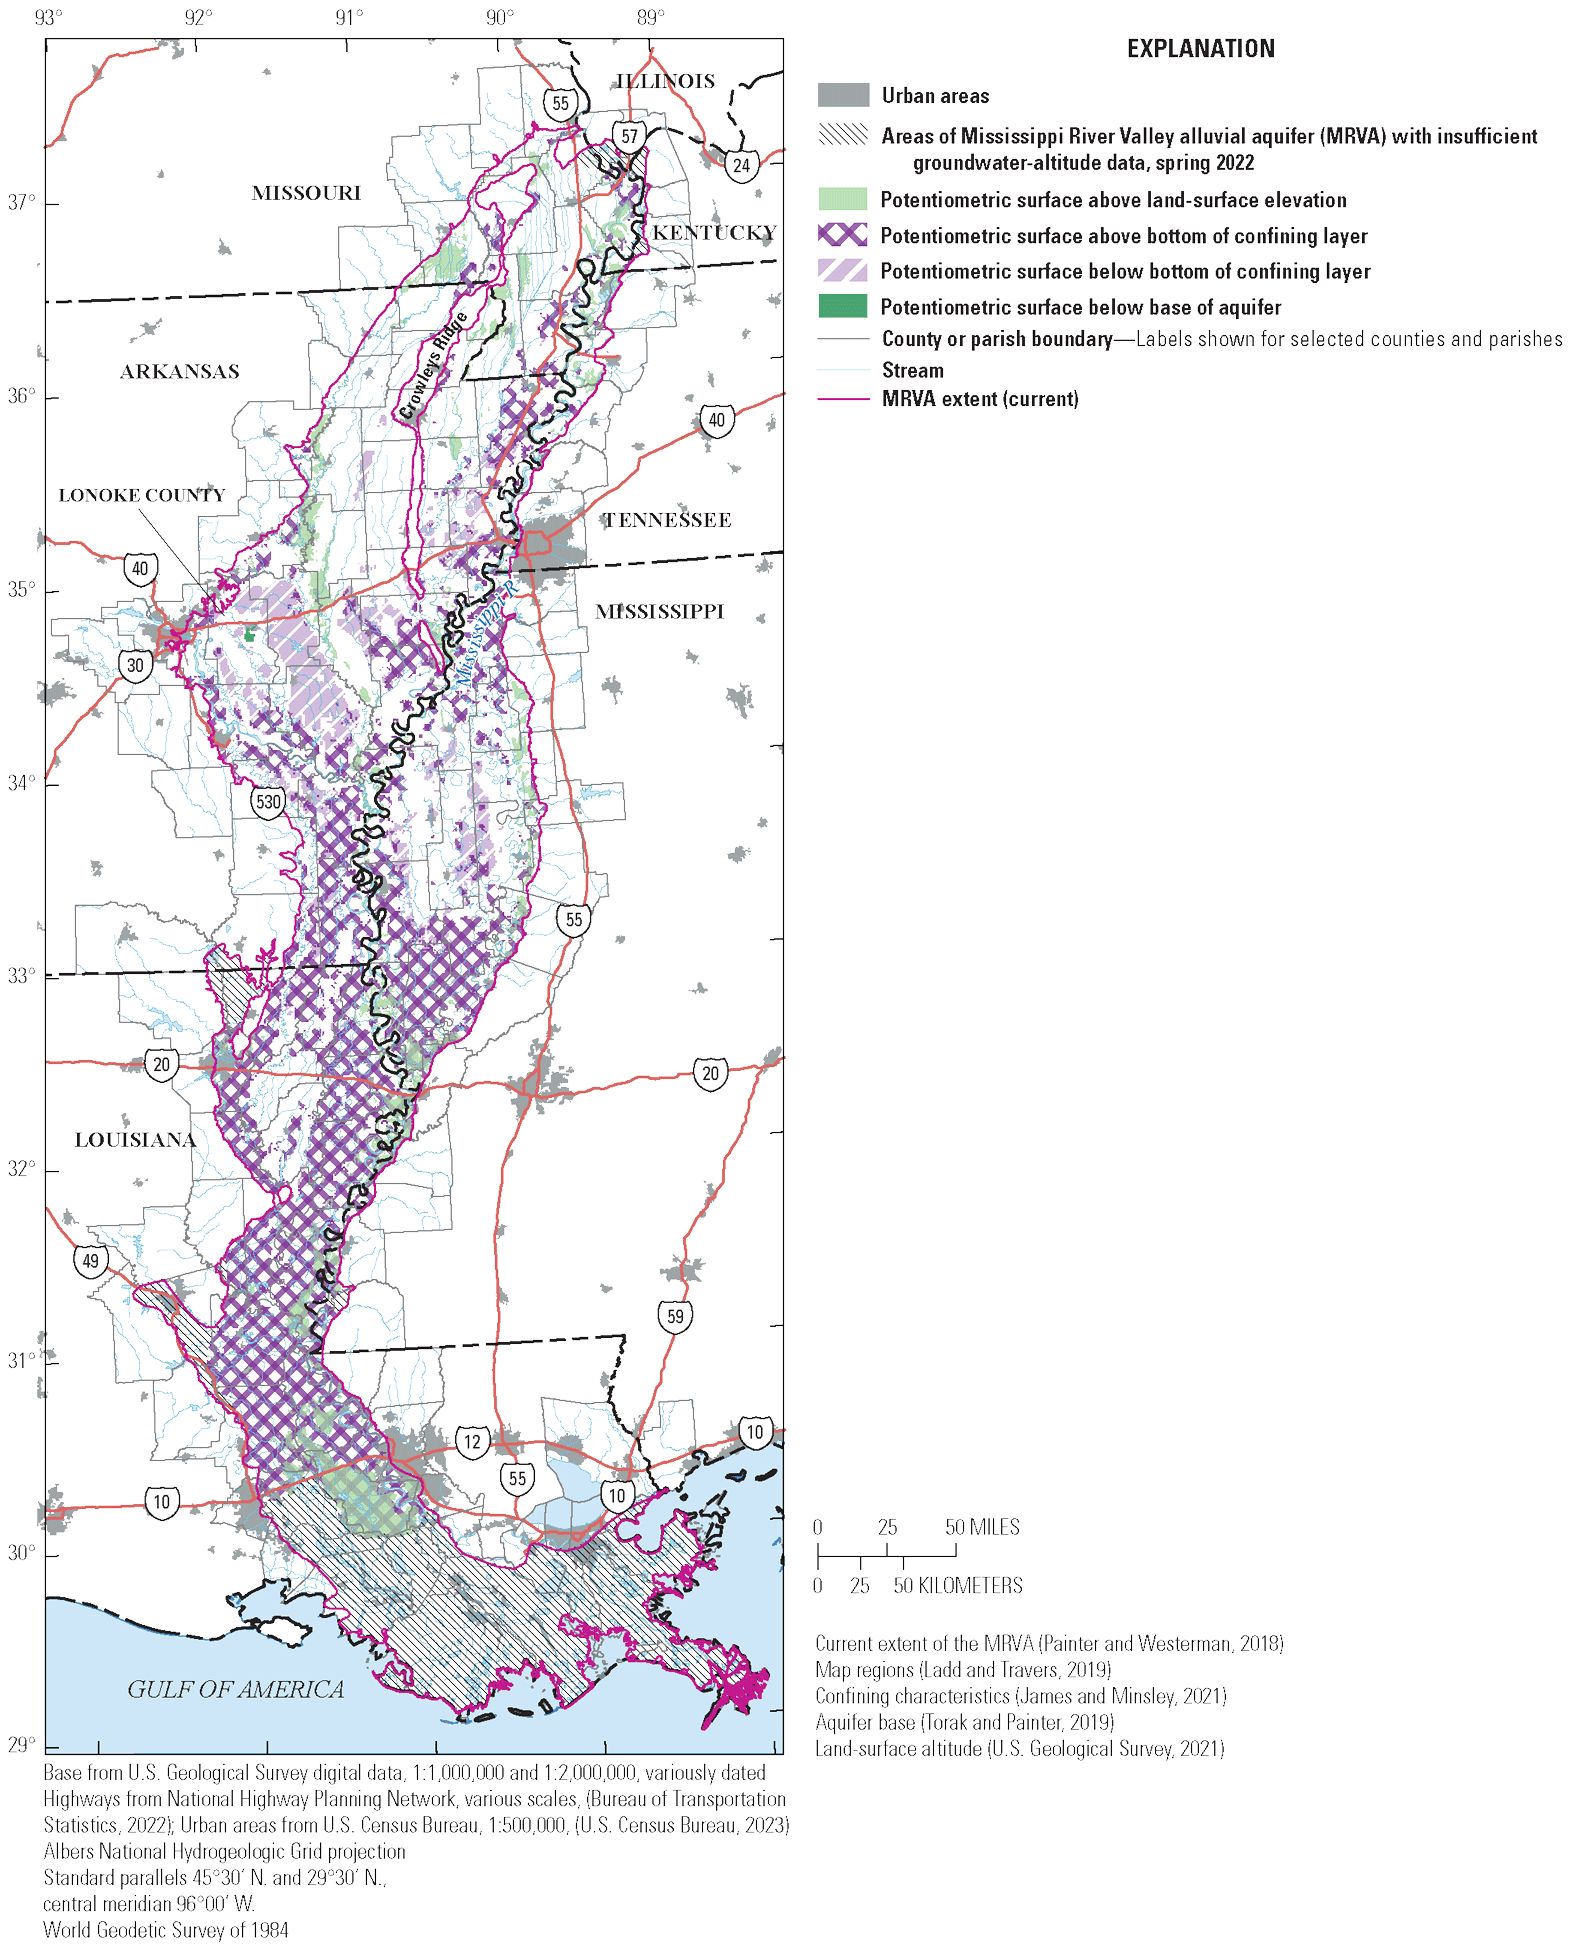
Map showing location of areas where the potentiometric surface is above land surface, above or below the bottom of the confining layer, and below the base of aquifer, Mississippi River Valley alluvial aquifer (MRVA), spring 2022.
The 2022 potentiometric surface was above the altitude of the bottom of the confining units in 39 percent of the aquifer area in which confining units were mapped from land surface to about 50 ft below land surface (fig. 5; James and Minsley, 2021). The areas where the potentiometric surface was above the altitude of the bottom of the confining units were primarily in southeastern Arkansas, northeastern Louisiana, and southwestern Mississippi. The areas where the potentiometric surface was below the altitude of the bottom of the confining units were primarily in the depressions in the potentiometric surface in east-central Arkansas and west-central Mississippi.
The potentiometric-surface raster was as much as 8 ft below the aquifer base altitude in an approximate 17 mi2 area in the south-central part of Lonoke County, Arkansas (fig. 5). In this area, water-level altitudes from four wells were used to generate the potentiometric-surface raster. The well identification code for these wells [termed “site badge in “McGuire and others (2024)] and the depth of the water-level altitude below the aquifer base for each well are USSCS:344253091483101 (1.16 ft), AR008:344643091500201 (0.80 ft), USGS:344648091494601 (0.80 ft), and USGS:344651091460301 (3.97 ft). No changes were made to the potentiometric-surface raster as a result of this comparison because additional data are needed to better define the aquifer base and to validate that these well are screened only in the MRVA.
The lowest measured groundwater altitude was in Saint Landry Parish, Louisiana, and the highest was in Bollinger County, Missouri. The lowest measured surface-water altitude was in West Baton Rouge Parish, La., and the highest was in Cape Girardeau County, Mo. (McGuire and others, 2025). Based on groundwater- and surface-water-altitude measurements for spring 2022, the MRVA is connected to surface-water features in some areas and disconnected in other areas at least during part of the year; however, the extent of the degree of connectivity of these areas cannot be determined from the maps.
The RMSE for the difference between the measured water-level altitude for the 1,095 manually and 36 continuously measured wells, which were used in the potentiometric-surface map and were located in a raster cell with a potentiometric-surface value, was 1.30 ft with a bias of 0.06 ft. Five of the manually measured wells used in the 2022 potentiometric-surface map were in raster cells where the potentiometric-surface value was not defined. The RMSE and bias for the differences between the measured water-level altitude and potentiometric-surface raster values for the 45 manually and 2 continuously measured wells, which were in a raster cell with a potentiometric-surface value but were not used in the potentiometric-surface map because they were rejected for reasons discussed in the “Water-Level Data” section, were 27.03 and −5.10 ft, respectively.
The spring 2022 potentiometric contours in the Cache region ranged from 120 to 340 ft above NAVD 88 and show a large depression in the lower one-half of the Cache region (sheet 2, available for download at https://doi.org/10.3133/sim3532). The lowest measured groundwater altitude was 118.06 ft in a depression in Poinsett County, Ark., and the highest measured groundwater altitude was 339.71 ft in Bollinger County, Mo. The lowest measured surface-water altitude was 167.45 ft in Monroe County, Ark., and the highest was 342.13 ft in Cape Girardeau County, Mo. (McGuire and others, 2025). The groundwater gradient in the Cache region generally was to the south-southwest or into the depression in the southern part of the region.
The spring 2022 potentiometric contours in the St. Francis region ranged from 170 to 310 ft above NAVD 88 (sheet 2, available for download at https://doi.org/10.3133/sim3532). The lowest measured groundwater altitude was 164.36 ft in St. Francis County, Ark., and the highest measured groundwater altitude was 311.38 ft in Mississippi County, Mo. The lowest measured surface-water altitude was 168.53 ft in Phillips County, Ark., and the highest was 324.40 ft in Scott County, Mo. (McGuire and others, 2025). The groundwater gradient in the St. Francis region generally was to the south-southwest.
The spring 2022 potentiometric contours in the Boeuf region ranged from 30 to 230 ft above NAVD 88 (sheet 3, available for download at https://doi.org/10.3133/sim3532). The lowest measured groundwater altitude was 26.77 ft in Concordia Parish, La., and the highest measured groundwater altitude was 186.82 ft in Jefferson County, Ark. The lowest measured surface-water altitude was 31.28 ft in Concordia Parish, La., and the highest was 231.91 ft in Pulaski County, Ark. (McGuire and others, 2025). The groundwater gradient in the Boeuf region is to the southeast, southwest, south, and into the depressions.
The spring 2022 potentiometric contours in the Grand Prairie region ranged from 90 to 230 ft above NAVD 88; there is a large depression in the potentiometric surface within the region (sheet 3, available for download at https://doi.org/10.3133/sim3532). The lowest measured groundwater altitude was 83.29 ft in Lonoke County, Ark., and the highest measured groundwater altitude was 230.13 ft in Pulaski County, Ark. The lowest measured surface-water altitude was 154.74 ft in Arkansas County, Ark., and the highest was 199.95 ft in White County, Ark. (McGuire and others, 2025). The groundwater gradient in the Grand Prairie region generally was into the depression that encompasses most of the region.
The spring 2022 potentiometric contours in the Delta region ranged from 70 to 200 ft above NAVD 88. Potentiometric contours indicated a large groundwater depression in the central part of the region (sheet 4, available for download at https://doi.org/10.3133/sim3532). The lowest measured groundwater altitude was 63.67 ft in Sunflower County, Mississippi, and the highest measured groundwater altitude was 198.36 ft in DeSoto County, Miss. The lowest measured surface-water altitude was 87.17 ft in Sharkey County, Miss., and the highest was 178.94 ft in Tunica County, Miss. (McGuire and others, 2025). The groundwater gradient in the Delta region generally was into the large depression at the center of the region.
For most of the Atchafalaya region and all the Deltaic and Chenier Plains region, potentiometric-surface map of conditions in the spring of 2022 could not be created because of insufficient groundwater-altitude data (sheet 5, available for download at https://doi.org/10.3133/sim3532). In the part of the Atchafalaya region with sufficient data, potentiometric contours ranged from 0 to 40 ft above NAVD 88 (sheet 5, available for download at https://doi.org/10.3133/sim3532). The lowest measured groundwater altitude was 0.13 ft in Saint Landry Parish, La., and the highest measured groundwater altitude was 43.95 ft in Avoyelles Parish, La. The lowest measured surface-water altitude was 2.93 ft in West Baton Rouge Parish, La., and the highest was 32.41 ft in Avoyelles Parish, La. (McGuire and others, 2025). The groundwater gradient in the mapped area was generally toward the south and southwest.
Depth to Water, Spring 2022
Depth to water in the MRVA for spring of 2022 ranged from 5.00 ft above land surface to 145.66 ft below land surface for values from measured wells and from 0.76 ft above land surface to 145.18 ft below land surface in the interpolated raster (McGuire and others, 2025). In the interpolated raster, the percent of aquifer area, not including the areas with insufficient groundwater-altitude data, in each depth category ranged from 1 percent of the aquifer area with water levels above land surface to 37 percent of aquifer area with depth-to-water values ranging from 10 to 25 ft below land surface (fig. 6). The deepest water levels were more than 100 ft below land surface and were in 2 percent of the MRVA area. The deepest water levels were near Crowleys Ridge and in the central west part of the MRVA.
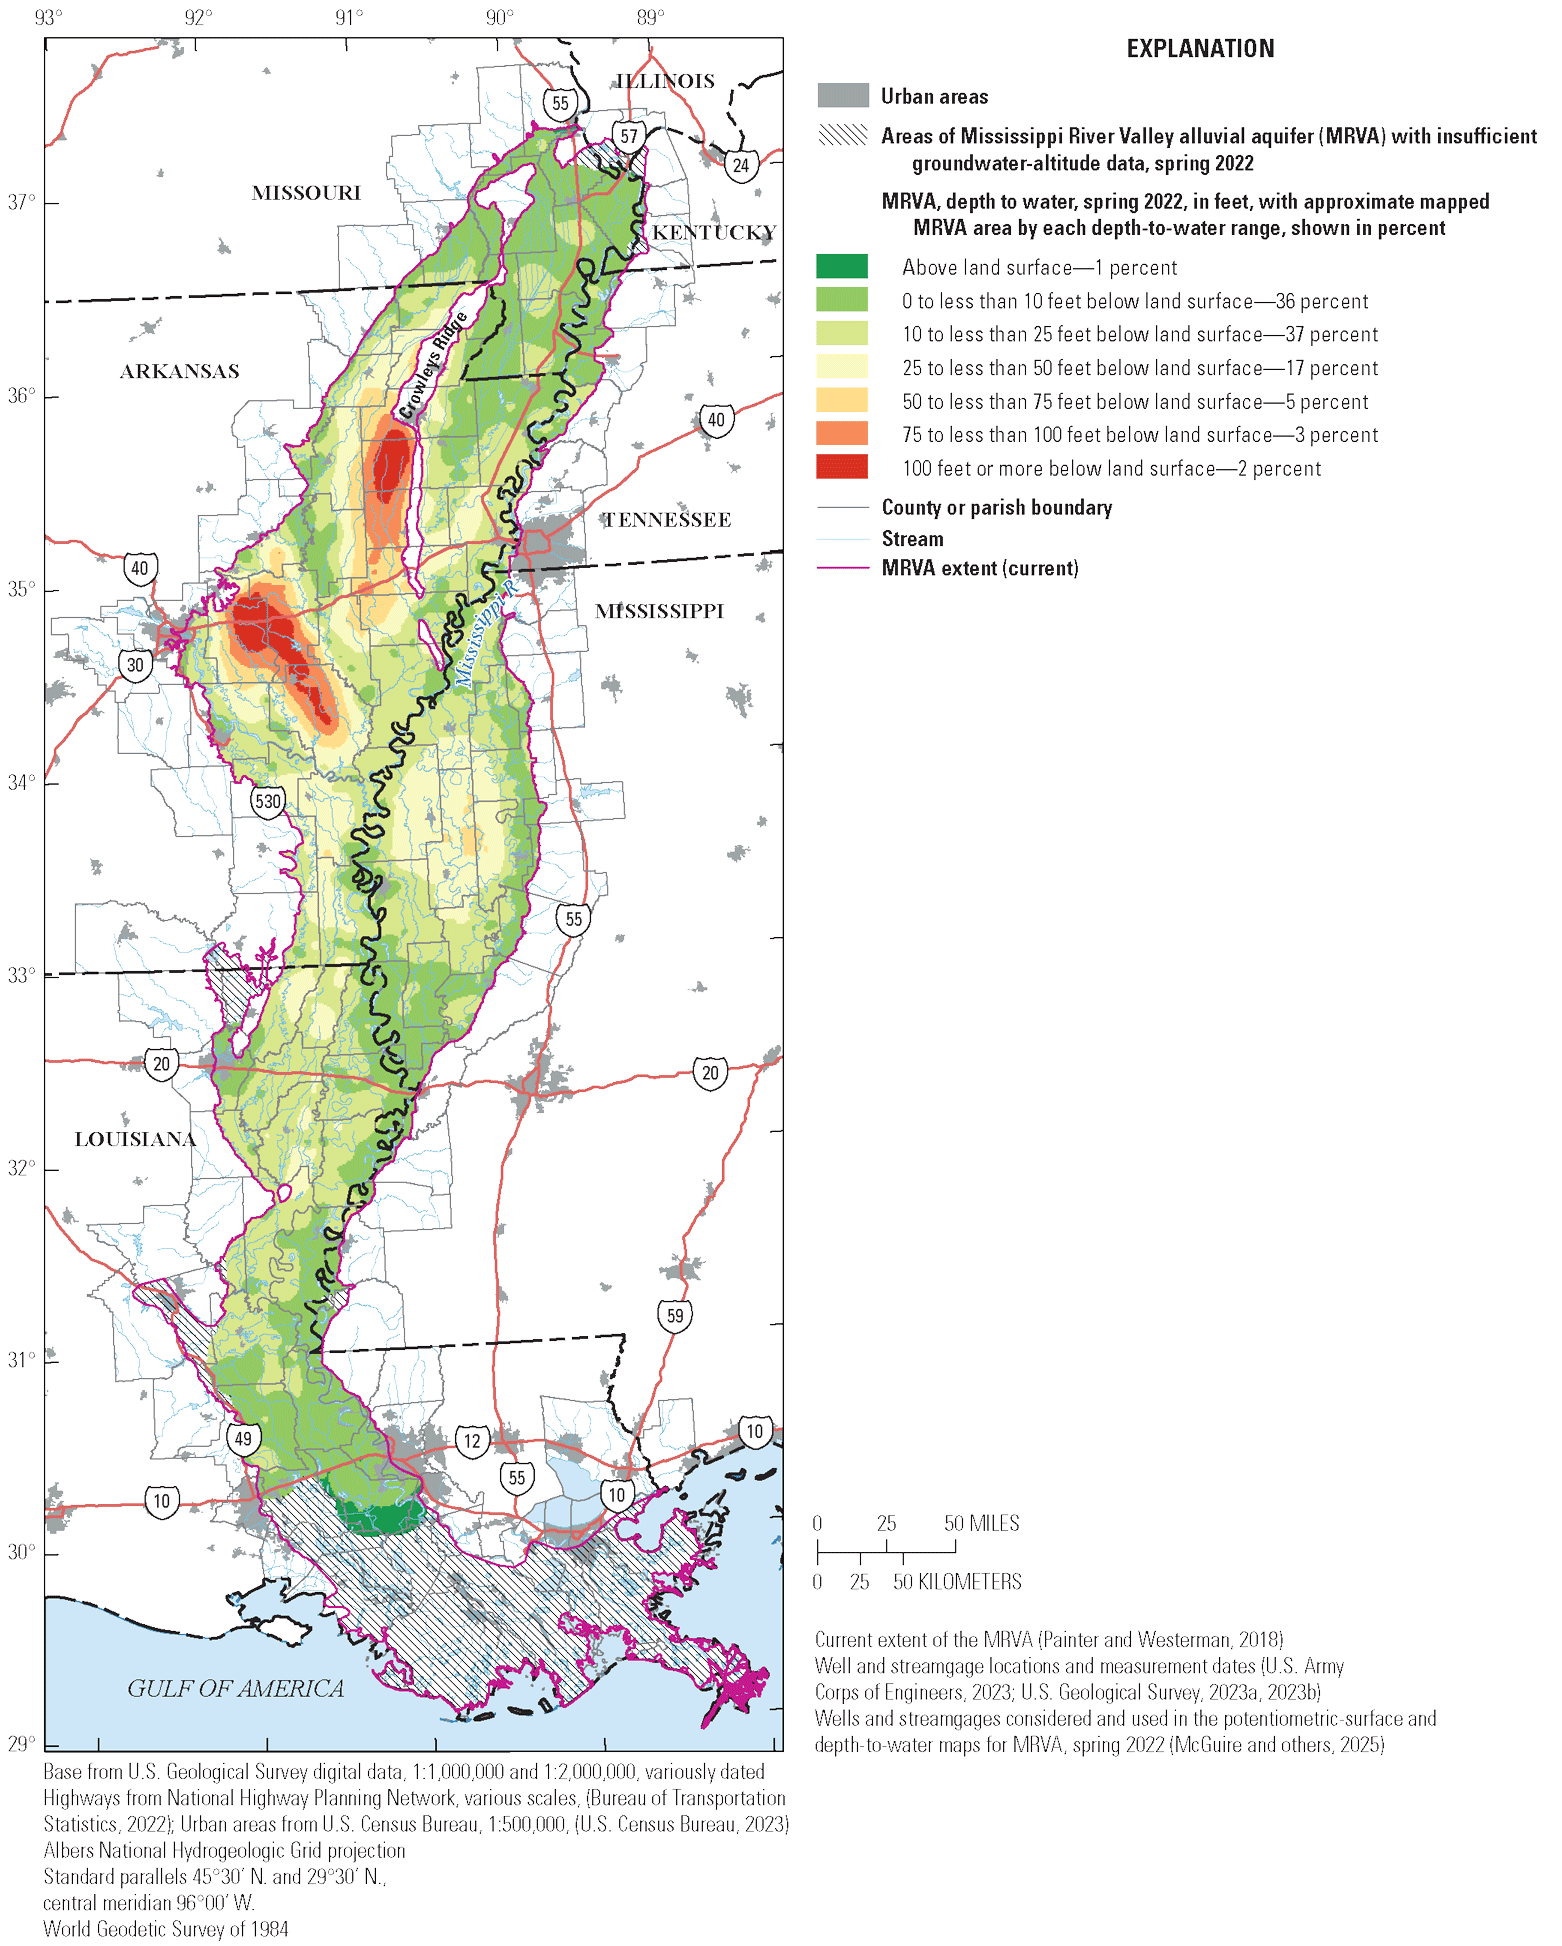
Map showing depth to water from land surface, in feet, Mississippi River Valley alluvial aquifer (MRVA), spring 2022.
Summary
Potentiometric-surface and depth-to-water maps for spring 2022 were created for the Mississippi River Valley alluvial aquifer (MRVA) using groundwater-altitude data from 1,136 wells completed in the MRVA and from the altitude of the top of the water surface in area rivers from 160 streamgages. The groundwater- and surface-water altitude data and the potentiometric surface map were referenced to the North American Vertical Datum of 1988. The potentiometric-surface and depth-to-water maps for 2022 were created to support investigations to characterize the MRVA as part of the U.S. Geological Survey Water Availability and Use Science Program.
Sufficient data were available to map the potentiometric surface and depth to water of the MRVA for spring 2022 for about 83 percent of the aquifer area. The lowest measured groundwater altitude was 0.13 feet (ft) in Saint Landry Parish, Louisiana, and the highest was 339.71 ft in Bollinger County, Missouri; the lowest measured surface-water altitude was 2.93 ft in West Baton Rouge Parish, La., and the highest was 342.13 ft in Cape Girardeau County, Mo. The potentiometric contours ranged from 0 to 340 ft. The regional direction of groundwater gradient was generally to the south-southwest, except in areas of groundwater-altitude depressions, where the groundwater gradient was into the depression, and near rivers, where the groundwater gradient can be from aquifer to the river or from the river into the aquifer. There are large depressions in the potentiometric-surface map in the lower one-half of the Cache region and in most of the Grand Prairie and Delta regions.
Depth to water in the MRVA, spring 2022, by well ranged from 5.00 ft above land surface to 145.66 ft below land surface. The percent of aquifer area, not including the areas with insufficient groundwater-altitude data, in each depth-to-water category ranged from 1 percent of the aquifer area with water levels above land surface to 37 percent of aquifer area with depth-to-water values from 10 to 25 ft below land surface.
References Cited
Ackerman, D.J., 1989, Hydrology of the Mississippi River Valley alluvial aquifer, south-central United States—A preliminary assessment of the regional flow system: U.S. Geological Survey Water-Resources Investigations Report 88–4028, 74 p. [Also available at https://doi.org/10.3133/wri884028.]
Ackerman, D.J., 1996, Hydrology of the Mississippi River Valley alluvial aquifer, south-central United States: U.S. Geological Survey Professional Paper 1416–D, 53 p., 8 pls. [Also available at https://doi.org/10.3133/pp1416D.]
Albin, D.R., Hines, M.S., and Stephens, J.W., 1967, Water resources of Jackson and Independence Counties, Arkansas: U.S. Geological Survey Water Supply Paper 1839–G, 29 p. [Also available at https://doi.org/10.3133/wsp1839G.]
Asquith, W.H., Seanor, R.C., McGuire, V.L., and Kress, W.H., 2019, Source code in R to quality assure, plot, summarize, interpolate, and extend groundwater-level information, visGWDB—Groundwater-level informatics with demonstration for the Mississippi River Valley alluvial aquifer: U.S. Geological Survey software release, accessed September 2023 at https://doi.org/10.5066/P9W004O6.
Boswell, E.H., Cushing, E.M., Hosman, R.L., and Jeffery, H.G., 1968, Quaternary aquifers in the Mississippi embayment, with a discussion of quality of the water: U.S. Geological Survey Professional Paper 448–E, 15 p., 2 pls. [Also available at https://doi.org/10.3133/pp448E.]
Bureau of Transportation Statistics, 2022, National Highway Planning Network (NHPN): Bureau of Transportation Statistics digital data, accessed March 29, 2024, at https://doi.org/10.21949/1522161.
Clark, B.R., Barlow, P.M., Peterson, S.M., Hughes, J.D., Reeves, H.W., and Viger, R.J., 2018, National-scale grid to support regional groundwater availability studies and a national hydrogeologic database: U.S. Geological Survey data release, accessed August 2018 at https://doi.org/10.5066/F7P84B24.
Clark, B.R., Hart, R.M., and Gurdak, J.J., 2011, Groundwater availability of the Mississippi embayment: U.S. Geological Survey Professional Paper 1785, 62 p. [Also available at https://doi.org/10.3133/pp1785.]
Dalsin, G.J., 1978, The Mississippi River Valley alluvial aquifer in Mississippi: U.S. Geological Survey Water-Resources Investigations Report 78–106, 2 pls. [Also available at https://doi.org/10.3133/wri78106.]
Darden, D., 1981, Water-level map of the Mississippi delta alluvium in northwestern Mississippi, April 1981: U.S. Geological Survey Open-File Report 81–1123, 1 pl. [Also available at https://doi.org/10.3133/ofr811123.]
Darden, D., 1982a, Water-level maps of the alluvial aquifer, northwestern Mississippi, September 1981: U.S. Geological Survey Open-File Report 82–574, 1 pl. [Also available at https://doi.org/10.3133/ofr82574.]
Darden, D., 1982b, Water-level maps of the alluvial aquifer, northwestern Mississippi, April 1982: U.S. Geological Survey Water-Resources Investigations Report 82–4061, 1 pl. [Also available at https://doi.org/10.3133/wri824061.]
Darden, D., 1983, Water-level maps of the alluvial aquifer, northwestern Mississippi, September 1982: U.S. Geological Survey Water-Resources Investigations Report 83–4133, 1 pl. [Also available at https://doi.org/10.3133/wri834133.]
Edds, J., and Fitzpatrick, D.J., 1984, Maps showing altitude of the potentiometric surface and changes in water levels of the alluvial aquifer in eastern Arkansas, Spring 1983: U.S. Geological Survey Water-Resources Investigations Report 84–4264, 1 pl. [Also available at https://doi.org/10.3133/wri844264.]
Engler, K., Bayley, F.H., III, and Sniegocki, R.T., 1963, Studies of artificial recharge in the Grand Prairie region, Arkansas; environment and history: U.S. Geological Survey Water Supply Paper 1615–A, 32 p., 4 pls. [Also available at https://doi.org/10.3133/wsp1615A.]
Fenneman, N.M., and Johnson, D.W., 1946, Physiographic divisions of the conterminous U.S: U.S. Geological Survey data release, accessed October 2019 at https://doi.org/10.5066/P9B1S3K8.
Helsel, D.R., and Hirsch, R.M., 2002, Statistical methods in water resources: U.S. Geological Survey Techniques of Water-Resources Investigations, book 4, chap. A3, 523 p.[Superseded in 2020 by version 1.1, which is https://doi.org/10.3133/tm4A3.]
Hosman, R.L., and Weiss, J.S., 1991, Geohydrologic units of the Mississippi embayment and Texas coastal uplands aquifer systems, south-central United States: U.S. Geological Survey Professional Paper 1416–B, 19 p. [Also available at https://doi.org/10.3133/pp1416B.]
Hutchinson, M.F., 1988, Calculation of hydrologically sound digital elevation models, in Third International Symposium on Spatial Data Handling, August 17–19, 1988, Sydney, Australia, [Proceedings]: International Geographical Union, Commission on Geographical Data Sensing and Processing, Department of Geography, Ohio State University, p. 117–133.
Hutchinson, M.F., 1989, A new procedure for gridding elevation and stream line data with automatic removal of spurious pits: Journal of Hydrology, v. 106, no. 3–4, p. 211–232. [Also available at https://doi.org/10.1016/0022-1694(89)90073-5.]
Hutchinson, M.F., 2000, Optimising the degree of data smoothing for locally adaptive finite element bivariate smoothing splines: The ANZIAM Journal, v. 42(E), p. C774–C796, accessed January 2021 at https://doi.org/10.21914/anziamj.v42i0.621.
James, S.R., and Minsley, B.J., 2021, Combined results and derivative products of hydrogeologic structure and properties from airborne electromagnetic surveys in the Mississippi Alluvial Plain (ver. 2, July 2024): U.S. Geological Survey data release, accessed January 2024 at https://doi.org/10.5066/P9382RCI.
Joseph, R.L., 1999, Status of water levels and selected water-quality conditions in the Mississippi River Valley alluvial aquifer in eastern Arkansas, 1998: U.S. Geological Survey Water-Resources Investigations Report 99–4035, 2 pl., 54 p. [Also available at https://doi.org/10.3133/wri994035.]
Kleiss, B.A., Coupe, R.H., Gonthier, G.J., and Justus, B.J., 2000, Water quality in the Mississippi embayment, Mississippi, Louisiana, Arkansas, Missouri, Tennessee, and Kentucky, 1995–98: U.S. Geological Survey Circular 1208, 36 p. [Also available at https://doi.org/10.3133/cir1208.]
Ladd, D.E., and Travers, L.R., 2019, Generalized regions of the Mississippi Alluvial Plain: U.S. Geological Survey data release, accessed April 2019 at https://doi.org/10.5066/P915ZZQM.
Lohman, S.W., 1972, Ground-water hydraulics: U.S. Geological Survey Professional Paper 708, 9 pl., 70 p. [Also available at https://doi.org/10.3133/pp708.]
Lovelace, J.K., Nielsen, M.G., Read, A.L., Murphy, C.J., and Maupin, M.A., 2020, Estimated groundwater withdrawals from principal aquifers in the United States, 2015 (ver. 1.1, June 2020): U.S. Geological Survey Circular 1464, 70 p. [Also available at https://doi.org/10.3133/cir1464.]
McGuire, V.L., Seanor, R.C., Asquith, W.H., Kress, W.H., and Strauch, K.R., 2019, Potentiometric surface of the Mississippi River Valley alluvial aquifer, spring 2016: U.S. Geological Survey Scientific Investigations Map 3439, 14 p., 5 sheets, accessed September 2020 at https://doi.org/10.3133/sim3439.
McGuire, V.L., Seanor, R.C., Asquith, W.H., Nottmeier, A.M., Smith, D.C., Tollett, R.W., Kress, W.H., and Strauch, K.R., 2020, Altitude of the potentiometric surface in the Mississippi River Valley alluvial aquifer, spring 2018: U.S. Geological Survey Scientific Investigations Map 3453, 13 p., 5 sheets, accessed September 2020 at https://doi.org/10.3133/sim3453.
McGuire, V.L., Seanor, R.C., Asquith, W.H., Strauch, K.R., Nottmeier, A.M., Thomas, J.C., Tollett, R.W., and Kress, W.H., 2021, Altitude of the potentiometric surface in the Mississippi River Valley alluvial aquifer, spring 2020: U.S. Geological Survey Scientific Investigations Map 3478, 14 p., 5 sheets, accessed September 2020 at https://doi.org/10.3133/sim3478.
McGuire, V.L., Strauch, K.R., Seanor, R.C., Asquith, W.H., Nottmeier, A.M., Thomas, J.C., Tollett, R.W., and Kress, W.H., 2023, Datasets of depth to water, spring 2016, 2018, and 2020, and spring-to-spring water-level change 2016–18, 2018–20, and 2016–20, Mississippi River Valley alluvial aquifer: U.S. Geological Survey data release, accessed July 2023 at https://doi.org/10.5066/P9HOSTI7.
McGuire, V.L., Strauch, K.R., Wojtylko, E.A., Asquith, W.H., Nottmeier, A.M., Thomas, J.C., Tollett, R.W., Kress, W.H., and Krahulik, J.R., 2025, Datasets used to map the potentiometric surface and depth to water, Mississippi River Valley alluvial aquifer, spring 2022: U.S. Geological Survey data release, https://doi.org/10.5066/P95883TJ.
Miller, D.G., 1999, National Geodetic Survey (NGS) height conversion methodology: National Geodetic Survey’s VERTCON program, accessed February 2024 at https://www.ngs.noaa.gov/cgi-bin/VERTCON/vert_con.prl.
Miller, J.A., and Appel, C.L., 1997, Ground water atlas of the United States—Segment 3, Kansas, Missouri, and Nebraska: U.S. Geological Survey Hydrologic Atlas 730–D, 24 p. [Also available at https://doi.org/10.3133/ha730D.]
Painter, J.A., and Westerman, D.A., 2018, Mississippi alluvial plain extent, November 2017: U.S. Geological Survey data release, accessed March 2018 at https://doi.org/10.5066/F70R9NMJ.
Plafcan, M., and Edds, J., 1986, Water level and saturated thickness maps of the alluvial aquifer in eastern Arkansas, 1984: U.S. Geological Survey Water-Resources Investigations Report 86–4014, 1 pl. [Also available at https://doi.org/10.3133/wri864014.]
Plafcan, M., and Fugitt, D.T., 1987, Water-level maps of the alluvial aquifer in eastern Arkansas, 1985: U.S. Geological Survey Water-Resources Investigations Report 86–4178, 1 pl. [Also available at https://doi.org/10.3133/wri864178.]
Plafcan, M., and Remsing, L.M., 1989, Water-level maps of the Mississippi River Valley alluvial aquifer in eastern Arkansas, 1986: U.S. Geological Survey Water-Resources Investigations Report 88–4067, 1 pl. [Also available at https://doi.org/10.3133/wri884067.]
Plebuch, R.O., and Hines, M.S., 1967, Water resources of Pulaski and Saline Counties, Arkansas: U.S. Geological Survey Water Supply Paper 1839–B, 25 p., 1 pl. [Also available at https://doi.org/10.3133/wsp1839B.]
Reed, T.B., 2004, Status of water levels and selected water-quality conditions in the Mississippi River Valley alluvial aquifer in eastern Arkansas, 2002: U.S. Geological Survey Scientific Investigations Report 2004–5129, 60 p. [Also available at https://doi.org/10.3133/sir20045129.]
Saucier, R.T., 1994, Geomorphology and quaternary geologic history of the lower Mississippi Valley: Vicksburg, Miss., U.S. Army Corps of Engineers, v. 1–2, 414 p., 28 pls., accessed June 2018 at https://biotech.law.lsu.edu/climate/mississippi/sausier/sausier.htm.
Schrader, T.P., 2001, Status of water levels and selected water-quality conditions in the Mississippi River Valley alluvial aquifer in eastern Arkansas, 2000: U.S. Geological Survey Water-Resources Investigations Report 2001–4124, 52 p., 2 pls. [Also available at https://doi.org/10.3133/wri014124.]
Schrader, T.P., 2006, Status of water levels and selected water-quality conditions in the Mississippi River Valley alluvial aquifer in eastern Arkansas, 2004: U.S. Geological Survey Scientific Investigations Report 2006–5128, 82 p., 3 pls. [Also available at https://doi.org/10.3133/sir20065128.]
Schrader, T.P., 2008, Water levels and selected water-quality conditions in the Mississippi River Valley alluvial aquifer in eastern Arkansas, 2006 (ver. 1.0): U.S. Geological Survey Scientific Investigations Report 2008–5092, 75 p., accessed October 2019 at https://doi.org/10.3133/sir20085092.
Schrader, T.P., 2010, Water levels and selected water-quality conditions in the Mississippi River Valley alluvial aquifer in eastern Arkansas, 2008: U.S. Geological Survey Scientific Investigations Report 2010–5140, 71 p., 2 pls. [Also available at https://doi.org/10.3133/sir20105140.]
Schrader, T.P., 2015, Water levels and water quality in the Mississippi River Valley alluvial aquifer in eastern Arkansas, 2012: U.S. Geological Survey Scientific Investigations Report 2015–5059, 63 p., 2 pls., accessed June 2018 at https://doi.org/10.3133/sir20155059.
Seanor, R.C., and Smoot, C.W., 1995, Louisiana ground-water map no. 6—Potentiometric surface, 1990, and water-level changes, 1974–90, of the Mississippi River alluvial aquifer in northeastern Louisiana: U.S. Geological Survey Water-Resources Investigations Report 95–4146, 2 pls., accessed June 2018 at https://doi.org/10.3133/wri954146.
Smoot, C.W., 1986, Louisiana hydrologic atlas map no. 2—Areal extent of freshwater in major aquifers of Louisiana: U.S. Geological Survey Water-Resources Investigations Report 86–4150, 1 pl., accessed July 2019 at https://doi.org/10.3133/wri864150.
Stanton, G.P., Joseph, R.L., and Pugh, A.L., 1998, Status of water levels and selected water-quality conditions in the Mississippi River Valley alluvial aquifer in eastern Arkansas, 1994–1996: U.S. Geological Survey Water-Resources Investigations Report 98–4131, 72 p., 3 pls. [Also available at https://doi.org/10.3133/wri984131.]
Sumner, D.M., 1984, Water-level maps of the alluvial aquifer, northwestern Mississippi, April 1983: U.S. Geological Survey Water-Resources Investigations Report 83–4285, 1 pl. [Also available at https://doi.org/10.3133/wri834285.]
Sumner, D.M., 1985, Water-level maps of the alluvial aquifer, northwestern Mississippi, September 1983: U.S. Geological Survey Water-Resources Investigations Report 84–4346, 1 pl. [Also available at https://doi.org/10.3133/wri844346.]
Torak, L.J., and Painter, J.A., 2019, Digital surfaces of the bottom altitude and thickness of the Mississippi River Valley alluvial aquifer and site data within the Mississippi Alluvial Plain project region: U.S. Geological Survey data release, accessed September 2020 at https://doi.org/10.5066/P9D9XR5F.
U.S. Army Corps of Engineers, 2023, RiverGages.com, Water levels of rivers and lakes: U.S. Army Corps of Engineers digital data, accessed August 2023 at https://rivergages.mvr.usace.army.mil/WaterControl/new/layout.cfm.
U.S. Census Bureau, 2023, TIGER/Line Shapefile 2020 urban areas: U.S. Census Bureau digital data, accessed March 19, 2024, at https://www.census.gov/geographies/mapping-files/2020/geo/tiger-line-file.html.
U.S. Geological Survey, 2000, Mississippi River Valley alluvial aquifer: U.S. Geological Survey data release, accessed January 2024 at https://doi.org/10.5066/P9NAWGUD.
U.S. Geological Survey, 2021, 1/3rd arc-second digital elevation models (DEMs)—USGS National Map 3DEP downloadable data collection: U.S. Geological Survey, accessed September 2021 at https://data.usgs.gov/datacatalog/data/USGS:3a81321b-c153-416f-98b7-cc8e5f0e17c3.
U.S. Geological Survey, 2023a, USGS water data for the Nation: U.S. Geological Survey National Water Information System database, groundwater data, accessed September 2023 at https://doi.org/10.5066/F7P55KJN.
U.S. Geological Survey, 2023b, USGS water data for the Nation: U.S. Geological Survey National Water Information System database, surface-water data, accessed June 2023 at https://doi.org/10.5066/F7P55KJN.
Westerfield, P.W., 1990, Water-level maps of the Mississippi River Valley alluvial aquifer in eastern Arkansas, 1987: U.S. Geological Survey Water-Resources Investigations Report 90–4089, 1 pl. [Also available at https://doi.org/10.3133/wri904089.]
Westerfield, P.W., and Gonthier, G., 1993, Water-level maps of the Mississippi River Valley alluvial aquifer in eastern Arkansas, 1989: U.S. Geological Survey Water-Resources Investigations Report 92–4120, 1 pl. [Also available at https://doi.org/10.3133/wri924120.]
Westerfield, P.W., and Poynter, D.T., 1994, Water-level maps of the Mississippi River Valley alluvial aquifer in eastern Arkansas, spring 1992: U.S. Geological Survey Open-File Report 93–374, 1 pl. [Also available at https://doi.org/10.3133/ofr93374.]
Conversion Factors
U.S. customary units to International System of Units
Datum
Horizontal coordinate information is referenced to the World Geodetic Survey of 1984 (WGS 84). Historical data collected and stored with reference to the North American Datum of 1927 (NAD 27), or the North American Datum of 1983 (NAD 83) were converted to WGS 84 for use in this publication.
Vertical coordinate information was referenced to the North American Vertical Datum of 1988 (NAVD 88). Historical data collected and stored with reference to the National Geodetic Vertical Datum of 1929 (NGVD 29) were converted to NAVD 88 for use in this publication.
Altitude, as used in this report, refers to distance above the vertical datum.
For more information about this publication, contact:
Director, USGS Nebraska Water Science Center
5231 South 19th Street
Lincoln, NE 68512
402–328–4100
For additional information, visit: https://www.usgs.gov/centers/ne-water
Publishing support provided by the
Rolla Publishing Service Center
Disclaimers
Any use of trade, firm, or product names is for descriptive purposes only and does not imply endorsement by the U.S. Government.
Although this information product, for the most part, is in the public domain, it also may contain copyrighted materials as noted in the text. Permission to reproduce copyrighted items must be secured from the copyright owner.
Suggested Citation
McGuire, V.L., Strauch, K.R., Wojtylko, E.A., Asquith, W.H., Nottmeier, A.M., Thomas, J.C., Tollett, R.W., and Kress, W.H., 2025, Altitude of the potentiometric surface and depth to water in the Mississippi River Valley alluvial aquifer, spring 2022: U.S. Geological Survey Scientific Investigations Map 3532, 5 sheets, scales 1:1,000,000 and 1:2,000,000, 19-p. pamphlet, https://doi.org/10.3133/sim3532.
ISSN: 2329-132X (online)
Study Area
| Publication type | Report |
|---|---|
| Publication Subtype | USGS Numbered Series |
| Title | Altitude of the potentiometric surface and depth to water in the Mississippi River Valley alluvial aquifer, spring 2022 |
| Series title | Scientific Investigations Map |
| Series number | 3532 |
| DOI | 10.3133/sim3532 |
| Publication Date | April 16, 2025 |
| Year Published | 2025 |
| Language | English |
| Publisher | U.S. Geological Survey |
| Publisher location | Reston, VA |
| Contributing office(s) | Nebraska Water Science Center |
| Description | Pamphlet: ix, 19 p.; 5 Sheets: 30.00 x 45.00 inches or smaller; Data Release; Dataset |
| Country | United States |
| Other Geospatial | Mississippi River Valley alluvial aquifer |
| Online Only (Y/N) | Y |
| Additional Online Files (Y/N) | Y |