

Hydrology and Water Quality of the Great Dismal Swamp, Virginia and North Carolina, and Implications for Hydrologic-Management Goals and Strategies
Links
- Document: Report (20.3 MB pdf) , HTML , XML
- Data Release: USGS data release - Hydrologic, water-quality, fire, forest-cover, and other data, the Great Dismal Swamp, Virginia and North Carolina
- Download citation as: RIS | Dublin Core
Acknowledgments
These studies were funded by the U.S. Fish and Wildlife Service (FWS) and the U.S. Geological Survey (USGS). The North Carolina Department of Natural and Cultural Resources, Division of Parks & Recreation provided access to and allowed construction of wells in the Dismal Swamp State Park part of the Great Dismal Swamp. Assistance from FWS employees at the Great Dismal Swamp National Wildlife Refuge is gratefully acknowledged. Bryan Poovey (refuge forester) and Cody Daniels (refuge forestry technician) helped mark and clear sites for well locations and transport equipment in the Block C1 study area. Amanda Knox and Ben Hiza (summer interns) helped install wells in the Block C1 study area. Donald Schwab (refuge biologist) helped in the original study design and set up. Chris Lowie (refuge manager) helped secure funding and coordinated and secured support. Karen Balentine (hydrologic technician) helped with equipment installation and collected a large part of the data in the study in the northeastern part of the swamp. Russell Lotspeich of the USGS helped to determine altitudes of benchmarks and well and piezometer measuring points in the study in Block C1.
Abstract
The Great Dismal Swamp is a peat wetland in the Coastal Plain of southeastern Virginia and northeastern North Carolina. Timber harvesting and the construction of ditches to drain the swamp and facilitate the harvesting are collectively implicated in changes that altered the wetland forests, caused subsidence and decomposition of the peat, and increased the risk of fire. In response to these changes, managers have implemented strategies to control water levels and rewet the swamp using a network of 64 adjustable-height, water-control structures on the ditches. Rewetting the swamp is intended to re-establish the original wetland-forest types, reduce the risk of fire, reduce subsidence and decomposition of the peat, enhance peat accretion, and reduce the risk of fire. Knowledge of responses of the swamp to hydrologic controls, however, is critical to developing and implementing effective management goals and strategies. Because the 2008 South One fire re-emphasized the need for this knowledge, the U.S. Geological Survey in cooperation with the U.S. Fish and Wildlife Service began studies in 2009 to identify critical hydrologic controls and responses to these controls.
These studies identified water sources, topography, the two-layered hydraulic characteristics of the peat, the absence of peat in some areas, the ditch and road network, water-control structures on the ditches, the Dismal Swamp Canal and associated infrastructure, and wetland forests as the primary hydrologic controls. Precipitation is the only water source across much of the swamp. The eastward flow of streams and groundwater from the Isle of Wight Plain, across the Suffolk scarp, and into the swamp are additional water sources to the western part of the swamp. Vertical differences in the hydraulic characteristics of the peat reflect an upper peat having a high hydraulic conductivity and specific yield overlying a lower peat and sand having lower hydraulic conductivity and specific yield. The upper peat forms the main aquifer for the storage, flow, and release of water from the swamp. Maintaining water in the upper peat is critical to water availability to the wetland forests because of these properties.
Groundwater flows from the swamp into the ditches and the Dismal Swamp Canal where it discharges into nearby streams. Discharge typically is to the closest ditch except where a spoil-pile road that impedes flow intervenes between the swamp and the ditch. When groundwater levels in a ditch are about 2 feet lower than levels in the other three ditches surrounding a part of the swamp, however, most groundwater typically discharges to the ditch having the lower level. This occurs even if a spoil-pile road intervenes between the swamp and the ditch having the lower level. Flow to a single ditch shifts watershed boundaries and groundwater divides toward the ditches having higher water levels and demonstrates how flow and discharge are controlled by ditch water levels. Consequently, managing water levels based on these and other hydrologic controls and responses is critical to achieving management objectives.
The chemistry of water across the swamp shows the effects of the peat. Dissolved organic carbon concentrations in the groundwater are among the highest reported globally, ranging from 55 to 195 milligrams per liter. The pH of groundwater and ditch water is commonly less than 4.0 standard units because of organic acids. A relation between the pH and specific conductance of groundwater and ditch water reflects water sources, flow paths, and the chemical evolution, as waters from the different sources mix and flow along the paths.
Introduction
Peatlands (wetlands underlain by peat soils) worldwide support unique plant communities, sequester carbon that is stored over the long term, and serve as habitats critical to the survival of numerous threatened and endangered species (Mitsch and Gosselink, 2007). Hydrologic characteristics of peat differ from those of mineral soils and are key to carbon sequestration and storage. Carbon sequestration and storage are important because carbon is a component of carbon dioxide and methane, two greenhouse gases that cause global warming. Many peatlands, however, have been hydrologically altered by constructing ditches to drain them in support of timber harvesting and agriculture (Holden and others, 2004; Page and others, 2009; Lunt and others, 2010; Landry and Rochefort, 2012). Such drainage contributes to changes in plant communities (Chimner and others, 2016), decomposition of the peat that releases carbon and causes land subsidence (Galloway and others, 1999), and an increased risk of fire (Turetsky and others, 2011). Consequently, such altered peatlands are being “restored” to reverse this damage and reestablish the original plant-community types through effective management. Because of the nature and extent of this damage, however, the hydrology, peat characteristics, and plant communities of most peatlands cannot be restored to their original condition and spatial patterns. Effective restoration and management require knowledge of the current hydrologic controls in these systems to establish approaches needed to achieve hydrologic targets required and tolerated by the desired wetland communities (National Research Council, 2001; Chimner and others, 2016).
The Great Dismal Swamp (the swamp) is a temperate to subtropical, forested peatland on the Atlantic Coastal Plain of southeastern Virginia and northeastern North Carolina (fig. 1). The swamp has a 250-year history of artificial drainage that began when a company formed by George Washington and several co-investors constructed the first ditches between 1763 and 1768 (Hansen, 2010). Continued ditch construction to promote agriculture greatly diminished the size of the swamp from an estimated 1,500,000 acres prior to European colonization (Shaler, 1890). Timber companies drained most of the remaining swamp to facilitate timber harvesting. Drainage and timber harvesting are collectively implicated in a shift from the original wetland-forest communities of Taxodium distichum (bald cypress)/Nyssa aquatica (tupelo)/Nyssa sylvatica (black gum), Chamaecyparis thyoides (Atlantic white cedar), and Pinus serotina (pond pine common in pocosins) (Kearney, 1901; Carter and Gammon, 1976; Levy, 1991; U.S. Fish and Wildlife Service, 2006) to the present-day forests consisting of more than 60 percent Acer rubrum (red maple)/gum communities mixed with remnants of the original forest communities (Dean, 1969; Carter and Gammon, 1976; Levy, 1991; U.S. Fish and Wildlife Service, 2006).
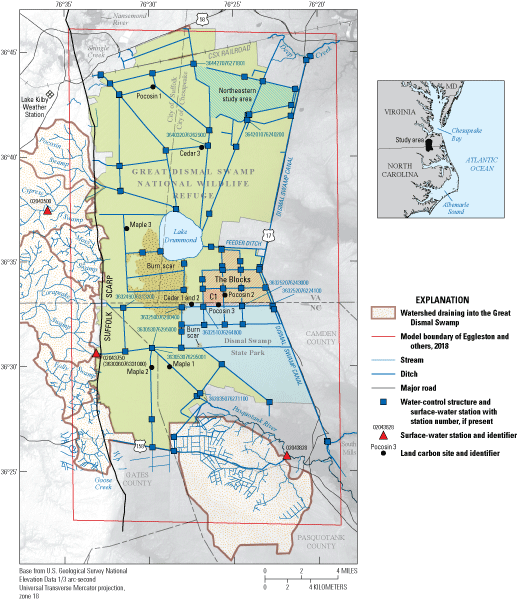
Location of Block C1, Land Carbon, and Northeast study areas, Dismal Swamp State Park, surface-water stations, the Lake Kilby weather station, and water-control structures, the Great Dismal Swamp, Virginia and North Carolina.
In 1974, the timber companies placed 49,097 acres of the remaining swamp into conservation status through the Nature Conservancy. The goal of the timber companies and the Nature Conservancy was to transfer the land to the Federal Government and the State of North Carolina for long-term management. Through laws passed by the U.S. Congress and the North Carolina State Legislature, and subsequent land acquisitions, the swamp now includes the 112,000-acre Great Dismal Swamp National Wildlife Refuge (the refuge) and the 14,432-acre Dismal Swamp State Park (fig. 1). The U.S. Fish and Wildlife Service (FWS) and the North Carolina Department of Natural and Cultural Resources, Division of Parks & Recreation are responsible for the refuge and park, respectively, cooperatively managing approximately 200 miles (mi) of ditches that drain the refuge and park.
In addition to providing habitat and storing carbon, the swamp also provides unique recreational opportunities for tourists and area residents and can mitigate downstream flooding. Recreation, tourism, and flood mitigation produce economic benefits to nearby communities. Restoration to re-establish and maintain the original forest-community types has been a goal of refuge staff since 1974 (U.S. Fish and Wildlife Service, 2006). Restoration efforts include a combination of hydrologic- and silviculture-management strategies. Hydrologic strategies focus on slowing drainage to “rewet the peat” using adjustable-height, water-control structures installed in ditches like those used on agricultural land in northeastern North Carolina (Dukes and others, 2003; Evans and others, 2007). These strategies also (1) reduce the risk of catastrophic fire, (2) facilitate carbon sequestration and storage as peat, (3) reduce the release of carbon and subsidence through peat decomposition, (4) reduce the risk of downstream flooding, and (5) improve recreational opportunities. Refuge staff is seeking ways to manage the 64 existing structures effectively and optimally locate additional structures. Such management has been difficult because knowledge of the hydrology of the swamp is inadequate for these needs (U.S. Fish and Wildlife Service, 2006).
Drainage combined with reduced precipitation in 2008 created conditions that led to several fires. One of these fires, the South One fire, got out of control and burned into the peat, which made it difficult to extinguish. Consequently, 4,884 acres burned over 129 days from June 1 through October 7, 2008. Damage caused by this fire re-emphasized the need for a better understanding of the hydrology and for the development of achievable management goals and a more effective management strategy for the swamp.
In response to these needs, the FWS provided funds to the U.S. Geological Survey (USGS) in 2009 to start the first in a series of hydrologic studies that renewed the partnership between the FWS and the USGS since studies conducted in the 1970s and early 1980s. These studies, funded by both agencies, include (1) a study of the hydrology of Block C1 in the Blocks southeast of Lake Drummond (fig. 1), (2) the USGS Land Carbon study, a part of the USGS Climate and Land Use Change project (fig. 1), (3) a hydrologic study of the northeastern quadrant of the swamp as a part of funds received by the FWS to construct additional water-control structures in that part of the swamp (fig. 1), (4) a steady-state, numerical modeling study funded as a part of the structure construction, and (5) additional monitoring implemented by refuge staff.
Results from the steady-state model simulations are presented in Eggleston and others (2018). The numerical model simulates steady-state conditions for average, wet, and dry conditions during the start of the growing season (April through June). A simplified representation of the hydrologic system was modeled. The present report is the compilation of results from Eggleston and others (2018) and these other studies conducted by the USGS, in cooperation with the U.S. Fish and Wildlife Service, to evaluate the hydrologic controls and responses to these controls across the Great Dismal Swamp.
Purpose and Scope
This report describes the hydrologic controls and responses to these controls based on a conceptual model developed during these studies that was revised from an earlier conceptual model developed at the time the refuge was created (Lichtler and Walker, 1974) and expands on the conceptual model in Eggleston and others (2018). This conceptual model integrates and summarizes the data and collective knowledge from hydrologic studies that span more than 45 years with an emphasis on studies of the last 10 years (2009–18) and differs appreciably from that presented by Lichtler and Walker (1974). The report describes the spatial and temporal variability in hydrologic controls and the resulting responses. It highlights differences from the conceptual model of Lichtler and Walker (1974) and is partly substantiated by the water chemistry/quality.
The report also describes the histories of changes in the infrastructure, land use, and characteristics of the swamp. These histories relate closely to each other in many ways and reflect long-term effects on the swamp. They combine to reflect continuing changes in the peat, hydrology, and wetland-forest cover of the swamp and are important to development of achievable management goals, effective management strategies, and sound research across the swamp.
The intended audience includes refuge and park managers and other staff, managers outside the swamp, monitoring coordinators, and other researchers. For refuge and park staff, the report provides information that affects the selection of locations for constructing additional structures, management of the structures, determination of likely hydrologic responses to management actions, and considerations for how hydrologic characteristics affect restoration of forest-community types. For managers outside the swamp, the information can support management decisions affected by conditions within the swamp. For monitoring coordinators and other researchers, the information can assist in network design, research design, and interpretation of results because of the importance of spatial and temporal differences in hydrologic controls and responses, and water chemistry, on monitoring and research results.
Previous Investigations
The swamp has an extensive, written history with documents ranging from public interest to scientific publications. Public-interest publications typically address the potential for economic development of the swamp and the effects of the swamp on the lives of area residents. Scientific publications address the geology (particularly the peat), hydrology, plant and animal communities, and their interdependence and document many of the changes in swamp characteristics over time. One of the earliest and most widely known publications is William Byrd’s account of his 1728 survey of the Virginia/North Carolina State line through the swamp (Byrd, 1841). Shaler (1890) provides one of the earliest, extensive descriptions of the relations among geology, hydrology, and plant and animal communities of the swamp.
Early research into various other characteristics of the swamp discuss limited aspects of the hydrology (Shaler, 1890; Kearney, 1901; and Osbon, 1920). The first description focusing on the groundwater hydrology was Lichtler and Walker (1974). It is part of the Great Dismal Swamp Study (U.S. Fish and Wildlife Service, 1974), which the U.S. Congress commissioned to evaluate the feasibility of protecting and preserving the swamp. Lichtler and Walker (1974) describe a conceptual model of groundwater flow through the swamp that emphasizes the importance of groundwater flowing east from the Suffolk scarp through sand of the Norfolk Formation (now known as the Tabb Formation). Some groundwater then discharges upward into the peat to maintain saturated conditions in the swamp and promote peat formation. Part of this groundwater was thought to flow and discharge into the Dismal Swamp Canal. This description is based primarily on a review of published reports on the geology, limited field data, streamflow-gaging-station records from near the Suffolk scarp, other publications, and basic hydrologic principles.
In the mid-1970s, when the possibility of preserving the Great Dismal Swamp was evaluated, several researchers collected information on the natural history of the swamp. The book “The Great Dismal Swamp” edited by Kirk (1979) summarizes these studies. This research evaluated the geology, peat stratigraphy, forest communities, human use, land-use history, and other aspects of the swamp. It served as the foundation for the scientific understanding of swamp ecosystems when the refuge was established in 1974 and, like Lichtler and Walker (1974), was based primarily on previously collected data and reconnaissance evaluations.
Following establishment of the refuge, academic and Federal researchers investigated aspects of the hydrology and ecology of the swamp. Examples include the Carter and Gammon (1976) classification of forest communities using remote sensing, the Carter and others (1977) investigation of water-management approaches using remote sensing, and the Carter and others (1994) investigation of forest transitions from upland to wetland communities near the Suffolk scarp. Phipps and others (1978) evaluated the response of tree growth to drainage through tree-ring analysis. Researchers from Old Dominion University related water levels to tree growth in four forest-community types (Dabel and Day, 1977; Day and others, 1988; Powell and Day, 1991; Rodgers and others, 2003). More recently, researchers from Christopher Newport University investigated the growth and regeneration of Atlantic white cedar communities (Atkinson and others, 2003; DeBerry and Atkinson, 2014).
Description of the Swamp and Surrounding Areas
The Great Dismal Swamp is on the mid-Atlantic Coastal Plain and straddles the Virginia–North Carolina State line (fig. 1). The refuge and state park protect the largest, intact remnant of a previously much larger peatland complex. The swamp extends south from the southwestern corner of the rapidly urbanizing metropolitan area of southeastern Virginia into agricultural areas of southeastern Virginia and northeastern North Carolina. In Virginia, the swamp is located within the independent cities of Chesapeake and Suffolk. From east to west in North Carolina, the swamp includes parts of rural Camden, Pasquotank, and Gates Counties. It is bounded on the east by the Dismal Swamp Canal, on the south by U.S. Route 158, on the west by the Suffolk scarp, and on the north by U.S. Route 58 and the CSX Railroad.
Climate
The swamp has a temperate to subtropical climate (Trewartha and Horn, 1980) consisting of hot, humid summers and cool, low-humidity winters. Mean annual temperature (1981–2010) averaged 59.6 degrees Fahrenheit (°F) at the National Oceanic and Atmospheric Administration, City of Suffolk, Lake Kilby station (station number USC00448192) northwest of the swamp (fig. 1) (https://www.ncdc.noaa.gov/cdo-web/datatools/normals, accessed May 11, 2016). Monthly average temperatures ranged from 40.0 °F in January to 78.8 °F in July. Average monthly precipitation followed a general, seasonal pattern, ranging from a monthly low of 3.23 inches (in.) in February to a monthly high of 5.71 in. in August, and averaged 49.49 in. annually.
Although average monthly precipitation followed this pattern, the pattern in any single year typically differs appreciably with periods of one to several consecutive months of much lower or higher than average precipitation being quite common. Several consecutive years of drought or heavy precipitation also are common.
Potential evapotranspiration (PET) averaged 32.44 inches per year (in/yr) and followed a seasonal pattern, increasing from a low of 0.21 in. in January to a high of 6.24 in. in July (https://climate.virginia.edu/va_pet_prec_diff.htm, accessed March 28, 2018). Average monthly PET exceeded average monthly precipitation from May through August and was about 1.25 in. greater than precipitation in June and July.
Winter precipitation typically accompanies frontal systems, whereas summer precipitation typically results from afternoon thunderstorms caused by daytime heating that can accompany frontal systems. Intensive low-pressure systems called nor’easters that form off the coast and move to the northeast typically bring the larger winter precipitation events accompanied by strong winds. Tropical, low-pressure systems (tropical depressions, tropical storms, and hurricanes) can bring heavy precipitation and strong winds from June through October with the greatest frequency typically from late August into early October.
Topography
Topography has three primary scales: regional, intermediate, and local or microtopography. Regional- and intermediate-scale topography reflect the effects of sediment deposition and erosion during previous high stands of the sea, deposition and erosion across emergent land that created historical and present-day drainage networks, and the subsequent formation and subsidence of the peat superimposed upon these drainage networks. The Suffolk scarp (fig. 1) is a Pleistocene Epoch, erosional, marine shoreline created during a previous high stand of the sea (Wentworth, 1930; Oaks and Coch, 1973). The scarp forms a distinct topographic break along the western boundary of the swamp (fig. 2), having relatively sharply decreasing land-surface altitude from the Isle of Wight Plain to the west to the lower-altitude Great Dismal Swamp to its east (Wentworth, 1930; Oaks and Coch, 1973). Land surface is about 60 to 70 feet (ft) above the North American Vertical Datum of 1988 (NAVD 88) near the crest of the scarp and decreases to about 25 ft above NAVD 88 within approximately 200 ft at the toe of the scarp. Six valleys that dissect the Isle of Wight Plain cut across the Suffolk scarp where their streams flow into the swamp. These valleys are broad and contain bottom-land, hardwood swamps typical of stream valleys across the mid-Atlantic Coastal Plain. Land surface across the Great Dismal Swamp is a relatively flat terrace that gradually slopes to the east from about 25 ft to about 10–12 ft above NAVD 88 across the 9–12 mi from the toe of the scarp to the canal (fig. 2). Additional gradients toward Lake Drummond in the center of the swamp and streams to the north and south of the swamp are superimposed on this regional-scale gradient to create intermediate-scale gradients.
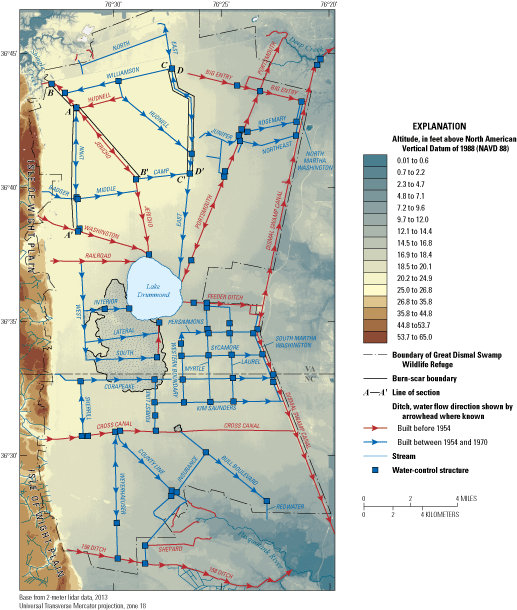
Land-surface altitude based on light detection and ranging (lidar) data, lines of section, the ditch network constructed before 1954 and 1954–70, locations of water-control structures on the ditches, and typical flow directions in the ditches, the Great Dismal Swamp, Virginia and North Carolina. [Note: The period of ditch construction is based on Shaler, 1890; U.S. Geological Survey, 1919, 1940, 1954a-g, 1977a-e; Brown, 1970. Cross sections are shown in figure 3. N, North; S, South]
Land subsidence resulting from large groundwater withdrawals from deep (hundreds of feet) Cretaceous aquifers in the Virginia Coastal Plain (Holdahl and Morrison, 1974; Pope and Burbey, 2004; Eggleston and Pope, 2013) affects the regional topography. Subsidence rates range from about 2.8 millimeters per year (mm/yr; 0.11 in/yr) in the southeastern refuge to 3.6 mm/yr (0.14 in/yr) in the northwestern refuge, toward the withdrawal center. Unlike subsidence from draining the peat, which can create abrupt local changes (discussed under “Peat” later in this report), effects of subsidence from groundwater withdrawals typically are widespread and subtle.
Although land-surface altitude decreases from the toe of the scarp, a low-relief area covers much of the northwestern quadrant of the swamp (fig. 2). This area extends east from the base of the scarp to East Ditch and north from near Badger, Middle, and Camp Ditches to Williamson Ditch (fig. 2, northwestern quadrant). Altitudes in the swamp along Lynn and Jericho Ditches (fig. 3, sections A–A′ and B–B′, respectively) are similar (averaging about 21.5–22.5 ft above NAVD 88) from their confluence in the north to the southern limit of Lynn Ditch where Jericho Ditch is about 2.2 mi east (fig. 2; fig. 3). Similarly, altitude in the swamp west of East Ditch (fig. 2, section C–C′) typically is less than 1 ft lower than that along Lynn Ditch, about 5 mi to the west (fig. 3, section C–C′). This contrasts with the approximately 1.5-ft difference in altitude in the approximately 100 ft from the western to the eastern side of East Ditch (fig. 3, sections C–C′ and D–D′, respectively). Not only are altitude differences small from the scarp to East Ditch, but differences along north-south sections are small. Notice that the vertical scale in fig. 3 exaggerates altitude differences.
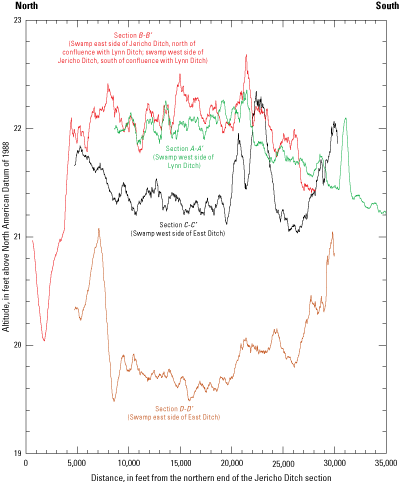
Land-surface altitudes based on light detection and ranging (lidar) data using a 50-measurement running average in the swamp along Lynn Ditch (section A–A′), Jericho Ditch (section B–B′), the western side of East Ditch (section C–C′), and the eastern side of East Ditch (section D–D′) through the northwestern wet area, the Great Dismal Swamp, Virginia and North Carolina. [Lines of section shown in fig. 2]
Microtopography results from a combination of the formation of the peat upon the original drainage system, human-caused alterations, peat subsidence, and the effects of forests. These differences, although small, can cause critical differences in the moisture content of the peat such that they can affect the forest-type distributions (Shaler, 1890). Human-caused alterations result from mechanical timber harvesting, construction of ditches and resulting spoil-pile roads, construction of railroads, clearing firebreaks, and other activities. Mechanical timber harvesting and clearing firebreaks rely on heavy equipment that, although modified to reduce pressure on the soft peat, still compacts the peat. Compaction creates ruts 1–3 ft lower than adjacent “ridges” of un-compacted peat. Ditch spoil material couples with road fill to form ridges 1–3 ft above the adjacent, natural peat surface. Railroad grades have similar effects but typically are not located along ditches. Paths regularly travelled by humans or wildlife gradually become compacted relative to the adjacent peat. The degree of compaction depends on the extent and type of use. An example of this phenomenon is an old all-terrain vehicle trail connecting East Ditch and Juniper Ditch in the north–central part of the refuge (fig. 2, northwestern quadrant). The width of this trail is about 5–10 ft; its depth allows flow from East Ditch to Juniper Ditch.
Hummocks and hollows are one of the most distinct and common natural micro-topographic features, particularly in pocosin and cedar communities. Hummocks are mounds typically surrounding the base of trees and shrubs, whereas hollows are depressions surrounding the hummocks. The altitude changes about 2–3 ft within a couple of feet laterally between hummocks and hollows. The extent to which the trees and shrubs have grown upon existing hummocks or have contributed to hummock formation is uncertain and likely varies. Seedlings commonly sprout and mature on existing hummocks. Uprooting of trees creates root mounds and adjacent holes that can be another source of hummocks.
Hummocks around trees appear to reflect both accretion and subsidence. Subsidence is common in drained peatlands and typically is caused by three responses of the peat to the drainage: (1) loss of buoyancy, (2) shrinkage from drying that irreversibly alters the physical characteristics of the peat, and (3) microbial oxidation of drained, moist peat (Ingram, 1992). Subsidence in drained peat can vary over short distances because of local differences in the peat moisture content between hummocks and hollows or over longer distances because of relative effects of ditches, spoil-pile roads, and other features.
Characteristics of hummocks partly vary by tree species. Typically, hummocks around pine and cedar trees appear to reflect accretion consisting of leaf litter at the surface underlain by substantial peat in contrast to the possible reduced accretion and (or) subsidence in adjacent hollows (fig. 4A and B). Hummocks around red maple trees typically are small, incomplete, or absent (fig. 4C) and expose the roots so that these trees appear to be “on legs.” Land-surface altitude at maple trees is similar to that away from trees in areas that would be hollows in other forest types. In many local areas having trees of different ages, the height of the tree collars (an indicator of the land surface when the seedling sprouted) above the hollows appears greater around larger, likely older trees, possibly indicating decreasing land-surface altitudes from peat subsidence. The primary difference in the appearance of hummocks around larger and older trees of different species is that hummocks appear taller and wider around older pine and cedar trees, whereas more roots are exposed around older maple trees.
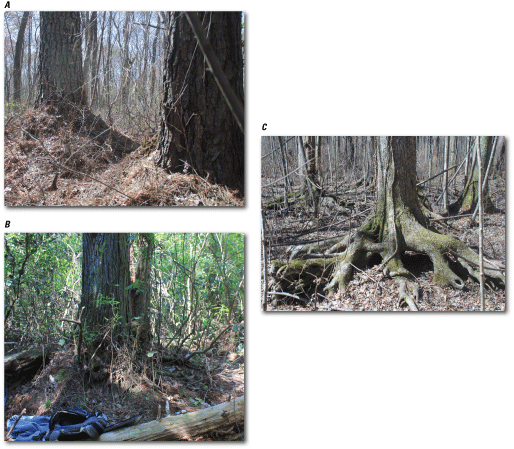
Peat hummocks and root exposure at the base of A, pine, B, Atlantic white cedar, and C, red maple trees, the Great Dismal Swamp, Virginia and North Carolina. Photographs by Gary K. Speiran, U.S. Geological Survey.
In parts of the swamp, differences in peat altitude appear to be caused by differences in subsidence that result from differences in drainage caused by the relative locations of ditches, spoil-pile roads, and the swamp (fig. 5). Where the swamp immediately borders a ditch, the ditch rapidly drains the peat. Where a spoil-pile road intervenes between the ditch and the swamp, especially if the regional hydraulic gradient is from the road to the ditch, the spoil-pile road forms a dam to surface-water and groundwater flow, typically retaining standing water. Spoil-pile roads consist of spoil material from ditch construction that is deposited on the peat and compresses the peat. This produces an elevated, lower hydraulic conductivity material than that of the adjacent swamp and dams the groundwater and surface water. Consequently, parts of the swamp directly bordering a ditch typically are drier than the parts directly bordering a spoil-pile road. Shaler (1890) notes how the spoil pile west of the Dismal Swamp Canal created persistently wetter conditions to the west, and the spoil pile to the east of the canal created persistently drier conditions to the east, because the natural flow from the west was inhibited by the spoil banks. These conditions typically occur along north-south oriented ditches where roads are west of the ditch because the regional hydraulic gradient is to the east. East Ditch appears to illustrate this phenomenon where land-surface altitude in the swamp east of the ditch is about 1.5 ft lower than that west of the ditch (fig. 3, sections C–C′ and D–D′).
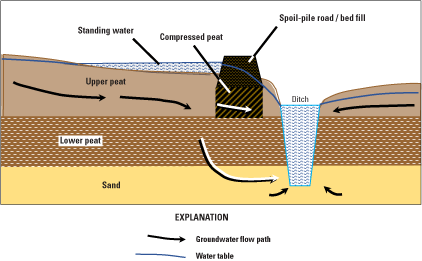
Schematic drawing showing the effects of a ditch and spoil-pile road on the flow of water from the swamp to a ditch, the Great Dismal Swamp, Virginia and North Carolina.
Land Use and Cover
Land use and cover within and surrounding the swamp are critical to the characteristics and hydrologic management of the swamp. Land use and cover west of the Suffolk scarp can affect the quantity and quality of water entering the swamp. Land use and cover in areas adjacent to the swamp to the north and south can affect management decisions within the swamp because water discharges from the swamp into these areas and can contribute to flooding. Hydrologic infrastructure is critical to the land use and cover because the mere presence and the management of the infrastructure affect the storage and drainage of water that, in turn, affects the land use and cover across the swamp and surrounding areas.
Wetland Ecosystems
Much of the area east of the Suffolk scarp originally included Lake Drummond, abundant wetland-forest ecosystems, and limited marshes. The original forest ecosystems consisted of bald cypress/tupelo/black gum, Atlantic white cedar, and pocosins for which the swamp was known (Shaler, 1890; Dean, 1969). These communities included a few, scattered, small red maple trees. The original forest communities have been replaced by predominantly red maple/gum communities having limited cypress, cedar, and pocosin communities, which have abundant populations of large red-maple trees (Carter and Gammon, 1976; U.S. Fish and Wildlife Service, 2006).
The distribution of the original communities was controlled partly by subtle differences in topography that affected the wetness of the peat (Shaler, 1890). Cypress/gum communities occupied the slightly lower-altitude, wetter areas, whereas cedar occupied the slightly higher-altitude, less wet areas (Shaler, 1890). Pocosin communities (shrub communities having an open, pine-tree canopy) typically occupy slightly drier conditions.
With the construction of the Dismal Swamp Canal, spoil banks on both sides of the canal inhibited the natural flow of water from the west into the canal and from the canal to parts of the swamp east of the canal. Inhibition of flow made conditions wetter west of the canal and drier east of the canal than before canal construction, altering the ecosystems (Shaler, 1890). Similar hydrologic conditions appear to exist along many ditch/spoil-pile combinations within the swamp. Tree-ring analyses indicate that drier than natural conditions from the drainage have stressed existing communities, likely contributing to this shift in community types (Phipps, and others, 1978).
The swamp originally was targeted for drainage and conversion to agricultural use in the 1760s. Although agriculture succeeded outside the current swamp, attempts within the current swamp failed because the soil was unsuitable for agriculture. Consequently, land use across the swamp focused on timber harvesting. Bald cypress and Atlantic white cedar were the principle species harvested because of their resistance to rot and other valuable characteristics. Most of the swamp reportedly has been harvested at least 2 or 3 times; only a few, scattered, old-growth trees remain. Because selective harvesting left red maple and other species, these harvesting preferences can be partly responsible for the current forest-community distribution. Carter and Gammon (1976) published the first map of the forest and understory distribution of the entire swamp after commercial harvesting ended.
Since then, harvesting has been only for refuge-management purposes, such as the removal of maple and some pine trees from parts of the Blocks to reduce the maple community and re-establish the more typical, open pine-tree-canopy pocosin. Spraying of herbicides augmented the harvesting to limit regeneration of maples from seeds and sprouting from the trunks and roots of harvested trees. Water-control structures are used to manage the hydrology in a manner to support the growth of desired, resilient, forest communities.
Appreciable change likely has occurred in the wetland-forest communities of the swamp from that mapped by Carter and Gammon (1976) to the current communities. Less than 5 years passed from the end of the extensive ditch construction and associated timber harvesting across the swamp (1953–70) to the acquisition of the data interpreted for publication of the Carter and Gammon map, whereas nearly 50 years have passed since collection of data for that map. The map was based on imagery collected between September 1970 and March 1975 (Gammon, 1977). Interpretation of imagery from flights over the swamp in 2015 under a contract between the FWS and a private company provides an updated map of the wetland-forest canopy (fig. 6), but this map does not include understory as does the map of Carter and Gammon (1976).
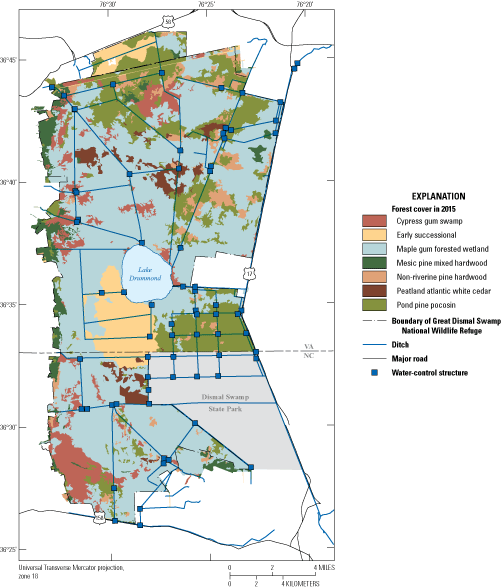
Distribution of forest cover within the Great Dismal Swamp, Virginia and North Carolina, based on interpretation of 2015 imagery. [U.S. Fish and Wildlife Service, written commun., 2016]
The one easily identifiable change in the forest community since Carter and Gammon (1976) occurred southwest of Lake Drummond where winds from Hurricane Isabel blew down a large cedar forest in 2003. Subsequent fires in that area in 2008 and 2011 burned into the peat, leaving the area as open water having limited emergent peat and trees. This area is identified as “burn scar” in figure 1 and figure 2 and “Early Successional” in figure 6. Otherwise, a general visual comparison of the recent interpretations with those of Carter and Gammon (1976) indicates similar major patterns but a greater resolution of the forest communities with the recent interpretations. An accurate, detailed comparison of these maps can be difficult because of differences in methods including the type of imagery, classification categories, interpretations, and the apparent resolution. As an example of the classification differences, Carter and Gammon (1976) classify an area along Juniper Ditch (fig. 2, northeastern quadrant) as pine/maple/cedar, whereas the recent map (fig. 6) classifies the area as pond pine pocosin. Anecdotally, although cedar trees remain standing in this area, many appear to have blown down during Hurricane Isabel in 2003 without subsequent regeneration. To better track future changes in the forest community, the FWS has established a network of vegetation-monitoring plots coupled with groundwater wells.
Fire
Fire can also change forest communities. Fire typically is caused by lightning strikes during the dry growing season from late spring into the early fall when evapotranspiration (ET) is high, but sometimes fire is caused by human activity. The available history of fires across the swamp is incomplete and cannot be thoroughly evaluated, although fire occurrence from 1980 through 2012 reflects monthly and interannual distributions (fig. 7). These distributions indicate “fires starting” so that fires that span multiple months or years are not counted more than once.
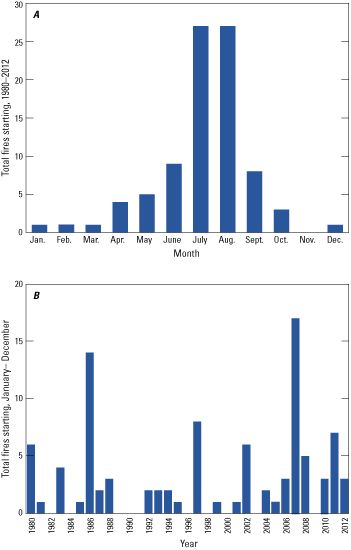
A, the count of fires starting in each month totaled for years from 1980 through 2012 and B, the total count of fires starting annually 1980 through 2012, the Great Dismal Swamp, Virginia and North Carolina.
The number of fires starting each month for all years combined shows a seasonal distribution. Fires typically are less common during the wet season from late fall into spring (fig. 7A) when they typically are small, quickly extinguished, and have minimal effect on the forest and peat. November was the only month having no fires starting; each month from December through March had only one fire starting. During the dry growing season, however, fires are more frequent, more likely to be difficult to extinguish so that they become large and intense, and have a greater effect on the forest and peat. Every month from May through September had more than five fires starting (fig. 7A).
The annual distribution for the 33 years from 1980 through 2012 shows no fires starting in 10 years. Eleven years had only one or two fires starting (fig. 7B). Twelve years had more than two fires starting. The 7-year period from 2006 through 2012 was the worst period; more than two fires started in all years except 2009. The 17 fires in 2007 was the most fires starting in any year. Five and seven fires started the years of the South One (2008) and Lateral West (2011) fires, respectively.
Drainage and fire-suppression techniques likely affect fire frequency, intensity, and spatial distribution across the swamp, but because of the lack of a more complete fire record, these effects cannot be evaluated and can only be assumed. Large, intense fires can destroy mature forest canopy, leading to regeneration of entirely different communities and habitats. In drained peatlands, they can become ground fires that burn through the peat to the water table and create depressions in the peat that change the hydroperiod (depth, duration, and timing of inundation and (or) groundwater levels; Frost, 1989; Turetsky and others, 2011). In contrast, the ability to identify and extinguish fires while they remain small likely has increased because spoil-pile roads adjacent to the ditches improve access.
Although fire can be catastrophic in wetland-forest communities, it also is one of the most important factors contributing to the healthy pocosin and Atlantic white cedar communities (Frost, 1989). The location, size, intensity, timing, and duration of fire, however, is critical. Although pocosins are fire-dependent ecosystems, fire severity must be limited, and return intervals typically must be long enough to allow peat accretion and forest-stand development (Frost, 1989; Richardson, 1991). Atlantic white cedar forests, on the other hand, depend on even less frequent fires but fires of greater intensity than those needed by pocosins (Frost, 1989). Such intense fires destroy competing vegetation and burn debris that normally limit the sunlight availability at ground level needed for the growth of cedar seedlings. Such fires promote establishment of the typical dense, monoculture, cedar forests. Because of the improved ability to identify, access, and extinguish fires, fires required by pocosin and cedar communities likely are less common.
Large, intense fires in the swamp occurred in 1806, 1839, 1923–26, 1930, 1941–42, 1955, 1967, (Simpson, 1990; U.S. Fish and Wildlife Service, 2006) and include the more recent 2008 South One fire and 2011 Lateral West fire south of Lake Drummond (fig. 2; fig. 8). Because of the potential for ground fires, fire-suppression techniques developed for peatlands focus on flooding the burning area to extinguish and reduce the spread of peat fires beneath land surface. Even by using these techniques, however, ground fires can smolder for months. The fires of 2008 and 2011 provide excellent examples of the difficulty in fighting such fires and their effects on the swamp and surrounding communities. The 2008 and 2011 fires burned 4,884 and 6,200 acres, respectively. Both started during dry growing seasons in an area being prepared in 2008 for regeneration of the cedar forest blown down by Hurricane Isabel. The 2011 fire burned throughout and beyond the footprint of the 2008 fire. The 2011 fire likely became intense and difficult to fight because of abundant fuel resulting from the herbaceous growth throughout the 2008 burn scar. Because of the depth and spatial extent of the burn scar that remained after these fires, the hydrology near the area was appreciably altered, and an emergent marsh replaced the forest community previously covering the area.
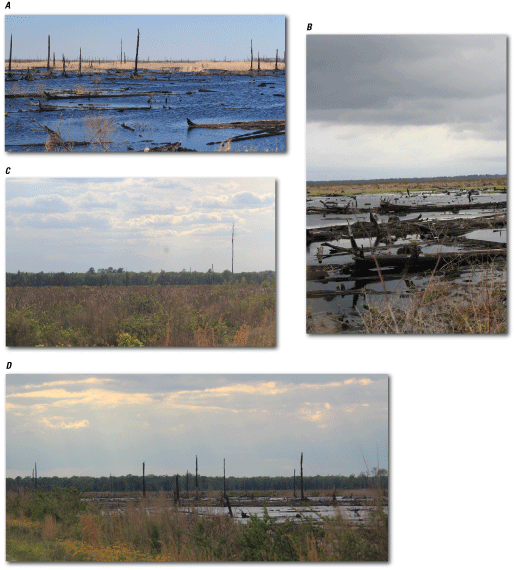
The burn scar from the 2008 and 2011 fires viewed from Corapeake Ditch, A, looking northeast, B, looking northeast close up, C, looking south, and D, looking northwest, the Great Dismal Swamp, Virginia and North Carolina. Photographs by Gary K. Speiran, U.S. Geological Survey.
These two fires required techniques not commonly used in fighting typical forest fires because groundwater and ditch-water levels were low, and the fires burned into the peat. Large pumps lifted water above temporary dams and existing water-control structures on the ditches to push the water upstream through the ditches from low-altitude sources into the higher-altitude burning areas. Because groundwater levels were low and conditions were dry, much of this water infiltrated the peat along the ditch banks reducing the success of this technique and allowing the fires to burn deeply into the peat and continue smoldering for 3–4 months.
Agricultural and Residential Development
Land use surrounding the swamp is important because areas west of the scarp drain to the swamp and affect its water budget and water quality, and the swamp drains to areas north and south of the swamp, affecting water quality and contributing to flooding. Colonists and early residents cleared areas surrounding the swamp for agricultural, residential, and other uses. Uplands on the adjacent Isle of Wight Plain were naturally drier than other areas, making them easily cleared and converted by the early 19th century. Early residents likely converted areas north, south, and east of the swamp during the same period. Spoil material deposited on both sides of the Dismal Swamp Canal when it was constructed inhibited the natural flow of water from the west, dried the land east of the canal and facilitated its conversion to agriculture (Shaler, 1890).
Areas draining the Isle of Wight Plain generally are rural, containing forested, agricultural, and rural-residential areas throughout Virginia and North Carolina; land-use types from the National Land Cover Database (https://coast.noaa.gov/digitalcoast/data/nlcd.html) are listed in table 1, by percent. Forests typically are pine and (or) mixed hardwoods. Flood plains of streams draining surrounding areas commonly contain bottomland hardwood wetlands. Agricultural areas typically contain row crops and pasture. Row crops include corn, soybeans, cotton, peanuts, and sorghum. Wheat is a common winter cover crop that is either plowed into the soil in the spring or allowed to mature, and then harvested.
Table 1.
Land-cover types in watersheds draining the Isle of Wight Plain into the Great Dismal Swamp, Virginia.[From the National Land Cover Database (https://coast.noaa.gov/digitalcoast/data/nlcd.html), accessed December 12, 2016. Does not total 100 percent due to rounding]
Residential development is increasing around the swamp and consists of a combination of dense urban and scattered rural residential types. Residential and other urban uses are expanding toward the swamp from Suffolk to the northwest and the City of Norfolk, the City of Virginia Beach, and the City of Chesapeake to the northeast. Agricultural fields east of Portsmouth Ditch and north of Big Entry Ditch (fig. 2, northeastern quadrant) that directly border the northeastern part of the swamp are being converted to residential subdivisions. Rural residential type development is spreading in other areas and consists of homes built on land parcels along roads, at the edge of fields, and in woodlands.
Description of Contributing Studies
Individual studies used in this report had different objectives and designs. The studies covered areas of different size and had various data-monitoring efforts. These studies produced limited publications on the hydrology and chemistry that incompletely address aspects of the hydrology and chemistry important to management decisions. Knowledge of the basis for these studies helps understand their role in this report.
Block C1
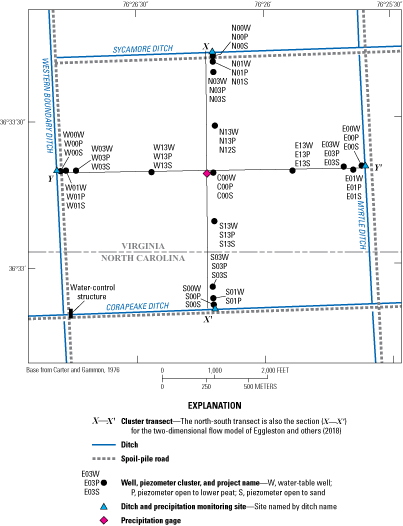
Between 2009 and 2013, the USGS conducted the first of the recent studies consisting of a local, detailed evaluation of the hydrology of Block C1 in a part of the swamp southeast of Lake Drummond known as “The Blocks” (fig. 1 and fig. 9). A 1-mi by 1-mi gridded pattern created by ditches characterizes the Blocks and is the basis for its name. Block C1 is in the southwestern corner of the Blocks. The study evaluated the relative importance of the peat, underlying sand, ditches, and spoil-pile roads to the hydrology of the swamp. Block C1 was selected because it (1) was one of the smallest areas bounded by ditches on all sides, (2) likely was isolated from the effects of the Suffolk scarp, (3) had relatively easy access across the block through north-south and east-west firebreaks cut through the forest communities and intersecting in the center of the block, (4) was in an area planned for reintroduction of the federally endangered Picoidis borealis (red-cockaded woodpecker), and (5) was to be hydrologically and silviculturally managed as habitat for the woodpeckers (fig. 9). The Blocks primarily contain a pocosin-forest community consisting of a dense shrub layer having an open pine-forest canopy, typical of habitat of the red-cockaded woodpecker. Trees included in pocosins are primarily pond pine having fewer Pinus taeda (loblolly pine). Two data-collection sites in Block C1 remain as base sites for continued, long-term, hydrologic monitoring of the swamp. Knowledge of local geohydrologic controls at this site influenced the initial revisions of the conceptual model from Lichtler and Walker (1974) presented in this report and the conceptualization for the model in Eggleston and others (2018) and other studies and monitoring efforts.
Locations of wells, ditches, and other features in the Block C1 study area, the Great Dismal Swamp, Virginia and North Carolina.
Land Carbon
The Land Carbon study began in 2014 as part of the USGS Climate and Land Use Change project (Diana Hogan, U.S. Geological Survey, written commun., 2014). The study was designed to evaluate the carbon budget, the ecosystem services, and the hydrologic and biogeochemical controls on the carbon budget in the swamp by monitoring soil-gas emission, carbon transport through groundwater, tree-growth rates, changes in land-surface altitudes, groundwater hydrology, and groundwater chemistry in three forest-community types. One study objective was to provide knowledge of differences in the controls of these forest types to assist the FWS in managing the swamp to minimize subsidence, maximize peat accretion, and enhance other management objectives. The forest-community types include Atlantic white cedar, pocosin, and maple/gum. Study sites consisted of 0.125-acre (20 by 25 meters) plots; three plots were in each forest-community type extending from the northwestern part of the swamp to the northern ends of Weyerhaeuser and County Line Ditches (fig. 1). The Land Carbon study is the basis for the discussion of the water chemistry and its relation to hydrology in this report.
Numerous publications are based directly on the Land Carbon study and other efforts associated with this study. Reddy and others (2015) describe the extent of carbon loss and the burn scar from the 2011 fire. Speiran and Wurster (2016) briefly describe the basic hydrologic and geochemical characteristics of the swamp. Duberstein and others (2016) quantify the aboveground biomass and its rate of change. Kim and others (2017) describe the wetness of the swamp by use of remotely sensed data. Drexler and others (2017) describe peat accumulation rates and selected characteristics of the peat. Parthum and others (2017) describe the benefits of fire mitigation as an ecosystem service to the swamp. Sleeter and others (2017) simulated the carbon budget.
Northeastern Quadrant of the Swamp
In 2014, the USGS in partnership with the FWS began monitoring groundwater and ditch-water levels in the northeastern quadrant of the swamp as part of the construction of 14 water-control structures in that area (fig. 10). The objectives of the study were to characterize the hydrologic controls and responses of the area for use in (1) developing a water-control-structure management strategy and (2) determining the success of this strategy by providing background information for characterizing changes in responses caused by implementation of the strategy. The northeastern study area covers about 6,000 acres that span nearly the complete range in hydroperiods observed across the swamp and extends from the wet, northwestern quadrant of the swamp to a dry area near the Dismal Swamp Canal. Accordingly, this report uses results from the northeastern quadrant as an example of the specific responses to the range in swamp-wide, intermediate, and local controls across the swamp. Speiran and Wurster (2016) discuss some of the findings from this study.
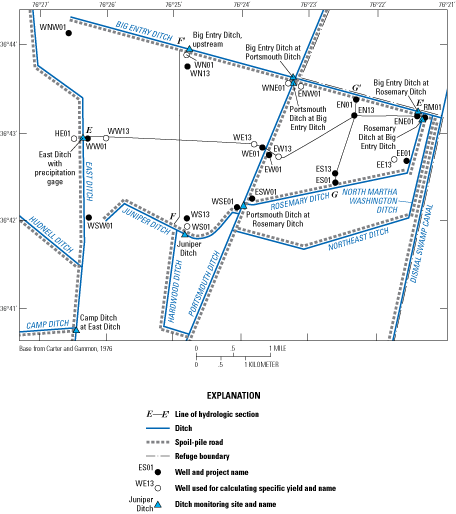
Locations of wells, ditch monitoring sites, lines of hydrologic section, and other features in the northeastern quadrant of the Great Dismal Swamp, Virginia and North Carolina.
Flow Model
Beginning in 2015, the USGS in partnership with the FWS developed a steady-state, numerical model for simulating the levels and flow of groundwater and surface water across the swamp as an outgrowth of the study of the northeastern quadrant and construction of the new water-control structures (Eggleston and others, 2018). The model provides a tool that can assist refuge and park managers in developing strategies for placing and managing water-control structures. Eggleston and others (2018) summarize model development and results of selected model simulations. The conceptual model discussed herein was the basis for the simplified conceptual model used in model configuration and initial hydraulic characteristics simulated with the model. Although the flow model was constructed as a simplified version of the conceptual model, it verified and helped refine aspects of the conceptual model used in this report.
Swamp-Wide, Surface-Water Monitoring
The FWS periodically measures water levels in ditches across the refuge using staff plates as part of an effort that began in the early 1990s. Staff plates historically were not referenced to a common vertical datum, and data were not consistently and reliably stored. Beginning in 2010, refuge staff upgraded this program, referencing all staff plates to NAVD 88 and storing all data in a refuge database. Forty water-monitoring sites presently are located on ditches throughout the swamp, and water levels are measured every 2 months. Flow is measured periodically at 10 of these sites; water levels are measured continuously at 5 of these sites (table 2). This program is creating a long-term water-level and flow record that can be used with modeling and other efforts to (1) develop effective water-management decisions, (2) prioritize sites for additional water-control structures, and (3) evaluate ditch hydrologic responses to weather and water-control-structure management.
Table 2.
Ditch sites at which the U.S. Fish and Wildlife Service periodically measures water levels and (or) flow and U.S. Geological Survey streamflow-gaging stations referenced in this report but not operated for these studies.[Latitude and longitude are in degrees, minutes, and seconds and presented as two-digit degrees followed by two-digit minutes, followed by two or more digit seconds. For example, 763309.57 is 76 degrees, 33 minutes, and 9.57 seconds. D, ditch; nr, near; VA, Virginia; NC, North Carolina]
Study Methods
Data were collected continuously and periodically from networks that included water-table wells, piezometers open to the lower peat, piezometers open to the sand underlying the peat, ditch sites, and precipitation gages as appropriate for each study. The lithology of the boreholes was described, and the hydraulic characteristics of the peat and sand were evaluated qualitatively. Groundwater levels used in this report are only from water-table wells open to the peat and (or) sand; data from piezometers open to the lower peat and sand underlying saturated peat are not used.
Data-Collection Networks
A network of well and ditch sites was established for each project on the basis of project needs and the conceptualizations of the local flow system. Although data from many sites are not used directly in this report, data from most sites helped in the development and refinement of the conceptual hydrologic model.
Wells
Water-table wells having screens open to the peat and (or) sand were constructed at 67 sites. Wells consisted of 2-in.-diameter polyvinyl chloride well casings and screens (0.010-in.-wide openings) installed in 4-in.-diameter holes hand bored into the peat and (or) sand. After each hole was bored, water was baled or pumped from the borehole until the water was free of peat particles to minimize plugging of well screens and well-filter sand when the wells were installed. Boreholes were pumped until the water was clear using a centrifugal “trash” pump having a rated pumping capacity of 36 gallons per minute until water was clear. In holes where the water table was in the upper part of the peat, water cleared within 2 minutes when pumped at the maximum rate. During pumping, the amount of drawdown was estimated but was not measured because of the difficulty in establishing a stable measuring point. In these holes, the water table typically declined less than 0.1 ft when the borehole was pumped continuously at the maximum rate. In holes where the water table was in the lower part of the peat or sand, however, the hole was dry within about 10 seconds and briefly spurted water about every 20–120 seconds during pumping.
Screened intervals extended from the bottom of the hole to land surface. The annular space between the well screen and borehole wall was filled with #2 well-filter sand. Wells were bailed or pumped to remove peat or sediment plugging the well screens. Details on construction methods and resolution of problems encountered because of the peat and other natural characteristics of the system are documented in detail in appendix 1 to assist in future efforts in the swamp.
Data on wells constructed at 17 sites in transects along the north-south and east-west firebreaks in Block C1 (fig. 9; table 3) are used in this report. The section for the two-dimensional flow model in Eggleston and others (2018) coincides with the north-south transect and is identified as “X–X′” in fig. 9. Wells are located about 5 ft, 100 ft, 300 ft, 1,300 ft, and 2,600 ft from both ends of each transect. Well C00W at the intersection of the transects is the 2,600-ft well for each transect. Data from 9 (table 4) of the 25 wells at the nine (2 sites are adjoining) Land Carbon study sites (fig. 1) are used in this report. Data from wells constructed at 25 sites (fig. 10; table 5) in the northeastern quadrant of the swamp (fig. 1) also are used in this report. In general, wells in the northeastern quadrant are at the corners of the eastern and the western blocks in the quadrant and along north-south and east-west transects across each block (fig. 10). Transects extend from the midpoint on one side of a block to the midpoint on the opposite side of that block. Corner wells generally are 100 ft from each ditch forming that corner. Transect wells generally are about 100 ft and 1,300 ft from each end of the transect. Details on locations of all wells and well nomenclature are presented in appendix 1.
Table 3.
Description of well and ditch monitoring sites at which water levels and precipitation were measured, including frequency and type of measurement, in Block C1, the Great Dismal Swamp, Virginia and North Carolina.[Latitude and longitude are in degrees, minutes, and seconds and presented as two-digit degrees followed by two-digit minutes, followed by two- or more digit seconds. For example, 763309.57 is 76 degrees, 33 minutes, 9.57 seconds. D, ditch; nr, near; VA, Virginia; NC, North Carolina; VA, Virginia; NC, North Carolina; N/A, not applicable]
Table 4.
Description of Land Carbon sites at which a Retract-A-Tip was used to collect water-quality samples, the Great Dismal Swamp, Virginia and North Carolina.[Latitude and longitude are in degrees, minutes, and seconds and presented as two-digit degrees followed by two-digit minutes, followed by two or more digit seconds. For example, 763309.57 is 76 degrees, 33 minutes, 9.57 seconds]
Table 5.
Description of wells in the northeastern quadrant of the swamp, including measurement frequency, the Great Dismal Swamp, Virginia and North Carolina.[Latitude and longitude are in degrees, minutes, and seconds and presented as two-digit degrees followed by two-digit minutes, followed by two or more digit seconds. For example, 763309.57 is 76 degrees, 33 minutes, 9.57 seconds; DCH, ditch; MI, mile; BL, below; NR, near; VA, Virginia; AB, above; CS, control structure; CR, creek; W, west; YDS, yards; D, ditch]
Groundwater levels were measured periodically in all wells and continuously in selected wells, depending on their location and purpose. Periodic water levels were measured at approximately 2-month intervals to the nearest 0.01 ft using an electrical or steel water-level tape. All continuously measured groundwater levels were measured at 15- or 30-minute intervals to the nearest 0.01 ft. At sites where transmission to satellites was possible, levels in wells were measured using KPSI, 0- to 35-ft, vented pressure transducers and recorded using Sutron SatLink (SAT) or SatLink2 (SAT2) data-collection platforms (DCPs). Data from these sites were transmitted through satellites to the USGS National Water Information System (NWIS) database (U.S. Geological Survey, 2019) as a part of the “real-time” network. For wells where the forest-canopy density prevented transmission to satellites, In Situ Level Troll 700H, 0- to 35-ft, vented pressure transducers having internal logging capability measured and recorded groundwater levels continuously. Data were downloaded from internal logging pressure transducers and loaded into the USGS NWIS database when water levels were measured periodically. Periodic measurements were used to verify and adjust continuous water-level data.
Ditches
In the Block C1 study, ditch-monitoring sites were at both ends of each transect (table 3; fig. 9). In the northeastern quadrant of the swamp, ditch-monitoring sites were (1) at 3 of the 4 ends of the two transects in the western block, (2) upstream and downstream from one water-control structure constructed during the study, and (3) upstream and downstream from one structure repaired during the study (table 5; fig. 10). Sites at the end of transects are at East Ditch at the western end of the east-west transect (station number 364259076262300), Juniper Ditch at the southern end of the north-south transect (station number 364145076245400), and Big Entry Ditch west of Portsmouth Ditch at the north end of the north-south transect (station number 364355076245000). One paired set of pressure transducers is at the water-control structure constructed at Rosemary Ditch above Big Entry Ditch. One transducer (364312076211800) is above the structure, and one (station number 364314076211900) is below the structure. The other paired set of pressure transducers at the control structure repaired during the study is at Portsmouth Ditch above and below the structure at Big Entry Ditch, station numbers 364336076231400 and 364336076231300, respectively. Water levels also are measured continuously with paired pressure transducers operated by the FWS upstream and downstream from structures at the Camp Ditch inflow into East Ditch and Portsmouth Ditch upstream from its confluence with Rosemary Ditch (table 2). The altitude of the measuring point for each ditch site was measured in the same manner as for wells, usually from the same reference point as used for nearby wells.
All continuously measured ditch-water levels were measured at 15- or 30-minute intervals to the nearest 0.01 ft. At sites where transmission to satellites was possible, levels in wells and ditches were measured using KPSI, 0- to 35-ft, vented pressure transducers and recorded and transmitted using SAT or SAT2 DCPs. Ditch levels measured continuously were referenced to staff plates at each site referenced to NAVD 88.
Precipitation
Precipitation was measured to the nearest 0.01 in. at 15- or 30-minute intervals using tipping-bucket rain gages, recorded, and transmitted using the Sat or Sat2 DCPs at 5 sites in Block C1 (table 3) and 2 sites in the northeastern quadrant of the swamp (table 5). Precipitation was not measured at Land Carbon study sites because sites were spread across the swamp, and forest canopy at the sites prevented measurement of reliable precipitation data. In Block C1, precipitation was measured at the center of the Block and near each end of each transect near the ditches (table 3). Precipitation sites in the northeastern quadrant of the swamp were near the intersection of the east-west transect across the western block with East Ditch and at the confluence of Portsmouth and Big Entry Ditches (table 5).
Hydraulic Characteristics
Hydraulic characteristics of the peat and mineral sediment affect the storage, release, and flow of groundwater throughout the swamp. They include porosity, specific yield, and hydraulic conductivity. Porosity is the total volume of pore space around and within the peat or mineral-sediment particles that can store water relative to the total volume (pore space plus particle volume). It is expressed as the decimal fraction or percent of the total volume. Specific yield of peat or mineral sediment is the volume of water that drains by gravity also expressed as a decimal fraction or percent of the total volume (Freeze and Cherry, 1979). The difference between specific yield and porosity, called specific retention, is the water that remains in the pore space after gravity drainage expressed as the decimal fraction or percent of the total volume. Part of the water remaining after gravity drainage is available for use by the forest community. As groundwater levels decline, any part of that water that dries or is taken up by the forest community must be replenished by infiltrating precipitation before the groundwater is recharged, thereby delaying the rise in groundwater levels. Hydraulic conductivity is a measure of the ability of water that saturates the pore space to flow through the material and reflects how well the pore space is interconnected. High specific yield and high hydraulic conductivity typically occur together. High sediment porosity, however, can accompany high or low specific yield and hydraulic conductivity.
Estimates of the magnitude of the hydraulic characteristics of the peat and mineral sediment of the swamp were based on several methods. Porosity was calculated from laboratory analyses of peat cores collected at Land Carbon sites and reported in Drexler and others (2017). Relative hydraulic conductivity was inferred from observed responses of groundwater levels to pumping water from holes bored into the peat and sand during well construction. Hydraulic conductivity values were derived from calibration of the numerical model simulating flow across the swamp (Eggleston and others, 2018).
Specific yield can be determined by several methods. It typically is calculated from laboratory tests of discrete intervals of peat and mineral-soil cores (Johnson, 1967). Specific yield for the Great Dismal Swamp peat and underlying sand, however, was calculated by comparing the incremental rise in groundwater levels with the incremental change in precipitation for selected precipitation events. This is a modification of the water-table fluctuation method for determining groundwater recharge discussed by Healy and Cook (2002) in which measured water-level fluctuations and specific yield are used to estimate recharge. To calculate specific yield, however, the incremental amount of precipitation, after that for interception and rewetting unsaturated peat and (or) sand, was divided by the consequent, incremental rise in groundwater level. Precipitation after interception and peat rewetting is assumed to be recharge. This method appears to be valid in the swamp because of the shallow water table and high hydraulic conductivity of the peat. It potentially provides a better value than other methods because it integrates the effects of lateral heterogeneities in the peat that might be represented disproportionately in individual peat cores, limits effects of compaction of the peat cores during collection that reduces specific yield, and provides incremental values through the range of depth of groundwater levels. Specific yield was calculated from water-level responses in well C00W in the center of Block C1 (table 3) and selected wells within the northeastern quadrant of the swamp (table 5). Specific yield was not calculated at Land Carbon sites because no precipitation gage was near these sites. Well C00W at the center of Block C1 was selected and used to develop and verify the method because continuous data from this well were least affected by upgradient groundwater sources and boundary conditions, such as ditches and roads. Additionally, the site had a shallow water table, limited tree canopy, and rapid recharge by precipitation, characteristics consistent with guidelines of Healy and Cook (2002). The site also had a precipitation gage at the well. Only events for which precipitation appreciably exceeded interception and rewetting of unsaturated peat and (or) sand were considered.
Water-Budget
Components of the water budget were calculated monthly using water levels from well C00W in the center of Block C1 and precipitation measured by the adjacent precipitation gage; monthly values were summed for the 2010 calendar year. Components include inputs, input storage, discharges, and change in storage. Precipitation was the only input as substantiated by cross-sectional, flow-model simulations of Block C1 (Eggleston and others, 2018). No evidence of surface runoff was identified by field observations during the year. Precipitation was stored in one of three reservoirs: plant surfaces and land surface as intercepted water, rewetting of unsaturated peat; and the aquifer as groundwater recharge. Discharge included ET of precipitation from interception and rewetting of unsaturated peat, ET of groundwater by plants, and groundwater discharge into the ditches.
Precipitation for interception and rewetting unsaturated peat was the precipitation falling during each precipitation event before groundwater levels rose. Precipitation required for interception could not be differentiated from that rewetting unsaturated peat. All precipitation required for interception and rewetting unsaturated peat was assumed to discharge subsequently as ET. The remaining precipitation recharged groundwater.
Groundwater recharge, groundwater discharge into the ditches, and groundwater discharge as ET were calculated daily from groundwater-level changes based on the well hydrograph and specific yield and then summed for each month. These were calculated by multiplying specific yield for the aquifer interval through which groundwater levels changed by the change in the groundwater level. If groundwater levels changed through intervals of differing specific yield, specific yield representative of each interval was multiplied by the amount of change in level through that interval. Groundwater recharge was calculated from the rise in groundwater levels resulting from precipitation. Groundwater discharge into ditches was calculated by using the decline in groundwater levels in the absence of ET (Johnson, 1967). This decline was the full decline over each 24-hour period during the non-growing season. Discharge as ET and into ditches during the growing season was calculated by a modification of the method described by White (1932) because groundwater levels did not rise during the night as described by White (1932) but declined throughout the night. During the growing season, the nighttime rate of decline was extrapolated over 24 hours to determine the daily discharge into the ditches. ET was calculated by subtracting the 24-hour decline for discharge into ditches from the total measured 24-hour decline. During the non-growing season, ET discharge was assumed to be only the precipitation required for interception and rewetting unsaturated peat because declines in groundwater levels appeared to be uniform each 24-hour period.
Change in storage was calculated monthly rather than daily by multiplying the specific yield for the interval(s) through which groundwater levels changed by the change in groundwater levels through each interval from the beginning to end of each month. A net rise in levels was an increase in storage, whereas a decline was a reduction in storage.
Water Quality/Chemistry
Interpretations of the quality and chemistry of water in the swamp are based on two study components. The first component is the bi-monthly collection and analysis of groundwater samples from the nine Land Carbon sites (sites 42–50, table 6; fig. 11). For the second component, the quality of ditch water and standing swamp water across the swamp and groundwater in the northeastern quadrant was measured during a synoptic, water-quality survey (sites 1–41 and 51–90, table 6; fig. 11). All samples were collected, processed, preserved, and analyzed according to USGS protocols (U.S. Geological Survey, 2012). Processing included filtering aliquots of samples through 0.45-micrometer, pore-sized filters. Results of analyses of these aliquots are identified as “filtered” in tables of this report. Such analyses are identified as “dissolved” in the text of this report. Results include a combination of characteristics analyzed by the USGS National Water Quality Laboratory (NWQL) for samples collected from the Land Carbon sites and measured in the field for both components.
Table 6.
Description of well, ditch, and swamp sampling sites, in the synoptic water-quality survey, March 15–23, 2016, and Land Carbon wells sampled March 29–31, 2016, the Great Dismal Swamp, Virginia and North Carolina.[Latitude and longitude are in degrees, minutes, and seconds and presented as two-digit degrees followed by two-digit minutes, followed by two or more digit seconds. For example, 763309.57 is 76 degrees, 33 minutes, 9.57 seconds; BE, Big Entry Ditch; CC, Cross Canal Ditch; CP, Corapeake Ditch; FL, Forest Line Ditch; IN, Interior Ditch; LCGW, Land Carbon groundwater; LY, Lynn Ditch; M C, Moss Creek; PM, Portsmouth Ditch; RM, Rosemary Ditch; RR, Railroad Ditch; WA, Washington Ditch; US, upstream; DS, downstream; SW, surface water; GW, groundwater; ft, foot; mi, mile]
| Site sequence number (shown in figure 11) | Station number | Latitude (north) | Longitude (west) | Short name | Station description | Source type |
|---|---|---|---|---|---|---|
| 1 | 364415076263501 | 364414.64 | 762634.98 | BE01 | Well WNW01, 59B25 | GW |
| 2 | 364404076254200 | 364404.00 | 762542.00 | BE02 | Big Entry Ditch US of Portsmouth Ditch, parking area | SW |
| 3 | 364355076245000 | 364354.84 | 762450.08 | BE03 | Big Entry Ditch US of Portsmouth Ditch near well WN01 | SW |
| 4 | 364354076245001 | 364354.41 | 762450.47 | BE04 | Well WN01, 59B17 | GW |
| 5 | 364346076245100 | 364346.02 | 762451.19 | BE05 | Well WN13, 59B18 | GW |
| 6 | 364257076242500 | 364227.00 | 762426.00 | BE06 | Midpoint Big Entry Ditch US of Portsmouth Ditch | SW |
| 7 | 364201076240200 | 364200.70 | 762401.50 | BE07 | Big Entry Ditch US of Portsmouth Ditch | SW |
| 8 | 364336076231300 | 364336.01 | 762313.67 | BE08 | Big Entry Ditch DS of Portsmouth Ditch | SW |
| 9 | 364325076221701 | 364325.21 | 762217.21 | BE09 | Big Entry Ditch Midpoint DS of Portsmouth Ditch | SW |
| 10 | 364325076221801 | 364324.53 | 762217.51 | BE10 | Well EN01, 60B38 | GW |
| 11 | 364312076222301 | 364312.18 | 762223.48 | BE11 | Well EN13, 60B39 | GW |
| 12 | 364314076211900 | 364314.34 | 762119.44 | BE12 | Big Entry Ditch US of Rosemary Ditch | SW |
| 13 | 364312076212001 | 364312.22 | 762119.55 | BE13 | Well ENE01, 60B43 | GW |
| 14 | 363053076295300 | 363053.09 | 762952.62 | CC01 | Cross Canal Ditch US of culvert at Weyerhaeuser Ditch | SW |
| 15 | 363018076295500 | 363018.07 | 762855.06 | CC02 | Weyerhaeuser Ditch at Maple 2 | SW |
| 16 | 363051076295100 | 363050.66 | 762951.17 | CC03 | Weyerhaeuser Ditch US of Cross Canal Ditch | SW |
| 17 | 363052076294900 | 363052.43 | 762949.26 | CC04 | County Line Ditch DS of Cross Canal Ditches | SW |
| 18 | 363054076294900 | 363053.55 | 762949.11 | CC05 | Cross Canal Ditch DS of Weyerhaeuser /County Line Ditches | SW |
| 19 | 363053076280600 | 363053.10 | 762805.64 | CC06 | Cross Canal Ditch US of Forest Line Ditch | SW |
| 20 | 363052076280600 | 363052.45 | 762805.64 | CC07 | Cross Canal Ditch DS of Forest Line Ditch | SW |
| 21 | 363302076324800 | 363301.59 | 763248.26 | CP01 | Corapeake Ditch near head of flow | SW |
| 22 | 36331076324800 | 363301.45 | 763248.26 | CP02 | Swamp across road on Corapeake near the head of flow | SW |
| 23 | 363248076321200 | 363248.23 | 763212.15 | CP03 | Corapeake Ditch last bend before straight section | SW |
| 24 | 363248076321200 | 363247.68 | 763212.14 | CP04 | Swamp across from bend in Corapeake Ditch | SW |
| 25 | 363249076313300 | 363248.65 | 763133.00 | CP05 | Corapeake Ditch at Sherrill Ditch | SW |
| 26 | 363248076313200 | 363247.95 | 763132.42 | CP06 | Sherrill Ditch US of Corapeake Ditch | SW |
| 27 | 363248076313200 | 363247.78 | 763131.73 | CP07 | Swamp southwest of Corapeake Ditch at Sherrill Ditch | SW |
| 28 | 363249076301900 | 363249.34 | 763018.82 | CP08 | Corapeake Ditch at western end of burn scar | SW |
| 29 | 363250076280400 | 363250.18 | 762803.55 | CP09 | Corapeake Ditch US of Forest Line Ditch | SW |
| 30 | 363251076264800 | 363250.89 | 762647.89 | CP10 | Corapeake Ditch at Western Boundary Ditch | SW |
| 31 | 363252076253400 | 363252.10 | 762534.40 | CP11 | Myrtle Ditch at Corapeake Ditch | SW |
| 32 | 363319076253600 | 363319.00 | 762536.00 | CP12 | Myrtle Ditch at Pocosin 2 | SW |
| 33 | 363252076253500 | 363251.54 | 762534.67 | CP13 | Corapeake Ditch DS of Myrtle Ditch | SW |
| 34 | 363248076313200 | 363247.91 | 763132.32 | FL01 | Forest Line Ditch US of Corapeake Ditch | SW |
| 35 | 363157076280400 | 363157.27 | 762804.38 | FL02 | Forest Line Ditch at Kim Saunders Ditch | SW |
| 36 | 363157076280300 | 363157.41 | 762803.33 | FL03 | Kim Saunders Ditch DS of Forest Line Ditch, no connection | SW |
| 37 | 363054076280500 | 363053.59 | 762805.12 | FL04 | Forest Line Ditch US of Cross Canal Ditch, gage height=16.18 ft | SW |
| 38 | 363524076312200 | 363524.32 | 763121.95 | IN01 | Interior Ditch Downstream of West Ditch, no connection | SW |
| 39 | 363527076302500 | 363526.77 | 763024.56 | IN02 | Interior Ditch, last trees on left at burn scar | SW |
| 40 | 363530076291800 | 363530.01 | 762918.34 | IN03 | Interior Ditch at Lake Drummond | SW |
| 41 | 363530076291600 | 363529.95 | 762915.71 | IN04 | Lake Drummond at Interior Ditch | SW |
| 42 | 363256076272103 | 363255.71 | 762721.17 | LCGW1 | Well Cedar 1 | GW |
| 43 | 363257076272203 | 363256.96 | 762722.00 | LCGW2 | Well Cedar 2 | GW |
| 44 | 364028076270103 | 364027.89 | 762701.44 | LCGW3 | Well Cedar 3 | GW |
| 45 | 362954076284703 | 362954.00 | 762846.92 | LCGW4 | Well Maple 1 | GW |
| 46 | 363018076295303 | 363018.09 | 762953.14 | LCGW5 | Well Maple 2 | GW |
| 47 | 363642076312503 | 363641.89 | 763125.36 | LCGW6 | Well Maple 3 | GW |
| 48 | 364317076294503 | 364317.59 | 762945.71 | LCGW7 | Well Pocosin 1 | GW |
| 49 | 363320076253303 | 363319.39 | 762533.41 | LCGW8 | Well Pocosin 2 | GW |
| 50 | 363253076255503 | 363252.82 | 762555.09 | LCGW9 | Well Pocosin 3 | GW |
| 51 | 363823076314000 | 363822.96 | 763140.16 | LY01 | Lynn Ditch at Washington Ditch | SW |
| 52 | 363915076314200 | 363914.97 | 763142.39 | LY02 | Lynn Ditch, 1.0 mi from Washington Ditch | SW |
| 53 | 363935076314300 | 363934.75 | 763143.22 | LY03 | Lynn Ditch, 1.4 mi from Washington Ditch, US of Badger Ditch | SW |
| 54 | 363934076314400 | 363934.30 | 763143.64 | LY04 | Badger Ditch Upstream of Lynn Ditch | SW |
| 55 | 364029076314500 | 364028.76 | 763144.85 | LY05 | Lynn Ditch, 2.4 mi from Washington Ditch | SW |
| 56 | 364122076314500 | 364121.64 | 763144.62 | LY06 | Lynn Ditch, 3.4 mi from Washington Ditch | SW |
| 57 | 364213076314300 | 364212.98 | 763143.46 | LY07 | Lynn Ditch, 4.4 mi from Washington Ditch | SW |
| 58 | 364258076314300 | 364257.52 | 763143.15 | LY08 | Lynn Ditch at Jericho Ditch, 5.4 mi from Washington Ditch | SW |
| 59 | 364258076314300 | 364257.92 | 763143.01 | LY09 | Jericho Ditch US of Lynn Ditch; flow east | SW |
| 60 | 363501076324200 | 363501.09 | 763242.35 | MC01 | Moss Creek | SW |
| 61 | 364145076245400 | 364145.00 | 762454.00 | PM01 | Juniper Ditch | SW |
| 62 | 364146076245401 | 364146.46 | 762453.96 | PM02 | Well WS01, 59B19 | GW |
| 63 | 364153076245101 | 364153.02 | 762450.69 | PM03 | Well WS13, 59B 20 | GW |
| 64 | 364201076240200 | 364200.91 | 762401.58 | PM04 | Portsmouth Ditch US of Rosemary Ditch | SW |
| 65 | 364203076240301 | 364202.88 | 762402.88 | PM05 | Well WSE01, 59B28 | GW |
| 66 | 364247076233800 | 364247.26 | 762338.00 | PM06 | Mid-point Portsmouth Ditch | SW |
| 67 | 364247076233701 | 364247.05 | 762336.89 | PM07 | Well EW01 56B32 | GW |
| 68 | 364247076233901 | 364247.48 | 762339.16 | PM08 | Well WE01 59B21 | GW |
| 69 | 364251076235101 | 364250.58 | 762351.29 | PM09 | Well WE13 59B22 | GW |
| 70 | 364336076231400 | 364335.75 | 762313.84 | PM10 | Portsmouth Ditch US of Big Entry Ditch | SW |
| 71 | 364204076235900 | 364204.48 | 762358.75 | RM01 | Rosemary Ditch DS of Portsmouth Ditch | SW |
| 72 | 364206076235801 | 364205.62 | 762358.13 | RM02 | Well ESW01 59B34 | GW |
| 73 | 364215076224401 | 364215.38 | 762244.15 | RM03 | Rosemary Ditch east at Midpoint | SW |
| 74 | 364216076224401 | 364216.24 | 762244.26 | RM04 | Well ES01 59B30 | GW |
| 75 | 364224076224401 | 364224.48 | 762243.64 | RM05 | Well ES13 59B31 | GW |
| 76 | 364207076213200 | 364207.01 | 762131.76 | RM06 | Rosemary Ditch at turn from east-west to north-south orientation, near bridge | SW |
| 77 | 364235076213101 | 364234.92 | 762131.43 | RM07 | Well EE01W 60B40 | GW |
| 78 | 364238076214001 | 364237.62 | 762140.36 | RM08 | Well EE13 60B41 | GW |
| 79 | 364312076211800 | 364312.18 | 762118.18 | RM09 | Rosemary Ditch US of Big Entry Ditch | SW |
| 80 | 363715076325500 | 363715.22 | 763254.87 | RR01 | Railroad Ditch at the Underground Railroad Display | SW |
| 81 | 363715076312900 | 363714.98 | 763129.50 | RR02 | Railroad Ditch at West Ditch | SW |
| 82 | 363714076312900 | 363714.49 | 763129.39 | RR03 | West Ditch at Railroad Ditch, gage height=19.60 ft | SW |
| 83 | 363642076312700 | 363641.89 | 763127.38 | RR04 | West Ditch at Maple 3 | SW |
| 84 | 363524076312300 | 363524.05 | 763122.67 | RR05 | West Ditch at Interior Ditch | SW |
| 85 | 363859076332900 | 363858.86 | 763328.70 | WA01 | Washington Ditch at Pocosin Swamp inflow | SW |
| 86 | 363839076325000 | 363839.40 | 763249.81 | WA02 | Washington Ditch at parking lot and gate, 0.7 mi DS of Pocosin Swamp inflow | SW |
| 87 | 363837076323900 | 363836.51 | 763238.88 | WA03 | Washington Ditch 0.9 mi. DS of Pocosin Swamp inflow | SW |
| 88 | 363823076314000 | 363822.73 | 763140.37 | WA04 | Washington Ditch 1.9 mi DS of Pocosin Swamp inflow, US of Lynn Ditch, gage height=20.18 ft | SW |
| 89 | 363807076303100 | 363806.51 | 763031.31 | WA05 | Washington Ditch 3.0 mi DS of Pocosin Swamp inflow | SW |
| 90 | 363752076293000 | 363752.01 | 762929.85 | WA06 | Washington Ditch, 4.0 mi DS of Pocosin Swamp inflow | SW |
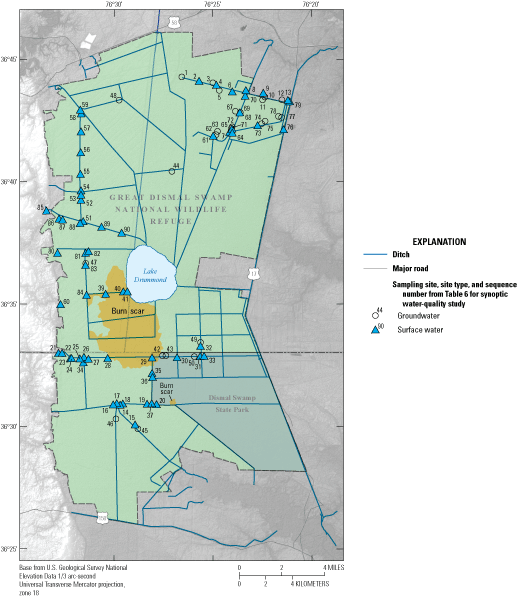
Location of the ditch, swamp, and groundwater sampling sites for the synoptic water-quality survey, March 15–23, 2016, and Land Carbon sites sampled March 29–31, 2016, the Great Dismal Swamp, Virginia and North Carolina. [Sites are identified by the sequence number in table 6]
Because of differences between the pH of groundwater from Land Carbon sites Maple 2 and Maple 3 (sites 46 and 47, table 6; fig. 11) and the pH of groundwater from the other seven Land Carbon sites, the synoptic water-quality survey was undertaken to better understand the effects of sources and flow across the swamp on water quality/chemistry. The synoptic survey was conducted March 15–23, 2016, at 81 sites (site 1–41 and 51–90, table 6; fig. 11) because it was a period of high but slowly decreasing flow having substantial flow of groundwater and stream water across the scarp without the rapidly changing conditions typical of periods having appreciable surface runoff. Samples were collected from water flowing through ditches, nearby water standing in the swamp at locations across the swamp from ditch sites, and groundwater from wells in the northeastern quadrant of the swamp. Samples were collected from Land Carbon wells from March 29–31, 2016.
Three types of ditch sites were selected to represent anticipated sources of water and changes in chemistry across the swamp. One type of site was the head of flow in a ditch where groundwater or stream water flowed across the scarp and entered the ditch. A second type of site was at confluences of two ditches where water from both ditches collected far enough above their confluence to avoid mixing of the two waters. The third type consisted of intermediate points along a ditch between the first two types of sites. Standing water in the swamp also was sampled where present near ditch sites if the swamp was reasonably accessible.
Water temperature, pH, specific conductance, and dissolved oxygen concentration were measured in the field using a calibrated, multi-parameter water-quality sonde. Samples of swamp and ditch water were measured in situ. For groundwater from wells in the northeastern quadrant of the swamp, the sonde was lowered into the well, placing the sensors just above the top of the screened interval.
Hydrology
The hydrology of the Great Dismal Swamp is controlled by a groundwater system interconnected with a surface-water system that collectively function as a single hydrologic system. Attributes of the system control the hydrology, affecting water storage, levels, flow, and discharge. Collectively, these controls and responses to them are critical parts of the conceptual groundwater flow model that modifies and expands on the conceptual models of Lichtler and Walker (1974) and Eggleston and others (2018).
The system has a combination of natural and human-made controls within and outside the swamp. Natural controls include geology, topography, wetland forests, precipitation, Lake Drummond, and streams surrounding the swamp. Human-made controls include ditches, adjacent spoil-pile roads, railroad grades, the Feeder Ditch, the Dismal Swamp Canal, and associated infrastructure. Attributes of these controls differ spatially and temporally, which cause spatially different and temporally changing responses across the swamp. Understanding spatial and temporal variability in controls and responses is essential for developing achievable management goals and effective management strategies for the hydrology at local to swamp-wide scales.
Groundwater System
The groundwater system consists of aquifers and confining units that form the shallow part of a regional aquifer system that extends across the Atlantic Coastal Plain of Virginia, North Carolina, and adjacent States. These aquifers and confining units consist of organic-peat and mineral sediments. The hydraulic characteristics of these sediments are the basis for their classification as aquifers or confining units.
Geology
The geology of the swamp consists primarily of the Dismal Swamp peat at land surface and underlying formations, consisting primarily of mineral sediment. In some areas, the peat is absent, and the mineral sediment is at land surface.
Mineral Sediment
The mineral sediment is of modern to Cretaceous age and extends laterally beyond the peat and vertically to bedrock at depths ranging from about 1,500 ft beneath the Suffolk scarp to about 2,300 ft beneath the Dismal Swamp Canal (McFarland and Bruce, 2006). These formations typically are thicker and deeper to the east. Only sediments of Tertiary age and younger at depths less than 110 to 175 ft directly affect the swamp, according to numerical-model simulations of groundwater flow through the Coastal Plain aquifers (Heywood and Pope, 2009). The deepest of the shallow sediments form the Eastover and Yorktown Formations of Tertiary age, which extend from west of the Isle of Wight Plain to the east beneath the swamp and beyond the coast. The Eastover Formation consists of silty sand, shelly fine-grained sand, and clay. The Yorktown Formation consists of marine clay, silt, sand, and coquinite (a cemented carbonate).
Oaks and Coch (1973) identified four relatively shallow formations, containing mineral sediment beneath the swamp that overlie the Yorktown Formation. From deepest to shallowest, these are Sedley, Norfolk, Londonbridge, and Sand Bridge Formations. The Norfolk Formation, however, was renamed the Tabb Formation (Johnson and others, 1985) and is identified as such in subsequent literature and this report. These formations create a complex, interlayered pattern that typically extends to depths of less than 10 ft near the northern end of the Suffolk scarp but up to about 30 ft near the southern end of the scarp and east to the Dismal Swamp Canal (Oaks and Coch, 1973). The Sedley Formation consists of marine and estuarine clay, silt, and fine-grained sand that directly overlies the Yorktown Formation in limited areas near the toe of the scarp. The Tabb Formation consists of a beach and dune deposits of coarse-grained sand facies at the toe of the scarp but becomes a shoreface deposit of medium-grained sand across the swamp from about 2 mi east of the toe of the scarp. The Tabb Formation overlies the Sedley Formation where both are present and the Yorktown Formation elsewhere. Along the toe of the scarp, the Londonbridge Formation (a lagoon, clayey-silt facies) and Sand Bridge Formation (a marsh and tidal-flat, silty-clay facies) separate the Tabb Formation from the peat. To the south, these formations are absent to the east of the toe of the scarp where the peat lies directly upon the medium-grained sand of the Tabb Formation. Farther north, the Londonbridge and Sand Bridge Formations extend eastward beyond the toe of the scarp beneath the entire swamp where they separate the Tabb Formation from the peat. Consequently, silt and clay separate the peat from coarse-grained sand along the entire toe of the scarp and medium-grained sand throughout the northern part of the swamp away from the scarp, whereas the silt and clay are absent to the south away from the scarp. A clayey sand facies of the Sand Bridge Formation underlies the peat in the northeastern quadrant of the swamp.
Although data on sediments beneath the Isle of Wight Plain are limited, the Sedley Formation overlies the Yorktown Formation near the Suffolk scarp (Oaks and Coch, 1973). The Sedley Formation is overlain by the Windsor Formation, which appears to be at land surface beneath much of the plain. The Windsor Formation is a silty sand facies (nearshore marine sediments) beneath the plain (Oaks and Coch, 1973). In limited areas near the Suffolk scarp, the Tabb Formation overlies the Windsor Formation and is at land surface.
Peat
The Dismal Swamp peat first formed in stream channels (Harrison and others, 1965) approximately 8,000–9,000 years ago (Whitehead, 1965; Stevens and Patterson, 1998). As in other peatlands, prolonged saturation of organic material by a shallow water table and (or) standing water limited the decomposition of the organic material and promoted conversion to peat (Oaks and Coch, 1973; Oaks and Whitehead, 1974). The upper clay and gentle slope of the Yorktown Formation and clayey facies of the overlying Sand Bridge and Londonbridge Formations undoubtedly contributed to these conditions (Oaks and Coch, 1973). As the peat accumulated, it impeded flow in the streams, filled the valleys, and expanded across the uplands to create the flat, present-day surface (Heath, 1975). Thus, the thickest peat overlies ancient valleys, whereas the thinnest peat overlies ancient uplands. Consequently, the topography of the top of the underlying sand, silt, and clay surface reflects the ancient surface-drainage system (Oaks and Coch, 1973). This surface represents early forms of the present-day drainage system where streams flowed east from the Isle of Wight Plain across the present-day swamp to the Northwest River to the east and the Pasquotank River to the south (Oaks and Coch, 1973).
Across the forested wetlands of the Great Dismal Swamp, leaves and other plant material (the duff layer) are underlain by a root mat of varying thickness (Kearney, 1901; Osbon, 1920; Lewis and Cocke, 1929; Henry, 1970; Oaks and Coch, 1973). Peat commonly fills space within the root mat and extends to the top of the sand, silt, and clay (Oaks and Coch, 1973; Oaks and Whitehead, 1974). Peat thickness can exceed 12 ft but commonly is 3 to 5 ft. The contact between the peat and mineral sediment is distinct in some areas, whereas it is a gradational transition in other areas where the sand, silt, and clay content of the peat increases with depth.
Two types of peat that reflected the dominant, overlying forest ecosystem originally were identified across the swamp: (1) black gum peat, a dark brown to black degraded peat and (2) juniper (cedar) peat, a dark to light brown, less degraded, fibrous peat (Kearney, 1901). Except in the peat and mineral-sediment transition, the peat has little mineral content, probably because few streams flowed through the system (Whitehead, 1965; Stevens and Patterson, 1998). Various sizes of partly decomposed tree and shrub parts are present throughout most peat. Large roots, branches, and trunks are so dense that when hand boring holes to depths of 5 ft or more, 3–6 attempts often were required at separate locations to achieve desired depths.
Field observations indicate that the consistency of the peat might have changed from that identified by Kearney (1901), possibly because of subsequent decomposition and other processes caused by fluctuating water levels from the extensive drainage through ditches since 1901. Kearney (1901) describes the highly degraded peat as mucky, which is the common description of the peat across the swamp by the 1960s and 1970s (Henry, 1970; Oaks and Coch, 1973; Oaks and Whitehead, 1974). The descriptions typically do not include characteristics typical of juniper peat.
As part of an analysis of groundwater levels in well C00W in the center of Block C1 (discussed in section “Hydraulic Characteristics”), a different response in groundwater levels to precipitation was noted between the upper and lower parts of the peat with a zone of transition between them. Throughout the remainder of this report, these are referred to as the “upper peat,” the “lower peat,” and the “upper/lower peat transition,” respectively. Close visual inspection of peat removed from subsequent boreholes revealed that the consistency of the mucky peat varies with depth in a manner not described in previous lithologic descriptions. Below the duff layer and root mat, (sometimes within the root mat), the upper degraded peat typically has a granular consistency that is particularly evident when drained and results from larger organic particles within the muck. The lower peat has a more clay-like, mucky consistency as described by previous researchers. A mixed transition zone lies between these two intervals.
Because the peat is similarly degraded throughout its vertical extent, these differences in consistency commonly are not identified, partly because the grains can be destroyed by drilling or boring holes; also, the material is pushed aside when holes are hand bored. Differences in the structure of the upper and lower peat are characterized as “sub-angular blocky” and “massive,” respectively, using the U.S. Department of Agriculture, Natural Resources Conservation Service Field Book (Natural Resources Conservation Service, 2012). Gently rubbing these particles between one’s fingers readily crumbles them into a consistency like that of the muck, demonstrating their fragile structure. Based on discussions with other scientists studying peatlands of eastern Virginia and North Carolina, this consistency is common elsewhere with the granular upper peat commonly described as “coffee-grounds.”
Once this difference in consistency was identified, field crews that were hand-boring holes to construct additional wells would reach into the boreholes to feel the sides of each borehole to identify and measure the depths of contacts between the different layers. This method provided greater accuracy than the retrieval of sediments using the auger because the auger commonly collapsed the duff layer and root mat after cutting through them and contained little peat when retrieved from the borehole. While feeling the sides of boreholes, 1- to 2-in. and larger solid “chunks” of peat not previously identified were retrieved from the sides of many boreholes. When this material was gently squeezed by hand, the material crumbled into the granular consistency typical of the upper peat. The particles became the consistency of the muck when gently rubbed between one’s fingers. This fragile physical structure of the chunks likely is a reason they were not identified previously.
The depth and thickness of the root mat and peat varies in lithologic logs from boreholes hand bored for the construction of project wells in the northeastern quadrant of the swamp, probably because this area is a limit of the extent of the peat. This variability partly results from a fire in 1930 that burned to depths of 6 ft into the peat (Oaks and Coch, 1973). Variability also can result from the decreasing wetness from west to east as the extent of standing water decreases and (or) the water-table depth increases. The depth of the bottom of the combined duff layer and root mat increases to the south and west from 0.0 to 0.2 ft along Big Entry Ditch to more than 0.5 ft along East Ditch, Juniper Ditch, and the southern arm of Rosemary Ditch and to 1.2 ft at well HE01 west of East Ditch (fig. 12).
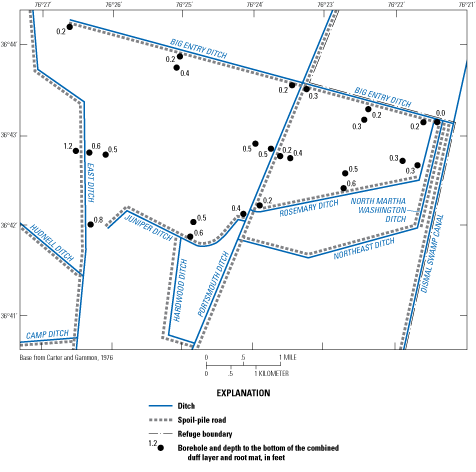
Boreholes with the depth of the bottom of the combined duff layer and root mat in the northeastern quadrant of the Great Dismal Swamp, Virginia and North Carolina.
The depth of the bottom of the peat (excluding the peat and mineral-sediment transition) also increases to the south and west. It ranges from 0 ft east of the confluence of Rosemary and Big Entry Ditches to more than 5 ft near East Ditch in the southwest corner of the study area (fig. 13). The thickness of the peat to mineral-sediment transition (depth of the transition minus the depth of the peat) is as great as 1.5 ft near East Ditch (fig. 13).
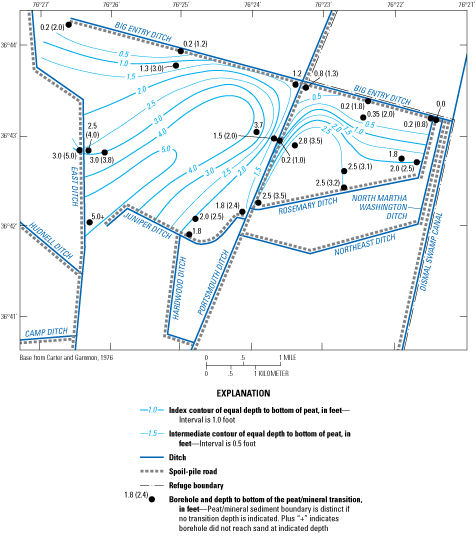
Boreholes with the depth of the bottom of the peat and the peat/mineral-sediment transition in the northeastern quadrant of the Great Dismal Swamp, Virginia and North Carolina.
Across the northeastern part of the swamp, the depth to the bottom of the upper peat increases toward the south and west (fig. 14). Where the root mat lies on the mineral sediment, space around the roots typically contains fibric or granular upper peat so that the bottom of the root mat is indicated as the bottom of the upper peat and is common along Big Entry Ditch. The depth to the bottom of the upper peat generally increases to 1.5–2.5 ft but can extend to 3.4 ft. Across the northeastern quadrant of the swamp, the upper peat is directly in contact with the mineral sediment or the transition from the peat to the mineral sediment at 19 of 25 sites (fig. 14, open circles); no upper/lower peat transition or lower peat was identified at these sites. The upper peat overlies the upper/lower peat transition or the lower peat at only six sites (fig. 14, solid circles).
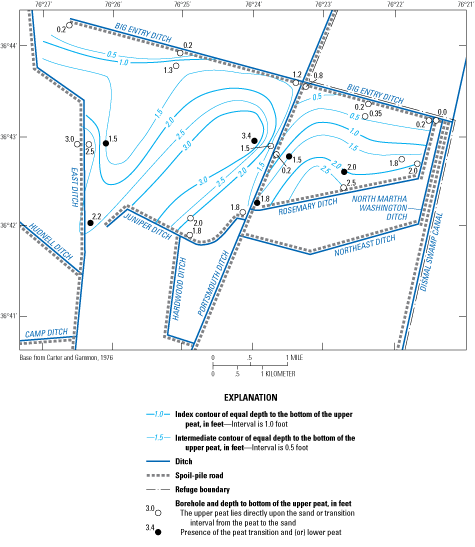
Boreholes with the depth to the bottom of the upper peat in the northeastern quadrant of the Great Dismal Swamp, Virginia and North Carolina.
Hydraulic Characteristics
Lateral and vertical heterogeneities in the specific yield, hydraulic conductivity, and thickness of the peat and mineral sediment affect where groundwater is recharged, is stored, and flows throughout the swamp. These characteristics are critical to delineating the aquifers and confining units of the shallow aquifer system and understanding their hydrologic response.
A difference between the specific yield of upper peat and lower peat in the swamp was first identified in the analysis of the response of groundwater levels to precipitation during seven selected events from November 2009 through September 2011 in well C00W at the center of Block C1. In this analysis, about 0.5–1.0 in. of precipitation was incorporated in the interception and rewetting of unsaturated peat before recharge began and groundwater levels rose during each event as highlighted by the logarithmic scale of the X axis in fig. 15A. Groundwater response to precipitation after interception and rewetting was rapid because of the limited open pine-forest canopy. Once recharge began, three zones characterized the rate of rise in groundwater levels: levels rose slowly within the upper peat (above a depth of 1.5 ft), rapidly within the lower peat (below a depth of about 2.0 ft), and at a changing rate in the upper/lower peat transition between depths of 1.5 and 2.0 ft, as highlighted by the arithmetic scale of the X axis in fig. 15B. Based on the rates of rise, specific yield of the upper peat averaged about 59 percent, whereas that of the lower peat averaged about 7.5 percent (table 7). Because the rate of rise was similar from land surface to the depth of 1.5 ft and the well was in a hollow, specific yield estimates appear to be minimally affected by nearby standing water. Typically, little standing water was observed when the water table was below land surface at the well. The specific yield of 59 percent for the upper peat is within the 56–63 percent identified for fibric peat in a Picea mariana (Black Spruce) bog in Canada (Petrone, and others, 2008). The specific yield of 7.5 percent for the lower peat is similar to the 8 percent of well-decomposed peat (Boelter, 1968).
Table 7.
Specific yield of peat calculated by comparing cumulative precipitation and changes in groundwater levels in well C00W in the center of Block C1 for selected events during 2009–11 and in wells in the northeastern quadrant of the swamp during 2015–16, the Great Dismal Swamp, Virginia and North Carolina.[Note: Within sediment type, specific yield is in order of increasing depth of interval. All values are in percent. --, no data]
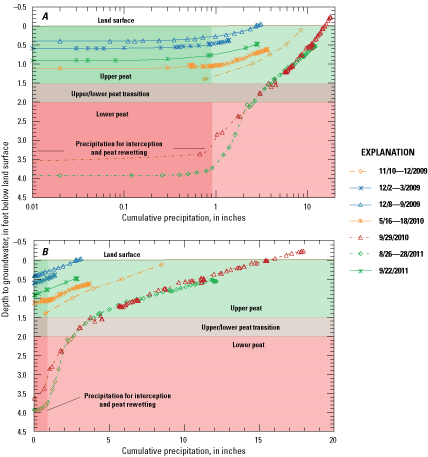
Response of groundwater levels in well C00W to cumulative precipitation for selected events, November 2009 through September 2011, in the center of Block C1 to determine A, the amount of precipitation incorporated in interception and rewetting of unsaturated peat before the rise in groundwater levels and B, the specific yield of upper and lower peat, the Great Dismal Swamp, Virginia and North Carolina.
Results of a similar analysis of nine wells across the northeastern quadrant of the swamp (HE01, WW13, WS01, WN01, WE13, WNE01, EW13, ENW01, and EE13) having adequate continuously measured groundwater levels shows possible vertical and spatial variations in the specific yield of the peat and sand (tables 7, 8). Precipitation events used for this analysis were limited to those having (1) groundwater levels below land surface, (2) appreciable precipitation after interception and rewetting unsaturated peat to create adequate groundwater recharge and a rise in groundwater levels, and (3) enough precipitation intensity. Because the canopy was denser in the northeastern part of the swamp than in Block C1, recharge appeared to be delayed as precipitation was intercepted by the canopy and then fell through the canopy or drained down the trunks of the trees. This delay caused periods of appreciable rise in groundwater levels during low-intensity precipitation periods following periods of less than about 1 hour of high-intensity precipitation so that the method was modified as discussed in the methods. These response characteristics also made numerous precipitation events unusable. Additionally, evaporation of the fallen precipitation, probably resulting from the tall dense canopy, excluded low-intensity precipitation periods.
Table 8.
Specific yield of sand calculated by comparing cumulative precipitation and changes in groundwater levels in well C00W in the center of Block C1 for selected events during 2009–11 and in wells in the northeastern quadrant of the swamp during 2015–16, the Great Dismal Swamp, Virginia and North Carolina.[Note: Within sediment type, specific yield is in order of increasing depth of interval. All values are in percent. --, no data]
Differences in specific yield of the peat likely reflect effects of differences in the formation and subsequent decomposition of the peat. Differences in specific yield of the sand likely reflect differences in its sand-grain size and silt and clay content. Although spatial variations might reflect true lateral variations within the peat, they also might reflect differences with depth. The number of values of specific yield varied among wells because specific yield was calculated only when groundwater levels changed through an appreciable interval of a material type during an event.
Standing water typically reflects an emergent water table where the root mat and peat are present at land surface because of their high permeability. Because this method averages effects of water levels over an unknown area, and the specific yield of standing water is 100 percent (has no media), standing water near wells limits the events useable for specific-yield calculations, even if no standing water is at the well because the presence of standing water near a well is caused by microtopography. Water levels typically were near or above land surface in the western part of the northeastern quadrant of the swamp because it is a wet part of the swamp. Most wells were in hollows so that standing water near the well was limited or absent when the water level in the well was near land surface. The one exception is well WW13; this well was on a hummock because standing water covered much of the surrounding land surface during well construction.
Water-level responses are depicted in four wells in fig. 16A–D as examples of responses observed. Specific yield calculated at well WW13 decreased from 100 percent (indicating standing water) at groundwater depths of 0.3–0.5 ft to 70 percent at depths of 0.75–0.95 ft (fig. 16A). This high, decreasing-with-depth specific yield is consistent with a decrease in the amount of standing water and decreasing groundwater levels from a qualitative assessment of the site. Between depths of about 1.0 and 1.5 ft, specific yield was 39 and 42 percent, consistent with that of other wells across the study area.
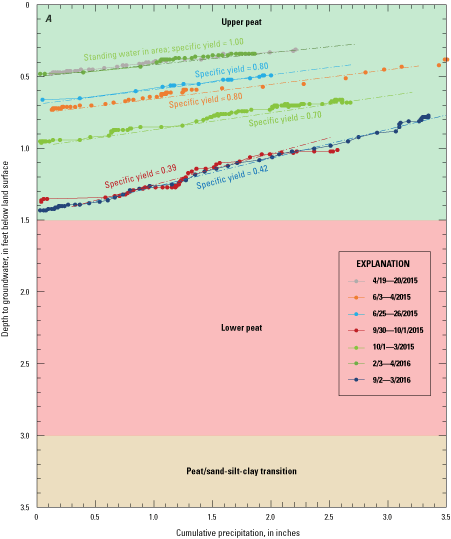
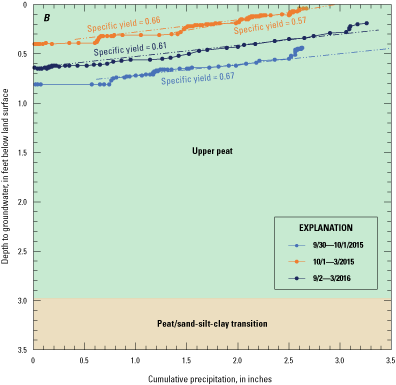
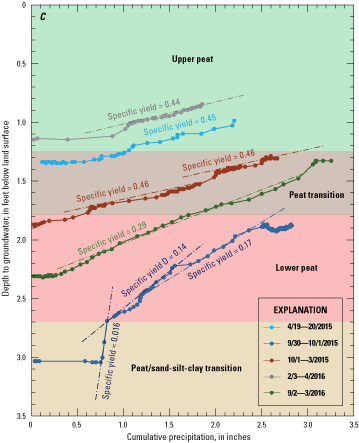
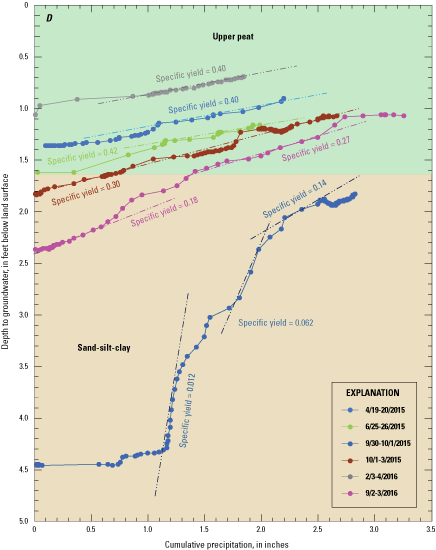
Response of groundwater levels to precipitation during selected precipitation events April 19, 2015, through September 3, 2016, used to estimate specific yield of the peat depicting A, the effects of standing water near well WW13, B, the absence of effects of standing water near well HE01, C, vertical differences in specific yield of the peat at well EW13, and D, vertical differences in specific yield of the peat and sand at well EE13 in the northeastern quadrant of the Great Dismal Swamp, Virginia and North Carolina.
At well HE01 to the west of East Ditch, useable precipitation events were limited to those during dry, summer periods because standing water was present at the well at other times. When the water table was below land surface, little standing water was near the well because the well was in a hollow. Specific yield at this well ranged from 57 (shallowest interval) to 67 percent (deepest interval) and averaged 63 percent at depths to 0.8 ft (table 7; fig. 16B). Because specific yield increased with depth, the change represents peat characteristics, not standing water. The average is similar to the 59 percent observed in well C00W in Block C1 (fig. 15). At other wells throughout the northeastern quadrant of the swamp, specific yield reflects a general, although not fully consistent, downward trend with depth as observed in well EW13 (tables 7, 8; fig. 16C). The lithologic log of well EW13 was the only log having the upper peat, lower peat, and sand.
For all wells having groundwater levels that fluctuated 1 ft or more through the sand during precipitation (WS01, WN01, WNE01, EW13, ENW01, and EE13), specific yield of the sand ranged from 1 to 33 percent and averaged 17 percent (table 8). Well EE13 reflects differences in the response between the peat and sand and over a 2.5-ft interval of sand (fig. 16D). The cause of the range in the sand is difficult to determine because the method integrates the effects of an unknown area where sediment characteristics likely differ from those observed in the well borehole. In comparison, Johnson (1967) reported specific yield averages of 8 percent for silt, 7 percent for sandy clay, 21 percent for fine-grained sand, and 26 percent for medium-grained sand.
Porosity of the upper peat averaged 87–91 percent at the nine Land Carbon sites (Drexler and others, 2017), which is consistent with the 92 percent of Morris and Johnson (1967). Although porosity of sand beneath the swamp was not measured, Morris and Johnson (1967) identified 42, 46, 43, and 39 percent as the porosity of clay, silt, fine-grained sand, and medium-grained sand, respectively. Thus, porosity of the sand, like its specific yield, likely is substantially less than that of the upper peat, meaning that the sand stores, transmits, and yields less water than the upper peat. Part of the water in saturated peat is in primary pore space (space between peat particles), and part is in secondary pore space (space within peat particles). Because sand has little secondary porosity, most water saturating sand is between sand grains.
Although specific retention was not measured, using the difference between a calculated range of 40–60 percent for the specific yield of the upper peat and the porosity identified by Drexler and others (2017), the water remaining in the peat after draining is between 27 and 51 percent of the total peat volume. This compares with a specific retention of 49 percent for peat reported by Morris and Johnson (1967) and equals between 30 and 59 percent of the water originally in the saturated peat. Thus, substantial water remains in unsaturated peat immediately after draining.
Because high specific yield typically accompanies high hydraulic conductivity; low specific yield typically accompanies low hydraulic conductivity, the upper peat likely has a high hydraulic conductivity and the lower peat and fine-grained sand likely have low hydraulic conductivities. Flow modeling calculated a single calibrated hydraulic conductivity for each modeled layer to include 13,220 feet per day (ft/d) for the upper peat, 24 ft/d for the lower peat, and 100 ft/d for the sand (Eggleston and others, 2018). Modeled hydraulic conductivity of the spoil-pile roads was 23 ft/d. These values compare to representative hydraulic conductivities of 8 ft/d for fine-grained sand, 40 ft/d for medium-grained sand, and 1,500 ft/d for gravel (Todd, 1980). Consequently, the hydraulic conductivity of the lower peat is between those of fine- and medium-grained sand; that of the upper peat is nearly an order of magnitude greater than that of gravel and more than three orders of magnitude greater than that of a fine-grained sand.
Differences among drawdowns when pumping water from open boreholes having the water table in the upper peat, lower peat, and sand reflect these differences in the hydraulic conductivity. The limited drawdown when the water table was in the upper peat reflects its high hydraulic conductivity. The draining of the borehole when the water table was in the lower peat or sand reflects their substantially lower hydraulic conductivity. Although use of pumping or slug tests of finished wells was considered for obtaining hydraulic properties of the peat and sand, finished wells having the water table within the upper peat that had been developed as completely as possible went dry within 10–15 seconds when similarly pumped. This indicates that hydraulic characteristics of well material, not aquifer material, controlled hydraulic responses of wells. These relative hydraulic characteristics of the peat layers are consistent with those of the acrotelm and catotelm, the distinct upper and lower peat layers identified by Ingram (1978) and differ greatly from the characteristics in the conceptual model of Lichtler and Walker (1974). These relative hydraulic characteristics were applied to the flow model of Eggleston and others (2018) before calibration and are substantiated by the calibration.
Aquifers and Confining Units/Zones
The Coastal Plain aquifer system beneath the swamp extends laterally into adjacent States and vertically from land surface to depths of about 1,500–2,300 ft beneath the swamp. The aquifer system consists of sediment of Cretaceous age and younger (McFarland and Bruce, 2006). Concern exists that large groundwater withdrawals from the Potomac aquifer (the deepest aquifer) and other deep aquifers that draw down groundwater levels within the aquifers by as much as 100 ft or more also drain appreciable water from the shallowest overlying aquifers and the swamp. Numerical model simulations were used to compare groundwater levels and flow in these aquifers prior to appreciable groundwater withdrawals, with levels and flow in 2003 (a year of large withdrawals and normal precipitation and groundwater recharge) and 2001 (a year of large withdrawals and reduced precipitation and groundwater recharge) (Heywood and Pope, 2009). Simulated levels in the surficial aquifer (the shallowest aquifer) for 2003 showed negligible change from levels prior to large withdrawals. Simulated declines of 0.5–1.0 ft in the surficial aquifer for conditions in 2001, however, resulted from the decreased precipitation that reduced groundwater recharge, not from the large withdrawals (Heywood and Pope, 2009). This implies that annual amounts of precipitation and resulting groundwater recharge have substantially greater effects on groundwater levels in the swamp than groundwater withdrawals from deep aquifers. Only aquifers shallower than depths of about 110–175 ft beneath the swamp, above the St. Marys confining unit, likely affect the swamp appreciably.
This shallow part of the aquifer system consists of the surficial aquifer, the underlying Yorktown-Eastover aquifer, and the intervening Yorktown confining zone (McFarland and Bruce, 2006). Local heterogeneities in the aquifer system that might locally control hydrologic processes and responses across the swamp, however, are not identified in the aquifer-system framework of McFarland and Bruce (2006) because of the scale of this framework that covers the entire Coastal Plain of Virginia and parts of adjacent States. For example, this framework does not identify the formations that make up the surficial aquifer and Yorktown confining zone beneath the swamp. The framework, however, identifies a general area where the Yorktown confining zone is absent beneath the swamp. By applying the geology of Oaks and Coch (1973) and hydraulic and other information described in this report to the framework of McFarland and Bruce (2006), the spatial distribution and other characteristics of the surficial aquifer and Yorktown confining zone can be described in greater detail to better understand their role in hydrologic controls and responses across the swamp.
The surficial aquifer covers the entire swamp and consists of the upper peat, lower peat, and underlying sandy sediment. Where the peat is absent, and the sand is at land surface, only sand forms the surficial aquifer. The shallow sand identified in boreholes likely is the medium-grained sand of the Tabb Formation that lies directly beneath the peat, as identified by Oaks and Coch (1973). The upper peat, however, forms the primary part of the aquifer because of its higher specific yield (fig. 15, fig. 16; tables 7, 8) and hydraulic conductivity (Eggleston and others, 2018) compared to the lower peat and sand. Beneath the Isle of Wight Plain, the surficial aquifer consists of the Windsor and Tabb Formations near the scarp (Oaks and Coch, 1973). The depth to the bottom of the surficial aquifer is about 30–40 ft beneath the Isle of Wright Plain near the scarp.
McFarland and Bruce (2006) describe the Yorktown confining zone as consisting of clay interbedded with sand and silt that appear to be absent beneath parts of the swamp. This unit is termed a “confining zone” rather than the more commonly used “confining unit” because it has substantial vertical hydraulic conductivity that allows more groundwater flow between the surficial and Yorktown-Eastover aquifers than a typical confining unit. McFarland and Bruce (2006) identify the extent of the confining zone as beneath the Isle of Wight Plain and swamp, except in an area that extends from about 1 to 10 mi north of North Carolina along the toe of the scarp to about 2 to 8 mi east of the toe. The thickness of the confining zone ranges from 0 to about 15 ft. Where present, the depth of the top of the confining zone ranges from about 10 to 15 ft (McFarland and Bruce, 2006).
Based on Oaks and Coch (1973), the confining zone appears to consist of the silty and clayey sediments of the Sedley Formation along the scarp and the Londonbridge and Sand Bridge Formations also along the scarp but extending across the northern part of the swamp. These sediments are absent across the southern part of the swamp east of the toe of the scarp in a pattern consistent with the confining zone depicted in McFarland and Bruce (2006). Upper clayey parts of the Yorktown Formation that were partly responsible for formation of the peat (Oaks and Coch, 1973) likely are part of the Yorktown confining zone.
The Yorktown-Eastover aquifer consists of sandy, permeable parts of the Yorktown and Eastover Formations (McFarland and Bruce, 2006). The upper part of the Yorktown-Eastover aquifer likely affects the swamp more than the deeper part (Eggleston and others, 2018). Because of the somewhat permeable nature of the Yorktown confining zone and its absence beneath the southern part of the swamp, the surficial and Yorktown-Eastover aquifers locally form an interconnected system that can be classified as either separate aquifers or a combined single aquifer beneath much of the swamp. The depth of the top of the Yorktown-Eastover aquifer ranges from about 10 to 35 ft beneath the swamp. The approximate thickness of this aquifer ranges from 60 to 140 ft.
The surficial aquifer is hydrologically the most important part of the shallow aquifer system to the swamp because of its shallow depth, connection with the ditch network, and the hydraulic characteristics of the upper peat. The upper peat transmits substantially more groundwater laterally beneath the swamp because of its much higher hydraulic conductivity than the lower peat and sand (Eggleston and others, 2018). Because of the low hydraulic conductivity and shallow depth of the lower peat, and the typical range in levels of the water table, the lower peat likely has a dual function: (1) it inhibits flow between the peat and sand aquifers when the water table is within the upper peat, exhibiting semi-confining unit or confining-zone characteristics, and (2) it stores, transmits, and discharges water when the water table declines into the lower peat. The exact role depends on location and hydrologic conditions. When the water table is within the lower peat or sand, groundwater primarily flows laterally through the sand because hydraulic conductivity of the sand is greater than that of the lower peat (Eggleston and others, 2018). Consequently, in this report the upper peat is referred to as the “peat aquifer” and the sand underlying the lower peat as the “sand aquifer.” The peat/mineral-sediment transition is part of the sand aquifer.
The northeastern quadrant of the swamp demonstrates the effects of thinning peat on the relative hydrologic importance of the peat and sand aquifers because they exist in distinct spatial patterns in this area (fig. 17). From west to east, land-surface altitude declines about 8 ft, from about 20 ft to 12 ft above NAVD 88 (fig. 17A), and accompanies a decrease in the thickness of the peat aquifer from about 3 ft to being present only within the root mat. Land-surface altitude in the swamp and peat thickness also decrease near Portsmouth Ditch. From south to north, the land-surface altitude declines about 2 ft across the western block (fig. 17B) and varies about 2 ft in no distinct pattern across the eastern block (fig. 17C). The thickness of the peat aquifer also decreases from south to north with a greater decrease across the eastern block (fig. 17B and C).
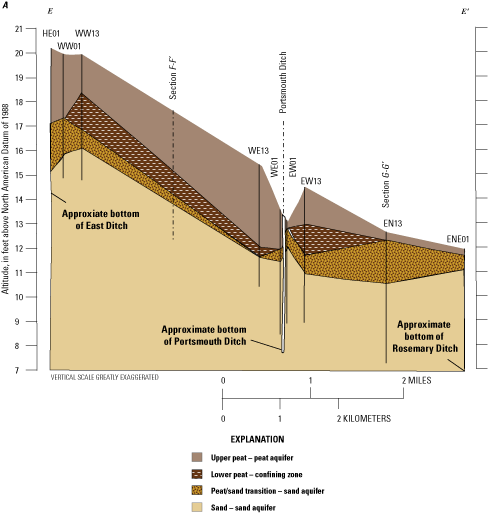
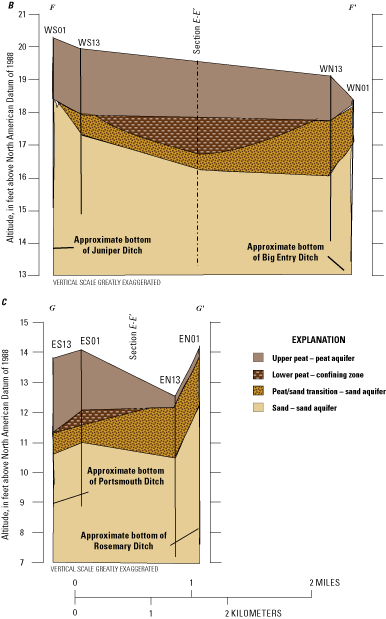
Hydrologic sections showing near-surface aquifers A, from west to east, B, from south to north across the middle of the western block, and C, from south to north across the middle of the eastern block in the northeastern quadrant of the Great Dismal Swamp, Virginia and North Carolina. [Lines of section shown in figure 10]
The decrease in thickness of the peat aquifer indicates the increased hydrologic importance of the sand aquifer to the east and north. Toward the south and west where the upper peat is sufficiently thick, the water table commonly remains within the upper peat, and most groundwater likely flows through the peat aquifer. Where groundwater flows through the peat aquifer, it can flow more easily between the peat and sand aquifers than in most other parts of the swamp because the lower peat is thin or absent in much of the area, and the upper peat lies directly upon the underlying sand or the peat/mineral-sediment transition throughout much of the area. Where the peat is not sufficiently thick, the water table declines to a great enough depth that most groundwater flows through the sand aquifer.
Surface-Water System
The surface-water system is an interconnected network of ditches, streams, the burn scar, Lake Drummond, the Feeder Ditch, and the Dismal Swamp Canal (fig. 2). Infrastructure on the ditches, the Feeder Ditch, and the Dismal Swamp Canal provide the FWS and the U.S. Army Corps of Engineers (the USACE) with the flexibility to manage the storage and release of water throughout the swamp. Spoil-pile roads (roads constructed on spoil banks) and railroad grades are additional infrastructure but provide little management capability.
Ditches, Spoil-Pile Roads, and Railroad Grades
Ditches, spoil-pile roads, and railroad grades are the legacy of timber harvesting across the swamp prior to its transfer to conservation status. The ditch network can be considered the primary component of the surface-water system because of its extent and interconnection with the groundwater system and other parts of the surface-water system.
The timing of ditch construction affects the duration and extent that an area has been drained. The duration of this drainage can affect the extent of the subsequent subsidence and changes in the forest communities. Although George Washington and co-investors constructed the first ditch in the 1760s, only 55 mi of the 200-mi-long ditch network was completed by 1953 (Shaler, 1890, plate VI; U.S. Geological Survey, 1919; 1940; 1954 a–g) (fig. 2, table 9). Timber companies, however, constructed approximately 145 miles of ditches and adjacent spoil-pile roads between 1953 and 1970 (U.S. Geological Survey, 1954a–g; 1977a–e) (fig. 2; table 9). Ditch and road construction peaked during the 1953–70 era because of improved construction techniques and the post-World War II increased demand for forest products. Previously existing ditches such as Washington Ditch (northwestern quadrant), Jericho Ditch (northwestern quadrant), and Cross Canal Ditch (South of Lake Drummond) were deepened and widened during this time to further improve drainage (Brown, 1970). The 1953–70 era was designated as such because 1953 imagery having limited existing ditches, was used for the maps published in 1954, and because timber companies discontinued ditch construction in about 1970 as they planned to transfer the land to conservation status.
Table 9.
Summary of ditch construction, including year or interval of years of ditch construction and associated maps used for determination of years, the Great Dismal Swamp, Virginia and North Carolina.[ <, before the indicated year; X, cannot determine because not within boundaries of the map; Y, shows on the map; N, located within the boundaries of this map but does not shown on this version of the map; NW, northwest. Note: Scale of all topographic maps is 1:24,000 unless otherwise noted]
Ditches constructed in the late 1700s and early 1800s are limited in number, width, and depth because they were dug by hand (Brown, 1970). Consequently, these ditches likely had only modest effects on the hydrology of the swamp. Techniques evolved through the years until the 1950s and 1960s when the ditches were excavated through the surficial peat and into underlying sand, silt, and clay using modern draglines and trucks (Brown, 1970). Removed material was deposited as spoil banks, typically on one side of each ditch (fig. 5). Roads were constructed on the spoil banks to provide access to the swamp and transport timber from the swamp. Some roads, termed “corduroy roads,” have spoil material deposited upon downed timber laid upon the peat. Corduroy roads typically allow flow through voids in the permeable timber base, especially as the logs decomposed and created additional voids. Spoil material was deposited directly upon the peat for other roads, compressing the peat and reducing its permeability. In some cases, fill material, such as sand and bricks, was hauled from offsite, spread, and compacted onto the spoil material to improve road stability and drivability. Ditches typically have about a 30-ft width and 6-ft depth; spoil-pile roads normally have a 30- to 40-ft width and are elevated 1 to 3 ft above the adjacent peat surface. Roads constructed using the two techniques cannot be readily differentiated.
Ditches and spoil-pile roads having spoil material deposited directly upon the peat more profoundly alter the hydrology of the swamp than ditches and corduroy roads because of the low permeability of the compressed peat, spoil material, and fill. Where ditches directly adjoin the swamp, surface water and groundwater readily drain into the ditches, making the swamp drier than it naturally was (fig. 5). Where spoil-pile roads intervene between ditches and the swamp, spoil piles inhibit flow, raising water levels and potentially creating standing water that makes the swamp wetter than it was naturally.
Railroads commonly were used to remove timber from the swamp between the mid-1800s and the 1960s (Trout, 1998; Simpson, 1990). Prior to 1940, short railroad lines constructed on downed timber transported harvested timber short distances to the limited ditch network through which logs were floated from the swamp (Shaler, 1890; U.S. Geological Survey, 1940). More recently, railroad grades were constructed either of downed timber or fill material hauled from off site. Grades constructed of downed timber have not persisted on the landscape. Grades constructed of fill material were elevated 1 to 4 ft above the adjacent peat, and many were integrated into the road network constructed in the 1950s and 1960s (Trout, 1998). Grades constructed of fill material and not integrated into the road network remain identifiable in the field. One of these grades, the abandoned Richmond Cedar Works Railroad, is evident in the swamp across the Blocks (fig. 1) and to the southwest. The only currently (2019) active railroad is the CSX rail line (fig. 1), crossing the swamp about 0.5 mi north of Williamson Ditch (fig. 2).
Lake Drummond, the Feeder Ditch, and the Dismal Swamp Canal
Lake Drummond, the Feeder Ditch, and the Dismal Swamp Canal (fig. 2) function as a single system maintained and managed for navigation by the USACE. This system has a long history of change beginning in 1787, when legislation authorized construction of the canal and prioritized use of all water in Lake Drummond for supporting navigation in the canal (Brown, 1970). Lake Drummond, a 3,108-acre natural lake at the center of the swamp, has a maximum depth of about 6 ft and stores a maximum of about 15,000 acre-feet of water (U.S. Army Corps of Engineers, 1996).
Between 1793 and 1805, a private company constructed the original 22-mi-long Dismal Swamp Canal to commercially transport goods between Chesapeake Bay to the north and Albemarle Sound to the south (Brown, 1970). Initially, the canal allowed only shallow-draft boats to pass because of its shallow depth. Shortly after completion of the canal, owners and operators realized the volume of water naturally entering the canal was insufficient to maintain navigation for even these boats during dry seasons. Consequently, the Feeder Ditch was constructed in 1812 to augment the supply of water to the canal with water from Lake Drummond (Brown, 1970; Trout, 1998). The Feeder Ditch is the primary surface-water outlet from the lake and is the largest surface-water input to the canal (Eggleston and others, 2018). Multiple navigation locks were added, and the canal was deepened between 1805 and 1826 to better control water and allow the canal to pass deeper-draft vessels. A stone lock completed in 1830, replaced a timber lock and provided greater control over the release of water from Lake Drummond (Trout, 1998). Additional modifications further deepened and widened the canal in the 1890s creating its modern footprint (Brown, 1970). The width of the current canal is approximately 100 ft, and water depth is maintained at about 6 ft (U.S. Army Corps of Engineers, 1996).
In 1925, the Federal Government purchased the Dismal Swamp Canal to incorporate it into the Atlantic Intracoastal Waterway (AICW). The AICW is managed by the USACE to facilitate the commercial transportation of goods along the Atlantic Coast in inland waters protected from coastal storms. The 1974 legislation establishing the refuge re-prioritized the use of lake water to refuge-habitat management; navigation became a secondary use (U.S. Army Corps of Engineers, 1996). Lake operations currently follow the 1996 Dismal Swamp Canal Operations Manual using standards for lake operation based on a 1976 agreement between the FWS and the USACE (U.S. Army Corps of Engineers, 1996). This agreement establishes a maximum operating lake level of 16.08 ft above NAVD 88 (5.3 ft above the Dismal Swamp Canal Datum [DSCD]) and a minimum operating lake level of 14.28 ft above NAVD 88 (3.5-ft DSCD; U.S. Army Corps of Engineers, 1996). Consequently, lake and canal operations strive to maintain lake levels within these targets by controlling releases from Lake Drummond. As long as lake levels remain above the minimum operating level, water is released from the lake to maintain navigation. Once lake levels reach the minimum target, the USACE closes the canal to navigation until lake levels rise again. Because the draft of vessels currently (2019) used for transporting goods is deeper than can pass through the canal, the canal now is used primarily for recreational boat traffic; commercial transportation of goods is through a part of the AICW farther east.
Streams
No natural streams flow across the swamp. Two types of streams, however, surround the swamp: (1) those that flow from the Isle of Wight Plain across the Suffolk scarp and drain into the western part of the swamp and (2) headwater streams into which the swamp drains that flow north into Chesapeake Bay or south into Albemarle Sound (fig. 1).
Most streams flowing across the Suffolk scarp are termed swamps because they form black-water, bottomland, hardwood swamps typical of streams in lower parts of the mid-Atlantic and Southeastern Coastal Plains; peat extends part of the way up these stream valleys from the Great Dismal Swamp. These streams drain about 50,000 acres of gently rolling terrain. The average slope of their watersheds ranges from 1.0 to 1.5 percent; the maximum range in watershed altitudes is about 55 ft. The largest streams are Pocosin Swamp and Cypress Swamp (fig. 1), which flow directly into Washington Ditch (West of Lake Drummond), and Corapeake Swamp, known locally as Daniels Road Swamp, which flows directly into Cross Canal Ditch (formerly Hamburg Ditch; fig. 1; fig. 2). Smaller streams include Moss Swamp, Folly Swamp, and Goose Creek, which cross the Suffolk scarp and discharge diffusely across the surface of the swamp (fig. 1).
The Great Dismal Swamp forms the watershed divide between Chesapeake Bay and Albemarle Sound, serving as the headwaters of several freshwater tidal tributaries to these estuaries. In the Chesapeake Bay watershed, the swamp drains primarily into Shingle Creek, a tributary of the Nansemond River, and Deep Creek, a tributary of the Southern Branch of the Elizabeth River. In the Albemarle Sound watershed, the swamp drains primarily into the Pasquotank River. Historically, the swamp also drained into the Northwest River and the Perquimans River, flowing into Currituck Sound and Albemarle Sound, respectively. Construction of the Dismal Swamp Canal hydrologically isolated the swamp from the Northwest River; construction of U.S. Highway 158 in the 1930s hydrologically isolated the Perquimans River.
Water-Control Structures
Managing water levels and flow through the swamp has been a priority of resource managers for generations (U.S. Fish and Wildlife Service, 2006). Structures on the canal system and the ditches have been constructed to achieve these goals. Current structures designed to manage flow through the canal system consist of a dam having an adjustable spillway at Lake Drummond and a navigation lock, dam, and spillway at the north and south ends of the canal in Deep Creek, Va., and South Mills, N.C., respectively (fig. 1). Manually adjustable gates, or wickets, on the spillways control the discharge of water from the system (U.S. Army Corps of Engineers, 1996). Widths of 40–60 ft allow spillways to discharge more than 1,000 cubic feet per second (ft3/s).
Smaller water-control structures have been used historically to manage levels and flow through ditches throughout the swamp (fig. 2). Crude timber structures were erected on Jericho Ditch (fig. 2, northwestern quadrant) in the 1800s to help maintain water levels for transporting shingles from the swamp through Shingle Creek to the harbor on the Nansemond River in Suffolk, Va. (Brown, 1970; Trout, 1998). Although evidence of such structures no longer exists, corrugated metal culverts and concrete structures fitted with hand-operated slide gates dating from the 1950s and 1960s remain (fig. 18A and B). Since 1974, the FWS and North Carolina State Parks have installed 59 of the 64 structures currently present across the swamp (fig. 2).
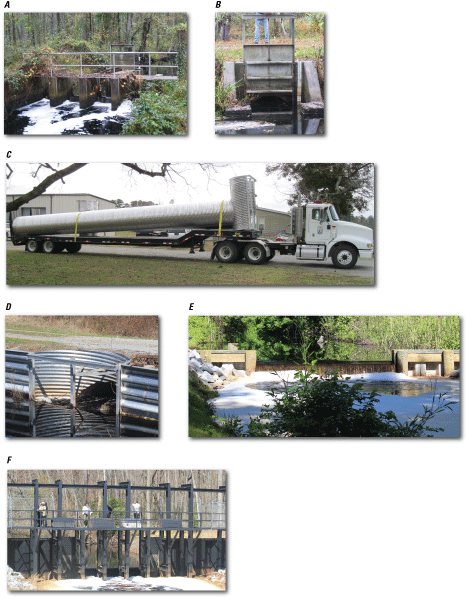
A, a concrete structure having a slide-gate control, B, close up of a slide-gate control, C, a corrugated culvert and riser before installation, D, a corrugated culvert and riser after installation, E, a sheet-pile structure having an adjustable-height weir, and F, a large adjustable-height weir on South Martha Washington Ditch, the Great Dismal Swamp, Virginia and North Carolina. Photographs A, B, D, E, and F by Gary K. Speiran, U.S. Geological Survey. Photograph C by Frederick C. Wurster, U.S. Fish and Wildlife Service.
Although some structures have fixed-height weirs, most have adjustable-height weirs that provide a flexibility to retain or release water in a manner not afforded by fixed-height weirs. The most common structure design is like that used on ditched agricultural land and managed forests across the Virginia and North Carolina Coastal Plain (Dukes and others, 2003: Evans and others, 2007). This design consists of a 4- to 6-ft-diameter, horizontal, corrugated-aluminum culvert having a riser (fig. 18C). Each riser consists of a 6- to 9-ft-diameter, vertically oriented, half culvert having two vertical channels designed for addition or removal of 6-in.-tall horizontally oriented boards, also called stop logs, to adjust weir height. To accommodate the maximum-anticipated flow, 1 to 3 culverts typically are installed beneath one of the spoil-pile roads at two intersecting ditches; risers are on the upstream ends of the culverts (fig. 18D).
Fixed- and adjustable-height weirs of vinyl or steel sheet piles are another common structure design (fig. 18E). Weirs typically have widths of 15–20 ft to accommodate the maximum anticipated flows. Staff manually adjusts weir altitudes using 6- to 12-in.-tall stop logs like those used with corrugated aluminum structures. The largest adjustable-height weirs were constructed on South Martha Washington Ditch (southeastern quadrant, fig. 2) to control larger flows (fig. 18F).
The Burn Scar
The area of the 6,200-acre burn scar (southwest of Lake Drummond, fig. 1) created by the 2008 South One and 2011 Lateral West fires (fig. 8) was primarily part of the groundwater system controlled by the hydraulic characteristics of the upper peat and its connection with the ditches before the fires. The loss of an unknown depth of peat from the 2008 fire, and an average of 1.5 ft (Reddy and others, 2015) and a maximum of 4.5 ft (Hawbaker and others, 2016) of peat from the 2011 fire, created a shallow, open-water reservoir having an extended hydroperiod that supports an emergent freshwater-marsh habitat. The loss of land-surface altitude and upper peat through which water flowed have altered water flow paths, levels, and storage, which affects management decisions.
Sources, Flow, and Discharge
Flow through the swamp is controlled by water sources, topography, peat and sand characteristics, forest cover, streams, the ditch and spoil-pile road network, water-control structures on ditches, the canal systems, and infrastructure on the canal system. Flow varies spatially and temporally because characteristics of these controls vary spatially and temporally. Water flows from the sources along different pathways through the peat and sand aquifers, ditches, and canal system, ultimately discharging as ET and to Shingle Creek, Deep Creek, and the Pasquotank River.
Water Sources
The swamp has three water sources: streams and groundwater that flow from the Isle of Wight Plain across the Suffolk scarp and discharge to the western part of the swamp and precipitation. Precipitation is the original source of all water, falling across the Isle of Wight Plain and providing the water to these stream and groundwater sources. Flow of water from ditches into the peat or sand aquifers is an exchange of water within the swamp and not a source.
Precipitation
Precipitation is the only water source across the swamp away from the Suffolk scarp and a primary source in parts of the swamp near the scarp. Based on model-simulated flow during average springtime conditions, precipitation provides 92 percent of the water that flows through the swamp (Eggleston and others, 2018).
The first precipitation falling on the swamp during each event is intercepted by vegetation and rewets unsaturated peat and (or) sand, taking up 0.5–1.0 in. of precipitation at the beginning of each event depending on antecedent conditions, determined on the basis of an analysis of information from the center of Block C1 (fig. 15A). This uptake likely varies across the swamp because of differences in the height and density of the forest canopy and understory and the thickness of unsaturated peat and (or) sand. The open pine-forest canopy of pocosin communities as in Block C1 exposes a dense shrub layer commonly having heights of 10 ft or more. In contrast, forests in many other areas have a tall, dense closed canopy having a limited shrub layer. In such canopies, some precipitation falls through the canopy to the ground but most likely is intercepted by the canopy and either remains captured in the canopy, filters through the canopy and falls to the ground, or runs down trunks to the ground. These processes delay rewetting, infiltration, and recharge as indicated in the discussion of the analysis of specific yield in the northeastern quadrant of the swamp (section “Hydraulic Characteristics”).
Precipitation more than that needed for interception and rewetting recharges the groundwater (fig. 15B). Because of the high permeability of the peat, little surface runoff occurs unless the peat is saturated to land surface and standing water is present. As an example, no physical evidence of surface runoff could be identified after 17.82 in. of precipitation fell in a single event on September 29, 2010, when the initial water-table depth was about 3.5 ft and rose to about 0.25 ft above land surface in well C00W in Block C1. Little standing water, however, was present in the area because the well was in a deep hollow.
Stream and Groundwater Flow across the Suffolk Scarp
Streams and groundwater that flow from the Isle of Wight Plain and across the Suffolk scarp are two additional water sources to the western part of the swamp. A water budget partly based on chemical separation of flow in streams across Virginia estimated that 25.5 percent of the precipitation falling on the City of Suffolk, which includes the Isle of Wight Plain, discharges from groundwater into streams, and 10.1 percent discharges into streams as surface runoff (Sanford and others, 2012). Based on model-simulated flow during average springtime conditions, streams flowing across the scarp are the source of 5 percent of the water flowing through the swamp (Eggleston and others, 2018). Three larger streams discharge directly into Washington Ditch (West of Lake Drummond) and Cross Canal Ditch (South of Lake Drummond, fig. 1), whereas the three smaller streams discharge diffusely across land surface into the swamp (fig. 1).
Part of the groundwater discharged into streams in the analysis of Sanford and others (2012) likely does not discharge to streams but is the groundwater that flows through the surficial and Yorktown-Eastover aquifers, across the scarp, and discharges into the swamp. Thus, groundwater discharge into the swamp is part of the 25.5 percent of the precipitation falling on the City of Suffolk indicated as groundwater discharging to streams in Sanford and others (2012). Model-simulated flow during average springtime conditions indicates groundwater flowing across the scarp provides 3 percent of the water that flows through the swamp (Eggleston and others, 2018). A limit on the groundwater and stream sources appears to be temporal effects of pumping groundwater from the surficial and Yorktown-Eastover aquifers beneath the Isle of Wight Plain for domestic, livestock, and irrigation uses (Lichtler and Walker, 1974). This lowers groundwater levels, locally reversing gradients during parts of the year and reducing groundwater and stream flow to the swamp.
Seasonal and annual differences in streamflow in Cypress Swamp, one of the two largest streams that cross the scarp, help characterize variability in these stream sources and in the groundwater source because streamflow includes surface runoff and groundwater discharge; relatively low flows consist primarily of groundwater discharge. Streamflow was monitored by the USGS at Cypress Swamp at Cypress Chapel, Va. (station number 02043500; fig. 1; table 2) from 1953 to 1996 with a gap between 1971 and 1978. This stream has a 24-square-mile (mi2) watershed that represents 30 percent of the total watersheds draining from the Isle of Wight Plain into the swamp.
Mean monthly streamflow in Cypress Swamp varies seasonally, increasing through the winter non-growing season and peaking from January through March (fig. 19; fig. 20). Streamflow decreases as ET increases during the growing season, reaching seasonal lows through the summer into early fall. Mean monthly streamflow in August and September is higher than that in June and July, partly because large precipitation events from tropical low-pressure systems occur in some years and raise the average. In years without such systems, streamflow in August and September can be equal to or less than that in June and July, having zero flow much of the time (fig. 20C).
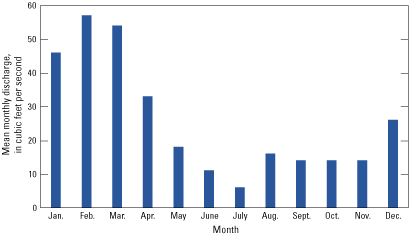
Mean monthly streamflow at the U.S. Geological Survey streamflow-gaging station number 02043500, Cypress Swamp at Cypress Chapel, Virginia, draining part of the Isle of Wight Plain upstream from the western boundary of the Great Dismal Swamp, Virginia and North Carolina, 1953–71 and 1978–96.
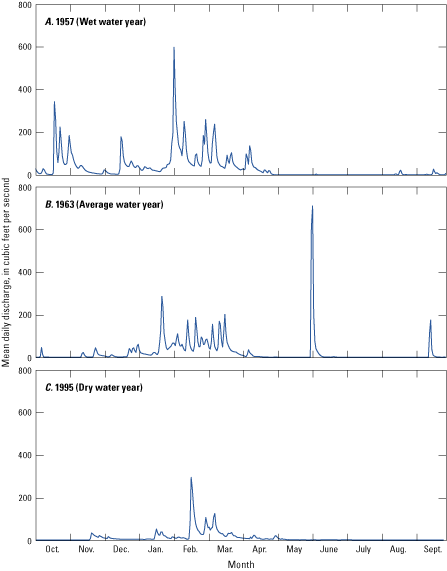
Mean daily streamflow for representative A, wet, B, average, and C, dry water years at U.S. Geological Survey streamflow-gaging station number 02043500, Cypress Swamp at Cypress Chapel, Virginia, draining part of the Isle of Wight Plain upstream from the western boundary of the Great Dismal Swamp, Virginia and North Carolina, 1957, 1963, and 1995, respectively. (Water year is the 12-month period from October 1 to September 30 of the following year. It is designated by the year in which it ends.)
Mean daily streamflow in Cypress Swamp was episodic and flashy (fig. 20), depending on precipitation. Following large precipitation events, instantaneous streamflow approached 1,300 ft3/s, although mean daily streamflow remained less than 800 ft3/s. Outside the direct effects of precipitation, streamflow typically was less than 100 ft3/s (fig. 20). Eighty percent of the total annual streamflow typically occurs from October to early April. As streamflow decreases, the percent of groundwater discharge into streams increases, although the actual amount of groundwater discharge decreases as water levels and gradients decrease and riparian ET increases (Sanford and others, 2012). This causes streamflow to decrease eventually to 0 ft3/s, partly because of the high ET during much of the summer growing season. Although streamflow decreases to zero, groundwater flow to the swamp likely continues longer than streamflow as indicated by water levels in the ditches parallel to the scarp that typically remain stable into the growing season. Total annual runoff ranged from 5.8 in. (1995) to 20.0 in. (1957) and averaged 13.1 in.
Flow
Water flows through the swamp in a combination of local, intermediate, and regional or swamp-wide patterns. Local flow patterns are superimposed upon intermediate flow patterns that, in turn, are superimposed upon swamp-wide flow patterns as reflected in groundwater and surface-water flow paths (fig. 21). Swamp-wide flow is to the east in the primary direction of regionally decreasing land surface (fig. 2) and decreasing water-level altitudes from water sources along the Suffolk scarp to the Dismal Swamp Canal, the primary surface-water discharge. This pattern is most evident in the northeastern quadrant of the swamp and in the water budget developed using model-simulated flow during average springtime conditions (Eggleston and others, 2018). In the southern part of the swamp, an intermediate, southerly/southeasterly flow pattern toward the Pasquotank River is superimposed upon the easterly flow pattern (fig. 21). In the northern part of the swamp, two intermediate flow patterns are superimposed upon the easterly flow pattern: a southerly flow pattern toward Lake Drummond and the Feeder Ditch, and a northerly flow pattern toward Shingle Creek and Deep Creek (fig. 21). Local and intermediate flow patterns partly mask the swamp-wide flow patterns.
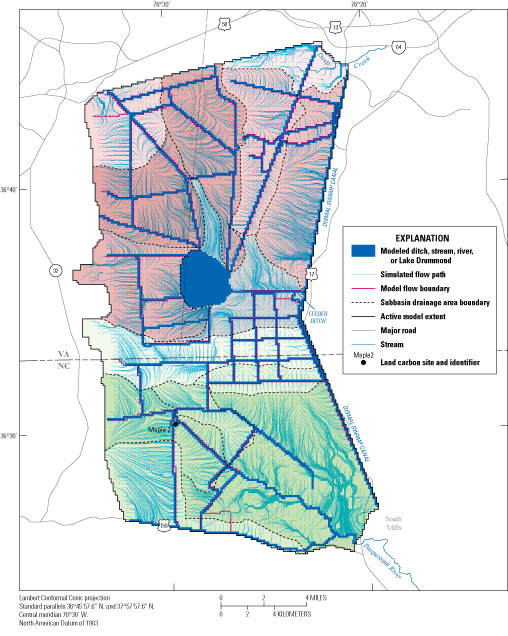
Groundwater flow paths and watershed boundaries, the Great Dismal Swamp, Virginia and North Carolina. From Eggleston and others, 2018.
Local Flow
Groundwater recharged by precipitation flows through the peat aquifer to ditches predominately in local flow patterns. Understanding controls and characteristics of this flow also helps to understand characteristics and controls on intermediate and swamp-wide flow. Results of water-level measurements in Block C1 reveal major aspects of local controls and the resulting local flow paths.
The configuration of the water table in Block C1 reflects the effects of precipitation recharge and subsequent discharge as ET, flow through the peat and sand aquifers, flow inhibition by a spoil-pile road, and discharge into ditches (fig. 22). Groundwater levels varied seasonally, having high levels during wet seasons from late winter into early spring as on March 8–10, 2010 (fig. 22A), and low levels during dry seasons through the summer as on July 27–29, 2010 (fig. 22B). (Note that the contour intervals for these periods are 0.1 ft and 0.25 ft, respectively, because use of the same intervals would make one figure cluttered or the other would have limited definition of the water table.) Dry seasons are caused by the onset of ET, not decreased precipitation. The average monthly precipitation generally increases from its low in February to the maximum in August. Similarly, average monthly PET increases from a low in January to a high in July, exceeding average monthly precipitation from May through August to cause the dry conditions.
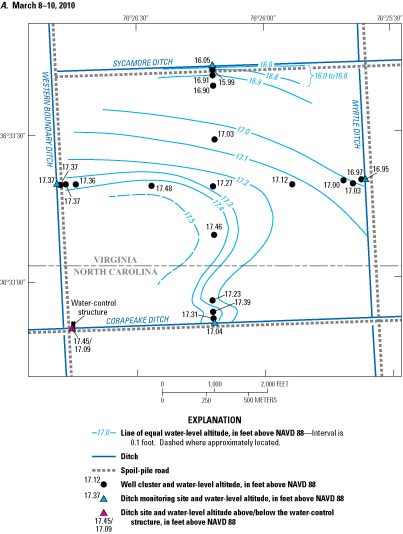
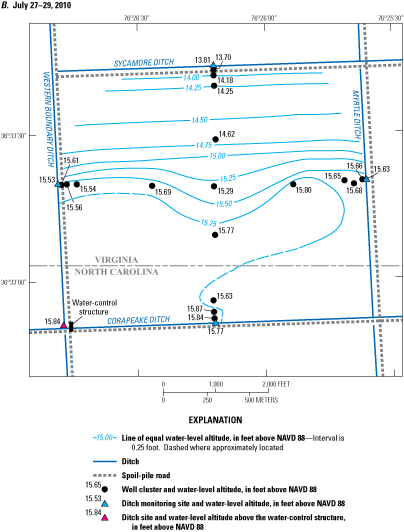
Water-table altitude and ditch monitoring site water level, during A, a wet season, March 8–10, 2010, and B, a dry season, July 27–29, 2010, in Block C1 of the Blocks, the Great Dismal Swamp, Virginia and North Carolina. [Note different contour intervals in A and B.]
During the wet season, groundwater levels were highest in the southwest quadrant of Block C1 and lowest along Sycamore Ditch and at the northern end of Myrtle Ditch (fig. 22A). Levels ranged from a high of 17.48 ft above NAVD 88 in well W13W, west of the center of the block, to a low of 15.99 ft above NAVD 88 in well N00W next to Sycamore Ditch. This gradient indicates flow was north toward Sycamore Ditch and northeast toward Myrtle Ditch into which groundwater discharged. Much of the water discharged into Sycamore Ditch despite the low hydraulic-conductivity, spoil-pile road intervening between the swamp and the ditch because the water level in Sycamore Ditch was about 2 ft lower than that in Corapeake Ditch where no spoil-pile road intervened. The low hydraulic conductivity of the road is evident in the differences in water-level gradients from the center of the block to the road compared to those across the road to Sycamore Ditch. Water levels declined only 0.36 ft across the more than 2,500 ft (nearly half a mile) from the center of the block to well N01W, which is about 100 ft from Sycamore Ditch (horizontal gradient of 1.4 × 10⁻⁴; see fig. 9 for well names). Levels declined 0.91 ft in only 100 ft from well N01W, across the road to the ditch, about 2.5 times the decline from the center of the block to well N01W. Because the horizontal gradient from well N01W to the road would be similar to that from the center of the block and the width of the road is about 30 ft, the horizontal gradient beneath the road was approximately 3.0 × 10⁻² or 210 times that from the center of the block.
The actual flow path from the swamp into Sycamore Ditch, however, remains uncertain based on these data. Results of two-dimensional, cross-sectional model simulations of flow between Corapeake and Sycamore Ditches (Eggleston and others, 2018), however, reveal this flow path and critical controls on groundwater flow. In a simulation that replicated the greater than 2-ft difference in water levels between Corapeake and Sycamore Ditches during the wet season of 2016, 84 percent of the groundwater flowed toward and discharged into Sycamore Ditch, despite the intervening spoil-pile road. Most of this water flowed through the upper peat until it was near the spoil-pile road and ditch where it flowed downward through the lower peat into the sand and flowed laterally under the spoil-pile road before discharging into Sycamore Ditch. Most groundwater flowing toward Corapeake Ditch, however, flowed through the upper peat and discharged directly into the ditch. The combination of field observations and model simulations indicate that most groundwater flows through the upper peat and that, despite the intervening spoil-pile road, the greater than 2-ft lower water level in Sycamore Ditch caused most of the water to flow toward and discharge into Sycamore Ditch.
The pattern during the dry season differed somewhat from that during the wet season. During the dry season, water levels declined 1.11 ft from the center of the block to well N01W, 100 ft from Sycamore Ditch (fig. 22B). This is more than three times the decline during the wet season. Levels declined 0.58 ft between well N01W and the ditch, about two-thirds of the decline of the wet season, indicating a lower rate of groundwater discharge during the dry season. Consequently, horizontal gradients increased to 4.4 × 10⁻⁴ from the center of the block to the road and decreased to 1.9 × 10⁻² across the road. The horizontal gradient across the road was only 43 times that from the center of the block during the dry season.
Differences in groundwater levels, flow paths, and horizontal hydraulic gradients between the wet and dry seasons largely reflect the onset of ET coupled with the hydraulic characteristics of the upper peat, lower peat, sand, and roadbed. During the wet season (fig. 22A), the water table likely was in the upper peat throughout the block except between the road and Sycamore Ditch, based on the 16.0 ft above NAVD 88 altitude of the bottom of the upper peat and the 15.5 ft above NAVD 88 altitude of the bottom of the upper/lower peat transition at well C00W. Consequently, groundwater primarily flowed through the upper peat during the wet season as indicated by Eggleston and others (2018).
With the onset of ET that caused the dry season, the water table likely declined into the upper/lower peat transition or lower peat along and south of the east-west transect and into the lower peat to the north. Because the hydraulic conductivity of the sand is about four times that of the lower peat (100 ft/d compared to 24 ft/d (Eggleston and others (2018)), lateral groundwater flow beneath the northern part of the block likely was primarily through the sand aquifer.
Lateral flow within the upper/lower peat transition in the southern part of the block likely was limited because so little of the upper/lower peat transition was saturated, a distinct lateral gradient in groundwater levels was not present, and the contact between the lower peat and upper/lower peat transition likely varied. Groundwater in the southern part of the block likely flowed downward through the lower peat into the sand aquifer and then laterally through the sand aquifer toward the ditches. Because the upper peat was not saturated and most flow was through the sand aquifer during the dry season, discharge was directly from the sand aquifer into the ditches. Flow through the lower hydraulic conductivity sand aquifer would account for the greater hydraulic gradient from the center of the block to Sycamore Ditch during the dry season.
Characteristics of the response of groundwater levels from the center of the Block C1 (well C00W) east to Myrtle Ditch to precipitation on August 22, 2010, differed by distance from the ditch (fig. 23). Groundwater levels were stable near the altitude of the bottom of the upper/lower peat transition until after the approximately 0.5 in. of precipitation needed for interception and rewetting unsaturated peat; levels rose rapidly as precipitation continued. The rate of rise differed among wells but was rather uniform within each well when the precipitation rate was uniform. The rise was greatest at the center of the block (well C00W), less at 100 ft from the ditch (well E01W), and even less at the well adjacent to the ditch (well E00W) (fig. 23).
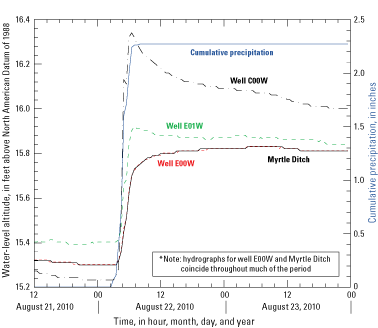
Response to precipitation of water levels in Myrtle Ditch, the well next to the ditch (well E00W), the well 100 ft from the ditch (well E01W), and the well 0.5 mile from the ditch (well C00W) in the Block C1, the Great Dismal Swamp, Virginia and North Carolina, August 21 through August 24, 2010.
Responses to changes in precipitation rates after interception and rewetting were almost immediate away from the ditch (fig. 23). When the precipitation rate briefly slowed after about 1.5 in. of cumulative precipitation about midway through the event, the water level declined slightly in well C00W and rose more slowly in well E01W within the same 30-minute interval when the precipitation rate decreased (precipitation was recorded at 30-minute intervals). The water level again rose more rapidly at both sites as the precipitation rate increased. The rate of water-level rise was slower and nearly uniform throughout the event in the ditch and adjacent well E00W with the ditch water levels controlling the level in the well. Control of groundwater levels by ditch water levels decreased with distance from the ditch and demonstrates how groundwater-level response depends on location. The rapid response of groundwater levels to changes in precipitation rates away from the ditch reflect effects of the high hydraulic conductivity of the peat and open canopy of Block C1.
Intermediate and Swamp-Wide Flow
Flow through the swamp is complex because of the size of the swamp and the varied hydrologic controls. Eggleston and others (2018) identified 15 watersheds across the swamp, based on combined groundwater and surface-water flow paths derived from a model simulation during average springtime conditions (fig. 21). Throughout the swamp, water flows from sources and groundwater divides to ditches, Lake Drummond, and other surface-water features to which the water discharges (fig. 21). Watershed boundaries and flow paths from these boundaries illustrate the complexity of the flow caused by these hydrologic controls. These boundaries and flow paths can change appreciably along some ditch intervals because of manipulation of water-control structures and other changing controls. Although field-observed flow through ditches and watershed boundaries (fig. 2) might not fully match modeled ones (fig. 21), they appear to be close in most locations.
One of the major controls on flow paths is the surface-water and groundwater sources from the Isle of Wight Plain. Model-simulated flow during average springtime conditions (Eggleston and others, 2018) indicates that groundwater flowing from the Isle of Wight Plain and across the Suffolk scarp into the swamp discharges into the north-south oriented ditches nearest and parallel to the scarp and to the western end of east-west oriented ditches originating at the base of the scarp, or connecting to or originating immediately east of, the north-south ditches (fig. 2; fig. 21). North-south oriented ditches from the north are Lynn, West, Sherrill, and Weyerhaeuser Ditches. Thus, these ditches function as barriers by intercepting the eastward flow of water that crosses the scarp (fig. 21; fig. 24). Spoil-pile roads adjacent to the north-south ditches further impede flow, acting like dams to that flow (fig. 5). Spoil-pile roads are east of Lynn, West, and Weyerhaeuser Ditches; these roads impede flow past these ditches and help force the discharge of water into the ditches. Sherrill Ditch is the only ditch where the spoil-pile road is between the scarp and the ditch. Each ditch except West Ditch has a reach characterized by minimal flow between northward and southward flowing water (fig. 21) and water-control structures at each end of the ditch that retain water in the ditch (fig. 2). These splits in flow directions form watershed boundaries that can shift north or south depending on hydrologic conditions and water-control-structure settings. West Ditch has no structures (west of Lake Drummond, fig. 2) and only connects directly to South Ditch at its southern end, not to Railroad Ditch to the north or Interior or Lateral Ditches in between. Consequently, most flow through this ditch is to the south into South Ditch. The modeled watershed boundary around West, South, and Riddick Ditches likely does not fully depict flow because some groundwater from the scarp flows past West Ditch into South Ditch. Some of the water in South Ditch then flows south through the burn scar to Corapeake Ditch as depicted in figure 2, and some flows east through the South Ditch into Riddick Ditch and then flows north into Lake Drummond.
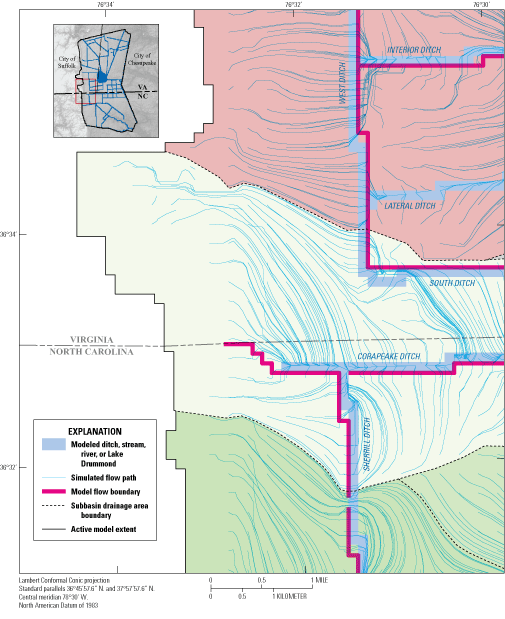
Groundwater flow paths from the Isle of Wight Plain across the Suffolk scarp to West Ditch and nearby parts of east-west ditches in the western part of the Great Dismal Swamp, Virginia and North Carolina [From Eggleston and others, 2018].
Four different flow patterns occur from this source (fig. 21; fig. 24). Where east-west ditches originate near the scarp, some of the groundwater discharges into these ditches before reaching the north-south ditches. Most groundwater flowing from the scarp west of Lynn and Weyerhaeuser Ditches discharges directly into these ditches and does not flow past them. At Sherrill Ditch, however, groundwater from the scarp west of the ditch flows past the ditch and splits into flow to the north and south (fig. 21; fig. 24). This groundwater then flows west where it discharges into Sherrill Ditch through its eastern side. Near West Ditch, part of the groundwater flows past the ditch and discharges into the parts of the east-west ditches immediately east of West Ditch (fig. 21; fig. 24). The decrease in land-surface and water-table altitudes across the Suffolk scarp combined with low gradients in the land-surface altitude and hydraulic gradients across the swamp cause this discharge. Thus, this combination of ditches limits the eastward extent of groundwater flow from the scarp.
These discharge patterns appreciably alter the conceptualization of Lichtler and Walker (1974), which describes how groundwater flows beneath the swamp through the Norfolk aquifer (surficial and Yorktown-Eastover aquifers) and discharges upward into the peat across the entire swamp and into Lake Drummond. Although Lichtler and Walker (1974) state that groundwater discharges in this manner, they also present groundwater levels from Charles T. Main, Inc. (1971) for three dates in late 1971 and early 1972 at five sites located in a line from near the scarp to Lake Drummond. Each site had paired wells individually open to the peat or underlying sand at different depths. These levels show a downward hydraulic gradient indicating downward, not upward, flow at all sites except the one next to Lake Drummond where the vertical gradient was negligible (Lichtler and Walker, 1974, fig. 13).
Across the swamp, modeled groundwater divides include watershed boundaries and other linear bands having no flow lines but from which flow lines originate where watershed boundaries are not depicted (fig. 21). Some divides are close to evenly spaced between ditches on opposite sides of the local swamp, whereas many are much closer to the ditch on one side than the other because of differences in water levels between these ditches, as observed in the local study in Block C1. Areas where the divide is nearly evenly spaced between ditches include parts of the northwestern quadrant and the Blocks. Several areas where the divide is shifted toward one of the ditches are (1) the northeastern quadrant between Portsmouth Ditch and the Dismal Swamp Canal, (2) many of the areas draining south to Lake Drummond and the Feeder Ditch, and (3) the southern part of the swamp that drains to the Pasquotank River (fig. 21).
Responses of water levels and flow in ditches to precipitation (fig. 25) depend on local flow controls and the location on the ditch relative to the controls. Because the permeability of sand, silt, and clay is less than that of the peat, precipitation falling on sand, silt, and clay infiltrates more slowly and creates more surface runoff than precipitation falling on the peat. Additionally, flow as surface runoff is more rapid than flow through the peat. Consequently, ditches receiving flow directly from streams originating on the Isle of Wight Plain contain more surface runoff and respond more rapidly to precipitation than ditches for which flow originates in the peat. Thus, the response to precipitation is muted in ditches in which flow originates in the peat but is more pronounced in Washington Ditch and Cross Canal Ditch because of the direct connections at their head of flow with streams that drain across the scarp from the Isle of Wight Plain (fig. 1). These ditches rapidly transport water to the east to discharge into Lake Drummond and the Pasquotank River, respectively. Such pronounced effects are apparent for the Corapeake Swamp inflow into Cross Canal Ditch (fig. 25A).
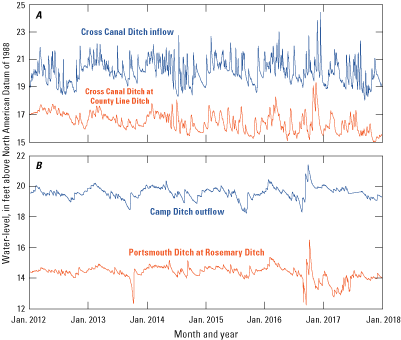
Water levels at U.S. Fish and Wildlife Service continuous water-level monitoring sites for A, Corapeake Swamp inflow to Cross Canal Ditch (Cross Canal Ditch Inflow) and Cross Canal Ditch at the intersection with Weyerhauser Ditch and County Line Ditch (Cross Canal at County Line Ditch),and B, outflow at Camp Ditch at East Ditch (Camp Ditch Outflow) and Portsmouth Ditch at Rosemary Ditch (Portsmouth Ditch at Rosemary Ditch), the Great Dismal Swamp, Virginia and North Carolina, January 2012 to January 2018.
The effects of flow across the scarp become less pronounced eastward toward the Dismal Swamp Canal whether the ditch connects directly to inflowing streams or entirely receives groundwater discharge and diffuse streamflow from across the scarp. Discharge of groundwater recharged in the peat by precipitation, manipulation of water-control structures, and dampening effects of the ditch on flow increasingly control the flow and water levels in ditches to the east.
The less pronounced effects on water levels to the east in a ditch receiving flow from a stream flowing across the scarp is evident in a comparison of levels in the inflow of Cross Canal Ditch (fig. 25A) with downstream levels in Cross Canal Ditch at Weyerhaeuser and County Line Ditches (southwestern quadrant, fig. 2) 3 mi into the swamp (fig. 25B). Hydrographs of flow from February 1, 2012, to May 9, 2012, at these sites show these effects on flow (fig. 26). Flow increases rapidly at the Cross Canal Ditch inflow site following a precipitation event, typically peaking about 24 hours after precipitation ceases. The downstream response at the intersection with Weyerhaeuser and County Line Ditches is dampened and lags that of the inflow, having peak flow downstream increasing less than one-half that at the inflow site and peaking about 3-4 days later for large events.
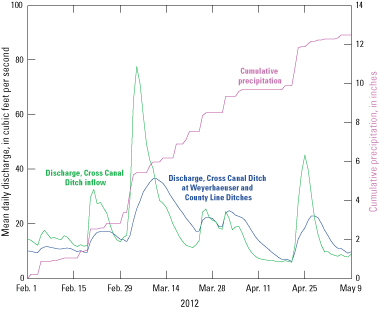
Precipitation relation to flow at U.S. Fish and Wildlife surface-water monitoring sites at the Corapeake Swamp to Cross Canal (inflow; former U.S. Geological Survey streamflow-gaging station number 02043750, Cross Canal Ditch nr Holly Grove, NC) and 3 mi east at the Cross Canal Ditch intersection with Weyerhaeuser and County Line Ditches (flow), the Great Dismal Swamp, Virginia and North Carolina, February 1–May 9, 2012. (nr, near; NC, North Carolina; mi, mile)
Ditches hydrologically isolated from streams that flow across the scarp are even more stable. One such site is the Camp Ditch outflow that drains water from the wet, northwestern quadrant and primarily receives groundwater that flowed across the scarp and precipitation that recharged the peat aquifer (fig. 25B). Yet another site isolated by spoil-pile roads, ditches, and water-control structures is Portsmouth Ditch at Rosemary Ditch (fig. 25B). This site primarily receives precipitation that recharges the peat aquifer and little water from either source that crosses the scarp.
Knowledge of the extent of the effects of a water-control structure on upstream levels in a ditch is critical for management decisions. The extent of effects along a ditch depends on the slope of the land surface adjacent to the ditch. Structures along high-relief sections (midstream, fig. 27A; fig. 27B) affects gradients along relatively short reaches of ditches but the short reaches have greater gradients than reaches having structures in gently sloping sections (upstream, fig. 27A) based on U.S. Fish and Wildlife Service data. Levels are closest to land surface immediately upstream from water-control structures and farthest below land surface immediately downstream from structures, the farthest point upstream from the next downstream structure. In the Corapeake Ditch profile (South of Lake Drummond, fig. 2; fig. 27A), the water level is near land surface along the entire segment west of the structure at Western Boundary Ditch and above land surface through the burn scar. Between Western Boundary and Laurel Ditches, the water surface is farther below land surface because of the greater slope and variable land-surface altitude. No structure was present downstream from Laurel Ditch at that time (November 23, 2011) so that the level of the Dismal Swamp Canal and the gradient in the ditch bed-controlled water levels. This accounts for the 4-ft to 5-ft difference between the water and land-surface altitudes and clearly shows the adverse effects of the absence of a downstream structure. A structure constructed on South Martha Washington Ditch between the confluence of South Martha Washington Ditch with Corapeake Ditch and the canal (fig. 18F) after November 23, 2011, maintains levels close to land surface along this ditch interval.
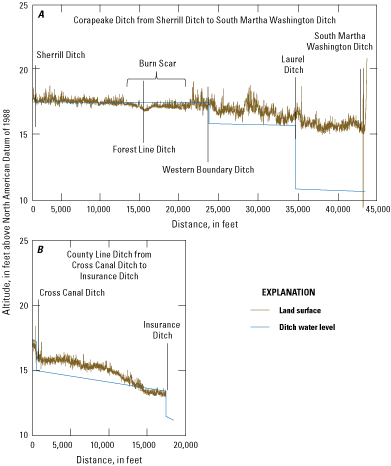
Water-surface profiles in relation to land-surface profiles along A, Corapeake Ditch on November 23, 2011, and B, County Line Ditch on April 4, 2011, based on U.S. Fish and Wildlife Service monitoring data, the Great Dismal Swamp, Virginia and North Carolina.
Like the interval on Corapeake Ditch between Western Boundary and Laurel Ditches, water levels along County Line Ditch between Weyerhaeuser and Insurance Ditches (South of Lake Drummond, fig. 2) are nearly 1 ft below land surface immediately downstream from Weyerhaeuser Ditch because of the slope of the land surface (fig. 27B). Even with water control in place, ditch water levels drop several feet below the land surface during dry climatic conditions. Control structures, however, raise the altitude and decrease the duration of low levels.
Adding water-control capability, either through installation of new water-control structures or repair of damaged and leaking structures effectively raises ditch water levels as observed at station number 363342076261100 (table 3) on Sycamore Ditch at the midpoint of the north side of Block C1 (fig. 2; fig. 28). Before structures were constructed in March 2013, flow in the ditch originated as groundwater discharged from the peat aquifer on both sides of the ditch into the 0.5-mi interval upstream from the site. The spoil-pile road along Western Boundary Ditch separated Western Boundary Ditch from Sycamore Ditch. The only structures on the ditch were more than 3 mi downstream. These structures leaked so that they retained little water in the ditch.
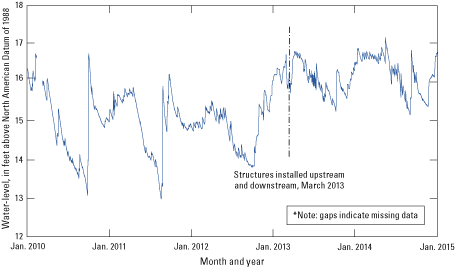
Water levels January 2010 to January 2015 at station number 363342076261100, Sycamore Ditch near Cypress Chapel, Virginia, on the north side of the Block C1 before and after the March 2013 installation of upstream and downstream water-control structures, the Great Dismal Swamp, Virginia and North Carolina.
In 2013, the leaking structures were repaired, and two new structures were installed. One new structure connected the head of flow in the Sycamore Ditch with Western Boundary Ditch; this is a culvert and riser installed under the spoil-pile road to provide an additional water source to Sycamore Ditch. The other structure is at Laurel Ditch, about 1.5 mi downstream from the water-level monitoring station; a culvert and riser replaced a culvert having no control under Laurel Road. The addition of an upstream inflow and a downstream control on outflow raised average winter high levels by 1 to 2 ft and summer extreme low water levels by more than 2 ft, decreasing the range in levels. These changes demonstrate the combined effects of the connections of ditches with the peat and water control on water levels in ditches.
Discharge from the Swamp
Water discharges from the swamp as ET, through the ditches, through the canal system, into streams north and south of the swamp, and through groundwater flow to adjacent areas. Discharge from the peat and sand aquifers into the ditches within the swamp are not considered discharge from the swamp but exchanges within the swamp. Based on model-simulated flow during average spring conditions, discharge as ET is 55 percent of the total discharge, through the canal system is 23 percent of the total discharge, into streams north and south of the swamp is 18 percent of the total discharge (stream location not differentiated), and through groundwater to adjacent areas is 4 percent of the total discharge (Eggleston and others, 2018).
During the growing season, groundwater discharges as ET causing groundwater levels to decline in 1 of 2 diurnal patterns that reflect local discharge into ditches and discharge from the swamp as ET (fig. 29). The diurnal pattern most commonly observed in groundwater levels is “sinusoidal,” having a daytime decline followed by a smaller nighttime rise, generally resulting in a net day-to-day decline (fig. 29A). White (1932) first described this pattern, which many wetland (for example, Mitsch and Gosselink, 2007) and groundwater-hydrology textbooks (for example, Freeze and Cherry, 1979) have long referenced. This pattern occurs in systems where appreciable groundwater flows laterally and (or) vertically from an external source, down hydraulic gradient to partly replenish lateral outflow and discharge as ET. The daytime decline occurs because discharge as ET and as lateral outflow exceeds inflow from the external source; levels rise during the nighttime because this inflow exceeds outflow when ET is minimal. The day-to-day decline reflects a net discharge during the 24-hour period. In some instances, the decline and rise can be of similar magnitude so that levels change little day-to-day (well ENE01, fig. 29A), indicating that most of the discharged groundwater is replaced by the source.
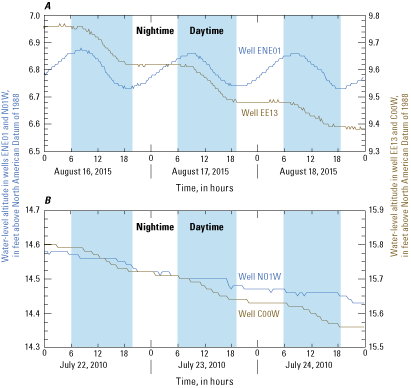
Sinusoidal and step-type diurnal cycles in groundwater levels from the combined effects of groundwater discharge through vegetation as evapotranspiration and into ditches in A, wells ENE01 (sinusoidal) and EE13 (step-type) in the northeastern part of the swamp, August 16–18, 2015, and B, wells C00W and N01W (both step-type) in the Block C1, July 22–25, 2010, the Great Dismal Swamp, Virginia and North Carolina.
The second and apparently less common diurnal pattern is “step-type” in which levels remain stable or decline gradually during the nighttime and decline more rapidly during the daytime (fig. 29A and B). The nighttime decline is almost entirely from net lateral outflow and discharge into the ditches. The level declines rapidly in the daytime because discharge into the ditches continues, but ET becomes the dominant discharge pathway. This pattern occurred in wells throughout Block C1 and was greater at the center of the block (well C00W) than near the ditches (wells N01W) because levels in ditches partly control groundwater levels near the ditches.
The small decline in the absence of a rise during the nighttime identified in Block C1 indicates the presence of a minimal, or the complete absence of an external, source of groundwater so that precipitation is the primary or only source of groundwater. Thus, groundwater levels rise only during recharge by precipitation (fig. 23) but decline between recharge events because of a net outflow from discharge into the ditches combined with discharge as ET.
The daily cycle in groundwater levels commonly increases in magnitude as the rate of ET increases from the spring into summer and as groundwater levels decline. Such increases have been identified similarly in surficial sand aquifers elsewhere in the Coastal Plain of Virginia where the daily amplitude of the diurnal, sinusoidal cycle increased to as much as 0.75 ft at a depth of about 3 ft (Speiran, 1996; Speiran, 2010). Across most of the swamp, the increased amplitude has three possible causes: (1) decreasing specific yield of the peat with depth, (2) a shift in ET from soil water (moist unsaturated peat) derived from precipitation to the groundwater source, and (3) an increasing percentage of fine and small roots (roots that take up water and nutrients) of trees and other vegetation become exposed to unsaturated peat as water levels decline. For the first cause, decrease in specific yield is unlikely in Block C1 while water levels remain in the upper peat because specific yield of the upper peat appears to be uniform (fig. 15). The specific yield decreases, however, through the upper/lower peat transition into the lower peat so that the amplitude of the cycle increases as the water table declines through that interval.
For the second cause, most of the precipitation intercepted by vegetation and rewetting unsaturated peat discharges as ET. As water remaining in unsaturated peat becomes depleted, increasing amounts of groundwater are used by the vegetation, increasing the amplitude of the diurnal groundwater-level cycles. In Block C1, discharge from interception and rewetted, unsaturated peat likely persists for only a short period because the shallow water table limits the precipitation stored in this reservoir. Thus, an increase in the amplitude of the diurnal cycle because of this shift is likely but probably is of short duration.
For the third cause, when the water table is shallow, most fine and small roots are in saturated peat. Fine- and small-root density is greatest near the peat surface and decreases with depth. The 0.0- to 0.1-m (0.0- to 0.3-ft) depth interval at the swamp contains 67, 57, and 57 percent of the fine and small roots present in the upper 0.4 m (1.3 ft) of peat in cedar, bald cypress, and maple/gum forest communities, respectively (Powell and Day, 1991). This 1.3-ft depth approaches the depth of the bottom of the upper peat in Block C1 (fig. 15B). Saturated soil typically becomes anoxic, especially in organic soil such as peat, interfering with normal metabolic processes. The anoxic conditions in saturated soil can stress and possibly kill upland species (Armstrong and others, 1994). Wetland species, however, employ adaptations for tolerating these conditions. These are metabolically inefficient “survival” adaptations. As groundwater levels decline, more fine and small roots are exposed to unsaturated, oxygenated peat, allowing the vegetation to shift to more metabolically efficient processes that allow them to thrive and not just survive. Because trees take up groundwater through unsaturated flow from the water table to the roots (Sánchez-Pérez and others, 2008), more roots are in unsaturated peat as the water table declines. This increases the amount of groundwater uptake and, consequently, increases the rate of water-level decline as groundwater levels become deeper within the upper peat.
As groundwater levels decline into the lower peat, the low hydraulic conductivity of the peat limits the flow of groundwater to the roots. This decreases the rate of groundwater discharge as ET, potentially stressing the forest and affecting growth. Phipps and others (1978) noted stress attributed to the “dry” conditions in their analysis of tree growth rings across the swamp and identified this stress as a possible factor in the change in forest types. Exposure of more roots to unsaturated peat accompanied by decreased specific yield and hydraulic conductivity creates competing effects on plant uptake of groundwater and synergistic effects on the decline of groundwater levels.
Characteristics of the canal system and ditches and how they are managed in response to precipitation also cause seasonal and annual variability in discharge from the swamp. The infrastructure on Lake Drummond and the Dismal Swamp Canal at Deep Creek, Va., and South Mills, N.C., provide the USACE with the appreciable capability for managing discharge from the swamp though the canal systems. Water-control structures on the ditch network provide the FWS with the ability to manage discharge from the swamp into surrounding rivers and the canal system that increases as more structures are constructed and structures are better managed.
A large part of the management of discharge from the swamp through the canal system depends on how the USACE manages levels in Lake Drummond by controlling releases from the lake through the Feeder Ditch. Prior to establishing the minimum, operating level of 14.38 ft above NAVD 88 for Lake Drummond in 1976, levels commonly dropped below this level (fig. 30). Since 1976, the USACE has maintained lake levels above or near this minimum level. This change in operation has reduced the monthly range in water levels by an average of 2.0 ft from the pre-1976 agreement water levels (fig. 30) and increased the frequency of closing the canal to navigation (U.S. Army Corps of Engineers, 1996).
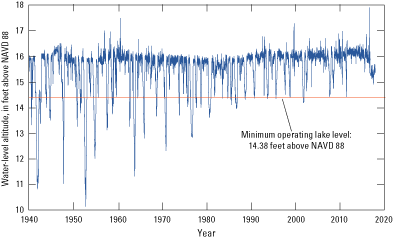
Water levels in Lake Drummond from 1940 to 2018, reflecting effects before and after the 1976 agreement between the U.S. Fish and Wildlife Service and the U.S. Army Corps of Engineers establishing a minimum operating level of 14.38 feet above North American Vertical Datum of 1988 (NAVD 88), the Great Dismal Swamp, Virginia and North Carolina. (U.S. Army Corps of Engineers, Norfolk District, written commun., 2018.)
Releases from Lake Drummond to the Dismal Swamp Canal create a flow divide at the mouth of the Feeder Ditch. South of the divide, water predominantly flows south toward South Mills. North of the divide, water predominantly flows north toward Deep Creek. Based on data provided by the USACE, estimated mean monthly releases from Lake Drummond and the Deep Creek and South Mills locks and spillways were of similar volume from 2010 through 2015 (fig. 31), averaging 141, 136, and 150 ft3/s, respectively. Model simulation of flow during average spring conditions estimated that 56 percent of the surface-water discharge from the swamp was through the canal system (Eggleston and others, 2018). Approximately 80 percent of the annual release was from October through May and typically was greatest from January through April, corresponding with the highest water levels in the lake and surrounding swamp. The lowest releases were during dry summer months of June through August. Because releases from each lock and spillway combination are about equal to releases from Lake Drummond, about one-half of the releases from the locks and spillways enters the canal as discharge directly from ditches, groundwater discharge through spoil banks, or precipitation falling directly on the canal.
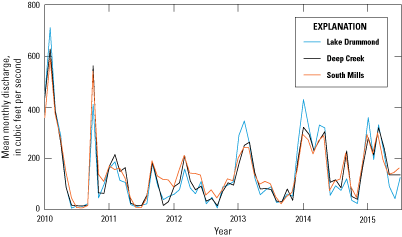
Mean monthly releases of water from Lake Drummond, the Deep Creek lock and spillway, and the South Mills lock and spillway, the Great Dismal Swamp, Virginia and North Carolina, January 2010 through June 2015. [U.S. Army Corps of Engineers, Norfolk District, written commun., 2018]
Flow characteristics of the three streams that drain the swamp also affect management of discharge from the swamp. These characteristics are not well documented, partly because these are small tidal streams, and continuously recording flow in such systems was difficult using earlier technologies. The only streamflow-gaging station on these streams is the Pasquotank River near South Mills, N.C. (USGS station number 0204382800 fig. 1; table 2). The watershed for this station covers 64 mi2 of the southern part of the swamp and agricultural land south of the swamp. The period of record for the station extends from 2004 to the present (2019). Tidal conditions derived from Albemarle Sound affect water levels and flow, causing periodic flow reversals. Although the general seasonal distribution of flow in the Pasquotank River (fig. 32) in water year1 2013 is consistent with that of Cypress Swamp (fig. 20), responses to precipitation were less flashy in the Pasquotank River, and flow persisted through dry seasons (fig. 32). These differences likely result from the combination of tidal effects, differences in the periods of record, effects of peat compared to mineral sediment, extent of wetlands, and watershed size. The Pasquotank River watershed area is more than 2.5 times the area of the Cypress Swamp watershed.
A water year is the 12-month period from October 1 to September 30 of the following year. It is designated by the year in which it ends.
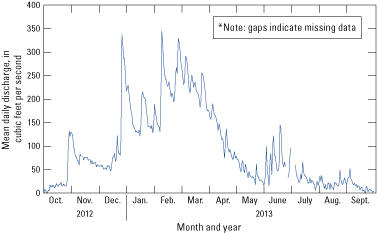
Mean daily streamflow at the U.S. Geological Survey streamflow-gaging station number 0204382800, Pasquotank River near South Mills, North Carolina, water-year 2013.
Groundwater typically discharges to areas to the north and south of the swamp, varies seasonally like other flows, and is similar in magnitude to groundwater flow across the scarp. Groundwater does not discharge to the west because the scarp is a water source where groundwater flows into the swamp. Groundwater discharging into the Feeder Ditch and the Dismal Swamp Canal through intervening spoil banks is part of the discharge through the canal system and is not included as part of the groundwater discharge from the swamp. This groundwater discharge is part of the doubling of flow between the outflow from the Feeder Ditch and the locks and spillways at Deep Creek and South Mills.
Wetness Gradient
Controls on flow from the Suffolk scarp water sources and precipitation create a wetness gradient across the swamp. Typically, the swamp is wetter along the scarp and becomes drier toward the east approaching the Dismal Swamp Canal. The northwestern, limited-relief quadrant of the swamp (fig. 2; fig. 3), however, appears to be the most extensive wet area along the scarp. The limited relief contributes to this wetness because it limits the hydraulic gradients needed for water to flow from the area through aquifers to ditches.
Another likely control is the extent of the coarse-grained sand of the Tabb Formation along the scarp. This sand extends east from the toe of the scarp to about where the first ditches parallel to the scarp are located (fig. 1), based on Oaks and Coch (1973). Because the thickness of this sand increases to the south, it likely better drains groundwater flowing from the southern end than the northern end of the scarp into the ditches. Effects of the limits of this coarse-grained sand might have been a factor visible at land surface that affected decisions on where to place these first parallel ditches.
Additional controls can couple with the low topographic gradient and extent of the coarse-grained sand to maintain the wet conditions. Characteristics of the interconnections among the ditches and their connection with Shingle Creek, the only surface-water discharge from the area, also are important. Because Jericho Ditch is the only ditch connected directly to Shingle Creek, characteristics of the connection of Jericho Ditch to other ditches are particularly critical. Although the spatial ditch distribution indicates a high degree of drainage (fig. 2), roads separate ditches at many of their confluences that lack culverts to pass water under the roads, or culverts that are present have water-control weirs. Consequently, water must either flow over weirs or through the peat and under the roadbed to flow from one ditch to the other. Not only does this make ditches ineffective drains in many locations, but spoil-pile roads adjacent to the ditches inhibit the natural flow of water across the swamp (fig. 5). Debris that partly fills ditches combines with these other attributes to slow drainage.
Characteristics of the water sources west of the scarp also can be a control. A greater amount of groundwater could flow across the northern than the southern part of the scarp for several reasons. Groundwater is the only source of flow from the Isle of Wight Plain to the northwestern quadrant because no streams cross this part of the scarp, and the stream density on the Isle of Wight Plain near the northern scarp appears to be less than that to the south. Land-surface altitude of the Isle of Wight Plain is greater near the northern part of the scarp than in most other parts of the scarp (fig. 2).
The present-day drier conditions along and immediately west of the Dismal Swamp Canal differ from the wet conditions observed by Shaler (1890). Shaler identified standing water west of the western spoil bank that he attributed to the damming of the natural flow of water from the west by the spoil bank. Present-day (2019) conditions appear to be dry because several east-west ditches breech the western spoil bank and drain water from the swamp into the canal. North Martha Washington and South Martha Washington Ditches, which are near and parallel to the canal, collect water from east-west ditches that do not breech the spoil bank and drain that water into ditches that do (fig. 2). These features did not exist when Shaler (1890) observed the wet conditions but are important present-day drains from the swamp.
The Northeastern Quadrant of the Swamp
The northeastern quadrant of the swamp provides a snapshot of the hydrologic response to numerous controls likely to be encountered elsewhere across the swamp and several controls seldom encountered, creating differing responses across the area. Discussion of the resulting responses and their controls helps to identify the likely controls when similar responses are observed elsewhere across the swamp. Flow across the area reflects local patterns superimposed upon the intermediate, northerly pattern and the swamp-wide, easterly pattern as reflected in the configuration of the water table during wet (fig. 33A) and dry seasons (fig. 33B). (Note: the red values in fig. 33 followed by “INT” are ditch levels linearly interpolated between upstream and downstream ditch levels.) The area has two main water sources: precipitation and flow from East Ditch along the western boundary of the area (fig. 33). Flow like that from East Ditch is not common elsewhere, but like groundwater flow across the scarp into the swamp, it provides a generally stable water source. Discharge is as ET across the entire area, as well as from the swamp through local ditches to Deep Creek to the north (the northerly, intermediate pattern) and toward the Dismal Swamp Canal to the east (the swamp-wide, easterly pattern). From southwest to northeast, groundwater flow increasingly shifts from the peat into the sand aquifer (fig. 17).
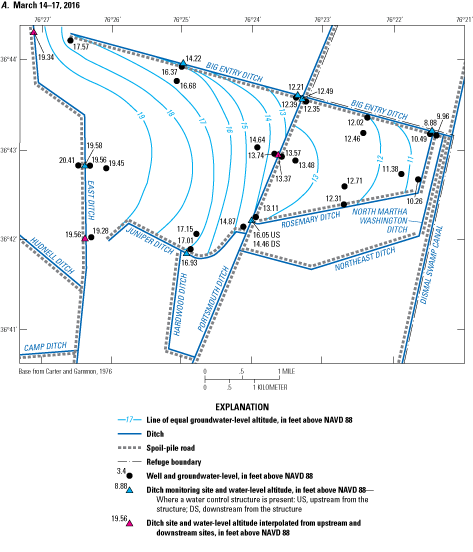
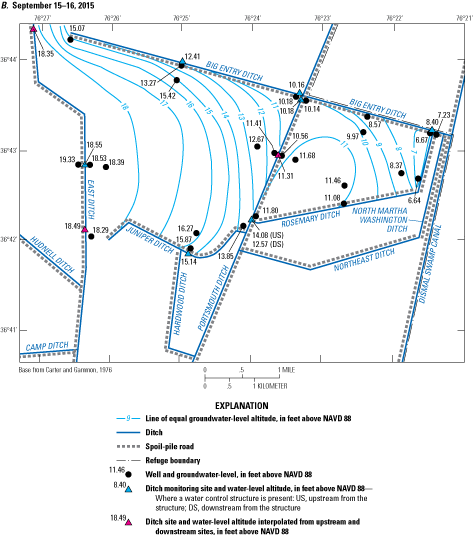
Water-table altitude during A, a wet season, March 14–17, 2016, and B, a dry season, September 15–16, 2015, in the northeastern quadrant of the Great Dismal Swamp, Virginia and North Carolina.
Because precipitation recharge is a main water source to this area, precipitation amounts, and temporal patterns provide important controls. In 2015 and 2016, annual and monthly precipitation at the gage at East Ditch varied appreciably and differed from mean annual and monthly amounts at the National Oceanic and Atmospheric Administration Lake Kilby station (fig. 34). Measured annual precipitation of 53.32 in. in 2015 and 79.66 in. in 2016 exceeded the mean annual precipitation of 49.49 in. (7.7 percent greater and 61 percent greater, respectively) at the Lake Kilby station. In contrast to the general seasonal pattern in the mean monthly precipitation for the Lake Kilby station, monthly precipitation in 2015 and 2016 followed no seasonal pattern with large month-to-month variations. Mean monthly precipitation at the Lake Kilby station ranged from a low of 3.23 in. in February to a high of 5.71 in. in August, whereas measured monthly precipitation in 2015 ranged from a low of 2.22 in. in May to a high of 11.55 in. in June. Precipitation in 2016 ranged from a low of 0.57 in. in November to a high of 17.37 in. 2 months earlier in September. The highest monthly precipitation for 2015 and 2016 was more than 2 and 3 times the highest mean monthly values at the Lake Kilby station, respectively. The large amounts of precipitation in September (17.37 in.) and October (13.33 in.) 2016 resulted primarily from two tropical weather systems. More than one-half the precipitation in September (more than 9 in.) fell in just over 36 hours during September 20–22 from Tropical Storm Julia. Hurricane Matthew produced an even greater 12.21 in. in 24 hours on October 8–9. Precipitation for each of 6 months in 2016 exceeded the maximum mean monthly amount at the Lake Kilby station.
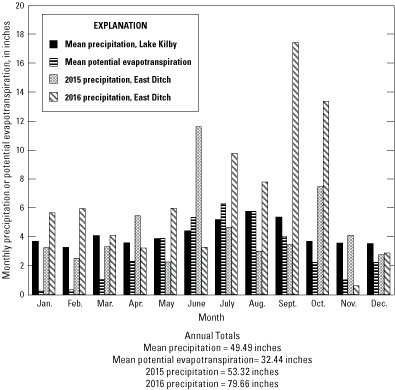
Mean monthly precipitation and potential evapotranspiration at the National Oceanographic and Atmospheric Administration Lake Kilby station, and monthly precipitation at the East Ditch precipitation gage in the northeastern quadrant of the Great Dismal Swamp, Virginia and North Carolina, 2015 and 2016.
The heavy precipitation from Tropical Storm Julia and Hurricane Matthew caused the worst flooding across the swamp and surrounding areas since Hurricane Floyd in 1999. Flooding of the swamp from these events inundated spoil-pile roads, making them impassable. It also short-circuited cable connections of pressure transducers at the Big Entry, Portsmouth, and Rosemary Ditch sites. This caused missing record from September 22, 2016, 2 days before the peak level in Juniper Ditch from Tropical Storm Julia, until about October 25, more than 2 weeks after the peak level in Juniper Ditch from Hurricane Matthew. The condition of spoil-pile roads prevented access to repair the equipment throughout this period. Additional factors, including damage from black bears, contributed to missing record that ranged from no missing record at Juniper Ditch to more than 36 percent missing record at Rosemary Ditch.
Water-level gradients among ditches and wells were similar across the northeastern part of the swamp (fig. 35; fig. 36). Water levels in ditches decreased about 10 ft from west (East Ditch) to east (Rosemary Ditch) and about 2–3 ft from south (Juniper Ditch) to north (Big Entry Ditch) across the western block (fig. 35). Similarly, groundwater levels decreased about 7 to 10 ft from west (well WW13) to east (well ENE01) and less than 1 ft to about 3 ft south (well WS01) to north (well WN01) across the western block (fig. 36).
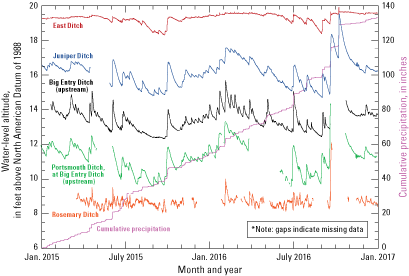
Cumulative precipitation and water-level altitudes in ditches across the northeastern quadrant of the Great Dismal Swamp, Virginia and North Carolina, January 2015 to January 2017.
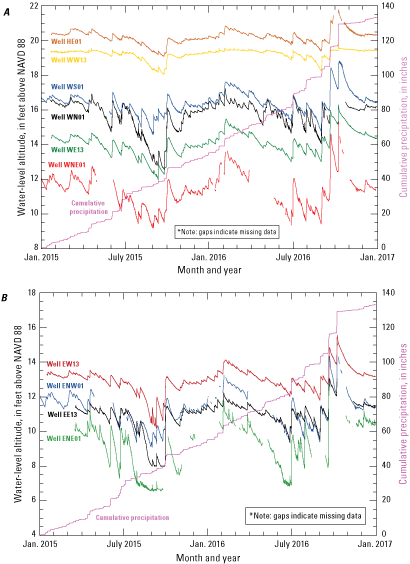
Cumulative precipitation and groundwater altitudes across the A, western block and B, eastern block of the northeastern quadrant of the Great Dismal Swamp, Virginia and North Carolina, January 2015 to January 2017. (NAVD 88, North American Datum of 1988)
Ditch water-level and nearby groundwater-level responses to controls are discussed using hydrographs having different temporal resolutions and periods at East Ditch (fig. 37), Portsmouth Ditch (fig. 38), and Rosemary Ditch (fig. 39). The same three periods are used for each ditch-water/groundwater combination to facilitate comparisons among sites. The periods are (1) January 2015 to January 2017, (2) the early spring wet season (represented by March 12 to April 2, 2015), and (3) the late summer dry season (represented by August 16 to September 6, 2015). Data for the Rosemary Ditch site, however, did not begin until March 18, 2015 (fig. 39). The 2-year hydrographs depict the large variability in levels throughout the year. The wet-season hydrographs reflect recharge and flow during minimal ET. The dry-season hydrographs reflect recharge and flow during high ET. Hydrographs for both the wet and dry seasons cover 3 weeks to facilitate comparisons between seasons and among sites. These seasons and sites depict a range in the types of responses that occur with no intention of reflecting all types of responses.
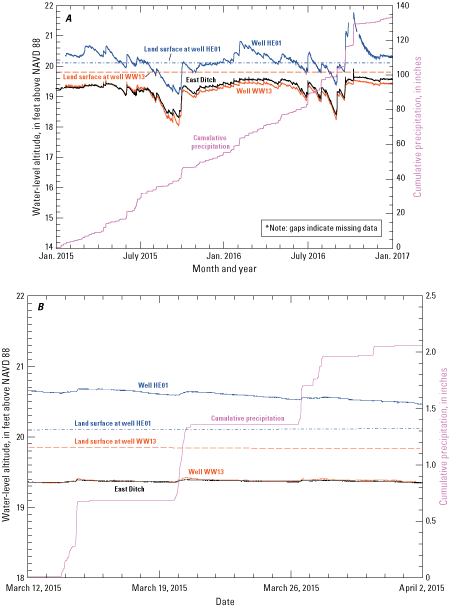
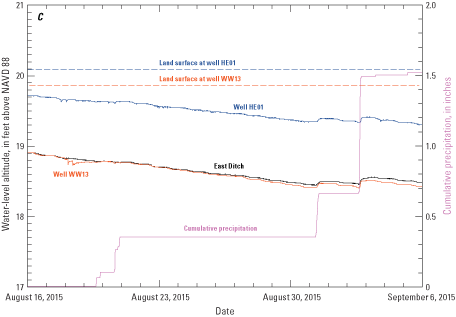
Water levels in East Ditch and wells HE01 and WW13: A, January 2015 to January 2017; B, during a wet season, March 12 to April 2, 2015; and C, during a dry season, August 16 to September 6, 2015, the northeastern quadrant of the Great Dismal Swamp, Virginia and North Carolina. (NAVD 88, North American Datum of 1988)
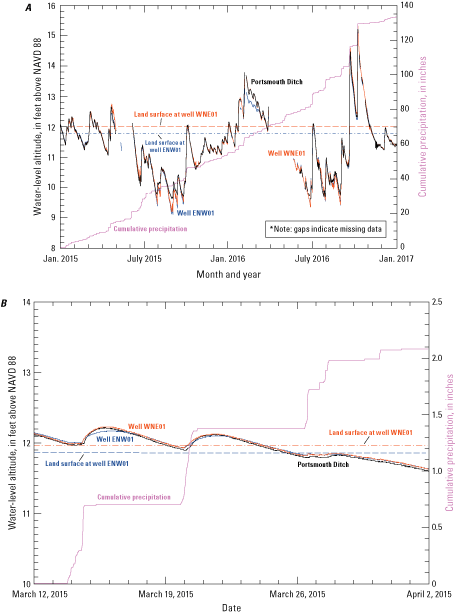
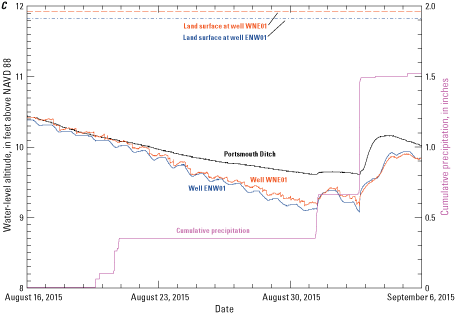
Water levels in Portsmouth Ditch and wells ENW01 and WNE01: A, January 2015 to January 2017; B, during a wet season, March 12 to April 2, 2015; and C, during a dry season, August 16 to September 6, 2015, in the northeastern quadrant of the Great Dismal Swamp, Virginia and North Carolina. (NAVD 88, North American Datum of 1988)
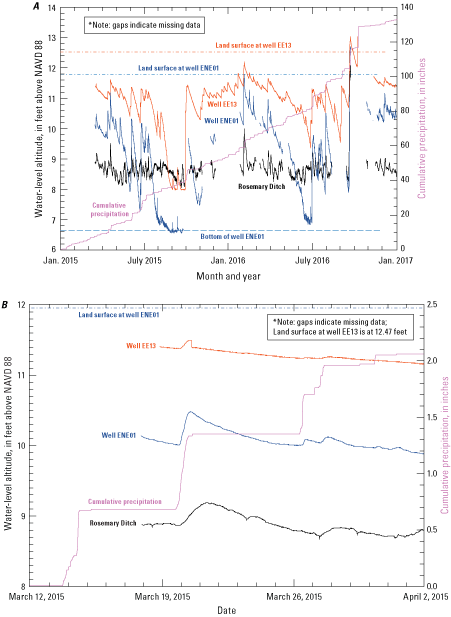
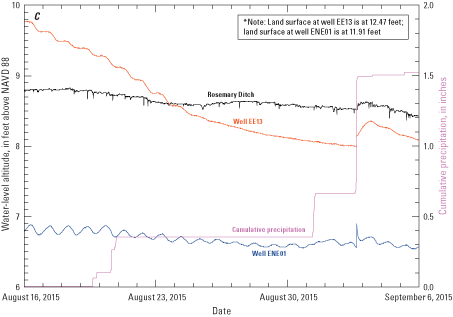
Water levels in Rosemary Ditch and wells EE13 and ENE01: A, March 2015 to January 2017; B, during a wet season, March 18 to April 2, 2015; and C, during a dry season, August 16 to September 6, 2015, the northeastern quadrant of the Great Dismal Swamp, Virginia and North Carolina. (NAVD 88, North American Datum of 1988)
The magnitudes of, and rates of change in, water levels differed among ditches (fig. 35), because of the effects of water sources and other controls from within and outside of the area. East Ditch, which forms the western boundary of the northeastern quadrant of the swamp, exchanges water with North and Williamson Ditches to the north, and Hudnell and Camp Ditches to the south. These ditches interconnect with other ditches across the wet, northwestern quadrant of the swamp. Connections of East Ditch with these ditches and the persistent wetness of the area provided a relatively stable water source to East Ditch. Where East Ditch forms the western boundary of the area, lateral flow in the ditch was minimal, sometimes visibly imperceptible, and changed direction. Not only was flow minimal in East Ditch, but water-level fluctuations were muted compared to other ditches (fig. 35) and nearby well HE01 to the west (fig. 36, fig. 37) because of the stable water source. In this interval, East Ditch generally supplements precipitation as a water source to the peat aquifer to the east, based on the gradient between ditch and groundwater levels (fig. 33; fig. 37).
The hydrographs for East Ditch and the wells 100 ft west (well HE01) and 1,300 ft east (well WW13) of the ditch (fig. 37) reveal responses to several controls. Water levels in East Ditch were stable throughout the wet season but decreased and fluctuated more during the dry season than during the wet season (fig. 37A). Levels appeared the least stable as the altitude of levels declined below about 19.2 to 19.4 ft above NAVD 88; fluctuations below this level resembled those of well HE01. The difference in response above and below this altitude was demonstrated by the relatively rapid rise in levels of about 0.5 ft owing to the more than 9 in. of precipitation from Tropical Storm Julia in late September 2016 with levels rapidly dropping less than 0.2 ft for a net rise of 0.3 ft when levels were below this altitude. In contrast, levels rose less than 0.4 ft owing to more than 12 in. of precipitation from Hurricane Matthew in early October and dropped about 0.3 ft within 24 hours of the peak for a net rise of 0.1 ft when levels were above this altitude. The initial rise was less than one-half of what would result from the precipitation falling directly on the ditch. The rise in East Ditch in response to these tropical systems was substantially less than the rise of about 3 ft at Juniper Ditch (fig. 35) and the more than 1.5-ft rise (record was lost near the peak) in well HE01 (fig. 37A).
The stability of levels in East Ditch and recharge of the peat aquifer to the east from the ditch maintain similarly stable levels generally at a slightly lower altitude in well WW13, 1,300 ft to the east (fig. 37). However, levels in well HE01, only 100 ft to the west fluctuated more and were about 1 ft or more above ditch levels throughout much of the year. Differences were, in part, due to the presence of the spoil-pile road between well HE01 and the ditch but not between well WW13 and the ditch. The higher and less stable levels in HE01 are a strong indication of the flow-inhibiting effects of spoil-pile roads, also identified in water-level differences between well N01W and Sycamore Ditch in Block C1 (fig. 22). Consequently, the swamp west of the spoil-pile road is part of the stable water source to East Ditch with the low hydraulic conductivity of the spoil-pile road partly contributing to this stability. Well HE01 also is upgradient from the ditch and well WW13 in the swamp-wide easterly flow pattern.
East Ditch and the two nearby wells show only a limited, stair-step ET cycle during the dry season (fig. 37C). This includes well WW13, despite the inflow from East Ditch, which commonly causes a sinusoidal cycle. A similar rate of ET and the low hydraulic gradient from the ditch to the well and across the entire northwestern quadrant source area could account for the absence of a sinusoidal ET cycle. The stable nighttime water levels indicate that inflow and outflow are similar. ET might in part contribute to less stable conditions as water levels decline below 19.2 ft NAVD 88 and more fine and small roots are in unsaturated peat.
Water levels in Portsmouth Ditch and wells ENW01 and WNE01 on either side of the ditch responded differently than East Ditch and its adjacent wells but similarly to each other (nearly coincident throughout the period), changing more than 6 ft over the 2-year period (fig. 38A). Water-level fluctuations in Portsmouth Ditch were among the greatest of all ditches in the area (fig. 35). Water levels in Portsmouth Ditch rose more in response to precipitation (fig. 38) than those in East Ditch (fig. 37), possibly because Portsmouth Ditch receives a large part of its flow from its watershed south of the study area without a stable water source (fig. 21).
During the wet season, the ditch and wells at the Portsmouth Ditch site responded similarly to precipitation (fig. 38B). Before precipitation events, a small water-level gradient was from the wells toward the ditch, indicating discharge from the peat into the ditch as water levels steadily declined. As water levels rose, the gradient remained small and from well WNE01 to the ditch, but it briefly reversed from the ditch to well ENW01 in the eastern block, indicating flow was from the ditch toward that well. Gradients from both wells again were toward the ditch as water levels declined. The direction of the gradient between well ENW01 and the ditch likely changed during the rise because the spoil-pile road intervened between the peat aquifer at well ENW01 and the ditch, impeding flow and delaying equilibration of levels between the well and the ditch, whereas no road separated the peat aquifer at well WNE01from the ditch.
During the dry season (fig. 38C), responses and relations were different than during the wet season (fig. 38B). Water levels in the ditch declined at a steady but decreasing rate with no clear ET cycle. Water levels in wells WNE01 and ENW01, however, reflected the effects of ET. As water levels declined, the gradient indicated a shift from flow from the wells toward the ditch to flow from the ditch toward both wells. The magnitude of this gradient increased as the characteristic of the ET cycle shifted from a stair-step to somewhat of a sinusoidal pattern as water levels declined, reflecting the gradient reversal. This shift was more evident in well ENW01 than WNE01, probably because of the effects of the intervening roadbed on the response in well ENW01. This shift to the sinusoidal pattern having an increased gradient shows that the ditch functioned increasingly as a local water source to the peat aquifer.
The response to precipitation during the dry season (fig. 38C) also differed from that of the wet season (fig. 38B). When precipitation began, groundwater levels rose rapidly at first, then slowed, and then rose more rapidly, whereas the response in the ditch was slower and more uniform. The rise in the ditch water level was largely flow from throughout the upper watershed (fig. 21) because the gradient locally remained from the ditch to the wells so that the ditch continued to contribute water to the peat throughout the event. The initial rapid rise in groundwater levels appears to be local recharge by precipitation, which slowed after the initial high intensity precipitation. As ditch water levels rose, flow into the peat from the ditch increased, and flow through the peat from the south and west also contributed to flow (fig. 33), causing the second rapid rise in groundwater levels as the gradient from the ditch to the wells increased.
Responses at the Rosemary Ditch site differed appreciably from responses at the two other sites in several ways. Water-level responses in the ditch were muted compared to those in the two nearby wells (fig. 39A) and Portsmouth Ditch (fig. 38A) but not as muted as that of East Ditch (fig. 37A). When comparing water levels, note that well ENE01 is about 100 ft from the Rosemary Ditch monitoring site, but well EE13 is about 0.75 mi upstream from the site so that water-level altitudes in that well cannot be compared directly to water-level altitudes in the ditch. Levels in the ditch typically ranged from 8 to 9 ft above NAVD 88 but increased to about 12 ft above NAVD 88 during the brief response to Hurricane Matthew. Levels in well ENE01 ranged from about 6.5 to more than 12.5 ft above NAVD 88 and in well EE13 ranged from about 8 to more than 13 ft above NAVD 88. Although the water-level ranges in the two wells were similar to those observed in wells by Portsmouth Ditch, the changes were more rapid in EE13 and ENE01 (fig. 38A; fig. 39A). Part of this difference in response likely was due to the limited peat toward the east causing groundwater levels to fluctuate more within the sand aquifer than within the peat aquifer. Fluctuations of the shallowest levels at well EE13 were smaller because the thickness of the peat is about 2 ft in that well (fig. 13). Because the sand has a lower specific yield than the peat, levels would rise more for the same amount of precipitation recharge and fall more for the same ET or ditch flow. This likely was part of the reason groundwater levels rose more in well ENE01 than in well EE13 in response to precipitation during the wet season (fig. 39B). During the wet season, levels in well ENE01 were 1 to 2 ft higher than the ditch water level with no spoil pile between the ditch and the well so that groundwater readily discharged into the ditch.
The nearby Dismal Swamp Canal likely contributes to muting changing levels in Rosemary Ditch in two ways. First, the canal is much wider than Rosemary and Big Entry Ditches, allowing a large amount of flow to be stored in the canal and transported through it with only a small change in levels. Secondly, operation of the canal for navigation attempts to maintain stable levels that can extend into Rosemary Ditch. The one exception to this was when flooding from Hurricane Matthew overwhelmed the response of the canal and ditch systems (fig. 35).
During the dry season, several changing responses to controls occurred (fig. 39C). Ditch levels remained stable compared to groundwater levels because of the effects of the canal. Groundwater levels in well ENE01 declined below ditch-water levels because of ET, which reversed the gradient as the ditch became a water source to the sand aquifer near the well. Levels in well ENE01 declined in a sinusoidal pattern that reflected the ditch as a water source to the sand aquifer. As groundwater levels declined, the rate of decline decreased and the amplitude of the cycle decreased in contrast to the increase observed in sand of wetlands elsewhere in the Coastal Plain of Virginia (Speiran, 1996; Speiran, 2010). The decrease in rate and amplitude with depth could be because the water table was about 5 ft below land surface, so that fine and small roots that typically are near land surface were substantially above the water table. Unsaturated flow toward the roots and land surface, therefore, would decrease as the water-table depth increased, indicating a decrease in the groundwater ET rate.
For well EE13, available data could not be used to identify the level at which the ditch became a water source, if it did. Because well EE13 is upstream from the Rosemary Ditch monitoring site, the reversal would occur at a higher altitude than the ditch water level at the monitoring site. Levels in well EE13 declined in a step pattern in mid-August, indicating discharge as ET with the ditch as a minimal water source near the well. Response to conditions in the ditch likely are limited because Well EE13 is 1,300 ft from the ditch whereas well ENE01 is only 100 ft from the ditch. As groundwater levels declined below 8.5 ft above NAVD 88 in well EE13 (below the ditch water level at the ditch monitoring site), the amplitude of step-type cycle decreased and shifted to a steady but decreasing rate of decline. Because groundwater levels declined to more than 5 ft below land surface, a decrease in the rate of groundwater discharge as ET is likely, as identified for well ENE01. Although an increase in specific yield could explain these changes, such a change is unlikely because the rate of decline slowed by a factor of 4 to 5, meaning specific yield would have to increase by that factor. Because the level in well EE13 continued to decline after the ET cycle ceased and until the recharge by precipitation on September 2, it is unlikely that the ditch became a source of water to the sand aquifer at that well.
The water-table configuration and altitudes across the northeastern quadrant of the swamp reflect the effects of controls at the East, Portsmouth, and Rosemary Ditch sites and additional controls. During the wet season in March 2015, the water table was high, and gradients in the western block indicate flow was from the East Ditch water source toward Big Entry and Portsmouth Ditches. The magnitude of the gradient changed little across the southwestern part of the western block but increased toward Big Entry and Portsmouth Ditches (fig. 33A). This increase resulted from the combination of the thinning of the peat aquifer to the north and east (fig. 14), the lower land surface near the ditches (fig. 17A; fig. 17B), and the presence of a spoil-pile road between the swamp and Big Entry Ditch. The gradient also was sharp in the northwestern corner because the East Ditch water source is close to the head of flow of Big Entry Ditch to which groundwater discharges (fig. 33). Although a spoil-pile road separates the swamp from Juniper Ditch, the gradient toward Juniper Ditch was small, indicating limited discharge into the ditch.
In the eastern block, the gradient was gradual from Portsmouth Ditch toward Rosemary Ditch to the east during the wet season having the highest level in the southwestern corner of the block (fig. 33A). The gradients toward Rosemary Ditch to the south and Big Entry Ditch to the north were small, indicating limited discharge into these ditches, probably because spoil-pile roads separate the swamp from the ditches; no spoil-pile road separates the swamp from Rosemary Ditch to the east. Because the level was highest in the southwestern corner of the eastern block during the wet season, Portsmouth Ditch possibly recharged the groundwater to the east. Such recharge likely is small because the gradient from the ditch to the east is small along most of the boundary and the spoil-pile road separates the ditch and the eastern block.
The water table was lower during the dry season in September 2015 (fig. 33B) than during the wet season in March 2015 (fig. 33A), and the pattern was similar to that of the March 2016 wet season (fig. 33A) with one major exception. The water table in the northeastern corner of the eastern block in September had a depression from ET with groundwater levels below levels in Big Entry and Rosemary Ditches, indicating the flow was from the ditches into the aquifer. The flow reversal from Portsmouth Ditch to wells WNE01 and ENW01 (fig. 38C) is not depicted in the dry-season water-level map (fig. 33B) because the gradient was small at the time of the periodic measurement, no more than a 0.04-ft difference, which is less than the resolution of the water-level map.
Water Budget
The 2010 water budget for Block C1 quantifies where precipitation is stored and the pathways by which it flows through and discharges from a local hydrologic system where precipitation is the only water source. Some components of the budget change seasonally depending on changes in the hydrologic controls.
Input and Input Storage
Precipitation followed no distinct seasonal pattern in 2010; month-to-month amounts quickly decreased from the annual high of 19.71 in. in September to 3.55 in. in October, and then the annual low of 0.68 in. in November (table 10). Precipitation totaled 62.84 in. annually and averaged 5.24 in. per month. Most precipitation in September resulted from the 18.78 in. (about 30 percent of the annual total) from the remnants of Tropical Storm Nicole during September 26–29. Unlike the large amounts of surface runoff from Tropical Storm Julia and Hurricane Matthew, effects of surface runoff were not evident after this event, even with the larger amount of precipitation, because of dry antecedent conditions.
Table 10.
Water budget, in inches, based on precipitation and water-table changes in well C00W at the center of Block C1, the Great Dismal Swamp, Virginia and North Carolina, January 1–December 31, 2010.[Interception and peat rewetting input is assumed to discharge as evapotranspiration; most of the lateral groundwater flow likely discharges into ditches; a positive groundwater storage indicates an increase in storage; a negative groundwater storage indicates a decrease in storage. N/A, not applicable]
Approximately 9.47 in. of the annual precipitation (15 percent of the annual total) was intercepted by vegetation and land surface or rewetted unsaturated peat in no distinct seasonal pattern (table 10). Amounts likely depended on the frequency and duration of precipitation events and antecedent conditions. Many precipitation events were not large enough to produce recharge, which varied monthly from 0.14 in. in April to 15.95 in. in September and totaled 54.89 in. annually (85 percent of the calculated annual input) and showed no distinct seasonal pattern.
Discharge and Change in Storage
Groundwater discharged by two pathways: (1) lateral flow that discharged into ditches and (2) ET to the atmosphere. Monthly lateral flow decreased from 6.05 in. in January to only 0.85 in. in September as groundwater ET became appreciable and groundwater levels declined into the low-hydraulic-conductivity, low-yielding lower peat. Lateral flow to the ditches then increased to a monthly high of 7.34 in. in October after groundwater levels rose to near land surface at the end of September. Lateral groundwater flow to ditches averaged 3.60 in. monthly and totaled 43.21 in. annually, which was 79 percent of the groundwater recharge or 69 percent of the annual precipitation (table 10).
As indicated by PET, actual ET typically increased from the winter through the spring, peaked in June or July, and remained high through August before it decreased into the winter. Water from interception and rewetted unsaturated peat discharged as ET throughout the year. ET discharged moisture either directly from the peat into the atmosphere or from the peat through the vegetation to the atmosphere. During many periods in the growing season, groundwater became the major or sole water source for vegetation because discharge as ET depleted soil moisture after precipitation events. During the non-growing season, groundwater discharge as ET appeared to be minimal as indicated by the uniform, 24-hour decline in groundwater. The moisture content of unsaturated peat appeared to supply most of the need for vegetation ET during the non-growing.
Monthly groundwater ET increased from 0.0 in. in February to 5.69 in. in June. Contrary to what was typically expected based on average monthly PET, ET then decreased by about 50 percent to 2.88 in. in July, 2.13 in. in August, and 1.56 in. in September (table 10). Total annual ET was 28.34 in. (45 percent of the measured precipitation) with 9.47 in. from interception and rewetted, unsaturated peat (15 percent of precipitation) and 18.87 in. from groundwater. Total ET was about 87 percent of the 32.44 in/yr average PET for the Lake Kilby weather station. Groundwater ET was 44 percent of the groundwater discharged laterally toward ditches, 34 percent of the annual recharge, and 30 percent of the annual precipitation.
Total groundwater discharge by lateral discharge (43.21 in.) and groundwater ET (18.87 in,) was 62.08 in., exceeding groundwater recharge by 7.19 in. Discharge greater than annual recharge causes a decrease in groundwater storage that manifests itself as a decline in the groundwater levels over the year. The change in groundwater storage based on groundwater levels was 9.29 in., which is 2.10 in. or 29 percent more than the change in storage calculated from the difference between groundwater recharge and discharge. Subtracting the calculated annual change in groundwater storage from total discharge, the net 2010 discharge of precipitation recharged in 2010 was 62.27 in., 0.57 in. (0.9 percent) less than measured precipitation.
Monthly changes in the water budget illustrate the attributes of seasonal variations in budget components (table 10). Although precipitation and recharge do not follow a seasonal pattern, ET showed the expected increase into the growing season (April–October), which causes a distinct seasonal pattern in discharge. Increased ET causes groundwater levels to decline and reduces flow toward and discharge into the ditches. During the non-growing season (November–March), the primary discharge pathway was lateral flow to the ditches. During the growing season, discharge was a combination of lateral flow and ET (table 10). Discharge by lateral flow to ditches and as ET decreased during July and August because the water table dropped from the upper peat (depth above 1.5 ft) into the lower peat (depth greater than 2.0 ft). This decrease in ET indicates that the low hydraulic conductivity of the lower peat limits the unsaturated flow of water toward fine roots, thereby limiting water availability and accounting for the “dry” conditions identified by Phipps and others (1978) in their tree-ring analysis. This limitation on flow stresses the trees and potentially alters habitats. Consequently, groundwater ET is reduced as the water table approaches land surface in the upper peat because more roots are in saturated peat and as the water table drops into the lower peat where the low specific yield and hydraulic conductivity limit water availability.
When the water table declines into the lower peat, most of the lateral flow and discharge into ditches likely is through the sand. Although the volume and rate of groundwater discharge was less when the water table was in the lower peat than in the upper peat, the rate of water-table decline nearly doubled due to low specific yield. The combination of lower flow and discharge combined with the greater hydraulic gradient during low water levels (fig. 22) further supports the conclusion of the low hydraulic conductivity of the lower peat. The average water-table decline was 0.08 foot per day (ft/d) above a depth of 1.5 ft and increased to 0.16 ft/d below a depth of 2.0 ft. Despite doubling the rate of decline and tripling the horizontal hydraulic gradient, the daily discharge volume decreased by more than 75 percent from 0.18 inch per day (in/d) to 0.04 in/d.
Comparison of Input, Input Storage, and Discharge
Annual input storage (interception and rewetting unsaturated peat plus recharge) was 1.52 in. (2.4 percent) more than measured precipitation (table 10). Annual input storage minus discharge from annual recharge (discharge minus the change in storage) is only 2.10 in. or 3.4 percent of the measured precipitation. The close agreement of these values indicates that specific yield estimates likely are close to actual values and that appreciable other sources such as surface runoff, other flow paths, and other storage reservoirs are unlikely.
Water Quality/Chemistry
Groundwater and surface water that flow east from the Isle of Wight Plain and across the scarp have a chemistry different from that of groundwater from precipitation recharged across the swamp. The organic carbon in the peat creates a water quality different from that commonly encountered in mineral sediment. As these waters mix, they geochemically interact and react with the mineral sediment and peat through which they flow, evolving the water quality. The mixing of these waters and their subsequent chemical evolution exhibited distinct patterns in the relation between pH and specific conductance (fig. 40) and created some extreme water-quality characteristics. Most deviations from the pH/specific conductance relation are attributed to identifiable effects of the hydrology and chemistry in the swamp and help substantiate the conceptual flow model.
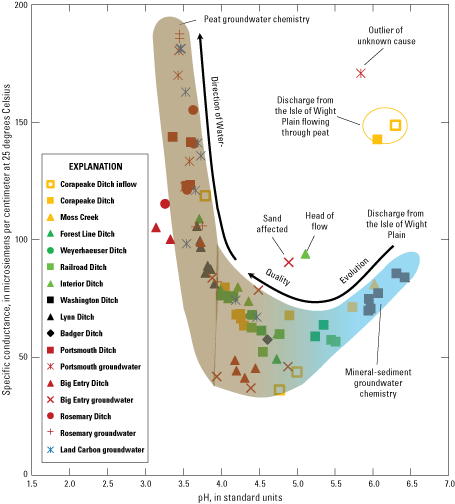
Relation between the pH and specific conductance of groundwater (*, +, or X), ditch water (solid symbols), swamp water, and inflowing ditch water (open symbols), reflecting the effects of the mixing of water sources and subsequent chemical evolution, across the Great Dismal Swamp, Virginia and North Carolina, March 15–31, 2016. [Solid symbols of the same shape and color are different points along the same ditch. Open symbols of the same shape and color as a ditch are samples from the nearby swamp. Solid symbols of the same color but different shape are interconnected ditches. Symbols for wells near a ditch have the same color as the ditch.]
Relation Between pH and Specific Conductance
The relation between pH and specific conductance was derived from data from the synoptic field survey of March 15–23, 2016, and groundwater collected at Land Carbon sites March 29–31, 2016 (fig. 11). To better depict the effects of sources, mixing of the waters, and chemical evolution across the swamp, a symbol convention is used in fig. 40 to track water sources and the subsequent evolution in water chemistry. Samples from the same ditch are indicated by the same solid symbol and color. Different shaped solid symbols of the same color represent other ditches flowing from one into the other or located in the same vicinity. Open symbols of the same shape and color represent water in the adjacent swamp. An asterisk (*), plus (+), or “X” represent groundwater; symbols having the same color as a ditch represent a well near that ditch.
The pH of water derived from the Isle of Wight Plain ranged from about 5.5 to 6.4 standard units; the specific conductance ranged from about 70 to 150 microsiemens per centimeter at 25 degrees Celsius (μS/cm) (light-blue-shaded area, fig. 40). The pH of groundwater from sites where precipitation infiltrated into and flowed through peat was more acidic, ranging from about 3.1 to 4.0 standard units; specific conductance of those waters ranged from 42 to 188 μS/cm (brown-shaded area, fig. 40). The pH of groundwater recharged primarily through the sand aquifer from two wells near Big Entry Ditch (fig. 2, northeastern quadrant; fig. 11) was about 4.9 standard units because minimal peat is present (blue-shaded area, fig. 40). Most waters not within these shaded areas but within the shaded transition are mixtures from these sources and (or) were chemically altered as the water flowed through the peat or sand aquifers (fig. 40).
Like spatial changes in hydrologic responses, water quality evolved in ditches as the water flowed from the scarp, and the effects of the peat chemistry increased as the ditch contained more groundwater discharged from the peat aquifer. The quality evolved to a lower pH and an initial decline in specific conductance followed by an increase. The nature and degree of this evolution, like hydrologic response, partly depends on differences in the characteristics of hydrologic and chemical controls. Differences in evolution of the water quality in Washington, Lynn, and Corapeake Ditches (fig. 2) highlight some major effects.
Washington Ditch (West of Lake Drummond, fig. 2) is 1 of only 2 ditches receiving water discharging directly from streams that cross the scarp. The pH and specific conductance of water in Washington Ditch changed little on March 23, 2016, relative to the overall differences in water quality across the swamp, remaining similar in characteristics along the entire ditch (fig. 40). Data are from six sites along a 4-mi interval of the ditch from the inflow of Pocosin Swamp at the scarp to where the road became impassable near Lake Drummond. The pH ranged from 5.9 to 6.4 standard units; specific conductance ranged from 70 to 86 μS/cm (fig. 40). This quality was like that of Moss Creek, a stream flowing across the scarp and into the swamp to the south (fig. 40). The water quality of Washington Ditch changed little because the large inflows from Pocosin Swamp and Cypress Swamp appeared to be much greater than groundwater discharge from the peat and, consequently, dominated the water quality.
The quality of water from Lynn Ditch on the same date reflected the evolution of the chemistry of groundwater discharged across the scarp that mixed with precipitation recharged through the peat (fig. 40). Lynn Ditch is 1 of the 4 ditches close to and parallel to the scarp and is nearly perpendicular to Washington Ditch about 1.9 mi from the scarp. A water-control structure under Washington Ditch road controls flow from Lynn Ditch into Washington Ditch. The quality of water at seven sites along the length of Lynn Ditch differed little from each other but differed substantially from that of Washington Ditch. Its chemistry was characteristic of that affected by peat; pH ranged from 3.7 to 3.9 standard units, and specific conductance ranged from 82 to 106 μS/cm (fig. 40). The quality differed little because Lynn Ditch is a similar distance from the scarp along its length, causing similar relative distributions in sources and chemical evolution of the water along its length.
Badger Ditch water originates as groundwater discharging from the base of Suffolk scarp and flows east past the approximate midpoint of Lynn Ditch. This flow mixes with groundwater recharged through the peat. In contrast to the quality of Lynn and Washington Ditches, the pH was 4.6 standard units and specific conductance was 58 μS/cm in Badger Ditch near Lynn Ditch (fig. 40). This quality was within the relation for the mixing of water from the scarp (Washington Ditch) with that dominated by the peat (Lynn Ditch), indicating a greater effect of chemical evolution from the peat than in Washington Ditch but less than in Lynn Ditch (fig. 40).
Flow in Corapeake Ditch (South of Lake Drummond, fig. 2) also originated as groundwater discharging from the base of Suffolk scarp. The quality of water at its head of flow on March 16, 2016, differed from that of Washington Ditch and evolved substantially downstream. Two sites at the head of flow at Corapeake Ditch had a similar quality to each other but appear as outliers from the pH/specific conductance relation (fig. 40). One site was standing water in the swamp across the road from the ditch; the other was directly in the ditch. Water at both sites likely was derived from the combination of groundwater discharging from the scarp as indicated by flow-model results of Eggleston and others (2018) (fig. 24) and recharge within the swamp. Unlike Washington Ditch, the head of flow in Corapeake Ditch had no direct inflow from a stream crossing the scarp. Consequently, a difference in quality of at least one source, likely groundwater flow across the scarp, or a different, likely short-lived evolution in the chemistry of the water from the two sources might have caused these outliers. The quality of the next downstream point on Corapeake Ditch is within the relation, like that of Washington Ditch. The quality continued to evolve through the mixing-zone relation toward the quality of the peat groundwater having a decreasing pH and variable specific conductance (fig. 40).
The cause of other apparent outliers, except groundwater from well SEW01 near Portsmouth Ditch (fig. 2, northeastern quadrant; fig. 11), can be explained by the water sources and the likely subsequent chemistry (fig. 40). The quality of groundwater from well SEW01 is different from that of Portsmouth Ditch and other nearby wells and is most like that of the two samples from the source of flow in Corapeake Ditch. This well, however, is near the mid-point of the east side of Portsmouth Ditch within the northeastern quadrant of the swamp. It is several miles from the scarp with intervening ditches so that flow across the scarp is not a likely water source to this well. No explanation of the quality of water from this well is readily evident, based on known conditions in this area.
The outlier from Interior Ditch is from the upstream end of the ditch adjacent to, but not directly connected to, West Ditch where groundwater from the scarp discharges into the ditches (fig. 24). Part of the groundwater likely flows through the peat before discharging to the ditch. The next downstream value is within the mixing relation.
Additional outliers, although outlying only a little, are from Big Entry and Rosemary Ditches in the northeastern quadrant of the swamp (fig. 2; fig. 40). The water source to Big Entry Ditch is groundwater discharging from the swamp along the entire length of the ditch, except at its intersection with Portsmouth Ditch where flows from the two ditches converge, mix, separate, and flow into both ditches. Groundwater discharge along Big Entry Ditch is a combination of peat- and mineral-sediment-derived groundwater as indicated by the thickness of the upper peat and thickness of the full peat (fig. 13; fig. 14). Near the head of flow, water has the lowest specific conductance, about 40 μS/cm, and appears to be appreciable mineral-sediment-derived groundwater. The two outliers from Big Entry Ditch were for samples collected immediately downstream from Portsmouth Ditch and farthest downstream, immediately above the confluence with Rosemary Ditch. The Rosemary Ditch outlier is for a sample collected immediately above the confluence with Big Entry Ditch.
Another aspect of the effects of flow on the pH/specific conductance relation is of note for two of the Land Carbon wells: Maple 2 and Maple 3. These two wells were the only Land Carbon wells to consistently have water samples with a pH greater than 4.0 standard units. The pH at first was thought to be caused by the forest-type land cover because these were 2 of the 3 maple forest sites. As the hydrology of the swamp became better understood, these pH values were considered to result possibly from water sources and flow paths, not forest type. This theory was a large part of the reason for conducting the synoptic survey. The relation (fig. 40) indicates that the quality of water from these wells is in the transition of water discharging across the scarp and groundwater derived from the peat, which is supported by model-simulated flow during average springtime conditions (Eggleston and others, 2018). Maple 3 is east of West Ditch where part of the groundwater flowing across the scarp passes under West Ditch as it flows to Lateral and Railroad Ditches (fig. 24). Maple 2 is between Weyerhaeuser and County Line Ditches (fig. 2) in a small area near their confluence with Cross Canal Ditch where water flows from Weyerhaeuser Ditch through the swamp to County Line Ditch (fig. 21). The pH of the water in Weyerhaeuser Ditch was greater than 4.0 standard units, like that of Maple 2. Like Lynn Ditch, Weyerhaeuser Ditch is 1 of the 4 ditches parallel to the scarp and receives groundwater discharge from across the scarp. Unlike Lynn Ditch, Weyerhaeuser Ditch indirectly receives water from streams that flow across the scarp and discharge diffusely across the surface of the swamp, likely accounting for the difference in the quality.
Dissolved Organic Carbon, Nutrients, and Major Ions
Decomposition of organic carbon in the peat produced dissolved organic carbon (DOC) in the groundwater that created a different quality than that typically encountered. At the nine Land Carbon sites, DOC concentrations ranged from 55 to 195 mg/L with a median concentration of 121 mg/L and an average concentration of 120 mg/L (fig. 41; table 11). Numerous other studies included DOC concentration for various periods. Maximum DOC concentrations in groundwater of only 2 of the 11 countries worldwide cited in Mostofa and others (2013) exceeded this median of 121 mg/L (183 mg/L in Botswana and 170 mg/L in Germany). DOC concentrations in groundwater of the Great Dismal Swamp were substantially higher than concentrations in swamps elsewhere in the eastern United States. In five swamps from eastern North Carolina, for example, DOC concentrations of samples ranged from 10 to 20 mg/L and averaged 15 mg/L (Mulholland and Kuenzler, 1979). The Chickahominy River is a black-water stream (has high DOC concentrations) that flows through a bottomland hardwood forest in the Coastal Plain of Virginia having DOC concentrations that ranged from 1 to 20 mg/L (Speiran, 2000). In the Okefenokee Swamp and Big Cypress Swamp to the south, DOC concentrations averaged 30–40 mg/L (Thurman, 1985). DOC concentrations ranged from 20 to 400 mg/L (average 55 mg/L) in the Great Heath, a sphagnum bog in Maine (Thurman, 1985). Although the maximum DOC concentration in the Great Heath exceeded the maximum measured in the Great Dismal Swamp, the average equaled the minimum measured in the Great Dismal Swamp. The cited references were published from 7 to more than 40 years before this report so that reported analyses likely cover a longer time period. Possible temporal effects on concentrations of DOC are uncertain and likely are different in the different systems.
Table 11.
Summary of groundwater-quality characteristics and constituent concentrations in samples from Land Carbon sites, the Great Dismal Swamp, Virginia and North Carolina, May 19, 2015 through April 1, 2017.[mg/L, milligrams per liter; diss, dissolved; wf, filtered water; μS/cm, microsiemens per centimeter; °C, degrees Celsius; N, nitrogen; <, less than; --, not calculated; P, phosphorus; wu, unfiltered water; μg/L, micrograms per liter; meq/L, milliequivalents per liter]
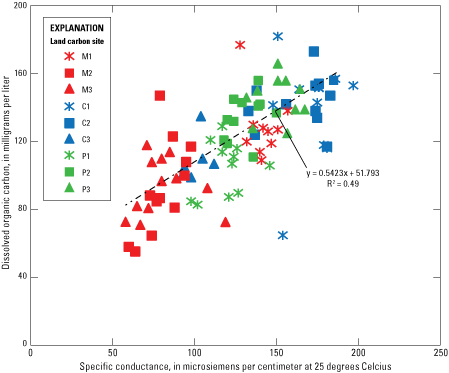
Relation of specific conductance and dissolved organic carbon concentrations in groundwater at Land Carbon sites, the Great Dismal Swamp, Virginia and North Carolina, May 19, 2015 through April 1, 2017.
Peat decomposition also releases various nutrients, making them available to aquatic systems. Effects of decomposition, as reflected in dissolved nitrogen, result partly in ammonia but mostly in dissolved organic nitrogen (table 11). Ammonia concentrations ranged from 0.05 to 1.79 mg/L as nitrogen (N), whereas concentrations of dissolved organic nitrogen ranged from 1.3 to 5.7 mg/L as N. Although the dissolved organic nitrogen is incorporated in the DOC, the relation between DOC and dissolved organic nitrogen (not depicted) was poor, having a correlation coefficient (R2) of 0.09. The nitrate plus nitrite concentrations were low, having a median concentration of less than the 0.02 mg/L as N minimum reporting level and the maximum concentration of 0.28 mg/L as N. The 95th percentile of the concentration was 0.009 mg/L as N (table 11). The low nitrate plus nitrite and low to moderately high ammonia concentrations are typical of systems having a high organic content where low dissolved oxygen concentrations limit the oxidation of ammonia to nitrate after the nitrogen is mineralized and released from the carbon. Concentrations of dissolved (water filtered) orthophosphate and dissolved phosphorus were less than the minimum reporting level in 67 and 59 of the 91 samples, respectively. The minimum reporting level for the orthophosphate was 0.004 mg/L as phosphorus (P). The minimum reporting level for the dissolved phosphorus varied, ranging from 0.008 to 0.184 mg/L as P. Maximum concentrations were 0.076 and 0.098 for orthophosphate and dissolved phosphorus, respectively.
The pH of groundwater at the Land Carbon sites ranged from 3.3 to 5.1 standard units with a median of 3.6 standard units (table 11). The low pH of the water in the Great Dismal Swamp (fig. 40; table 11), results from the humic and fulvic organic acids that partly compose the DOC, peat, and other organic material (Thurman, 1985). When the pH is less than 4.5 standard units, as it was in about 95 percent of the samples (table 11), the organic acids rather than carbonate and bicarbonate buffer the waters against changes in pH. Organic acids also can provide part of the buffering at pH greater than 4.5 standard units in these systems.
Ionization of the organic acids and other changes in chemistry create negative charges on the DOC. Negative charges on the DOC help the groundwater to conduct an electrical current, potentially contributing to a moderate relation between specific conductance and DOC (R2 of 0.49, fig. 41). The contribution of the DOC to specific conductance appears to be disproportional to the anionic composition required to balance the cation concentrations. As part of a check on water-quality analyses that is commonly used, the USGS NWQL issues alerts for results having 100 times the milliequivalence of cations divided by the specific conductance not within a targeted range of 0.92 to 1.24. The ratios were much lower than that range for all samples from all Land Carbon sites, except most samples from Maple 3 (fig. 42). Although the ratios for samples from Maple 2 are outside of the target range (about 0.75), they are closer to this range than remaining sites. The ratios for all other sites are less than 0.5 with those of many samples less than 0.25. The Maple 2 and Maple 3 sites are the only Land Carbon sites identified as mixtures that include groundwater discharging through the sand aquifer from the Isle of Wight Plain and across the scarp, further demonstrating the role of the peat and the DOC in affecting the groundwater chemistry in the swamp and the differences in the chemistry of the different water sources.
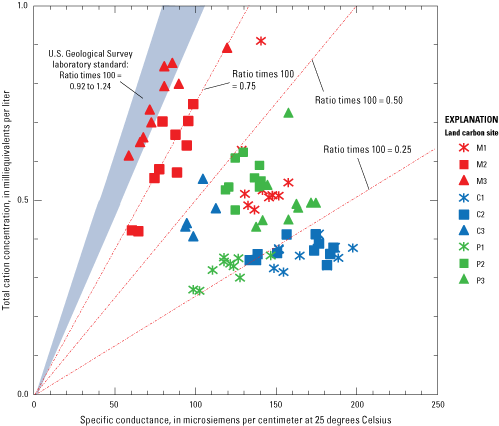
Relation of specific conductance to cation concentrations in groundwater at Land Carbon sites, the Great Dismal Swamp, Virginia and North Carolina, May 19, 2015, through April 1, 2017.
The negative charge of the DOC is a part of the anionic composition of the groundwater that balances the cationic composition. A comparison of anionic and cationic charges, termed an ion balance, typically is used to identify possible analytical errors or to determine whether all ions are accounted for in the analysis of water samples. Concentrations of major cations (calcium, magnesium, sodium, potassium, iron, and manganese) and major anions (chloride, sulfate, and fluoride) typically were less than 10 mg/L in most samples from Land Carbon sites (table 11). Because the anionic content of the DOC cannot be quantified, it is reflected at least as part of the cation excess in the ion balance.
Another factor affecting the ion balance in water having high DOC is the exchange of cations onto the DOC. When the cations are present on the DOC in this form, they are not dissolved in water as ions but will be analyzed as if they are because the ions pass through the filter on the DOC and are measured in the analysis. Because these ions are reported as dissolved and because the associated anionic characteristics of the DOC cannot be quantified, the ion balance displays an excess of cations (Thurman, 1985). For groundwater from the Land Carbon sites, the excess of cations ranged from about 10 to 70 percent (fig. 43). Although the Maple 2 and Maple 3 sites were closest to the range for the specific conductance/cation relation (fig. 42), these two sites, particularly Maple 3, tend to have the greatest percent difference between anion and cation concentrations (fig. 43), reflecting a likely high anionic charge on the DOC.
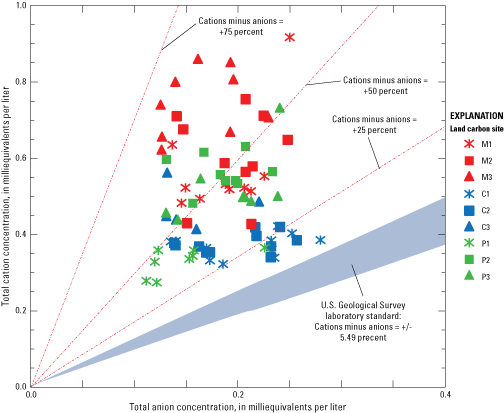
Relation of concentrations of total anions to total cations in groundwater at the Land Carbon sites, the Great Dismal Swamp, Virginia and North Carolina, May 19, 2015, through April 1, 2017.
Management and Research Implications
Rewetting the swamp by use of adjustable-height, water-control structures on ditches and silvicultural practices are the primary management practices implemented by refuge staff to reverse the effects of the persistently dry conditions caused by drainage and to achieve management objectives. Careful attention to the hydrologic controls and responses is critical to selecting hydrologic management practices that most effectively balance competing responses and objectives to best achieve overall objectives.
The primary habitat goal for the Great Dismal Swamp is to restore bald cypress, Atlantic white cedar, and pocosin habitats that dominated the forest before ditching and timber harvesting (U.S. Fish and Wildlife Service, 2006). Each species requires and tolerates different soil wetness and hydroperiods. Subtle differences in the topography control the wetness and hydroperiod and, consequently, the distribution of these species (Shaler, 1890; Dean, 1969). Prior to the onset of ditching and timber harvesting, bald cypress dominated the lower, wetter areas across the swamp, whereas cedar covered slightly higher, less wet areas (Shaler, 1890). Pine pocosins typically occupied slightly drier locations. Because of the long history of disturbances and the lasting effects of some disturbances, management using water-control structures cannot restore the swamp to its original conditions. Instead, use of water-control structures can create a range of hydrologic conditions that mimic original conditions but have a different spatial distribution potentially having large changes over short distances. Such hydrologic conditions can support resilient bald cypress, Atlantic white cedar, and pocosin habitats but in distributions different from pre-disturbance distributions. The lasting disturbances that will limit restoration and cause these distributions include decomposition of the peat, the low hydraulic conductivity of the roadbeds; continuing drainage through the ditches; and the steeper gradients of, and differing depths to, groundwater caused by this drainage. Characteristics of these distributions will depend on water-control structure locations, control-structure management, the side of the ditch having a spoil-pile road, microtopography, and other factors. These distributions are important considerations for planning silviculture-management actions, such as removing existing, less desirable species and planting desired species.
In the past, refuge managers removed most stop logs from water-control structures during the late winter to early spring wet season (February to April) to reduce inundation that was perceived to stress the forest. Stop logs were reinstalled only after the swamp drained and ditch-water levels were 2 to 3 ft below the top of ditch banks. This approach was based on the perception that raising stop-log levels after the swamp had drained would rewet the swamp already experiencing dry conditions. Across most of the swamp where precipitation is the only water source, however, raising stop-log levels at such times rewets the swamp only near the ditch; rewetting does not extend into the swamp unless enough precipitation falls to raise water levels. Large amounts of precipitation are needed at these times because of the onset of high ET rates; the likelihood of such precipitation is limited.
Only where the swamp receives groundwater from the Suffolk scarp and where ditches are appreciable local water sources to the peat aquifer, such as where East Ditch is a water source for the western block of the northeastern quadrant, will raising stop logs when entering dry seasons likely raise groundwater levels and rewet the swamp. As conditions become dry, however, the ability to rewet these parts of the swamp decreases as indicated by the declining water levels during the growing season in East Ditch and well WW13 to the east (fig. 37). The primary benefit of water-control structures, therefore, is to retain groundwater recharged during the wet season. The potential to retain water decreases considerably as temperatures warm, trees leaf out, and ET becomes an appreciable discharge pathway that causes rapidly declining groundwater levels and dries peat.
In a revised strategy to rewet the swamp, stop logs are set at levels to maintain ditch-water levels near the top of the ditch bank immediately upstream from structures to slow the decline in groundwater levels across the swamp. This strategy, however, causes mortality of wetland species such as Atlantic white cedar near the ditches; mortality typically does not extend away from the ditches, probably because drainage creates the thickest unsaturated peat and encouraged deep growing tree roots near ditches.
This mortality highlights some complexities of rewetting the swamp. When individual trees of wetland species germinate in persistently wet conditions, roots grow and remain shallow to best survive the conditions and thrive according to the hydroperiod required and tolerated by the respective species. Such conditions typically favor wetland over non-wetland species. Roots of many trees in the Great Dismal Swamp, however, appear to have grown to greater depths since the swamp was first drained to compensate for the persistently deeper water table and drier peat. When the swamp is rewetted, peat surrounding deeper roots will become saturated and remain saturated throughout much of the year, stressing the trees and causing damage and possible mortality of many of the mature trees, as observed for Atlantic white cedar along Corapeake Ditch. Consequently, rapid rewetting of the interior of the swamp also can cause extensive mortality in these areas. Needed natural regeneration and planting would require decades for reestablishing mature wetland forests. Reestablishment would become complicated by an appreciable decrease in ET that would cause wetter conditions throughout the growing season than would prevail with a mature wetland forest. This could limit natural regeneration and the survival of planted seedlings because seedlings require and tolerate different hydroperiods than mature trees of the same species. Accordingly, several years of low water levels and dry conditions likely will be needed to allow regeneration and (or) planting of seedlings that grow to a height that can survive inundation. Such a cycle would be needed periodically as a forest matures to establish an age-class distribution needed for a healthy, mature wetland forest.
As an unproven alternative to rapid rewetting, a slow (several years perhaps) incremental rewetting could saturate and kill limited roots of mature wetland trees and allow them to grow new, shallower, small and fine roots. This approach potentially could allow the mature trees to adapt to wetter conditions and minimize mortality. The manner of this implementation would require research to determine a rate for rewetting to favor desired wetland species and exclude non-wetland species.
Additional complexities are created by the spoil-pile roads on one side of each ditch that form wetter then natural conditions on that side of the ditch and drier than the natural conditions on the other side. This situation creates simultaneously conflicting management needs for draining excessively wet areas on one side of the ditch and rewetting excessively dry areas on the other. The establishment of different wetland communities having different wetness and hydroperiod needs and tolerances on each side of the ditch might be needed to restore the swamp.
The importance of ditch water levels to groundwater levels and flow at the local scale, even where spoil-pile roads intervene between the swamp and ditches as identified in the water-table configuration in Block C1 (fig. 22), is another important management consideration. Despite flow inhibition, the approximately 2-ft lower level in Sycamore Ditch than in the other three ditches surrounding the block consistently caused most groundwater to flow north into Sycamore Ditch. This shifted the groundwater divide toward Corapeake Ditch (fig. 22); approximately 85 percent of the groundwater discharging from Block C1 into Sycamore Ditch (Eggleston and others, 2018). Such shifts can cause differences in wetness across the swamp that affects species distributions and resulting management needs.
In addition to ditches and roadbeds, differences in the hydraulic characteristics of the upper peat, lower peat, and sand are among the most important controls on hydroperiod and flow throughout the swamp. The high specific yield and hydraulic conductivity of the upper peat allow the peat to store large amounts of water that are readily available to the forest community for ET and becomes unavailable when drained to the ditches by low ditch-water levels. In contrast, the low specific yield and hydraulic conductivity of the lower peat and sand limits water availability for the forest community when the water table declines, making conditions appear to be dry and causing stress to the forest (Phipps and others, 1978). Thus, keeping ditch-water levels high to keep the water table within the upper peat is important to maintaining the water source and achieving many management objectives. Although the thickness of the upper peat is 1.5 ft in Block C1, it varies across the swamp as in the northeastern quadrant of the swamp (fig. 14). Dry conditions are more difficult to avoid where the upper peat is thin or absent.
Although factors, such as differences in land-surface altitude on different sides of ditches (fig. 2; fig. 3), hummocks around tree bases, and exposed tree roots (fig. 4), indicate peat subsidence, the extent to which the loss of buoyancy, dehydration, and decomposition contribute to subsidence remains unknown. The net flux of carbon into or out of the swamp is being evaluated, although soil emission of carbon dioxide has been measured, and groundwater contains carbon dioxide and organic carbon concentrations greater than 60 mg/L. Although Drexler and others (2017) quantified net accretion rates for previously deposited peat, the rate at which peat accretes at land surface and decomposes and dehydrates below land surface was not determined. Ongoing surface-elevation-table (SET) monitoring will determine whether subsidence or peat accretion is greater. Part of the SET monitoring was established as part of the Land Carbon project; monitoring at other sites across the swamp began after that. Although the Land Carbon monitoring has been ongoing since 2015, identifying a trend requires several additional years of monitoring (Nicole Cormier, U.S. Geological Survey, oral commun., 2017). Water-level management to establish and preserve resilient wetland forests and reduce fire risk is expected to increase peat accretion, reduce peat decomposition, reduce dehydration, and reduce or reverse possible subsidence. Changing subsidence rates will affect land-surface altitude and the microtopography across the swamp, ultimately affecting the hydroperiod. Changing effects can be identified with the continued SET monitoring.
Water-control structures can mitigate flooding effects from some precipitation events by storing precipitation in the upper peat and slowing subsequent drainage. As the size of events increases and sequences of certain types of events occur, however, the capacity to store additional precipitation, control flow, and mitigate downstream flooding with structures is exceeded. Conditions under which the ability to store precipitation is exceeded depend on antecedent groundwater levels and soil moisture and characteristics of the event; runoff from the swamp even from large events can be limited or excessive depending on these conditions.
Large precipitation events in 2010 and 2016 provide contrasting examples of the effects of different events. When the first of more than 18 in. of precipitation fell during September 26–29, 2010, from Tropical Storm Nicole, groundwater levels were about 3.5 ft below land surface in well C00W in Block C1, and the peat was dry. Precipitation in July, August, and September 2010 was 3.83 in., 6.15 in., and less than 1 in., respectively. Groundwater levels increased to near land surface during that event, and surface runoff was limited.
In contrast, Tropical Storm Julia (September 20–22, 2016) produced more than 9 in. of the 13.33-in. September precipitation following 9.75 in. and 7.76 in. in July and August, respectively. Hurricane Matthew (October 8–9, 2016) followed with 12.21 in. Because of greater amounts of antecedent precipitation, groundwater levels were about 0.9 ft below land surface in well C00W before Tropical Storm Julia and rose to about 0.75 ft above land surface during that event. Groundwater levels were 0.3 ft above land surface before Hurricane Matthew and rose to about 1.25 ft above land surface during that event. As a result, water overflowed ditch banks, inundating roads, the swamp, and water-control structures, causing flooding from Tropical Storm Julia and even greater flooding from Hurricane Matthew. Flow could not be managed because the capability of the infrastructure was overwhelmed.
One commonly proposed approach for managing flooding is to drain the peat aquifer before large storms to increase available precipitation storage. For this approach to succeed, the storm must be predicted accurately far enough in advance to drain enough water from the peat. Most available storage is in the upper peat, based on specific yield (fig. 15; fig. 16). Available storage decreases through the upper/lower peat transition and is low in the lower peat and sand aquifer. Consequently, lowering groundwater levels to the upper/lower peat transition optimizes storage; little additional storage results from lowering levels in the lower peat. Owing to the flow characteristics of the ditch network, dropping ditch-water levels by 1–2 ft requires 2–3 weeks of draining at maximum rates to increase available storage before the arrival of a storm. Accurate storm prediction 2–3 weeks in advance is not currently possible. Consequently, lowering levels to such depths would create a high risk of the swamp becoming drained and dry if a predicted storm or other precipitation do not materialize, particularly if implemented when ET rates are high, which is when such storms typically occur. Without appreciable follow-up precipitation, dry conditions would persist, stress forests, and increase the risk of fire. Flood reduction, therefore, is a management goal that is difficult to achieve and competes with the reduction of fire risk; the reduction of peat decomposition, shrinkage, and subsidence; and the establishment of healthy, mature wetland forests.
Hydrologic management to reduce the risk of fire has important implications for cedar and pocosin communities because of their dependence on fire. By reducing fire risk, the types of fires needed by these communities likely would be reduced or eliminated. This is particularly likely for cedar communities that require large intense fires. Consequently, alternative management procedures such as harvesting competing species and planting the desired species might be needed.
Management of newly installed water-control structures in the northeastern quadrant of the swamp is intended to rewet that area. Success of such changes likely will vary across the area because of spatial differences in the hydrologic controls. Management of structures primarily affecting the western block likely will be more effective than management of structures primarily affecting the eastern block for three reasons. First, East Ditch provides a stable water source in addition to precipitation to the western block that is not available to the eastern block. Consequently, effective management of structures affecting the western block will cause water from the East Ditch source to be retained and wet conditions to be extended spatially and temporally. Second, the upper peat is thicker and more widespread across the western block, providing greater water-storage potential in the upper peat than in sand that dominates much of the eastern block. Third, a water control has been added only along a part of Big Entry Ditch west of its intersection with Portsmouth Ditch. This was an intentional management decision to reduce the risk of soil saturation and inundation of privately owned land north of Big Entry Ditch and east of Portsmouth Ditch. Although the road between the swamp and Big Entry Ditch impedes northward flow from both blocks, flow cannot be managed east of Portsmouth Ditch. Discharge from the eastern block will be greater than elsewhere because of lower water levels in Big Entry Ditch as observed with low levels in Sycamore Ditch north of Block C1, and will cause more groundwater to drain north along the entire northern boundary of the eastern block, creating drier conditions.
Selection of sites for construction of new water-control structures is an important part of future management decisions. The simulation model of Eggleston and others (2018) and future modified models are intended to be tools used for evaluating the effectiveness of potential sites. The use of the responses to hydrologic controls and the distribution of these controls is critical to selection of possible sites and model simulations to evaluate the effectiveness of these sites. Because groundwater flow from the Suffolk scarp is an important water source to the swamp, ditches to which this groundwater discharges could be important candidate locations for new structures. Example ditches include the southern end of West Ditch and east-west oriented ditches such as Corapeake Ditch and Railroad Ditch, originating at the toe of the scarp. Effective structure placement, including distances of the structures from the scarp and between structures, could depend on other hydrologic controls. Simulations of the effects of the burn scar on the effectiveness of structure placement on Corapeake Ditch and ditches in the northern part of the burn scar could provide important information.
Another useful simulation could be of the northeastern quadrant of the swamp. Although it might appear counterintuitive at first, constructing a ditch having water-control structures parallel to and immediately south of Big Entry Ditch would increase the wetness of the eastern block while minimizing potential flooding of the private land north of Big Entry Ditch. Structures on this ditch could maintain high water levels to rewet the swamp, whereas low water levels in Big Entry Ditch would minimize the potential soil saturation and inundation of private land to the north.
Design of a hydrologic-monitoring network and interpretation of its data are critical to making effective management decisions. Although knowing the responses of ditches and nearby groundwater levels is important, the response in interior parts of the swamp also is important and can be quite different. The response of groundwater levels to precipitation and ditch water levels varied with distance from ditches (fig. 23) and affected water-table gradients in Block C1 (fig. 22). Additionally, the characteristics of changes in groundwater levels and gradients at similar distances from ditches can vary, as indicated by the water table in the northeastern quadrant (fig. 33) and ditch-water- and groundwater-level responses at East Ditch (fig. 37), Portsmouth Ditch (fig. 38), and Rosemary Ditch (fig. 39). Such differences depend on hydrologic controls at different scales that vary appreciably over short distances. Thus, effective decisions on placement of monitoring and research sites, variables to monitor, monitoring frequency, and data interpretation depend on knowledge of these controls and responses.
These same factors also have important implications for hydrologic, water-quality, and biotic research. The pH/specific conductance relation (fig. 40) demonstrates how differences in water chemistry are affected by water sources and flow paths, which can be critical to selecting areas, specific sites within areas, variables to monitor, and the frequency of monitoring. These then can be important factors in interpreting water sources, hydrologic processes, and biogeochemical processes. Because of extreme differences in water quality such as pH, the interaction of the hydrology, water quality, and biota are critical. A pH between 3.0 and 4.0 standard units can alter biological processes, such as nutrient uptake, decomposition of the peat, and other oxidation/reduction processes by bacteria, from those at a pH near neutral. Low pH also increases the solubility of metals such as mercury, a common concern in wetlands. Hypothetically, the reversal in the hydrologic gradient by ET to create local flow from a ditch into the swamp like that observed in the northeastern quadrant of the swamp (fig. 38) could alter such processes. If the ditch water has a higher pH than the groundwater, possibly because the ditch water originated from flow across the scarp, this flow could alter these processes and alter dissolution of metals and other processes. Such processes could unknowingly alter research results and application of results across the swamp because such effects could be localized. The presence of the high DOC concentrations and the effects on water chemistry, ion balances, and other relations also are important in evaluation and analysis of data to understand processes because poor relations are not indicative of analytical problems, but of biogeochemical processes.
Summary and Conclusions
A 200-mi-long network of ditches having adjacent spoil-pile roads constructed to support timber harvesting drains the Great Dismal Swamp, a temperate to subtropical peatland in the Coastal Plain of southeastern Virginia and northeastern North Carolina. Drainage and timber harvesting are collectively implicated in a shift from the original wetland-forest communities of Taxodium distichum/Nyssa aquatica/Nyssa sylvatica (bald cypress/tupelo/black gum), Chamaecyparis thyoides (Atlantic white cedar), and Pinus serotina (pond pine in pocosins) to more than 60 percent Acer rubrum (red maple)/gum. Since 1974, the U.S. Fish and Wildlife Service (FWS) and The North Carolina Department of Natural and Cultural Resources, Division of Parks & Recreation have managed the swamp as the Great Dismal Swamp National Wildlife Refuge (112,000 acres) and the Dismal Swamp State Park (14,432 acres), respectively. Sixty-four water-control structures constructed on the ditches are managed to control the hydrology in a manner intended to rewet the swamp and restore the resilient wetland communities of the original forest types, reduce the risk of fires, reduce land-surface subsidence, promote peat accretion, and reduce downstream flooding.
Because the 2008 South One fire re-emphasized the need for achievable hydrologic management goals and effective hydrologic management strategies, the U.S. Geological Survey in cooperation with the FWS began a series of studies in 2009 to better understand hydrologic controls and responses to these controls to facilitate implementation of improved management strategies. These studies have identified water sources, topography, the two-layered hydraulic characteristics of the peat, the absence of peat in some areas, the ditch and road network, water-control structures on the ditches, the Dismal Swamp Canal and other infrastructure, and wetland forests to be among the primary hydrologic controls. These controls collectively affect groundwater recharge, storage, water levels, flow, discharge into the ditches, discharge as evapotranspiration (ET), flow through ditches, and discharge from the swamp.
Groundwater and streams flow east from the Isle of Wight Plain, cross the Suffolk scarp, and then discharge into the swamp to combine with precipitation across the entire swamp as water sources. North-south oriented ditches closest to and parallel to the scarp (Lynn, West, Sherrill, and Weyerhaeuser Ditches) and east-west oriented ditches perpendicular to the scarp that originate at its base (Corapeake and Railroad Ditches, for example) or just east of the north-south ditches (Interior and South Ditches, for example) intercept groundwater that flows across the scarp, limiting the eastward extent of direct effects of this source. Although precipitation typically is the only water source elsewhere, ditches are local water sources to aquifers rather than discharge points in areas having certain hydrologic conditions. Ditches such as East Ditch can be year-round sources, whereas ET during the dry season causes some ditches to become seasonal, local water sources to the peat and sand aquifers.
Peat, having spatially differing thickness, underlies most of the swamp and overlies sand, silt, and clay. The greater hydraulic conductivity and specific yield of the upper peat compared to the lower peat and deeper sand make the upper peat the principle aquifer affecting the swamp. Throughout most of the swamp, groundwater discharges from the peat into the ditches where ditches directly adjoin the swamp. Because spoil-pile roads compact underlying peat, roads intervening between ditches and the swamp inhibit this discharge. When water levels in such a ditch are adequately below those of other ditches surrounding the swamp, most groundwater flows from the swamp through the upper peat and ultimately discharges through the sand to that ditch despite the low hydraulic conductivity of sediment beneath the roads. Such flow past roads to ditches demonstrates the importance of water levels in ditches and streams in controlling flow through the swamp.
The quality and chemistry of the water reflects the effects of the peat. The pH of the water ranged from 3.0 to 6.4 standard units with the low pH resulting from organic acids derived from the peat. Low pH can affect various processes, including nutrient uptake, bacterial decomposition, and solubility of metals. Dissolved organic carbon (DOC) concentrations, derived from the peat, are among the highest reported globally, ranging from 55 to 195 milligrams per liter. A relation between pH and specific conductance of the water helps identify water sources, the mixing of these sources, flow paths of that water, and the chemical evolution of the water. This water chemistry can have important implications for future monitoring and research.
Although the refuge-wide direction of flow through the aquifers and ditches is east toward the Dismal Swamp Canal where much of the water ultimately discharges, water also flows in intermediate directions toward and discharges into Lake Drummond in the center of the swamp, Shingle Creek and Deep Creek to the north, and the Pasquotank River to the south. Because of groundwater that flows across the Suffolk scarp and other controls affecting drainage, the northwestern quadrant is the wettest part of the swamp. A major discharge pathway across the entire swamp is ET of groundwater through the forests, as reflected in diurnal fluctuations in groundwater levels during the growing season.
Water-control structures on the ditches (most of which have adjustable-height weirs) and additional infrastructure that controls flow from Lake Drummond through the Feeder Ditch to the Dismal Swamp Canal and from the canal through locks and spillways to Deep Creek to the north and the Pasquotank River to the south control flow from the swamp. Because hydrologic controls and responses vary spatially and temporally, knowledge of these controls and responses is important to management of the swamp by use of these structures and infrastructure. Because the upper peat stores and transmits larger amounts of water than the lower peat and sand, maintaining water levels in the upper peat becomes critical to achieving management goals. When the water table is in the lower peat or sand, less water is available so that water levels decline rapidly. Consequently, keeping the water table within the upper peat will make water more readily available to the forests, better support wetland forest types, and keep the swamp from rapidly drying. Because recharge by precipitation is the only source of groundwater to much of the swamp, raising the level of weirs on structures after water has drained from the swamp will not raise groundwater levels in the swamp, except near ditches. Raising weir levels before water drains from the swamp provides the greatest opportunity to maintain wet conditions during periods of little precipitation. Because ditches having control structures create a different wetness distribution than existed before construction of ditches, the distribution of reestablished, wetland-forest types will differ from the original distribution when structures are managed effectively.
Selected References
Atkinson, R.B., DeBerry, J.W., Loomis, D.T., Crawford, E.R., Belcher, R.T., Brown, D.A., and Perry, J.E., 2003, Water tables in Atlantic white cedar swamps—Implications for restoration, in Atlantic white cedar restoration ecology and management, Proceedings of a symposium: Newport News, Va., Christopher Newport University, p. 137–150.
Byrd, W., of Westover, 1841, The Westover manuscripts containing the history of the dividing line between Virginia and North Carolina—A journey to the land of Eden, A.D. 1733, and a progress to the mines: Petersburg, Va., Edmund and Julian C. Ruffin, 143 p., accessed November 10, 2015, at https://docsouth.unc.edu/nc/byrd/byrd.html.
Drexler, J.Z., Fuller, C.C., Orlando, J., Salas, A., Wurster, F.C., and Duberstein, J.A., 2017, Estimation and uncertainty of recent carbon accumulation and vertical accretion in drained and undrained forested peatlands of the southeastern USA: Journal of Geophysical Research—Biogeosciences, p. 122, accessed February 21, 2018, at https://doi.org/10.1002/2017JG003950.
Duberstein, J.A., Hawbaker, T.J., Speiran, G.K., Zhu, Z., Cormier, N., and Wurster, F.C., 2016, Quantifying aboveground biomass and its rate of change in Great Dismal Swamp, Virginia, USA: Proceedings of the 15th International Peat Congress 2016, Peatlands in harmony–Agriculture, industry and nature: Sarawak, Malaysia, International Peatland Society, p. 681–685.
Eggleston, J., Decker, J., Finkelstein, J., Wurster, F.C., Misut, P.E., Sturtevant, L., and Speiran, G.K., 2018, Hydrologic conditions and simulation of groundwater and surface water in the Great Dismal Swamp of Virginia and North Carolina: U.S. Geological Survey Scientific Investigations Report 2018–5056, 67 p.
Eggleston, J., and Pope, J.P., 2013, Land subsidence and relative sea-level rise in the southern Chesapeake Bay region: U.S. Geological Survey Circular 1392, 30 p., accessed March 5, 2016, at https://pubs.usgs.gov/circ/1392/pdf/circ1392.pdf.
Gammon, P., 1977, Vegetative communities of the Great Dismal Swamp—Identification and mapping with seasonal color infrared photographs, in Proceedings of the sixth biennial workshop—Arial color photography in the plant sciences and related fields: Fort Collins, Colo., Colorado State University, p. 111–131.
Hawbaker, T.J., Reddy, A.D., Zhu, Z., Wurster, F., and Duberstein, J., 2016, Quantifying above and belowground carbon loss following wildfire in peatlands using repeated LiDAR measurements: Proceedings of the 15th International Peat Congress 2016, Peatlands in harmony–Agriculture, industry and nature: Sarawak, Malaysia, International Peatland Society, p. 676–680.
Lunt, P., Allott, T., Anderson, P., Buckler, M., Coupar, A., Jones, P., Labadz, J., and Worrall, P., 2010, Peatland restoration: IUCN UK Peatland Programme Commission of Inquiry on Peatlands, accessed October 4, 2018, at https://www.iucn-uk-peatlandprogramme.org/publications/commission-inquiry/work-commission/peatland-restoration.
Natural Resources Conservation Service, 2012, Field book for describing and sampling soils, version 3.0: U.S. Department of Agriculture, [variously paged], accessed February 24, 2018, at https://www.nrcs.usda.gov/Internet/FSE_DOCUMENTS/nrcs142p2_052523.pdf.
Oaks, R.Q., Jr., and Whitehead, D.R., 1974, Geologic setting and origin of the Dismal Swamp, southeastern Virginia and northeastern North Carolina, in Kirk, P.W., Jr., ed., The Great Dismal Swamp: Proceedings of a symposium sponsored by Old Dominion University and United Virginia Bank-Seaboard Nations: Charlottesville, Va., University Press of Virginia, p. 1–24.
Page, S., Hoscilo, A., Wosten, H., Jauhiainen, J., Silvius, M., Rieley, J., Ritzema, H., Tansey, K., Graham, L., Vasander, H., and Limin, S., 2009, Restoration ecology of lowland tropical peatlands in Southeast Asia—Current knowledge and future research directions: Ecosystems (New York, N.Y.), v. 12, no. 6, p. 888–905.
Petrone, R.M., DeVito, K.J., Silins, U., Mendoza, C., Brown, S.C., Kaufman, S.C., and Price, J.S., 2008, Transient peat properties in two pond-peatland complexes in the sub-humid western Boreal Plain, Canada: Mires and Peat, v. 3, article 05, p. 1–13, accessed May 20, 2012, at http://mires-and-peat.net/pages/volumes.php#Vol3.
Pindilli, E., Sleeter, R., Hogan, D., 2018, Estimating the societal benefits of carbon dioxide sequestration through peatland restoration: Ecological Economics, v. 154, p. 145–155, accessed December 3, 2018, at https://doi.org/10.1016/j.ecolecon.2018.08.002.
Shaler, N.S., 1890, General account of fresh-water morasses of the United States with a description of the Dismal Swamp District of Virginia and North Carolina, in Powell, J.W., 1890, Tenth annual report of the Director, 1888–1889: Washington, D.C., Government Printing Office, U.S. Geological Survey, p. 255–339.
Speiran, G.K., and Wurster, F.C., 2016, Spatial differences in hydrologic characteristics and water chemistry of a temperate Coastal Plain peatland—The Great Dismal Swamp: Proceedings of the 15th International Peat Congress 2016, Peatlands in harmony – Agriculture, industry and nature: Sarawak, Malaysia, International Peatland Society, p. 686–690.
Turetsky, M.R., Donahue, W.F., and Benscoter, B.W., 2011, Experimental drying intensifies burning and carbon loss in a northern peatland: Nature Communications, v. 2, article 514, 5 p., accessed October 12, 2016, at https://www.nature.com/articles/ncomms1523.
U.S. Fish and Wildlife Service, 2006, Great Dismal Swamp National Wildlife Refuge and Nansemond National Wildlife Refuge, Final Comprehensive Conservation Plan: U.S. Fish and Wildlife Service, 285 p., accessed December 3, 2012, at https://www.fws.gov/uploadedFiles/Region_5/NWRS/South_Zone/Great_Dismal_Swamp_Complex/Great_Dismal_Swamp/FinalCCP_GDS.pdf.
U.S. Geological Survey, 2012, The national field manual for the collection of water-quality data (version 7): U.S. Geological Survey Techniques and Method, book 9, chaps. A1–A9, accessed April 5, 2013, at https://water.usgs.gov/owq/FieldManual/.
Whitehead, D.R., 1965, Palynology and Pleistocene phytogeography of unglaciated eastern North America, in Wright, H.E., and Frey, D.G., eds., The Quaternary of the United States, A review volume the Congress of the International Association for Quaternary Research: Princeton, N.J., Princeton University Press, p. 417–432.
Appendix 1. Well Construction Methods and Nomenclature
Conversion Factors
U.S. customary units to International System of Units
Temperature in degrees Celsius (°C) may be converted to degrees Fahrenheit (°F) as follows:
°F = (1.8 × °C) + 32.
Temperature in degrees Fahrenheit (°F) may be converted to degrees Celsius (°C) as follows:
°C = (°F – 32) / 1.8.
Datum
Vertical coordinate information is referenced to the North American Vertical Datum of 1988 (NAVD 88).
Horizontal coordinate information is referenced to North American Datum of 1983 (NAD 83).
Altitude, as used in this report, refers to the distance above the vertical datum.
Supplemental Information
Specific conductance is given in microsiemens per centimeter at 25 degrees Celsius (µS/cm at 25 °C).
Concentrations of chemical constituents in water are given in either milligrams per liter (mg/L) or micrograms per liter (µg/L).
Use of liter (L) as a special name for cubic decimeter (dm3) is restricted to the measurement of liquids and gases. No prefix other than milli should be used with liter.
Abbreviations
AICW
Atlantic Intracoastal Waterway
DCP
Data-collection platform
DOC
Dissolved organic carbon
DSCD
Dismal Swamp Canal Datum
E
East
ET
Evapotranspiration
FWS
U.S. Fish and Wildlife Service
Lidar
Light Detection and Ranging
N
North
NE
Northeast
NW
Northwest
NWIS
National Water Information System
NWQL
National Water Quality Laboratory
PET
Potential evapotranspiration
PVC
Polyvinyl chloride
S
South
SAT
Satlink
SAT2
Satlink2
SE
Southeast
SET
Surface-elevation table
SW
Southwest
USACE
U.S. Army Corps of Engineers
USGS
U.S. Geological Survey
W
West
For more information, contact
Center Director, Virginia and West Virginia Water Science Center
U.S. Geological Survey
1730 East Parham Road, Richmond, VA 23228
Publishing support provided by the West Trenton Publishing Service Center.
Disclaimers
Any use of trade, firm, or product names is for descriptive purposes only and does not imply endorsement by the U.S. Government.
Although this information product, for the most part, is in the public domain, it also may contain copyrighted materials as noted in the text. Permission to reproduce copyrighted items must be secured from the copyright owner.
Suggested Citation
Speiran, G.K., and Wurster, F.C., 2021, Hydrology and water quality of the Great Dismal Swamp, Virginia and North Carolina, and implications for hydrologic-management goals and strategies: U.S. Geological Survey Scientific Investigations Report 2020-5100, 104 p., https://doi.org/10.3133/sir20205100.
ISSN: 2328-0328 (online)
Study Area
| Publication type | Report |
|---|---|
| Publication Subtype | USGS Numbered Series |
| Title | Hydrology and water quality of the Great Dismal Swamp, Virginia and North Carolina, and implications for hydrologic-management goals and strategies |
| Series title | Scientific Investigations Report |
| Series number | 2020-5100 |
| DOI | 10.3133/sir20205100 |
| Publication Date | October 21, 2021 |
| Year Published | 2021 |
| Language | English |
| Publisher | U.S. Geological Survey |
| Publisher location | Reston, VA |
| Contributing office(s) | Virginia and West Virginia Water Science Center |
| Description | xii, 104 p. |
| Country | United States |
| State | North Carolina, Virginia |
| Other Geospatial | Great Dismal Swamp |
| Online Only (Y/N) | Y |
| Additional Online Files (Y/N) | N |