

Using Microbial Source Tracking To Identify Fecal Contamination Sources in an Embayment in Hempstead Harbor on Long Island, New York
Links
- Document: Report (2.04 MB pdf) , HTML , XML
- Related Work: Scientific Investigations Report 2021–5033 - Overview and methodology for a study to identify fecal contamination sources using microbial source tracking in seven embayments on Long Island, New York
- Data Release: USGS National Water Information System database - USGS water data for the nation
- Download citation as: RIS | Dublin Core
Acknowledgments
The authors wish to thank the staff of the Bureau of Shellfisheries at the New York State Department of Environmental Conservation for their field efforts. The authors also wish to acknowledge the local guidance of the Coalition to Save Hempstead Harbor.
Executive Summary
The U.S. Geological Survey worked collaboratively with the New York State Department of Environmental Conservation (DEC) to assess the potential sources of fecal contamination entering Hempstead Harbor, an embayment on the northern shore of Nassau County, Long Island, New York, that exchanges tidal flow with Long Island Sound, from June 2018 to July 2019. Water samples are routinely collected by the DEC in the harbor and analyzed for fecal coliform bacteria, an indicator of fecal contamination, to determine the need for closure of shellfish beds for harvest and consumption. Fecal indicator bacteria, such as fecal coliform, signify the potential for pathogenic (disease-causing) bacteria to be present.
Indicator bacteria alone cannot determine the biological or geographical sources of contamination. Microbial source tracking (MST) is a method used to determine these sources of contamination. Microbial source tracking laboratory techniques can ascertain whether genetic material obtained from Bacteroides or Helicobacter bacteria in water or sediment is consistent with humans, canines (dogs), ruminants (deer, sheep), or waterfowl. Bacteroides and Helicobacter are genera of bacteria found in the gut of most warm-blooded animals. These techniques can also quantify the concentrations of genetic markers found.
Information such as the location, weather and season, surrounding land use, and additional water-quality data for the location where a sample was collected help determine the geographical source and conveyance of land-based water to the embayment. The presence of genetic material and FC in samples collected at the same time is important to show that the fecal coliform is likely from the host source detected. It is possible for waters with waste infiltration to have genetic material present but no fecal indicators, such as disinfected water from a wastewater treatment plant or from groundwater that has passed through a sandy aquifer.
Water samples were collected in the summer and winter seasons. In each of the two seasons, one sample was collected in dry weather, and one, after substantial rainfall. Groundwater and sediment samples were also collected throughout the study. Surface-water source sites sampled include Glen Cove Creek, the culvert at Glenwood Road, an outfall at the end of Skillman Street, a newly constructed spillway at the end of Skillman Street, the culvert at Tappen Beach, and the pond culvert at the southern end of Hempstead Harbor.
Human, canine, and waterfowl fecal contributions to Hempstead Harbor were frequently detected across the landscape. Among the potential sources of fecal contaminated water contributing to Hempstead Harbor—groundwater, stormwater, marinas (boats), and the Glen Cove Water Pollution Control Plant—stormwater from municipal separate storm sewer system conveyances were found to be the most likely transport mechanism of fecal contamination.
The most substantial source of fecal contamination to Hempstead Harbor was found to be discharge from sites with constant flow, mainly municipal separate storm sewer systems throughout the harbor, in particular the outfall at Skillman Street and the culvert at Glenwood Road sites under dry- and wet-weather conditions. Contributions of fecal contamination did not appear to be attributable to the marina in Glen Cove Creek during the summer sampling; however, additional samples from within the marina throughout the year are needed to confirm this finding. Although the MST and other water-quality analyses indicated influence from septic systems, groundwater has not been shown to contribute to fecal coliform loads. One of the two groundwater samples along the shoreline of Hempstead Harbor where MST analyses showed evidence of human waste did not have corresponding fecal coliform detections, indicating limited transport of bacteria in the subsurface groundwater through the sandy aquifer material, which is consistent with results throughout Long Island. Sediment sampled adjacent to the culvert at Glenwood Road site contained elevated concentrations of fecal coliform, indicating that the streambed can act as a source during resuspension events, such as an ebbing (outgoing) tide, storm-driven waves (particularly at low tide), and boat wakes.
A classification scheme was developed that considered conditions such as high fecal coliform concentrations (particularly in dry-weather samples) and contributions from human and canine waste based on detection of MST markers. The class of sites were assessed to assist stakeholders and resource managers in prioritizing which source sites are consistently contributing fecal coliforms to Hempstead Harbor throughout the year. The sites at the culvert at Glenwood Road and the outfall and the spillway at Skillman Street were classified as locations that contribute substantial fecal contamination to Hempstead Harbor.
Introduction
To better understand fecal contamination sources in coastal embayments of Long Island, microbial source tracking (MST) and fecal coliform bacteria (FC) data were collected from seven embayments from June 2018 to July 2019 (U.S. Geological Survey, 2020a). The objective of this research is to identify the different pathogen sources, both the host organism (such as human, mammals, or birds) and geographic origin (such as urban and storm runoff and submarine groundwater discharge), to embayments with fecal contamination. The embayments selected represent a mix of sewered and unsewered areas, differing levels of impervious land cover, varying population density, and a variety of land-use types so as to transfer what is learned to other areas beyond the seven studied. In total, 353 samples were collected in the 7 embayments on Long Island. These were primarily surface-water samples but also include 17 groundwater, 11 sediment, 2 sewage influent, and 8 fecal samples.
The presence of fecal contamination in Hempstead Harbor and resulting hazards posed to marine resources and human health are of increasing concern. Recreational uses of the harbor, including shellfishing and public bathing, are frequently restricted because of high counts of FC, which are used as surrogate indicators for when pathogens may be present. Pathogen loads can be influenced by watershed land-use, proximity to point sources such as municipal separate storm sewer systems (MS4s), as well as tidal exchange/circulation transporting pathogens from outside the study area (Gao and others, 2015), sediment resuspension (O’Mullan and others, 2019), and human recreation (including boating). Wastewater treatment plants can also act as point sources (via effluent discharge) for pathogens when standard operations and procedures for disinfection are compromised. Nonpoint sources may include shallow groundwater discharge because many of the areas surrounding Hempstead Harbor still rely on onsite wastewater disposal systems (OWDS), such as cesspools and septic systems. Through routine FC monitoring, the DEC and nonprofit environmental groups such as the Coalition to Save Hempstead Harbor have identified fecal contamination as a concern in Hempstead Harbor. Microbial source tracking techniques are necessary to determine the dominant source (human, canine, ruminant, waterfowl) and geographic origin of FC, using land use, topography, and hydrology to establish a framework. The success of future pathogen-control measures may be measured by the decline in FC concentrations.
Site Description
Hempstead Harbor is an estuarine embayment of Long Island Sound in Nassau County on Long Island, New York (fig. 1). It is bordered by the township of North Hempstead to the west and populated areas south of Bar Beach, by Oyster Bay to the east, and by the city of Glen Cove to the northeast. Much of the shoreline is unsewered and served by cesspools or septic tanks. Small sections on the western shore are served by the Port Washington Sewer District. The city of Glen Cove on the northeastern side of the harbor is served by the Glen Cove Water Pollution Control Plant operated by Nassau County, and the village of Roslyn south of the harbor is serviced by the Bay Park or Cedar Creek municipal sewage treatment plants on the southern shore of Long Island.
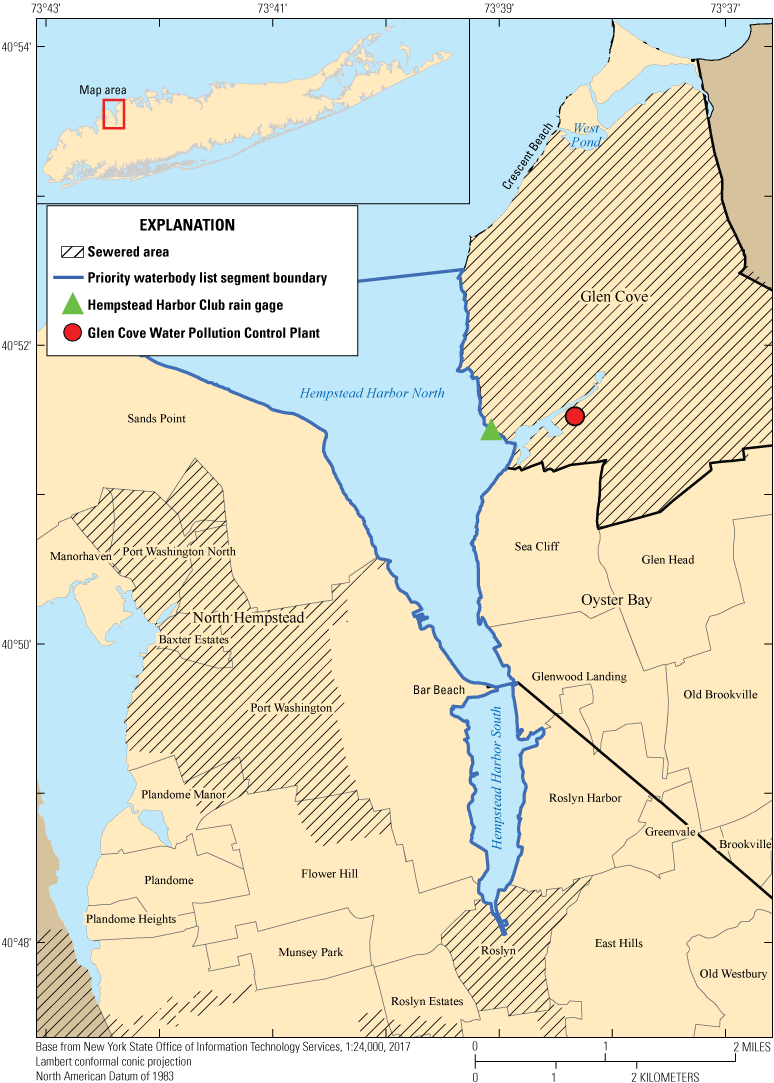
Map showing the extent of the two priority waterbody list segments in Hempstead Harbor on Long Island, New York, as designated by the New York State Department of Environmental Conservation (2020); the sewered area surrounding Hempstead Harbor, the Glen Cove Water Pollution Control Plant, and the rain gage at the Hempstead Harbor Club are indicated. Areas that are not sewered are served by cesspools or septic tanks.
For regulatory purposes, the DEC distinguishes between Hempstead Harbor North (the area from Bar Beach north until it joins Long Island Sound) and Hempstead Harbor South (the area from Bar Beach south to Old Northern Boulevard). Land use in the area surrounding the harbor is a mix of residential, commercial, and industrial areas. Residential areas near the outer harbor, particularly on the western side, have low population density, whereas areas in Glen Cove and Sea Cliff have high population density. Roughly 50 percent of the land cover of the watershed is impervious.
Potential contributions of contaminated water to the harbor include storm runoff, groundwater inputs, and pond drainage. Illicit boat discharges and effluent from the Glen Cove Water Pollution Control Plant are also possible contributors of fecal contamination to the harbor. Moderate to steeply sloping bluffs along the edges of Hempstead Harbor are typical of the northern shore of Long Island and allow for rapid delivery of stormwater through direct runoff or storm drains. The sites where surface-water samples were collected (U.S. Geological Survey, 2020a) for the Hempstead Harbor study (fig. 2; table 1.1) are as follows:
-
• The sampling site for Glen Cove Creek is at the end of a marina dock downstream from the Glen Cove Water Pollution Control Plant outfall. There are several stormwater outfalls along both sides of the creek; the outfall directly across the marina site flows during dry weather conditions. There was construction along the shore within the city of Glen Cove and inland when samples were collected.
-
• The sampling site at the culvert at Tappen Beach drains Scudders Pond and possibly connects several stormwater drains from the adjacent roadway. The culvert discharges directly to the beach and water drains down into the harbor continuously.
-
• The sampling site at the culvert at Glenwood Road is a 4- by 5-foot storm drain that directs stormwater and groundwater in the harbor and flows continuously, regardless of season or weather conditions.
-
• The sampling site at the outfall at Skillman Street directs upland surface waters and some groundwater into the harbor. This outfall flows continuously, regardless of season or weather conditions.
-
• The sampling site at the spillway at Skillman Street has a newly constructed stormwater diversion outfall for the adjacent shoreline park and possibly other areas upland that were under construction at the time samples were collected.
-
• The sampling site at the pond culvert at Hempstead Harbor South drains Roslyn Pond and an adjacent pond as well as stormwater from the adjacent roadway. The ponds are home to migratory birds and are partially surrounded by park area with dog walking paths and direct water access.
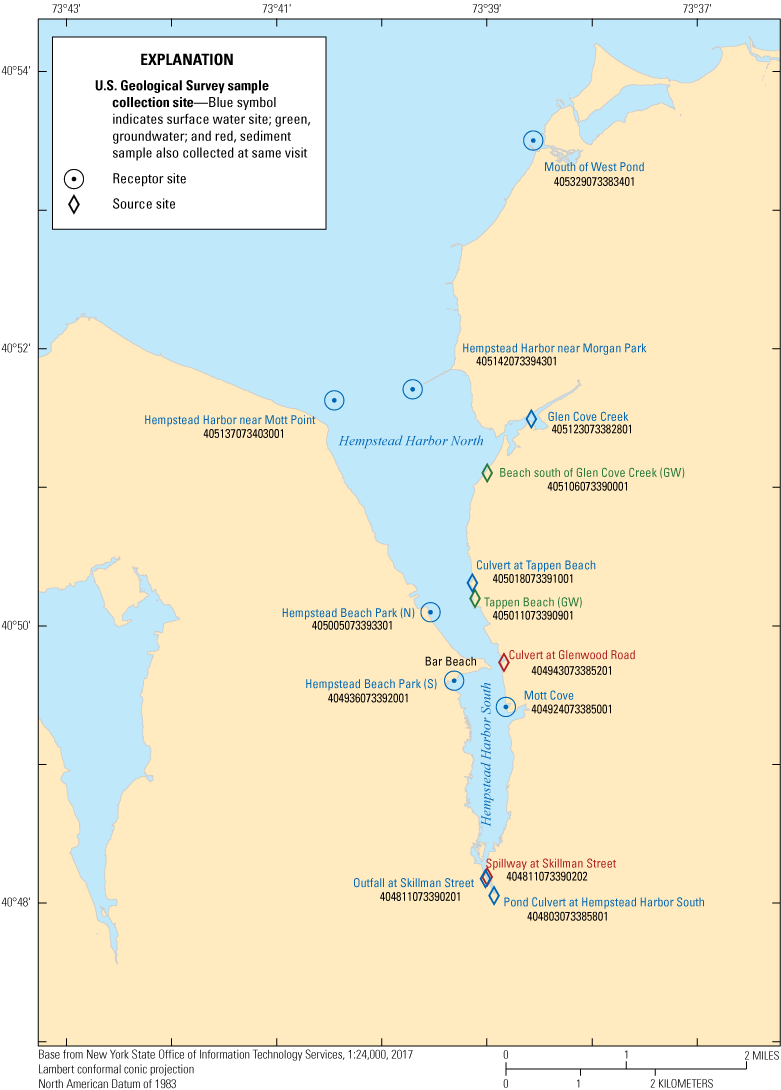
Map showing the locations where surface-water and groundwater samples were collected for microbial source tracking in Hempstead Harbor on Long Island, New York. Data are from U.S. Geological Survey (2020a). Surface-water sites (blue), groundwater sites (green), and surface-water sites where sediment samples were also collected during one visit (red).
Approach and Methods
Sampling Methods
Sampling and laboratory methods used for this study are detailed in Tagliaferri and others (2021). Groundwater samples in Hempstead Harbor were collected in November 2018. Wet conditions were defined as more than 0.25 inch of precipitation in 24 hours or 0.50 inch in 48 hours. Dry conditions were defined as less than 0.25 inch of precipitation in 72 hours. Rainfall totaled 0.53 inch on June 4 and 5, 2018, designating samples collected on June 6, 2018, as summer wet samples (more than 0.50 inch within 48 hours). Winter wet samples were also collected on April 15 and 16, 2019, with 0.49 inch of precipitation falling on April 13, 0.01 inch falling on April 14, and 0.61 inch falling on April 15, 2019. Rainfall values were obtained from the Hempstead Harbor Club rain gage (fig. 1) identified as site number KNYGLENC2 (Weather Underground, 2020).
From June 2018 to April 2019, 14 sites were sampled within Hempstead Harbor, yielding 41 surface-water samples (2 of which were replicates), 3 groundwater samples (1 of which was a replicate), and 2 sediment samples collected concurrently with surface-water samples at 2 sites (fig. 2). Of the surface-water sites, six were considered to be source sites (waters flowing directly into Hempstead Harbor from the land through culverts and groundwater discharge), and six were considered to be receptor sites (the harbor itself). Eighteen surface-water samples were collected under wet conditions, and 21, under dry conditions; 15 surface-water samples were collected in the summer, and 24, in the winter.
Laboratory Methods
Laboratory methods used for this study are detailed in Fisher and others (2020). Samples for fecal coliforms were analyzed at Suffolk County Department of Health Services Public Environmental Health Laboratory (PEHL). Additional information was either observed or compiled to facilitate interpretation of data. Precipitation measurements from the Hempstead Harbor Club rain gage, identified as site number KNYGLENC2 (Weather Underground, 2020), were used to determine dry and wet weather conditions. Quality assurance for samples collected at site KNYGLENC2 is unavailable, and values were not used in any quantitative analysis. Relative tide stage as noted by USGS field personnel and verified based on available tidal predictions (National Oceanic and Atmospheric Administration, undated), was documented along with the sample information in the National Water Information System (NWIS; U.S. Geological Survey, 2020a) database. Land-cover and sewer district geographic information system (GIS) coverages (Nassau County, 2015; Suffolk County, 2020; U.S. Geological Survey, 2020b) were used for data interpretation. These data were used to increase confidence in the geographical source of the water and in the likely transport mechanisms of fecal contamination to the Hempstead Harbor embayment.
Results
Results of MST and FC were assessed based on concentrations, presence or absence, and relative abundance of host markers with respect to surface-water source and receptor sites. Differences in MST markers and FC concentrations were also compared seasonally and conditionally (that is, wet or dry), with dry-weather discharges with high FC concentrations from MS4 source sites being of particular concern. Relations between land-use, population density, percent sewerage, and percent impervious land cover were also examined with respect to MST marker presence and abundance and FC concentrations to look for potential correlations on a local scale.
Microbial Source Tracking
Throughout Hempstead Harbor, human (HF183) and canine Bacteroides (BacCan) markers were detected in roughly half of the surface-water samples from source and receptor sites. Ruminant Bacteroides markers (Rum2Bac) were detected in only two samples—one source and one receptor sample, each in dry weather and during the summer months—suggesting little contribution from the resident deer population. All but 1 of the 16 detections for the waterfowl Helicobacter marker (GFD) were in the winter months, suggesting a seasonal flux in avian fecal contamination. For HF183, a greater percentage of samples collected during dry weather (53 percent) had detections above the reporting limit compared with samples collected during wet weather (46 percent; table 1). This may indicate a constant source of fecal contamination entering Hempstead Harbor that is unrelated to weather events. Of the BacCan results detected above the reporting limit, 32 percent were in winter samples, and 70 percent were in summer samples (table 1), which may reflect the use of public space for dog walking in warmer months. As with HF183, BacCan detections during wet and dry weather were similar (38 percent and 47 percent, respectively), suggesting canine influence is unrelated to weather events.
Table 1.
Summary of microbial source tracking results in surface-water samples for sites sampled in Hempstead Harbor on Long Island, New York.[Ratios are number of samples with detections greater than reporting limit per total number of samples. Reporting limits vary due to analytical processes and matrix interferences]
Host Specific Markers
Reporting limits for the three predominant MST markers (HF183, BacCan, and GFD) detected in Hempstead Harbor varied slightly for samples because of analytical processes, such as dilutions required because of matrix interferences. Understanding occurrence of the predominant MST markers in Hempstead Harbor can help prioritize locations for additional investigation and infrastructure improvement and provide a baseline for host contributions when prioritizing sites of concern for assessing FC and after total maximum daily load implementation.
HF183
The HF183 human Bacteroides marker was detected at least once in surface-water samples at each receptor site, which is indicative of the continuous inputs from potential inland sources (including the Glen Cove Water Pollution Control Plant and illicit connections to the stormwater drain system). Concentrations in samples collected from the same site were generally higher in dry weather than wet weather (fig. 3). In general, concentrations of HF183 were lower in receptor samples than in source site samples, except for the Mouth of West Pond site. Crescent Beach, near West Pond, has been shown to contain high concentrations of bacteria with failing septic implicated (New York State Department of Environmental Conservation, undated); therefore, discharge from the Mouth of West Pond site would be more representative of a source to the DEC designated shellfish area of Hempstead Harbor.
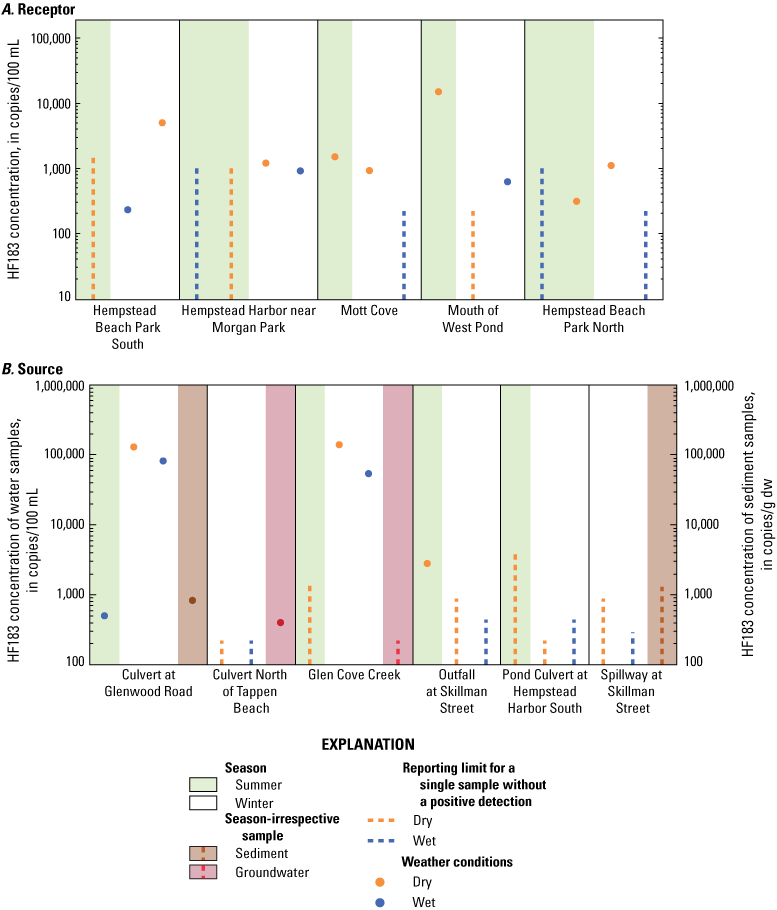
Graphs showing concentrations of the human Bacteroides (HF183) marker, in copies per 100 milliliters, from A, receptor and B, source sites under various surface-water sample conditions at Hempstead Harbor, New York. Dashed lines indicate reporting limit for a single sample without a positive detection. Green and white shading indicates samples that were collected in summer and winter seasons, respectively; sediment and groundwater samples were collected irrespective of season and are indicated with brown and red shading, respectively.
Samples from three of the six surface-water source sites in Hempstead Harbor had detections of HF183 above the reporting limit. Samples collected in winter at the Culvert at Glenwood Road site and at the end of the marina dock in Glen Cove Creek had concentrations of HF183 that were orders of magnitude higher than most receptor samples. Concentrations of HF183 in the two samples collected at the Culvert at Glenwood Road site during winter months were 130,000 and 82,000 copies/100 mL compared with 500 copies/100 mL in the summer wet sample and corresponded with fecal coliform concentrations of 1,700 and 9,200 MPN/100 mL in the winter and 800 MPN/100 mL in the summer. The continuous flow observed at the Culvert at Glenwood Road source site, regardless of weather conditions, is suggestive of groundwater infiltration and discharges from illicit septic connections to the MS4 as observed in nearby Alley Creek in Queens, New York (New York City Parks Natural Resources Group, 2015).
Samples from Glen Cove Creek also contained high concentrations of HF183 in both wet (54,000 copies/100 mL) and dry (140,000 copies/100 mL) winter samples. Concentrations of fecal coliform were 9,200 and 170 MPN/100 mL in wet and dry winter samples, respectively (table 1.2; U.S. Geological Survey, 2020a). Given the timing (winter) of sample collection, it is unlikely that illicit boat discharges were responsible for the HF183 detections in these samples because most of the boats had been removed from the dock slips several months earlier. There were no HF183 markers detected in samples collected at the end of the marina dock in Glen Cove Creek during the summer.
BacCan
The canine Bacteroides marker (BacCan) was detected at least once at five of the six source sites and at least once at four of the five receptor sites with available MST data (fig. 4), likely owing to runoff contributions from pet waste and to mixing from the Glen Cove Water Pollution Control Plant effluent. Detections in receptor samples were generally from dry-weather samples, whereas detections in source samples were a more even mix of wet- and dry-weather samples.
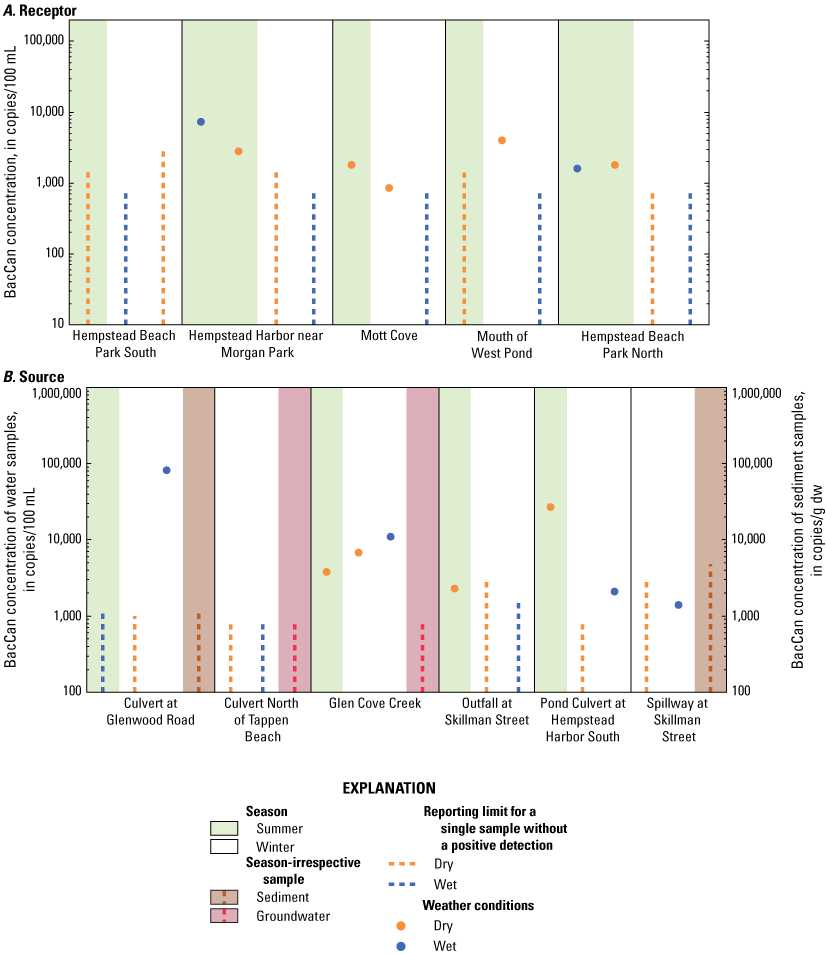
Graphs showing concentrations of the canine Bacteroides (BacCan) marker, in copies per 100 milliliters, from A, receptor and B, source sites under various surface-water sample conditions at Hempstead Harbor, New York. Dashed lines indicate reporting limit for a single sample without a positive detection. Green and white shading indicates samples that were collected in summer and winter seasons, respectively; sediment and groundwater samples were collected irrespective of season and are indicated with brown and red shading, respectively.
Concentrations of BacCan were highest at the Culvert at Glenwood Road site (82,000 copies/100 mL) during wet weather in the winter season and coincided with high concentrations of HF183 (82,000 copies/100 mL) detected in the same sample. All three samples from Glen Cove Creek had concentrations above the reporting limit for BacCan, reflecting the multiple inputs to the creek. Detections of the BacCan marker in source samples from the Pond Culvert at Hempstead Harbor South may reflect the greater number of sidewalks and the dog park adjacent to the shore.
Fecal coliform concentrations in samples from the Outfall at Skillman Street site were consistently high, particularly during dry weather, and correspond with elevated BacCan concentrations. Fecal coliform concentrations in samples from the Pond Culvert at Hempstead Harbor South site (which discharges water from Roslyn Pond) were higher in the wet-weather sample that had low BacCan concentrations. This is possibly a result of dilution by stormwater from connected storm drains carrying greater fecal coliform loads; however, more samples are required to make this conclusion.
GFD
The waterfowl Helicobacter (GFD) marker was detected at least once at five out of the six source sites and at least once at four out of the five receptor sites with available MST data, primarily in the winter, with only one detection during the summer months at the Mouth of West Pond site (fig. 5). No GFD markers were detected in surface-water samples collected at the Hempstead Harbor near Morgan Park site or at the Culvert at Glenwood Road site. Further, the only host-specific marker present in the two samples collected from the Culvert at Tappen Beach site was GFD, despite Scudders Pond (which discharges to Hempstead Harbor through this culvert) being surrounded by homes with OWDS.
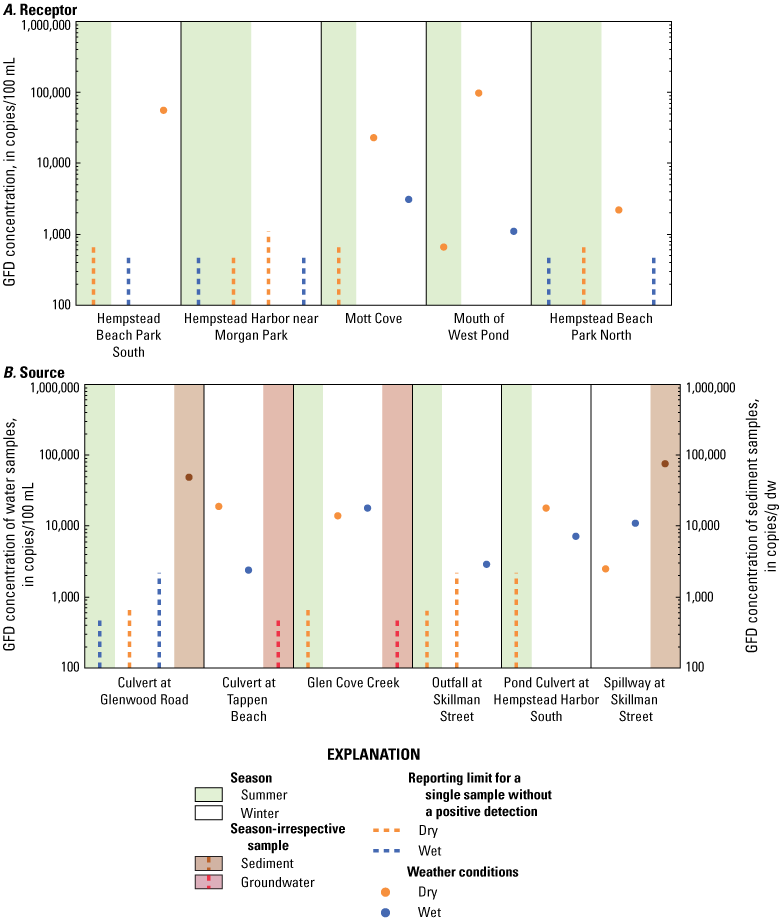
Graphs showing concentrations of the waterfowl Helicobacter (GFD) marker, in copies per 100 milliliters, from A, receptor and B, source sites under various surface-water sample conditions at Hempstead Harbor, New York. Dashed lines indicate reporting limit for a single sample without a positive detection. Green and white shading indicates samples that were collected in summer and winter seasons, respectively; sediment and groundwater samples were collected irrespective of season and are indicated with brown and red shading, respectively.
In general, receptor samples with detections of the GFD marker corresponded with low fecal coliform concentrations (table 1.2; U.S. Geological Survey, 2020a) relative to detections for HF183 (fig. 3) and BacCan (fig. 4). This was also the case with source samples and is particularly noticeable in samples with no other host-specific marker present. For example, fecal coliform and GFD concentrations in the dry sample from the Culvert at Tappen Beach site were less than 18 MPN/100 mL and 19,000 copies/100 mL, respectively, and in the dry sample from the Spillway at Skillman Street site were less than 18 MPN/100 mL and 2,500 copies/100 mL, respectively. An exception is a wet weather sample at the Outfall at Skillman Street site that had a fecal coliform concentration of 490 MPN/100 mL and a GFD concentration of 2,900 copies/100 mL.
Fecal Coliform Bacteria
Concentrations of fecal coliform in samples from surface-water source sites ranged from below the reporting limit in 12 percent of samples to greater than 16,000 MPN/100 mL (the maximum reporting limit for the dilution protocol) in two samples, one from the Outfall at Skillman Street site (under dry-weather conditions) and the other from Spillway at Skillman Street site (under wet-weather conditions). Concentrations for samples collected at the receptor sites ranged from less than the reporting limit in 41 percent of samples to 300 MPN/100 mL in a single sample at the Hempstead Beach Park North site under wet-weather conditions (table 1.2; U.S. Geological Survey, 2020a). Only three of the receptor samples, the sample from the Hempstead Beach Park North site, one at the Mott Cove site (140 MPN/100 mL), and one at the Mouth of West Pond site (61 MPN/100 mL), were above 49 MPN/100 mL, the 90-percentile concentration determined by the DEC for Hempstead Harbor as part of the National Shellfish Sanitation Program closure criteria (U.S. Food and Drug Administration, 2019). The two sites (Outfall at Skillman Street and Spillway at Skillman Street) with the highest fecal coliform concentrations (greater than 16,000 MPN/100 mL) did not have the highest concentration or highest frequency of detection for any of the Bacteroides and Helicobacter markers.
The relation between fecal coliform and marker detection is not straightforward. Fecal coliform and specific host-associated markers may decay at different rates and be present in different abundances. Host-associated markers were shown to decay more rapidly than FC in (Rogers and others, 2011; Drozd and others, 2013). In general, high fecal coliform concentrations also did not relate to weather condition or season.
Isotopes
Isotopes of nitrogen (δ15N) and oxygen (δ18O) in nitrate in samples from source sites indicated instances of contributions from wastewater-affected groundwater being diluted during wet weather (fig. 6). Most source samples exhibited signatures of groundwater influenced by anthropogenic sources (Burns and others, 2009). Of the three samples collected at the Culvert at Glenwood Road site, results of isotope dilution were mixed. In the summer wet weather sample, HF183 was relatively low and corresponded with the lowest observed fecal coliform concentration (800 MPN/100 mL) and the highest observed nitrate plus nitrite concentration (8.12 mg/L as N; δ18O = 1.60 ppt); whereas, in winter wet weather samples, nitrate plus nitrite concentration was lower and diluted (2.55 mg/L as N; δ18O = 4.19 ppt) by stormwater that carried higher fecal coliform concentrations (9,200 MPN/100 mL; table 1.2; U.S. Geological Survey, 2020a). This points to a combination of MS4 and septic influences that may be occurring from groundwater infiltration and illicit connections to the storm drain system, correlating with higher nitrate. A similar groundwater signature for nitrate and δ18O was identified at the Culvert at Tappen Beach site (which drains Scudders Pond); however, no HF183 was detected, suggesting that the OWDSs from homes upgradient and surrounding the pond are not contributing to elevated fecal coliform concentrations under dry or wet weather conditions.
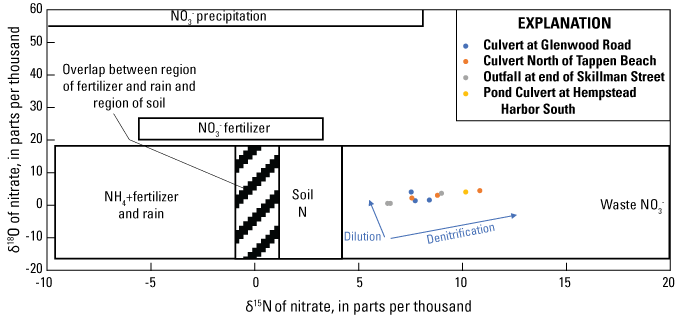
Graph showing concentrations of stable isotopes of oxygen-18 (δ18O) and nitrogen-15 (δ15N) of nitrate (NO3−) in surface-water samples collected around the watershed in Hempstead Harbor, New York. Groups of isotope ranges (modified from Burns and others, 2009) represent likely sources of nitrate and differences in isotope ratios. Patterned area is overlap between the region of fertilizer and rain and the region of soil. Sites can be described as contributions from groundwater undergoing denitrification and dilution of rainwater throughout the year. N, nitrogen; NH4+, ammonium.
Nonpoint Sources of Fecal Coliform Bacteria
Major potential nonpoint contributors of freshwater to Hempstead Harbor include groundwater seepage and direct stormwater runoff not conveyed by the MS4. Groundwater was collected from two sites, the Beach south of Glen Cove Creek and Tappen Beach sites. Fecal coliform was not detected in either groundwater sample (table 1.2; U.S. Geological Survey, 2020a). At the Tappen Beach site, which is downgradient from an unsewered residential area and the septic system of a seasonal restaurant, HF183 was detected in shallow groundwater (roughly 8 feet below land surface) at an estimated concentration of 400 copies/100 mL. The lack of positive detections for FC in groundwater throughout the study area, along with positive HF183 and high nitrate values (U.S. Geological Survey, 2020a) implies septic influence and strongly suggests that direct groundwater seepage to Hempstead Harbor is an unlikely contributor to the concentrations of fecal coliform observed in receptor samples.
Another nonpoint source that can potentially contribute to fecal contamination in water samples is sediment during resuspension (O’Mullan and others, 2019). To better understand these contributions, sediment samples were collected at the Culvert at Glenwood Road site and below the Spillway at Skillman Street site, with estimated fecal coliform concentrations of 260 and 510 colony forming units per gram dry weight, respectively (table 1.2; U.S. Geological Survey, 2020a). Additionally, human and waterfowl MST markers were also detected in these samples, with concentrations at the Culvert at Glenwood Road site of 830 copies/100 mL of HF183 and 49,000 copies/100 mL of GFD and at the Spillway at Skillman Street site of 76,000 copies/100 mL GFD. Recent research (Hassard and others, 2016; O’Mullan and others, 2019) shows that resuspension of sediment along natural shorelines can cause a spike in fecal coliform concentrations. Therefore, it is likely that during conditions that result in high wave energy, sediment can act as a source of FC when resuspended in the water column as a result of tidal movement, storms, or boat activity.
Classification of Source Sites
The source sites were assessed to better understand geographical sources and transport mechanisms to surface-water receptor sites and how potential land-use and population density relate to FC and MST marker presence and abundance (table 2).
Table 2.
Geographical sources of water for sample locations and the potential for these sites to have contributed to the fecal coliform concentrations observed in the samples.[OWDS, onsite wastewater disposal system; MST, microbial source tracking; X, potential contributor; —, not a likely contributor based on current data]
Source sites were classified according to methods described in Tagliaferri and others (2021) to aid resource managers with potential remediation efforts (table 3). Class 1 sites have the highest levels of contamination and class 5 sites have the least. Sites designated as sources to Hempstead Harbor are further characterized below.
Table 3.
Sample results for fecal coliform and microbial source tracking markers by source site type at Hempstead Harbor on Long Island, New York.[Proposed priorities consider concentrations of fecal coliform above 49 most probable number per 100 milliliters (MPN/100 mL), dry weather discharges, and influences of human sewage and canine waste. HF183, human-associated Bacteroides marker; BacCan, canine-associated Bacteroides marker; —, no data]
Culvert at Glenwood Road—Class 1
The samples collected at the Culvert at Glenwood Road site had some of the highest concentrations of both human and canine markers in the Hempstead Harbor watershed and elevated concentrations of FC in wet and dry weather (800 to 9,200 MPN/100 mL). The area is unsewered, with roughly 30 percent of the land use unspecified. Nitrate and isotope data point to diluted groundwater for the winter, wet-weather sample, suggesting runoff contributions that correlate with high human and canine markers and FC. The culvert flows continuously and is suspected of contributing high FC concentrations related to illicit sewer hookups to the storm drain system, which is influenced by groundwater infiltration under all conditions and stormwater that flows into the storm drain system from adjacent roadways during wet-weather conditions. The sediment at this location, which is exposed and can be in direct contact with the culvert flow, also may act as a source of FC when resuspended during tidal exchange or storms. The culvert is roughly parallel with the sandbar that acts as the regulatory divide between Hempstead Harbor North and South. Contributions from the culvert affect both Hempstead Harbor North and South through daily tidal exchange. Although stormwater is a big contributor at this location, there are other potential factors (for example, illicit connections of wastewater to drainage conveyances) that contribute to the consistent delivery of FC.
Outfall at Skillman Street—Class 1
The Outfall at Skillman Street site is adjacent to the new stormwater spillway (Spillway at Skillman Street site) and directs upland surface waters and some groundwater into the harbor. The population density in the surrounding area is high; 80 percent of the area is sewered, and 30 percent of the land use is residential, with the rest being a mix of commercial and industrial uses. Nitrate and isotope data point to diluted groundwater for the winter wet sample, suggesting upland runoff contributions are funneled through the system. The outfall is a consistent source of high FC that is influenced by humans, canines, and ruminants (deer). Human and canine markers were only detected in the dry, summer sample. Samples from this site had higher fecal coliform concentrations during dry weather (5,400 and greater than 16,000 MPN/100 mL) compared with wet weather (490 MPN/100 mL). This site is likely affected by upland surface-water drainage and infiltration of waste that appear to be diluted by stormwater runoff during wet weather events.
Glen Cove Creek—Class 1
Glen Cove Creek site is downstream from the Glen Cove Water Pollution Control Plant outfall and adjacent to a marina, with several stormwater outfalls along both sides of the creek. The creek was found to be a consistent source of FCs. Human, canine, and waterfowl markers were all detected; however, no human marker was present in the summer, dry-weather sample, collected during the summer boating season. The human marker was detected during both dry and wet weather at similar concentrations for two winter samples. More discrete and focused sampling would be needed throughout the year to confirm any influence from the marina. Although both winter samples showed comparable concentrations of HF183, the wet sample contributed orders of magnitude higher fecal coliform concentrations than the dry sample. This suggests that, although the human marker may be present and potentially originating from the Glen Cove Water Pollution Control Plant during dry weather, stormwater is a more substantial contributor of FC.
Pond Culvert at Hempstead Harbor South—Class 2
The Pond Culvert at Hempstead Harbor South site drains ponds and stormwater from the adjacent roadway. The area is 91 percent sewered and has a mix of land use, with 35 percent residential and 14 percent commercial. Two of the three samples had fecal coliform concentrations above 49 MPN/100 mL, which corresponded to a dry summer (500 MPN/100 mL) and wet winter (790 MPN/100 mL) sample (table 1.2; U.S. Geological Survey, 2020a). The HF183 marker was not detected in the samples collected at this site; however, BacCan was detected in both samples with elevated fecal coliform, suggesting canine influence regardless of season or condition. At this site, contributions of bacteria from pond drainage may be as substantial as contributions from stormwater.
Spillway at Skillman Street—Class 3
The Spillway at Skillman Street site (adjacent to the Outfall at Skillman Street site) drains stormwater from the roadway and (current [2019]) construction area. Fecal coliform concentrations were greater than 16,000 MPN/100 mL in the wet-weather sample and coincided with detections of waterfowl and canine markers. However, fecal coliform and canine markers were not detected in the dry weather sample. The human marker was not detected in either sample. Stormwater is the most substantial source of fecal contamination at the spillway.
Culvert at Tappen Beach—Class 4
The Culvert at Tappen Beach site drains upland ponds and possibly stormwater from the adjacent roadway. The area is unsewered, and land use is 39 percent residential and 27 percent recreational (mostly at Tappen Beach). FC concentrations under all conditions were relatively low. The waterfowl marker was the only marker present and was detected in both samples. This location is not a major contributor of fecal coliform to the harbor overall, though slightly higher concentrations in wet weather compared to dry suggest some stormwater contributions.
Summary
The U.S. Geological Survey, in collaboration with the New York State Department of Environmental Conservation, assessed the potential sources of fecal contamination entering Hempstead Harbor on Long Island, New York, from June 2018 to July 2019. Water samples are routinely collected by the DEC in Long Island embayments and analyzed for fecal coliform bacteria, an indicator of fecal contamination, to determine the need for closure of shellfish beds for harvest and consumption. Fecal indicator bacteria such as fecal coliform signify the potential for pathogenic (disease-causing) bacteria to be present.
Host sources of fecal contamination in Hempstead Harbor were assessed based on bacterial Bacteroides and Helicobacter microbial source tracking (MST) markers and isotope analyses of nitrogen and oxygen. Overall, human, canine, and waterfowl contributions were ubiquitous; however, by evaluating the MST markers alongside fecal coliform data and land-use information, geographical sources of fecal contamination discharging from the culverts and outfalls sampled as part of this study were better differentiated. Among the potential sources of fecal contaminated water contributing to Hempstead Harbor—groundwater, stormwater (MS4s), marinas (boats), and the Glen Cove Water Pollution Control Plant—stormwater from MS4s were the most likely transport mechanism of fecal contamination into Hempstead Harbor. The most substantial source of fecal contamination to Hempstead Harbor was found to be discharge from sites with constant flow, mainly municipal separate storm sewer system throughout the harbor, in particular at the Outfall at Skillman Street and the Culvert at Glenwood Road sites under both dry and wet conditions.
Of the sites sampled for this study, three sites had persistently high fecal coliform bacteria concentrations and the presence of human (HF183) and canine (BacCan) MST markers. The Culvert at Glenwood Road, the Outfall at Skillman Street, and the Spillway at Skillman Street sites were identified as locations contributing a substantial source of fecal contamination to Hempstead Harbor. The sample collected at the marina at the Glen Cove Creek site did not suggest boats were substantially contributing to fecal coliform bacteria, but more samples would be needed to support this finding. The absence of fecal coliform bacteria in groundwater samples that tested positive for the human MST marker indicated that water from septic systems entering the harbor is influenced by human waste; however, it may not contribute to the elevated fecal coliform bacteria often detected. Further, sediment can act as a source of fecal contamination when resuspended in the water column through tidal shifts or boat activity. More samples in Hempstead Harbor that correlate suspended sediment with fecal coliform bacteria would be needed to definitively attribute sources and loads.
References Cited
Burns, D.A., Boyer, E.W., Elliott, E.M., and Kendall, C., 2009, Sources and transformations of nitrate from streams draining varying land uses—Evidence from dual isotope analysis: Journal of Environmental Quality, v. 38, no. 3, p. 1149–1159, accessed March 10, 2021, at https://doi.org/10.2134/jeq2008.0371.
Drozd, M., Merrick, N.N., Sanad, Y.M., Dick, L.K., Dick, W.A., and Rajashekara, G., 2013, Evaluating the occurrence of host-specific Bacteroidales, general fecal indicators, and bacterial pathogens in a mixed-use watershed: Journal of Environmental Quality, v. 42, no. 3, p. 713–725, accessed December 15, 2020, at https://doi.org/10.2134/jeq2012.0359.
Fisher, S.C., McCarthy, B.A., Kephart, C.M., and Griffin, D.W., 2020, Assessment of water quality and fecal contamination sources at Hook Pond, East Hampton, New York: U.S. Geological Survey Scientific Investigations Report 2020–5071, 58 p., accessed December 15, 2020, at https://doi.org/10.3133/sir20205071.
Gao, G., Falconer, R.A., and Lin, B., 2015, Modelling the fate and transport of fecal bacteria in estuarine and coastal waters: Marine Pollution Bulletin, v. 100, no. 1, p. 162–168, accessed December 15, 2020, at https://doi.org/10.1016/j.marpolbul.2015.09.011.
Hassard, F., Gwyther, C.L., Farkas, K., Andrews, A., Jones, V., Cox, B., Brett, H., Jones, D.L., McDonald, J.E., and Malham, S.K., 2016, Abundance and distribution of enteric bacteria and viruses in coastal and estuarine sediments—A review: Frontiers in Microbiology, v. 7, article 1692, 31 p., accessed December 15, 2020, at https://doi.org/10.3389/fmicb.2016.01692.
Nassau County, 2015, Nassau County DPW sanitary sewer collection districts: Nassau County data, accessed March 30, 2021, at https://www.arcgis.com/home/item.html?id=26d010a660d047c495d2226df26af81a.
National Oceanic and Atmospheric Administration, [undated], NOAA tide predictions: National Oceanic and Atmospheric Administration data, accessed 2020 at https://tidesandcurrents.noaa.gov/tide_predictions.html.
New York State Department of Environmental Conservation, 2020, Waterbody inventory/priority waterbodies list: New York State Department of Environmental Conservation data, accessed December 3, 2020, at https://www.dec.ny.gov/chemical/36730.html.
New York State Department of Environmental Conservation, [undated], Nassau County nitrogen reduction initiatives: New York State Department of Environmental Conservation web page, accessed April 22, 2021, at https://www.dec.ny.gov/docs/water_pdf/nassaucnrippt.pdf.
O’Mullan, G.D., Juhl, A.R., Reichert, R., Schneider, E., and Martinez, N., 2019, Patterns of sediment-associated fecal indicator bacteria in an urban estuary—Benthic-pelagic coupling and implications for shoreline water quality: The Science of the Total Environment, v. 656, p. 1168–1177, accessed December 15, 2020, at https://doi.org/10.1016/j.scitotenv.2018.11.405.
Rogers, S.W., Donnelly, M., Peed, L., Kelty, C.A., Mondal, S., Zhong, Z., and Shanks, O.C., 2011, Decay of bacterial pathogens, fecal indicators, and real-time quantitative PCR genetic markers in manure-amended soils: Applied and Environmental Microbiology, v. 77, no. 14, p. 4839–4848, accessed December 15, 2020, at https://doi.org/10.1128/AEM.02427-10.
Suffolk County, 2020, GIS viewer—Suffolk County: Suffolk County data, accessed March 30, 2021, at https://gisportal.suffolkcountyny.gov/gis/home/.
Tagliaferri, T.N., Fisher, S.C., Kephart, C.M., Cheung, N., Reed, A.P., and Welk, R.J., 2021, Overview and methodology for a study to identify fecal contamination sources using microbial source tracking in seven embayments on Long Island, New York: U.S. Geological Survey Scientific Investigations Report 2021–5033, 8 p., accessed May 29, 2021, at https://doi.org/10.3133/sir20215033.
U.S. Food and Drug Administration, 2019, National shellfish sanitation program—Guide for the control of molluscan shellfish—2019 revision: U.S. Food and Drug Administration, 502 p., accessed March 1, 2021, at https://www.fda.gov/food/federalstate-food-programs/national-shellfish-sanitation-program-nssp.
U.S. Geological Survey, 2020a, USGS water data for the nation: U.S. Geological Survey National Water Information System database, accessed July 31, 2020, at https://doi.org/10.5066/F7P55KJN.
U.S. Geological Survey, 2020b, National land cover database: U.S. Geological Survey data, accessed March 30, 2021, at https://www.usgs.gov/centers/eros/science/national-land-cover-database?qt-science_center_objects=0#qt-science_center_objects.
Weather Underground, 2020, Hempstead Harbour Club—KNYGLENC2: Weather Underground data, accessed January 12, 2021, at https://www.wunderground.com/dashboard/pws/KNYGLENC2.
Appendix 1. Samples Collected at Hempstead Harbor on Long Island, New York, for Bacterial Genetic Markers
Table 1.1.
Locations where samples were collected in Hempstead Harbor on Long Island, New York, for bacterial genetic markers and fecal coliform analysis.[Samples collected include blanks and replicates. Data are from the National Water Information System web interface (U.S. Geological Survey, 2020a). Sample conditions of wet and dry indicate whether a sample was influenced by storm or nonstorm conditions, respectively. ID, National Water Information System identification number]
Table 1.2.
Data summary of all samples collected in Hempstead Harbor on Long Island, New York, for bacterial genetic markers and fecal coliform analysis.[Samples collected include blanks and replicates. Bacterial genetic markers are human-associated Bacteroides (HF183), ruminant-associated Bacteroides (Rum2Bac), waterfowl-associated Helicobacter (GFD), and canine-associated Bacteroides (BacCan) markers. Station data are available on the National Water Information System web interface (U.S. Geological Survey, 2020a). MST samples were analyzed by the U.S. Geological Survey Ohio Microbiology Laboratory. Fecal coliform samples were analyzed by the Suffolk County Department of Health Services Public and Environmental Health Laboratory. Bacterial genetic marker values in bold typeface are indicative of a concentration greater than the reporting limit; values preceded by a less than (<) symbol indicate the reporting limit for a given assay when a nondetect occurred; values preceded by a greater than (>) symbol indicate the maximum reporting limit for the dilution protocol. copies/100 mL, copies of genetic marker per 100 milliliters; MPN/100 mL, most probable number per 100 milliliters; E, estimate; b, concentration was greater than the limit of quantification but less than the reporting limit; ~, duplicate qPCR results do not agree; V, result may be affected by contamination; c, contamination was found in a blank sample and was used to appropriately qualify associated samples; —, assay was not performed; * measured in copies of genetic marker per gram dry weight; **, measured in colony forming units per gram dry weight]
Reference Cited
U.S. Geological Survey, 2020, USGS water data for the nation: U.S. Geological Survey National Water Information System database, accessed July 31, 2020, at https://doi.org/10.5066/F7P55KJN.
Supplemental Information
Concentrations of chemical constituents in water are given in milligrams per liter (mg/L).
Concentrations of fecal coliform are given in copies of genetic markers per 100 milliliters (copies/100 mL), colony forming units per gram dry weight (CFU/g dw), or most probable number per 100 milliliters (MPN/100 mL).
Abbreviations
BacCan
canine-associated Bacteroides marker
DEC
New York State Department of Environmental Conservation
DNA
deoxyribonucleic acid
FC
fecal coliform bacteria
GFD
waterfowl-associated Helicobacter marker
GIS
geographic information system
HF183
human-associated Bacteroides marker
MPN
most probable number
MS4
municipal separate storm sewer system
MST
microbial source tracking
NWIS
National Water Information System
OWDS
onsite wastewater disposal systems
Rum2Bac
ruminant-associated Bacteroides marker
USGS
U.S. Geological Survey
For more information, contact
Director, New York Water Science Center
U.S. Geological Survey
425 Jordan Road
Troy, NY 12180–8349
dc_ny@usgs.gov
or visit our website at
https://www.usgs.gov/centers/ny-water
Publishing support provided by the Pembroke Publishing Service Center.
Disclaimers
Any use of trade, firm, or product names is for descriptive purposes only and does not imply endorsement by the U.S. Government.
Although this information product, for the most part, is in the public domain, it also may contain copyrighted materials as noted in the text. Permission to reproduce copyrighted items must be secured from the copyright owner.
Suggested Citation
Tagliaferri, T.N., Fisher, S.C., Kephart, C.M., Cheung, N., Reed, A.P., and Welk, R.J., 2021, Using microbial source tracking to identify fecal contamination sources in an embayment in Hempstead Harbor on Long Island, New York: U.S. Geological Survey Scientific Investigations Report 2021–5042, 19 p., https://doi.org/10.3133/sir20215042.
ISSN: 2328-0328 (online)
Study Area
| Publication type | Report |
|---|---|
| Publication Subtype | USGS Numbered Series |
| Title | Using microbial source tracking to identify fecal contamination sources in an embayment in Hempstead Harbor on Long Island, New York |
| Series title | Scientific Investigations Report |
| Series number | 2021-5042 |
| DOI | 10.3133/sir20215042 |
| Publication Date | August 09, 2021 |
| Year Published | 2021 |
| Language | English |
| Publisher | U.S Geological Survey |
| Publisher location | Reston, VA |
| Contributing office(s) | New York Water Science Center |
| Description | Report: vii, 19 p.; Data Release |
| Country | United States |
| State | New York |
| Other Geospatial | Hempstead Harbor, Long Island |
| Online Only (Y/N) | Y |
| Additional Online Files (Y/N) | N |