

Simulating the Effects of Climate-Related Changes to Air Temperature and Precipitation on Streamflow and Water Temperature in the Meduxnekeag River Watershed, Maine
Links
- Document: Report (20.6 MB pdf) , HTML , XML
- Data Release: USGS data release - Data for simulating the effects of air temperature and precipitation changes on streamflow and water temperature in the Meduxnekeag River watershed, Maine
- Download citation as: RIS | Dublin Core
Abstract
Responsible stewardship of native fish populations and riparian plants in the Meduxnekeag River watershed in northeastern Maine is a high priority for the Houlton Band of Maliseet Indians. Understanding the potential changes in hydrology and water temperature as a result of climate change is important to this priority for evaluating future habitat conditions in the watershed. This report, prepared in cooperation with the Houlton Band of Maliseet Indians, documents and presents the results of a model using the Precipitation-Runoff Modeling System (PRMS), a hydrologic model designed to provide streamflow and water temperature simulations under predicted changes in precipitation and air temperature during the next century.
To estimate streamflows and water temperature in the Meduxnekeag River watershed, a PRMS model was developed and calibrated. By using the calibrated PRMS model, simulations were made for projected scenarios of 0, 5, 10, and 15 percent increases in precipitation and for increases in air temperature of 0.0, 3.6, 7.0, and 10.4 degrees Fahrenheit (°F). The increases in precipitation and temperature were applied to all the daily input values uniformly. These scenarios were based upon the results from 30 climate change models summarized in the National Climate Change Viewer. Streamflows and water temperatures modeled for different climate scenarios were compared with streamflows and water temperatures modeled with unadjusted climate inputs.
Overall, streamflow increased with increasing precipitation and decreased with increasing air temperature. Water temperature increased with increasing air temperature. At the outlet of the studied Meduxnekeag River watershed, with both a 15 percent increase in precipitation and a 10.4 °F increase in air temperature, the mean annual streamflow increased by 17 percent from 489 cubic feet per second (ft3/s) to 572 ft3/s, and the mean annual maximum streamflow decreased by 8.3 percent from 3,870 ft3/s to 3,550 ft3/s. At the same location and under the same scenario, the mean annual water temperature increased by 17.5 percent from 47.4 °F to 55.7 °F.
Significant changes in mean monthly streamflows were found with increasing air temperature. The PRMS model results showed that when air temperature was increased, there was an increase in mean monthly streamflow during the winter months and a decrease in mean monthly streamflow during the spring months. In addition, with a 10.4 °F increase in the air temperature, the month with the greatest monthly streamflow changed from April to December. In addition, the PRMS model estimated that the mean annual maximum snowpack in snow water equivalent for the watershed would decrease from 7.67 inches to 1.26 inches, and the mean annual date of the maximum snowpack would change from March 21 to January 28 with a 15 percent increase in precipitation and a 10.4 °F increase in air temperature.
Introduction
The use and responsible stewardship of native fish populations and riparian plants in the Meduxnekeag River watershed in northeastern Maine is of critical importance to the Houlton Band of Maliseet Indians (HBMI). These and other natural resources in the watershed provide substantial contributions to the cultural and economic viability of the HBMI community (Houlton Band of Maliseet Indians, 2017).
Although downstream power-generating stations have diminished and even eliminated culturally significant species like the Atlantic salmon, American eel, and gaspereau (alewife) from the Meduxnekeag River, hydrologic trends due to climate change pose additional threats to aquatic life and sustenance fishing. Hydrologic-trend studies in New England have documented changes in several components of the water cycle, including streamflows, during the past 30 to 40 years. Winter-and-spring streamflows, comprising a combination of snowmelt runoff and rain, have become significantly (with a probability of significance greater than 90 percent—that is, p less than [<] 0.1) earlier in northern and mountainous sections of the northeastern United States during the 20th century, with most of the change occurring over a 1- to 2-week period within the last 30 years (Dudley and Hodgkins, 2002; Hodgkins and others, 2003; Hodgkins and Dudley, 2006; Dudley and others, 2017). Annual peak flows have increased significantly in the northeastern United States during the past 50 to 100 years (Hodgkins and Dudley, 2005; Collins, 2009; Hodgkins and others, 2019), summer-stormflow magnitudes have increased in many rivers (Hodgkins and Dudley, 2011), and seasonal groundwater levels have increased throughout much of northern New England (Dudley and Hodgkins, 2013).
In addition, projections for climate change in the northeastern United States include warmer temperatures and increases in precipitation. Annual precipitation in the northeastern United States is projected to increase by about 5 to 8 percent by the middle of the 21st century and by about 7 to 14 percent by the end of the 21st century (Hayhoe and others, 2007a). The annual mean air temperature in the northeastern United States is projected to increase by about 3.8 to 5.2 degrees Fahrenheit (°F) by the middle of the 21st century and by approximately 5.2 to 9.4 °F by the end of the 21st century (Hayhoe and others, 2007a). Some State and Federal agencies responsible for the management of water resources, civil infrastructure, and human resources dependent upon hydrologic systems have been proactively preparing for the effects of climate-related changes in streamflows (for example, Maine Department of Transportation [Hodgkins and Dudley, 2013] and New Hampshire Department of Health and Human Services [Bjerklie and others, 2015]).
The successful persistence of fish species in the Meduxnekeag River watershed will depend on specific favorable hydrologic and water-quality conditions. A proactive approach to understanding and anticipating the needs of aquatic life in the watershed should include an assessment of the sensitivity of streamflows and water temperature to the predicted changes in precipitation and air temperature.
Previous Investigations
The prediction of hydrologic vulnerability caused by future climate scenarios has increasingly become a major point of research in the Northeast (Neff and others, 2000). Mack (2009) assessed a future climate scenario for the seacoast region by simulating potential variations in groundwater recharge and water use. Future projections were based on and compared to existing conditions and historical trends. Bjerklie and others (2011) used a watershed-runoff model to simulate groundwater recharge and snowfall in the Connecticut River Basin (western New Hampshire) and found that, during 1960‒2007, snowfall generally decreased, and base flow (discharge to streams from groundwater) increased. These changes were not distributed uniformly in time or space, and snowfall and base flow have marginally decreased or increased in some places in response to local conditions. Similarly, for the 57-year study period from 1950 to 2006, Hodgkins and Dudley (2011) measured increased base flow and stormflow in New England, and Dudley and Hodgkins (2013) measured higher groundwater levels.
Wake and others (2014a, b) indicated that the climate-model consensus showed increasing air temperature and precipitation for New England in the future, at least until 2100. Bjerklie and others (2011, 2015) projected that, in response to the climate change, groundwater recharge (and subsequently base flow) will likely continue to increase, and snowfall, to decrease, in parts of New Hampshire and the Connecticut River Basin. These effects do not happen everywhere but depend on the results of the global circulation model (often referred to as a “global climate model”), the local physiographic features represented in the model, and greenhouse-gas-emission scenarios that are coupled with land use and land cover within a projected global economic framework (Stocker and others, 2013). Similar projections were reported by the U.S. Geological Survey (USGS; 2021a) on the basis of the Intergovernmental Panel on Climate Change fifth climate change assessment report (Stocker and others, 2013) and the National Climate Assessment (Melillo and others, 2014; U.S. Global Change Research Program, 202164). Campbell and others (2011) reported that precipitation in the White Mountains of New Hampshire has increased during the latter half of the 20th century, resulting in increased water yield, and that the upward trend in precipitation is expected to continue into the future. Researchers also reported a decrease in evapotranspiration over the same period (Campbell and others, 2011; Melillo and others, 2014); however, they expected that evapotranspiration will increase in the future in response to rising air temperatures (projected by global circulation models), and that might keep pace with increasing precipitation, offsetting continued increases in water yield.
Past trends show precipitation increases across much of the conterminous United States (Karl and Knight, 1998; Groisman and others, 2005). These trends have also been noted in more localized studies in parts of New England (Miller and others, 2002) and the State of New York (Burns and others, 2007). The increase in streamflow that was measured in about 1970 coincided with changes in the timing of snowmelt peaks in New England (Hodgkins and others, 2003). These historical trends have been shown to be consistent with global circulation model projections used in hydrologic-model simulations for the recent past (Bjerklie and others, 2011). The projections from the global circulation model simulations are consistent with the historical trends and indicate that the trends in precipitation, temperature, and total runoff will continue to increase in the northeastern United States (Hayhoe and others, 2007b). Additionally, Demaria and others (2016) predicted increases in the magnitude of 3-day peak flows and decreases in the magnitude of 7-day low flows in the Northeast on the basis of simulations of future climates from 16 global circulation models.
Changes in land and water use also could affect hydrologic conditions in the future. This is particularly true in areas with high populations. Claessens and others (2006) suggested that land-use change is not as effective as climate change and water use in causing changes in the water budget for an urbanized watershed in Massachusetts; however, the balance of these effects likely will depend on the spatial distribution of climate change factors and degrees of urbanization. In contrast, LaFontaine and others (2015) found that land-use change (characterized as increasing development and impervious surface) can have a great effect on total runoff generated from a watershed; however, specific stormwater-management practices can largely mitigate this effect.
Objectives and Scope
This report presents the data, methods, and results of a cooperative study of the Meduxnekeag River watershed to build and calibrate a deterministic watershed model and a water temperature model capable of simulating future hydrologic and temperature changes on the basis of projected climate estimates. Several future climate scenarios are simulated with the models. Output from the models resulting from this project may provide hydrologic and temperature input for estimating the vulnerability of salmon to climate change.
Description of the Meduxnekeag River Watershed
The Meduxnekeag River originates from Meduxnekeag Lake in the southeastern part of Aroostook County, Maine, flows east-northeast for roughly 11 miles to the downstream end of the study area, and then continues east for another 11 miles to its confluence with the St. John River in New Brunswick, Canada. The drainage area at the downstream end of the study area (fig. 1) is 257 square miles (mi2); the drainage area at the mouth of the Meduxnekeag River where it flows into the St. John River, however, is 516 mi2.
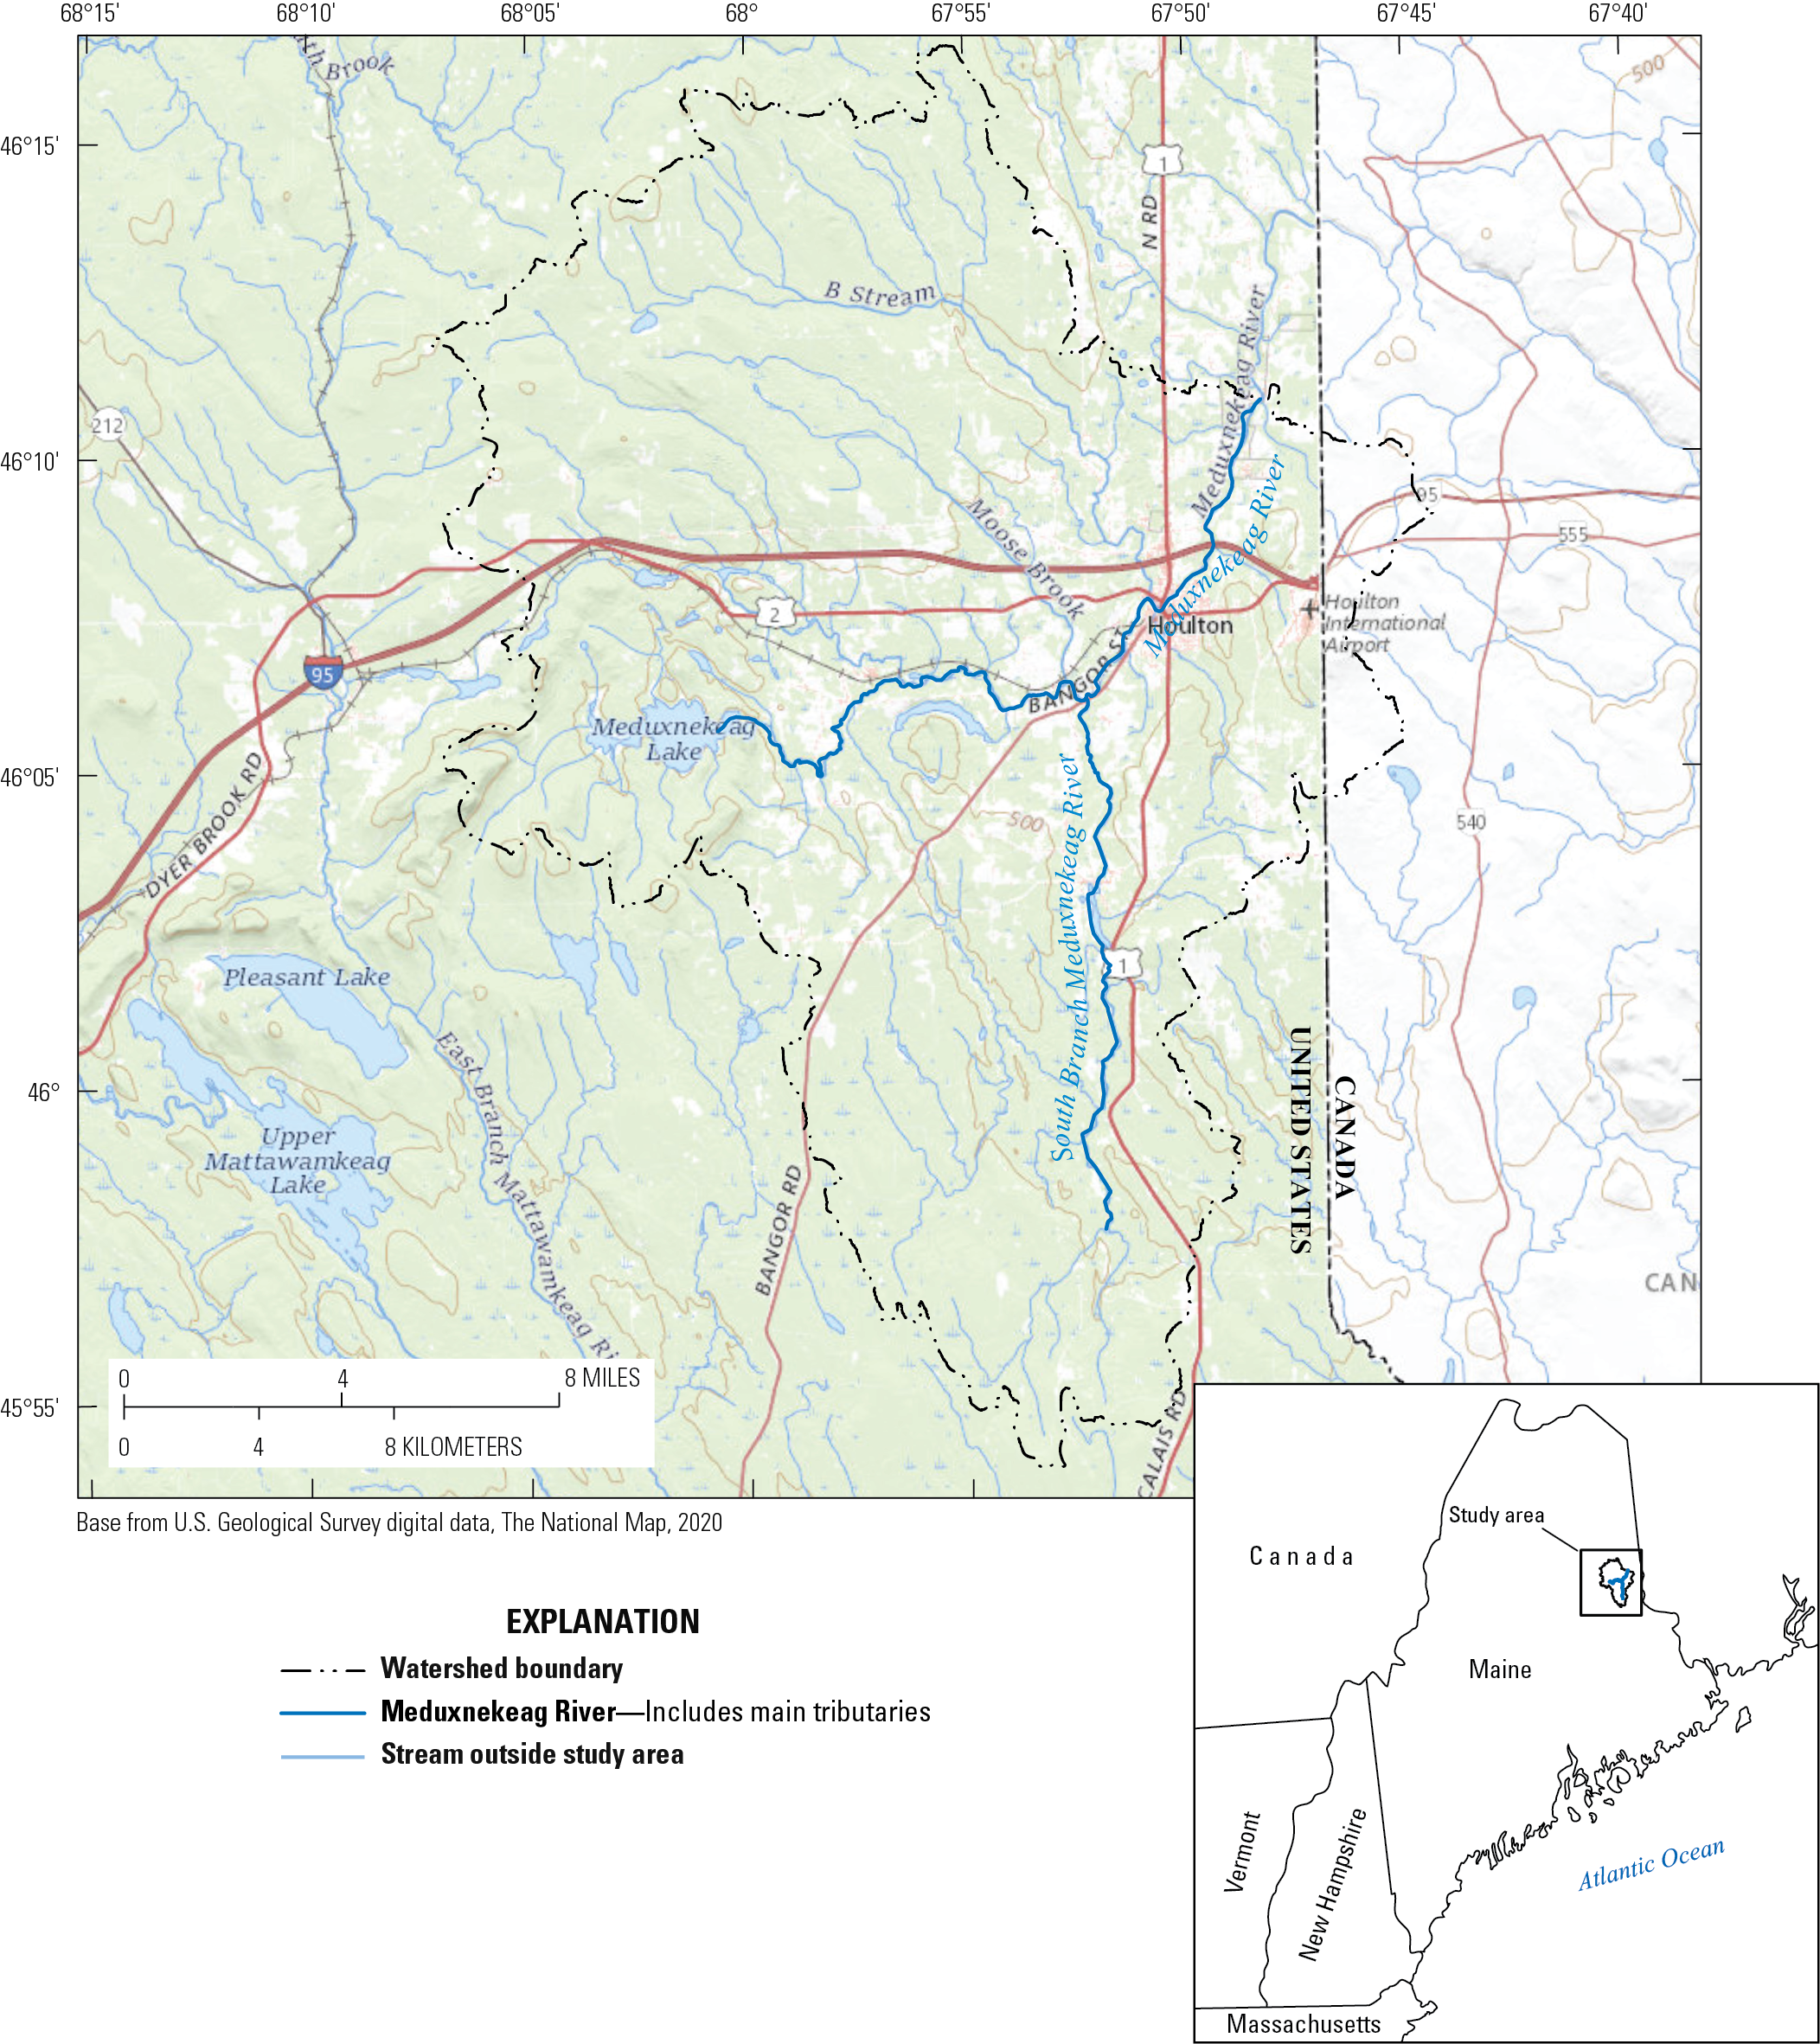
Map showing the Meduxnekeag River watershed study area in Maine.
Within the study area, the watershed is primarily forested especially in the headwaters area, whereas agricultural lands dominate the central and eastern parts of the watershed and the area along the river corridor. The river passes through nearly 2 miles (mi) of the urbanized areas of Houlton at approximately 4 mi upstream from the downstream end of the study area.
The climate in the Meduxnekeag River watershed is temperate, with mild summers and cold winters. The mean annual air temperature during 1981–2010 was about 41 degrees Fahrenheit (°F), with mean monthly air temperatures ranging from about 12 °F in January to 66 °F in July (National Oceanic and Atmospheric Administration, 2020). The mean annual precipitation is 41 inches (in.). The mean annual evapotranspiration for the Meduxnekeag River watershed area was estimated to be 17 in. from 1951 to 1980 (Randall, 1996).
Meduxnekeag River Watershed Model
The watershed model used for this investigation was the USGS Precipitation-Runoff Modeling System (PRMS) version 5.1.0 (Leavesley and others, 1983; Markstrom and others, 2015). PRMS, a deterministic, distributed-parameter, physically based watershed-modeling system, was applied to evaluate the effects of changes in climate and land cover on streamflows, stream temperatures, and general watershed hydrology (Markstrom and others, 2015). Responses to climate and land-cover changes are simulated in terms of water and energy balances, streamflow regimes, flood peaks and volumes, soil-water relations, and groundwater recharge. In PRMS, the components of streamflow include contributions from surface runoff, subsurface (soils) interflow, and groundwater; and the basin’s water budget consists of storage in snowpack, soil moisture, and groundwater, inputs from precipitation and snowmelt, losses to evapotranspiration, recharge to the deeper aquifer system, and outflows to streams from surface, subsurface, and shallow-groundwater reservoirs.
The PRMS is a modular modeling system, whereby select modules that represent watershed-process algorithms are combined into a customized PRMS model from a library of subroutine modules to simulate components of a particular hydrologic system, including water, energy processes, and stream temperature. PRMS operates on a fixed daily time step and is driven by daily inputs of total precipitation and maximum and minimum temperatures. The Meduxnekeag PRMS model (Olson, 2021) includes a list of modules used in this configuration. Supplemental information regarding PRMS modules and source code specific to the PRMS configuration presented in this report is available in the PRMS user’s manual (Markstrom and others, 2015) and the USGS PRMS developer’s resources (U.S. Geological Survey, 2021b).
The PRMS lends itself to the goals of this study because the model includes a stream temperature module for the simulation of mean daily water temperatures in a network of stream segments. This stream temperature module was developed as a recent enhancement to the PRMS. This new module is based on the Stream Network Temperature model, which was developed as a mechanistic, one-dimensional heat-transport model (Theurer and others, 1984) by the U.S. Fish and Wildlife Service.
Hydrologic Response Units
In the PRMS model for the Meduxnekeag River watershed, the modeled region is divided into polygon-shaped subwatersheds called hydrologic response units (HRUs). The daily water balance is simulated for each of the HRUs based on precipitation and temperature input data. The HRUs in the PRMS model include a wide range of sizes selected to provide a dense distribution of hydrologic output across the watershed. HRU boundaries coincide with catchments that drain to the Meduxnekeag River and its network of tributaries. The total runoff simulated by the PRMS is aggregated from the HRUs draining to and routed through stream segments that represent the stream channel network. Each stream segment defined in the PRMS represents a channel reach bounded by an HRU or, in most cases, on each side of the channel by an HRU. Each channel, except for the most upstream segment, is fed by an upstream segment and the bounding HRUs. The accumulated discharge in the segment is routed to the next downstream segment by the use of a Muskingum routing scheme (Markstrom and others, 2015).
The Meduxnekeag River watershed was subdivided into 317 HRU catchments that compose a network of 160 stream reach segments representing the Meduxnekeag River drainage system (fig. 2). Detailed datasets showing the HRU catchments and stream segments with identifiers are provided in Olson (2021). The HRUs and the stream segment distribution were determined on the basis of the level of detail needed for water-management decision making. The HRU and segments were distributed at a scale such that simulated data for all locations of potential interest within the watershed would be available.
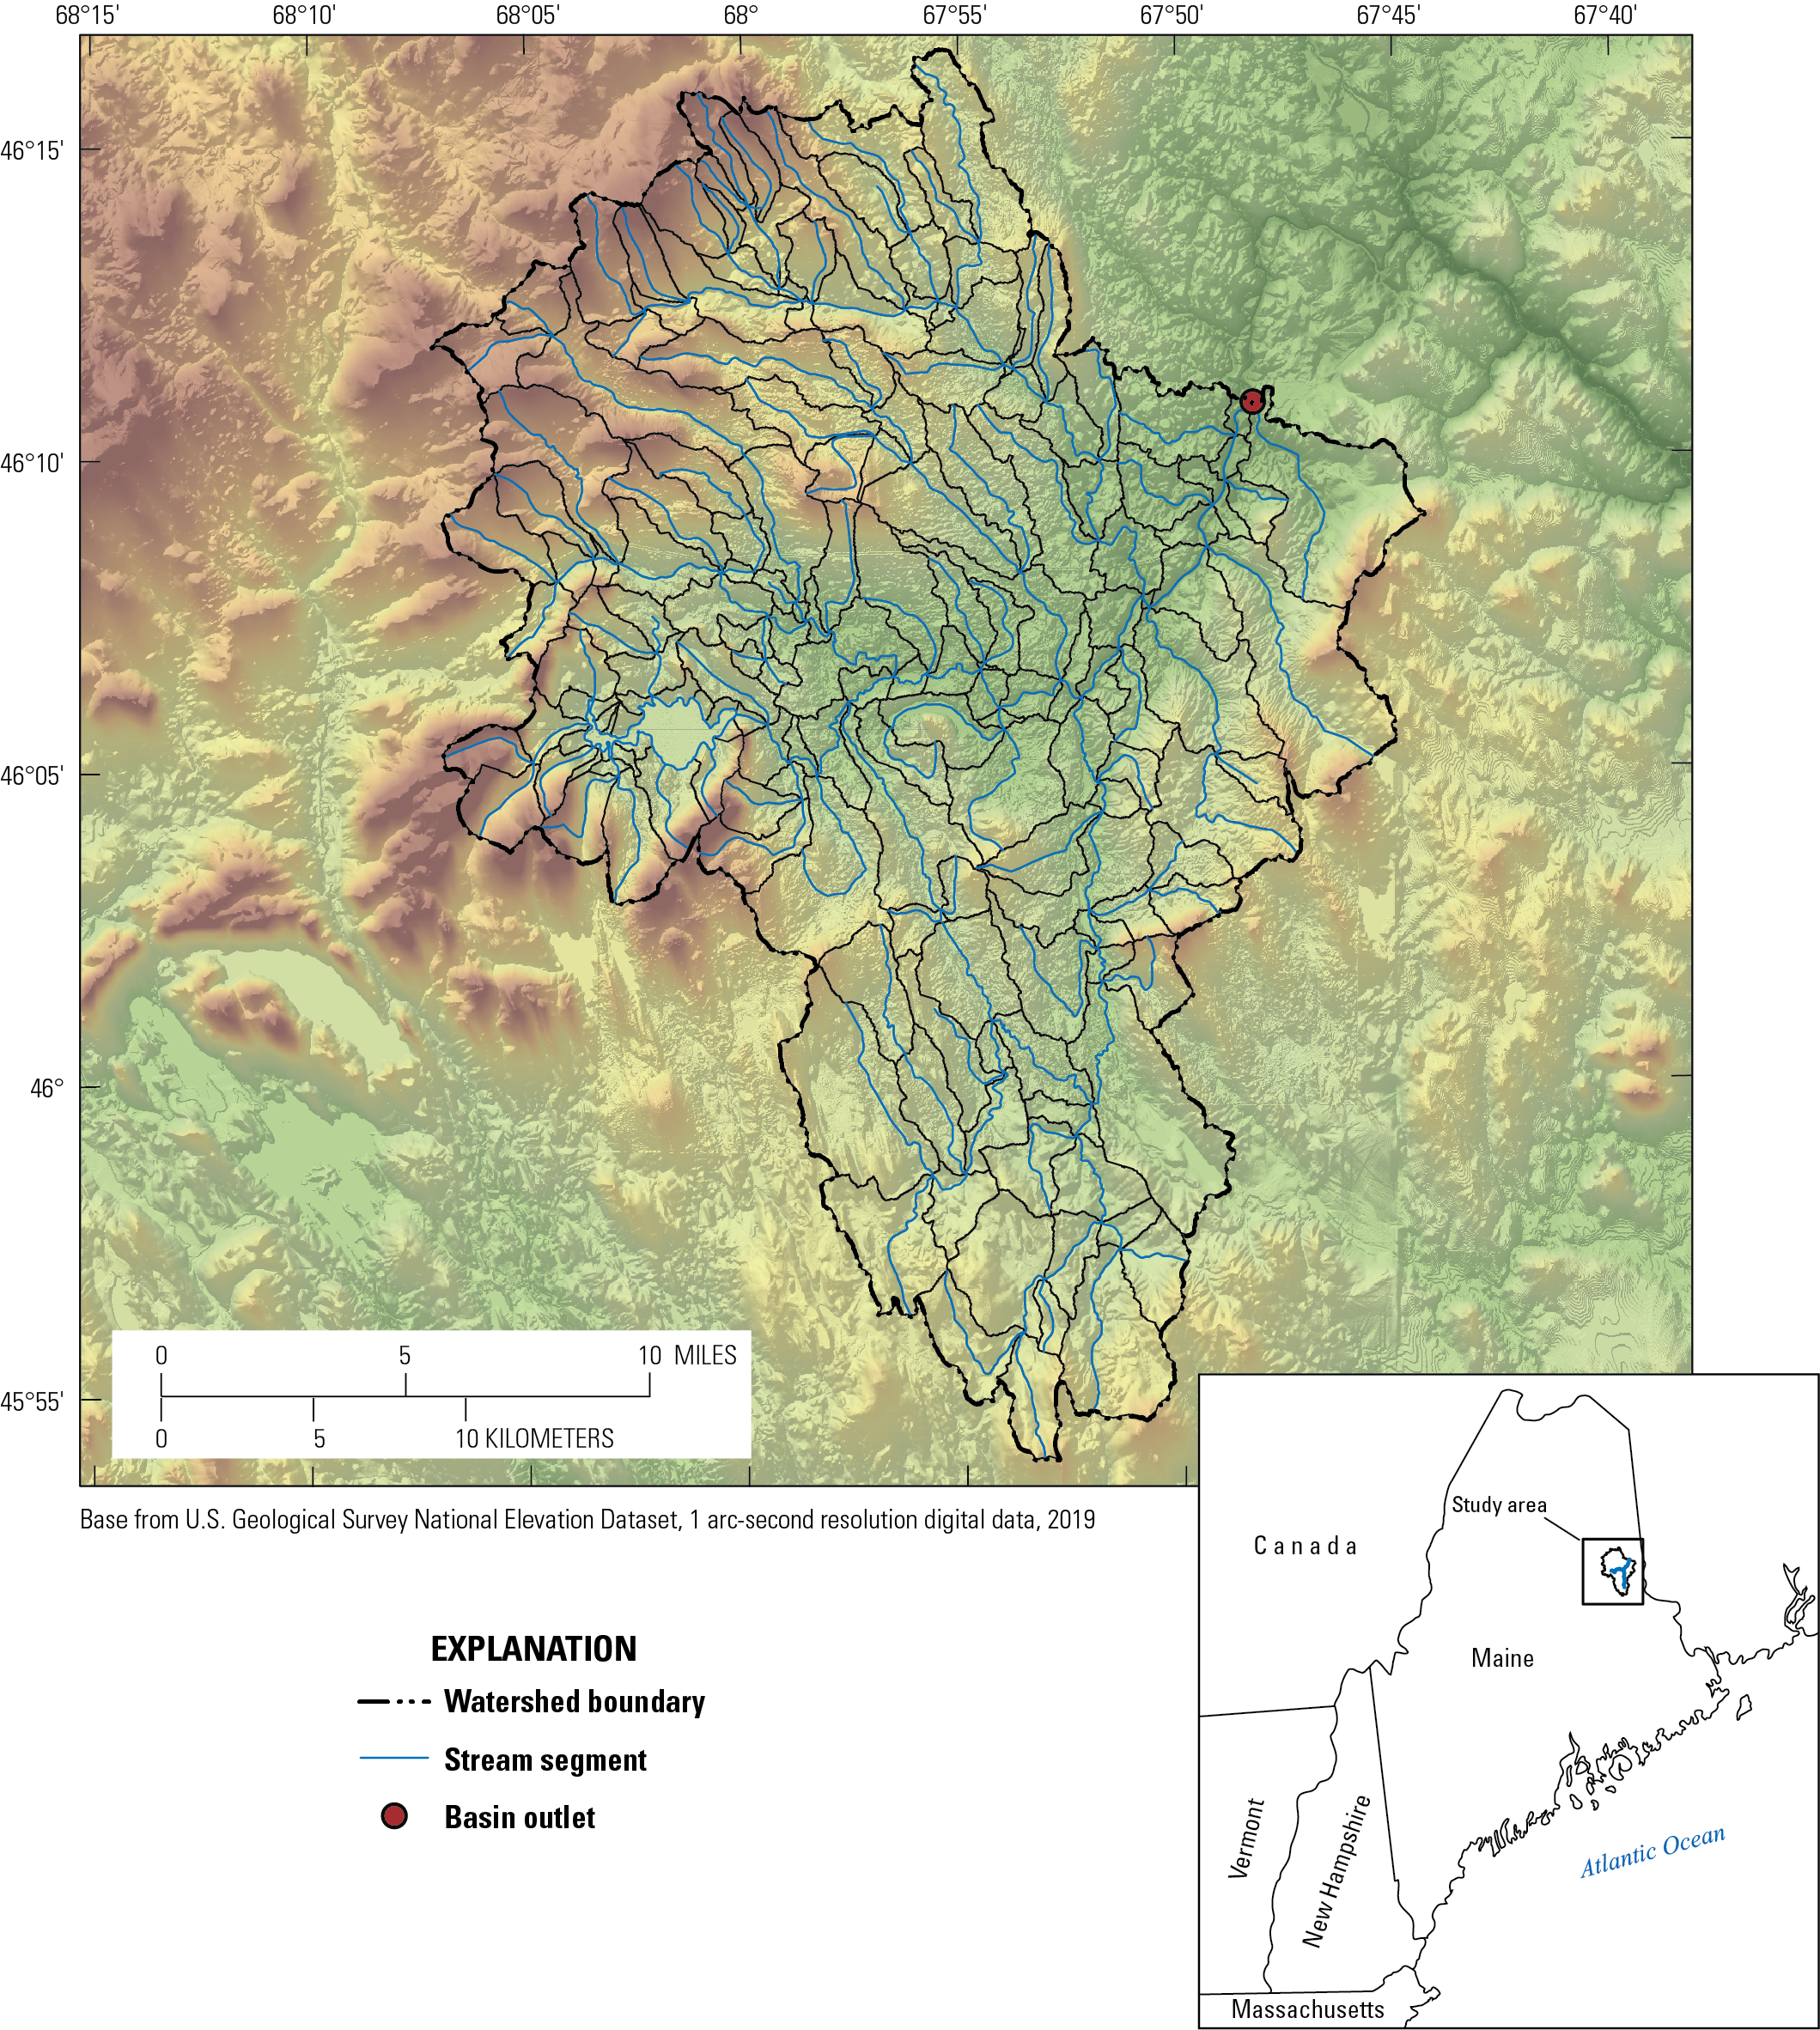
Map showing the distribution of hydrologic response unit (HRUs) in the Meduxnekeag River watershed, Maine, and the stream segments that compose the drainage network in the Precipitation-Runoff Modeling-System model.
Initial PRMS Parameterization
The PRMS model uses physically based algorithms to simulate various hydrologic processes (Markstrom and others, 2015; Bjerklie and Sturtevant, 2017). Within the model, parameters are assigned to HRUs and stream segments. These parameters are used in the computations of the algorithms to determine the hydrologic response of each HRU and stream segment. The PRMS simulates the hydrologic cycle by using the spatial variation in measurable physical characteristics—including land cover, topography, soil, and geology—that can be quantified within a geographic information system (GIS). The initial values for the parameters in the model were defined by using a GIS method developed for a New England regional PRMS model generated as part of the USGS National Hydrologic Model (NHM) or were directly downscaled from the regional New England PRMS model (Regan and others, 2018). The regional NHM model represented the Meduxnekeag River watershed with 6 HRUs, and the smaller scale Meduxnekeag model in this investigation included 317 HRUs.
Many of the initial parameters from the regional NHM model were not subject to calibration but were based on physical quantities that were derived from the geographic data for each HRU, and therefore were scaled directly from the GIS. It was assumed that the calibration of the regional NHM model would hold for the current time frame within the local scale model for the purpose of comparison with future projections. The GIS characteristics were obtained from national and statewide datasets that included the coordinates of the HRU centroid, topography (slope, aspect, and altitude; U.S. Geological Survey, 2020), soils (Natural Resources Conservation Service, 2019), land cover (Vogelmann and others, 2001; U.S. Geological Survey, undated b), and hydrography (U.S. Geological Survey, undated a). Snow-related parameters were primarily derived from an analysis of the temperature input data, which indicated when snow, mixed rain and snow, and all rain occurred.
The parameters subject to calibration were adapted to the Meduxnekeag River watershed-scale model from the regional PRMS model by correlating the parameters in the regional model with a set of GIS information, including mean HRU elevation, slope, and latitude. The elevation, slope, and latitude to be used as predictive variables for each of the 317 HRU were determined using a GIS and the National Elevation Dataset (U.S. Geological Survey, 2020). A multiple regression method was used to derive a predictive relation between the parameter to be downscaled and the predictive variables, and then the predictive variables associated with each HRU were used to determine the value of the parameter for that HRU. The parameters that were extrapolated from the HRUs in the regional model were based on the assumption that the regional-model calibration holds for the current state of the watershed hydrology. The regional model was calibrated by using data up to and including 2016 (Regan and others, 2018). In most cases, slope and elevation were sufficient to explain 70 percent or more of the variation in the parameter values. This method of distributing the parameter values is based on the assumption that the processes represented by the extrapolated parameters are not scale dependent; the result is that the relations between parameter values at the regional scale are preserved at the local scale.
Table 1 lists the parameters that were distributed on the basis of the relations between their values in the regional model and the HRU elevation, slope, and latitude. The table also describes the function of each parameter in the hydrologic model algorithm. Parameters not computed from physiographic information or directly calibrated were set at values derived from the regional model or at default values (Markstrom and others, 2015). With initial parameterization of the Meduxnekeag model completed, data could be applied to the model for calibration.
Table 1.
Parameters distributed to model hydrologic response units in a regional model for the Meduxnekeag River Watershed, Maine.[Data are from Olson (2021). Regional response units (HRUs) are distributed on the basis of the relations of their values in the regional model HRU and the HRU elevation, slope, and latitude, which are subject to calibration. ELEV, mean elevation of the HRU, in feet; ET, evapotranspiration; GWR, groundwater reservoir; LAT, latitude of the HRU, in degrees north; LUCA, Let Us Calibrate calibration software (Hay and Makiko, 2006; U.S. Geological Survey, 2013); NRMSE, normalized root-mean square error of the discharge estimates; NSE, Nash-Sutcliffe Efficiency value of the discharge estimates; SLOPE, mean slope of the HRU, in feet per foot; °F, degree Fahrenheit]
Data
The model parameters that define the characteristics of each HRU and the stream segments that compose the model structure were based on GIS information. These data determine the hydrologic response of each HRU and stream segment to the dynamic model input. The dynamic input (the data that drive the model output) consisted of daily precipitation and daily maximum and minimum air temperatures. Model calibration and evaluation were based on comparison with USGS streamflow and stream temperature data collected at three streamgages within the watershed (see “PRMS Model Development” section of this report). In addition, miscellaneous water temperature data collected at various locations within the stream network in the watershed were also used for comparison with model output of water temperature data.
Streamflow Data
USGS streamflow records were used for calibration and evaluation of the PRMS model. The data consisted of daily streamflow measurements from three USGS streamgages in the Meduxnekeag River watershed (fig. 3; table 2). The streamflow data from the Meduxnekeag River at Lowery Road near Houlton, Maine streamgage (USGS site number 01018035) were used for model calibration. The streamflow data from the Meduxnekeag River above South Branch Meduxnekeag River near Houlton, Maine (USGS site number 01017960) and Meduxnekeag River near Houlton, Maine (USGS site number 01018000) streamgages were used for model evaluation. None of the daily-discharge data from the streamgages used for model evaluation were significantly affected by lake and reservoir storage or water diversions; however, a small discharge from the Houlton wastewater treatment facility outfall contributed to flow at the downstream streamgage used for calibration (site number 01018035).
Table 2.
U.S. Geological Survey streamgages in the Meduxnekeag River watershed, Maine.[Data are from Olson (2021). Locations of streamgages are shown in figure 3. Evaluation streamgages are listed in downstream order]
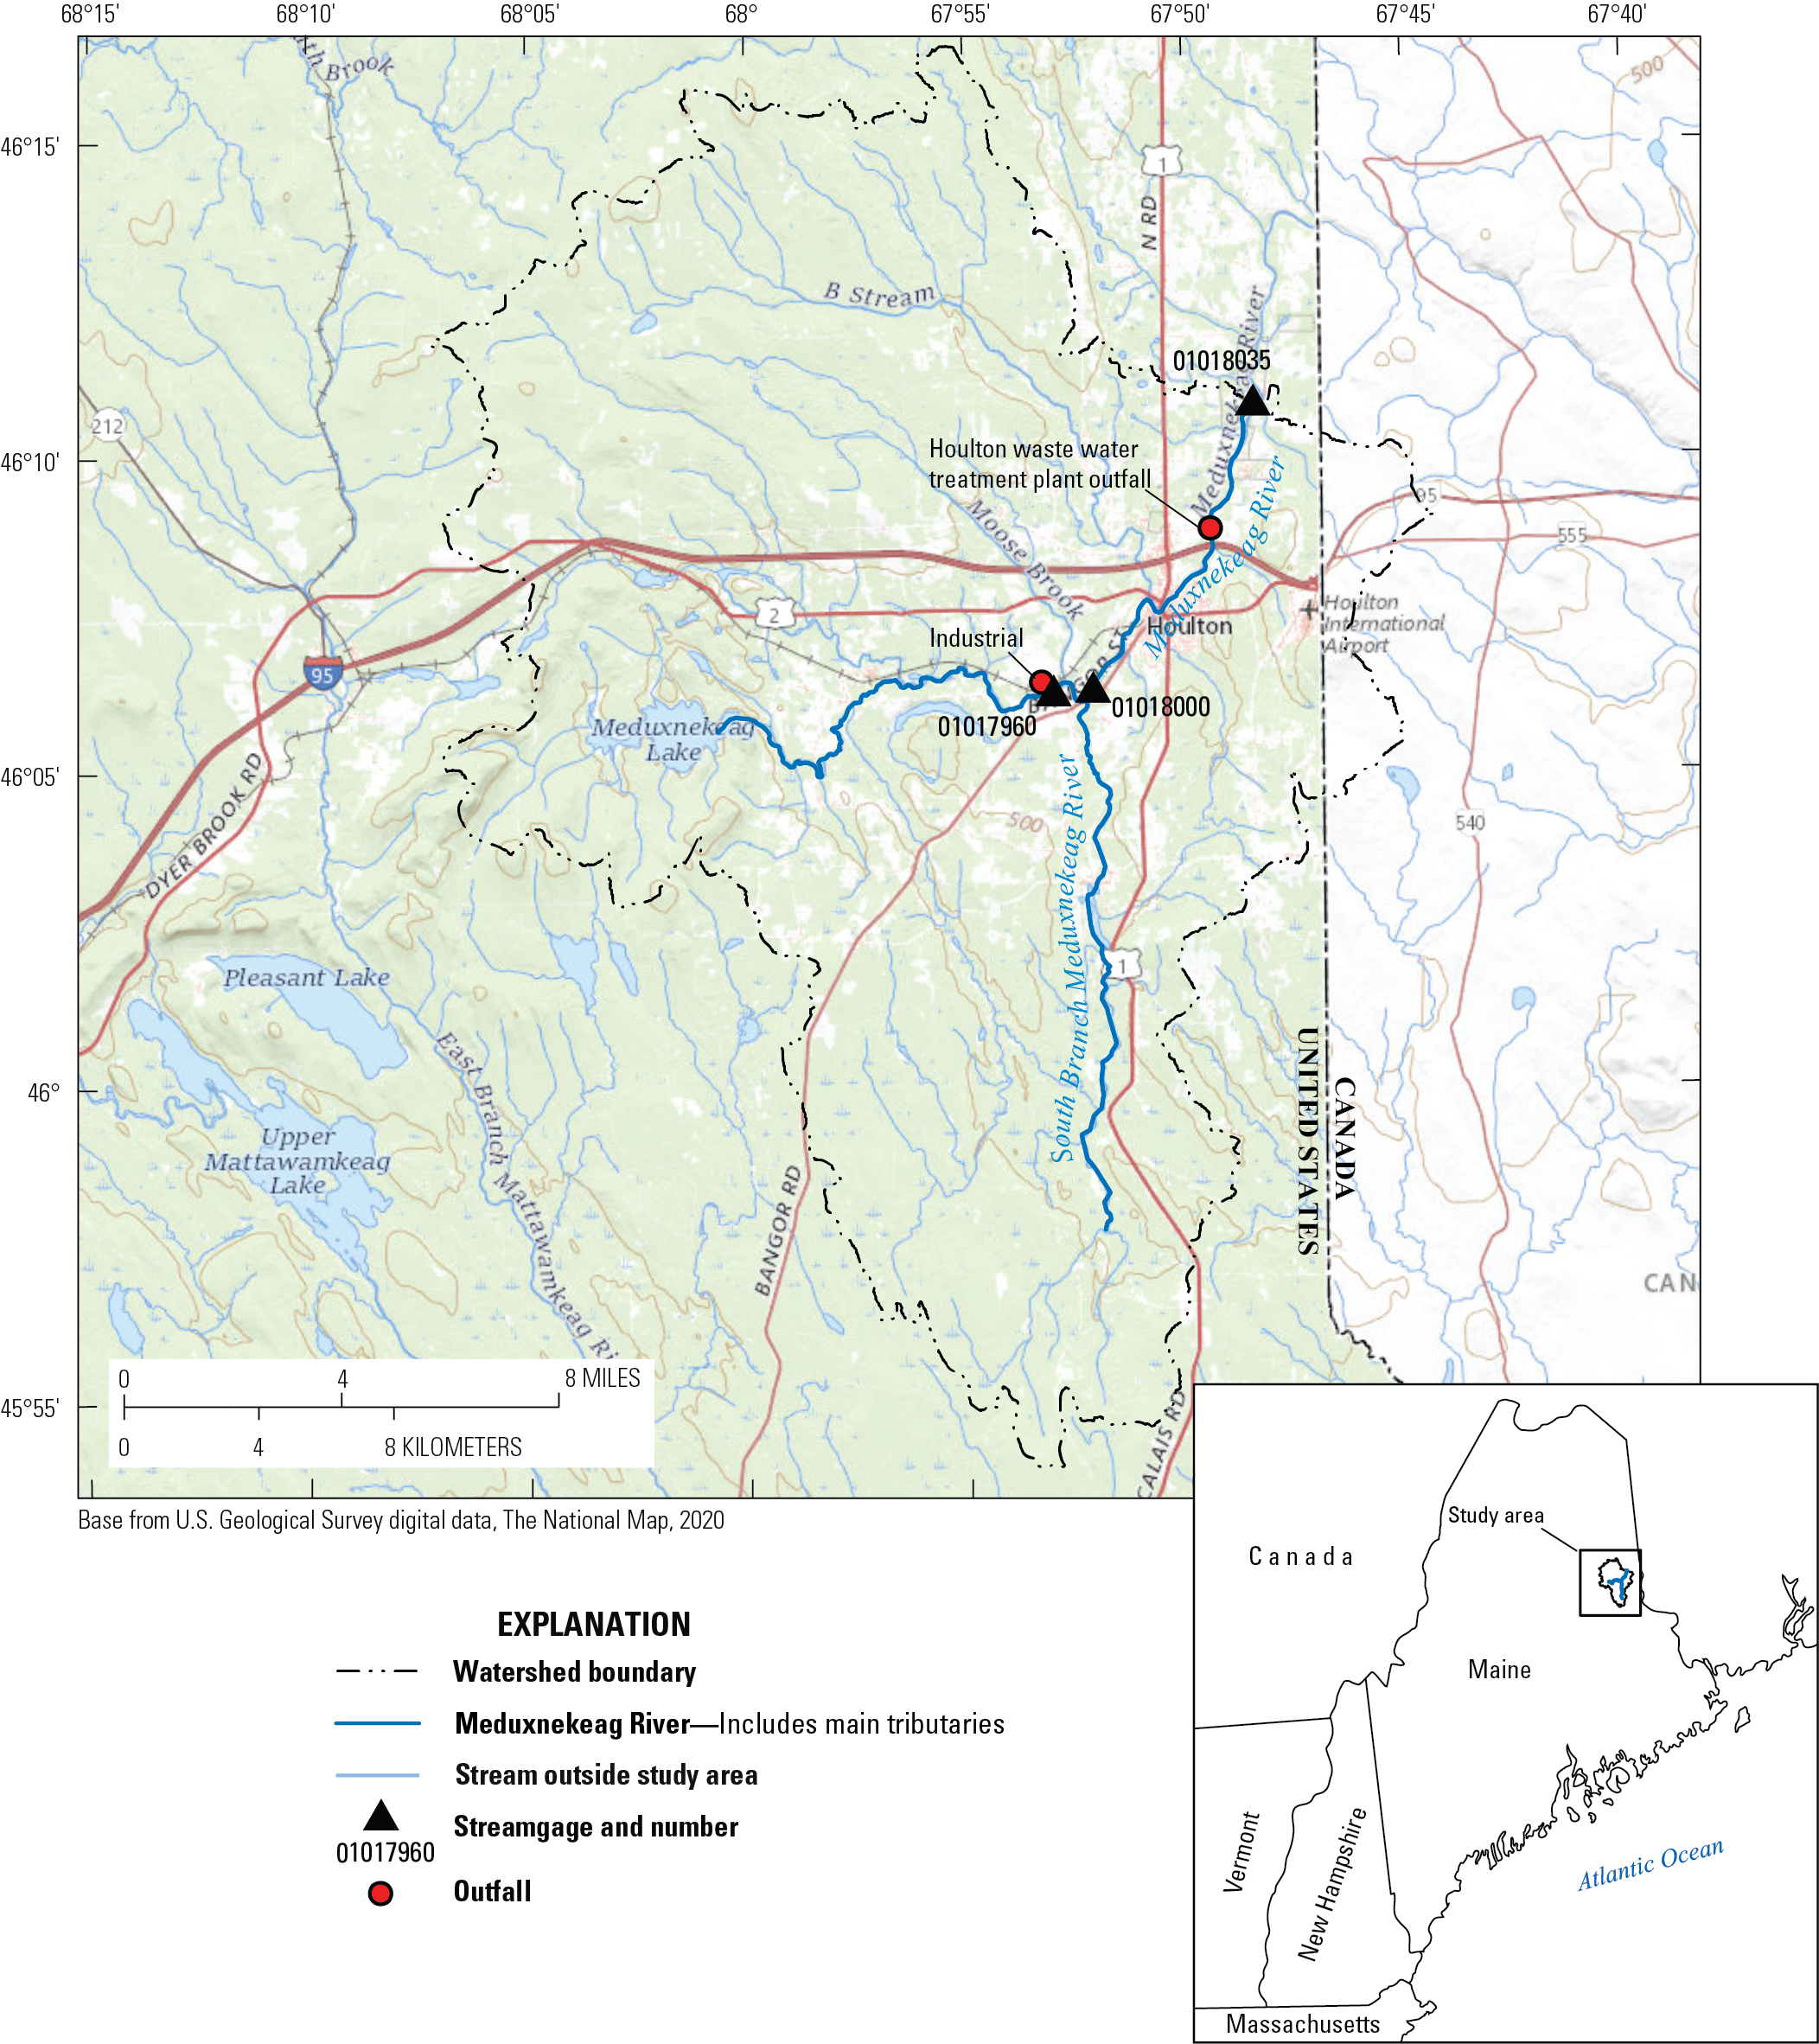
Map of the Meduxnekeag River watershed, Maine, showing locations of the three U.S. Geological Survey streamgages and the outfalls in the study area.
Stream Temperature Data
Stream temperature data were collected by the USGS at three USGS streamgages (fig. 3; table 2). Data for 8 years (2010–2018) of stream temperature data were used for calibration from the Meduxnekeag River at Lowery Road near Houlton, Maine streamgage. Because the other two streamgages had shorter records (only 2 years) of stream temperature data, these records were used in the evaluation of the model.
Data collected by the HBMI were also available for modeled stream temperature evaluation. The HBMI has a significant database of stream temperature data available. Of the data-collection stations (more than 100) managed by the HBMI, 7 were selected for use as additional evaluation sites because of their lengths of record and locations (fig. 4; table 3). With a few exceptions, the HBMI sites were operated only during the summer.
Table 3.
Houlton Band of Maliseet Indians stream temperature data-collection sites used in the evaluation of a model to simulate potential changes in hydrology and water temperature in the Meduxnekeag River watershed, Maine.[Data are from Olson (2021). Station locations are shown on figure 4. PRMS, Precipitation-Runoff Modeling System]
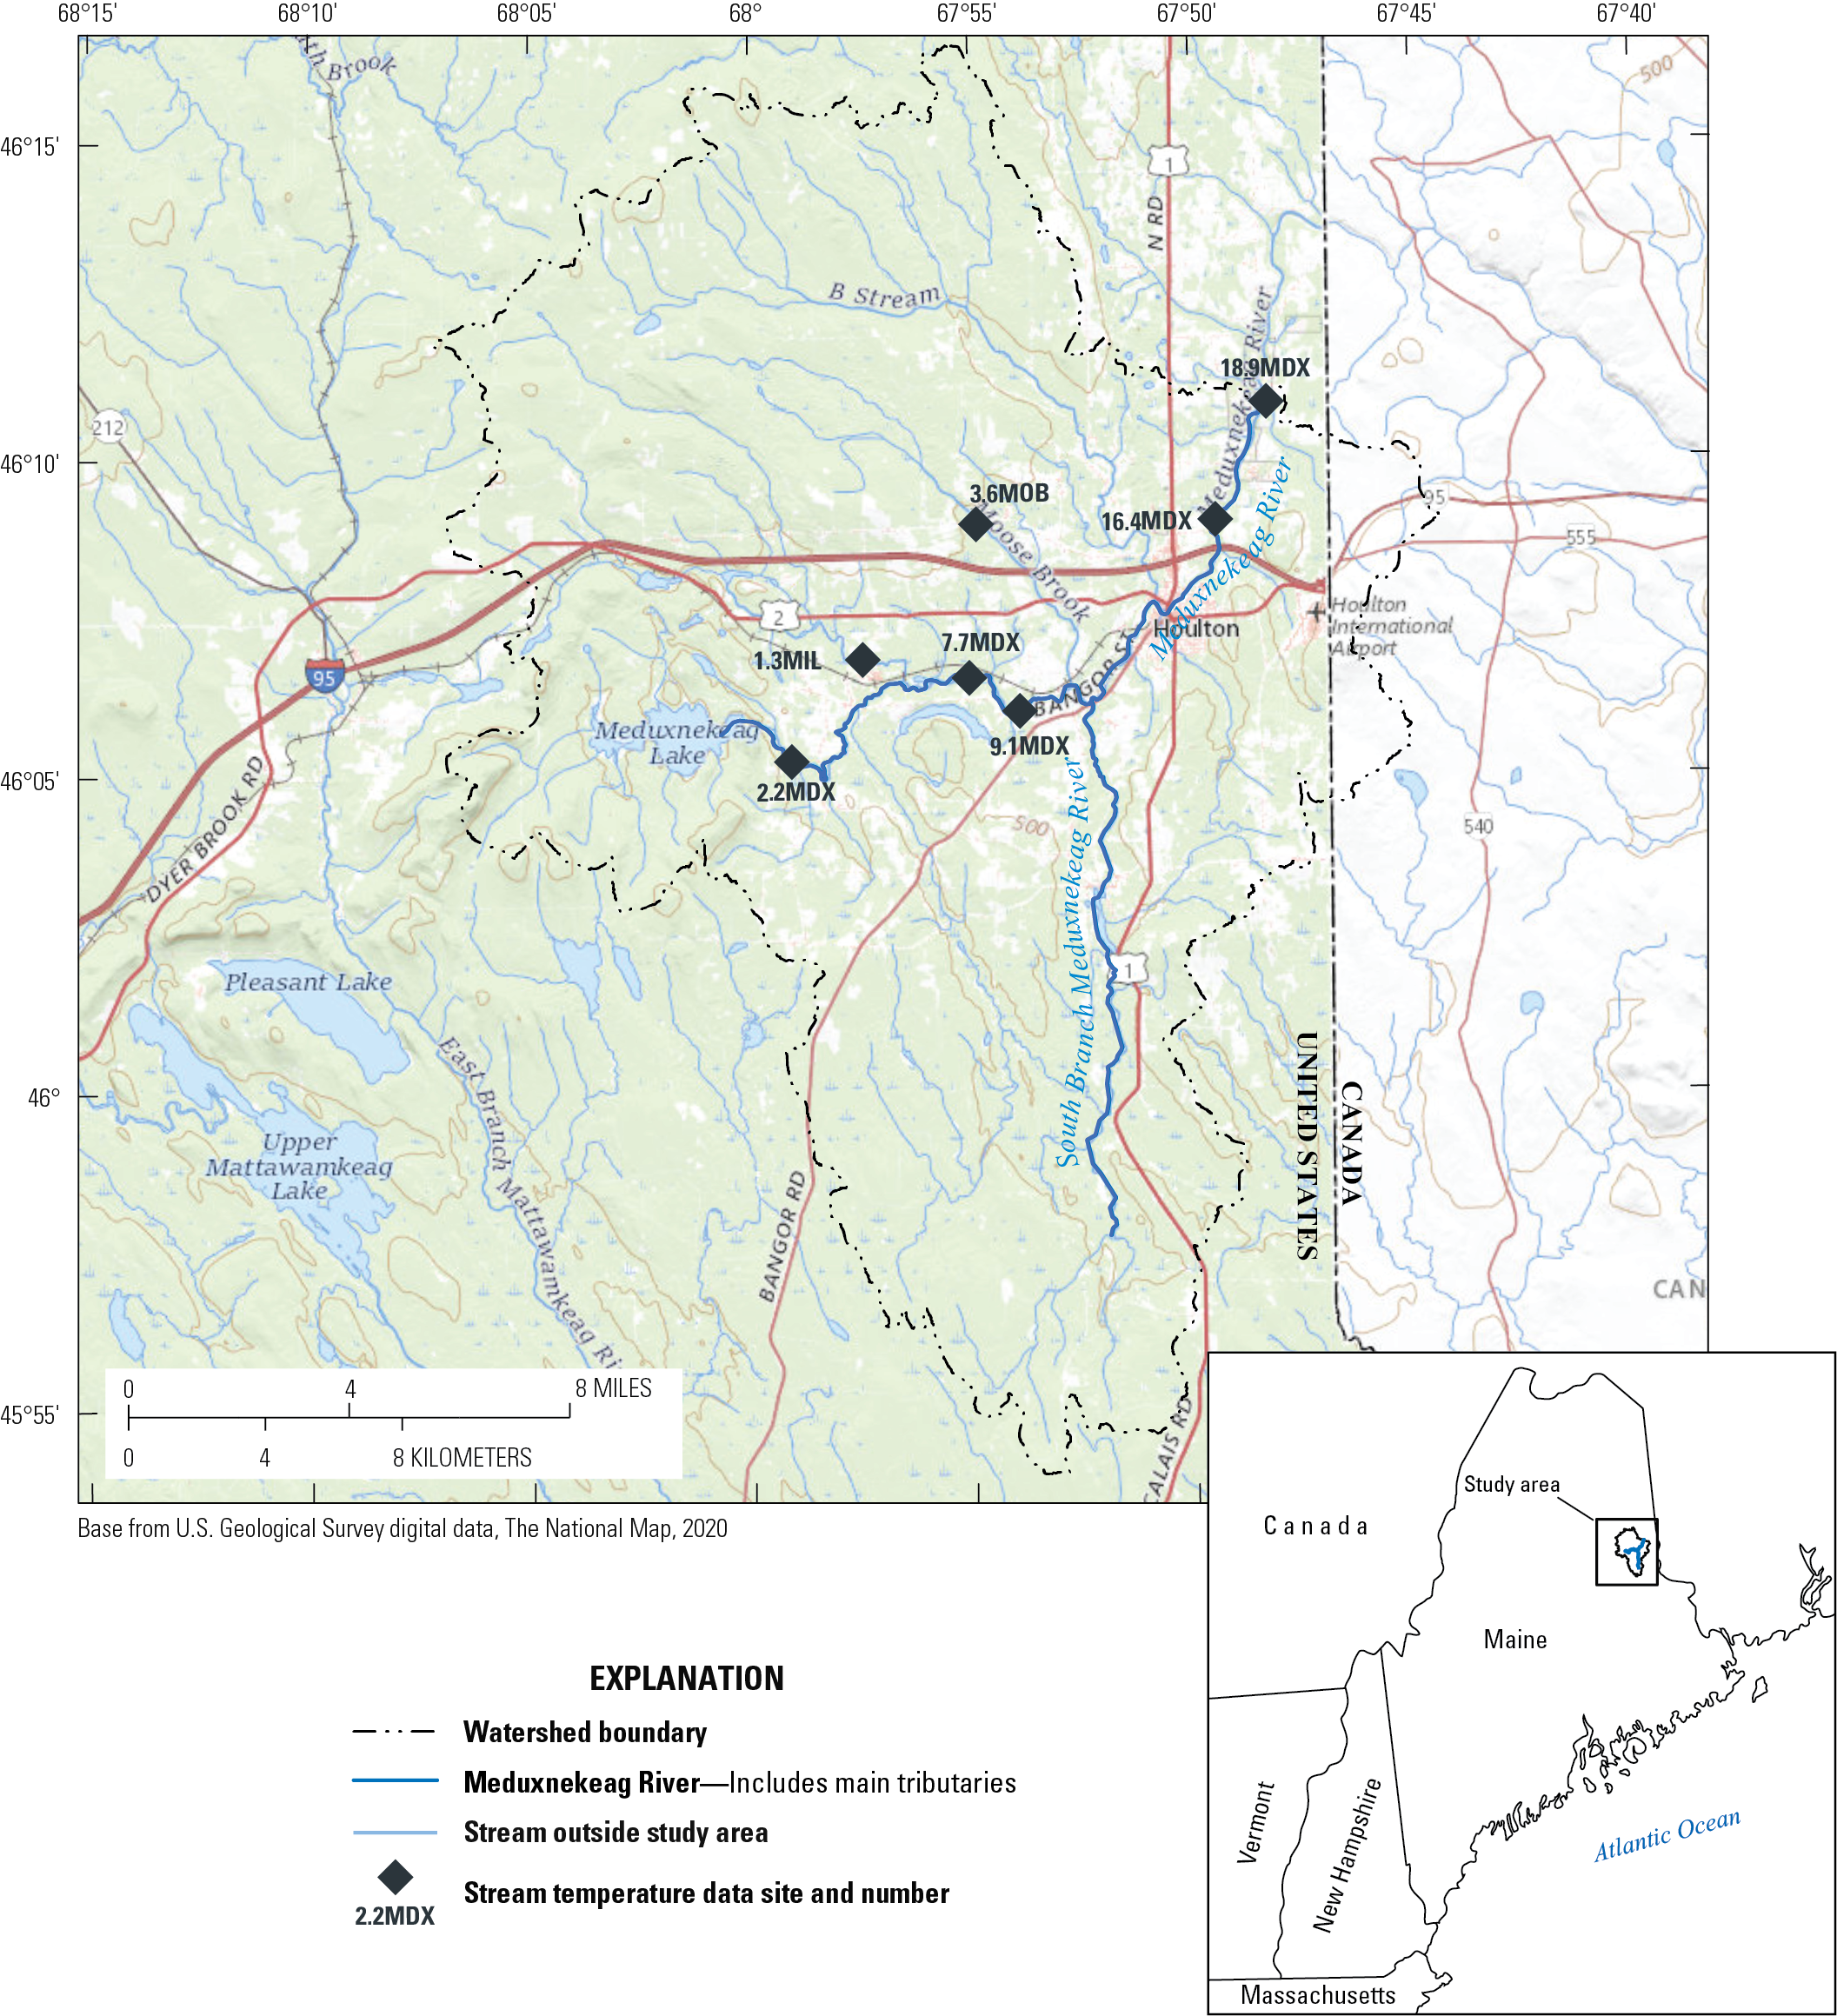
Map showing locations of the Houlton Band of Maliseet Indians (HBMI) stream temperature data collection sites used in the evaluation of a model to simulate potential changes in hydrology and water temperature in the Meduxnekeag River watershed, Maine.
Precipitation and Air Temperature Data
The PRMS uses daily precipitation totals and maximum and minimum daily air temperatures as input. The daily precipitation and air temperature data used for this model were obtained for a 37-year period (1980–2016) through the USGS Geo Data Portal (U.S. Geological Survey, 2011). The 37-year period provided time-series data of sufficient length to yield mean values and variability representative enough to ensure that inferential statistics would be meaningful.
Three national gridded weather-input datasets were evaluated for use in the model, including the University of Idaho daily meteorological data for the continental United States (UIdaho; Abatzoglou, 2011), gridded meteorological data for 1949–2010 (Maurer and others, 2002a, b38), and Daymet daily surface weather data (version 3; Thornton and others, 2016). These gridded data products were interpolated from station data, a process that can cause enough smoothing of the data to produce inaccurate time and magnitude values for local daily events; however, long-term averages are accurate (Thornton and others, 1997; Stahl and others, 2006; Oubeidillah and others, 2013; Di Vittorio and Miller, 2014).
The comparison of the three datasets showed that the temperature data were quite similar among all three; however, the daily precipitation for the Daymet data was markedly different from the other two datasets—showing more days with precipitation and higher precipitation values on average. From 1981 to 2010, for example, the Daymet, UIdaho, and Maurer datasets included 4,096, 3,204, and 2,887 days of precipitation, respectively. For the same period, the Daymet, UIdaho, and Maurer datasets included mean annual precipitation values of 46.45, 41.52, and 41.76 inches, respectively. The expected annual value of precipitation was about 41.5 inches; this value was derived from long-term records provided in Huntington and Billmire (2014) for watersheds in northern Maine adjacent to or near the Meduxnekeag River watershed.
The comparison also evaluated preliminary (before model calibration) evapotranspiration simulated by the PRMS. The simulated evapotranspiration estimates derived from the UIdaho and Maurer data were closer to the expected value of 17.5 inches annually reported in Huntington and Billmire (2014). Based on these comparisons, the UIdaho and Maurer datasets are considered to be the best for calibrating and simulating the current hydrologic conditions. The Maurer data, however, do not extend past 2010. Hence, the UIdaho dataset was used for this study because of the similarity to the Maurer data, because the expected values of both precipitation and simulated evapotranspiration were more similar to those reported in Huntington and Billmire (2014) and because the UIdaho dataset extends beyond 2010. It is important to note, however, that the UIdaho dataset shows the maximum daily rainfall as substantially lower than the rainfall values reported in the other two datasets, indicating that simulated peak flows might not be as high as they would be if the Maurer or Daymet data were used for the modeling.
Outfalls in the Stream Network
Two outfalls (fig. 3) divert water into the stream network. One is discharge from the Houlton wastewater treatment facility; the other is discharge from an industrial site. The mean of the discharge rate from the Houlton wastewater treatment facility was 1.7 cubic feet per second (ft3/s) from January 2013 to April 2018. The industrial site used a lower mean discharge rate of 0.05 ft3/s from January 2017 to August 2018, when it was discharging water.
The mean discharge of the Houlton wastewater treatment facility was added manually into the simulated streamflow downstream of the inflow point for model calibration. The discharge from the industrial site was ignored because it was insignificant to the calibration. Including the water temperature from the outfalls in the calibration was deemed unwarranted because (1) the magnitudes of the discharges from the outfall were small compared with the streamflow, (2) the temperature of the outfall discharge would not significantly differ from the expected stream temperature, and (3) the stream temperature at the outfalls was not known.
Climate Data for Future Projections
The daily precipitation and maximum and minimum air temperatures were modified to represent possible future climate conditions so that the model could be used to evaluate the effects that climate change might have on streamflow and stream temperatures. The input modifications projected a range of possible changes based on models for two representative concentration pathways (RCP) emission scenarios (RCP4.5 and RCP8.5, Stocker and others, 2013). RCP4.5 is a scenario during which greenhouse gases stabilize; RCP8.5 is a scenario where greenhouse gases continue to rise unchecked to the end of the century. The National Climate Change Viewer (U.S. Geological Survey, 2021a) was used to view the results of the means of 30 climate change models for the RCP scenarios in the Meduxnekeag River watershed. All scenarios projected the climate of the Meduxnekeag River watershed to become warmer and wetter.
Using the National Climate Change Viewer, a matrix of changes to daily precipitation and maximum and minimum air temperatures was assembled to represent a range of possible climate change scenarios from the present [2021] to the end of the century [2099]. To encompass potential future climate change, the matrix includes all combinations of the precipitation increasing by 0, 5, 10, and 15 percent and the maximum and minimum air temperature increasing by 0, 3.6, 7.0, and 10.4 °F. The increases in precipitation and temperature were applied to all the daily input values uniformly such that each daily value in the current conditions (baseline) input file (0 percent increase in precipitation and 0 °F increase in maximum and minimum daily temperature) was increased by 5, 10, and 15 percent and 3.6, 7.0, and 10.4 °F respectively.
These changes in climate were applied to the entire 37-year period (1980–2016) of available precipitation and maximum and minimum air temperature data. After applying the climate-related changes to the model, statistics of the results for each element in the matrix were compared with the model’s results for the 37-year period without climate change adjustments to evaluate the effects of each of the climate change scenarios.
PRMS Model Development
The PRMS can be parameterized at a wide range of scales with any scheme for subdividing the modeled area, provided that the subdivisions correspond to watershed boundaries. PRMS simulations are based on the spatial variation in measurable physical characteristics—including land cover, topography, soil, and geology—that can be quantified by using GIS. The PRMS simulates evapotranspiration, surface runoff, groundwater-storage flux, snow cover, snowmelt, and streamflow, as well as other hydrologic variables. The PRMS computes these water-balance variables for all subdivisions (HRUs) that compose the watershed of interest. Once the initial parameterization was complete (see “Initial PRMS Parameterization” section of this report), and the precipitation, temperature, and streamflow data were compiled, the model was calibrated.
PRMS Calibration
Once the initial parameters were established, and the model was running, the model was calibrated by adjusting key water-balance and routing parameters (table 1), including the coefficients used to simulate potential evapotranspiration, travel time within the stream network, and the rate of release from the groundwater reservoir. Several parameters that were initialized by extrapolation from the HRUs in the regional model were calibrated subsequently.
The Meduxnekeag River watershed includes three USGS streamgages, each of which has a length of record greater than 10 years (table 2). The entire available records from the streamgages were used for calibration or evaluation. The model was calibrated on the most recent data from the downstream streamgage (Meduxnekeag River at Lowery Road near Houlton, ME, 01018035) and then evaluated on the two upstream streamgage records. The calibration process used the automated calibration software LUCA (Hay and Makiko, 2006), with the objective function being either the normalized root-mean-square error of discharge estimates or the Nash-Sutcliff efficiency of discharge estimates (table 1).
In addition, the manual calibration was done based on model performance. This included manual adjustments on parameters calibrated by the LUCA software. The calibrated parameters were assigned values that are physically reasonable on the basis of modeling experience (Bjerklie and Sturtevant, 2017). The outfall discharge from the Houlton wastewater treatment facility (fig. 3) was considered in the calibration by adding the mean outfall discharge (1.7 ft3/s) to the simulated natural discharge from the watershed. The discharge from other outfall was not used in the calibration because the average discharge of available data was less than 0.1 ft3/s.
The model’s calibration was evaluated on the basis of matching general water-balance information and goodness-of-fit statistics for simulated streamflow compared with USGS measured streamflow. The goodness-of-fit statistics included the Nash-Sutcliffe efficiency (NSE) statistic (Nash and Sutcliffe, 1970). Following Moriasi and others (2007), an NSE of 0.5 or greater is considered a satisfactory or good fit between the simulated and measured hydrographs, and an NSE of 0.4 to 0.5 is considered marginally satisfactory. Values of NSE less than 0.4 are considered unsatisfactory.
Additional goodness-of-fit statistics included the normalized root-mean-square error (NRMSE, normalized on the difference between the maximum and minimum values in the record) and the percent bias (PBIAS). A comparison of flow-durations and low-flow statistics was also used for evaluating model performance. The evaluation statistics were based on similar measures. The use of the upstream streamgages for evaluation enabled an assessment of how well the model provided information distributed across the watershed.
Stream Temperature Module
The stream temperature module in the PRMS was developed to provide a method to simulate mean daily stream water temperatures along a network of stream segments defined in the PRMS (Sanders and others, 2017). The computational methods in the stream temperature module are based on the Stream Network Temperature model originally developed by Theurer and others (1984) at the U.S. Fish and Wildlife Service and subsequently described by Bartholow (2010).
The stream temperature module routes stream temperatures downstream, accounting for reach-scale processes that alter the temperature balance. Groundwater temperature is estimated by balancing the mean annual air temperature with the daily air temperature fluctuation. Land-cover, humidity, evapotranspiration, solar radiation, and canopy cover parameters are employed in the module. The stream temperature module computes mean and maximum daily water temperatures for each stream segment defined in a PRMS.
Parameterization and Calibration of the Temperature Module
The stream temperature module uses information from the PRMS model to assign physical parameters to each stream segment. This information includes characteristics of each stream segment as the slope of the stream segment, the aspect of the channel, and shading of the stream channel as determined by the density of the vegetative cover. Several key parameters that affect stream temperature are not calibrated as part of the PRMS hydrologic-model calibration. These key parameters include the stream width and the temperature contribution determined by the residence time in the groundwater (gw_tau) and in the subsurface (ss_tau) discharge reservoirs (table 4). These parameter values were computed directly from physical relationships derived for the stream channel or were calibrated manually.
Table 4.
Calibrated water temperature module parameters for the Precipitation-Runoff Modeling System for the Meduxnekeag River watershed, Maine.[Data are from Olson (2021). The Precipitation-Runoff Modeling System is from Leavesley and others (1983) and Markstrom and others (2015). HRU, hydrologic response unit]
The width of the stream segment is a critical parameter for estimating the stream temperature because it determines the surface area over which heat is exchanged with the atmosphere. The stream width was estimated by deriving a width-discharge relation that used data from the three USGS streamflow gages located within the watershed, and then extrapolated to each stream segment on the basis of the slope and elevation of the stream segment. Similarly, a relation between the groundwater and subsurface model-routing parameters was developed on the basis of slope and elevation measurements and was then used to distribute these parameter values to each HRU.
Final calibration for the stream temperature module was completed by manually, adjusting the effective stream width and the residence time in the groundwater- and subsurface- discharge reservoirs. Evaluations of the calibration runs were based upon matching the mean and standard deviations of the open-water temperatures at the downstream USGS gage, maximizing the NSE, and minimizing the NRMSE. The temperature data from the two upstream USGS streamgages and those collected by the HBMI at selected locations were used to evaluate the model results. The entire period of record available for the water temperature measuring sites was used for calibration and evaluation.
Several important considerations need to be made when the calibration and evaluation of the temperature simulations are interpreted. First, the model simulates a mean temperature for the stream segment, whereas the observed temperatures are point measurements that might differ from the mean along the reach. Second, the model does not simulate temperatures of water below ice cover or when significant ice is present; as a result, measurements made during ice-cover periods are not reliable. And third, for stream segments below the outfalls, the effects of the outfalls on the temperatures of water from the outfalls to downstream reaches were not included in the simulated stream temperatures.
Discussion of Results from the Calibrated Model
Records from the streamgage used for calibration (USGS station 01018035; fig. 3; table 2) included at least 10 years of daily-discharge data that were not significantly affected by lake and reservoir storage or water diversions. The PRMS simulated long-term water balance (more than 10 years, 2005–2016) for the watershed upstream from the calibration gage showed values for annual precipitation, evapotranspiration, and runoff to be well within the expected ranges. The mean annual precipitation input to the model from the UIdaho dataset was 41.3 in.; the expected value for the Meduxnekeag River watershed was 41.6 to 43.4 in. (Huntington and Billmire, 2014). The mean annual evapotranspiration computed by the model for the watershed was 15.0 in.; the expected value was 12.6 to 16.8 in. (Maine Geological Survey, 2018). The mean annual runoff simulated by PRMS was 26.3 in., slightly larger than the expected range of 24.4 to 25.8 in. (Huntington and Billmire, 2014). These results indicated that the long-term water balance in the model is satisfactory.
Other outputs such as groundwater recharge and snow water equivalent were also within expected magnitudes. The mean annual groundwater recharge simulated by PRMS was 12.0 inches per year (in/yr). This value falls within the approximate 95 percent confidence interval of 11.7 to 23.1 in/yr of recharge reported by Nielsen and Westenbroek (2019) and is somewhat more than the estimates from Huntington and Billmire (2014) that range from 4.1 to 8.3 in/yr of recharge. Given the ranges of these independent estimates, the PRMS-simulated mean annual recharge is considered to be within expected magnitudes. Finally, the mean annual snowfall in inches of snow water equivalent simulated by the model was 7.1 in.; the expected value is 7 to 9 in. (Loisell and Hodgkins, 2002; Hodgkins and Dudley, 2006).
Results and Evaluation of a PRMS Hydrologic-Model Streamflow Simulation
In addition to the general water balance, the calibrated model simulations were compared with the population of simulated streamflows with the USGS measured streamflows with the NSE statistic, the PBIAS, the NRMSE expressed as a percent, and the log residual of the simulated minus the measured streamflow. The mean and the standard deviation of the log residual reduce the weight (influence) of low- and- high-streamflow errors and thus provide a better picture of the typical residual error of a time series in which the daily and monthly residual errors are averaged.
The model showed very good simulation of the mean streamflow at all the streamgages after the calibration (fig. 5; table 5). The error for the mean-annual simulated daily streamflows for both the calibration and evaluation streamgages was less than 2.5 percent, which indicates that the regional annual water balance, on average, was well simulated. The mean percent differences and range of differences in this study are similar to the differences calculated for other calibrated PRMS models developed for complex terrain where the data were used to simulate hydrologic conditions and assess hydrologic change (Koczot and others, 2005; Chase, 2011).
Table 5.
Statistics calculated for streamflows at U.S. Geological Survey streamgages and Precipitation-Runoff Modeling System-simulated streamflows for the Meduxnekeag River watershed, Maine.[Data are from Olson (2021). Locations of streamgages are shown in figure 3. Evaluation streamgages are listed in downstream order. percentile streamflows are the percentage of streamflows in the record that exceed the listed streamflow value. ft3/s, cubic foot per second; PRMS, Precipitation-Runoff Modeling System; NRMSE, normalized root-mean-square error; NSE, Nash-Sutcliffe efficiency coefficient]
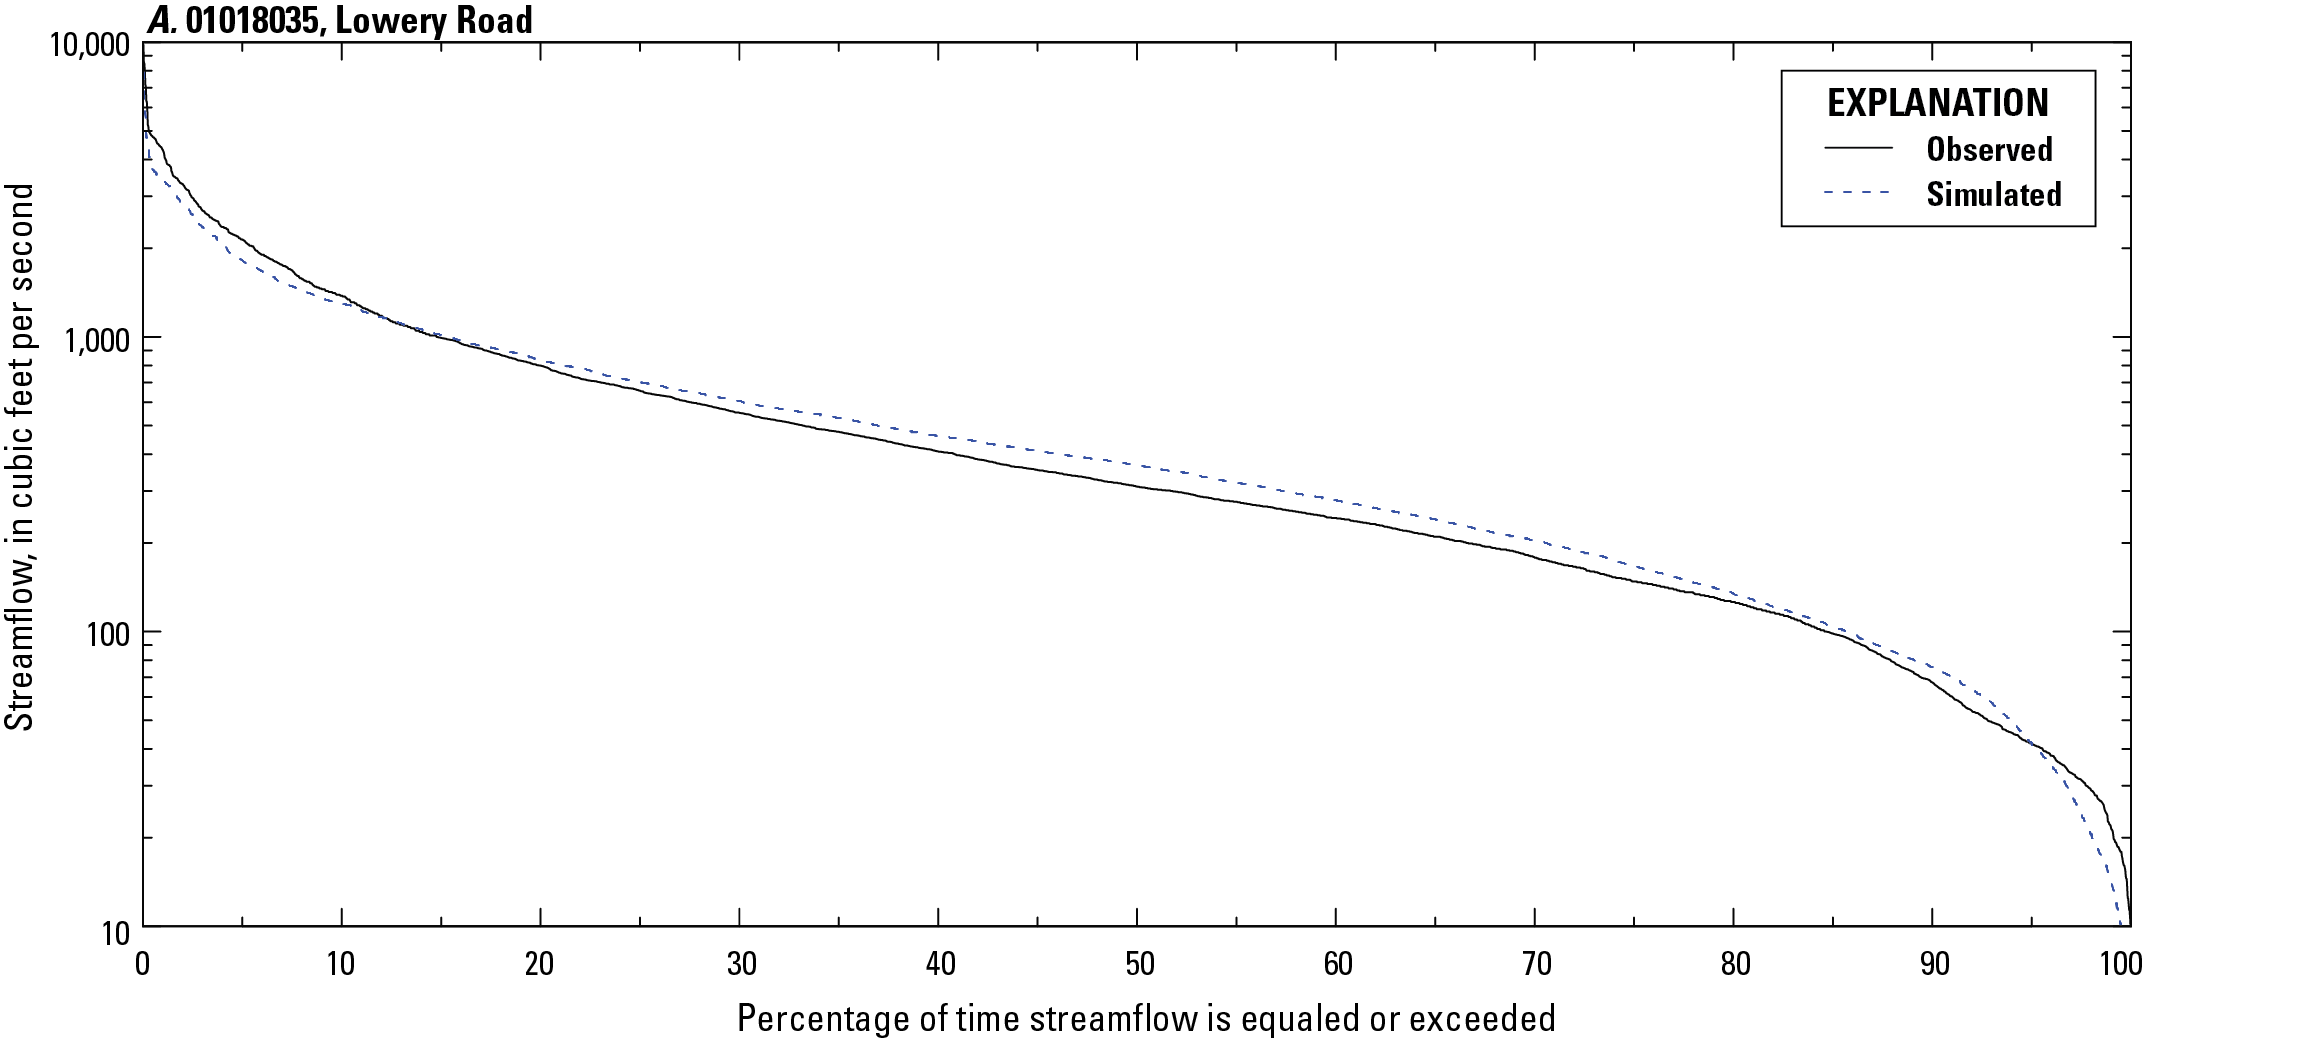
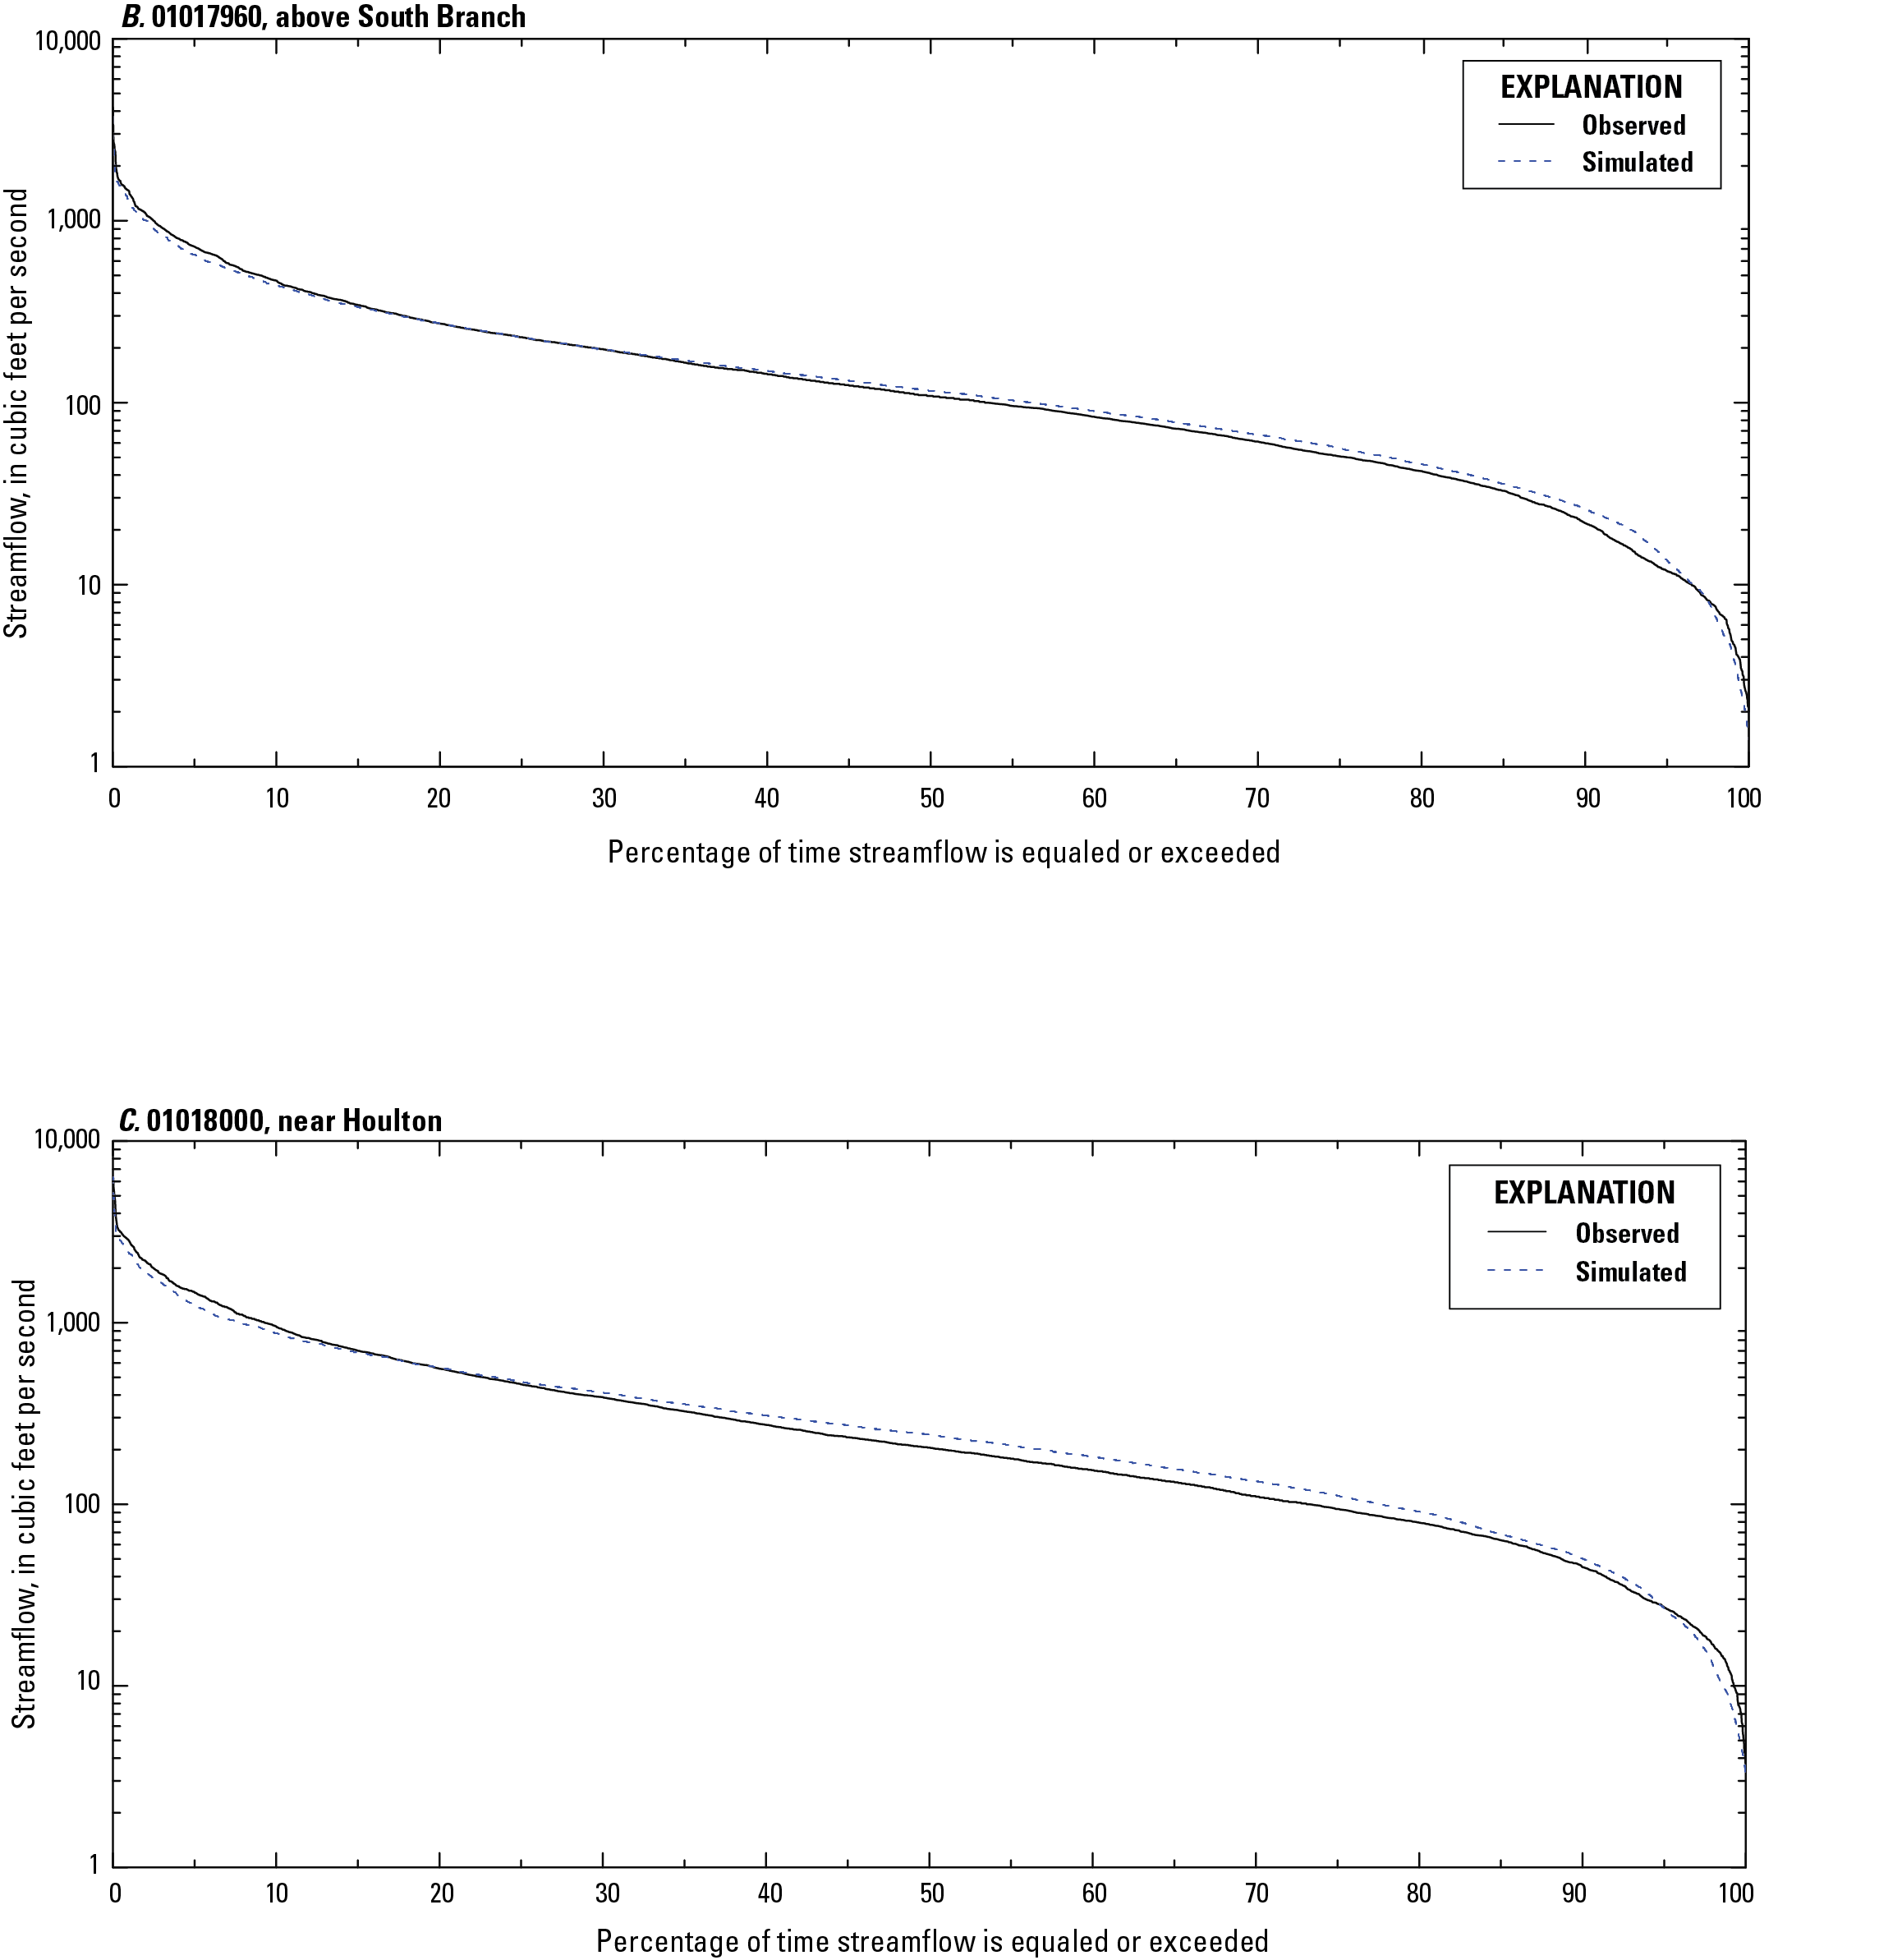
Graphs showing U.S. Geological Survey (USGS)-measured and Precipitation-Runoff Modeling System (PRMS)-simulated streamflow-duration curves for A, the calibration streamgage 01018035 and the evaluation streamgages B, 0101796 and C, 01018000 in the Meduxnekeag River watershed, Maine.
The NSE, log residual, PBIAS, and NRMSE characterize the overall error and bias in the simulated hydrographs compared with the measured hydrographs. The NSE statistic is a measure of how well a simulated dynamic time series (streamflow hydrograph) fits the measured time series during the period of record relative to the mean, accounting for timing and quantity. A value of 1 for the NSE indicates that the simulated and measured time series are identical, and a value of 0 indicates that the simulated time series provides as much predictive information as the mean of the measured time series alone. As previously stated, an NSE statistic of 0.5 or higher indicates a satisfactory or “good” calibration; 0.4 to less than 0.5, a marginal or “fair” calibration; and less than 0.4, a relatively “poor” calibration (Moriasi and others, 2007). For this study, a mean log residual less than 0.04 indicates an overall error of approximately 10 percent or less and is considered a good (satisfactory) calibration; an NRMSE of less than 10 percent is considered satisfactory; and a PBIAS higher than 20 percent was considered to represent a fair or poor simulation (Moriasi and others, 2007).
Whereas the calibration statistics listed in table 5 show that the simulation has a good calibration on the basis of the NSE, PBIAS, NRMSE, and mean log-residual, the error of the standard deviation of the log residuals and the relatively large percent error (compared with the mean statistics) of the standard deviations (more than 10 percent) indicates that the simulation is not representing the range of flows as well as it is representing the mean and timing of the streamflow. This error is the result of the large relative errors at both the high and low ends of the streamflow distribution (fig. 5; table 5).
The larger error on the high end of the discharge range might be explained from the precipitation-input record, which indicates that the most extreme precipitation events were not captured well by the UIdaho gridded dataset (see “Precipitation and Air Temperature Data” section of this report). Relatively large errors on the low end of discharge may be explained by the oversimplification of the groundwater-flow system in the PRMS model, as well as the fact that a small absolute error at the low end may translate to a very large percent error. Given the overall good calibration and the difficulty of simulating with high accuracy both the low and high end of the discharge range (as well as directly measuring these extremes), the overall model simulation is considered well suited for extrapolation. Given the physically based model and parameter structure, the climate change simulations are likely to be consistent with the hydrologic processes in the watershed; as such, the changes in streamflow and stream temperature relative to the baseline (current) conditions may also be considered relatively reliable.
Results and Evaluation of Stream Temperature Simulation
Water temperatures simulated by the calibrated model were compared with the population of USGS measured temperatures. The results were evaluated with the NSE statistic, the PBIAS, and the NRMSE expressed as a percent. The model showed very good simulation of the mean water temperatures at all the streamgages after the calibration (table 6). The error for the mean annual simulated daily water temperatures at the calibration streamgage was less than 1 percent. The error for the mean simulated daily water temperature at the evaluation streamgages with only two summers of data was less than 5 percent, which indicates that the temperature was well simulated. The NSE for the simulated daily water temperature at the calibration site was 0.975; NSE values of 0.577 and 0.795 at the evaluation sites indicate satisfactory simulations.
Water temperature statistics for U.S. Geological Survey streamgages and Precipitation-Runoff Modeling System simulations for the Meduxnekeag River watershed, Maine.
Water temperature statistics for U.S. Geological Survey streamgages and Precipitation-Runoff Modeling System simulations for the Meduxnekeag River watershed, Maine
[Data are from Olson (2021). Locations of streamgages are shown in figure 3. Evaluation streamgages are listed in downstream order. °F, degree Fahrenheit; PRMS, Precipitation-Runoff Modeling System; NRMSE, normalized root-mean-square error (normalized on the mean); NSE, Nash-Sutcliffe efficiency coefficient]
Water temperature data collected by the HBMI were also compared with PRMS-simulated water temperature data for the stream segment where the HBMI station was located. The means compared well (table 7), with the percent errors of the mean being less than 5; however, the means of most of the PRMS-simulated water temperatures were lower than the means of the HBMI-measured water temperatures. The NSE coefficients varied greatly from 0.073 to 0.927. A low NSE coefficient (<0.4) indicates poor relationship between the records in terms of timing and magnitude. The statistics in table 7 indicate that the PRMS simulated the HBMI temperature data poorly in some stream locations and well in other locations. The reason for the poor relationships in water temperature could be that the model simulates a mean temperature for an entire stream segment, whereas the observed temperatures are point measurements that may vary from the mean for the reach, particularly if these measurements were made near the shore in shallow water or outside the main flow.
Water temperature statistics from the Houlton Band of Maliseet Indians water temperature collection stations and Precipitation-Runoff Modeling System simulations for the Meduxnekeag River watershed, Maine.
Water temperature statistics for the Houlton Band of Maliseet Indians water temperature collection stations and Precipitation-Runoff Modeling System simulations for the Meduxnekeag River watershed, Maine
[Data are from Olson (2021). Locations of stations are shown on figure 4. °F, degree Fahrenheit; PRMS, Precipitation Runoff Modeling System; NRMSE, normalized root-mean-square error (normalized on the mean); NSE, Nash-Sutcliffe efficiency coefficient]
Simulating the Effects of Projected Air Temperature and Precipitation Changes on Streamflow and Water Temperature
To use the model to evaluate the projected effects that climate change could have on streamflow and stream temperatures, the daily precipitation and maximum and minimum daily air temperatures input to the model were modified to represent possible future climate conditions. The input modifications projected a range of possible changes as described in the “Climate Data for Future Projections” section of this report.
To encompass future potential climate changes to daily precipitation and maximum and minimum air temperatures through the end of the century, a matrix of the combinations of the precipitation increasing by 0, 5, 10, and 15 percent and the maximum and minimum air temperatures increasing by 0, 3.6, 7.0, and 10.4 °F was used. These climate-related changes were applied uniformly to the entire 37-year period (1980–2016) of available precipitation and maximum and minimum air temperature data.
Since the algorithms in the PRMS model use the meteorological input data to estimate the daily solar radiation, changing the meteorological inputs would affect the model-estimated solar radiation; however, solar radiation should not be expected to increase above calibrated maximums caused by climate-related increases in temperature. Solar radiation, however, could theoretically be affected by an increase in precipitation, particularly on days when the precipitation was historically small and unlikely to have produced cloud cover all day; the same day under a future scenario with greater precipitation, however, might be expected to have greater cloud cover. For these reasons, it was deemed important to not allow solar radiation to change due to the increases in temperature but to allow solar radiation estimates to change due to increases in precipitation. To accomplish this, the PRMS model was first run for each of the selected precipitation change scenarios, and the daily solar radiation was output. The solar radiation dataset for each of the precipitation scenarios were then used as inputs for the model runs that included changes in temperature, and the algorithm that computes solar radiation from air temperature and precipitation was not used.
After running the climate change scenarios with the PRMS, statistics of the results for each element in the matrix were computed so that comparisons could be made with the statistics of the results computed by the model for the 37-year period without climate change adjustments. For each of the calibration and evaluation streamgage sites, the streamflow statistics that were computed included mean annual streamflow, mean annual maximum streamflow, mean annual 7-day low streamflow, mean annual minimum streamflow, and mean monthly streamflows for each month of the year (tables 8–10).
Table 8.
Streamflow statistics for selected climate change scenarios at the site of the U.S. Geological Survey streamgage 01018035 Meduxnekeag River at Lowery Road near Houlton, Maine.[Data are from Olson (2021). Location of streamgage is shown on figure 3. ft3/s, cubic foot per second; °F, degree Fahrenheit]
Table 10.
Streamflow statistics for selected climate change scenarios at the site of the U.S. Geological Survey streamgage 01018000 Meduxnekeag River near Houlton, Maine.[Data are from Olson (2021). Location of streamgage shown on figure 3. ft3/s, cubic foot per second; °F, degree Fahrenheit]
Table 9.
Streamflow statistics for selected climate change scenarios at the site of the U.S. Geological Survey streamgage 01017960 Meduxnekeag River above South Branch Meduxnekeag River near Houlton, Maine.[Data are from Olson (2021). Location of streamgage shown on figure 3. ft3/s, cubic foot per second; °F, degree Fahrenheit]
Overall, mean annual streamflow and mean annual maximum streamflow increased with increasing precipitation and decreased with increasing air temperature (tables 8–10). At the outlet of the watershed, which corresponds to the Meduxnekeag River at Lowery Road near Houlton, Maine USGS streamgage (01018035; fig. 3), the mean annual streamflow increased from 489 ft3/s to 603 ft3/s (25 percent above baseline) with a 15 percent increase in precipitation (table 8). With a 15 percent increase in precipitation and an increase in air temperature of 10.4 °F, the streamflow increased by 17 percent above baseline (to 572 ft3/s), indicating that the increasing temperature resulted in more water loss through evapotranspiration compared with the water loss expected with no temperature increase.
The mean annual maximum streamflow increased from 3,870 ft3/s to 4,670 ft3/s with a 15 percent increase in precipitation but then decreased to 3,550 ft3/s when an increase of 10.4 °F in air temperature was also applied (table 8). The result was an 8.3 percent decrease in mean annual maximum streamflow with both the 15 percent increase in precipitation and a 10.4 °F increase in air temperature. These results are consistent with findings of Hodgkins and Dudley (2013) and can be explained by increased temperatures that have reduced the amount of snow available in storage during the spring melt and runoff, which is when the maximum streamflows typically occur.
One of the most pronounced changes in streamflow was the change in mean monthly discharges when air temperature inputs increased. When air temperature was increased, there was an increase in mean monthly streamflow during the winter months and a decrease in mean monthly streamflows during the spring months (fig. 6). For example, at the streamgage site Meduxnekeag River at Lowery Road near Houlton, Maine (01018035) at the outlet of the studied watershed, with no change in precipitation and an increase of 10.4 °F in air temperature, the mean streamflow in February increased from 124 ft3/s to 570 ft3/s, and the mean streamflow in April decreased from 1,480 ft3/s to 502 ft3/s—an increase of 360 percent and a decrease of 66 percent, respectively. Although the PRMS produced relatively large errors in both the low and high ranges of streamflow, the relative increases and decreases in streamflow above the baseline condition are considered possible. It should be noted that the mean streamflow in February for the observed data (not shown on fig. 6) collected by the streamgage at the outlet of the studied watershed (Meduxnekeag River at Lowery Road near Houlton, ME, 01018035) was 293 ft3/s. Although the winter simulations may be highly uncertain, it is still important to note that an increase in the air temperature of 10.4 °F resulted in the month with the greatest monthly streamflow changing from April to December. This seasonal redistribution of stream flow with climate change is consistent with other studies in Maine (Dudley and others, 2012) and represents an expected decrease in winter snowpack water equivalent as larger percentages of precipitation fall as rain during the winter months.
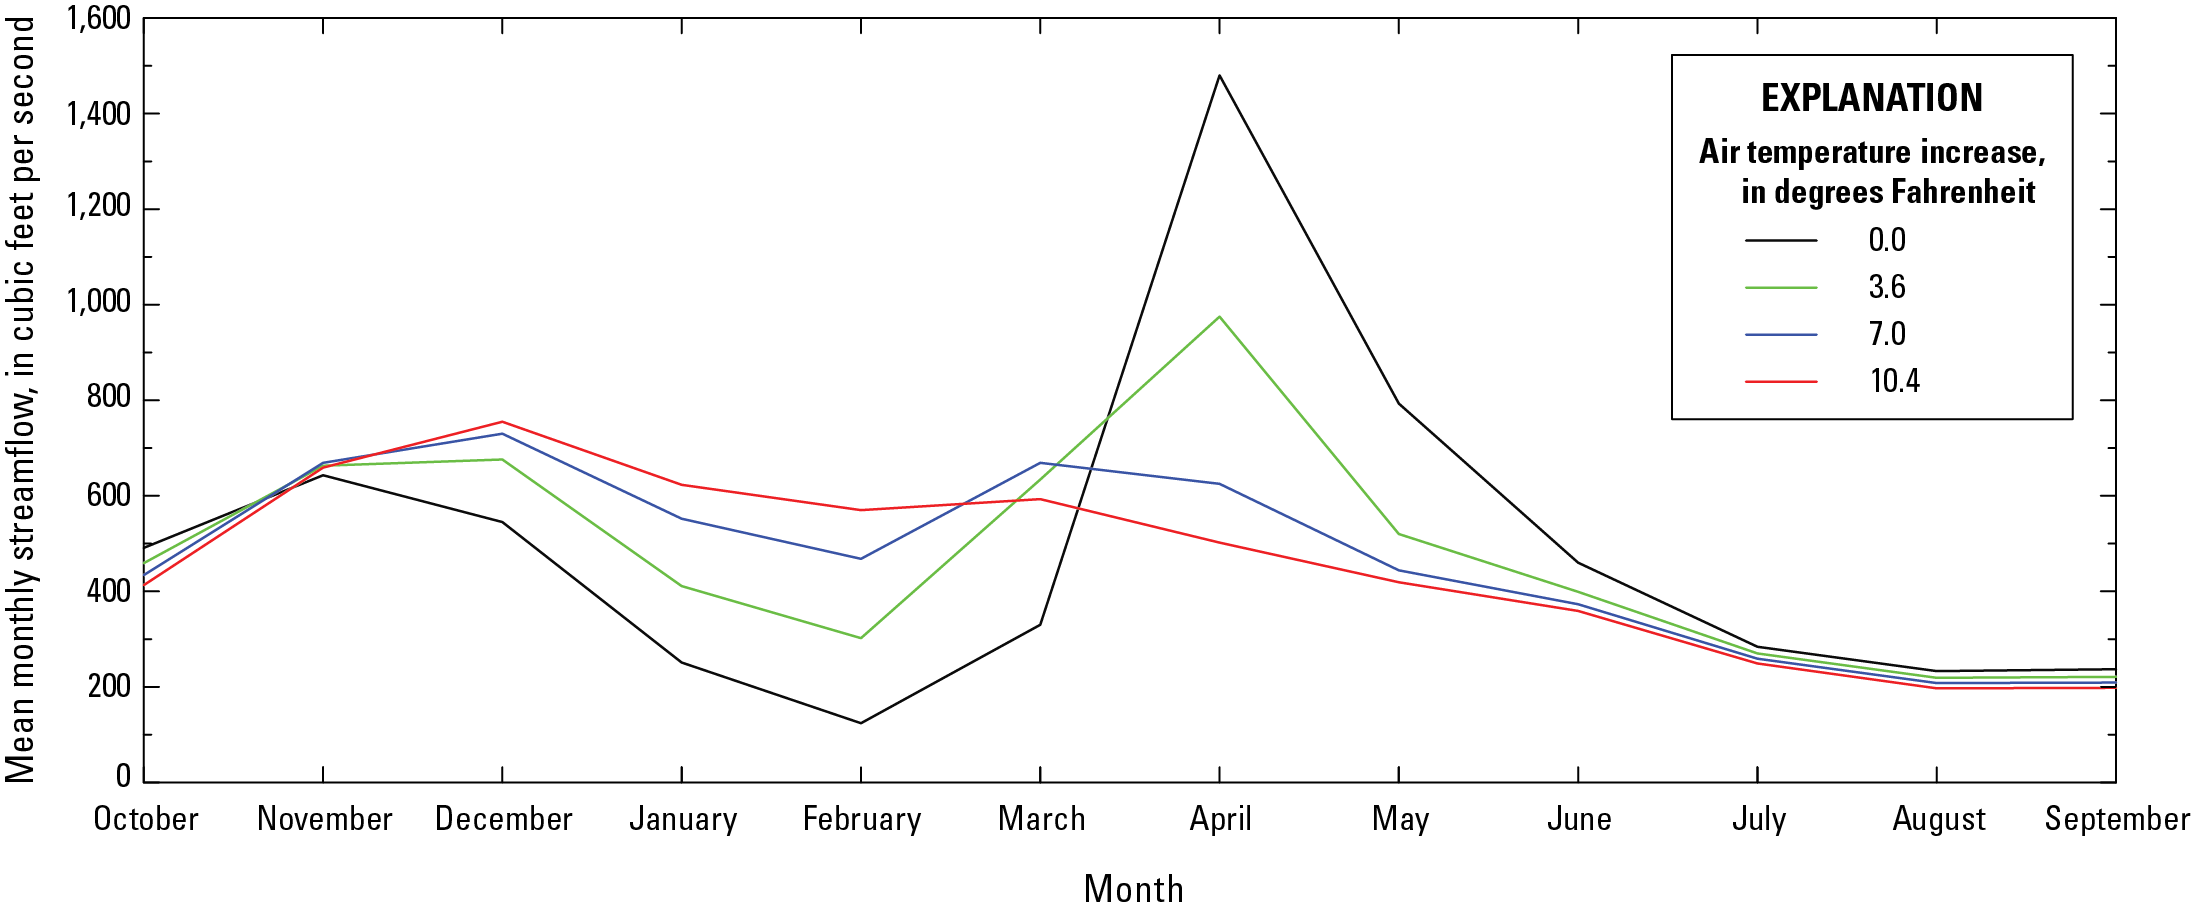
Graph showing mean monthly streamflow at the outlet of the studied Meduxnekeag River watershed, Maine, for scenarios of air temperature changes with no change in precipitation.
The mean annual 7-day low streamflow, which represents the lowest annual flow, increased with increasing temperature at the calibration and evaluation streamgage sites (tables 8 through 10). This result, however, was due to the underestimation of winter (December to February) streamflows by the PRMS under current climate conditions, which showed that the lowest flows were during the winter months. For example, with a 3.6 °F increase in temperature, the PRMS simulated more runoff from snowmelt and rain during the winter months and thus reduced the number of low winter streamflows that the model simulated without the temperature increase. The elimination of winter low streamflows resulted in the increase of the mean annual 7-day low streamflow. During the summer months, the streamflow decreased with increasing temperature, and the mean streamflow in August decreased from 233 ft3/s (with no temperature change) to 197 ft3/s (with a temperature increase of 10.4 °F)—a 15.5 percent decrease at the basin outlet (table 8; 01018035). This result was considered more reliable because the mean streamflow in August from the observed data from the streamgage at the outlet of the study basin (USGS streamgage 01018035; fig. 3) was 236 ft3/s (not listed in table 8). This indicates that summer monthly streamflows would likely show a decreasing trend with increasing temperature.
To take a closer look at low summer streamflows, the daily simulated streamflows that were exceeded 90 percent of the time during baseline conditions (that is, no changes in precipitation or temperature) were computed for June, July, August, and September for each year from 1981 to 2016. This computation was done for the reaches at the calibration and evaluation streamgage sites. With the streamflow exceeded 90 percent of the time for the selected months during baseline conditions used as a threshold, the number of days that streamflows were less than the thresholds was determined for each climate change scenario. Tables 11, 12, and 13 list the numbers of days streamflows were less than the threshold for each month at each location as both an absolute count and a percentage change. A positive percentage change indicates that the number of low-streamflow days is increasing, as is the potential for extremely low streamflows during that month (drier conditions); a negative percentage change means that the number of low streamflows is decreasing, indicating that the river would experience fewer extreme low streamflows (wetter conditions).
Table 11.
Number and percentage of days in June, July, August, and September with streamflows less than the monthly streamflow exceeded 90 percent of the time during baseline conditions as a threshold at the site of the U.S. Geological Survey Meduxnekeag River at Lowery Road near Houlton, Maine streamgage (01018035).[Location of streamgage shown in figure 3. ft3/s, cubic foot per second; °F, degree Fahrenheit; —, baseline condition not applicable]
Table 12.
Number and percentage of days in June, July, August, and September with streamflows less than the monthly streamflow exceeded 90 percent of the time during baseline conditions as a threshold at the site of the U.S. Geological Survey Meduxnekeag River above South Branch Meduxnekeag River near Houlton, Maine streamgage (01017960).[Location of streamgage shown in figure 3. ft3/s, cubic foot per second; °F, degree Fahrenheit; —, baseline condition not applicable]
Table 13.
Number and percentage of days in June, July, August, and September with streamflows less than the monthly streamflow exceeded 90 percent of the time during baseline conditions as a threshold at the site of the U.S. Geological Survey Meduxnekeag River near Houlton, Maine streamgage (01018000).[Location of streamgage shown in figure 3. ft3/s, cubic foot per second; °F, degree Fahrenheit; —, baseline condition not applicable]
Tables 11, 12, and 13 list similar results for each streamgage, with an increasing number of low streamflows days with increasing air temperature and 0 percent increase in precipitation, with the largest increases during June and July. The increase in the number of low-streamflow days is less during August and September because streamflows and subsurface water storage are already at their lowest levels in the watershed and potential evapotranspiration is limited by the soil-moisture availability. In other words, the soil moisture available to plants is already depleted, so increased evaporative potential does not increase evapotranspiration. Considering increasing precipitation along with increasing air temperature, the results show how the balance between increasing water availability due to increasing precipitation and increasing water loss from evapotranspiration due to increasing air temperature shifts each month. As precipitation increases, the number of low-streamflow days decrease in all months for a given air temperature change. During June, the balance between increasing precipitation (more water entering the system from precipitation) and evapotranspiration (more water leaving the system from higher air temperature) consistently shows a net increase in the number of days with low streamflows for all combinations of increasing precipitation and air temperature. The pattern shifts over the summer months until September, when the balance shows a decrease in the number of days with low streamflows with increasing temperatures.
The water temperature statistics that were computed included mean annual water temperature, mean annual maximum water temperature, April mean water temperature, and July mean water temperature (tables 14–16). These water temperature statistics were computed for the stream reaches at the three USGS streamgage locations (fig. 3). Overall, changes in water temperature simulated for the three streamgage locations were minimal with increases in precipitation (less than 0.5 °F decrease) but more responsive to increases in air temperature as simulated by the PRMS (tables 14–16). The largest simulated change caused by increasing precipitation was a 0.4 °F decrease in the mean July water temperature at the outlet of the study basin, at USGS streamgage 01018035. At this location (table 14), with a 15 percent increase in precipitation and a 10.4 °F increase in air temperature, the mean annual water temperature increased from 47.4 °F to 55.7 °F, the mean April water temperature increased from 39.6 °F to 52.8 °F, and the mean July water temperature increased from 69.4 °F to 80.8 °F—increases of 17.5, 33.3, and 16.4 percent, respectively.
Table 14.
Water temperature statistics for selected climate change scenarios at the site of the U.S. Geological Survey Meduxnekeag River at Lowery Road near Houlton, Maine streamgage (01018035).[Location of streamgage shown on figure 3. ft3/s, cubic foot per second; °F, degree Fahrenheit]
Table 16.
Water temperature statistics for selected climate change scenarios at the site of the U.S. Geological Survey Meduxnekeag River near Houlton, Maine streamgage (01018000).[Location of streamgage shown in figure 3. ft3/s, cubic foot per second; °F, degree Fahrenheit]
Table 15.
Water temperature statistics for selected climate change scenarios at the site of the U.S. Geological Survey Meduxnekeag River above South Branch Meduxnekeag River near Houlton, Maine streamgage (01017960).[Location of streamgage shown in figure 3. ft3/s, cubic foot per second; °F, degree Fahrenheit]
The mean annual maximum snow water equivalent and the mean annual date of the maximum snow water equivalent for the watershed were determined for comparison (table 17). The mean annual maximum snowpack in snow water equivalent increased with increasing precipitation and decreased with increasing air temperature; however, the increases in air temperature dominated the changes in the snowpack. The mean annual maximum snowpack in snow water equivalent increased from 7.67 in. to 9.07 in. with a 15 percent increase in precipitation but decreased to 1.26 in. when a 10.4 °F increase in air temperature was incorporated into the model input. Similarly, the mean annual date of the maximum snowpack came as much as 4 days later (March 21 to March 25) with a 15 percent increase in precipitation, but as many as 53 days earlier (March 21 to January 28) with a 10.4 °F increase in temperature.
Table 17.
Snowpack statistics for selected climate scenarios for the Meduxnekeag River watershed, Maine.[Feb, February; Jan, January; Mar, March; °F, degree Fahrenheit]
Model Limitations
This study emphasizes the importance of understanding the changes in streamflow, snowmelt, and water temperature caused by potential climate change that have been predicted through the hydrologic responses of models. Episodic events such as floods, which are affected by hourly and finer time-scale precipitation events, are not addressed in this study. Pursuant to the discussion of the model calibration, simulated daily and monthly time series are likely subject to greater uncertainty when the calibration statistics are unsatisfactory. Other limitations of the model are as follows:
-
• Changes in water withdrawals and returns are not simulated.
-
• The model simulates a mean temperature for the stream segment, whereas the observed temperatures, used as calibration targets, are point measurements that might vary from the mean for the reach.
-
• Interbasin transfers are not simulated from return flow from withdrawals.
-
• Changes in land-use spatial patterns are not simulated.
-
• The effect of frozen ground on runoff is not explicitly simulated (the version of PRMS used in this study does not account for this process).
-
• The hydrologic effects associated with land-use and land-cover change could be important in determining the trends of possible future change and could be a more important driver of hydrologic change than potential climate change in some areas.
Summary
The Houlton Band of Maliseet Indians needs hydrologic simulations to plan responsible stewardship of native-fish populations and riparian plants in the Meduxnekeag River watershed in northeastern Maine. In response, the U.S. Geological Survey, in cooperation with the Houlton Band of Maliseet Indians, developed a Precipitation-Runoff Modeling System (PRMS) model designed to provide streamflow and water temperature simulations based on projected changes in precipitation and air temperature over the next century. Although the model had the capability to calculate the effects of land-use change on the hydrologic system, these changes were not tested as part of this study.
In general, the PRMS model is well calibrated; however, the modeled-streamflow errors were larger under the lowest and highest flow ranges. By using the calibrated PRMS model, simulations were made for projected scenarios of 0 (baseline), 5-, 10-, and 15 percent increases in precipitation, and air temperature increases of 0.0 (baseline), 3.6, 7.0, and 10.4 degrees Fahrenheit (°). These scenarios were based upon the results of 30 climate change models summarized in the National Climate Change Viewer. Given the physically based model and parameter structure, it is anticipated that the climate change simulations are likely to be consistent with the hydrologic processes in the watershed, and as such, the changes in streamflow and stream temperature relative to the baseline (current) conditions may also be considered reliable.
Overall, the mean annual streamflow and mean annual maximum streamflow increased with increasing precipitation and decreased with increasing air temperature. Water temperatures decreased slightly (less than 0.5 °F) with increasing precipitation but also increased with increasing air temperature. At the outlet of the studied Meduxnekeag River watershed (U.S. Geological Survey Meduxnekeag River at Lowery Road near Houlton, Maine streamgage 01018035), with a 15 percent increase in precipitation and a 10.4 °F increase in air temperature, the mean annual streamflow increased by 17 percent from 489 cubic feet per second (ft3/s) to 572 ft3/s, and the mean annual maximum streamflow decreased by 8.3 percent from 3,870 ft3/s to 3,550 ft3/s. At the same location and under the same scenario, the mean annual water temperature increased by 17.5 percent from 47.4 °F to 55.7 °F.
Significant changes in mean monthly streamflows were found with increasing air temperature. The PRMS results showed that when air temperature increased, the mean monthly streamflow increased during the winter months but decreased during the spring months. For example, with no change in precipitation and an increase of 10.4 °F in air temperature, the mean streamflow at the outlet of the study basin in February increased from 124 ft3/s to 570 ft3/s, and the mean streamflow in April decreased from 1,480 ft3/s to 502 ft3/s—an increase of 360 percent and a decrease of 66 percent, respectively. Furthermore, the month with the greatest monthly streamflow changed from April to December.
Snowpack was also affected by climate and temperature changes. With a 15 percent increase in precipitation and a 10.4 °F increase in air temperature, the PRMS model estimated that the mean annual maximum snowpack for the watershed in snow water equivalent would decrease from 7.67 inches to 1.26 inches, and that the mean annual date of the maximum snowpack would change from March 21 to January 28.
Given its current calibration, this model may be applied not only for forecasting real-time streamflows and water temperatures, but also for assessing future effects of climate and eventually land-cover change in this watershed and thus providing further information that would be useful for the creation of watershed-management strategies. This PRMS model could eventually join a suite of forecast tools to aid watershed managers in forecasting water yield, understanding important variables related to streams (temperature and streamflow), gaining a better picture of habitats adequate for aquatic life, and safeguarding the natural balance of the watershed system and the Houlton Band of Maliseet Indians.
References Cited
Abatzoglou, J.T., 2011, Daily temperature data for the continental United States: University of Idaho data, accessed January 2018 at https://cida.usgs.gov/thredds/dodsC/UofIMETDATA.html.
Bartholow, J., 2010, Stream network and stream segment temperature models software: U.S. Geological Survey data release, accessed August 20, 2021, at https://doi.org/10.3133/96233.
Bjerklie, D.M., and Sturtevant, L., 2017, Simulated hydrologic response to climate change during the 21st century in New Hampshire: U.S. Geological Survey Scientific Investigations Report 2017–5143, 53 p., accessed October 1, 2018, at https://doi.org/10.3133/sir20175143.
Bjerklie, D.M., Ayotte, J.D., and Cahillane, M.J., 2015, Simulating hydrologic response to climate change scenarios in four selected watersheds of New Hampshire: U.S. Geological Survey Scientific Investigations Report 2015–5047, 53 p., accessed October 1, 2018, at https://doi.org/10.3133/sir20155047.
Bjerklie, D.M., Trombley, T.J., and Viger, R.J., 2011, Simulations of historical and future trends in snowfall and groundwater recharge for basins draining to Long Island Sound: Earth Interactions, v. 15, no. 34, p. 1–35, accessed October 1, 2018, at https://doi.org/10.1175/2011EI374.1.
Burns, D.A., Klaus, J., and McHale, M.R., 2007, Recent climate trends and implications for water resources in the Catskill Mountain region, New York: Journal of Hydrology (Amsterdam), v. 336, no. 1–2, p. 155–170, accessed October 1, 2018, at https://doi.org/10.1016/j.jhydrol.2006.12.019.
Campbell, J.L., Driscoll, C.T., Pourmokhtarian, A., and Hayhoe, K., 2011, Streamflow responses to past and projected future changes in climate at the Hubbard Brook Experimental Forest, New Hampshire, United States: Water Resources Research, v. 47, no. 2, article W02514, 15 p., accessed October 1, 2018, at https://doi.org/10.1029/2010WR009438.
Chase, K.J., 2011, Development of a precipitation-runoff model to simulate unregulated streamflow in the South Fork Flathead River basin, Montana: U.S. Geological Survey Scientific Investigations Report 2011–5095, 39 p., accessed October 1, 2018, at https://doi.org/10.3133/sir20115095.
Claessens, L., Hopkinson, C., Rastetter, E., and Vallino, J., 2006, Effect of historical changes in land use and climate on the water budget of an urbanizing watershed: Water Resources Research, v. 42, no. 3, article W03426, 13 p., accessed October 1, 2018, at https://doi.org/10.1029/2005WR004131.
Collins, M.J., 2009, Evidence for changing flood risk in New England since the late 20th century: Journal of the American Water Resources Association, v. 45, no. 2, p. 279–290, accessed October 1, 2018, at https://doi.org/10.1111/j.1752-1688.2008.00277.x.
Demaria, E.M.C., Palmer, R.N., and Roundy, J.K., 2016, Regional climate change projections of streamflow characteristics in the Northeast and Midwest U.S: Journal of Hydrology. Regional Studies, v. 5, no. March, p. 309–323, accessed October 1, 2018, at https://doi.org/10.1016/j.ejrh.2015.11.007.
Di Vittorio, A.V., and Miller, N.L., 2014, Evaluating a modified point-based method to downscale cell-based climate-variable data to high resolution grids: Theoretical and Applied Climatology, v. 112, p. 495–519, accessed October 2015 at https://doi.org/10.1007/s00704-012-0740-9.
Dudley, R.W., and Hodgkins, G.A., 2002, Trends in streamflow, river ice, and snowpack for coastal river basins in Maine during the 20th century: U.S. Geological Survey Water-Resources Investigations Report 02–4245, 26 p., accessed October 1, 2018, at https://doi.org/10.3133/wri20024245.
Dudley, R.W., and Hodgkins, G.A., 2013, Historical groundwater trends in northern New England and relations with streamflow and climatic variables: Journal of the American Water Resources Association, v. 49, no. 5, p. 1198–1212, accessed October 1, 2018, at https://doi.org/10.1111/jawr.12080.
Dudley, R.W., Hay, L.E., Markstrom, S.L., and Hodgkins, G.A., 2012, Watershed scale response to climate change—Cathance Stream basin, Maine: U.S. Geological Survey Fact Sheet 2011–3128, 6 p., accessed October 1, 2018, at https://doi.org/10.3133/fs20113128.
Dudley, R.W., Hodgkins, G.A., McHale, M.R., Kolian, M.J., and Renard, B., 2017, Trends in snowmelt-related streamflow timing in the conterminous United States: Journal of Hydrology (Amsterdam), v. 547, p. 208–221, accessed October 1, 2018, at https://doi.org/10.1016/j.jhydrol.2017.01.051.
Groisman, P.Y., Knight, R.W., Easterling, D.R., Karl, T.R., Hegerl, T.C., and Razuvaev, V.N., 2005, Trends in intense precipitation in the climate record: Journal of Climate, v. 18, no. 9, p. 1326–1350, accessed October 1, 2018, at https://doi.org/10.1175/JCLI3339.1.
Hay, L.E., and Makiko, U., 2006, Multiple-objective stepwise calibration using Luca: U.S. Geological Survey Open-File Report 2006–1323, 25 p., accessed October 1, 2018, at https://doi.org/10.3133/ofr20061323.
Hayhoe, K., Wake, C., Anderson, B., Liang, X.-Z., Maurer, E., Zhu, J., Bradbury, J., DeGaetano, A., Stoner, A.M., and Wuebbles, D., 2007a, Regional climate change projections for the Northeast USA: Mitigation and Adaptation Strategies for Global Change, v. 13, no. 5–6, p. 425–436, accessed August 21, 2021, at https://doi.org/10.1007/s11027-007-9133-2.
Hayhoe, K., Wake, C.P., Huntington, T.G., Luo, L., Schwartz, M.D., Sheffield, J., Wood, E., Anderson, B., Bradbury, J., DeGaetano, A., Troy, T.J., and Wolfe, D., 2007b, Past and future changes in climate and hydrological indicators in the U.S. northeast: Climate Dynamics, v. 28, no. 4, p. 381–407, accessed October 1, 2018, at https://doi.org/10.1007/s00382-006-0187-8.
Hodgkins, G.A., and Dudley, R.W., 2005, Changes in the magnitude of annual and monthly streamflows in New England, 1902–2002: U.S. Geological Survey Scientific Investigations Report 2005–5135, 44 p., accessed October 1, 2018, at https://doi.org/10.3133/sir20055135.
Hodgkins, G.A., and Dudley, R.W., 2006, Changes in late-winter snowpack depth, water equivalent, and density in Maine, 1926–2004: Hydrological Processes, v. 20, no. 4, p. 741–751, accessed October 1, 2018, at https://doi.org/10.1002/hyp.6111.
Hodgkins, G.A., and Dudley, R.W., 2011, Historical summer base flow and stormflow trends for New England rivers: Water Resources Research, v. 47, no. 7, article W07528, 16 p., accessed October 1, 2018, at https://doi.org/10.1029/2010WR009109.
Hodgkins, G.A., and Dudley, R.W., 2013, Modeled future peak streamflows in four coastal main rivers: U.S. Geological Survey Scientific Investigations Report 2013–5080, 18 p., accessed October 1, 2018, at https://doi.org/10.3133/sir20135080.
Hodgkins, G.A., Dudley, R.W., and Huntington, T.G., 2003, Changes in the timing of high river flows in New England over the 20th century: Journal of Hydrology (Amsterdam), v. 278, p. 244–252, accessed October 1, 2018, at https://doi.org/10.1016/S0022-1694(03)00155-0.
Hodgkins, G.A., Dudley, R.W., Archfield, S.A., and Renard, B., 2019, Effects of climate, regulation, and urbanization on historical flood trends in the United States: Journal of Hydrology (Amsterdam), v. 573, p. 697–709, accessed October 1, 2018, at https://doi.org/10.1016/j.jhydrol.2019.03.102.
Houlton Band of Maliseet Indians, 2017, Natural Resources Department: Houlton Band of Maliseet Indians web page, accessed September 20, 2021, at http://naturalresources.maliseets.com.
Huntington, T.G., and Billmire, M., 2014, Trends in precipitation, runoff, and evapotranspiration for rivers draining to the Gulf of Maine in the United States: Journal of Hydrometeorology, v. 15, no. 2, p. 726–743, accessed October 1, 2018, at https://doi.org/10.1175/JHM-D-13-018.1.
Karl, T.R., and Knight, R.W., 1998, Secular trend of precipitation amount, frequency, and intensity in the United States: Bulletin of the American Meteorological Society, v. 79, no. 2, p. 231–242, accessed October 1, 2018, at https://doi.org/10.1175/1520-0477(1998)079<0231:STOPAF>2.0.CO;2.
Koczot, K.M., Jeton, A.E., McGurk, B.J., and Dettinger, M.D., 2005, Precipitation-runoff processes in the Feather River basin, northeastern California, and streamflow predictability, water years 1971–97: U.S. Geological Survey Scientific Investigations Report 2004–5202, 82 p., accessed October 1, 2018, at https://doi.org/10.3133/sir20045202.
LaFontaine, J.H., Hay, L.E., Viger, R.J., Regan, R.S., and Markstrom, S.L., 2015, Effects of climate and land cover on hydrology in the southeastern U.S.—Potential impacts on watershed planning: Journal of the American Water Resources Association, v. 51, no. 5, p. 1235–1261, accessed October 13, 2021, at https://doi.org/10.1111/1752-1688.12304.
Leavesley, G.H., Lichty, R.W., Troutman, B.M., and Saindon, L.G., 1983, Precipitation-runoff modeling system—User’s manual: U.S. Geological Survey Water-Resources Investigations Report 83–4238, 207 p., accessed October 1, 2018, at https://doi.org/10.3133/wri834238.
Loisell, M.C., and Hodgkins, G., 2002, Snowpack in Maine—Maximum observed and March 1 mean equivalent water content: U.S. Geological Survey Water-Resources Investigations Report 01–4258, 19 p., accessed October 1, 2018, at https://doi.org/10.3133/wri20014258.
Mack, T.J., 2009, Assessment of ground-water resources in the Seacoast region of New Hampshire: U.S. Geological Survey Scientific Investigations Report 2008–5222, 188 p., accessed October 1, 2018, at https://doi.org/10.3133/sir20085222.
Maine Geological Survey, 2018, Water resources in Maine: Maine Geological Survey web page, accessed October 1, 2018, at https://www.maine.gov/dacf/mgs/explore/water/facts/water.htm.
Markstrom, S.L., Regan, R.S., Hay, L.E., Viger, R.J., Webb, R.M.T., Payn, R.A., and LaFontaine, J.H., 2015, PRMS–IV, the precipitation-runoff modeling system, version 4: U.S. Geological Survey Techniques and Methods, book 6, chap. B7, 158 p., accessed October 1, 2018, at https://doi.org/10.3133/tm6B7.
Maurer, E.P., Wood, A.W., Adam, J.C., Lettenmaier, D.P., and Nijssen, B., 2002a, A long-term hydrologically-based data set of land-surface fluxes and states for the conterminous United States: Journal of Climate, v. 15, no. 22, p. 3237–3251, accessed October 1, 2018, at https://doi.org/10.1175/1520-0442(2002)015<3237:ALTHBD>2.0.CO;2.
Maurer, E.P., Wood, A.W., Adam, J.C., Lettenmaier, D.P., and Nijssen, B., 2002b, Long-term hydrologically-based data of land-surface fluxes and states for the conterminous United States (version 1.5, April 23, 2010): Santa Clara University data, accessed during January 2018 at https://cida.usgs.gov/thredds/dodsC/new_gmo.html.
Melillo, J.M., Richmond, T.C., and Yohe, G.W., eds., 2014, Climate change impacts in the United States—The third national climate assessment: U.S. Global Change Research Program, 841 p., accessed October 1, 2018, at https://www.globalchange.gov/browse/reports/climate-change-impacts-united-states-third-national-climate-assessment-0
Miller, D.R., Ogden, F.L., Warner, G.S., and DeGaetano, A.T., 2002, Precipitation in Connecticut: University of Connecticut Institute of Water Resources Special Report 36, 65 p., accessed October 1, 2018, at https://opencommons.uconn.edu/ctiwr_specreports/36
Moriasi, D.N., Arnold, J.G., Van Liew, M.W., Bingner, R.L., Harmel, R.D., and Veith, T.L., 2007, Model evaluation guidelines for systematic quantification of accuracy in watershed simulations: Transactions of the ASABE, v. 50, no. 3, p. 885–900. [American Society of Agricultural and Biological Engineers], accessed October 1, 2018, at https://doi.org/10.13031/2013.23153.
Nash, J.E., and Sutcliffe, J.V., 1970, River flow forecasting through conceptual models part I—A discussion of principles: Journal of Hydrology (Amsterdam), v. 10, no. 3, p. 282–290, accessed October 1, 2018, at https://doi.org/10.1016/0022-1694(70)90255-6.
National Oceanic and Atmospheric Administration, 2020, 1981–2010 normals: National Oceanic and Atmospheric Administration data tools, accessed September 16, 2020, at https://www.ncdc.noaa.gov/cdo-web/datatools/normals.
Natural Resources Conservation Service, 2019, Soils: Natural Resources Conservation Service data, accessed September 20, 2021, at https://www.nrcs.usda.gov/wps/portal/nrcs/detail/soils/survey/?cid=nrcs142p2_053627.
Neff, R., Chang, H.J., Knight, C.G., Najjar, R.G., Yarnal, B., and Walker, H.A., 2000, Impact of climate variation and change on mid-Atlantic region hydrology and water resources: Climate Research, v. 14, no. 3, p. 207–218, accessed October 1, 2018, at https://doi.org/10.3354/cr014207.
Nielsen, M.G., and Westenbroek, S.M., 2019, Groundwater recharge estimates for Maine using a soil-water-balance model—25-year average, range, and uncertainty, 1991 to 2015: U.S. Geological Survey Scientific Investigations Report 2019–5125, 56 p., accessed October 1, 2018, at https://doi.org/10.3133/sir20195125.
Olson, S.A., 2021, Data for simulating the effects of air temperature and precipitation changes on streamflow and water temperature in the Meduxnekeag River watershed, Maine: U.S. Geological Survey data release, https://doi.org/10.5066/P9EB4H6H.
Oubeidillah, A.A., Kao, S.C., Ashfaq, M., Naz, B., and Tootle, G., 2013, A large-scale, high-resolution hydrological model parameter dataset for climate-change impact assessment for the conterminous United States: Hydrology and Earth System Sciences, v. 10, p. 9575–9613, accessed October 2015 at https://doi.org/10.5194/hessd-10-9575-2013.
Randall, A.D., 1996, Mean annual runoff, precipitation, and evapotranspiration in the glaciated northeastern United States, 1951–80: U.S. Geological Survey Open-File Report 96–395, 2 sheets, accessed October 1, 2018, at https://doi.org/10.3133/ofr96395.
Regan, R.S., Markstrom, S.L., Hay, L.E., Viger, R.J., Norton, P.A., Driscoll, J.M., and LaFontaine, J.H., 2018, Description of the National Hydrologic Model for use with the Precipitation–Runoff Modeling System (PRMS): U.S. Geological Survey Techniques and Methods, book 6, chap. B9, 38 p., accessed October 1, 2018, at https://doi.org/10.3133/tm6B9.
Sanders, M.J., Markstrom, S.L., and Regan, R.S., 2017, Documentation of a mean daily temperature module—An enhancement to the precipitation-runoff modeling system: U.S. Geological Survey Techniques and Methods, book 6, chap. D4, 18 p., accessed October 1, 2018, at https://doi.org/10.3133/tm6D4.
Stahl, K., Moore, R.D., Floyer, J.A., Asplin, M.G., and McKendry, I.G., 2006, Comparison of approaches for spatial interpolation of daily air temperature in a large region with complex topography and highly variable station density: Agricultural and Forest Meteorology, v. 139, p. 224–236, accessed October 1, 2018, at https://doi.org/10.1016/j.agrformet.2006.07.004.
Stocker, T.F., Qin, D., Plattner, G.K., Tignor, M., Allen, S.K., Boschung, J., Nauels, A., Xia, Y., Bex, V., and Midgley, P.M., eds., 2013, Climate change 2013—The physical science basis—Contribution of working group I to the fifth assessment report of the Intergovernmental Panel on Climate Change: Intergovernmental Panel on Climate Change, 1,535 p., accessed October 1, 2018, at https://doi.org/10.1017/CBO9781107415324.
Theurer, F.D., Voos, K.A., and Miller, W.J., 1984, Instream water temperature model: U.S. Fish and Wildlife Service Instream Flow Information Paper 16, 86 p. [Also available at http://www.arlis.org/susitnadocfinder/Record/dbtw3128.]
Thornton, P.E., Running, S.W., and White, M.A., 1997, Generating surfaces of daily meteorological variables over large regions of complex terrain: Journal of Hydrology, v. 190, no. 1997, p. 214–251. [Also available at https://doi.org/10.1016/S0022-1694(96)03128-9.]
Thornton, P.E., Thornton, M.M., Mayer, B.W., Wei, Y., Devarakonda, R., Vose, R.S., and Cook, R.B., 2016, Daymet—Daily surface weather data on a 1-km grid for North America, version 3: Oak Ridge National Laboratory data, accessed January 2018 at https://doi.org/10.3334/ORNLDAAC/1328.
U.S. Geological Survey, 2011, Welcome to the geo data portal: U.S. Geological Survey data, accessed January 2018 at http://cida.usgs.gov/gdp/
U.S. Geological Survey, 2013, LUCA: U.S. Geological Survey software, accessed September 2020 at https://wwwbrr.cr.usgs.gov/projects/SW_MoWS/LUCA.html
U.S. Geological Survey, 2020, National elevation dataset: U.S. Geological Survey data, accessed September 2020 at https://ned.usgs.gov/.
U.S. Geological Survey, 2021a, National climate change viewer: U.S. Geological Survey data, accessed September 20, 2021, at https://www2.usgs.gov/landresources/lcs/nccv/maca2/maca2_watersheds.html.
U.S. Geological Survey, 2021b, Precipitation Runoff Modeling System (PRMS): U.S. Geological Survey web page, accessed September 20, 2021, at https://www.usgs.gov/software/precipitation-runoff-modeling-system-prms.
U.S. Geological Survey, [undated]a, National hydrography dataset: U.S. Geological Survey data, accessed September 2016 at https://nhd.usgs.gov/.
U.S. Geological Survey, [undated]b, National land cover database: U.S. Geological Survey data, accessed September 2016 at https://www.usgs.gov/centers/eros/science/national-land-cover-database.
U.S. Global Change Research Program, 2021, National Climate Assessment and Development Advisory Committee: U.S. Global Change Research Program web page, accessed September 20, 2021, at https://www.globalchange.gov/ncadac.
Vogelmann, J.E., Howard, S.M., Yang, L.M., Larson, C.R., Wylie, B.K., and Van Driel, N., 2001, Completion of the 1990s national land cover dataset for the conterminous United States from Landsat Thematic Mapper data and ancillary data sources: Photogrammetric Engineering and Remote Sensing, v. 67, no. 6, p. 650–662, accessed October 1, 2018, at https://www.asprs.org/wp-content/uploads/pers/2001journal/june/2001_jun_highlight.pdf.
Wake, C., Burakowski, E., Hayhoe, K., and Stoner, A., 2014a, Climate change in northern New Hampshire, past, present, and future: Durham, N.H., University of New Hampshire, The Sustainability Institute, article 1, 76 p., accessed September 2021 at https://scholars.unh.edu/cgi/viewcontent.cgi?article=1001&context=sustainability.
Wake, C., Burakowski, E., Hayhoe, K., and Stoner, A., 2014b, Climate change in southern New Hampshire, past, present, and future: Durham, N.H., University of New Hampshire, The Sustainability Institute, article 2, 86 p., accessed September 2021 at https://scholars.unh.edu/cgi/viewcontent.cgi?article=1002&context=sustainability.
Conversion Factors
U.S. customary units to International System of Units
Temperature in degrees Fahrenheit (°F) may be converted to degrees Celsius (°C) as follows:
°C = (°F – 32) / 1.8.
Datums
Vertical coordinate information is referenced to the North American Vertical Datum of 1988 (NAVD 88).
Horizontal coordinate information is referenced to the North American Datum of 1983 (NAD 83).
Altitude, as used in this report, refers to distance above the vertical datum.
Abbreviations
GCM
global circulation model
GIS
geographical information system
HBMI
Houlton Band of Maliseet Indians
HRU
hydrologic response unit
NAD 83
North American Datum of 1983
NAVD 88
North American Vertical Datum of 1988
NRMSE
normalized root-mean-square error
PBIAS
percent bias
PRMS
Precipitation-Runoff Modeling System
USGS
U.S. Geological Survey
For more information, contact
Director, New England Water Science Center
U.S. Geological Survey
10 Bearfoot Road
Northborough, MA 01532
dc_nweng@usgs.gov
or visit our website at
https://www.usgs.gov/centers/new-england-water
Publishing support provided by the Denver and Pembroke Publishing Service Centers
Disclaimers
Any use of trade, firm, or product names is for descriptive purposes only and does not imply endorsement by the U.S. Government.
Although this information product, for the most part, is in the public domain, it also may contain copyrighted materials as noted in the text. Permission to reproduce copyrighted items must be secured from the copyright owner.
Suggested Citation
Bjerklie, D.M., and Olson, S.A., 2021, Simulating the effects of climate-related changes to air temperature and precipitation on streamflow and water temperature in the Meduxnekeag River watershed, Maine: U.S. Geological Survey Scientific Investigations Report 2021–5104, 35 p., https://doi.org/10.3133/sir20215104.
ISSN: 2328-0328 (online)
Study Area
| Publication type | Report |
|---|---|
| Publication Subtype | USGS Numbered Series |
| Title | Simulating the effects of climate-related changes to air temperature and precipitation on streamflow and water temperature in the Meduxnekeag River watershed, Maine |
| Series title | Scientific Investigations Report |
| Series number | 2021-5104 |
| DOI | 10.3133/sir20215104 |
| Publication Date | November 30, 2021 |
| Year Published | 2021 |
| Language | English |
| Publisher | U.S. Geological Survey |
| Publisher location | Reston, VA |
| Contributing office(s) | New England Water Science Center |
| Description | Report: vi, 35 p.; Data Release |
| Country | United States |
| State | Maine |
| Other Geospatial | Meduxnekeag River watershed |
| Online Only (Y/N) | Y |
| Additional Online Files (Y/N) | N |