

Hydrogeology and Gain/Loss Assessment of Two Lakes Contaminated with Per- and Polyfluoroalkyl Substances, Vicinity of Joint Base McGuire-Dix-Lakehurst, New Jersey, 2020–21
Links
- Document: Report (3.32 MB pdf) , HTML , XML
- Databases:
- Download citation as: RIS | Dublin Core
Acknowledgments
The authors would like to thank Pemberton Township, New Jersey and Manchester Township, New Jersey for access to their municipal parks. Dominick Antolino and Daniel Skulski of the U.S. Geological Survey provided technical reviews of this report.
Abstract
Per- and polyfluoroalkyl substances (PFAS) have been identified in two lakes near Joint Base McGuire-Dix-Lakehurst (JBMDL) in New Jersey—Little Pine Lake in Pemberton Township and Pine Lake in Manchester Township. The streams that enter these lakes begin in or near JBMDL where sources of PFAS contamination are located. The U.S. Geological Survey, in cooperation with the U.S. Air Force Civil Engineer Center, performed a study of the hydrogeology and the gaining or losing conditions associated with these lakes.
Hydrogeologic characteristics in the vicinity of both lakes were assessed using qualitative vertical hydraulic profiling of the subsurface. Groundwater was pumped from test intervals at various depths below land surface, then groundwater levels were measured until they recovered to static conditions. Low permeability aquifer intervals were identified within the aquifer underlying both lakes, consistent with silty and (or) clayey subunits of the Kirkwood-Cohansey aquifer system indicated on geophysical and lithologic logs.
Gaining or losing conditions between groundwater and lake surface water were assessed with continuous monitoring of water levels and temperature in the lakes and in three piezometers per lake screened at different depths in the underlying aquifer from August 2020 through May 2021. At Little Pine Lake, surface water levels were consistently lower than groundwater levels, which is indicative of a gaining condition with groundwater flowing into the lake. Gaining conditions also support the lack of diurnal temperature fluctuations observed in groundwater, but poor response of surface-water temperature prevents complete analysis. The potential for losing conditions at other locations around Little Pine Lake necessitates further assessment in regard to possible PFAS contamination of groundwater in the underlying aquifer. Temperature results were inconclusive at Pine Lake, but surface water levels were consistently higher than groundwater levels throughout the monitoring period, which indicates a losing condition with lake water flowing into the underlying aquifer. Because of the downward vertical hydraulic gradient identified at Pine Lake, there is a strong possibility that PFAS in the lake water has also contaminated groundwater in its vicinity.
Introduction
Joint Base McGuire-Dix-Lakehurst (JBMDL) is a 42,000 contiguous acre (66 square mile) military installation composed of McGuire Air Force Base, Army post Fort Dix, and Naval Air Engineering Station Lakehurst in Burlington and Ocean Counties, New Jersey. Contamination from toxic per- and polyfluoroalkyl substances (PFAS)—specifically perfluorooctanoic acid (PFOA), perfluorooctane sulfonic acid (PFOS), and perfluorononanoic acid (PFNA)—has been detected in groundwater and surface water at JBMDL (U.S. Air Force, 2016). These PFAS likely originated from activities involving fire-suppressing aqueous film forming foam (AFFF), such as fire training; aircraft, vehicle, or fuel fires; and AFFF storage or disposal areas. In 2016, the U.S. Environmental Protection Agency (EPA) issued a nonregulatory health advisory of 70 parts per trillion (ppt) for combined PFOA and PFOS concentrations in drinking water (U.S. Environmental Protection Agency, 2019). The New Jersey Department of Environmental Protection (NJDEP) adopted maximum contaminant levels of 13 ppt for PFNA in 2018, and 13 and 14 ppt for PFOS and PFOA, respectively, in 2020 (New Jersey Department of Environmental Protection, 2020).
A study by the NJDEP assessed the occurrence of 13 PFAS compounds in surface water, sediment, and fish tissue at 11 locations across New Jersey based on the proximity to potential sources of PFAS and the likelihood of the waterways being used for recreational and fishing purposes (Goodrow and others, 2018). Little Pine Lake, on the south boundary of JBMDL in the Browns Mills community of Pemberton Township (fig. 1) in Burlington County, had the highest measured total PFAS concentration of all water samples in that study at 279.5 nanograms per liter (ng/L; 1 ppt = 1 ng/L). Of the 13 PFAS compounds examined, the highest concentrations were 100 ng/L of PFOS and 95.9 ng/L of perfluorohexane sulfonic acid (PFHxS). Pine Lake, to the east of JBMDL in Manchester Township (fig. 2) in Ocean County, had the third highest total PFAS concentration in the study at 170.7 ng/L, and the compounds with the highest individual concentrations were PFOS at 102.0 ng/L (the highest reported of any PFAS in the study), and PFHxS at 24.6 ng/L. Nine of the 13 PFAS compounds detected in the study were found in both Little Pine Lake and Pine Lake surface water.
Goodrow and others (2018) also collected sediment and fish tissue samples in the NJDEP study. Similar to water samples, the highest concentration of total PFAS detected in all sediment samples, 30.93 nanograms per gram (ng/g), was from those samples collected in Little Pine Lake. Sediment samples collected at Pine Lake had a PFOS concentration of 19.30 ng/g, which was the second highest concentration of PFOS observed in sediment. The largemouth bass and the yellow perch contained an average PFOS concentration of 73.67 ng/g and 118.60 ng/g, respectively. PFOS concentrations in tissue from largemouth bass in Little Pine Lake were second only to the largemouth bass concentrations in Pine Lake, which had an average PFOS concentration of 114 ng/g. Average PFOS concentrations in the American eel and pumpkinseed sunfish were 162.5 ng/g and 119.2 ng/g, respectively.
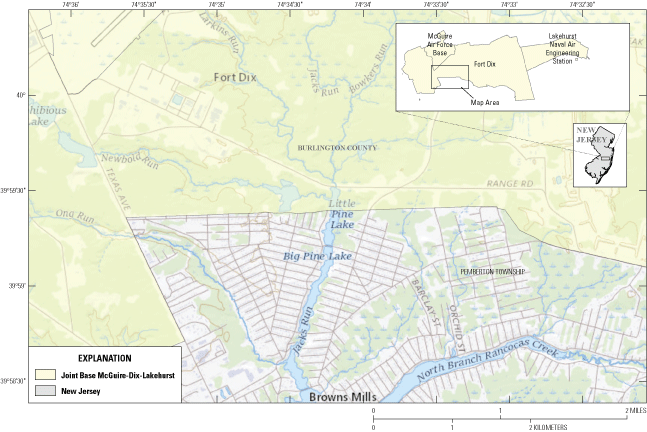
Map showing the location of Little Pine Lake in Pemberton Township, relative to Joint Base McGuire-Dix-Lakehurst, New Jersey.
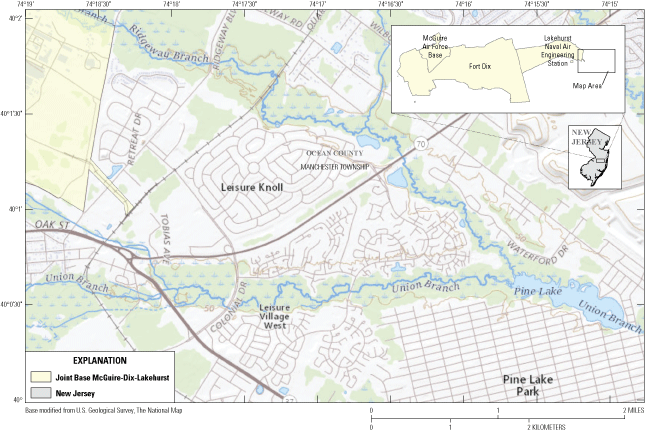
Map showing the location of Pine Lake in Manchester Township, relative to Joint Base McGuire-Dix-Lakehurst, New Jersey.
Some residents of the suburban neighborhoods surrounding Little Pine Lake and Pine Lake receive drinking water from domestic wells screened in the Kirkwood-Cohansey aquifer system, the unconfined water-table aquifer in this area (Fiore, 2020). There is concern that residents with shallow wells may be exposed to PFAS in their drinking water if downward vertical hydraulic gradients are present within Little Pine Lake and Pine Lake, where surface water could potentially flow into the groundwater system. Such losing conditions from the lake into the aquifer may be part of the natural flow system or the result of human activity such as domestic well pumping and (or) damming on the downstream end of the lakes. The combined drawdown of domestic well pumping may decrease groundwater levels near the lakes enough to create a losing condition. Dams downstream of each lake may increase lake levels higher than the surrounding groundwater levels and thus cause a losing condition as well.
Purpose and Scope
This report describes a gain/loss assessment conducted by the U.S. Geological Survey (USGS), in cooperation with the U.S. Air Force Civil Engineer Center (AFCEC), to determine whether downward vertical hydraulic gradients at Pine Lake and Little Pine Lake are present, indicating a losing condition from the lake to aquifer and a greater likelihood of PFAS contamination of the unconfined aquifer, or if vertical gradients are upward, indicating a gaining condition and a lesser likelihood of PFAS contamination of domestic wells. From August 2020 to May 2021, continuous water level and water temperature monitoring were performed in each lake and in temporary groundwater piezometers at each lake to determine hydraulic gradients. Qualitative permeability testing by vertical hydraulic profiling methods is also described to provide general hydrogeologic information about the aquifers underlying these lakes.
Hydrologic Setting
Surface Water
Little Pine Lake is located at the confluence of the Jacks Run, Larkins Run, and Newbold Run tributaries of North Branch Rancocas Creek (fig. 1). Flow in Little Pine Lake is approximately north to south. At the southern end of Little Pine Lake is a manmade berm with a spillway that allows water to flow from Little Pine Lake into another lake—Big Pine Lake. A gate is attached to the spillway that can regulate flow and lake levels between the lakes. Big Pine Lake was not sampled for PFAS by Goodrow and others (2018). The Fort Dix boundary transverses west-to-east across Little Pine Lake. Jacks Run and Larkins Run both begin on the McGuire Air Force Base portion of JBMDL, near reported PFAS source areas (U.S. Air Force, 2016). Surface water samples collected near the headwaters of these streams contained as much as 640 ng/L of PFOS,47 ng/L of PFOA, and 16 ng/L of PFNA (U.S. Air Force, 2016). Monitoring wells in these areas had PFOS concentrations as high as 240 ng/L, PFOA concentrations as high as 45 ng/L, and PFNA concentrations as high as 7.7 ng/L (U.S. Air Force, 2016).
Pine Lake is located at the confluence of the Union Branch and Ridgeway Branch tributaries of the Toms River, about 3.5 miles (mi) east-southeast of the southeast corner of the Lakehurst portion of JBMDL (fig. 2). Flow in Pine Lake is approximately northwest to southeast and is directed toward a weir at the downstream end, where water exits the lake as a continuation of Union Branch. A dam is also constructed on the weir. Upstream, Ridgeway Branch follows the north border of Lakehurst Naval Air Engineering Station at the easternmost end of JBMDL. A sample collected in Ridgeway Branch in 2016 returned a PFOS concentration of 390 ng/L and a PFOA concentration of 98 ng/L (U.S. Air Force, 2016). This surface water sample was collected in the vicinity of a JBMDL PFAS source area where 2016 concentrations of PFOS and PFOA in one monitoring well were 1,000 and 220 ng/L, respectively, and PFNA was below detection (U.S. Air Force, 2016).
Groundwater
Fiore (2020) described the regional hydrogeologic structure in the vicinity of JBMDL, which included areas where Little Pine Lake and Pine Lake are located. Both lakes overlie the Kirkwood-Cohansey aquifer system, which consists primarily of sands from the Kirkwood Formation, Cohansey Formation, and surficial deposits (Sugarman and others, 2013). The Kirkwood-Cohansey is primarily unconfined, but the presence of low permeability clay and silt subunits interbedded with the sand can locally create semiconfined conditions or perched water tables that introduce heterogeneity into the groundwater flow system (Zapecza, 1989; Sugarman and others, 2013; Fiore and others, 2018) and especially impede downward infiltration of surface water into groundwater (Reilly and others, 2010; Fiore, 2016). Furthermore, the high organic carbon content of many of these subunits may create sites with high affinity for PFAS sorption and therefore can affect PFAS transport and remediation (Fiore, 2020).
Clay subunits are indicated beneath Little Pine Lake, but not Pine Lake, based on borehole geophysical logs and drilling records (Fiore, 2020). However, these investigations were performed at a regional scale without high-resolution focus on these particular areas, so the subunit at Little Pine Lake may consist of a series of multiple thinner subunits that appear as a single thicker subunit when assessing at that coarser scale. Similarly, one or more subunits may be present at Pine Lake, despite no subunits detected at the regional scale. Geologic mapping in the Cohansey Formation often depicts a clay-sand facies that consists of multiple interbedded clays and sands mapped as one unit (Stanford, 2016), but separately may have different hydrologic effects on groundwater flow in the aquifer system.
Studies of groundwater flow in areas that include JBMDL, Pine Lake, or Little Pine Lake generally assume a gaining condition, without integrating the hydrolithologic heterogeneity of the Kirkwood-Cohansey aquifer system (Modica, 1996; Nicholson and Watt, 1997; AECOM, 2010; Cauller and others, 2016) or vertical hydraulic gradients (Watt and others, 1994; Watt and others, 2002; AECOM, 2010) as part of the assessment. Therefore, prior knowledge of groundwater conditions and groundwater/surface water interaction associated with these specific lakes is limited.
No groundwater samples have been collected for PFAS near Pine Lake, but monitoring wells east and northeast of the upstream end of Little Pine Lake have reported exceedances of PFOS and PFOA (AFCEC Installation Restoration Program, JBMDL, written commun., 2017).
Methods
The assessment of the hydrogeology and gaining or losing conditions in Pine Lake and Little Pine Lake was made using (1) vertical hydraulic profiling, (2) continuous monitoring of water levels, and (3) continuous monitoring of temperature. No PFAS samples in lakes, piezometers, or domestic wells were collected by the USGS for this study by request of AFCEC. Seepage runs, commonly used to determine gaining or losing conditions by measuring the difference of streamflow at the upstream and downstream ends of a stream reach, were not performed because the surface water flow rates through the lakes were assumed to be too low relative to the measurement uncertainty error inherent to the method for accurate determination. Time-domain electromagnetic imaging, a waterborne geophysical method, was also considered, but the presence of overhead power lines, lakeside houses, and other utilities that may cause electrical interference was a concern.
Vertical Hydraulic Profiling
To assess general heterogeneity with depth below Pine Lake and Little Pine Lake, vertical hydraulic profiling was conducted using a qualitative depth interval pumping method. A Geoprobe SP16 drive-point sampler was driven into the subsurface to a specific depth interval at which a screen was exposed. The interval was then pumped of three casing volumes (casings being the rods above the SP16 sampler screen), and water levels were monitored manually until recovery. Recovery to static water levels was assumed to be 0.03 feet (ft) or less of change in 10 minutes. The sampler was then repositioned to another depth in the same hole and the process was repeated as many as five times per hole.
The vertical hydraulic profiling method used in this study is considered a qualitative measure of the general permeability of the sediments surrounding the test interval. If an interval is pumped dry or did not recover within an arbitrarily chosen time (45 minutes to 1 hour was used in this study), the permeability is likely low and the lithology is likely a clay, silt, or very fine sand. If the interval sustained pumping and recovered to static water levels, the sediments at that depth are likely permeable sand or gravel. Recovered water level hydraulic heads at different test intervals can then be assessed together to observe the direction(s) of the vertical hydraulic gradients at that location. This method has proven effective for analyzing hydrogeology and groundwater-surface water exchange at other locations in the Kirkwood-Cohansey aquifer system where clay subunits were present (Fiore and others, 2018). For more quantitative approaches, such as those to obtain hydraulic conductivity, aquifer transmissivity, or other values, longer duration tests with continuously monitored water levels and accurate pump rates would be required for each test interval to obtain more specific drawdown and recovery data.
Vertical hydraulic profiling tests at Pine Lake were performed on June 26, 2020. Tests at Little Pine Lake were performed on July 8 and July 29, 2020. Descriptions of the test intervals at Little Pine Lake and Pine Lake are provided in table 1. Four depth intervals were tested at Pine Lake within one hole (PL-GP), and eight depth intervals were tested at Little Pine Lake among two holes (LPL-GP1 and LPL-GP2).
Table 1.
Description of vertical hydraulic profiling test intervals in temporary groundwater piezometers, Little Pine Lake and Pine Lake, New Jersey, 2020–21.[NWIS, National Water Information System database; NAVD 88; North American Vertical Datum of 1988; BLS, below land surface]
Results of the vertical hydraulic profiling are discussed in the context of the hydrogeologic framework by Fiore (2020) in the vicinity of the lakes (figs. 3, 4). Information from the hydrogeologic framework was supplemented with existing publicly available driller logs available in the NJDEP DataMiner database (New Jersey Department of Environmental Protection, 2021), as well as interpretations from Stanford (2013). All additional lithology and borehole logs used in this report are available in the USGS GeoLog Locator database (U.S. Geological Survey, 2021), though no logs were collected specifically for this study.
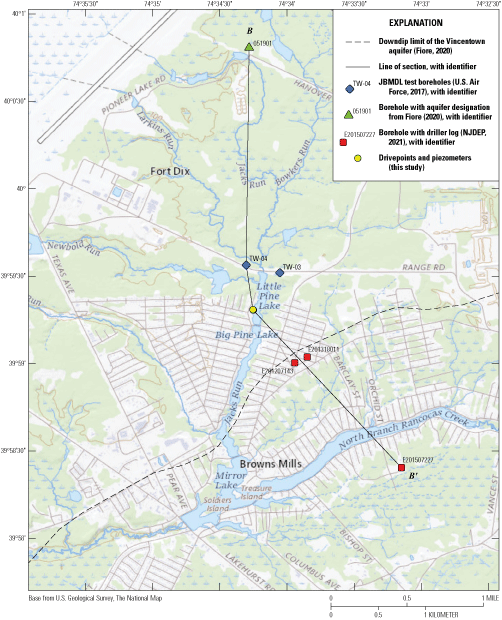
Map showing boreholes and cross section line used in the hydrogeologic framework, Little Pine Lake and vicinity, New Jersey. NJDEP, New Jersey Department of Environmental Protection.
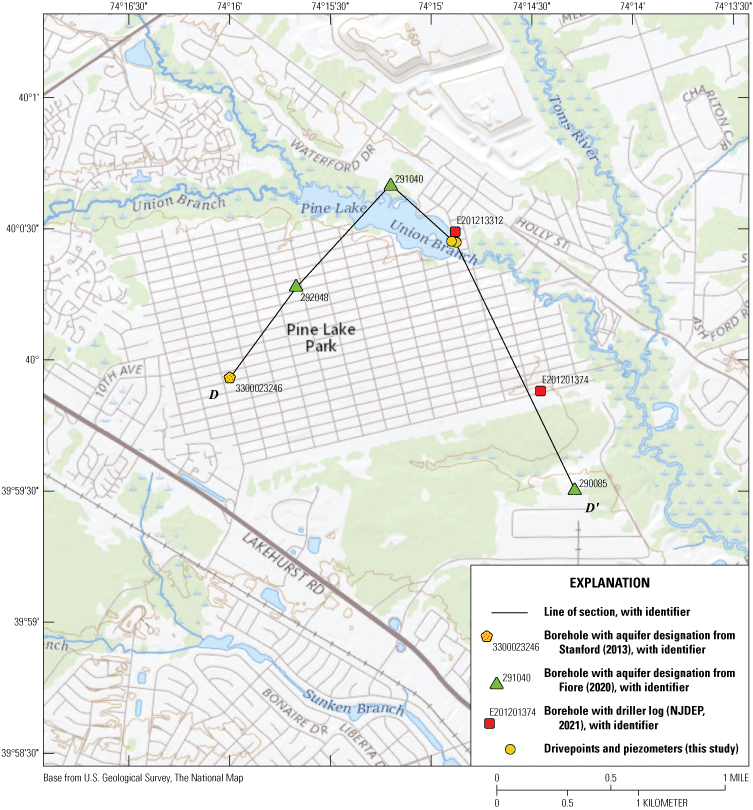
Map showing boreholes and cross section line used in the hydrogeologic framework, Pine Lake and vicinity, New Jersey. NJDEP, New Jersey Department of Environmental Protection.
Continuous Monitoring of Water Levels
Hydraulic gradients between the surface water in the lakes and the adjacent groundwater were determined by continuous water-level monitoring data. Lower groundwater levels than lake levels would indicate surface water is flowing into the groundwater system, thus indicating a losing condition and the potential for PFAS contamination of the aquifer. Conversely, when groundwater levels are higher than nearby lake levels, it would indicate groundwater is flowing into the lake, and thus a gaining condition and lower potential for PFAS contamination of the aquifer. Both instances assume hydraulic connection between the groundwater and surface water.
Owing to seasonal and punctuated variations in water levels in lakes and groundwater, continuous water-level monitoring better assesses hydraulic gradients when compared to discrete water level synoptic gaging events. Annual highs for water levels in New Jersey typically occur in the spring following low evapotranspiration of shallow groundwater through the winter months. Annual low water levels typically occur in the fall, following high evapotranspiration through the summer months. Therefore, higher springtime water levels may produce a gaining condition and lower fall water levels may produce a losing condition within the same surface water body depending on season. Water levels may also vary with changes in the duration and intensity of individual precipitation events. Furthermore, continuous monitoring allows for consideration of dam effects, such as unscheduled lowering of the spillway gate at Little Pine Lake, which would increase lake levels and potentially cause a losing condition when the gate is closed.
Three temporary piezometers were installed at each of the two lakes to monitor groundwater levels (fig. 5). Each piezometer was screened at a different depth so vertical gradients could be assessed. Piezometers and their depths are listed in table 1. At Little Pine Lake, all three piezometers were continuously monitored. At Pine Lake, only the shallowest piezometer was continuously monitored and the remaining two had discrete measurements only as the rods used in their installation were too narrow for the transducers. However, the lack of continuous data at these piezometers did not affect the results of the hydrograph interpretations, as discussed later. One surface water gage site was installed per lake (fig. 5; table 2), which consisted of a transducer inserted through a slotted PVC pipe fixed to a dock piling (at Little Pine Lake) and a concrete wall (at Pine Lake). The North American Vertical Datum of 1988 (NAVD 88) altitudes at each piezometer and surface water gage location were determined by levelling their measuring point altitude from a reference Global Navigation Satellite System receiver. Each piezometer and surface water gage was visited every 10 weeks throughout the continuous deployment to check for sensor drift and to download data from the recorders. At each visit, discrete water-level measurements were made manually at all piezometer and surface water sites with a calibrated steel tape using techniques described by Cunningham and Schalk (2011). These measurements were used to make corrections for instrument drift during data analysis. Each site was instrumented with an In Situ Level Troll 500 vented pressure transducer recording at intervals of 15 minutes. Water-level data are available in the USGS National Water Information System (NWIS) database (U.S. Geological Survey, 2020).
Table 2.
Description of surface water monitoring locations, Little Pine Lake and Pine Lake, New Jersey, 2020–21.[NWIS, National Water Information System database; nr, near; NJ, New Jersey]
At Little Pine Lake, piezometer LPL-PZ-23 was installed in the same drive-point hole used for test intervals LPL-GP2-42 and LPL-GP2-52. Piezometer LPL-PZ-10 was installed in the same drive-point hole (LPL-GP1) used for the five additional test intervals at that location. Piezometer LPL-PZ-05 was installed by hand below the lakebed. At Pine Lake, piezometer PL-PZ-29 was installed in the same drive-point hole as the test intervals at that location. Piezometer PL-PZ-16 was also installed using a drive-point, but no intervals were tested in that drive-point hole. Piezometer PL-PZ-06 was installed by hand below the lakebed.
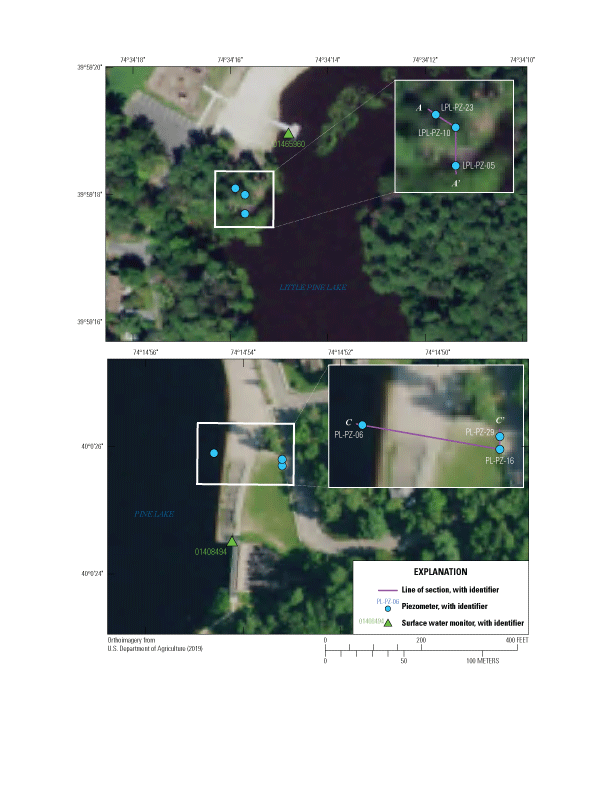
Map showing the location of temporary piezometers and surface water monitors at Little Pine Lake and Pine Lake, New Jersey.
Continuous Monitoring of Temperature
Continuous monitoring of groundwater temperatures can provide insights into gain/loss on the basis of the diurnal fluctuations of water temperature at different depths (Stonestrom and Constantz, 2003). Deeper groundwater generally remains at a near-constant temperature and is expected to have muted, negligible temperature fluctuations throughout the day. Conversely, surface water temperature fluctuates in a similar pattern to air temperature and is generally highest midday and lowest before sunrise. In the case of a gaining condition, shallower groundwater would exhibit similarly minimal variations in temperature as deeper groundwater because groundwater is flowing upwards from depth. In the case of a losing condition, the shallower groundwater would instead be imprinted by the higher diurnal temperature variations of surface water as the downward hydraulic gradient transports heat from the lake into the aquifer system. Water temperature should be considered a secondary line of evidence to indicate gain/loss compared to water levels, which are the primary indicator.
The transducers used to monitor water levels also include an internal thermistor to monitor temperature, so water levels and temperature data are collected simultaneously in the same gages and piezometers. Temperature calibration procedures followed USGS protocols from Wilde (2006) to ensure the transducer readings were within the USGS established error of ±0.02 degrees Celsius (°C) of difference from standard. The transducer thermistors were checked using a five-point temperature check prior to installation and following retrieval. A five-point temperature check tests the thermistor through a range of temperatures from 40 to 0 °C. A two-point temperature comparison was completed in the field around the middle of the deployment period, checking transducer thermistor temperatures against a National Institute of Standards and Technology calibrated thermistor at 0 and 40 °C water brought to the field. Temperature comparisons were also checked for in situ groundwater as well. Temperature data are available in the USGS National Water Information System database (U.S. Geological Survey, 2020).
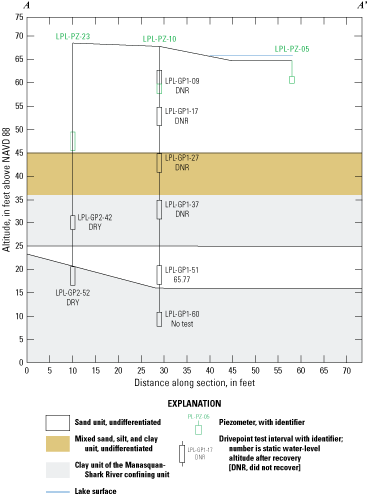
Line of section A-A′ with results of vertical hydraulic profiling, Little Pine Lake, New Jersey.
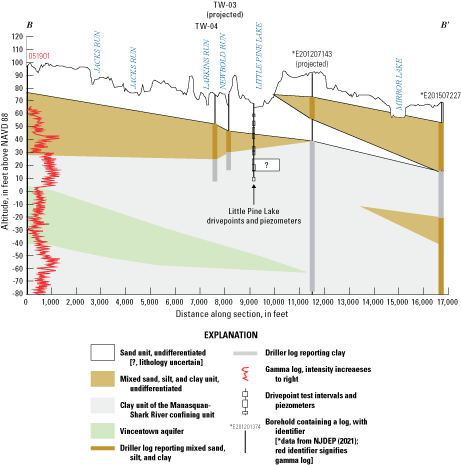
Line of section B-B′ showing context within the regional hydrogeologic framework, Little Pine Lake, New Jersey. NJDEP, New Jersey Department of Environmental Protection.
Assessment of Little Pine Lake
Vertical Hydraulic Profiling
The spatial distribution of vertical hydraulic profiling results from Little Pine Lake are displayed in figure 6 and within the regional hydrogeologic context in figure 7. Eight intervals were tested among two holes at Little Pine Lake (table 1). One interval, LPL-GP1-51, was able to be pumped and measured to recovery, and is the only test interval at Little Pine Lake that did not indicate aquifer material with low permeability. Two intervals, LPL-GP2-52 and LPL-GP2-42, were pumped dry, indicating low permeability aquifer material. Four intervals (LPL-GP1-37, LPL-GP1-27, LPL-GP1-17, LPL-GP1-09) did not recover to static water-level conditions following pumping, which also indicates low permeability. Pump equipment issues prevented full pumping of interval LPL-GP1-37, but the water levels did not recover following its partial development, indicating that this interval was composed of low permeability aquifer material Interval LPL-GP1-60 was not tested because the pre-pumping water level in the interval was too deep to be pumped with a peristaltic pump. The presumed cause for the deep water level is low permeability aquifer material surrounding the screen preventing water from entering, but this explanation cannot be confirmed.
Based on their screen altitudes in the context of the hydrogeologic framework, intervals LPL-GP2-52, LPL-GP2-42, LPL-GP1-60, and LPL-GP1-37 were likely screened within the Manasquan-Shark River confining unit that underlies the Kirkwood-Cohansey aquifer system. Results of the hydraulic profiling are consistent with this placement. LPL-GP1-51 is also situated in this unit, but the higher permeability indicated by its ease of pumping and subsequent recovery to static water levels is more representative of an aquifer permeability, thus this interval may have been screened in a lens of sandier material than its surroundings. Interval LPL-GP1-27 was situated in a mixed clayey, silty, and sandy unit that Fiore (2020) and Sugarman and others (2018) also consider part of the Manasquan-Shark River confining unit, and based on its lack of recovery to static water levels, LPL-GP1-27 was likely situated in a more silty and clayey unit at this location. Although the intervals LPL-GP1-17 and LPL-GP1-09 did not recover, the framework places these depths within the Kirkwood-Cohansey aquifer system. The lack of recovery may have been caused by residual screen clogging left over from testing in finer-grained units at deeper intervals, incomplete screen development during pumping, and (or) the interval being situated in a silty or clayey lens subunit common in the Kirkwood-Cohansey aquifer system.
Water levels were measured in the intervals that did not recover and are available in NWIS, but they have limited usefulness in this assessment because of being collected in nonstatic, unrecovered conditions. The sole static water level during testing at Little Pine Lake was from LPL-GP1-51 at an altitude of 65.77 ft above NAVD 88. The water-level elevation of Little Pine Lake was not recorded at the at the time of this measurement.
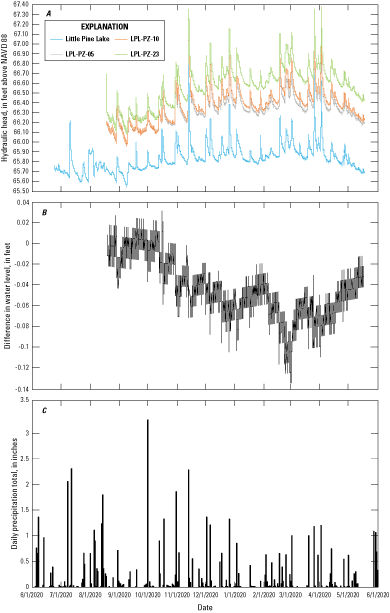
Graphs of A, water level, B, difference in water level between LPL-PZ-05 and LPL-PZ-10, and C, precipitation, Little Pine Lake, New Jersey, 2020–21.
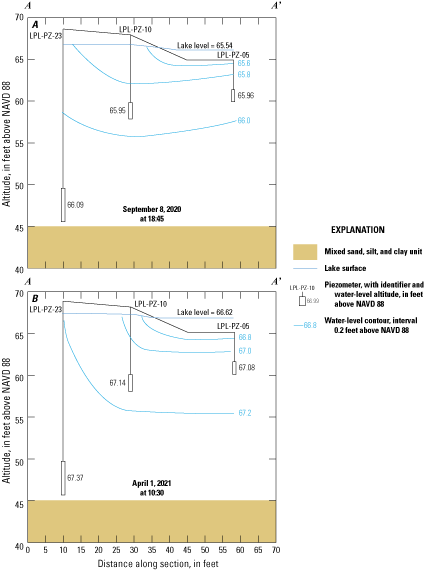
Line of section A-A′ showing water-level contours during A, the approximate minimum, and B, the approximate maximum water-level conditions during the study period of record, Little Pine Lake, New Jersey. NAVD 88; North American Vertical Datum of 1988.
Water-Level Monitoring
Hydrographs of the continuous water-level data from Little Pine Lake are plotted on figure 8, along with a precipitation hyetograph with data from the National Oceanic and Atmospheric Administration (NOAA) Philadelphia-Mt. Holly weather station (National Oceanic and Atmospheric Administration, 2021) located about 13 mi west of Little Pine Lake. Results of water-level monitoring at Little Pine Lake indicate gaining conditions were present throughout the monitoring period. Water level altitudes in Little Pine Lake were consistently lower than water level altitudes in the piezometers (fig. 8A), which indicates a gaining condition, with prevailing flow moving from the aquifer and into the lake. Similar fluctuations in continuous groundwater levels from all piezometers and surface water levels in Little Pine Lake in response to stressors such as precipitation events indicate the piezometers were likely hydraulically connected to the lake and screened in similar aquifer material.
In general, hydraulic gradients at Little Pine Lake were low. The highest groundwater-level altitudes in the deepest piezometer LPL-PZ-23 were rarely greater than 1 ft higher than the Little Pine Lake surface water level; the only instances greater than 1 ft occurred on August 31 and October 30–November 5. Shallow- and intermediate-depth piezometers LPL-PZ-05 and LPL-PZ-10 were typically about 0.5 ft higher than Little Pine Lake. The difference of water level altitudes between LPL-PZ-05 and LPL-PZ-10 was also less than 0.03 ft from August 2020 through mid-fall (fig. 8B), a negligible difference for water-level differences between two sites, thus the water-level altitudes in LPL-PZ-05 and LPL-PZ-10 can be considered approximately equal during this time period. However, the difference became greater later in the fall and through the winter, when LPL-PZ-10 levels were as much as 0.14 ft higher than LPL-PZ-05, which is more strongly indicative of an upward gradient.
Section A-A′ during the approximate lowest (fig. 9A) and highest (fig. 9B) water levels recorded during the monitoring period (September 8, 2020, and April 1, 2021, respectively) is shown in figure 9. During the highest conditions on April 1, water-level altitudes and potentiometric surfaces indicate a flow direction into the lake (fig. 9B). During the lowest conditions on September 8, water-level altitudes in LPL-PZ-05 and LPL-PZ-10 are approximately equal (65.96 and 65.95 ft, respectively). Given the spatial difference between the deeper screen altitude of LPL-PZ-10 compared to LPL-PZ-05, water-level contours on figure 9A indicate the potential for a slight outward direction of flow in the subsurface below the lake from the center toward the edges. This flow may only be a localized effect where shallow groundwater flows outward but is discharged back into the lake, as is drawn on the cross section. Regardless, the water-level altitude in Little Pine Lake was lower than the water-level altitudes in both piezometers and overall indicative of a gaining condition. However, the uncertainty associated with these low hydraulic gradients require additional data to be collected in order to fully assess this hydrology.
The instrumentation to monitor the lake levels was located upstream of the piezometers, so assuming that the flow in Little Pine Lake was always from north to south without reversals of flow direction caused by a buildup of water behind the berm on the downstream end, the lake level near the piezometers may have been slightly lower than at the transducer location. Thus, the gaining condition may be more pronounced. However, because of the presence of the berm downstream of the monitoring equipment, the potential for higher water levels from accumulation behind the berm may cause losing conditions to occur near the berm. Water that is lost to the aquifer could then potentially cause PFAS contamination if that water flows away from the lake, and (or) that water could flow around the berm and discharge back into surface water on the downstream Big Pine Lake side.
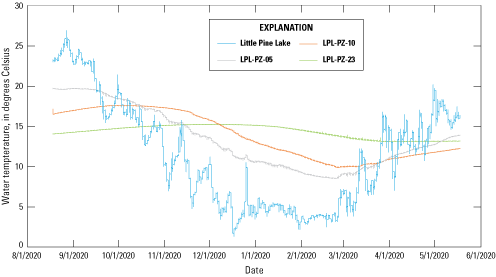
Graph of temperature data over time, Little Pine Lake, New Jersey.
Temperature Monitoring
Temperature monitoring data for Little Pine Lake are shown in figure 10. Diurnal temperature fluctuations in Little Pine Lake were negligible or nonexistent. The surface water would be expected to have strong fluctuations, but the water column above the surface water monitor may have been too deep to see these effects considering the transducer was installed just above the lakebed. However, gaining conditions indicated by water-level data are consistent with the lack of diurnal fluctuations in groundwater. The results of the temperature data are typical of general seasonal effects, with the highest temperatures in late summer and lowest temperatures in winter, except for LPL-PZ-23 with a high in late fall/early winter and a low in summer. The lake level had the greatest seasonal fluctuations and the groundwater piezometers had increasingly smaller seasonal fluctuations with depth, as would be expected.
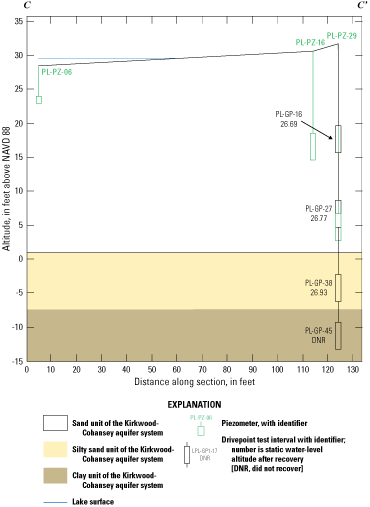
Line of section C-C′ with results of vertical hydraulic profiling, Pine Lake, New Jersey.
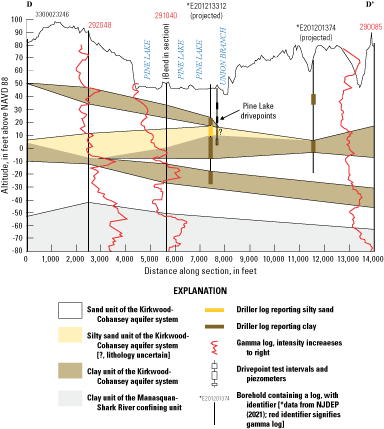
Line of section D-D′ showing context within the regional hydrogeologic framework, Pine Lake, New Jersey. NJDEP, New Jersey Department of Environmental Protection.
Assessment of Pine Lake
Vertical Hydraulic Profiling
The spatial distribution of vertical hydraulic profiling results for Pine Lake are displayed in figure 11 and within the regional hydrogeologic context in figure 12. Four intervals were tested at Pine Lake: PL-GP-45, PL-GP-38, PL-GP-27, and PL-GP-16. The deepest interval, PL-GP-45, was the only interval that failed to recover after pumping, which indicates low permeability and is consistent with the clayey subunit in Kirkwood-Cohansey aquifer system within which the hydrogeologic framework places these depths. The hydrogeologic framework also places interval PL-GP-38 in a silty sand unit, but that interval recovered to static water levels after pumping and likely has a moderate permeability. PL-GP-16 and PL-GP-27 also recovered to a static water level after pumping, consistent with the lack of fine-grained material at those depths.
Altitudes of the recovered water levels indicate an overall upward hydraulic gradient at the borehole location. However, the Pine Lake surface water-level altitude was at least 1.5 ft higher than the highest groundwater level during this time—the lake level is above the lake bottom at piezometer PL-PZ-06, where the lake bottom altitude is 28.42 ft above NAVD 88, and the highest water level altitude during testing was 26.93 ft in PL-GP-38. Therefore, Pine Lake was likely experiencing a losing condition during hydraulic testing. The upward gradient in these piezometers is more likely representative of the upward vertical component of the overall outward flow exiting the lake into the aquifer, which is also illustrated by the water-level data collected in the piezometers described in the Water-Level Monitoring section.
The Kirkwood-Cohansey aquifer system has a greater thickness near Pine Lake owing to its location farther downdip, where the aquifer thickens to more than 150 ft at certain locations, compared to the generally less than 80-ft thickness of the aquifer system near Little Pine Lake (Fiore, 2020). Nearby domestic well E201213312 also has a reported 6-ft-thick clayey unit from 27 to 33 ft depth below land surface, which is a similar depth to the test interval PL-GP-27. Vertical hydraulic profiling tests did not indicate any evidence of this unit, which may pinch out north of the testing location or thin to a thickness with a negligible effect on hydrology. The driller log for E201213312 also describes a black color for this clay unit. A high organic carbon content could cause the color to be black, which is of interest to this study as high organic carbon sediments likely cause sorption of PFAS.
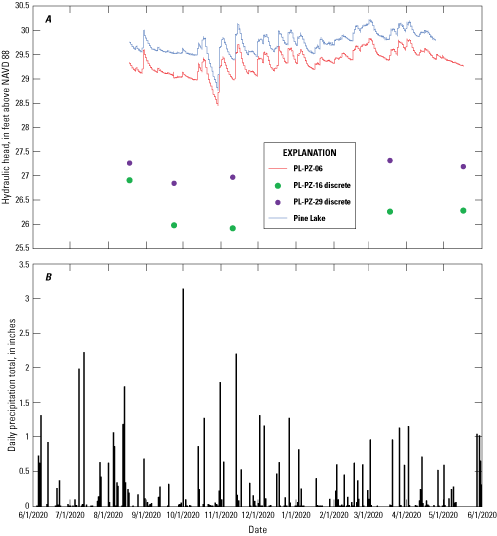
Graphs of A, water levels, and B, precipitation, Pine Lake, New Jersey, 2020–21.
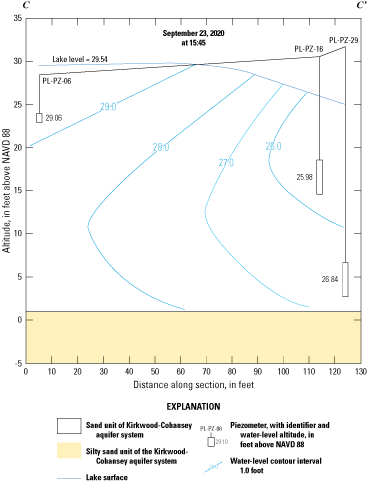
Line of section C-C′ showing water-level contours, Pine Lake, New Jersey. NAVD 88; North American Vertical Datum of 1988.
Water-Level Monitoring
Hydrographs of the continuous water-level data from Pine Lake are plotted on figure 13, along with a precipitation hyetograph of data from the NOAA Philadelphia-Mt. Holly weather station located about 29 mi west of Pine Lake. Surface water-level altitudes ranged from approximately 28.7 to 30.2 ft, and groundwater-level altitudes ranged from about 26.0 to about 29.7 ft. Results of water-level monitoring at Pine Lake indicate losing conditions were present throughout the monitoring period. The water-level altitude in Pine Lake was constantly higher than the groundwater-level altitudes in the piezometers (fig. 13), which indicates an overall downward vertical gradient from the lake into the aquifer. Continuous water-levels from PL-PZ-06 had similar fluctuations to Pine Lake in response to stressors such as precipitation events, so PL-PZ-06 was likely hydraulically well-connected to the lake. Because no continuous data were collected in PL-PZ-16 and PL-PZ-29, the monitoring data cannot indicate their hydraulic connectivity. However, connectivity can be inferred by the results of the vertical hydraulic profiling discussed earlier.
Pine Lake and PL-PZ-06 had about 0.3–0.5 ft water-level difference during the monitoring period. Discrete water levels in PL-PZ-16 and PL-PZ-29 were typically more than 3 and 2 ft deeper than the lake level, respectively. PL-PZ-16 had a lower water-level altitude than PL-PZ-29, consistent with the results of vertical hydraulic profiling. Although these heads would be typical of an upward gradient, the higher lake level is still indicative of an overall losing condition. The apparent upward vertical gradient from PL-PZ-29 to PL-PZ-16 is likely the vertical component of outward and upward flow away from laterally upgradient and (or) more central portions of the lake, particularly in the shallow portion of the overall groundwater flow system along the edge of the lake, as depicted on the hydrologic cross section through these piezometers (fig. 14). The approximately 1-ft differences in water-level altitude between PL-PZ-16 and PL-PZ-29 were greater than water-level altitudes in drive-point test intervals of similar depths (PL-GP-16 and PL-GP-27, respectively), which had a water-level difference of less than 0.1 ft. This discrepancy likely resulted from the test intervals being nested in the same location, but the piezometers in separate boreholes with PL-PZ-29 is located about 10 ft in the upstream direction of PL-PZ-16. The higher head difference likely indicates a strong lateral component imprinted on the overall downward hydraulic flow gradient from a more north-to-south direction, representing incoming flow from farther upgradient at Pine Lake. Flow paths that occur at depths below the observation data available, especially from the center portion of the lake outward toward the edges, likely have an even stronger outward gradient for which the upward and outward component occurs farther from the lake in contrast to the upward and outward component at the shallower depths represented by the piezometer data. These deeper flow paths likely flow through the silty sands below Pine Lake, for which the vertical hydraulic profiling results have shown to not retard groundwater flow to a measurable extent.
The surface water monitoring instrumentation at Pine Lake was located downstream of the piezometers, so the surface-water altitude assessed at the monitoring location may be slightly lower than the surface-water altitude closer to the piezometers. If so, the downward gradients and losing conditions at Pine Lake would likely be larger. Based on the evidence for these losing conditions at Pine Lake, there is a strong possibility that PFAS in Pine Lake has entered the underlying aquifer.
Temperature Monitoring
Results of temperature monitoring at Pine Lake (fig. 15) showed negligible or nonexistent diurnal fluctuations in surface water and groundwater. Observations of minimal fluctuations in surface water temperature, together with the strong downward gradient evident from the water-level data, indicates inconclusive usefulness of the temperature data. The surface water instrumentation was installed in a location where the flow was visibly higher, which may have caused mixing and contributed to the lack of diurnal fluctuation. Groundwater conditions at the surface water sensor location may have also been different that groundwater conditions near the piezometers, and similar to Little Pine Lake, the transducer may have been installed too deep below the lake surface to be affected by air temperature. Similarly, the shallowest piezometer PL-PZ-06 may have been screened too deep below the lake bottom to retain an unattenuated diurnal temperature signal from above. The highest seasonal temperatures occurred in summer and the lowest occurred in winter, as would be expected.
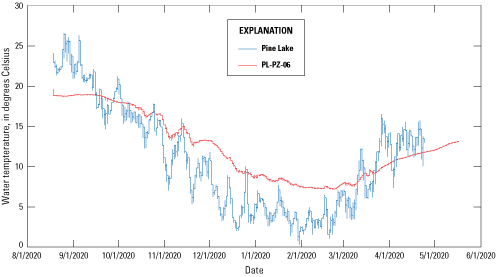
Graph of temperature data over time, Pine Lake, New Jersey.
Limitations
Assumptions inherent in the methods used in this study create limitations for an assessment of gain/loss. First, the continuous monitoring occurs at various depths to account for heterogeneity with depth beneath the lakes, but heterogeneity can also occur laterally, and the lakes can have both gaining and losing conditions at different locations around the lake. Similarly, the vertical gradients and gaining or losing conditions at the edges of the lakes may differ from those in the center of the lakes. Multiple piezometer nests at multiple locations in and around each lake, geophysical methods such as distributed temperature sensing systems that can analyze a larger geographic area and at depth (particularly for gaining conditions), sampling of biological or water-quality tracers such as diatoms, and (or) other instrumentation such as seepage meters would be required for a more complete assessment.
In addition, the determination of whether the lakes are gaining or losing does not rule out or imply PFAS contamination of domestic wells, but only introduces the potential for PFAS contamination of the aquifer near the lake. PFAS can still be present in domestic wells around Little Pine Lake even if gaining conditions are observed, such as for the reasons stated above or from other upgradient sources originating on JBMDL or another location. The reverse is also possible—although a losing condition was indicated at Pine Lake, the domestic wells may not necessarily be contaminated with PFAS if the flow paths to the domestic wells are different than the flow paths PFAS follow when entering the groundwater. The only way to confirm or rule out PFAS contamination in these domestic wells is to sample these wells for PFAS.
Summary and Conclusions
The hydrogeology and gain/loss conditions of Little Pine Lake in Pemberton Township, New Jersey and Pine Lake in Manchester Township, New Jersey were assessed using qualitative vertical hydraulic profiling with a Geoprobe drive-point and continuous monitoring of water levels and temperature in the lakes and in piezometer clusters at various depths in the underlying aquifer from August 2020 to May 2021. This assessment occurred in the context of reported per- and polyfluoroalkyl substances (PFAS) contamination present in these lakes, which would have the potential to contaminate drinking water wells in the surrounding aquifer during losing conditions.
Both lakes are located in the Kirkwood-Cohansey aquifer system. Eight depth intervals were tested for water-level recovery at Little Pine Lake; six of these intervals did not recover to static conditions or were pumped dry, which is indicative of lower permeability aquifer material. This observation was consistent with the silty and clayey sands previously determined to be present in the aquifer system at this location. Four depth intervals were tested at Pine Lake. The three shallowest intervals recovered to static water levels that indicated upward flow of water, but each of these water levels were below the water level in the lake, indicating a losing condition. The deepest test interval did not recover to static water levels, as would be expected by the clay unit at this depth indicated by a nearby driller log.
Continuously monitored water levels at Little Pine Lake and three clustered piezometers show a lower surface water level in Little Pine Lake compared to the groundwater levels in the aquifer, which is indicative of a gaining condition. However, the berm on the downstream end of Little Pine Lake may have a damming effect that may create losing conditions, and there were negligible differences in water-level altitudes between the shallow- and intermediate-depth piezometers from summer through mid-fall compared to measurable differences from mid-fall through spring. Thus, more information is required to fully assess the hydrology of Little Pine Lake and groundwater-surface water as it relates to possible PFAS contamination in the aquifer underlying Little Pine Lake.
Temperature results from Little Pine Lake showed minimal diurnal fluctuation in both surface water and groundwater temperature. Lack of diurnal fluctuations in the groundwater temperature data is consistent with the gaining conditions observed in the water-level data, but the observed data for surface water temperatures generally show larger fluctuations and thus the usefulness of the water temperature data for assessing gaining and losing conditions in this instance is not clear.
One of the three clustered piezometers at Pine Lake was continuously monitored. The remaining two had manual discrete measurements only. Surface water-level altitudes in Pine Lake were always higher than groundwater-level altitudes in all three piezometers. Therefore, Pine Lake likely exhibits a losing condition. This losing condition occurred during the entire period of study. Although the deepest piezometer had a higher water level than the intermediate-depth piezometer, the upward gradient was likely a minor outward flow in the shallow part of the system rather than flow upward toward the lake. Based on the higher lake level at Pine Lake relative to groundwater, conditions are present that allow for transport of PFAS into the underlying aquifer.
Similar to Little Pine Lake, temperature data from Pine Lake showed minimal diurnal fluctuations in surface water and groundwater. Rather than indicate a gaining condition, these results are inconclusive owing to the losing conditions indicated by the water-level data, and the lack of fluctuations likely had another cause unrelated to gaining or losing conditions.
References Cited
Cunningham, W.L., and Schalk, C.W., 2011, Groundwater technical procedures of the U.S. Geological Survey: U.S. Geological Survey Techniques and Methods, book 1, chap. A1, 151 p., accessed July 7, 2021, at https://doi.org/10.3133/tm1A1.
Fiore, A.R., 2016, Hydrogeologic barriers to the infiltration of treated wastewater at the Joint Base McGuire-Dix-Lakehurst Land Application Site, Burlington County, New Jersey: U.S. Geological Survey Scientific Investigations Report 2016–5065, 83 p., accessed August 4, 2020, at https://doi.org/10.3133/sir20165065.
Fiore, A.R., 2020, Regional hydrostratigraphic framework of Joint Base McGuire-Dix-Lakehurst and vicinity, New Jersey, in the context of perfluoroalkyl substances contamination of groundwater and surface water: U.S. Geological Survey Open-File Report 2019–1134, 42 p., accessed July 28, 2020, at https://doi.org/10.3133/sir20105025.
Fiore, A.R., Voronin, L.M., and Wieben, C.M., 2018, Hydrogeology of, simulation of groundwater flow in, and potential effects of sea-level rise on the Kirkwood-Cohansey aquifer system in the vicinity of Edwin B. Forsythe National Wildlife Refuge, New Jersey: U.S. Geological Survey Scientific Investigations Report 2017–5135, 59 p., accessed April 9, 2019, at https://doi.org/10.3133/sir20175135.
Goodrow, S.M., Ruppel, B., Lippincott, L., and Post, G.B., 2018, Investigation of levels of perfluorinated compounds in New Jersey fish, surface water, and sediment, New Jersey: Department of Environmental Protection, SR15-010, 46 p., accessed April 17, 2019, at https://www.nj.gov/dep/dsr/publications/Investigation%20of%20Levels%20of%20Perfluorinated%20Compounds%20in%20New%20Jersey%20Fish,%20Surface%20Water,%2 0and%20Sediment.pdf.
Modica, E., 1996, Simulated effects of alternative withdrawal strategies on ground-water-flow patterns, New Jersey Pinelands: U.S. Geological Survey Water-Resources Investigations Report 95-4133, 46 p., accessed August 8, 2020, at https://doi.org/10.3133/wri954133.
National Oceanic and Atmospheric Administration, 2021, Daily summaries station details: National Oceanic and Atmospheric Administration Global Historical Climatology Network web page, accessed September 2, 2021, at https://www.ncdc.noaa.gov/cdo-web/datasets/GHCND/stations/GHCND:USC00286964/detail.
New Jersey Department of Environmental Protection, 2020, Affirming national leadership role, New Jersey publishes formal stringent drinking water standards for PFOA and PFOS: NJDEP News Release 20/P025, accessed August 5, 2020, at https://www.nj.gov/dep/newsrel/2020/20_0025.htm.
New Jersey Department of Environmental Protection, 2021, DEP DataMiner database: New Jersey Department of Environmental Protection web page, accessed May 17, 2021, at https://www13.state.nj.us/DataMiner.
Nicholson, R.S., and Watt., M.K., 1997, Simulation of ground-water flow in the unconfined aquifer system of the Toms River, Metedeconk River, and Kettle Creek basins, New Jersey: U.S. Geological Survey Water-Resources Investigations Report 97-4066, 100 p., accessed August 4, 2020, at https://doi.org/10.3133/wri974066.
Reilly, T.J., Romanok, K.M., Tessler, S., and Fischer, J.M., 2010, Assessment of physical, chemical, and hydrologic factors affecting the infiltration of treated wastewater in the New Jersey Coastal Plain, with emphasis on the Hammonton Land Application Facility: U.S. Geological Survey Scientific Investigations Report 2010–5006, 59 p., accessed August 8, 2020, at https://doi.org/10.3133/sir20105006.
Stanford, S.D., 2013, Geology of the Keswick Grove quadrangle, Ocean County, New Jersey: New Jersey Geological and Water Survey Open-File Map 100, scale 1:24,000, accessed May 18, 2021, at https://www.state.nj.us/dep/njgs/pricelst/ofmap/ofm100.pdf.
Stanford, S.D., 2016, Geology of the Whiting quadrangle, Ocean and Burlington Counties, New Jersey: New Jersey Geological and Water Survey Open-File Map 113, scale 1:24,000, accessed April 22, 2019, at https://www.state.nj.us/dep/njgs/pricelst/ofmap/ofm113.pdf.
Stonestrom, D.A., and Constantz, J., eds., 2003, Heat as a tool for studying the movement of ground water near streams: U.S. Geological Survey Circular 1260, 96 p., accessed April 17, 2019, at https://pubs.water.usgs.gov/circ1260.
Sugarman, P.J., Carone, A.R., Stroiteleva, Y., Pristas, R.S., Monteverde, D.H., Domber, S.E., Filo, R.M., Rea, F.A., and Schagrin, Z.C., 2018, Framework and properties of aquifers in Burlington County, New Jersey: New Jersey Geological and Water Survey Geologic Map Series GMS 18-3, scale 1:100,00, accessed April 9, 2019, at https://www.nj.gov/dep/njgs/pricelst/gmseries/gms18-3.pdf.
Sugarman, P.J., Monteverde, D.H., Boyle, J.T., and Domber, S.E., 2013, Aquifer correlation map of Monmouth and Ocean Counties, New Jersey: New Jersey Geological and Water Survey Geologic Map Series 13-1, scale 1:100,000, accessed April 9, 2019, at https://www.state.nj.us/dep/njgs/pricelst/gmseries/gms13-1.pdf.
U.S. Air Force, 2016, Site inspection (SI) of fire fighting foam usage at various Air Force bases in the eastern United States—Validated SI results; Joint Base McGuire-Dix-Lakehurst, New Jersey: U.S. Air Force web page, accessed July 28, 2020, at https://www.jbmdl.jb.mil/Portals/47/documents/JB%20MDL%20Verified%20Results.pdf?ver=2016-11-29-081655-927.
U.S. Department of Agriculture, 2019, National Agriculture Imagery Program county mosaic: Geospatial Data Gateway database, accessed May 6, 2021, at https://datagateway.nrcs.usda.gov/GDGHome_DirectDownLoad.aspx.
U.S. Environmental Protection Agency, 2019, EPA’s per- and polyfluoroalkyl substances (PFAS) action plan: U.S. Environmental Protection Agency webpage, EPA 823R18004, accessed August 5, 2020, at https://www.epa.gov/pfas/epas-pfas-action-plan.
U.S. Geological Survey, 2020, USGS water data for the nation: U.S. Geological Survey National Water Information System database, accessed August 4, 2020, at https://doi.org/10.5066/F7P55KJN.
U.S. Geological Survey, 2021, USGS GeoLog locator database: U.S. Geological Survey database, accessed May 17, 2021, at https://doi.org/10.5066/F7X63KT0.
Watt, M.K., Johnson M.L., and Lacombe P.J., 1994, Hydrology of the unconfined aquifer system, Toms River, Metedeconk River, and Kettle Creek Basins, New Jersey, 1987–90: U.S. Geological Survey Water-Resources Investigations Report 93-4110, 5 pl., accessed August 4, 2020, at https://doi.org/10.3133/wri934110.
Watt, M.K., Kane, A.C., Charles, E.G., and Storck, D.A, 2002, Hydrology of the unconfined aquifer system, Rancocas Creek area, Rancocas, Crosswicks, Assunpink, Blacks, and Crafts Creek Basins, New Jersey, 1996: U.S. Geological Survey Water-Resources Investigations Report 2002-4280, 5 pl., accessed August 8, 2020, at https://doi.org/10.3133/wri024280.
Wilde, F.D., Temperature, 2006: U.S. Geological Survey Techniques of Water-Resources Investigations, book 9, chap. 6.1, accessed July 13, 2021, at https://doi.org/10.3133/twri09A6.1.
Conversion Factors
U.S. customary units to International System of Units
Temperature in degrees Celsius (°C) may be converted to degrees Fahrenheit (°F) as follows: °F = (1.8 × °C) + 32.
Datum
Vertical coordinate information is referenced to North American Vertical Datum of 1988 (NAVD 88).
Horizontal coordinate information is referenced to North American Datum of 1983 (NAD 83).
Altitude, as used in this report, refers to distance above the vertical datum.
Abbreviations
AFCEC
U.S. Air Force Civil Engineer Center
AFFF
aqueous film forming foam
EPA
U.S. Environmental Protection Agency
ft
feet
JBMDL
Joint Base McGuire-Dix-Lakehurst
NAD 83
North American Datum of 1983
NAVD 88
North American Vertical Datum of 1988
ng/g
nanograms per gram
ng/L
nanograms per liter
NJDEP
New Jersey Department of Environmental Protection
NOAA
National Oceanic and Atmospheric Administration
NWIS
National Water Information System
ppt
parts per trillion
PFAS
per- and polyfluoroalkyl substances
PFHxS
perfluorohexane sulfonic acid
PFNA
perfluorononanoic acid
PFOA
perfluorooctanoic acid
PFOS
perfluorooctane sulfonic acid
USGS
U.S. Geological Survey
For additional information, contact:
Director, New Jersey Water Science Center
U.S. Geological Survey
3450 Princeton Pike, Suite 110
Lawrenceville, NJ 08648
Or visit our website at: https://www.usgs.gov/centers/nj-water
Publishing support provided by the West Trenton Publishing Service Center
Disclaimers
Any use of trade, firm, or product names is for descriptive purposes only and does not imply endorsement by the U.S. Government.
Although this information product, for the most part, is in the public domain, it also may contain copyrighted materials as noted in the text. Permission to reproduce copyrighted items must be secured from the copyright owner.
Suggested Citation
Fiore, A.R., Witzigman, C.M., and Reiser, R.G., 2021, Hydrogeology and gain/loss assessment of two lakes contaminated with per- and polyfluoroalkyl substances, vicinity of Joint Base McGuire-Dix-Lakehurst, New Jersey, 2020–21: U.S. Geological Survey Scientific Investigations Report 2021–5107, 24 p., https://doi.org/10.3133/sir20215107.
ISSN: 2328-0328 (online)
Study Area
| Publication type | Report |
|---|---|
| Publication Subtype | USGS Numbered Series |
| Title | Hydrogeology and gain/loss assessment of two lakes contaminated with per- and polyfluoroalkyl substances, vicinity of Joint Base McGuire-Dix-Lakehurst, New Jersey, 2020–21 |
| Series title | Scientific Investigations Report |
| Series number | 2021-5107 |
| DOI | 10.3133/sir20215107 |
| Publication Date | October 12, 2021 |
| Year Published | 2021 |
| Language | English |
| Publisher | U.S. Geological Survey |
| Publisher location | Reston, VA |
| Contributing office(s) | New Jersey Water Science Center |
| Description | Report: viii, 24 p.; Database: 2 |
| Country | United States |
| State | New Jersey |
| Other Geospatial | Joint Base McGuire-Dix-Lakehurst |
| Online Only (Y/N) | Y |
| Additional Online Files (Y/N) | N |