

Sediment Transport in the Yankee Fork of the Salmon River near Stanley, Idaho, Water Years 2012–19
Links
- Document: Report (4.3 MB pdf) , HTML , XML
- Data Release: USGS data release - Synthetic streamflow regressions and daily mean streamflow estimates at three sites on the Yankee Fork Salmon River near Clayton, ID, Water Years 2012-2019
- Download citation as: RIS | Dublin Core
Abstract
Placer and dredging operations in the Yankee Fork Basin, Idaho, have left more than 5 miles of the lower Yankee Fork of the Salmon River (Yankee Fork) in a highly altered fluvial condition, resulting in poor habitat quantity and quality for native fish species. Since 2011, the Bureau of Reclamation and other stakeholders have implemented a series of restoration efforts to improve the connectivity of the river with its floodplain and to improve aquatic and terrestrial habitat in the Yankee Fork. In conjunction with these rehabilitation efforts, the U.S. Geological Survey monitored streamflow and suspended-sediment and bedload transport during water years 2012–19 at four sites in the affected lower reach of the Yankee Fork. The objectives of the monitoring were to (1) identify source areas of sediment, (2) quantify sediment transport in the lower Yankee Fork, and (3) provide a benchmark to evaluate the effects of rehabilitation efforts in the basin.
During the 8 years of sampling, the annual flow-weighted suspended-sediment concentrations (SSCs) were largest at the most downstream Clayton site, ranging from a low of 11 milligrams per liter (mg/L) in 2015 to 145 mg/L in 2017. The Clayton site also had the largest flow-weighted concentrations of suspended sand and suspended fines. At relatively low streamflow, the fine-grained fraction of the suspended sediment was the dominant component of the SSC at all sites, with an increase in the sand-size fraction as streamflow increased during snowmelt runoff. Each of the three main-stem Yankee Fork sites indicated a large amount of hysteresis in SSCs during snowmelt runoff, with concentrations on the rising limb of the hydrograph larger than concentrations on the falling limb at similar streamflow. Hysteresis was particularly evident in the fine-grained fraction of suspended sediment, indicating that sediment transport in the lower Yankee Fork is more limited by the supply of fine-grained sediment as compared to coarser-grained sediment.
Bedload samples were collected starting in water year 2016, with sampling limited to spring snowmelt runoff when streamflow was sufficiently large to transport coarse-grained bottom material. The mean median grain size (D50) at the Bonanza, West Fork, Confluence, and Clayton sites was 2.7, 1.8, 6.0, and 12 millimeters, respectively. In contrast to SSCs, bedload discharge did not show an appreciable degree of hysteresis, typical of many transport-limited streams where a large supply of coarse-grained bottom material is available for transport. However, the bedload showed a general coarsening from sand to gravel-size material as streamflow increased in response to snowmelt runoff.
Suspended-sediment load (SSL) and bedload transport in the Yankee Fork was quantified using the modeling program R-LOADEST to relate SSL and bedload discharge to variations in streamflow at each of the four sites. The models provided an excellent fit to the data, with coefficient of determination (R2) values greater than 80 percent at all sites and for all sediment constituents. Annual and multi-year loads, or mass flux, for suspended sediment, suspended-sediment size fractions, and bedload were estimated using the R-LOADEST models to determine which reaches in the Yankee Fork generate and transport alluvial sediment and various size fractions.
During water years 2012–19, based on the summation of the suspended sand and suspended fines load, the Yankee Fork transported about 117,000 tons of suspended sediment to the Salmon River, about 56 percent of the total being suspended sand. Almost 55 percent of the SSL discharged from the Yankee Fork to the Salmon River during water years 2012–19 occurred during water year 2017. The watershed upstream from the Bonanza site, which accounts for 55 percent of the watershed area of the Yankee Fork, contributed 47 percent of the mean streamflow, 27 percent of the SSL, 36 percent of the suspended fines, and 20 percent of the suspended sand discharged to the Salmon River during water years 2012–19. The intervening drainage area between the Bonanza and Confluence sites, including the West Fork of the Yankee Fork, contributed 43 percent of the mean streamflow, 29 percent of the SSL, 31 percent of the suspended fines, and 28 percent of the suspended sand during water years 2012–19. The reach between the Confluence and Clayton sites, which accounts for only 13 percent of the watershed area and contributes only 10 percent of the mean streamflow, accounted for 44 percent of the SSL, 33 percent of the suspended fines, and 52 percent of the suspended sand delivered to the Salmon River during water years 2012–19.
The addition of bedload sampling starting in water year 2016 allowed for an estimate of the total sediment load (suspended sediment and bedload) and the relative contribution of bedload to the transport of sediment in the Yankee Fork. During water years 2016–19, bedload accounted for 10 percent of the total sediment load at the Bonanza and Confluence sites and 20 percent of the total sediment load at the Clayton site. The total bedload discharged to the Salmon River during water years 2016–19, as measured at the Clayton site, was about 22,700 tons, with 75 percent of the total generated in the reach of the Yankee Fork downstream from the Confluence site. During water years 2016–19, the Yankee Fork discharged about 114,000 tons of sediment (both suspended sediment and bedload) to the Salmon River. Of this total, 47 percent was suspended sand, 33 percent was suspended fines, and 20 percent was bedload. Water year 2017 accounted for 75 percent of the total sediment load and 81 percent of the bedload discharged to the Salmon River during water years 2016–19.
The addition of suspended-sediment and bedload sampling at the West Fork site starting in water year 2018 allowed for quantification of sediment inputs from the West Fork to the main stem of the Yankee Fork between the Bonanza and Confluence sites. The West Fork accounted for 56 percent of the total sediment load, and all the bedload accrued between the Bonanza and Confluence sites during water years 2018–19. Of 3,890 tons of total sediment discharged from the West Fork during water years 2018–19, about 42 percent was suspended fines, 35 percent was suspended sand, and 23 percent was bedload. Although the West Fork accounted for 39 percent of the mean streamflow, it accounted for only 17 percent of the total sediment load discharged to the Salmon River from the Yankee Fork during water years 2018–19.
Introduction
The Yankee Fork of the Salmon River (Yankee Fork) is located in central Idaho and is one of the larger watersheds (about 190 square miles [mi2]) in the upper Salmon River subbasin (fig. 1). The Yankee Fork has been identified as critical habitat under the Endangered Species Act and is considered a high-priority habitat in National Oceanic and Atmospheric Administration National Marine Fisheries Service Federal Columbia River Power System 2008 Biological Opinion (National Oceanic and Atmospheric Administration, 2010). Fish species of interest in the Yankee Fork Basin include spring/summer Chinook salmon (Oncorhynchus tshawytscha), steelhead (Oncorhynchus mykiss), bull trout (Salvelinus confluentus), and westslope cutthroat (Oncorhynchus clarkii lewisi).
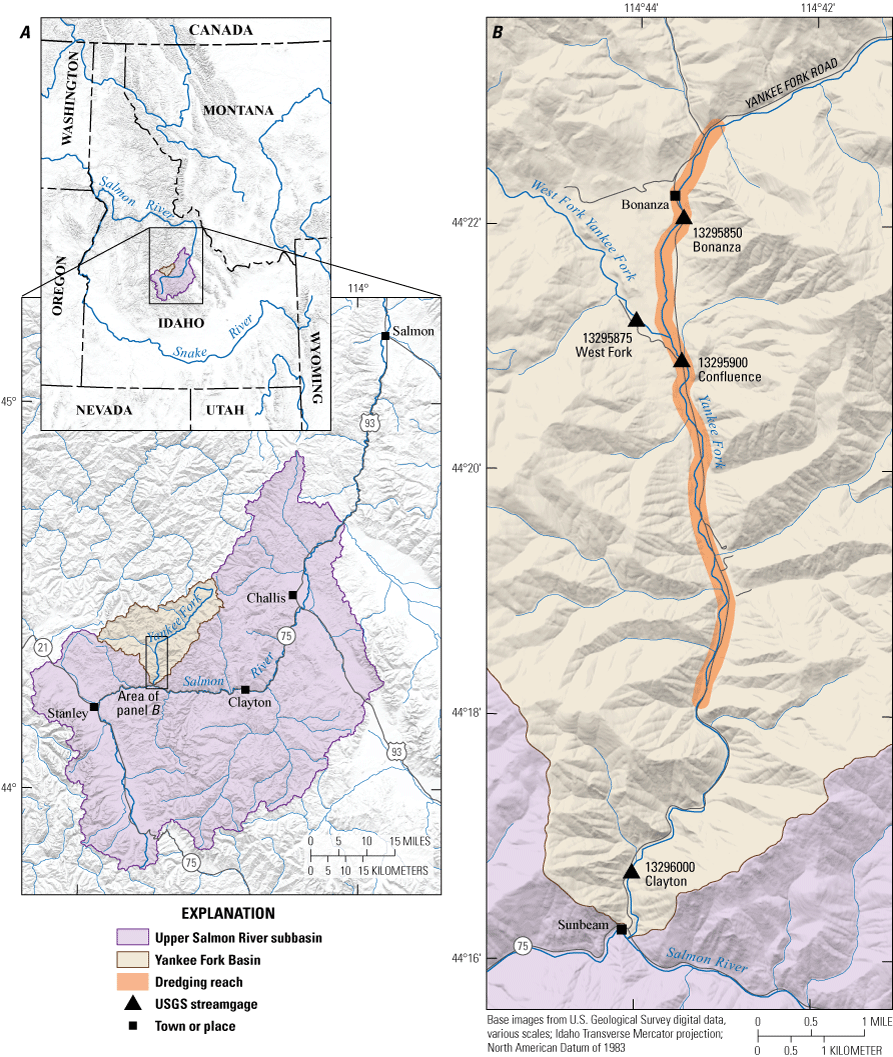
Locations of the U.S. Geological Survey (USGS) streamgage sampling sites in the Yankee Fork of the Salmon River near Stanley, Idaho.
Various mining activities have occurred in the Yankee Fork Basin since the late 19th century (Rhea and others, 2013). Dredging operations during 1940–52 altered a substantial part of the Yankee Fork and left more than 5 miles of the lower reach of the Yankee Fork in a highly altered and unnatural state (Bureau of Reclamation, 2012a, 2013). As a result, much of the lower Yankee Fork is a fluvial system characterized by disconnected off-channel habitats, confined stream channels, disconnected historical floodplains, and lack of vegetation, resulting in poor habitat quantity and quality for native fish species (Richards and others, 1992; Bureau of Reclamation, 2012b, 2012c).
To improve aquatic and terrestrial habitat in the Yankee Fork, the Bureau of Reclamation (Reclamation) and other stakeholders collaborated on the dredge tailings restoration and Yankee Fork rehabilitation projects (Gregory and Galloway, 2019). The objectives of these restoration efforts were to (1) reconnect the historical channel and floodplain; (2) re-establish connectivity with tributaries; and (3) enhance floodplain, tributary, and instream complexity. The monitoring and adaptive management aspects of the restoration projects would provide baseline data of pre-rehabilitation conditions (Kondolf, 1995; Kondolf and Micheli, 1995). These data would then be used to help with channel design by providing the thresholds for substrate mobility, and to adapt rehabilitation actions to maximize efforts (Wood and Armitage, 1997).
In conjunction with these rehabilitation efforts, the U.S. Geological Survey (USGS) monitored streamflow and collected suspended and bedload-sediment samples during water years 2012–19 at four sites in the lower Yankee Fork as defined by Gregory and Galloway (2019): Yankee Fork Salmon River at Bonanza Bridge, Idaho (USGS streamgage 13295850); West Fork of Yankee Fork near Bonanza Bridge, Idaho (USGS streamgage 13295875); Yankee Fork Salmon River below West Fork near Bonanza, Idaho (USGS streamgage 13295900); and Yankee Fork Salmon River near Clayton, Idaho (USGS streamgage 13296000) (hereinafter referred to as the Bonanza, West Fork, Confluence, and Clayton sites, respectively; fig. 1; table 1). The USGS monitoring approach and preliminary results were described by Johnsen (2018).
Table 1.
U.S. Geological Survey streamgage sites where streamflow was measured and sediment samples collected in the Yankee Fork of the Salmon River, Idaho, water years 2012–19.[Latitude and Longitude are based on North America Datum of 1983. Indexed sites were those correlated to the continuous site. Locations of U.S. Geological Survey (USGS) streamgage sites are shown in figure 1. Abbreviations: abv, above; ID, Idaho; No., number; nr, near; WF, West Fork; ft3/s, cubic feet per second; mi2, square miles]
Purpose and Scope
This report documents findings based on streamflow and sediment data collected by the USGS, in cooperation with Reclamation, during water years 2012–19 at three sites on the lower Yankee Fork and one site on the West Fork of the Yankee Fork. Specifically, the report examines streamflow and suspended-sediment and bedload data to (1) improve the understanding of the river hydrodynamics on a spatial and temporal scale in controlling sediment transport in the lower Yankee Fork, (2) identify the dominant subbasins and reaches in the Yankee Fork and tributaries contributing to the sediment load in the lower Yankee Fork, (3) quantify sediment transport in the Yankee Fork from the Bonanza site downstream to the Clayton site and subsequent sediment delivery to the Salmon River, and (4) provide benchmark conditions to compare pre- and post-rehabilitation sediment transport regimes to evaluate the effects of rehabilitation efforts in the Yankee Fork Basin.
Methods of Data Collection and Analysis
Over the period of water years 2012–19, the sampling network on the Yankee Fork was expanded based on the study findings and increases in funding. Starting in water year 2012, streamflow data and suspended-sediment samples were collected at the Bonanza, Confluence, and Clayton sites (main-stem sites). Bedload sampling was added to the three main-stem sites starting in water year 2016, and the West Fork site was added in water year 2018. Data collection included measurement of streamflow and collection of suspended-sediment and bedload samples (table 1). This section of the report documents the methods used for collecting and analyzing the data. Further descriptions of the USGS methods used during this study are available in Johnsen (2018).
Streamflow
Streamflow measurements at all sites in this study were obtained using standard USGS methods (Turnipseed and Sauer, 2010). At the Clayton site, the most downstream site on the Yankee Fork (fig. 1), continuous streamflow was measured using an established streamgage with a continuous record of water stage calibrated to periodic onsite measurements. For the other three sites in this study without continuous record (Bonanza, West Fork, and Confluence), streamflow was measured on the day that sediment samples were collected and subsequently indexed to the continuous streamflow record at the gaged Clayton site. The correlation (coefficient of determination [R2] = 97–99 percent) between the measured streamflow at the indexed sites and the gaged Clayton site was used to generate a synthetic daily mean streamflow record for the Bonanza, West Fork, and Confluence sites over the time period during which sediment data were collected. Ducar and Fosness (2021) described in depth the method used to develop the synthetic streamflow records for the Bonanza, West Fork, and Confluence sites using the continuous record from the gaged site at Clayton.
Suspended Sediment and Bedload
Streams transport sediment by carrying the finer particles in suspension (suspended sediment) with turbulent eddies and by rolling or skipping coarser particles along the streambed (bedload). The total suspended-sediment concentration (SSC) consists of fine-grained particles (<62.5 micrometers [μm]) and sand-sized particles (>62.5 μm). Suspended sediments generally move downstream at about the same velocity as the water, and the discharge of suspended sediment usually is dependent on the available supply of fine-grained (fines) and sand-sized (sand) sediment. When the supply of fines and sand in the floodplain and stream channel is less than what the stream can transport, it is a supply-limited transport regime (Wilcock and others, 2009). Sediment that moves on or near the stream bottom by sliding, rolling, or bouncing is bedload (Edwards and Glysson, 1999). In contrast to finer-grained suspended sediment, the supply of coarse-grained (sand-size and larger) sediments in gravel-bed streams often is greater than the stream can transport. In a typical fluvial system, coarse-grained sediments remain at rest on the streambed, with bedload transport occurring only when the streamflow reaches a velocity sufficient to transport the coarse-grained bed sediment (Emmett and Wolman, 2001). When stream velocity is the limiting factor in the transport of bed sediment, it is a transport-limited regime. The total sediment load in a stream is the sum of the suspended-sediment load (SSL) plus the bedload. Because the particle-size distribution of both the suspended load and bedload is a function of streamflow, much variation can be expected in the concentration and grain-size characteristics of sediments both spatially at different locations in a stream and temporally with seasonal and annual changes in the magnitude of streamflow (Wilcock and others, 2009).
Suspended Sediment
In supply-limited and unregulated, snowmelt-driven streams, SSCs on the rising limb of the snowmelt runoff hydrograph typically are higher than those measured at equivalent streamflow on the falling limb. This difference in sediment concentrations over the hydrograph is termed hysteresis and is caused by the flush of sediments stored over the winter or seasonally in the floodplain and stream channel. As a result of hysteresis, sediment concentrations typically are largest prior to the hydrograph peak, and then decrease following the peak once the stored sediment supply has been depleted. To account for hysteresis, sediment samples were collected 5–8 times per year with sampling targeted to capture a wide range of streamflow conditions on the rising limb, the peak, and the falling limb of the snowmelt runoff hydrograph (fig. 2). However, because the Yankee Fork is unregulated upstream from the sampling sites, streamflow can be highly variable. During numerous years, snowmelt runoff occurred in a series of events that made identification and sampling of the rising and falling limbs and the annual hydrograph peak difficult.
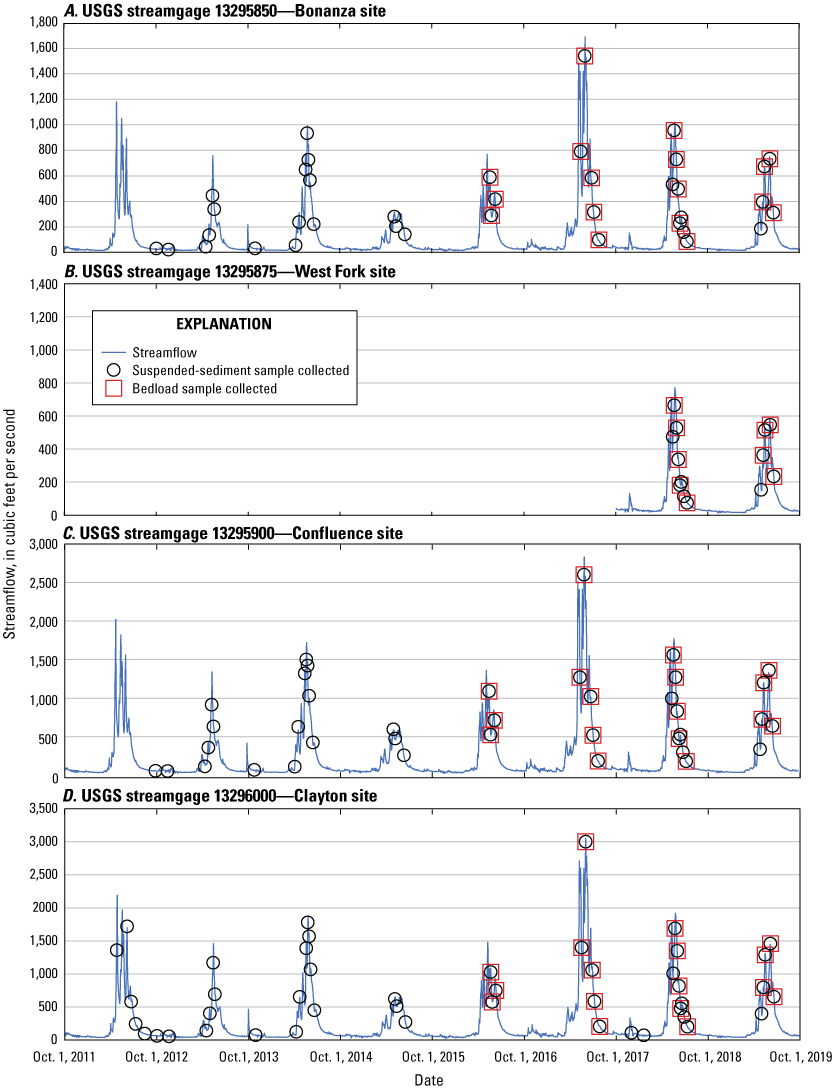
Streamflows at which suspended-sediment and bedload samples were collected at four U.S. Geological Survey (USGS) streamgage sites in the Yankee Fork Basin, Idaho, water years 2012–19.
During this study, 45 suspended-sediment samples were collected at the Clayton site, 38 samples each were collected at the Bonanza and Confluence sites, and 14 samples were collected at the West Fork site (table 1). All sediment samples were collected using standard USGS methods, procedures, and equipment as documented by Edwards and Glysson (1999) and U.S Geological Survey (variously dated).
Suspended-sediment samples were collected using an isokinetic D-96 collapsible-bag sampler suspended from a bridge using equal-width and depth-integrating techniques. Use of the D-96 allows for isokinetic sampling over a wide range of stream depths and velocities (Davis, 2005; Gray and others, 2008). For collection of suspended-sediment samples, the total stream width was divided into 10 equal-width increments, and individual depth-integrated samples were collected at the centroid of each increment. Individual samples from each centroid were composited in 3-liter bottles until the entire cross section of the stream was sampled. Following collection, samples were sent to the USGS Cascade Volcano Observatory (CVO) sediment laboratory in Vancouver, Washington, where they were composited into a single sample and analyzed for SSC and particle-size fractions less than 62.5 μm (fines). A detailed description of the techniques used for the USGS laboratory analysis of suspended sediment is provided by Guy (1969).
For this study, SSL and the fine-grained and sand-sized fraction loads of suspended sediment were simulated using R-LOADEST (Runkel and others, 2004; R Core Team, 2020). The R-LOADEST package (available at https://github.com/USGS-R/rloadest) is an implementation of the LOAD ESTimator (LOADEST) program for estimating constituent loads in streams and rivers (Runkel and others, 2004). R-LOADEST is based on a rating-curve method (Cohn and others, 1989, 1992; Crawford, 1991) that uses regression to estimate constituent load in relation to several predictor variables related to streamflow and time. The model has been used to estimate sediment transport and sediment loads in the Snake and Clearwater River Basins of Idaho and Washington, the basin flux of water-quality constituents in the Mississippi River Basin, trace-metal transport in the Spokane River Basin, and long-term trends in the water quality of rivers and streams from across the Nation (Smith and others, 1987; Goolsby and others, 1999; Clark and others, 2013; Clark and Mebane, 2014).
For the Bonanza, Confluence, and Clayton sites, SSL and size-fraction loads were estimated for water years 2012–19; for the West Fork site, loads were estimated for water years 2018 and 2019. For consistency, and because the fit of the R-LOADEST models at all four sites for SSL and size fractions were excellent using only the streamflow parameters (table 2), the time-related variables in R-LOADEST were not incorporated in the models. Thus, the R-LOADEST models for the SSL and separate size fractions reduced to the following:
Table 2.
Regression coefficients and coefficients of determination for models used to estimate concentrations and loads of suspended sediment, suspended-sediment size fractions, and bedload at four sites in the Yankee Fork Basin, Idaho, water years 2012–19.[Regression form for suspended sediment is ln(L)=I+aln(Q)+bln(Q2), where L is the sediment load in tons per day; I is the regression intercept; ln(Q)=ln(streamflow) - center of ln(streamflow), in cubic feet per second; and a and b are regression coefficients. Regression form for bedload is ln(L)=I+aln(Q), where L is the bedload discharge in tons per day; I is the regression intercept; ln(Q)=ln(streamflow) – center of ln(streamflow), in cubic feet per second; and a is a regression coefficient or transport rate, Abbreviations: R2, coefficient of determination; USGS, U.S. Geological Survey; —, not applicable]
SSL
is the suspended-sediment load, in tons per day;
I
is the regression intercept;
Q
is the centered streamflow, in cubic feet per second;
a and b
are regression coefficients that remain constant over time; and
ε
is unaccounted error associated with the regression model.
Site-specific estimates of the daily SSL and size fractions were computed using the selected model (table 2) and daily mean streamflow at each site. Bias introduced by conversion of the logarithm of load into estimates of actual load were corrected using the Bradu-Mundlak method (Bradu and Mundlak, 1970). An annual mean flow‐weighted concentration (FWC) for the total suspended sediment and size fractions was estimated as the annual load divided by the total annual streamflow volume. The FWC can be used to normalize the data so that SSCs at different sites are comparable when samples are collected at different frequencies and during different hydrologic conditions.
Bedload
The coarse-grained bottom sediment in most gravel-bed streams generally is immobile during most of the year. In the Yankee Fork, streamflows sufficient to move coarse-grained sediment (bedload) generally occur only during snowmelt runoff, primarily in May and June. When bedload transport does occur, it often is intermittent, spatially variable within the stream, and temporally variable during steady streamflow conditions (Emmett and Wolman, 2001; Wilcock and others, 2009).
During this study, 17 bedload samples each were collected at the Bonanza, Confluence, and Clayton sites, and 10 samples were collected at the West Fork site (table 1). All bedload samples were collected concurrently with suspended-sediment samples and when streamflow was sufficiently high to initiate bedload transport (fig. 2). Bedload samples were collected with an Elwha-style sampler with a 4-in by 8-in nozzle and using an equal-width-increment sampling method as described by Hubbell (1964) and Edwards and Glysson (1999). This method involves dividing and sampling the stream channel in evenly spaced sections to accurately represent bedload transport across the entire channel. When possible, samples were collected at 20 equally spaced intervals with duration of 60 seconds on the stream bottom per interval. At some of the sites and at some streamflows, fewer than 20 sections were sampled because of extremely fast and turbulent stream conditions. For analysis, all sectional samples were composited into one sample representing the entire cross section. At each site, a duplicate cross-sectional sample was collected during each sampling event and analyzed separately at the USGS CVO sediment laboratory in Vancouver, Washington. Duplicates were compared for quality assurance and repeatability, but for analysis purposes, the duplicate samples are reported as an average. The bedload samples were analyzed for total mass and full particle size increments from 0.0625 to 128 millimeters (mm). The grain size and statistics software GRADISTAT was used to classify the particle-size distribution, textural group, and sorting (Blott and Pye, 2001).
Because of substantial variability in the spatial and temporal pattern of bedload, transport curves relating bedload to streamflow generally have a greater degree of uncertainty than do transport curves for suspended sediment. To estimate the bedload transport on the day of sampling, the following equation (Edwards and Glysson, 1999), was used:
whereQb
is bedload discharge, in tons per day;
k
is a conversion factor specific to the sampler orifice (0.141 for the Elwha sampler);
W
is the total stream width, in feet;
M
is the total mass of the bedload sample, in grams; and
T
is the total time the sampler was on the bed, in seconds.
To estimate daily, monthly, and annual bedload, R-LOADEST was used to find the best fit log-log regression between streamflow and bedload discharge using the daily mean streamflow at each site. As with the SSL estimates, bias introduced by conversion of the logarithm of bedload into estimates of actual bedload was corrected using the Bradu-Mundlak method (Bradu and Mundlak, 1970). Thus, the R-LOADEST models for bedload discharge reduced to the following:
whereL
is the bedload discharge, in tons per day;
I
is the regression intercept;
Q
is the centered streamflow, in cubic feet per second;
a
is the regression coefficient, or transport rate, that remains constant over time; and
ε
is unaccounted error associated with the regression model.
Daily bedload discharges were summed to determine an annual bedload discharge. Although the fit of the log-log regressions for bedload discharge at all sites was good (R2 = 83–95 percent, table 2), because of the small number of samples collected, the bedload discharge estimates at all four sites should be viewed with discretion.
Sediment Characteristics and Loads
Because sediment transport varies in response to runoff conditions, historical information on streamflow in the Yankee Fork is valuable for assessing the representativeness of the data collected during this study and subsequently used to estimate sediment loads in the Yankee Fork. The magnitude and timing of streamflow in the Yankee Fork primarily is determined by the amount of water produced from the winter snowpack and the timing of the snowmelt runoff. As such, streamflows in the Yankee Fork and its tributaries typically rise rapidly in the spring as the snowpack melts and reach the peak in May or June (fig. 3). Generally, when precipitation and snowpack are below average, such as during water year 2015, streamflow runoff is reduced, and transport of sediment in streams is below average. However, even during below-average years, rapid warming of the snowpack may result in substantial runoff events and high rates of sediment transport. In contrast, when precipitation, snowpack, and runoff are above normal, such as during water year 2017, sediment transport is generally larger than average. Streamflow in the Yankee Fork typically declines gradually over the summer following the peak, with base streamflow conditions occurring in fall and through the winter.
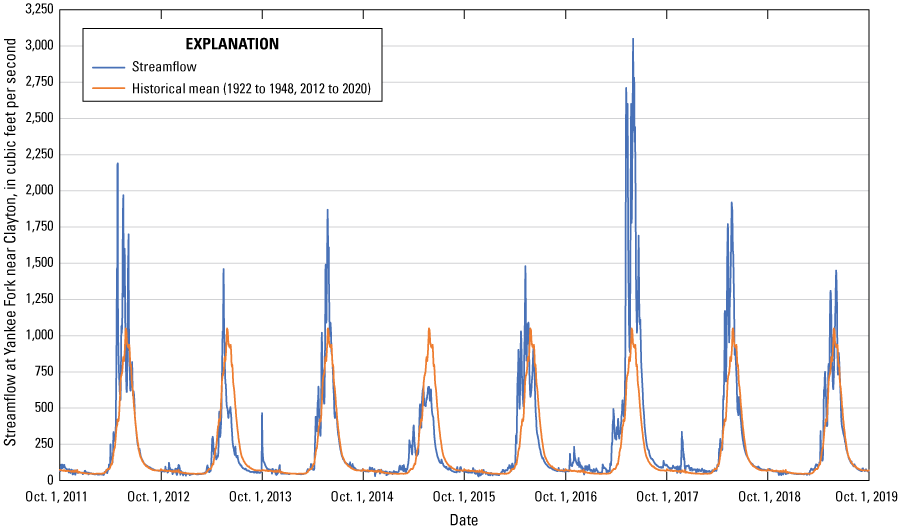
Streamflow at the Clayton site of the Yankee Fork of the Salmon River, Idaho, during water years 2012–19, compared to the historical mean streamflow.
During water years 2012–19, streamflow in the Yankee Fork, as represented by streamflow at the gaged Clayton site, was variable in relation to 33 years of historical streamflow record (water years 1922–48 and 2012–20) (fig. 3; U.S. Geological Survey, 2021). During water years 2012, 2017, and 2018, streamflow at the Clayton site exceeded the long-term mean during most of the year, particularly during spring runoff. In the Yankee Fork, as well as in most of the Salmon River Basin and much of Idaho, water year 2017 was one of the largest water years recorded during the last 100 years of streamflow record. During water years 2013 and 2015, streamflow in the Yankee Fork was less than the historical mean for most of the year and exceeded the historical mean only during brief periods early in the spring.
Suspended-Sediment Concentrations
Concentrations of suspended sediment in the Yankee Fork were variable, spanning 3–4 orders of magnitude during water years 2012–19 (table 3). The maximum measured SSCs and individual size fractions at the Bonanza, Confluence, and Clayton sites occurred in May and June 2017, coinciding with the hydrograph peak for 2017. At each of the three main-stem sites, the SSCs collected during the peak streamflow of 2017 were more than double the SSCs of any other samples collected during 2012–19. The largest mean and median SSCs, size fraction concentrations, and bedload discharge were measured at the Clayton site (table 3); the smallest concentrations and bedload discharge were measured at the West Fork site. However, because the West Fork site was not sampled during water year 2017, the dataset for the West Fork is not necessarily comparable to the dataset for the main-stem sites.
Table 3.
Summary statistics for streamflow, suspended-sediment concentrations, and bedload at four sites in the Yankee Fork Basin, Idaho, water years 2012–19.[Abbreviations: D50, median grain size; USGS, U.S. Geological Survey; ft3/s, cubic feet per second; mg/L, milligrams per liter; mm, millimeter]
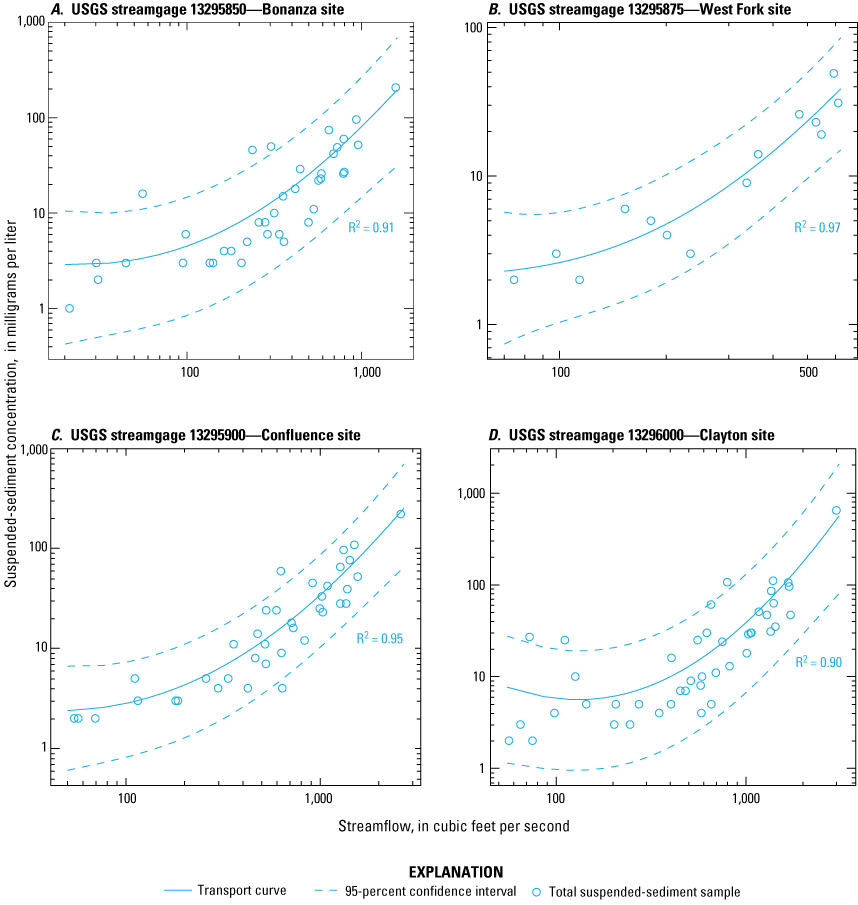
The large amount of scatter in the transport curves for SSCs and individual size fractions (fig. 4) is attributable partly to hysteresis in the concentrations during snowmelt runoff. When streamflow increases, especially early in the spring, materials stored within the stream channel or in riparian and terrestrial zones become mobile as they are subjected to increased stream velocities. The magnitude of hysteresis can be affected by antecedent conditions as well as the magnitude of the streamflow event or events generating hysteresis. Because of hysteresis, transport curves such as those shown in figure 4 are variable and often are marginal predictors of SSCs (R2 = 53–87 percent). In some years, multiple cycles of hysteresis might occur as streamflow rises and falls in response to varying patterns of snowmelt runoff. In the plots of figure 4, points above the transport curve typically represent samples collected on the rising limb and near the peak of the snowmelt hydrograph; points below the transport curve typically represent samples collected on the falling limb.
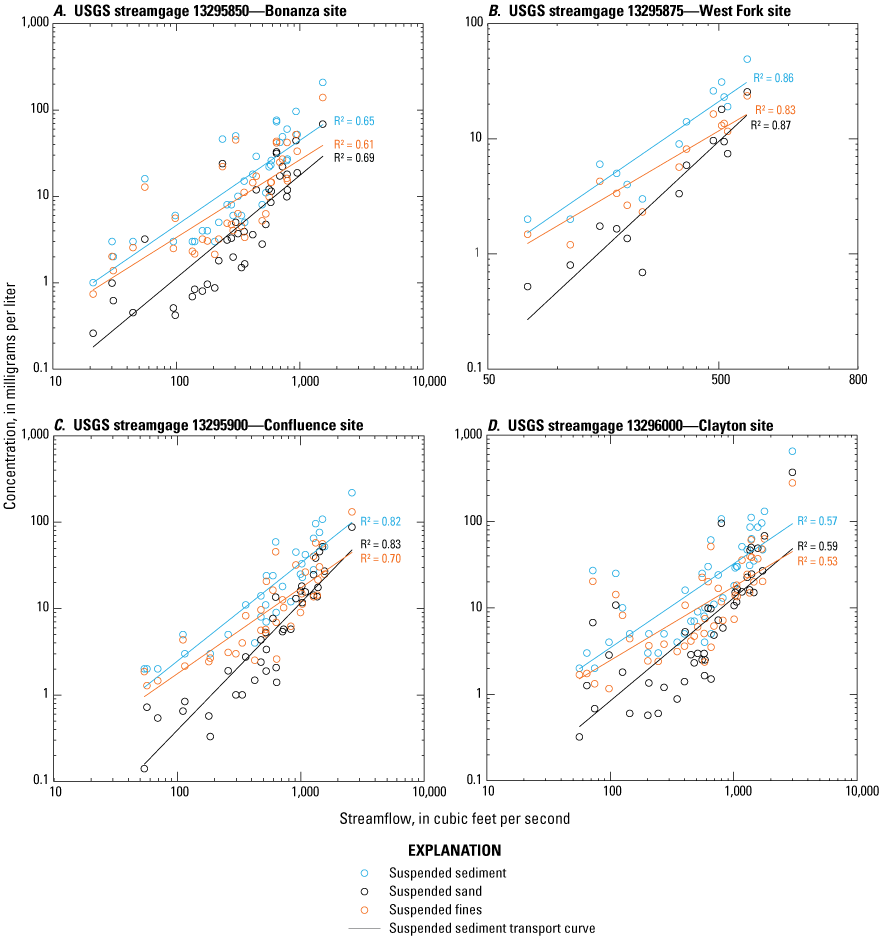
Suspended-sediment concentration transport curves representing best-fit regressions relating streamflow to concentrations of suspended sediment and size fractions at four sites in the Yankee Fork Basin, Idaho, water years 2012–19. R2, coefficient of determination.
The slopes of the transport curves in figure 4 indicate that, at all sites, the concentrations of the fine-grained fraction of SSC are larger than the concentration of sand-size fraction at low streamflows. As streamflow increases, the sand-size concentration at all sites increases more rapidly (steeper slope) than the concentration of fines until they become equivalent. Based on the transport curves shown in figure 4, at the Bonanza, Confluence, and Clayton sites, the sand and fine-grain fractions of the SSC become equivalent somewhere between streamflows of 2,000 and 3,000 ft3/s; at higher streamflows, the sand-sized fraction becomes the dominant component of the SSC. Based on the transport curves at the West Fork site, suspended sand becomes the dominant component of the SSC at a streamflow between 500 and 600 ft3/s.
Because use of typical transport curves such as those in figure 4 can substantially underestimate sediment concentrations, particularly at peak streamflow, use of these curves to determine annual and seasonal SSLs would result in a large underestimate of the actual SSLs. Inclusion of the quadratic Q2 term in the R-LOADEST models (eq. 1) provided a much better fit (higher R2 values) at all four sites (fig. 5) and substantially improved the ability of the models to estimate seasonal and annual SSLs.
Suspended-sediment concentration transport curves representing best-fit regressions using R-LOADEST models to relate streamflow to concentrations of suspended sediment at four sites in the Yankee Fork Basin, Idaho, water years 2012–19. R2, coefficient of determination.
The effect of hysteresis on SSCs is evident in samples collected during water year 2014 at the Bonanza, Confluence, and Clayton sites (fig. 6). Streamflow in the Yankee Fork peaked on May 25, 2014, before declining rapidly in late May and into June. Samples collected on the rising limb of the hydrograph and prior to May 25 had larger SSCs per unit streamflow than samples collected on the falling limb following the peak. The amount of hysteresis in the SSCs seems to be strongly influenced by the particle-size distribution as well. Fine-grained suspended sediments showed a more pronounced hysteresis than the sand-size fraction at all three of the sites (fig. 6). The pronounced “flush” of suspended sediment in the early part of snowmelt runoff seems to represent primarily fine-grained material stored in the floodplain and stream channel throughout most of the year. Once the supply of fine-grained sediment has been depleted, and as streamflow increases, sand-sized material in the channel and along the banks is suspended and transported, increasing the sand load proportionately. This pattern is typical in gravel-bed streams where the supply of sand is usually less limiting than the supply of fines (Wilcock and others, 2009).
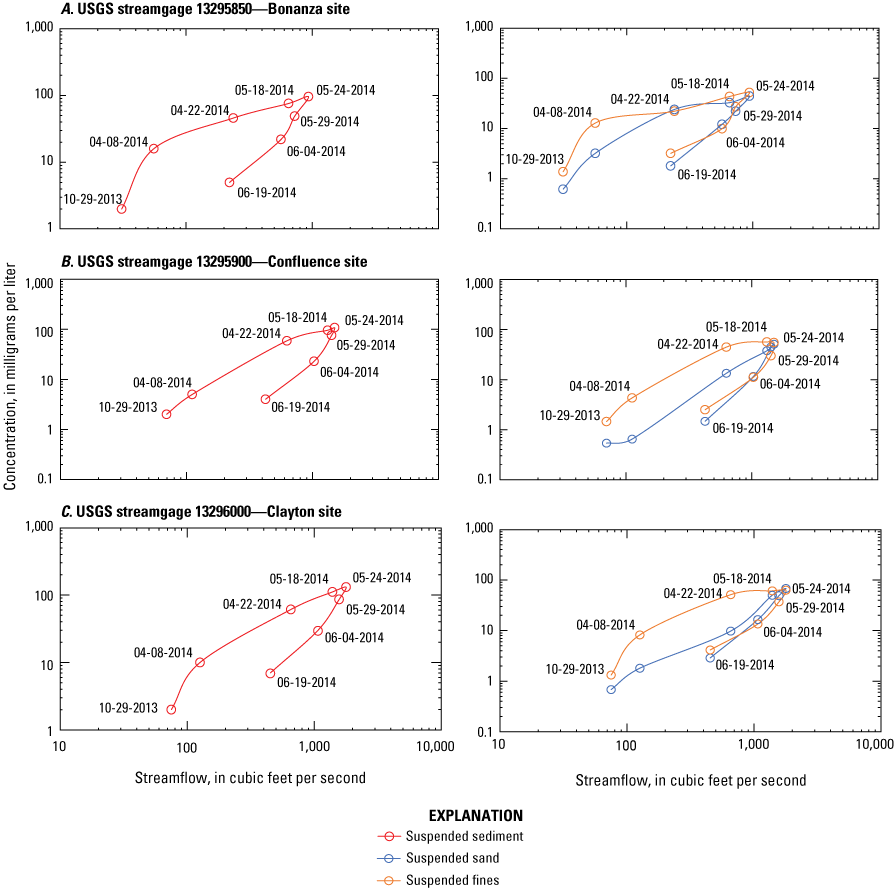
Influence of hysteresis on the concentrations of suspended sediment, suspended sand, and suspended fines at the Bonanza, Confluence, and Clayton sites in the Yankee Fork of the Salmon River, Idaho, water year 2014.
Although some degree of hysteresis in the SSCs was evident during most of the water years from 2012 to 2019, hysteresis was not always as apparent as during water year 2014. Multiple peaks in the snowmelt runoff hydrograph during many of the years made it difficult to sample on both the rising and falling limbs, as well as at the peak. As a result, sample coverage over the snowmelt hydrograph during many years was inadequate to consistently identify and track SSC hysteresis in the Yankee Fork.
During the 8 years of sampling during 2012–19, the annual FWC of suspended sediment (table 4) was largest for the Clayton site, ranging from 11 milligrams per liter (mg/L) in water year 2015 to 140 mg/L in water year 2017. The Clayton site also had the largest FWCs of suspended sand and suspended fines, and the largest percentage of suspended sand during all years. Of the three main-stem sites, the Bonanza site had the smallest FWC of suspended sediment during most years, ranging from 7.4 mg/L in water year 2015 to 74 mg/L in water year 2017.The largest percentage of suspended fines generally occurred at the Bonanza site. At the three main-stem sites, the largest FWCs of suspended sediments, suspended sand, and suspended fines, and the largest percentage as sand occurred during water year 2017. Based on only 2 years of data, the FWC and size fraction concentrations at the West Fork site were smaller than those at the three main-stem sites. The FWC of suspended fines was larger than the FWC of suspended sand during all years at the Bonanza and West Fork sites. The same was true at the Confluence site except during water year 2017 when the FWC of suspended sand was larger than the FWC of suspended fines (table 4).
Table 4.
Annual flow-weighted concentrations of suspended sediment, suspended sand, and suspended fines, and mean percent fines at four sites in the Yankee Fork Basin, Idaho, water years 2012–19.[Abbreviations: FWC, flow-weighted concentration; USGS, U.S. Geological Survey; mg/L, milligrams per liter]
Based on the R-LOADEST results (table 5), during most years the load of suspended fines was larger than the load of suspended sand at the Bonanza and Confluence sites (fig. 7). At the Clayton site, the load of suspended sand exceeded the load of suspended fines during multiple years. During 2012–19, the SSLs at the Bonanza, Confluence, and Clayton sites were 30,500, 63,200, and 110,000 tons, respectively (table 5; fig. 8). More than 90 percent of the SSL during each year occurred during the months of May and June. Of the total SSL during water years 2012–19 at the Bonanza, Confluence, and Clayton sites, about 58, 52, and 44 percent, respectively, were suspended fines. Of the total SSL load in the Yankee Fork during water years 2012–19, water year 2017 accounted for more than 50 percent of the SSL at each of the main-stem sites (table 5). At the Clayton site, the annual SSL ranged from about 1,710 tons in 2015 to about 60,400 tons in 2017 (table 5). The suspended fines and suspended sand loads at Clayton ranged from about 1,100 and 542 tons, respectively, in 2015, to about 25,400 and 42,100 tons, respectively, in 2017. During all years, and for all size fractions, the largest estimated SSLs were at the Clayton site. Assuming the SSL at the Clayton site represents the SSL discharged from the Yankee Fork to the Salmon River, about 110,000 tons of suspended sediment were delivered to the Salmon River from the Yankee Fork during water years 2012–19.
Table 5.
Estimated annual mean streamflow, suspended-sediment loads, 95-percent confidence intervals, and suspended-sediment yields at four sites in the Yankee Fork Basin, Idaho, water years 2012–19.[Locations of sites are shown in figure 1. Suspended-sediment yields are based on drainage areas in table 1. Abbreviations: C.I., confidence interval; tons, short tons; USGS, U.S. Geological Survey; ft3/s, cubic feet per second; tons/mi2, tons per square mile]
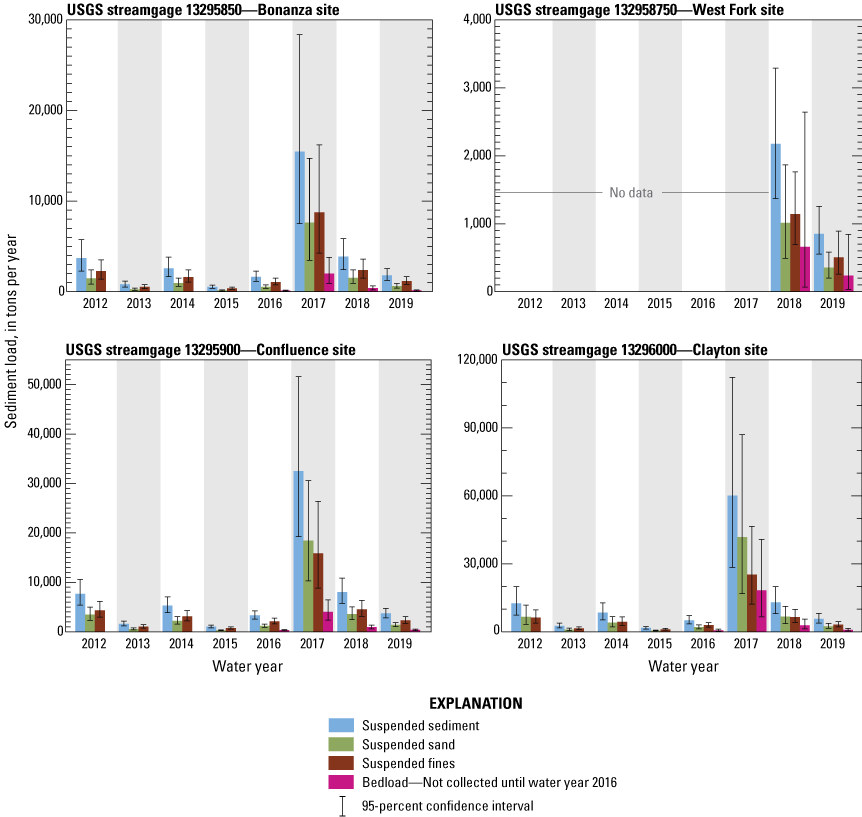
Water year loads of suspended sediment, suspended sand, suspended fines, and bedload at four sites in the Yankee Fork Basin, Idaho, water years 2012–19.
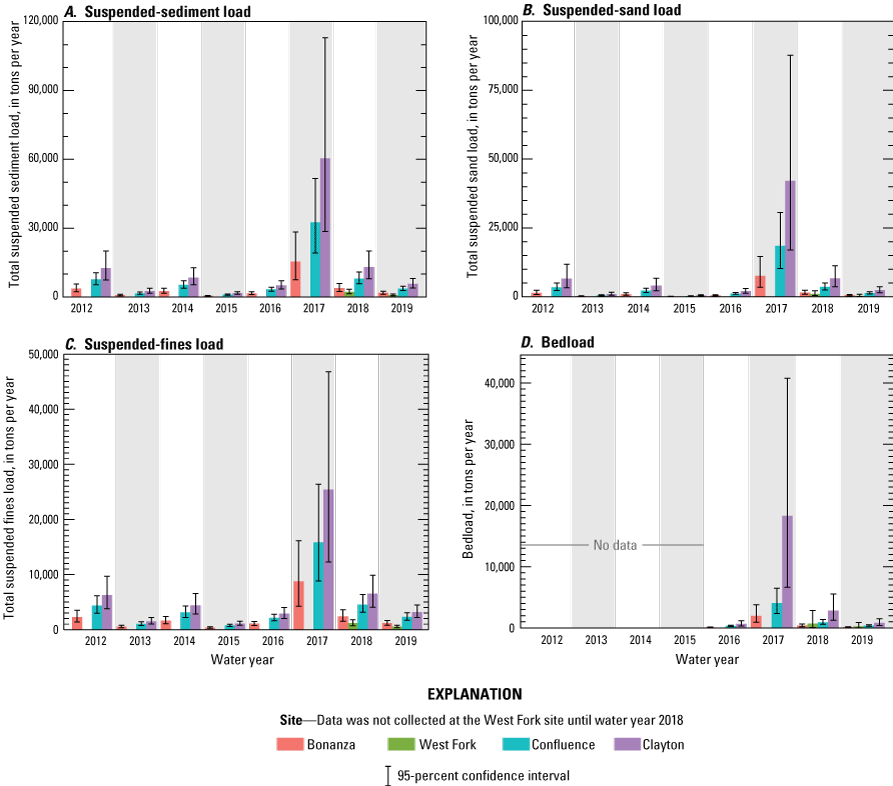
Annual loads of suspended sediment, suspended sand, suspended fines, and bedload between sites in the Yankee Fork Basin, Idaho, water years 2012–19.
Bedload
Bedload data were not collected until water year 2016 at the Bonanza, Confluence, and Clayton sites, and not until water year 2018 at the West Fork site. As with suspended sediment, bedload transport was highly variable, ranging from zero during most of the year at all the sites, to almost 800 tons per day at the Clayton site during peak streamflow in 2017 (table 3). Samples from all sites had a strong correlation (R2 = 84–95 percent) between streamflow and bedload discharge (fig. 9). Differences in the relative transport rate, or the slope of the transport curves shown in figure 9, are indicative of differences in channel characteristics and (or) sediment supply between sites (Wilcock and others, 2009). The relative transport rate, expressed as the coefficient a in equation 3, ranged from 3.14 at the Confluence site to 4.17 at the Clayton site (table 2), within the range reported by King and others (2004)—1.49–5.75 (average 2.71)—in 33 coarse-bed streams in Idaho. The larger the value of the exponent, the larger the proportion of the sediment load associated with higher streamflow. The larger transport rate at the Clayton site is probably related to a steeper, narrower stream channel and consequent higher stream velocities in the lower, undredged reach of the Yankee Fork between the Confluence and Clayton sites. Although the transport rate at the West Fork site (3.70) was intermediary to the other three sites, bedload at the West Fork site was not measured during 2017, making the relative comparison to the other sites difficult.
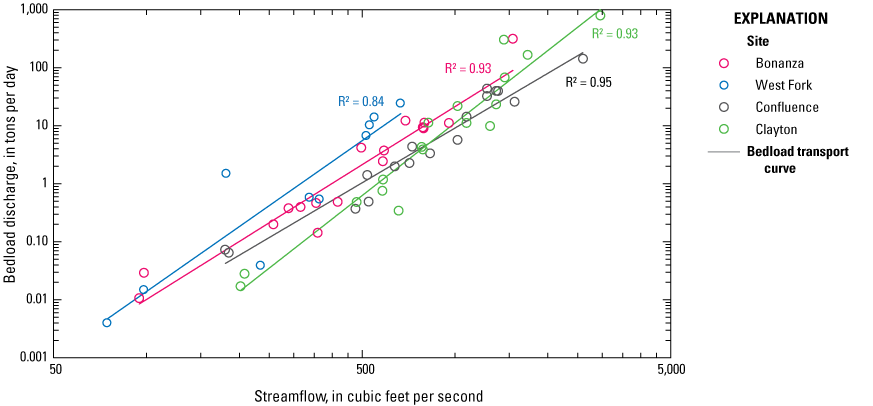
Bedload transport curves representing best-fit regressions relating streamflow to bedload discharge at four sites in the Yankee Fork Basin, Idaho, water years 2012–19. R2, coefficient of determination.
Particle-size distributions provide insight on bed-material response to changes in streamflow and stream energy. The main-stem sites on the Yankee Fork had varying distributions, with the Clayton and Confluence sites having a higher mean percentage of larger particles in the bedload than the Bonanza site (fig. 10). The particle size distribution at the West Fork site was similar to that at the Bonanza site, although the West Fork site was not sampled during 2017. The mean D50 values at the Bonanza, West Fork, Confluence, and Clayton sites were 2.7, 1.8, 6.0, and 12 mm, respectively (table 3). The size distribution of the bedload ranged from poorly to moderately sorted sand and sandy gravel at lower streamflow, to poorly sorted gravel in the three main-stem sites during peak streamflow in 2017 (table 6). Compared to the SSCs, bedload discharge did not show an appreciable degree of hysteresis during the years it was measured. This is typical of many transport-limited streams where a large supply of coarse-grained bed material is available for transport (King and others, 2004). However, the bedload at the main-stem sites showed a substantial coarsening with increased streamflow and possible hysteresis in the particle-size distribution over the rising and falling limbs of the hydrograph during 2017 (fig. 11). Bedload samples collected prior to and at the hydrograph peak of 2017 were predominantly sandy gravel and gravel at all three main-stem sites, whereas samples collected on the falling limb were gravelly sand at the Bonanza and Confluence sites, and sandy gravel at the Clayton site (table 6).
Table 6.
Bedload discharge, median grain size, textural group, and sorting of bedload samples collected at four sites in the Yankee Fork Basin, Idaho, water years 2016–19.[Textural group and sorting are based on descriptions in Blott and Pye (2001). Abbreviations: D50, median grain size; mm-dd-yyyy, month, day, year; USGS, U.S. Geological Survey; mm, millimeter]
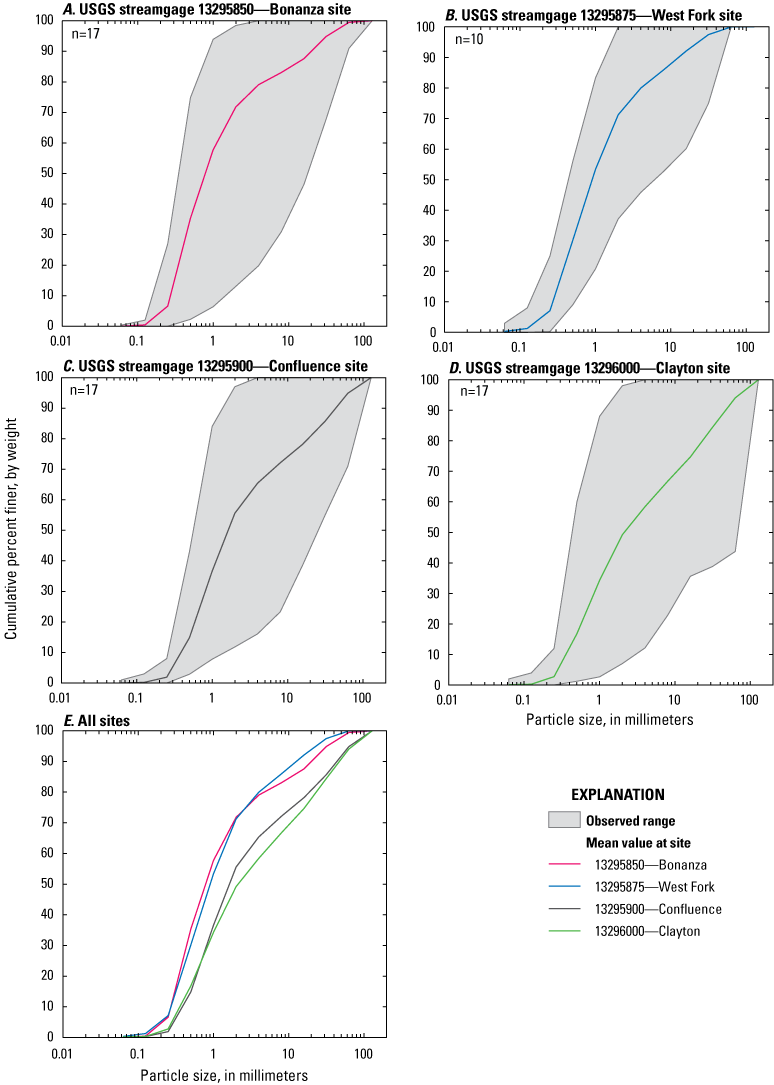
Cumulative-frequency distribution of the mean and range of particle sizes in bedload samples collected at four sites in the Yankee Fork Basin, Idaho, water years 2016–19. n, number of samples.
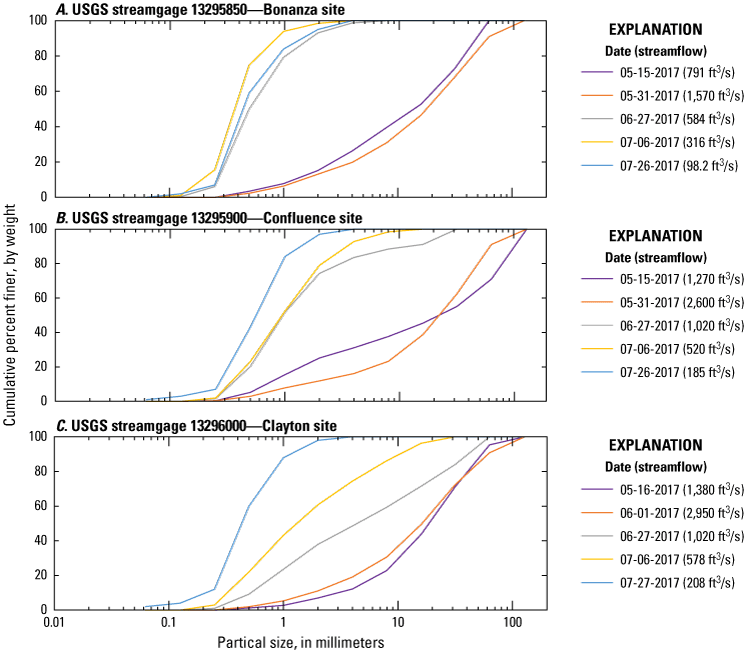
Particle size distribution of bedload samples collected at the Bonanza, Confluence, and Clayton sites in the Yankee Fork Basin, Idaho, during 2017. ft3/s, cubic feet per second.
Annual bedload discharge was computed using the best-fit R-LOADEST regression model for each site (table 2). The annual bedload discharge during 2016–19 in the Yankee Fork at the Bonanza site ranged from about 112 tons in water year 2016 to about 1,990 tons in water year 2017 (table 7). At the Confluence site, annual bedload discharge ranged from about 329 tons during water year 2016 to about 4,040 tons during water year 2017. As with suspended sediment, the West Fork of the Yankee Fork probably accounts for most, if not all, of the bedload accrued between the Bonanza and Confluence sites. During the two water years in which it was sampled (2018–19), the West Fork generated about 894 tons of bedload, about 10 percent more than the total accrued between the Bonanza and Confluence sites during the same time period (table 7). At the Clayton site, the bedload ranged from about 661 tons in water year 2016 to about 18,300 tons in water year 2017. As a percentage of the total sediment load (suspended and bedload), bedload was about 10, 10, and 20 percent of the total sediment load at the Bonanza, Confluence, and Clayton sites, respectively, during water years 2016–19 (tables 7–8).
Table 7.
Estimated annual mean streamflow, bedload, and 95-percent confidence intervals at four sites in the Yankee Fork Basin, Idaho, water years 2016–19.[Locations of sites are shown in figure 1. Abbreviations: C.I., confidence interval; tons, short tons; USGS, U.S. Geological Survey; ft3/s, cubic feet per second]
Table 8.
Estimated annual mean streamflow and total sediment loads and yields at four sites in the Yankee Fork Basin, Idaho, water years 2016–19.[Locations of sites are shown in figure 1. Total sediment yields are based on drainage areas in table 1. Total sediment load: Total sediment load = Suspended sand load + Suspended fines load + Bedload. Abbreviations: tons, short tons; USGS, U.S. Geological Survey; ft3/s, cubic feet per second; tons/mi2, tons per square mile]
The percentage of bedload as a fraction of the total sediment load in the Yankee Fork seems to be comparable to other gravel-bed streams of similar size in Idaho. King and others (2004) estimated that, at bankfull streamflow and greater, bedload accounted for more than 10 percent of the total sediment load in 25 of 31 coarse-bed streams in Idaho. However, in larger watersheds, Clark and others (2013) estimated that bedload was only 0.6–7.9 percent of the total annual sediment load at 10 sites in the lower Snake and Clearwater River Basins. The relatively large fractional amount of bedload reported in this study and by King and others (2004) likely results from a combination of relatively high stream gradient; large quantities of streambed sand and gravel; and high streamflow velocity associated with unregulated, snowmelt-driven streams. The presence of large supplies of transportable sand and gravel in the dredged reaches of the Yankee Fork also likely contributed to the relatively large amount of bedload being transported in the Yankee Fork.
Suspended-Sediment and Bedload Transport in the Yankee Fork
With increases in funding, the sediment-sampling network in the Yankee Fork expanded during water years 2012–19. The addition of bedload sampling in water year 2016 and the inclusion of the West Fork site in water year 2018 created spatial and temporal variability in the dataset for each site and between sites. This variability made it challenging to evaluate the total sediment transport in the lower Yankee Fork on a consistent basis over the entirety of the study. To maintain spatial and temporal consistency among sites, three discrete time periods were evaluated separately to assess and quantify sediment transport in the Yankee Fork. The first time period covers water years 2012–19 at the three main-stem sites and only includes suspended sediment. The second time period covers water years 2016–19 and includes suspended sediment and bedload at the three main-stem sites. The third time period adds the West Fork site and includes suspended sediment and bedload collected during water years 2018–19 at all four sites. Tables 5 and 7 provide site-specific mean streamflow and load estimates and 95-percent confidence intervals for suspended sediment and size fractions and bedload for each water year when data were available. Table 5 provides a summation of suspended-sediment load during water years for each of the three time periods evaluated and table 8 provides a summation of the total sediment load for water years 2016–19 and 2018–19.
Because the loads for total suspended sediment, suspended sand, and suspended fines at each site were estimated using separate transport equations (table 2), the annual SSL estimates in table 5 are not necessarily equivalent to the sum of the annual suspended-sand and suspended-fines loads. For the analysis in this section, the SSL at each site was estimated as the sum of the suspended-sand and suspended-fines loads and, therefore, may be slightly different than the SSLs in table 5. Similarly, the total sediment load in table 8 was estimated as the sum of the suspended sand and fines plus bedload. Using this approach, discrete reaches of the Yankee Fork could be evaluated to determine sediment entrainment and transport, and deposition of various sediment-size fractions on a consistent basis.
Suspended-Sediment Transport, Water Years 2012–19
Water years 2012–19 encompassed a wide range of streamflows in the Yankee Fork on a seasonal and annual basis. As such, suspended-sediment samples collected during the 8 years of the study represent a wide range of hydrologic conditions (fig. 2). Using the annual and total estimates of the size-fraction loads from table 5 allows for reach-specific quantification of the suspended-sediment loads and delineation of the size-fraction loads in the Yankee Fork.
During water years 2012–19, the mean streamflow at the Bonanza site was 115 ft3/s, or 47 percent of the mean streamflow of 244 ft3/s measured at the Clayton site (fig. 12). The total SSL at the Bonanza site (as estimated from the sum of the size fractions) during water years 2012–19 was 31,300 tons, of which 58 percent was fine-grained sediment and 42 percent was sand. Water year 2017 accounted for 23 percent of the total mean streamflow at the Bonanza site during water years 2012–19. Similarly, water year 2017 accounted for 52 percent of the SSL, 58 percent of the suspended sand, and 48 percent of the suspended fines at the Bonanza site during water years 2012–19. Of the three main-stem sites, the Bonanza site had the largest proportion of fine-grained suspended sediment (58 percent). Hysteresis at the Bonanza site (fig. 6) indicates that a disproportionately large part of the sediment load is transported during the rising limb of the snowmelt runoff hydrograph, and that the stream channel upstream from the Bonanza site is limited by the available supply of fine and sand-size sediment. Although the subbasin area upstream from the Bonanza site constituted 55 percent of the total basin area and contributed 47 percent of the mean streamflow in the Yankee Fork, the relative contribution or yield (table 5) of suspended sediment from this part of the basin was smaller than the yields at the Confluence and Clayton sites. Although dredging occurred in the Yankee Fork near the Bonanza site (fig. 1), a large part of the upstream watershed is forested, and large reaches of the Yankee Fork and its tributaries upstream from the Bonanza site are relatively undisturbed.
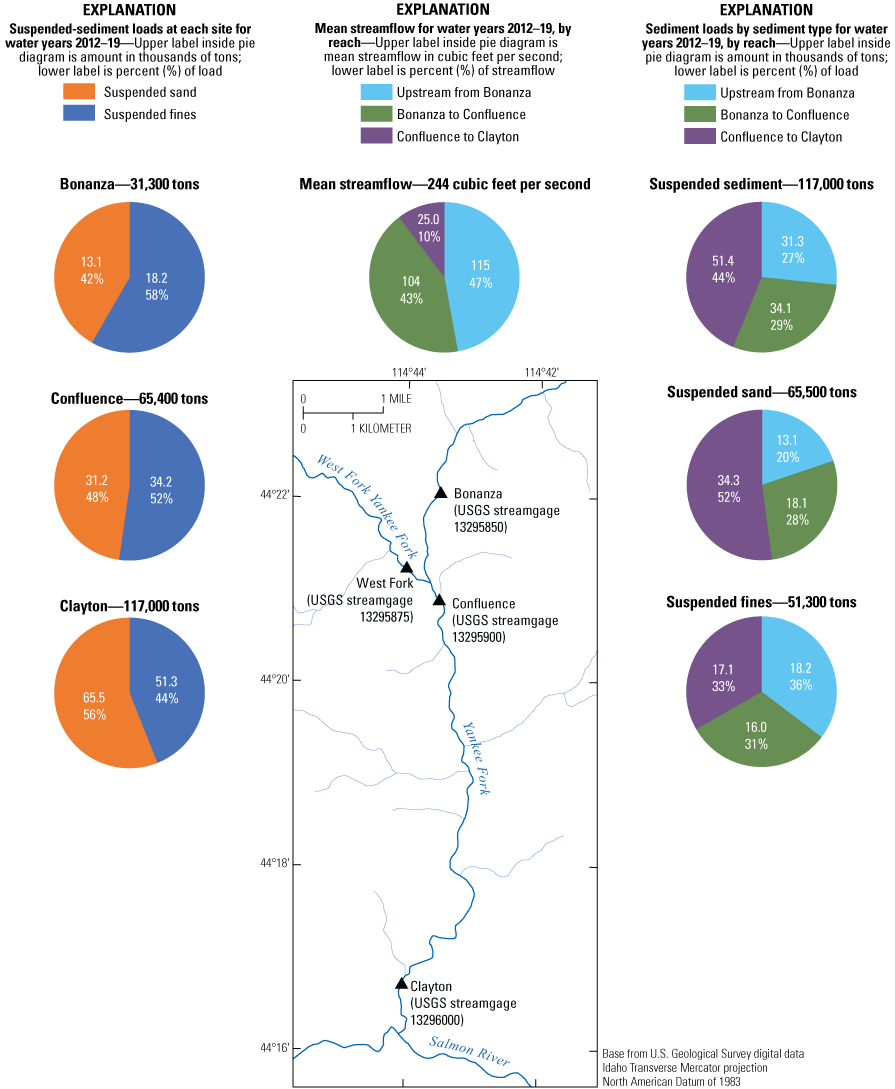
Suspended-sediment loads and reach contributions of suspended sediment and size-fractions at three sites in the Yankee Fork Basin, Idaho, water years 2012–19. Total suspended-sediment loads shown in the pie diagrams are estimated using the sum of the suspended-sediment size fraction loads from table 5 and, therefore, may be slightly different from the total suspended-sediment loads listed in table 5.
At the Confluence site, mean streamflow during water years 2012–19 was 219 ft3/s, about 90 percent of the mean streamflow at the Clayton site. Most of the increase in streamflow between the Bonanza and Confluence sites (104 ft3/s) was likely from the West Fork, which drains 35 percent of the Yankee Fork Basin upstream from the Confluence. During water years 2012–19, the SSL at the Confluence site totaled 65,400 tons, slightly more than twice the SSL at the Bonanza site (fig. 12). Sand accounted for 48 percent and fines 52 percent of the SSL at the Confluence site. The increase in the SSL between the Bonanza and Confluence sites during 2012–19 was 34,100 tons—18,100 tons of sand and 16,000 tons of fines. Although water year 2017 accounted for 22 percent of the total mean streamflow at the Confluence site during water years 2012–19, it accounted for 53 percent of the SSL, and nearly 60 percent of the suspended sand and 46 percent of the suspended fines. Although most of the additional SSL accrued between the Bonanza and Confluence sites is likely discharged from the West Fork, historical dredging in the Yankee Fork between the Bonanza and Confluence sites has provided a reservoir of coarse-grained sediments available for transport. Although hysteresis is evident in the SSCs at the Confluence site (fig. 6), the affect seems more pronounced for the fine-grained fraction, suggesting a stream reach more limited by the supply of fine-grained sediment as compared to sand-sized sediment.
Based on the summation of the suspended-sand and suspended-fines loads at the Clayton site, the Yankee Fork delivered 117,000 tons of suspended sediment to the Salmon River during water years 2012–19 (fig. 12). Of this total, 56 percent was sand and 44 percent was fines. Although the increase in mean streamflow between the Confluence site downstream to the Clayton site was only 25 ft3/s (or about 10 percent of the mean streamflow at the Clayton site during water years 2012–19), this lower 5-mile reach of the Yankee Fork generated 34,300 tons of suspended sand, and 17,100 tons of suspended fines during water years 2012–19 (fig. 12). The large increase in the sand load downstream from the Confluence site indicates that the stream channel and floodplain of the Yankee Fork, along with high-gradient tributary streams, supply a large amount of the coarse-grained sediment discharged to the Salmon River. The minimal amount of hysteresis in the sand concentrations at the Clayton site (fig. 6) indicates that the reach is not limited by the supply of sand, but rather the ability of the Yankee Fork to suspend and transport the sand-sized material in the stream channel.
Using mass balance and the suspended size-fraction loads in table 5, we determined the source in the Yankee Fork Basin of most of the suspended sediment discharged to the Salmon River during water years 2012–19 (fig. 12). The results indicate that the watershed upstream from the Bonanza site contributed 47 percent of the mean streamflow, 27 percent of the SSL, 36 percent of the suspended fines, and 20 percent of the suspended sand delivered to the Salmon River during water years 2012–19. The reach between the Bonanza and Confluence sites, inclusive of the West Fork, contributed 43 percent of the mean streamflow, 29 percent of the SSL, 31 percent of the suspended fines, and 28 percent of the suspended sand delivered to the Salmon River during water years 2012–19. The reach of the Yankee Fork from the Confluence site downstream to the Clayton site contributed only 10 percent of the mean streamflow, but 44 percent of the SSL, 33 percent of the suspended fines, and 52 percent of the suspended sand delivered to the Salmon River during water years 2012–19.
Total Sediment Transport, Water Years 2016–19
Because water years 2012–19 are inclusive of water years 2016–19, the annual loads and contributions of suspended sediment to the Yankee Fork estimated during water years 2016–19 were similar to the estimates during 2012–19 (fig. 13). This similarity is especially true given that water year 2017, which accounted for more than one-half of the SSL during both time periods, was part of both datasets. For SSL, and both size fractions, the total load during water years 2016–19 accounted for 70–80 percent of the total load during water years 2012–19 (table 5).
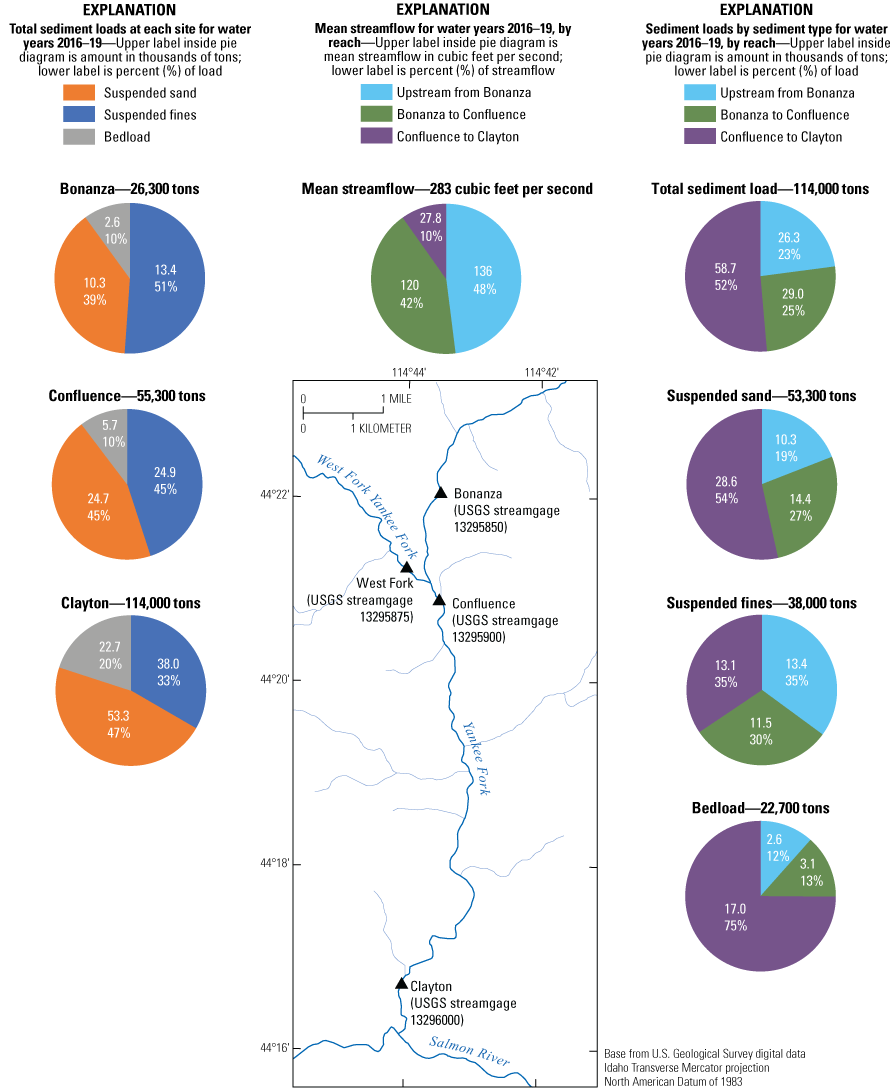
Total sediment loads, and reach contributions of total sediment, suspended-sediment size fractions, and bedload at three sites in the Yankee Fork Basin, Idaho, water years 2016–19. Total sediment loads shown in the pie diagrams are estimated using the sum of the suspended-sediment size fraction loads from table 5 and bedload from table 7.
During water years 2016–19, 48 percent of the mean streamflow, 35 percent of the suspended fines, and 19 percent of the suspended sand discharged to the Salmon River were derived from the basin upstream from the Bonanza site (fig. 13). About 42 percent of the mean streamflow, 30 percent of the suspended fines, and 27 percent of the suspended sand were generated between the Bonanza and the Confluence sites. Only 10 percent of the mean streamflow, but 35 percent of the suspended fines and 54 percent of the suspended sand, were generated from the Confluence site downstream to the Clayton site. The source-area contributions in different reaches of the main stem of the Yankee Fork as a percentage of the streamflow and suspended-sediment load delivered to the Salmon River during 2016–19, were nearly identical to those for water years 2012–19.
The addition of bedload sampling at the three main-stem sites starting in water year 2016 allowed for an estimate of the total sediment load (suspended sediment and bedload) and the relative contribution of bedload to the transport of sediment in the Yankee Fork. The total bedload at the Bonanza site during water years 2016–19 was 2,620 tons, or 10 percent of the total sediment load of 26,300 tons at the Bonanza site (fig. 13; tables 7–8). At the Confluence site, bedload was 5,690 tons, and similar to the Bonanza site, constituted about 10 percent of the total sediment load at the Confluence site during water years 2016–19. Most of the bedload accrued between the Bonanza and Confluence sites likely originated from the West Fork. From the Confluence site downstream to the Clayton site, bedload increased almost fourfold to 22,700 tons during water years 2016–19. Of this total, water year 2017 accounted for 18,300 tons of bedload, about 81 percent of the total at the Clayton site during water years 2016–19. As measured at the Clayton site, 114,000 tons of sediment were discharged to the Salmon River from the Yankee Fork during water years 2016–19; 75 percent of this total was discharged during water year 2017. Of the 114,000 tons of sediment discharged to the Salmon River, 47 percent was suspended sand, 33 percent was suspended fines, and 20 percent was bedload (fig. 13).
About 2,600 tons, or 12 percent of the bedload discharged to the Salmon River during water years 2016–19, was contributed from the basin upstream from the Bonanza site (fig. 13). Another 3,100 tons of bedload, or 13 percent of the total, was generated between the Bonanza and Confluence sites. By far the largest contributor of bedload to the Salmon River during water years 2016–19 was the reach downstream from the Confluence site. Although this reach accounted for only 10 percent of the mean streamflow, it accounted for 17,000 tons, or 75 percent of the 22,700 tons of bedload discharged to the Salmon River during water years 2016–19 (fig. 13). The total sediment yield for the Bonanza, Confluence, and Clayton sites was 248, 340, and 600 tons/mi2, respectively, during water years 2016–19 (table 8).
Total Sediment Transport, Water Years 2018–19
In the previous two time periods evaluated, the assumption was that most of the incremental gain in streamflow and sediment load between the Bonanza and Confluence sites was derived from the West Fork, which accounts for 97 percent of the intervening basin area. The addition of suspended-sediment and bedload sampling at the West Fork site, starting in water year 2018, allowed us to verify if this assumption was correct. A large part of the West Fork watershed burned during the summer of 2012, which likely resulted in an increased delivery of sediment from its basin. However, because sediment data were not collected at the West Fork site prior to water year 2018, direct impacts from the 2012 fires on the sediment delivery from the West Fork watershed could not be evaluated. Additionally, because the West Fork site was not sampled during water year 2017, the sediment transport curves developed for that site do not include the high streamflow events from 2017, which were included in the transport curves for the three main-stem sites. Although water years 2018 and 2019 were about average or slightly above average with respect to the historical streamflow in the Yankee Fork (fig. 3), data collected during a high streamflow year similar to 2017 would be helpful to improve and extend the sediment transport curves shown in figures 4–5 for the West Fork site.
Without a year similar in magnitude to water year 2017, the nature of the sediment transported and the total sediment budget for water years 2018–19 looked substantially different compared to water years 2016–19 (fig. 14). At the three main-stem sites, the total sediment load tended towards finer-grained material compared to water years 2016–19 (fig. 14). At the Bonanza site, 57 percent of the total sediment transported during water years 2018–19 was suspended fines, an increase of 6 percent in the suspended-fines load compared to water years 2016–19. Suspended sand accounted for 35 percent of the total sediment load at the Bonanza site during water years 2018–19, and bedload accounted for 8 percent, both less than the relative contributions during water years 2016–19. At the Confluence site, suspended fines accounted for 52 percent of the total sediment load, 7 percent more than during water years 2016–19, and suspended sand accounted for 38 percent, or 7 percent less than during water years 2016–19. Bedload accounted for 10 percent of the sediment load at the Confluence site during 2018–19, the same percentage as during 2016–19. At the Clayton site, the percentage of suspended fines was 43 percent of the total load during 2018–19, 10 percent higher than during 2016–19. Suspended sand accounted for 41 percent and bedload 16 percent of the total sediment load at the Clayton site during water years 2018–19, decreases of 6 and 4 percent, respectively, compared to water years 2016–19.
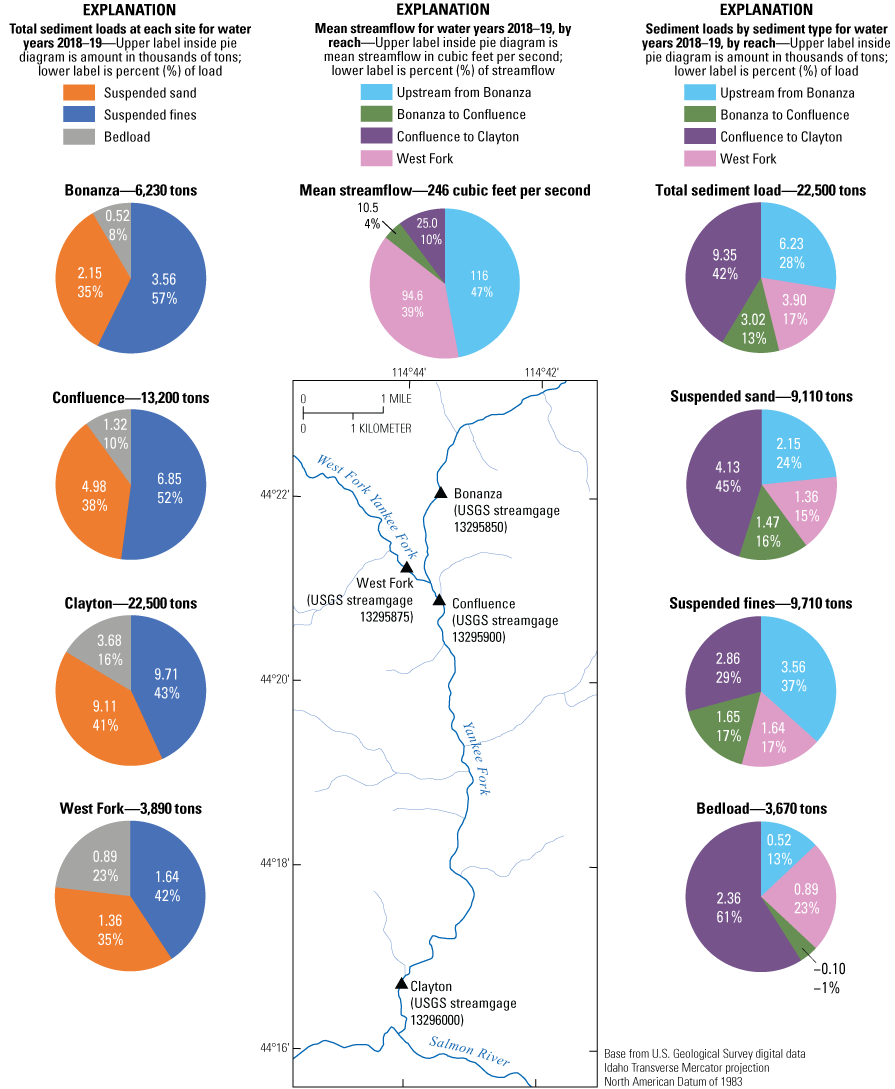
Total sediment loads, and reach contributions of total sediment, suspended-sediment size fractions, and bedload at four sites in the Yankee Fork Basin, Idaho, water years 2018–19. Total sediment loads shown in the pie diagrams are estimated using the sum of the suspended-sediment size fraction loads from table 5 and bedload from table 7.
The data collected at the West Fork site during water years 2018–19 indicate that the West Fork Basin contributed a large part, but not all, of the increase in streamflow and sediment load between the Bonanza and Confluence sites. The West Fork accounted for nearly all the bedload, but only about one-half of the suspended-sediment load accrued in the reach between the Bonanza and Confluence sites (fig. 14). Of the 3,890 tons of sediment delivered from the West Fork during water years 2018–19, about 42 percent was suspended fines, 35 percent was suspended sand, and 23 percent was bedload. As measured at the Clayton site, the total sediment load delivered to the Salmon River from the Yankee Fork during 2018–19 was about 22,500 tons. Of this total, the West Fork contributed 39 percent of the streamflow, 17 percent of the total sediment load, 17 percent of the suspended fines, 15 percent of the suspended sand, and 23 percent of the bedload (fig. 14). Like the results from the other two time periods, during water years 2018–19, the watershed upstream from the Bonanza site was the largest contributor of suspended fines (about 37 percent), with the reach of the Yankee Fork between the Confluence and Clayton sites being the largest source of suspended sand (45 percent) and bedload (61 percent). The total sediment yield for the Bonanza, West Fork, Confluence, and Clayton sites was 59, 68, 81, and 120 tons/mi2, respectively, during water years 2018–19 (table 8).
Summary
Placer and dredging operations in the Yankee Fork Basin, Idaho, have left more than 5 miles of the lower Yankee Fork of the Salmon River (Yankee Fork) in a highly altered fluvial condition, resulting in poor habitat quantity and quality for native fish species. Since 2011, the Bureau of Reclamation and other stakeholders have implemented a series of restoration efforts to improve the connectivity of the river with its floodplain and to improve aquatic and terrestrial habitat in the Yankee Fork. In conjunction with these rehabilitation efforts, the U.S. Geological Survey monitored streamflow and suspended-sediment and bedload transport during water years 2012–19 at four sites in the affected lower reach of the Yankee Fork. The objectives of the monitoring were to (1) identify source areas of sediment, (2) quantify sediment transport in the lower Yankee Fork, and (3) provide a benchmark to evaluate the effects of rehabilitation efforts in the basin.
During the 8 years of sampling, the annual flow-weighted suspended-sediment concentrations (SSCs) were largest at the most downstream Clayton site, ranging from a low of 11 milligrams per liter (mg/L) in 2015 to 145 mg/L in 2017. The Clayton site also had the largest flow-weighted concentrations of suspended sand and suspended fines. At relatively low streamflow, the fine-grained fraction of the suspended sediment was the dominant component of the SSC at all sites, with an increase in the sand-size fraction as streamflow increased during snowmelt runoff. Each of the three main-stem Yankee Fork sites indicated a large amount of hysteresis in SSCs during snowmelt runoff, with concentrations on the rising limb of the hydrograph larger than concentrations on the falling limb at similar streamflow. Hysteresis was particularly evident in the fine-grained fraction of suspended sediment, indicating that sediment transport in the lower Yankee Fork is more limited by the supply of fine-grained sediment as compared to coarser-grained sediment.
Bedload samples were collected starting in water year 2016, with sampling limited to spring snowmelt runoff when streamflow was sufficiently large to transport coarse-grained bottom material. The mean median grain size (D50) at the Bonanza, West Fork, Confluence, and Clayton sites was 2.7, 1.8, 6.0, and 12 millimeters, respectively. In contrast to SSCs, bedload discharge did not show an appreciable degree of hysteresis, typical of many transport-limited streams where a large supply of coarse-grained bottom material is available for transport. However, the bedload showed a general coarsening from sand to gravel-size material as streamflow increased in response to snowmelt runoff.
Suspended-sediment load (SSL) and bedload transport in the Yankee Fork was quantified using the modeling program R-LOADEST to relate SSL and bedload discharge to variations in streamflow at each of the four sites. The models provided an excellent fit to the data, with coefficient of determination (R2) values greater than 80 percent at all sites and for all sediment constituents. Annual and multi-year loads, or mass flux, for suspended sediment, suspended-sediment size fractions, and bedload were estimated using the R-LOADEST models to determine which reaches in the Yankee Fork generate and transport alluvial sediment and various size fractions.
During water years 2012–19, based on the summation of the suspended sand and suspended fines load, the Yankee Fork transported about 117,000 tons of suspended sediment to the Salmon River, about 56 percent of the total being suspended sand. Almost 55 percent of the SSL discharged from the Yankee Fork to the Salmon River during water years 2012-19 occurred during water year 2017. The watershed upstream from the Bonanza site, which accounts for 55 percent of the watershed area of the Yankee Fork, contributed 47 percent of the mean streamflow, 27 percent of the SSL, 36 percent of the suspended fines, and 20 percent of the suspended sand discharged to the Salmon River during water years 2012–19. The intervening drainage area between the Bonanza and Confluence sites, including the West Fork of the Yankee Fork, contributed 43 percent of the mean streamflow, 29 percent of the SSL, 31 percent of the suspended fines, and 28 percent of the suspended sand during water years 2012–19. The reach between the Confluence and Clayton sites, which accounts for only 13 percent of the watershed area and contributes only 10 percent of the mean streamflow, accounted for 44 percent of the SSL, 33 percent of the suspended fines, and 52 percent of the suspended sand delivered to the Salmon River during water years 2012–19.
The addition of bedload sampling starting in water year 2016 allowed for an estimate of the total sediment load (suspended sediment and bedload) and the relative contribution of bedload to the transport of sediment in the Yankee Fork. During water years 2016–19, bedload accounted for 10 percent of the total sediment load at the Bonanza and Confluence sites and 20 percent of the total sediment load at the Clayton site. The total bedload discharged to the Salmon River during water years 2016–19, as measured at the Clayton site, was about 22,700 tons, with 75 percent of the total generated in the reach of the Yankee Fork downstream from the Confluence site. During water years 2016–19, the Yankee Fork discharged about 114,000 tons of total sediment load (both suspended-sediment load and bedload) to the Salmon River. Of this total, 47 percent was suspended sand, 33 percent was suspended fines, and 20 percent was bedload. Water year 2017 accounted for 75 percent of the total sediment load and 81 percent of the bedload discharged to the Salmon River during water years 2016–19.
The addition of suspended-sediment and bedload sampling at the West Fork site starting in water year 2018 allowed for quantification of sediment inputs from the West Fork to the main stem of the Yankee Fork between the Bonanza and Confluence sites. The West Fork accounted for 56 percent of the total sediment load, and all the bedload accrued between the Bonanza and Confluence sites during water years 2018–19. Of 3,890 tons of total sediment discharged from the West Fork during water years 2018–19, about 42 percent was suspended fines, 35 percent was suspended sand, and 23 percent was bedload. Although the West Fork accounted for 39 percent of the mean streamflow, it accounted for only 17 percent of the total sediment load discharged to the Salmon River from the Yankee Fork during water years 2018–19.
Acknowledgments
Special thanks go to USGS field personnel from the Idaho Water Science Center Boise and Idaho Falls Field Offices, which were responsible for the data collection.
References Cited
Blott, S.J., and Pye, K., 2001, GRADISTAT—A grain size distribution and statistics package for the analysis of unconsolidated sediments: Earth Surface Processes and Landforms, v. 26, no. 11, p. 1237–1248, accessed March 15, 2021. https://doi.org/10.1002/esp.261.
Bradu, D., and Mundlak, Y., 1970, Estimation in lognormal linear models: Journal of the American Statistical Association, v. 65, no. 329, p. 198–211. [Also available at https://doi.org/10.1080/01621459.1970.10481074.]
Clark, G.M., Fosness, R.L., and Wood, M.S., 2013, Sediment transport in the lower Snake and Clearwater River Basins, Idaho and Washington, 2008–11: U.S. Geological Survey Scientific Investigations Report 2013–5083, 56 p., https://doi.org/10.3133/sir20135083.
Clark, G.M., and Mebane, C.A., 2014, Sources, transport, and trends for selected trace metals and nutrients in the Coeur d’Alene and Spokane River Basins, northern Idaho, 1990–2013: U.S. Geological Survey Scientific Investigations Report 2014–5204, 62 p., https://doi.org/10.3133/sir20145204.
Cohn, T.A., Caulder, D.L., Gilroy, E.J., Zynjuk, L.D., and Summers, R.M., 1992, The validity of a simple statistical model for estimating fluvial constituent loads—An empirical study involving nutrient loads entering Chesapeake Bay: Water Resources Research, v. 28, no. 9, p. 2353–2363, https://doi.org/10.1029/92WR01008.
Cohn, T.A., Delong, L.L., Gilroy, E.J., Hirsch, R.M., and Wells, D.K., 1989, Estimating constituent loads: Water Resources Research, v. 25, no. 5, p. 937–942, https://doi.org/10.1029/WR025i005p00937.
Crawford, C.G., 1991, Estimation of suspended-sediment rating curves and mean suspended-sediment loads: Journal of Hydrology, v. 129, nos. 1–4, p. 331–348, https://doi.org/10.1016/0022-1694(91)90057-O.
Davis, B.E., 2005, A guide to the proper selection and use of federally approved sediment and water-quality samplers: U.S. Geological Survey Open-File Report 2005–1087, 20 p., https://doi.org/10.3133/ofr20051087.
Ducar, S.D., and Fosness, R.L., 2021, Synthetic streamflow regressions and daily mean streamflow estimates at three sites on the Yankee Fork Salmon River near Clayton, Idaho, water years 2012–19: U.S. Geological Survey data release, https://doi.org/10.5066/P9T1F6SW.
Edwards, T.K., and Glysson, G.D., 1999, Field methods for measurement of fluvial sediment: U.S. Geological Survey Techniques of Water-Resources Investigations, book 3, chap. C2, 89 p., https://doi.org/10.3133/twri03C2.
Emmett, W.W., and Wolman, M.G., 2001, Effective discharge and gravel-bed rivers: Earth Surface Processes and Landforms, v. 26, no. 13, p. 1369–1380, https://doi.org/10.1002/esp.303.
Goolsby, D.A., Battaglin, W.A., Lawrence, G.B., Artz, R.S., Aulenbach, B.T., Hooper, R.P., Keeney, D.R., and Stensland, G.J., 1999, Flux and sources of nutrients in the Mississippi–Atchafalaya River Basin—Topic 3 Report for the integrated assessment on hypoxia in the Gulf of Mexico: Silver Spring, Maryland, National Oceanic and Atmospheric Administration Coastal Ocean Program Decision Analysis Series No. 17, 130 p. [Also available at https://repository.library.noaa.gov/view/noaa/21437.]
Gray, J.R., Glysson, G.D., and Edwards, T.E., 2008, Suspended sediment samplers and sampling methods, chap. 5 (Sediment transport measurements), section 5.3 of Garcia, M., ed., Sedimentation engineering—Processes, measurements, modeling, and practice: Reston, Virginia, American Society of Civil Engineers Manual 110, p. 320–339.
Guy, H.P., 1969, Laboratory theory and methods for sediment analysis: U.S. Geological Survey Techniques of Water Resources Investigations, book 5, chap. C1, 58 p., https://doi.org/10.3133/twri05C1.
Hubbell, D.W., 1964, Apparatus and techniques for measuring bedload: U.S. Geological Survey Water-Supply Paper 1748, 74 p., https://doi.org/10.3133/wsp1748.
Johnsen, J.W., 2018, Sediment transport monitoring of the Yankee Fork of the Salmon River near Stanley, Idaho, 2012–15: U.S. Geological Survey Open-File Report 2018–1189, 17 p., https://doi.org/10.3133/ofr20181189.
King, J.G., Emmett, W.W., Whiting, P.J., Kenworthy, R.P., and Barry, J.J., 2004, Sediment transport data and related information for selected coarse-bed streams and rivers in Idaho: U.S. Forest Service, Rocky Mountain Research Station, Fort Collins, Colorado, General Technical Report RMRS-GTR-131, 26 p., https://doi.org/10.2737/RMRS-GTR-131.
Kondolf, G.M., 1995, Five elements for effective evaluation of stream restoration: Restoration Ecology, v. 3, no. 2, p. 133–136, https://doi.org/10.1111/j.1526-100X.1995.tb00086.x.
Kondolf, G.M., and Micheli, E.R., 1995, Evaluating stream restoration projects: Environmental Management, v. 19, no. 1, p. 1–15, https://doi.org/10.1007/BF02471999.
National Oceanic and Atmospheric Administration, 2010, Supplemental consultation on remand for operation of the Federal Columbia River power system, 11 Bureau of Reclamation projects in the Columbia Basin and ESA Section 10(a)(1)(A) permit for juvenile fish transportation program: National Oceanic and Atmospheric Administration, National Marine Fisheries Service, Northwest Region, May 20, 2010, NOAA Fisheries Log No. F/NWR/2010/0209, 40 p.
R Core Team, 2020, R—A language and environment for statistical computing—Version 4.0.2: Vienna, Austria, R Foundation for Statistical Computing web page, accessed June 22, 2020, at https://www.r-project.org./
Rhea, D.T., Farag, A.M., Harper, D.D., McConnell, E., and Brumbaugh, W.G., 2013, Mercury and selenium concentrations in biofilm, macroinvertebrates, and fish collected in the Yankee Fork of the Salmon River, Idaho, USA, and their potential effects on fish health: Archives of Environmental Contamination and Toxicology, v. 64, no. 1, p. 130–139, https://doi.org/10.1007/s00244-012-9816-x.
Richards, C., Cernera, P.J., Ramey, M.P., and Reiser, D.W., 1992, Development of off-channel habitats for use by juvenile chinook salmon: North American Journal of Fisheries Management, v. 12, no. 4, p. 721–727, https://doi.org/10.1577/1548-8675(1992)012<0721:DOOCHF>2.3.CO;2.
Runkel, R.L., Crawford, C.G., and Cohn, T.A., 2004, Load Estimator (LOADEST): A FORTRAN program for estimating constituent loads in streams and rivers: U.S. Geological Survey Techniques and Methods, book 4, chap. A5, 69 p., https://doi.org/10.3133/tm4A5.
Smith, R.A., Alexander, R.B., and Wolman, M.G., 1987, Water-quality trends in the Nation’s rivers: Science, v. 235, no. 4796, p. 1607–1615, https://doi.org/10.1126/science.235.4796.1607.
Turnipseed, D.P., and Sauer, V.B., 2010, Discharge measurements at gaging stations: U.S. Geological Survey Techniques and Methods, book 3, chap. A8, 87 p., https://doi.org/10.3133/tm3A8.
U.S. Geological Survey, 2021, National Water Information System: U.S. Geological Survey web interface, https://doi.org/10.5066/F7P55KJN, accessed March 2021, at https://waterdata.usgs.gov/nwis/.
U.S. Geological Survey, [variously dated], National field manual for the collection of water-quality data: U.S. Geological Survey Techniques of Water-Resources Investigations, book 9, chaps. A1–A9. [Also available at https://pubs.water.usgs.gov/twri9A.]
Wilcock, P., Pitlick, J., and Cui, Y., 2009, Sediment transport primer—Estimating bed-material transport in gravel-bed rivers. U.S. Forest Service, Rocky Mountain Research Station, Fort Collins, Colorado, General Technical Report RMRS-GTR-226, 78 p., https://doi.org/10.2737/RMRS-GTR-226.
Wood, P.J., and Armitage, P.D., 1997, Biological effects of fine sediment in the lotic environment: Environmental Management, v. 21, no. 2, p. 203–217, https://doi.org/10.1007/s002679900019.
Conversion Factors
International System of Units to U.S. customary units
Temperature in degrees Celsius (°C) may be converted to degrees Fahrenheit (°F) as follows:
°F = (1.8 × °C) + 32.
Temperature in degrees Fahrenheit (°F) may be converted to degrees Celsius (°C) as follows:
°C = (°F – 32) / 1.8.
Supplemental Information
Concentrations of suspended sediments in water are given in milligrams per liter (mg/L).
A water year is defined as the 12-month period from October 1, for any given year, through September 30 of the following year. The water year is designated by the calendar year in which it ends.
Publishing support provided by the U.S. Geological Survey
Science Publishing Network, Tacoma Publishing Service Center
For more information concerning the research in this report, contact the
Director, Idaho Water Science Center
U.S. Geological Survey
230 Collins Road
Boise, Idaho 83702-4520
Disclaimers
Any use of trade, firm, or product names is for descriptive purposes only and does not imply endorsement by the U.S. Government.
Although this information product, for the most part, is in the public domain, it also may contain copyrighted materials as noted in the text. Permission to reproduce copyrighted items must be secured from the copyright owner.
Suggested Citation
Clark, G.M., and Ducar, S.D., 2021, Sediment transport in the Yankee Fork of the Salmon River near Stanley, Idaho, water years 2012–19: U.S. Geological Survey Scientific Investigations Report 2021–5111, 36 p., https://doi.org/10.3133/sir20215111.
ISSN: 2328-0328 (online)
Study Area
| Publication type | Report |
|---|---|
| Publication Subtype | USGS Numbered Series |
| Title | Sediment transport in the Yankee Fork of the Salmon River near Stanley, Idaho, water years 2012–19 |
| Series title | Scientific Investigations Report |
| Series number | 2021-5111 |
| DOI | 10.3133/sir20215111 |
| Publication Date | October 18, 2021 |
| Year Published | 2021 |
| Language | English |
| Publisher | U.S. Geological Survey |
| Publisher location | Reston, VA |
| Contributing office(s) | Idaho Water Science Center |
| Description | Report: vi, 36 p.; Data Release |
| Country | United States |
| State | Idaho |
| City | Stanley |
| Online Only (Y/N) | Y |