

Geology and Hydrogeology of the Yucaipa Groundwater Subbasin, San Bernardino and Riverside Counties, California
Links
- Document: Report (15 MB pdf) , HTML , XML
- Data Release: Data Release - Data release of hydrogeologic data of the Yucaipa groundwater subbasin, San Bernardino and Riverside Counties, California
- Version History: Version History (2 KB txt)
- NGMDB Index Page: National Geologic Map Database Index Page (html)
- Download citation as: RIS | Dublin Core
Acknowledgments
The authors thank the San Bernardino Valley Municipal Water District for their cooperation on this project, including providing funding, expertise, and logistical support for data compilation and analysis; the respective staffs of the South Mesa Water Company, Western Heights Water Company, and the Yucaipa Valley Water District for their local and historical expertise about the area.
The authors thank U.S. Geological Survey colleagues for assistance in data compilation, analysis, and support, including Claudia Faunt, Wes Danskin, Greg Mendez, Meghan Dick, Josh Larsen, Whitney Seymour, Milissa Peterson, Sarah Roberts, and Lindsay Ellingson.
Abstract
The Yucaipa groundwater subbasin (referred to in this report as the Yucaipa subbasin) is located about 75 miles (mi) east of of Los Angeles and about 12 mi southeast of the City of San Bernardino. In the Yucaipa subbasin, as in much of southern California, limited annual rainfall and large water demands can strain existing water supplies; therefore, understanding local surface water and groundwater conditions is essential for managing these resources. To better understand the hydrogeology and water resources in the Yucaipa subbasin, especially groundwater, the San Bernardino Valley Municipal Water District and the U.S. Geological Survey initiated a cooperative study to evaluate the hydrogeologic system of the Yucaipa subbasin and the encompassing Yucaipa Valley watershed. Previous studies of the area provided information on general geologic and hydrologic conditions, but this study provides the first comprehensive definition of the hydrogeology of the subsurface throughout the entire subbasin.
The Yucaipa subbasin is located between the northwest trending San Andreas fault zone and San Jacinto fault. Several northeast-trending dip-slip faults dissect the Yucaipa subbasin, providing the mechanism for structural relief within the sediment-filled subbasin and between the subbasin and surrounding mountains and highlands. Several of these dip-slip faults have been previously identified as potential barriers to groundwater flow. This report provides a synthesis of previous studies and a discussion of the geologic interpretations that were used as the foundation for hydrogeologic classification of the Yucaipa subbasin. Notably, this report (1) adopts the recently named and classified sedimentary deposits of Live Oak Canyon geologic formation and extends the mapped distribution of the formation into the Yucaipa subbasin, and (2) adopts the interpretation that activity along the Banning fault predates the deposition of most basin-fill sedimentary materials in the Yucaipa subbasin.
Four hydrogeologic units were classified in the Yucaipa subbasin: (1) crystalline basement, (2) consolidated sedimentary materials, (3) unconsolidated sediment, and (4) surficial materials. The crystalline basement unit forms the bottom boundary of the aquifer system, and the three other units comprise the basin-fill aquifer system. The four hydrogeologic units vary in extent, thickness, and structural relief across the subbasin, with the unconsolidated sediment unit serving as the primary aquifer unit. A three-dimensional hydrogeologic framework model was developed for the Yucaipa subbasin and surrounding area to characterize the thickness, extent, and hydrogeologic variability of the aquifer system. Geologic maps, borehole geophysical logs, drillers’ lithology logs, and depth-to-basement gravity data were used to map and interpolate the subsurface extent and structure of the hydrogeologic units within the subbasin. Faults and structures of geologic and (or) hydrogeologic importance were included in the model for future evaluation of their potential effects on groundwater flow. The resulting hydrogeologic framework is consistent with existing geologic concepts and the tectonic and structural history of the Yucaipa subbasin and surrounding area. The framework is also suitable for use in basin-scale hydrogeologic investigations.
Introduction
Groundwater is an important natural resource, especially in southern California, where limited annual rainfall and large water demands for municipal, agricultural, industrial, and domestic use can strain existing water supplies. Water agencies in the greater Los Angeles metropolitan area serve a population of about 17 million people (U.S. Census Bureau, 2010), demonstrating the need for sustainable water management and a comprehensive understanding of local and regional water resources. The Santa Ana River watershed (fig. 1) is typical of many watersheds in southern California, with relatively high topographic relief between the headwaters of the river in the San Bernardino Mountains and the river mouth at the Pacific Ocean. The Santa Ana River watershed is partitioned into smaller watersheds positioned between regions of high topography; the Yucaipa Valley watershed (YVW; fig. 1) encompasses three of the smaller watersheds. The Santa Ana River watershed encompasses much of what the California Department of Water Resources (DWR) refers to as the Upper Santa Ana Valley groundwater basin (California Department of Water Resources, 2016; fig. 1). The DWR naming convention of the groundwater basin is used within this report.
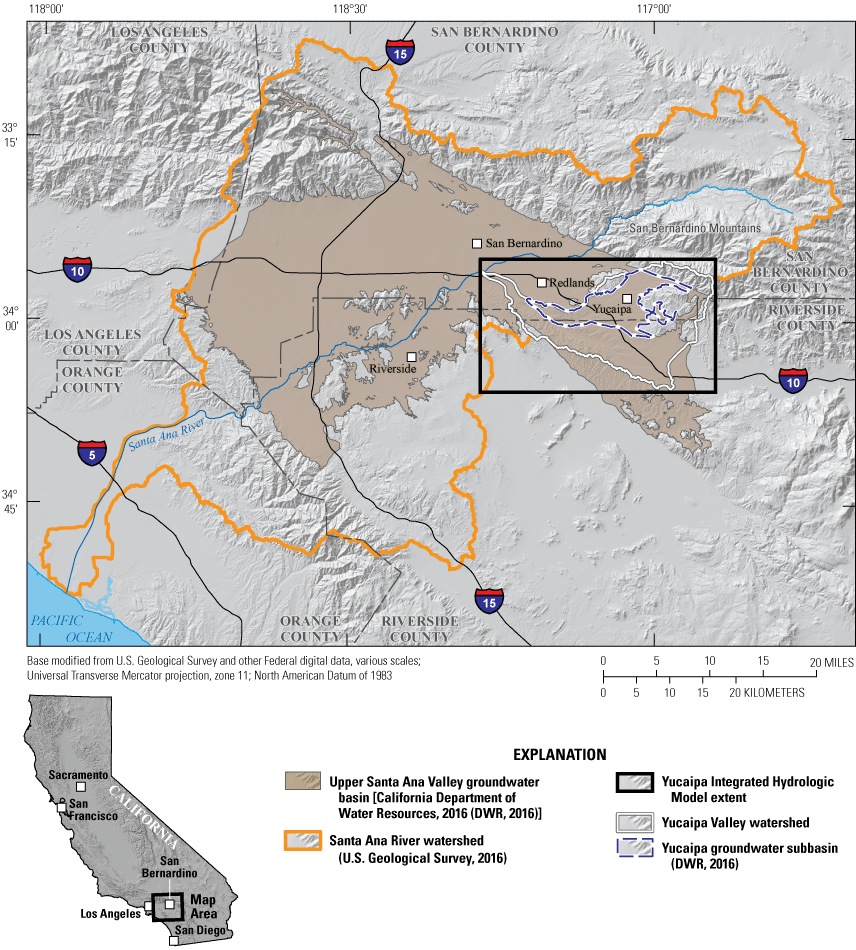
Location of the Yucaipa groundwater subbasin, Yucaipa Valley watershed, and Upper Santa Ana Valley groundwater basin, San Bernardino and Riverside Counties, California.
The Upper Santa Ana Valley groundwater basin includes the Yucaipa groundwater subbasin, referred to hereafter as the Yucaipa subbasin. Water demands within the Yucaipa subbasin have historically been supplied by groundwater, but since the early 2000s, imported water from northern California has augmented the total water supply through direct use and through anthropogenic recharge (Cromwell and others, 2022a). Overall demand for groundwater continues to rise. Water managers are concerned that despite the influx of imported water, groundwater levels may decline to a point where producing water becomes uneconomical and severely limits the ability of local agencies to meet water-supply demand.
To better understand the hydrogeology and water resources in the Yucaipa subbasin, the San Bernardino Valley Municipal Water District (SBVMWD) and the U.S. Geological Survey (USGS) initiated a cooperative study to evaluate the hydrogeologic system of the Yucaipa subbasin and in the encompassing YVW. A three-dimensional (3D) hydrogeologic framework model (HFM) was constructed as part of this report to quantify the structure and extent of hydrogeologic units in the YVW; the hydrologic system was conceptualized and quantified by Cromwell and others (2022a); and the Yucaipa Integrated Hydrological Model (YIHM; Alzraiee and others, 2022) was developed to simulate the integrated surface-water and aquifer systems, including natural and anthropogenic recharge and discharge throughout the study area during calendar years 1947–2014. The vertical discretization and hydraulic properties of the YIHM were based on the HFM. This report documents the construction of a quantitative HFM that uses various surface and subsurface datasets to define the thickness and extent of unconsolidated and consolidated sedimentary materials and define the location and orientation of geologic structures (faults, folds). The quantitative HFM can be used with an integrated hydrologic model to evaluate the effects of materials and geologic structures on groundwater flow in the Yucaipa subbasin.
Previous Investigations
Regional geologic and hydrogeologic mapping of the area was published originally by Eckis (1934) and then by Burnham and Dutcher (1960). A geologic mapping effort in the 1960s resulted in maps encompassing much of the area surrounding the Yucaipa subbasin, these maps include: the San Gorgonio Mountain and Morongo Valley 15-minute quadrangles at 1:62,500 scale (Dibblee and Minch, 2008) and a series of five maps at 1:24,000 scale including the Yucaipa (Dibblee and Minch, 2004), Beaumont (Dibblee and Minch, 2003a), El Casco (Dibblee and Minch, 2003b), Sunnymead (Dibblee and Minch, 2003c), and the southern half of the Redlands (Dibblee and Minch, 2003c) 7.5-minute quadrangles (fig. 2). Online portable document format (pdf) versions of these maps were made available in the 2000s; only these more recent versions of the maps are referenced in this report. A detailed map of surficial sediments and fault systems in the greater San Bernardino area (Matti and others, 1985) was used by Matti and Carson (1991) to calculate the susceptibility of these sediments to earthquake-induced liquefaction.
In the 1970s, 1980s, and 1990s, geologic maps at various scales were published that included the Yucaipa subbasin. A generalized geologic map at 1:250,000 scale was published of the greater San Gorgonio Pass region that also provided a regional tectonic model (Matti and others, 1985, 1992a), and maps at 1:24,000 scale included the 7.5-minute Redlands (Morton, 1978) and Yucaipa (Matti and others, 1992b) quadrangles. Revised geologic maps at various scales of the Yucaipa subbasin and surrounding area were published in the 2000s and 2010s. Revised maps at 1:24,000 scale include the Yucaipa (Matti and others, 2003a), El Casco (Matti and others, 2015), Sunnymead (Morton and Matti, 2001), and Redlands (Matti and others, 2003b) 7.5-minute quadrangles (fig. 2). A 1:100,000-scale map of the Santa Ana and San Bernardino 30-minute by 60-minute quadrangles compiled and synthesized the most recent geologic mapping available, including the revised maps mentioned above (Morton and Miller, 2006; outlines not shown in fig. 2).
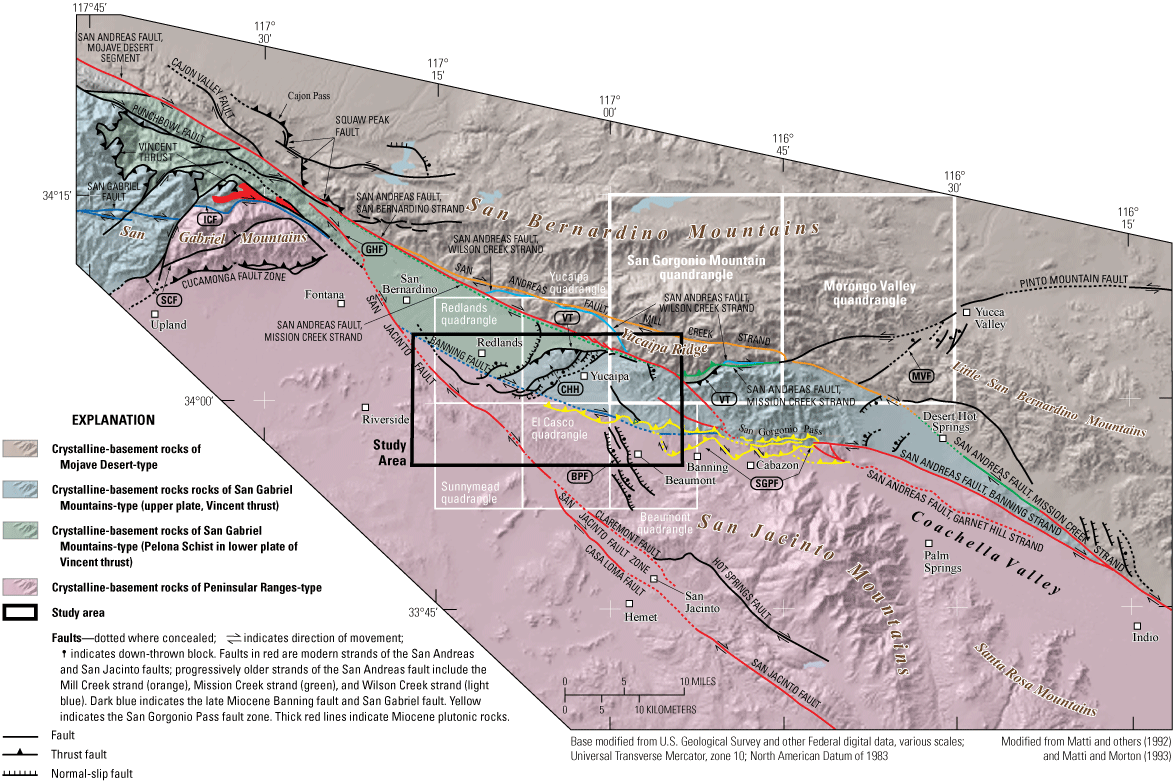
Location of the Yucaipa groundwater subbasin and Yucaipa Valley watershed relative to major faults and regional basement terranes (adapted from Matti and others [1992a] and Matti and Morton [1993]). Fault names and abbreviations are as listed in Matti and others (2003a). Fault abbreviations, from west to east, are: SCF, San Antonio Canyon fault; ICF, Icehouse Canyon fault; GHF, Glen Helen fault; VT, Vincent thrust; CHH, Crafton Hills horst-and-graben complex; BPF, Beaumont plain fault zone; SGPF, San Gorgonio Pass fault zone; MVF, Morongo Valley fault. Outlines are shown for the Redlands, Sunnymead, Yucaipa, El Casco, Beaumont, San Gorgonio Mountain, and Morongo Valley quadrangles.
Gravity, aeromagnetic, and seismicity data were used to create structural models of the greater San Gorgonio Pass region (Langenheim and others, 2005), the San Bernardino area (Anderson and others, 2004), and the Yucaipa subbasin (Mendez and others, 2016). These geophysical investigations, in combination with geologic and hydrologic investigations, offer substantial insight into the tectonic evolution of the greater Yucaipa subbasin area and provide the conceptual framework for this study.
The first hydrogeologic studies in the area around the Yucaipa subbasin were conducted by Lippincott (1902a, b) and Mendenhall (1905, 1908) who focused primarily on areas east of the Yucaipa subbasin near the cities of San Bernardino and Redlands (fig. 1). Groundwater storage capacity, groundwater flow, and hydrogeology were estimated and described for 35 groundwater basins in southern California, including the Yucaipa subbasin (Eckis, 1934). The geology and hydrology were further refined by Troxel1 (1954), Dutcher (1956), and Burnham and Dutcher (1960). Other hydrogeologic investigations of the Yucaipa subbasin focused on (1) groundwater inflow and outflow (Gleason, 1947; Dutcher and Burnham, 1960; Dutcher and Fenzel, 1972), (2) groundwater storage and artificial recharge (Moreland, 1970; Bloyd, 1971; Geoscience Support Services, Inc., 2015), (3) groundwater levels and sustainable yield (Fletcher, 1976; Mann, 1986; Fox, 1987; Todd, 1988; Geoscience Support Services, Inc., 2014a), and (4) water quality (Mendez and others, 2001). Numerical simulations of the aquifer system include a simplified regional well-response model (Durbin, 1974), and groundwater-flow models of selected areas within the Yucaipa subbasin (Powers and Hardt, 1974) and the Beaumont plain (Rewis and others, 2006; fig. 3). Various numerical models of the adjacent San Bernardino groundwater subbasin include those by Durbin and Morgan (1978), Hardt and Hutchinson (1980), Hardt and Freckleton (1987), Hughes (1992), and Danskin and others (2006).
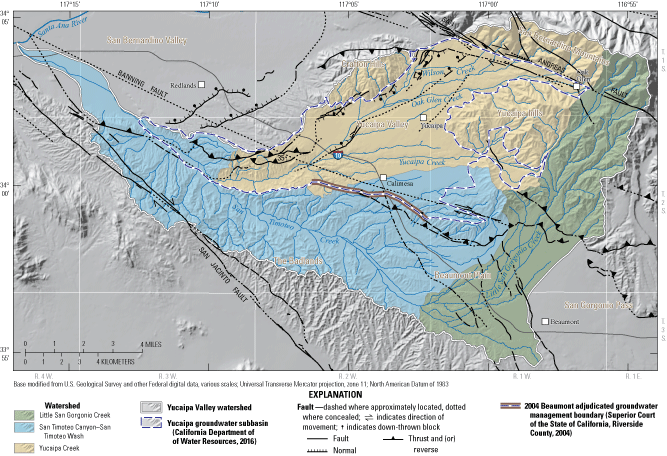
Subwatersheds of the Yucaipa Valley watershed and surrounding areas, San Bernardino and Riverside Counties, California.
Purpose and Scope
The purpose of this study is to develop a quantitative 3D HFM of the Yucaipa subbasin and surrounding area to better understand the aquifer system. A compilation of geologic maps, lithologic and geophysical borehole data, and gravity-derived depth-to-basement estimates was used to evaluate the subsurface extent of hydrogeologic units and geologic structures in the Yucaipa subbasin. The HFM was constructed using input-data types described above and interpolated using Earthvision geologic modeling software and ESRI ArcGIS version 10.7.1 geographic information systems (GIS) software. The HFM is suitable for use in basin-scale geologic and hydrogeologic investigations.
Description of Study Area
The Yucaipa subbasin is the area of interest for this study, and as such, most of the discussion and evaluation of the hydrogeologic system in this report focuses on the subbasin itself. The YVW, which encompasses the Yucaipa subbasin and its three source watersheds, is used as the active domain for the YIHM (Alzraiee and others, 2022), which enables the YIHM to calculate surface and subsurface recharge across the entire groundwater subbasin. Therefore, some geologic and hydrogeologic aspects of the YVW are discussed and evaluated in this report. The three watersheds that comprise the YVW (fig. 3) are (1) Yucaipa Creek, (2) San Timoteo Canyon–San Timoteo Wash, and (3) Little San Gorgonio Creek (Watershed Boundary Dataset 12-digit hydrologic unit codes [HUC 12]; U.S. Geological Survey, 2016). The San Timoteo Canyon–San Timoteo Wash watershed (named by the U.S. Geological Survey, 2016) refers to San Timoteo Creek (fig. 3), in this report “San Timoteo Wash” is used in reference to the watershed with the same name, and “San Timoteo Creek” is used in reference to the stream. The Little San Gorgonio Creek watershed does not directly overlap with the Yucaipa subbasin but rather drains from north to south and feeds into the San Timoteo Canyon–San Timoteo Wash watershed (fig. 3).
The Yucaipa Groundwater Subbasin
The Yucaipa subbasin is a semiarid inland valley that straddles southwestern San Bernardino County and northwestern Riverside County, about 12 mi southeast of the City of San Bernardino and about 75 mi east of Los Angeles (fig. 1). Located in the eastern part of the Upper Santa Ana Valley groundwater basin, the Yucaipa subbasin is bounded on the north by the San Bernardino Mountains, on the east by the low hills just east of the City of Yucaipa (hereafter referred to informally as the “Yucaipa hills”), on the south by the San Timoteo groundwater subbasin, and on the west by the Crafton Hills and the San Bernardino groundwater subbasin (figs. 3, 4A). The Yucaipa subbasin encompasses about 39 square miles, including the City of Yucaipa and several smaller municipalities (fig. 3).
Geologically, the Yucaipa subbasin is a sediment-filled depression situated between the northwest-trending San Andreas fault zone and San Jacinto fault (fig. 2). Crystalline-basement rocks crop out in the uplifted San Bernardino Mountains, Yucaipa hills, and Crafton Hills, and underlie the Yucaipa subbasin at depth; basin-fill materials consist of unconsolidated sediment and consolidated sedimentary rocks and overlie crystalline-basement rocks within the subbasin. Most groundwater storage and extraction are from the sedimentary materials that comprise the basin-fill aquifer (Cromwell and others, 2022a), although small-scale fractures, joints, and faults in crystalline basement rocks may provide conduits for transmitting recharge into the basin-fill aquifer.
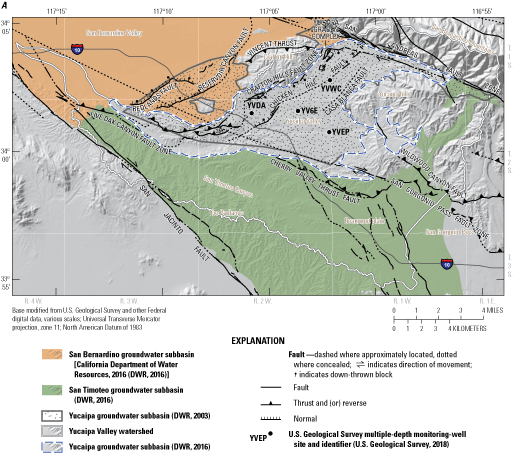
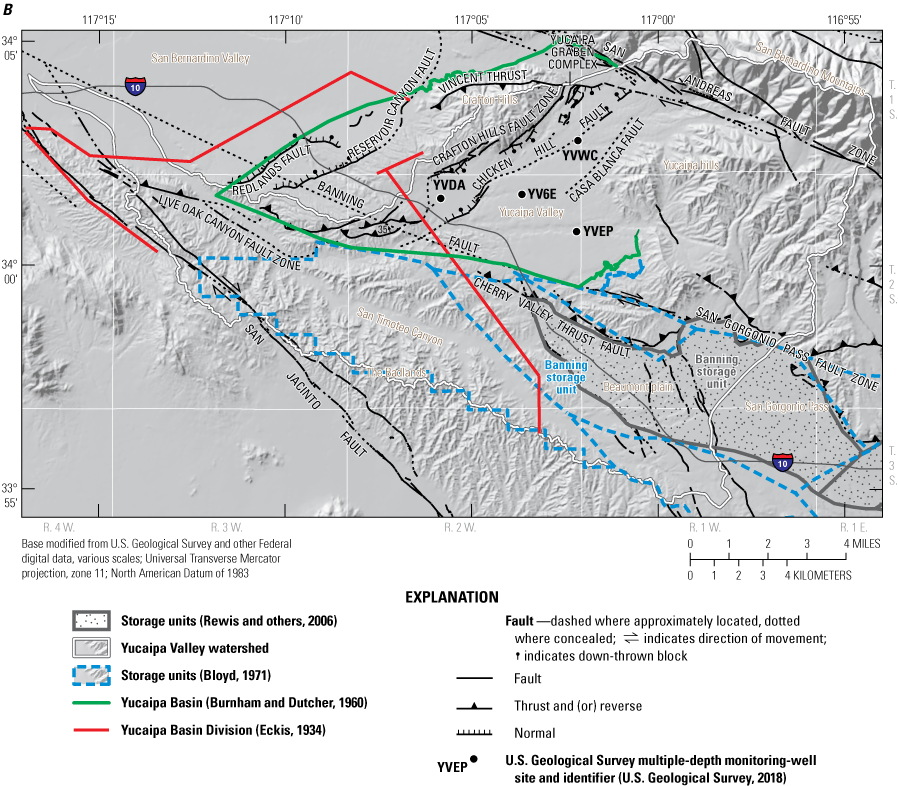
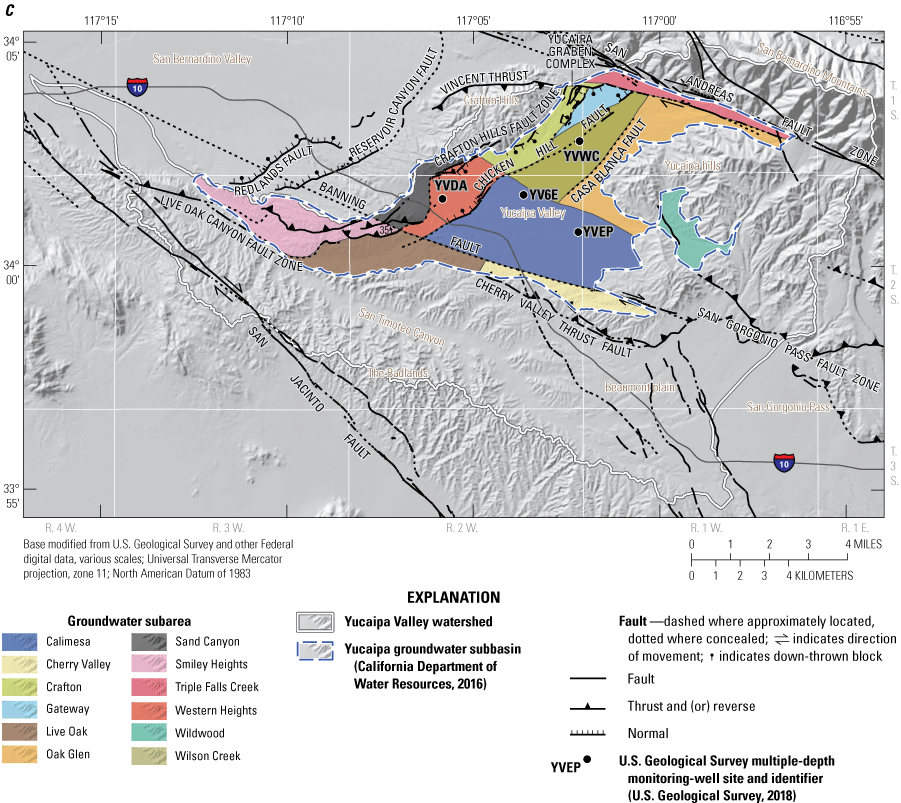
Past and present interpretations of the Yucaipa groundwater subbasin and adjacent groundwater areas, Yucaipa Valley watershed, San Bernardino and Riverside Counties, California. A, definitions of the Yucaipa groundwater subbasin from the California Department of Water Resources from 2003 and 2016, and adjacent groundwater subbasins; B, definitions of the Yucaipa groundwater subbasin and adjacent groundwater areas in the Beaumont plain from other studies; C, groundwater subareas of the Yucaipa groundwater subbasin defined by Cromwell and others (2022a).
Previous Definitions of the Yucaipa Groundwater Subbasin
Historically, the extent of the Yucaipa subbasin has varied from study to study. This variability demonstrates the challenge of correlating geologic relations observable at Earth’s surface with geologic, geophysical, and hydrologic properties estimated for the subsurface. With each new geologic and hydrogeologic study, scientists have learned more about how the location, extent, geologic age, and geologic character of known surface features—for example, faults, folds, permeable and less permeable geologic units—inform the interpretation and modeling of groundwater flow and recharge potential within the Yucaipa subbasin. In addition, scientific advances have required that groundwater-management boundaries be adjudicated and adjusted (for example, the 2004 Beaumont adjudication; Superior Court of the State of California, Riverside County, 2004). In combination, these factors have led to adjustments in the shape and hydrogeologic definition of the Yucaipa subbasin (figs. 4A–C).
The first definition of the Yucaipa subbasin was by Eckis (1934, p. 161–168, plates C and E) who recognized that groundwater in the Yucaipa subbasin was isolated hydrogeologically to the southwest from groundwater in what was then called the San Timoteo Basin. Eckis (1934) interpolated a “basin division” between the two areas (fig. 4B). Eckis (1934) also inferred that most of the modern Yucaipa subbasin was hydrogeologically continuous with groundwater areas in the Beaumont plain to the southeast and referred to this combined area as the “Yucaipa-Beaumont Basin.” The “basin division” of Eckis (1934) that divided the Yucaipa subbasin trended northwest-southeast between the Crafton Hills and The Badlands and was based on water-table differences at different depths of groundwater bearing sediments on either side of the divide (fig. 8 in Eckis, 1934). Eckis (1934) did not discuss geologic controls on the “basin division.”
Burnham and Dutcher (1960; p. 184 and fig. 121) provided the first robust definition of the then-named “Yucaipa Basin” (fig. 4B) and established much of the foundational scientific understanding that later studies would build upon. Burnham and Dutcher (1960) defined the basin as being bordered on the northwest by the San Bernardino groundwater subbasin at the Redlands fault and Crafton Hills, on the north by the San Bernardino Mountains along the San Andreas fault, on the east by the Yucaipa hills, and on the south by the Banning fault (fig. 4B). The northeastern part of the basin extended eastward between the Yucaipa hills and San Bernardino Mountains, along the San Andreas fault zone, although the extent was not defined in their report.
PDF versions of the report by Burnham and Dutcher (1960) occasionally have figure calls between text body and figures that are confusing. In some instances, when a figure is cited in the narrative, either (1) there is no figure number present as called for in the text; or (2) at the upper-right corner of a given figure, two numbers may be indicated, casting doubt as to whether the reader is examining the correct figure. In this report, best efforts were made to clarify the proper figure reference.
The basin definition of Burnham and Dutcher (1960) involved several newly described faults (fig. 4B) that played a significant role in bounding the “Yucaipa Basin,” including the Redlands fault (Matti and others, 2003b), Crafton fault (now referred to as the Reservoir Canyon fault; Morton, 1978; Matti and others, 2003a), Oak Glen fault (now included as part of the Yucaipa graben complex; see “Faults” section of this report and Matti and others, 2003a), Chicken Hill fault (Matti and others, 2003a), and Banning fault (Matti and others, 2003a, b, 2015). Unfortunately, these fault names have not been used consistently in the geologic and hydrogeologic literature. In the half century since Burnham and Dutcher (1960) published their findings, subsequent investigations (Dibblee, 1968; Morton, 1978; Matti and others, 1992b, 2003a, b, 2015596061; Morton and Miller, 2006; Mendez and others, 2016) have refined or revised the mapped distribution of faults in the Yucaipa Valley area, identified new fault patterns, or both (figs. 4 and 5), including the Yucaipa graben complex, the Crafton Hills fault zone, and the Live Oak Canyon fault zone. Refined fault interpretations or new fault patterns could potentially influence how boundaries for the Yucaipa subbasin are constrained and how fault patterns might influence groundwater flow. A discussion of original and subsequent evidence for recognizing and mapping faults in the Yucaipa subbasin area is included in the “Faults” section of this report.
In 2003, the California Department of Water Resources (2003; fig. 4A) adjusted the footprint and boundaries of the Yucaipa subbasin. That report described the subbasin as being bounded on the west by the Redlands fault and the Crafton Hills, on the north by the San Andreas fault zone, on the east by the Yucaipa hills, and on the south by the Banning fault. The subbasin boundaries of California Department of Water Resources (2003) were equivalent to those of Burnham and Dutcher (1960; fig. 4A) along the southern and western extents of the subbasin, except along the Crafton Hills. There, California Department of Water Resources (2003) placed the subbasin boundary along the southern extent of the hills (fig. 4A) while Burnham and Dutcher (1960) placed the boundary along the northern extent (fig. 4B). In addition, a small area of uplifted crystalline rocks southwest of the Crafton Hills (east of the intersection of the Reservoir Canyon and Banning faults) was excluded from the subbasin by California Department of Water Resources (2003; fig. 4A). Burnham and Dutcher (1960) did not determine the exact eastern or northern extents of the subbasin along the Yucaipa hills and San Bernardino Mountains (fig. 4B); therefore, a direct comparison of their potential eastern extent of the Yucaipa subbasin and that of California Department of Water Resources (2003) is not possible. However, Burnham and Dutcher (1960; p. 184) presumed that the limits of the basin were “at consolidated rocks or faults that form barriers to ground-water movement.”
Figure 4A shows additional groundwater areas of the Yucaipa subbasin. These areas include groundwater storage units of the Beaumont plain (Bloyd, 1971) and the Beaumont and Banning storage units (Rewis and others, 2006).
Current Definition of the Yucaipa Groundwater Subbasin
The extent of the Yucaipa subbasin was updated and revised in 2016 by the DWR (California Department of Water Resources, 2016) as part of the Sustainable Groundwater Management Act (SGMA) process. The update was in response to a request from stakeholders that the Yucaipa subbasin boundaries be modified to be more consistent with local watersheds and to better conform with adjacent groundwater basins. As defined in 2016 by the California Department of Water Resources, boundaries for the Yucaipa subbasin are based on geologic, administrative, and topographic criteria. Geologic boundaries identified by California Department of Water Resources (2016) include both faults and geologic contacts. For example, the western and northern boundaries of the subbasin largely are fault controlled (Crafton Hills fault zone, San Andreas fault zone; figs. 4A, 5), as are groundwater areas within the subbasin (Chicken Hill fault; fig. 4C). By contrast, the eastern subbasin boundaries coincide with geologic contacts that develop between sedimentary basin-fill and adjacent uplands underlain by crystalline basement rocks. For example, the subbasin boundaries between the Yucaipa Valley and the Yucaipa hills (fig. 5). The southeastern and southern boundaries of the Yucaipa subbasin are based on multiple criteria (California Department of Water Resources, 2016, citing boundary locations adjudicated by the Superior Court of the State of California, Riverside County, 2004; fig. 3). To the southeast, the subbasin boundary coincides with an outcrop trace of the Banning fault (figs. 4A, 5); to the south the boundary coincides partly with a concealed trace of the Banning fault (as inferred by Burnham and Dutcher, 1960, p. 100; and Bloyd, 1971; fig. 4B) and partly with physiographic features (fig. 3). The subbasin definition of California Department of Water Resources (2016) is utilized in this report.
The Yucaipa subbasin historically has been divided into smaller groundwater subareas (hereafter referred to as “subareas”) based on the location of faults and other barriers to groundwater flow. The subbasin was split into smaller subareas on the basis of groundwater levels that were observed to be offset across then-mapped faults and other unnamed faults, which Burnham and Dutcher (1960) collectively referred to as “barriers to groundwater flow”. The extents and positions of the subareas were further refined by Moreland (1970), Geoscience Support Services, Inc. (2014b), and most recently by Cromwell and others (2022a). Cromwell and others (2022a) retained the subarea boundaries mapped by Moreland (1970), and made adjustments along selected boundaries to align with current fault maps and to match the extent of the Yucaipa subbasin as defined by California Department of Water Resources (2016). As part of their effort, the number of subareas was expanded from 7 (Moreland, 1970) to 12 (fig. 4C). The subareas of Cromwell and others (2022a) are used in this report.
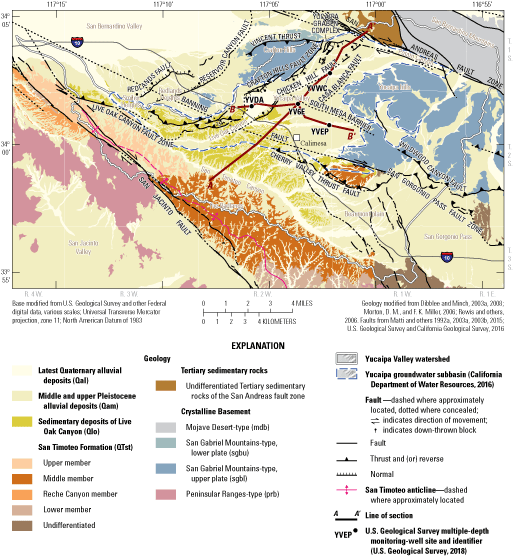
Geologic map of the Yucaipa groundwater subbasin, Yucaipa Valley watershed, San Bernardino and Riverside Counties, California.
Geology of the Yucaipa Groundwater Subbasin
The geology of the Yucaipa subbasin and the surrounding area (fig. 5) is the foundation on which the HFM is constructed and designed. In this section, the regional and local geologic setting, geologic units, and geologic structures are described.
Regional Geologic Setting
The Yucaipa subbasin is a sediment-filled depression situated between the northwest-trending San Andreas fault zone and San Jacinto fault (figs. 2, 5). Much of the topographic and structural relief that characterizes the subbasin can be attributed to tectonic interactions between these two structural systems (Matti and Morton, 1993). The San Andreas fault zone and San Jacinto fault are right-lateral strike-slip faults (indicated by arrows on figs. 2 and 5), and each consists of several individual, sub-parallel fault strands. The San Jacinto fault has been active since about 1.2 Ma (million years ago; Matti and Morton, 1993) to about 1.5 Ma (Morton and Matti, 1993), and the San Andreas fault zone has been active in its present orientation since about 4–5 Ma (Matti and Morton, 1993). The San Andreas and San Jacinto fault zones converge about 30 mi northwest of the Yucaipa subbasin, but south and east of this juncture, the San Jacinto fault steps southwest away from the San Andreas fault zone (figs. 2, 5; Morton and Matti, 1993; Anderson and others, 2004). Tectonic interaction between the two major strike-slip fault zones has produced domains of extension and contraction between them (fig. 2), yielding the structurally complex fault framework of the Yucaipa subbasin.
Local Geologic Setting
This section describes and discusses the geologic setting that controls the spatial and subsurface extent of geologic units that comprise the Yucaipa subbasin. The geologic setting of the subbasin is complex and historically has been interpreted differently by different studies; therefore, the geologic setting was updated so that hydrogeologic generalizations and interpretations used in the HFM can be related to the underlying geologic architecture. The following section describes the geologic units that underlie the Yucaipa subbasin and the structures (faults and folds) that deform them. The geologic units include Mesozoic and older crystalline rocks, Tertiary and early Quaternary sedimentary materials— including the San Timoteo Formation and sedimentary deposits of Live Oak Canyon—and later Quaternary alluvial deposits (fig. 5, table 1).
Table 1.
Descriptions and approximate ages of geologic groupings and relations with hydrogeologic units defined for the three-dimensional hydrogeologic framework model, Yucaipa groundwater subbasin, Yucaipa Valley watershed, San Bernardino and Riverside Counties, California.| Generalized geologic unit | Description | Approximate age | Hydrogeologic unit |
|---|---|---|---|
| Latest Quaternary surficial deposits (Qal) | Artificial fill, wash deposits (very young, young), alluvial-fan deposits (very young, young), axial-valley deposits (very young, young), undifferentiated surficial deposits (young, very young)1 | Holocene and latest Pleistocene (modern to about 15,000 years)2 | Surficial materials |
| Middle and upper Pleistocene Alluvial Deposits (Qam) | Wash deposits (old, very old), alluvial-fan deposits (old, very old), undifferentiated surficial deposits (old, very old), pedogenic soil and (or) residuum (very old)1 | Pleistocene; (as old as 500,000 and as young as 50,000 years old)2 | Surficial materials/unconsolidated sediment |
| Sedimentary deposits of Live Oak Canyon (Qlo) | New name for sedimentary materials, largely northeast of San Timoteo Canyon, previously referred to as "San Timoteo Formation, upper member"2 | Early and middle Pleistocene (1.2–1.5 million years old to 500,000–600,000 years old)2,3,4 | Unconsolidated sediment |
| San Timoteo Formation (QTst) | Various members of the San Timoteo Formation. Includes lower and middle members as mapped by Matti and others (2015), and upper member, quartzite conglomerate member, and Reche Canyon member as mapped by Morton and Miller (2006). | Pliocene and Pleistocene (about 5 million years old to 1.2–1.5 million years old)3,4,5,6,7,8 | Consolidated sedimentary materials |
| Tertiary sedimentary rocks (Tso) | Mill Creek Formation of Gibson (1971; Pelona Schist-bearing conglomerate, volcanic-clast-bearing sandstone, mudstone, sandstone); formation of Warm Springs Canyon (nonmarine sandstone and conglomerate); includes deep subsurface rocks south of the Banning fault forming gravity-low identified by Langenheim and others (2005; see cross section B-B' in fig. 7A) | Probably late Miocene2,9 | Consolidated sedimentary materials/ Crystalline basement (Mill Creek Formation and formation of Warm Springs Canyon) |
| Crystalline basement (mdb, sgb, sgbu, sgbl, prb) | Mojave Desert-type (foliated and gneissic granitoid rocks that intrude older plutonic and metamorphic rocks); San Gabriel Mountains-type (lower-plate assemblage of greenschist-facies metasedimentary rocks and metabasalt, and upper-plate assemblage of foliated and gneissose rocks); Peninsular Ranges-type (granitoid rocks that locally intrude bodies of older metasedimentary rock) | Mesozoic–Paleozoic and (or) late Proterozoic2,9 | Crystalline basement |
Geologic Units
The geologic discussion and interpretations in this report are based on geologic mapping and interpretation of the Yucaipa subbasin published since the 1980s (see “Previous Investigations” section). Geologic maps at 1:24,000 scale of the 7.5-minute Yucaipa (Matti and others, 2003a), El Casco (Matti and others, 2015), Sunnymead (Morton and Matti, 2001), and Redlands (Matti and others, 2003b) quadrangles provided a context for geologic relations within, and to the south and west of the Yucaipa Subbasin (fig. 2). The generalized geologic map at 1:250,000 scale of the greater San Gorgonio Pass region (Matti and others, 1985, 1992a) included the Yucaipa subbasin and provided a regional tectonic model within which the structural framework of the subbasin was evaluated. The 1:100,000 scale geologic-map compilation of the 30-minute by 60-minute Santa Ana and San Bernardino quadrangles (Morton and Miller, 2006) stitched regional mapping efforts into a broad footprint that included the Yucaipa subbasin. This compilation included the earlier work of the Yucaipa (Matti and others, 2003a), Redlands (Matti and others, 2003b), and Sunnymead (Morton and Matti, 2001) 7.5-minute quadrangles, but was released prior to publication of the El Casco 7.5-minute quadrangle of Matti and others (2015). The subsequent map of the El Casco 7.5-minute quadrangle of Matti and others (2015) revised some of the geologic interpretations by Morton and Miller (2006) and introduced new stratigraphic nomenclature (notably the addition of the sedimentary deposits of Live Oak Canyon in place of the upper member of the San Timoteo Formation, see below).
Surface geology of the study area (fig. 5) encompassed by the Yucaipa, El Casco, Sunnymead, and Redlands 7.5-minute quadrangles (fig. 2) was derived from the compilation of Morton and Miller (2006); surface geology for the study area east of those quadranges (fig. 2) was derived from the 1:62:500 scale map of the 15-minute San Gorgonio Mountain and Morongo Valley quadrangle (Dibblee and Minch, 2008), the 1:24,000 scale map of the 7.5-minute Beaumont quadrangle (Dibblee and Minch, 2003a), and the geologic interpretations of Rewis and others (2006). The hydrogeologic investigation of the Beaumont plain by Rewis and others (2006) used the geologic interpretations that were later released by Matti and others (2015).
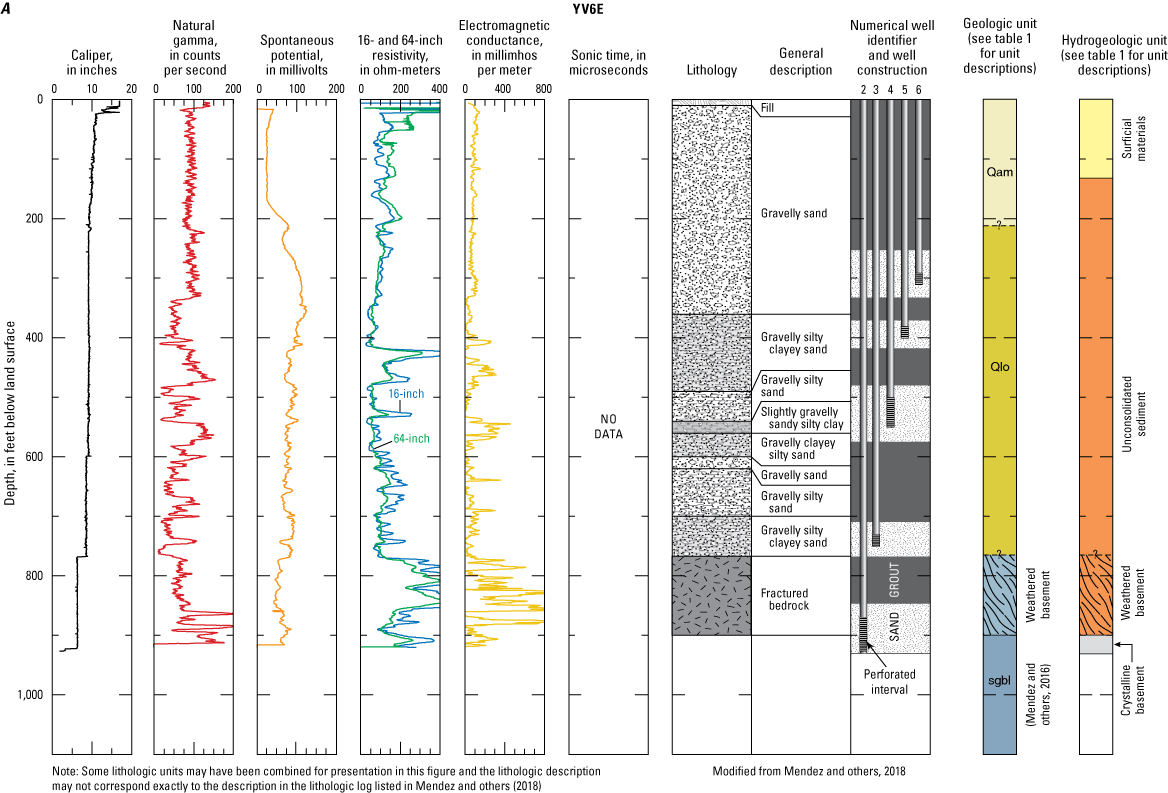
Figure 5 summarizes the geologic setting of the Yucaipa subbasin, and figure 6 illustrates the gravity-derived depth-to-basement beneath the sedimentary basin-fill (Anderson and others, 2004; Langenheim and others, 2005; Mendez and others, 2015). Deep depth-to-basement estimates in figure 6 correspond to measured gravity lows. There is considerable variability in the depth-to-basement, but two patterns are evident: (1) beneath much of the Yucaipa subbasin, crystalline basement is shallower than about 2,000 feet (ft) below land surface; and (2), there are two primary areas where the sedimentary fill is greater than 3,000 ft thick (fig. 6), implying deep structural depressions in the crystalline-basement rocks over the last several million years have been filled with low-density sedimentary material. One of these structural lows is within the Western Heights subarea, along the west margin of the Yucaipa subbasin; the second structural low is situated south of the Banning fault. Geologic cross sections A-A’ and B-B’ (figs. 7A, 7C) depict how the two deep parts of the subbasin associated with gravity lows affect the local geology, especially in relation to the Chicken Hill fault and the Banning fault (fig. 5; discussed below).
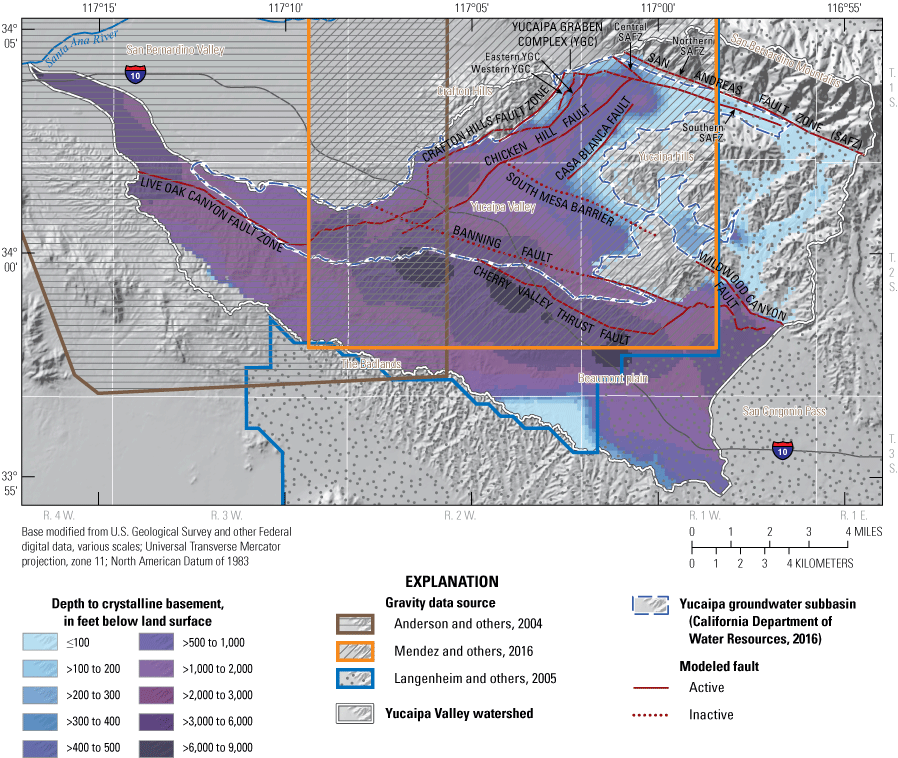
Extent of depth-to-basement input data and interpolated depth-to-crystalline basement of the three-dimensional hydrogeologic framework model, Yucaipa groundwater subbasin, Yucaipa Valley watershed, San Bernardino and Riverside Counties, California. See table 3 for information on model faults.
Crystalline Basement Rocks
Crystalline rocks crop out around the margins of the Yucaipa subbasin (fig. 5) and underlie all sedimentary materials (figs. 7A, 7C, 8A, 8B). Herein, these rocks are referred to as crystalline-basement rocks because they form a hard foundation for overlying sedimentary materials. The basement rocks can be subdivided into three distinctive “packages,” or region-wide lithologies (figs. 2, 5; Matti and others, 1992b; Matti and Morton, 1993): (1) crystalline-basement rocks of Mojave Desert-type that outcrop in the San Bernardino Mountains north of the San Andreas fault zone, (2) crystalline-basement rocks of San Gabriel Mountains-type that outcrop in the Crafton Hills and Yucaipa hills north of the Banning fault, and (3) crystalline-basement rocks of Peninsular Ranges-type that outcrop south of the Yucaipa subbasin and south of the Banning fault.
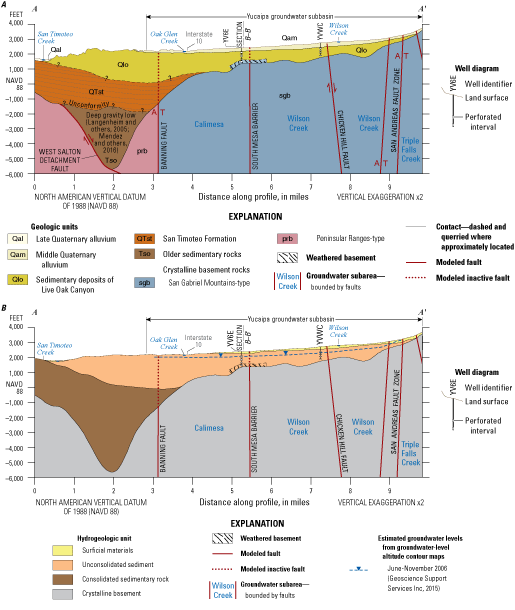
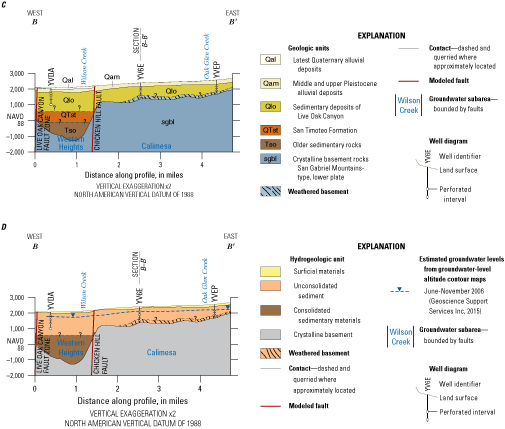
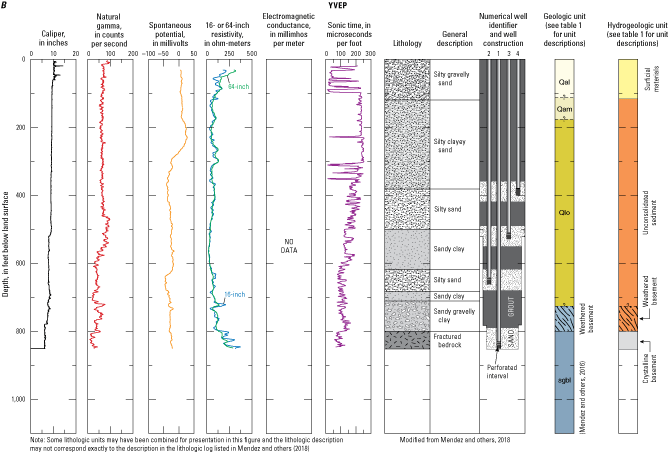
Sections through the Yucaipa groundwater subbasin, Yucaipa Valley watershed, San Bernardino and Riverside Counties, California. U.S. Geological Survey multiple-depth monitoring-well sites YV6E, YVWC, YVDA, YVEP, shown with perforation intervals. A and C, geologic cross sections showing how the subsurface distribution of geologic units listed in table 1 are interpreted in this report; B and D, cross sections along the same transects showing how modeled units in the three-dimensional hydrogeologic framework model compare to and correlate with geologic units in A and B and in table 1. See figure 5 for location of sections. Groundwater subareas listed on the sections are shown in figure 4C.
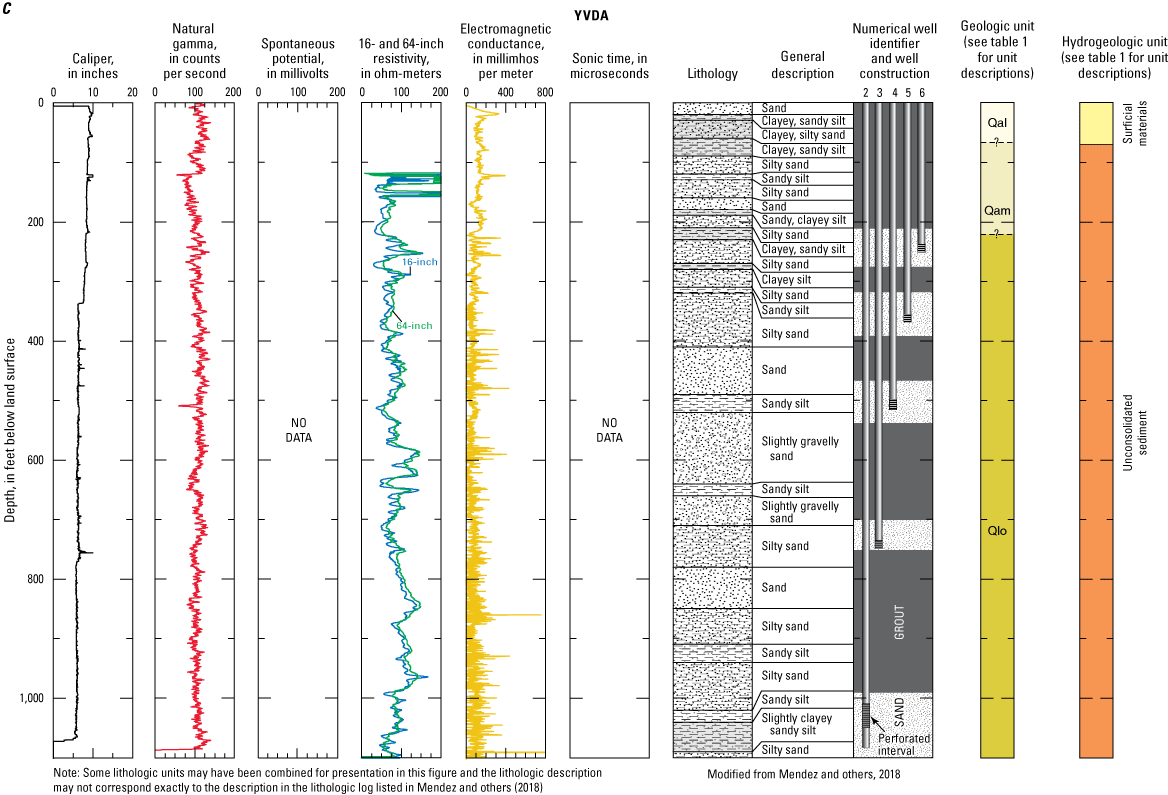
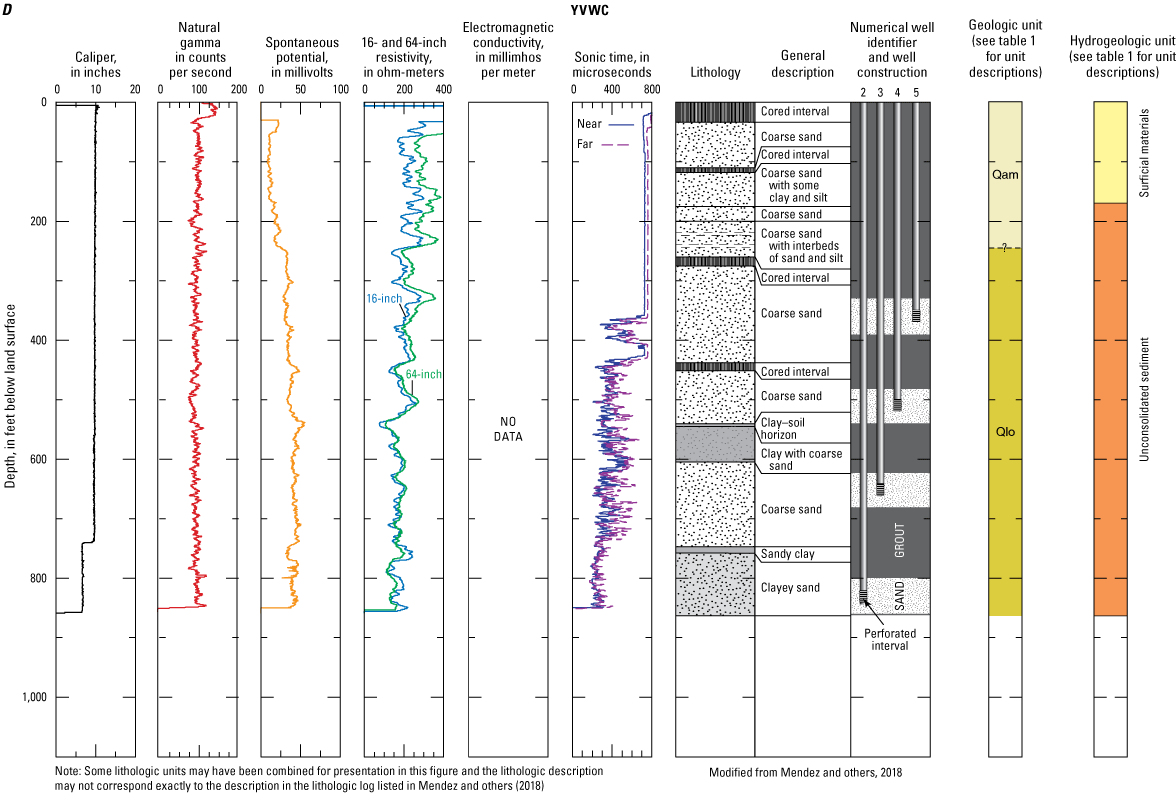
Geophysical logs, summary lithology, well construction information, potential geologic unit interpretations, and hydrogeologic unit interpretations for U.S. Geological Survey multiple-depth monitoring-well sites in the Yucapia groundwater subbasin, Yucaipa Valley watershed, San Bernardino and Riverside Counties, California. A, YV6E; B, YVEP; C, YVDA; and D, YVWC, modified from Mendez and others (2018).
Mojave Desert-Type
Mojave Desert-type rocks underlie the San Bernardino Mountains north and east of the San Andreas fault zone (figs. 2, 5). These consist primarily of foliated and gneissic Mesozoic granitoid rocks (granodiorite and less common monzogranite) that intrude older plutonic rocks (Triassic quartz monzonite and monzogranite) and even older metamorphic rocks (Paleozoic and [or] late Proterozoic quartzite, marble, and gneiss). Sandwiched between strands of the San Andreas fault zone is a narrow slice of Mojave Desert-type rocks consisting of heterogeneous foliated and gneissose granitoids (the Wilson Creek block of Matti and Morton [1993] and Matti and others [2003a], not shown in fig. 2) that are broadly correlated with Mojave Desert-type rocks like those in the Little San Bernardino Mountains.
San Gabriel Mountains-Type
San Gabriel Mountains-type rocks occur between the San Andreas and Banning faults and form the subsurface basement floor beneath sedimentary materials of the Yucaipa subbasin (section A-A’, fig. 7A); these rocks are exposed in the Crafton Hills and Yucaipa hills (fig. 5). The rocks comprise two structural packages separated by the regionally extensive Vincent-Orocopia-Chocolate Mountain thrust (Ehlig, 1981; not shown on fig. 2), locally represented in the Yucaipa subbasin by the Vincent thrust (figs. 2, 5; sawteeth on the mapped fault indicate the upper plate). The two structural packages are (1) a lower-plate assemblage (Pelona Schist) consisting mainly of greenschist-facies metasedimentary rocks and minor metabasalt overlain by (2) an upper-plate assemblage consisting of foliated and gneissose rocks that originated as Mesozoic granodiorite and tonalitic plutonic rocks but subsequently were strongly deformed into foliated, gneissose, and mylonitic rocks whose original igneous fabrics largely have been overprinted by high-strain fabrics. Local exposures of the Vincent thrust occur on the west- and northwest-facing slopes of the Crafton Hills (fig. 5; Matti and others, 2003a). The thrust dips eastward and likely projects into the subsurface beneath the Yucaipa subbasin and deep beneath upper-plate rocks exposed in the Yucaipa hills.
Peninsular Ranges-Type
The third regionally persistent assemblage of crystalline rocks occurs in the vicinity of the Yucaipa subbasin, but only in the subsurface south of the Banning fault (figs. 2, 5, and 7A). These are crystalline rocks of Peninsular Ranges-type, mainly granitoid rocks of various compositions (tonalite, granodiorite, and quartz diorite) of Mesozoic (mainly Cretaceous) age that locally intrude bodies of much older metasedimentary rock (quartzite, marble, biotite-quartz gneiss).
Tertiary Sedimentary Rocks
Tertiary sedimentary rocks are sedimentary materials that are consolidated. They do not crop out in the Yucaipa subbasin but are thought to occur in the deeper subsurface in the Western Heights subarea (fig. 7C). Lower Pleistocene and Pliocene sedimentary rocks crop out in The Badlands south of the Yucaipa subbasin, and presumably these occur in the subsurface south of the Banning fault (figs. 5, 7A). Sedimentary rocks older than the San Timoteo Formation may occur in the deep subsurface south of the Banning fault as well as the Western Heights subarea (figs. 7A, C), and these may be as old as late Miocene. Upper Miocene sedimentary rocks crop out north of the Yucaipa subbasin in the San Bernardino Mountains north of the San Andreas fault zone.
Undifferentiated Sedimentary Rocks of the San Andreas Fault Zone
Undifferentiated Tertiary sedimentary rocks located between strands of the San Andreas fault zone at the northeastern margin of the Yucaipa subbasin (fig. 5) include the Mill Creek (Gibson, 1971) and Warm Springs Canyon Formations (Matti and others, 2003a; Morton and Miller, 2006). The age of these continental sedimentary rocks are not well constrained, but they are probably late Miocene and constitute thick sedimentary fill sequences deposited in and adjacent to the San Andreas fault zone (Matti and others, 2003a).
Deep Subsurface Sedimentary Rocks
Old sedimentary rocks are likely present in the deep subsurface within structural lows in the Western Heights subarea and south of the Banning fault (figs. 7A, C). The sedimentary rocks in each locality are likely of similar age but may have different provenance, so they are discussed separately below.
South of the Banning Fault
The strong gravity low south of the Banning fault (Langenheim and others, 2005; Mendez and others, 2016) corresponds to a structural low of more than 8,000 ft below land surface (fig. 6). Geologic cross section A-A’ (fig. 7A) depicts a volume of older sedimentary rock (unit Tso) forming the lower part of the structural low, overlain by the San Timoteo Formation (unit QTst) and sedimentary deposits of Live Oak Canyon (unit Qlo). Langenheim and others (2005) and Mendez and others (2016) interpreted the gravity low as a fault-parallel trough filled with low-density sedimentary materials. Langenheim and others (2005, p. 1562; also Mendez and others, 2016) correlated the gravity low south of the Banning fault with similar gravity lows at the northwest head of the Salton Trough; they proposed that the fault has displaced the comparable gravity signatures by about 19 mi. Alternatively, using figure 4A from Langenheim and others (2005), we measured about 31 mi of dextral slip required for the Banning fault to restore the northwest end of the gravity lows near the Yucaipa subbasin to the northwestern Coachella Valley (fig. 2). Because the Banning fault is thought to have been active during the period 10–5 Ma (Matti and Morton, 1993), the oldest deep sedimentary rocks in gravity low south of the Banning fault must be older than 5 Ma (late Miocene or older), and probably correlate with comparable old sedimentary rocks at the northwest head of the Salton Trough.
Not enough is known about the deep sedimentary rocks south of the Banning fault to interpret their formational assignment. Matti and others (2015, p. 66) briefly discussed lithologic records from a subsurface boring between the southern Yucaipa subbasin boundary and San Timoteo Canyon (Beaumont Midway Oil Company; Shuler, 1953), including the possibility that the boring encountered marine sedimentary rock at 2,250 ft below land surface. If confirmed, the marine rocks might represent occurrence of the Imperial Formation, well known in eastern San Gorgonio Pass and the northwest head of the Salton Trough (Allen, 1957).
The deep sedimentary rocks are inferred to be overlain (most likely unconformably) by the San Timoteo Formation (fig. 7A). This inference is supported by the basal San Timoteo Formation being about 4.5–5 million years old (Albright, 1997, 1999; Matti and others, 2015) and thus post-dates dextral slip proposed for the Banning fault (Matti and Morton, 1993). Cross section A-A’ not only depicts an unconformity between the old sedimentary rocks and the San Timoteo Formation but also shows the San Timoteo Formation projecting northward atop the now-terminated Banning fault and lapping onto crystalline-basement rocks of San Gabriel Mountains-type (fig. 7A). In cross section A-A’, note that a geologic structure termed the West Salton detachment fault is questionably inferred to separate the deep sedimentary rocks from crystalline-basement rocks of Peninsular Ranges-type to the south (fig. 7A). The location of the West Salton detachment fault west of San Gorgonio Pass (fig. 7A) was proposed by Matti and Langenheim (2008) and discussed by Matti (2018).
Western Heights Subarea
The strong gravity low in the Western Heights subarea recognized by Langenheim and others (2005) and Mendez and others (2016) corresponds to a structural low as deep as about 4,000 ft below land surface. Cross section B-B’ (fig. 7C) depicts a volume of older sedimentary rock filling the lower part of the Western Heights subarea structural low, overlain by the San Timoteo Formation, sedimentary deposits of Live Oak Canyon, and Quaternary sedimentary units (geologic units described below). Older sedimentary rocks deep in the Western Heights subarea could not be assigned to any known geologic unit because they are not penetrated by subsurface borings, so they are simply assigned to the deep subsurface sedimentary rock unit (unit Tso). The rocks are not likely to be correlated with or lithologically similar to deep subsurface sedimentary rocks south of the Banning fault because the Banning fault separates the two sedimentary sequences and has juxtaposed them against each other by as much as 25 mi of dextral slip (Matti and Morton, 1993). The deep subsurface sedimentary rocks in the Yucaipa subbasin are inferred to be Miocene in age.
San Timoteo Formation
The San Timoteo Formation is a regionally important stratigraphic unit that flanks the northeast margin of the San Jacinto fault. The unit, for the most part, does not crop out within the Yucaipa subbasin, but is well exposed in The Badlands (fig. 5; Morton and Matti, 2001; Matti and others, 2003b, 201561; Morton and Miller, 2006). For much of this outcrop exposure, the San Timoteo Formation is folded into a northwest-trending asymmetric anticline having a southwestern limb that dips steeply toward the San Jacinto Valley and a northeastern limb that dips shallowly toward (and presumably beneath) the Yucaipa subbasin. The other surface exposure of the San Timoteo Formation is at the southeastern part of the Yucaipa subbasin—in the hangingwall (upper plate, indicated by the presence of sawteeth in fig. 5) of the Cherry Valley thrust fault (fig. 5). There, the unit also is folded into an asymmetric anticline having a steeply dipping southwestern limb and a shallower northeastern limb (Matti and others, 2015).
Regionally, the San Timoteo Formation is separated into multiple members and subunits (fig. 5; Morton and Miller, 2006; Matti and others, 2015). The upper member and Reche Canyon member crop out in the northwestern part of The Badlands (Morton and Miller, 2006) and probably have no counterparts within the Yucaipa subbasin, although the upper member crops out adjacent to the westernmost subbasin boundary. The middle and lower members of the San Timoteo Formation crop out mainly south of the Yucaipa subbasin in the El Casco 7.5-minute quadrangle (Matti and others, 2015). The middle member generally consists of light-gray, sheet-like layers of well-consolidated to cemented pebble-cobble conglomerate, with medium to thick intervals of gray-brown fine- to coarse-grained sandstone and minor amounts of siltstone and mudstone intervals (Frick, 1921; Matti and others, 2015). The lower member is separated into several subunits (Matti and others, 2015) that generally are much finer grained than the middle member, including abundant fine- to coarse-grained sandstone and associated intervals of yellowish-gray colored mudrock.
The San Timoteo Formation is shown as “undifferentiated” in the Beaumont 7.5-minute quadrangle southeast of the Yucaipa subbasin (figs. 2, 5). In this report, the formation in this area is adopted as presented by Dibblee and Minch (2003a) and Rewis and others (2006)—those authors did not differentiate between different members of the San Timoteo Formation. Interpreting different members of the formation in this area was beyond the scope of this report. Typical lithologies of the undifferented sediments of the San Timoteo Formation include well-consolidated to cemented, well sorted fine- to coarse-grained sand and sandstone and sheet-like layers of well-consolidated to indurated pebble-cobble gravel and conglomerate (Dibblee and Minch, 2003a; Rewis and others, 2006).
Sediments of the San Timoteo Formation were sourced from crystalline rocks north and northeast of the formation’s depocenter. In large part the sources were rocks of San Gabriel Mountains-type (both upper and lower plates of the Vincent thrust), but in the northwestern part of The Badlands some sediment was sourced from rocks of Mojave Desert-type (the quartzite-bearing conglomerate unit of Matti and others, 2003b, unit QTstcq; see discussion by Morton and Matti, 1993). The depositional transition between lower and middle members of the San Timoteo Formation and younger parts of the formation—especially the quartzite-bearing conglomerate unit (mapped as part of the upper member in fig. 5; Morton and Matti, 2001; Matti and others, 2003b)—marks an important shift in Quaternary paleogeography for the region surrounding the Yucaipa subbasin. This shift presumably was linked to inception of dextral slip on the San Jacinto fault. Motion on that structure, coupled with simultaneous folding and uplift of the lower and middle San Timoteo members (Kendrick and others, 2002) uplifted The Badlands landscape above adjacent lowlands where sediment continued to accumulate—but in depositional patterns different from those that existed when the lower and middle members accumulated. This new paleogeographic setting not only received sediment sourced from the San Bernardino Mountains but also Pelona Schist-bearing sediment derived from outcrops in the southeastern San Gabriel Mountains. Fossils collected from the San Timoteo Formation in The Badlands (Morton and others, 1986; Repenning, 1987; Morton and Matti, 1993; Albright, 1997, 19992; Reynolds and others, 2013) suggest that these paleogeographic changes occurred after about 1.3–1.5 Ma (Albright, 1999). It is not clear that this paleogeographic evolution is recorded in subsurface sedimentary rocks in the Yucaipa subbasin north of the Banning fault.
The location of cross section A-A’ (figs. 5 and 7A) does not allow the section to show geologic units that occur beneath the San Timoteo Formation in the southeastern part of The Badlands. There, the San Timoteo Formation is underlain by the Mount Eden Formation, a Miocene unit of nonmarine sedimentary rock characterized by clasts exclusively of Peninsular Ranges-type (Matti and others, 2015). Stratigraphic and paleogeographic relations between the Mount Eden beds and deep subsurface sedimentary rocks south of the Banning fault, in the hangingwall of the West Salton detachment fault, are not obvious.
Cross section B-B’ (fig. 7C) depicts undifferentiated San Timoteo Formation in the subsurface of the Western Heights subarea (unit QTst). If present, these sedimentary deposits could correlate with younger parts of the San Timoteo Formation, possibly with the upper member as recognized by Morton and Miller (2006) in the northwestern part of The Badlands. This hypothetical correlation with the upper member of the formation is speculative, however, and is based on the inference that upper member of the San Timoteo Formation may not have accumulated in the Yucaipa subbasin while sediment in the lower and middle members accumulated in The Badlands.
Sedimentary Deposits of Live Oak Canyon
The sedimentary deposits of Live Oak Canyon comprise a large part of the principal water-bearing hydrogeologic unit in the Yucaipa subbasin (Cromwell and others, 2022a). For this reason, the geologic unit’s nomenclatural usage and physical stratigraphy is described in detail.
Stratigraphic Nomenclature
The new name “sedimentary deposits of Live Oak Canyon” was applied by Matti and others (2015) to a sequence of unconsolidated to consolidated sandy and gravelly sedimentary materials that are best exposed north of San Timoteo Canyon and along the west and east flanks of Live Oak Canyon (fig. 5). Historically, this sedimentary succession had been classified inconsistently by previous workers. Burnham and Dutcher (1960) assigned the materials to their “older alluvium.” Dibblee (1968, 1974) assigned most of the succession to their unit Qoa and the lower part to the San Timoteo Formation. Morton (1978) applied the name “Sandstone and conglomerate” (their unit Ts). Matti and others (1992a, 2003a, b5960) correlated the succession with the upper member of the San Timoteo Formation (their unit QTsu), a precedent followed by Morton and Miller (2006). Most recently, Matti and others (2015, p. 17) presented evidence that the sedimentary succession north of San Timoteo Canyon probably is not correlated with the upper member of San Timoteo Formation as interpreted by Matti and others (1992a, 2003a, b) and Morton and Miller (2006) but instead is a younger succession that post-dates that unit and rests unconformably on it (see cross section A-A’ in fig. 7A). Based on the interpretation of Matti and others (2015), the sedimentary deposits of Live Oak Canyon underlie the low hills and mesas generally northeast of San Timoteo Canyon but do not occur southwest of the canyon, except in an area west of the Yucaipa subbasin in the hanging wall of the Live Oak Canyon fault zone (fig. 5). This study follows the stratigraphic usage of Matti and others (2015) and extends the mapped extent of the sedimentary deposits of Live Oak Canyon to the Yucaipa, Redlands, and Sunnymead quadrangles (figs. 2, 5).
Distribution and Stratigraphy
Sedimentary deposits of Live Oak Canyon crop out extensively in the western part—and south—of the Yucaipa subbasin, although in the subbasin itself the unit mainly occurs in the subsurface (figs. 5, 7A, 7C). Matti and others (2015, p. 17–20, figs. 9–12) provided a detailed description of the unit and discuss contact relations with the underlying San Timoteo Formation and overlying Quaternary surficial deposits. Important lithologic and stratigraphic features of the sedimentary deposits of Live Oak Canyon include (Matti and others, 2015):
-
• The unit consists of unconsolidated and consolidated sedimentary materials with predominantly very pale brown-colored, sandy rock and sediment. Light-gray conglomeratic and gravelly rock and sediment is the secondmost abundant material; yellow, brown, and light-gray muddy rock and sediment is minimally present.
-
• Where exposed in the northern part of its outcrop belt (fig. 5), the stratigraphic transition between sedimentary deposits of Live Oak Canyon and overlying Quaternary sedimentary units varies from place to place: south of Interstate 10, along the west wall of Live Oak Canyon, the transition interval is characterized by reddish-colored paleosols and local unconformities, and it is not easy to identify a specific contact separating sedimentary deposits of Live Oak Canyon from overlying alluvial deposits (Matti and others, 2003a, 2015, p. 1861). On the east wall of Live Oak Canyon, contact relations are equally ambiguous, and two features contribute to contact uncertainty: (1) the upper part of the sedimentary deposits of Live Oak Canyon is lithologically very similar to overlying deposits of middle Pleistocene alluvium and (2) south of the contact zone, the landscape surface of the sedimentary deposits of Live Oak Canyon unit is capped locally by a reddish paleosol that probably is correlated with paleosols on the west wall of Live Oak Canyon (Matti and others, 2015, p. 18). Traced northward to Interstate 10, reddish paleosol outcrops progressively are buried by southward-prograding middle Pleistocene alluvial deposits (Matti and others, 2003a, 2015) and are difficult to distinguish among the three features (uppermost of the sedimentary deposits of Live Oak Canyon, basal deposits of the Pleistocene alluvial deposits, and remnants of the conspicuous paleosol that caps the landscape surface east of Live Oak Canyon).
-
• Difficulties associated with outcrop exposures of the boundary interval between the sedimentary deposits of Live Oak Canyon and overlying Pleistocene alluvial deposits are exacerbated in subsurface borings, where lithologic data from cuttings are not definitive and where geophysical logs provide only indirect evidence for geologic-unit recognition (fig. 8).
-
• Pebble- and cobble-size clasts in sedimentary deposits of Live Oak Canyon consist of Mojave Desert-type rock fragments (mainly granitoid and gneissose rocks) and San Gabriel Mountains-type rock fragments (mainly high-strain foliated rocks like those in the upper plate of the Vincent thrust, conspicuous fragments of white-colored aplite and pegmatite derived from the upper-plate, and Pelona Schist derived from the lower plate of the Vincent thrust).
-
• Matti and others (2015, p. 19–20) proposed that the sedimentary deposits of Live Oak Canyon accumulated on a middle Pleistocene braidplain complex situated between the uplifted Crafton Hills (to the west) and the Yucaipa hills (to the east; fig. 5). Clast compositions indicate that the sediment was sourced from both Mojave Desert-type rocks and San Gabriel Mountains-type rocks, demonstrating that streams transporting and depositing the sediment had headwaters sourced in both crystalline-basement types. The presence of Mojave Desert-type clasts in sedimentary deposits of Live Oak Canyon indicates that long-continued dextral slip along the San Andreas fault zone eventually brought the Yucaipa subbasin to a position where Mojave Desert-type rocks could contribute to the subbasin fill. Streams sourced from the San Bernardino Mountains carrying Mojave Desert-type rocks picked up clasts of San Gabriel Mountains-type rock as they passed downstream past the Crafton Hills and Yucaipa hills landscapes, and ultimately depositing both Mojave Desert- and San Gabriel Mountains-type material in the subbasin.
-
• A magnetostratigraphic profile across the sedimentary deposits of Live Oak Canyon (Albright, 1997, 1999) captured the Brunhes-Matuyama geomagnetic field reversal which is dated at about 780 ka. Parts of the sedimentary deposits of Live Oak overlying the Brunhes-Matuyama reversal obviously are younger than 780 ka and may be as young as 500–600 ka (Matti and others, 2015, p. 20). Albright (1997, 1999) and Matti and others (2015) discussed evidence that the lower part of the sedimentary deposits of Live Oak Canyon is as old as 1.2–1.5 Ma, with Matti and others (2015) preferring an age of 1.2 Ma for the base of the formation.
-
• Contact between the sedimentary deposits of Live Oak Canyon and the San Timoteo Formation in The Badlands is obscured by young Quaternary alluvium associated with the incision of San Timoteo Canyon (fig. 7A; Matti and others, 2015). A buttressing relation is envisioned between the sedimentary deposits of Live Oak Canyon and a rising landform in The Badlands (fig. 7A) attributable to warping and uplift associated with the San Timoteo anticline (see “Folds” section). Contact between the sedimentary deposits of Live Oak Canyon and the underlying San Timoteo Formation also occurs in the hangingwall of the Cherry Valley thrust fault north of Interstate 10—although critical outcrops have been removed due to human modification of the ground (Matti and others, 2015, p. 18, fig. 12).
Summary and Geologic Significance
In this report, the sedimentary deposits of Live Oak Canyon represent a cycle of sediment accumulation in a synformal depression that developed north of The Badlands at about 1.2 Ma (fig. 7A). Matti and others (2015, p. 19) emphasized that it is unlikely that the sedimentary deposits of Live Oak Canyon climb up the northeastern limb of the San Timoteo anticline, roll over the nose of the gently plunging fold, and occur on the southwest limb of the fold. Initial accumulation of the sedimentary deposits of Live Oak Canyon probably post-dates initiation of folding of the San Timoteo anticline, but gentle structural dips in the formation northeast of San Timoteo Canyon indicate that the sedimentary deposits of Live Oak Canyon ultimately were tilted by continued growth of the San Timoteo anticline. The evolving depocenter in which sedimentary deposits of Live Oak Canyon accumulated was bounded to the south by rising landscapes of The Badlands, to the west by the uplifted Crafton Hills, to the north by the San Andreas fault zone and crystalline rocks of Mojave Desert-type, and to the east by crystalline rocks of the Yucaipa hills, against which the sedimentary deposits of Live Oak Canyon buttressed unconformably. That paleogeographic setting was the main depocenter for most sediments of the Yucaipa subbasin younger than about 1.2 Ma.
Quaternary2 Alluvial Deposits
Middle Pleistocene through Holocene sedimentary materials occur throughout the Yucaipa subbasin. Many of these deposits are thin youthful veneers that mantle stream valleys and other lowlands, but some deposits are relatively thick older fills that underlie dissected geomorphic terraces that rise above stream valleys. The latter represent former valley-filling deposits that have been abandoned and incised by younger streamflows of the modern landscape. The Quaternary alluvial deposits are unconsolidated except for thin horizons that have been consolidated due to pedogenesis and epigenetic processes, and in most cases the deposits likely lie above the water table (fig. 7). In this report, two Quaternary alluvial deposit units are classified in the Yucaipa subbasin: (1) middle and upper Pleistocene alluvial deposits that appear as continuous outcrops along the broad floor of the Yucaipa Valley and Beaumont plain, and (2), latest Quaternary alluvial deposits that are generally found along streams and incised into older geologic units.
Middle and Upper Pleistocene Alluvial Deposits
Middle and upper Pleistocene alluvial deposits range from about 500 to 15 ka, and occur throughout the Yucaipa subbasin (figs. 5, 7A, and 7C). They underlie the broad mesa-like landform of Yucaipa Valley (fig. 5) and can be observed best in the steep walls of that landform and the flanks of nearby geomorphic terraces. The Yucaipa Valley landform extends south of the Calimesa subarea and then east to the Beaumont plain, and this composite geomorphic feature once formed a continuous aggradational platform on which middle Pleistocene alluvial-fan and braidplain deposits accumulated. Since that time, the aggradational landform has been incised by streamflows of Oak Glen Creek, Yucaipa Creek, Little San Gorgonio Creek, and San Timoteo Creek (fig. 3).
Thicknesses and contact relations for middle and upper Pleistocene alluvial deposits are difficult to document, especially from lithologic and geophysical records in subsurface boreholes (fig. 8). With few exceptions, in most parts of the Yucaipa subbasin, thicknesses and contact relations between middle and upper Pleistocene alluvial deposits and adjacent units can only be inferred. On the west wall of Live Oak Canyon, middle Pleistocene alluvial deposits appear to unconformably overlie sedimentary deposits of Live Oak Canyon; the overlying materials were assigned by Matti and others (2003a) to their very old alluvial deposits unit Qvoa3. On the east wall of Live Oak Canyon, middle Pleistocene alluvial deposits Matti and others (2015) assigned to their “alluvial-fan” unit Qof2 thicken northward toward the Yucaipa hills and thin southward, where they feather out on top of a landscape surface developed on the upper surface of sedimentary deposits of Live Oak Canyon (a very old pedogenic soil locally is developed on this landscape surface, as discussed above).
The lithologic character and depositional setting of middle and upper Pleistocene alluvial deposits vary throughout the study area. Near crystalline-basement rock source areas, the deposits are gravel rich and more poorly sorted; in distal settings, the deposits are sandier and locally have fine-grained intervals of silt and clay. Depositional settings also vary. For example, alluvial-fan and braidplain deposits of the composite Yucaipa Valley landform interfinger with axial-valley deposits along Oak Glen Creek. Oldest sedimentary materials comprising the middle and upper Pleistocene alluvial deposits are capped by pedogenic-soil profiles having thick, very red argillic B horizons that probably are on the order of 300,000 to 500,000 years old (Matti and others, 2003a).
Latest Quaternary Alluvial Deposits
The youngest geologic materials in the Yucaipa subbasin are latest Pleistocene and Holocene alluvial deposits that occur along streams and in channels incised into older geologic formations (figs. 5, 8). The young alluvial deposits range in age from about 15,000 years to modern, and consist of wash deposits, alluvial-fan deposits, and axial-valley deposits (Matti and others, 2003a). Very young wash deposits occupy lowlands of the Yucaipa Valley and include active and progressively less active to abandoned materials (Matti and others, 2003a). Young deposits are sandy and gravelly deposits having minimal soil-profile development.
Faults
Faults dissect and bound the Yucaipa subbasin and contribute to its structural geometry. Most identifiable faults in and adjacent to the subbasin are Quaternary and are related to the active San Andreas and San Jacinto fault zones. Faults and other structures may inhibit groundwater flow in permeable unconsolidated sediments (such as the sedimentary deposits of Live Oak Canyon, and middle and upper Pleistocene and uppermost latest Quaternary alluvial deposits) due to the presence of fine-grained gouge material, chemical cementation of proximal sediments, and the juxtaposition of different layers across faults caused by sharp folds or vertical or horizontal displacement of sediment or rock. Other faults may permit groundwater flow because of their discontinuous nature or limited offset of hydrogeologic units. Accordingly, the past and present fault patterns of known faults and structures in the Yucaipa subbasin need to be accurately characterized in order to adequately model groundwater flow. The following sections include (1) a summary of major mapped faults and structures in the Yucaipa subbasin, (2) a brief review of evidence that previous researchers (notably Burnham and Dutcher, 1960) used to recognize and map faults, and (3) a comparison of their fault patterns and geologic histories to those determined by subsequent investigations, including this report.
San Andreas Fault Zone
The San Andreas fault zone forms the northern boundary of the Yucaipa subbasin and is the most widely recognized structural element in the area. Matti and others (1985, 1992a) recognized four strands of the fault zone in the vicinity Yucaipa subbasin: from northeast to southwest, the Mill Creek, Wilson Creek, Mission Creek, and San Bernardino strands (fig. 2). The San Bernardino strand defines the modern trace of the San Andreas fault zone in the Yucaipa subbasin and is the only San Andreas fault trace that is relevant to the subbasin. See Matti and others (1992a) and Matti and Morton (1993) for a more detailed discussion of the San Andreas fault zone and each of the four fault strands.
The San Bernardino strand of the San Andreas fault zone breaks all but the youngest surficial materials. Estimates of slip-rate of the San Bernardino strand in the Yucaipa subbasin by Harden and Matti (1989) are compatible with gradual inception of the strand by reactivation of the abandoned Mission Creek strand (illustrated in fig. 2) starting perhaps around 125,000 years before present (Matti and others, 1985, 1992a; Matti and Morton, 1993). In the vicinity of the Yucaipa subbasin the San Bernardino strand has a complicated left-stepping geometry (Harden and Matti, 1989; Matti and others, 2003a) and is characterized in the northwestern part of the subbasin by individual en echelon fault segments that have a northwesterly trend averaging about 55 degrees west of north (Matti and others, 2003a). In the northeastern part of the subbasin, the San Bernardino strand consists of fewer individual fault strands that traverse the south margin of the San Bernardino Mountains (Matti and others, 1983, 1992a).
Banning Fault
The structural role of the Banning fault with regard to the Yucaipa subbasin has been the subject of considerable and varied interpretations, and questions remain about the fault’s mapped distribution, geologic age (age of fault movement), and its effect on groundwater in and adjacent to the subbasin (see below). Therefore, this section examines in detail what is known about the Banning fault as well as questions about its hydrogeologic role.
Nomenclatural Usage and Previous Interpretation
The Banning fault has been mapped and interpreted differently in nearly every study since it was first named by Hill (1928). This is partly due to structural complexity but the interpretations demonstrate the evolving understanding of fault patterns and sequencing relations in the greater San Gorgonio Pass and Yucaipa subbasin area. Therefore, the “Banning fault” of one study may not be the same as the “Banning fault” of another study. Confusion can be minimized, however, if use of the name is specified in each study.
Matti and others (1985, 1992a, p. 19) summarized how early investigators used the name “Banning fault”:
“Vaughan (1922) first mapped faults later referred to as the Banning fault; his map shows these as unnamed faults that extend west from their juncture with the San Andreas fault in the east part of San Gorgonio Pass. It is clear from Vaughan’s text (1922, p. 399–401) that he viewed the San Andreas fault as the dominant structure in San Gorgonio Pass; he attached no particular significance to the unnamed faults that he recognized to the west. Hill (1928) reinterpreted fault relations in San Gorgonio Pass and introduced the name “Banning fault” for the fault segments that Vaughan (1922) first identified. Although Hill (1928, plate II) did not specifically designate the Banning fault on his map, he evidently applied the name to a fault he showed extending from the east part of San Gorgonio Pass west to the San Jacinto fault and beyond....”
Allen (1957) clarified many of the geologic and nomenclatural problems associated with the Banning fault, and his report has formed the basis for all later discussions of the fault. Allen (1957) recognized that the Banning fault is an important strike-slip fault having as much as 7 to 10 mi of right-lateral offset.
The hydrogeologic effects of the Banning fault in the vicinity of the Yucaipa subbasin were first evaluated by Burnham and Dutcher (1960, fig. 3), who mapped the fault west from the Calimesa area to Live Oak Canyon and beyond. Along much of this extent, Burnham and Dutcher (1960) showed the Banning fault as a dotted line, indicating that it is concealed by sedimentary deposits they assigned to their unit “Qoa.” Burnham and Dutcher (1960, p. 99–100) identified the Banning fault as a barrier to groundwater flow.
Matti and others (1985, 1992a) interpreted the Banning fault as a late Miocene, right-lateral structure whose movement history ended at about 5 Ma (see fig. 3 of Langenheim and others, 2005). These findings were used by Matti and Morton (1993) to interpret the Banning fault as an old right-lateral strike-slip fault that was a late Miocene component of the San Andreas fault zone during the period of about 10–5 Ma. The most recent map interpretation of the Banning fault is provided by Matti and others (2003a, b, 20156061). Like Burnham and Dutcher (1960), these authors showed the Banning fault as a dotted-where-concealed structure extending from the Calimesa area to Live Oak Canyon and beyond, but they showed the fault somewhat north of the trace mapped by the earlier workers based on gravity and aeromagnetic interpretations by Langenheim and others (2005).
Fault Distribution and Geologic Relations
The identified extent of the Banning fault and geologic relations of the fault in the Yucaipa subbasin are discussed below with respect to three areas: (1) the Calimesa area where the fault has been interpreted to be the southern boundary of the Yucaipa subbasin, (2) the area around Live Oak Canyon, and (3) the Smiley Heights area.
Calimesa
The westernmost known outcrops of the entirety of the Banning fault are in the hills southeast of the town of Calimesa and are mapped as a solid line where it is located accurately (figs. 4C, 5). The fault is vertical or dips steeply to the north, and forms a distinct plane separating a zone of crushed and sheared crystalline-basement rock of San Gabriel Mountains-type to the north from deformed sedimentary rock to the south. The crush zone in the crystalline-basement rocks locally is as much as 30 ft wide and forms a prominent white to greenish-white zone (Shuler, 1953, fig. 23; Burnham and Dutcher, 1960, p. 99; Matti and others, 2015). The Quaternary Fault and Fold Database (U.S. Geological Survey and California Geological Survey, 2016) indicates that the Banning fault along this bedrock reach may have been active as recently as the late Quaternary. Matti and others (2015, p. 40) questioned whether late Quaternary displacements reported by the Quaternary Fault and Fold Database are attributable to throughgoing dextral slip on the Banning fault, and instead attributed slip to local late Quaternary reactivation of the fault due to contraction within the San Gorgonio Pass fault zone.
The last-known outcrop of crystalline bedrock associated with the Banning fault occurs just southeast of the town of Calimesa in the southeast quarter of Section 13, T. 3 S., R. 5 W (Burnham and Dutcher, 1906, fig. 3, their unit pTc). This site was reoccupied by Matti and others (2015), who observed poorly exposed rock that probably is crystalline basement of San Gabriel Mountains-type. The outcrop helps constrain the position of the Banning fault, which must occur south of it. Between the town of Calimesa and Live Oak Canyon, the Banning fault is concealed by the Pleistocene sedimentary deposits of Live Oak Canyon and by middle and upper Pleistocene alluvial deposits, and the fault’s location must be inferred (Matti and others, 2003a, 201561; note: Matti and others, 2003a, assigned the sedimentary deposits of Live Oak Canyon to the upper member of the San Timoteo Formation, their unit QTstu). Matti and others (2003a, 2015)61 interpreted the alluvial deposits to be middle Pleistocene (on the order of 600–200 ka). The sedimentary deposits of Live Oak Canyon underlying the alluvial deposits probably post-date the Brunhes-Matuyama geomagnetic field reversal (780 ka) documented lower in the sedimentary deposits of Live Oak Canyon succession (Albright, 1999). These stratigraphic and structural relations are compatible with those of Burnham and Dutcher (1960, fig. 3) whose geologic map uses a dotted-where-concealed line to depict the Banning fault between the town of Calimesa and Live Oak Canyon (with one exception, discussed below). This report uses the same dotted-where-concealed convention to indicate the Banning fault between the town of Calimesa and Live Oak Canyon (fig. 5)—but in a position slightly north of that depicted by Burnham and Dutcher (1960, fig. 3; see Matti and others, 1992a, 2003a59; Langenheim and others, 2005).
The mapped extent of the Banning fault near the town of Calimesa was revisited by Bloyd (1971) as part of their investigation of groundwater in the adjacent San Gorgonio Pass area (south and east of the Yucaipa subbasin). The geologic map of Bloyd (1971, pl. 1) lacks hypsographic data, hence geologic features and wells are difficult to locate accurately, but their mapped trace of the Banning fault appears to differ only slightly from that depicted by Burnham and Dutcher (1960, fig. 3). Bloyd (1971) does not indicate how the location of the Banning fault was positioned, other than a general statement that “all fault traces postulated from ground-water data or gravity and magnetic data, or from both sources of data, are specifically indicated as hypothetical on the geologic map (pl. 1)” (Bloyd, 1971, p. D7). Bloyd (1971) does not discuss differences between their location of the Banning fault compared to that of Burnham and Dutcher (1960), but like that investigation, Bloyd (1971, pls. 1 and 2) depicts the Banning fault as dotted-where-concealed, and as queried where the existence is hypothetical (note that the hypothetical interpretation applies to the Banning fault throughout its extent between the town of Calimesa and Live Oak Canyon). Bloyd (1971, p. D23) also observed a reversal of groundwater-head differentials across the Banning fault in the mid-1900s. Bloyd (1971) did not specifically state that the Banning fault forms a boundary between their groundwater storage units (fig. 4B) and the Yucaipa subbasin, but that relation otherwise is implicit from their investigation.
Despite uncertainties associated with Bloyd’s location of the Banning fault, that location was used in a 2004 legal adjudication of the Beaumont Basin (Superior Court of the State of California, Riverside County, 2004). Exhibit A of that adjudication depicts the Beaumont storage unit (fig. 4A; labelled in Exhibit A as the “Beaumont Basin”), along with faults mapped by Burnham and Dutcher (1960) and faults mapped by Bloyd (1971; Exhibit A also references faults from Bloyd [1970], however we found no authored publication from that year, and those faults likely should have been attributed to Bloyd [1971]). Exhibit A shows how the Banning fault (Bloyd, 1971) provides a northwest boundary of the Beaumont storage unit—and implicitly a boundary between that storage unit and the Yucaipa subbasin.
Live Oak Canyon
This report interprets geologic relations of the Banning fault in the Live Oak Canyon area differently than Burnham and Dutcher (1960, fig. 3), and these differences may influence hydrogeologic interpretations for the Yucaipa subbasin and for the YVW. Directly east of Live Oak Canyon, Burnham and Dutcher (1960, fig. 3) depicted the Banning fault using a solid line that presumably represents an observed fault located accurately; on the west margin of the canyon they also denoted the fault using a short solid-line segment, although their geologic map (Burnham and Dutcher, 1960, fig. 3) is difficult to interpret at that location. Where they depicted the fault with solid lines, the fault breaks sedimentary materials that they assigned to the San Timoteo Formation (their unit QTs). However, elsewhere in the general Live Oak Canyon area, Burnham and Dutcher (1960, fig. 3) depicted the Banning fault using a dotted line, indicating that the fault is concealed by their unit QTs. The use of different line types for the Banning fault by Burnham and Dutcher (1960) within the San Timoteo Formation (their unit QTs) implies the fault both disrupts local parts of the formation and is also concealed by that same formation throughout most of the map area; this seemingly incompatible interpretation is discussed in the next paragraph. Dutcher and Fenzel (1972, fig. 3) may have been sensitive to this contradiction because their geologic map depicts the Banning fault between Live Oak Canyon and Calimesa as an approximately located dashed line traversing the San Timoteo Formation and thus breaking that unit everywhere east of Live Oak Canyon—but importantly, not directly west of the canyon.
To support their location of the dotted-where-concealed Banning fault between Live Oak Canyon and the town of Calimesa, Burnham and Dutcher (1960, p. 100) pointed to local areas of white-colored caliche (calcrete) developed in beds of their “older alluvium” (their unit Qoa). Burnham and Dutcher (1960) reasoned that “The caliche deposits…in the older alluvium…are believed by the authors to coincide with an area where, because of the barrier action of the Banning fault, groundwater evaporated near the land surface during late Pleistocene time.” Thus, even though the caliche deposits accumulated in the older alluvium, Burnham and Dutcher (1960, p. 100) attributed their origin to the dotted-where-concealed Banning fault—a structure that was presumably beneath unbroken deposits of older alluvium and San Timoteo Formation (Burnham and Dutcher, 1960, fig. 3).
Smiley Heights
Geologic relations in the Smiley Heights area northwest of Live Oak Canyon (fig. 5) have been interpreted differently in every study, both in terms of geologic structure and geologic units. Burnham and Dutcher (1960, p. 100) observed that “…the elevated areas of Redlands Heights, Smiley Heights, and the elongate frontal ridge west of Smiley Heights across San Timoteo Canyon were uplifted along the Banning fault, which was traced [to the west]…by the presence of cemented fractures, discordant dips, and aligned troughs along the southern flanks of the uplifted areas.” Directly west of Live Oak Canyon Dutcher and Fenzel (1972, pl. 3) position the Banning fault near the location of Burnham and Dutcher (1960), although in the Smiley Heights area Dutcher and Fenzel (1972, pl. 3) position the fault farther north than the earlier investigation. West of San Timoteo Canyon, Dutcher and Fenzel (1972) depart even farther from Burnham and Dutcher (1960), although they state (Burnham and Dutcher, 1972, p. 11) that “The western position of the Banning fault trace shown in figure 3 is based mostly on 1967 ground-water evidence.” Morton (1978) observed some of the fault structures in the Smiley Heights and San Timoteo Canyon areas, but they did not associate them with the Banning fault. All of the early studies classified geologic units here as the San Timoteo Formation, overlain by bodies of older alluvium. Matti and others (2003b) subsequently recognized that the stratigraphy and geologic structure of the Smiley Heights area is even more complex than recognized by Morton (1978), and they made the following determinations:
-
(1) They assigned most of the sedimentary sequence to the upper member of the San Timoteo Formation (their unit QTstu). This report assigns these sedimentary materials to the sedimentary deposits of Live Oak Canyon.
-
(2) They recognized a subparallel series of curvilinear faults having up-on-the-north displacement. These structures allow Smiley Heights to be uplifted as originally proposed by Burnham and Dutcher (1960, p. 100)—but not by the Banning fault as conceived by those authors. Instead, Matti and others (2003b) associated the new structures with their “Live Oak Canyon fault zone” (discussed below).
-
(3) They documented a pair of northwest-plunging synclinal and anticlinal folds.
Subsequently, in the geologic maps of the Yucaipa (Matti and others, 2003a) and El Casco (Matti and others, 2015) 7.5-minute quadrangles, the authors concluded that there was no evidence that any of the fault structures in the hills north of San Timoteo Canyon and west of Live Oak Canyon can be attributed to the Banning fault as proposed by Burnham and Dutcher (1960).
Banning Fault in This Report
This report adopts the conclusion by Matti and others (1992a, 2003a, b, 2015) that the Banning fault cannot be recognized in the Live Oak Canyon and Smiley Heights areas based on three lines of evidence outlined in this section. These lines of evidence are taken to mean that the Banning fault most likely is an old geologic feature (Matti and others, 1992a; Matti and Morton, 1993) whose distribution and movement history are unrelated to Quaternary geologic and landscape evolution in the vicinity of the Yucaipa subbasin. Accordingly, its structural role with regard to the hydrogeology of the subbasin may be uncertain.
First, Matti and others (2003a, 2015) were unable to document fault segments Burnham and Dutcher (1960, fig. 3) depicted with solid lines on both the east and west margins of Live Oak Canyon. Outcrops on the west margin of the canyon were examined by Matti and others (2003b), and they did not recognize a fault as portrayed there by Burnham and Dutcher (1960, fig. 3). On the east margin of Live Oak Canyon, private-property restrictions prevented further examination of faulting and calcrete occurrences previously recognized there by Burnham and Dutcher (1960). However, examination of imagery and aerial photographs coupled with reconnaissance ground observations (Matti and others, 2003a, b) did not reveal compelling evidence for a fault where one was depicted with a solid line by Burnham and Dutcher (1960).
Second, between Live Oak Canyon and the town of Calimesa, Burnham and Dutcher (1960, fig. 3) observed that some outcrops of the San Timoteo Formation (their unit QTs) were broken by their “Banning fault” while other outcrops were not. Dutcher and Fenzel (1972, fig. 3) may have been sensitive to this contradiction because between Live Oak Canyon and Calimesa their geologic map shows the Banning fault everywhere breaking the San Formation, and depicting it using an approximately located dashed line everywhere east of Live Oak Canyon—but importantly, not directly west of the Canyon. However, Matti and others (2003a) could not confirm these observations. It is possible that unit QTs of Burnham and Dutcher (1960) might have different ages in different parts of the area, thus allowing older sequences to be faulted but younger sequences to post-date movement on the Banning fault. However, stratigraphic patterns discernable on imagery and aerial photographs do not indicate such age discrepancies.
Third, Smiley Heights represents a landscape that has been uplifted relative to surrounding areas as originally proposed by Burnham and Dutcher (1960, p. 100). This landscape is underlain mainly by the Sedimentary deposits of Live Oak Canyon (described above, a name that replaces the “San Timoteo Formation” recognized in the area by all previous studies discussed in this section). Depressions and swales in the Smiley Heights landscape contain localized alluvial deposits mapped as a middle Pleistocene unit by Matti and others (2003b, their unit Qvoa3). These localized deposits clearly are related to unit Qvoa3 that caps the Smiley Heights landscape (Matti and others, 2003a, b) and represent either down-dropped remnants of that unit or younger Pleistocene alluvial deposits that accumulated in local depressions as the Smiley Heights landscape was uplifted. This kind of landscape is not recognized east of Live Oak Canyon, suggesting that structures west of the canyon are unrelated to a throughgoing Banning fault.
Live Oak Canyon Fault Zone
Matti and others (2003b) applied the name “Live Oak Canyon fault zone” to the series of arcuate faults that traverse the south margin of Smiley Heights (fig. 5). Matti and others (2003b) did not discuss their slip sense or structural role, but in this report we interpret these faults as north-dipping reverse and thrust faults whose movement has led to uplift of the Smiley Heights and Redlands Heights highland. The fault system most likely is late Quaternary because it disrupts a landscape surface estimated to be approximately 300–700 ka (surface Q3 of Kendrick and McFadden, 1996; Kendrick and others, 2002, p. 2,784). This surface caps the Sedimentary deposits of Live Oak Canyon and is comparable to paleosols reported by Matti and others (2003a) in the upper part of that unit on the east margin of Live Oak Canyon (discussed above).
Tectonic interaction between contractional structures of the Live Oak Canyon fault zone and extensional structures of the Crafton Hills fault zone (fig. 5) is not obvious. Matti and others (2003a, b) interpreted structures of the two fault zones to overlap spatially: specifically, their mapping depicts one strand of the Crafton Hills fault zone extending a short distance into the Redlands 7.5-minute quadrangle, where strands of the Live Oak Canyon fault zone also are depicted (fig. 5). In addition, along trend in the adjacent Yucaipa 7.5-minute quadrangle, Matti and others (2003a) showed only strands of the Crafton Hills fault zone, implying that the contractional Live Oak Canyon fault zone does not extend far to the northeast. However, in the southwest corner of the Yucaipa 7.5-minute quadrangle, a strand of the Live Oak Canyon fault zone dips about 35 degrees to the northwest (fig. 5; the fault was observed in a geotechnical trench). The fault clearly is a thrust fault that appears to be an extension of the Live Oak Canyon fault zone, and not a strand of the normal-slip Crafton Hills fault zone as mapped previously by Matti and others (2003a). The newly recognized change in structural style probably applies to fault strands directly northeast of the 35-degree dip depicted in figure 5. The structural character of the boundary zone between extensional and contraction fault complexes has not been resolved and is beyond the scope of this report.
Normal-Slip Faults Associated with the Yucaipa Groundwater Subbasin
A series of northeast-trending, normal-slip faults traverses and bounds the Yucaipa subbasin and is responsible for much of its topographic and structural relief (Burnham and Dutcher, 1960, p. 112, fig. 3). The normal-slip structures include (from west to east) the Redlands fault, the Reservoir Canyon fault, the Crafton Hills fault zone, the Yucaipa graben complex (including the previously named Oak Glen fault), the Chicken Hill fault, and probably the Casa Blanca fault (fig. 5). Matti and others (1985, 1992a)57 and Matti and Morton (1993) interpreted the normal faults as a zone of extensional stress created by a late Quaternary right step between the San Andreas and San Jacinto fault zones. Whether the faults were active prior to the late Quaternary is not known.
Crafton Hills Fault Zone
The name Crafton Hills fault zone (not to be confused with the “Crafton Fault” of Burnham and Dutcher, 1960) was applied by Matti and others (1985, 1992a) to faults bounding the southeastern margin of the Crafton Hills. Matti and others (1985, 1992a) interpreted the Crafton Hills bedrock uplift as a horst bordered on the west by the Redlands and Reservoir Canyon faults and downdropped San Bernardino groundwater subbasin and on the east by the Crafton Hills fault zone and downdropped Yucaipa Valley. Together with faults along the northwestern margin of the Crafton Hills, the Crafton Hills fault zone is a significant structural feature in the Yucaipa subbasin and surrounding area. As used in this report, the Crafton Hills fault zone defines the northwestern boundary of the Yucaipa subbasin (figs. 4C and 5). This interpretation departs from the interpretation by Burnham and Dutcher (1960, p. 116, fig. 3), as discussed below.
Matti and others (1985, 1992a, 2003a) mapped the Crafton Hills fault zone along the eastern margin of the bedrock Crafton Hills horst and then southwest along sedimentary materials underlying uplands in the Sand Canyon subarea (unit Qvoa3 of Matti and others, 2003a). They then continued normal-slip structures of the Crafton Hills fault zone south of Interstate 10 at the head of Live Oak Canyon. We now interpret faults south of Interstate 10 to be contractional structures associated with the Live Oak Canyon fault zone—not extensional structures of the Crafton Hills fault zone. The Western Heights subarea apparently represents a transition zone between down-to-the-east normal-slip faults (Crafton Hills fault zone) and up-on-the-west reverse-slip faults (Live Oak Canyon fault zone). Geometric and kinematic interaction between normal-slip and reverse-slip structures of the two fault zones has not been resolved and is beyond the scope of this report.
Yucaipa Graben Complex
The name “Yucaipa graben complex” was applied by Matti and others (1985, 1992a) to a series of discontinuous and locally arcuate fault scarps at the northwestern extent of the Yucaipa subbasin (fig. 5; Matti and others, 2003a). The fault scarps have variable trends, but most have downdropped blocks that face inward toward the center of the subbasin. The scarp-forming structures are interpreted as normal-slip faults, are inferred to trend southwestward toward the Chicken Hill fault (discussed in the next section), and probably are continuous with that structure (Matti and others, 2003a).
One of the fault scarps included within the Yucaipa graben complex is coincident with part of the Oak Glen fault as mapped by Burnham and Dutcher (1960) and Dutcher and Burnham (1959). Burnham and Dutcher (1960) recognized a pronounced south-facing fault scarp at the head of Yucaipa Valley, and associated the fault scarp with a groundwater barrier on the north side of the Crafton Hills and another barrier extending up Potato Canyon toward the Oak Glen subarea (fig. 5). Matti and others (2003a) recognized the west-trending fault scarps at the head of Yucaipa Valley, but rather than assigning the scarps to the Oak Glen fault, they attributed them and nearby scarps to a series of normal-slip faults forming the northern boundary of their Yucaipa graben complex (also see Matti and others, 1985, 1992a). East of the Crafton Hills, the west-trending scarp intersects two curvilinear en echelon segments that turn abruptly south and splay into three scarps that form the west boundary of the Yucaipa graben complex (Matti and others, 1992b, 2003a).
A through going Oak Glen fault as envisioned by Burnham and Dutcher (1960) and Dutcher and Burnham (1959) is not recognized in this report. Instead, the structural interpretation Matti and others (1992b, 2003a59) is used, whereby the Oak Glen fault is confined to the Yucaipa subbasin and should be viewed as part of the Yucaipa graben complex (fig. 5).
Chicken Hill Fault
As originally recognized by Burnham and Dutcher (1960, p. 117, fig. 3), the Chicken Hill fault extended from Interstate 10 (at that time, U.S. Highway 99) north and northwest to the Crafton Hills. For the south part of the Chicken Hill fault, this report follows the original usage of Burnham and Dutcher (1960). For the north part, this report follows Matti and others (1992a, 2003a) who projected a dotted-where-concealed trace of the fault northeast from the Western Heights subarea, along the northwestern margin of the Yucaipa Valley landform. In this configuration, the Chicken Hill fault forms the east margin of the extensional Yucaipa graben complex.
Along its southern extent, all previous studies agree on the geologic setting and structural role of the Chicken Hill fault. For about 1.5 mi north of Interstate 10, the fault separates the high-standing Yucaipa Valley landform from the lower-standing floodplain of Oak Glen Creek (fig. 5). The fault’s extent south of Interstate 10 is not known, but Matti and others (2003a) project its concealed trace for a short distance down Live Oak Canyon. There, structural interaction between the extensional Chicken Hill fault and the contractional Live Oak Canyon fault zone has not been documented.
About 1.5 mi north of Interstate 10, Burnham and Dutcher (1960, fig. 3) showed the Chicken Hill fault diverging northeastward from the Yucaipa Valley landform, crossing the floodplain of Oak Glen Creek, and joining faults along the east margin of the Crafton Hills uplift. This scenario requires that displacement along the Chicken Hill fault changes from down-to-the-west along its southern extent to down-to-the-east along faults bounding the northeastern Crafton Hills (fault scarps bounding the Crafton Hills all have down-thrown blocks on the east—not the west). Such reversal of slip sense is possible; faults having slip reversal along strike (“scissors faults”) are reported in the geologic literature. However, Matti and others (2003a, p. 27–28) presented arguments that the trend of the Chicken Hill fault remains on the east side of the Oak Glen Creek floodplain and ultimately connects with normal-slip faults of the Yucaipa graben complex at the northwest head of the valley. By this interpretation, the Chicken Hill fault can maintain its down-on-the-west geometry along its entire length, and this interpretation is used in this report (fig. 5).
Redlands and Reservoir Canyon Faults
The Redlands fault was mapped by Dutcher and Burnham (1959, pl. 1) and by Burnham and Dutcher (1960, p. 115–116, fig. 3). The fault forms a down-to-the-west scarp that trends northeast from the Redlands area (Matti and others, 2003a, b). The fault is likely a normal-slip structure, but this slip style has not been documented.
The name “Reservoir Canyon fault” was applied by Morton (1978) to the structure Burnham and Dutcher (1960, p. 113–114, fig. 3) mapped as the "Crafton fault", a precedent followed by Matti and others (2003a, b). This conflicting fault nomenclature can lead to ambiguities in the literature. The fault forms a down-to-the-west scarp that trends northeast from the Redlands area to the western edge of the uplifted crystalline-basement rocks and thence along the west margin of the Crafton Hills (Burnham and Dutcher, 1960, fig. 3). This report follows the naming convention of Morton (1978) and Matti and others (2003a, b).
Casa Blanca Fault
The Casa Blanca fault is a northeast trending fault that Moreland (1970) identified as a barrier to groundwater flow. Moreland (1970) suggested that the fault probably had down-to-the-west displacement and probably splintered on its north end with a branch passing on both sides of a particular well. The mapped distribution of the fault was based on observed disparities in groundwater levels between two wells (Moreland, 1970). The inferred location of the Casa Blanca fault is included in the Quaternary Fault and Fold Database of the United States (U.S. Geological Survey and California Geological Survey, 2016; fig. 5); in that database, the fault has unspecified dip direction, slip rate, and slip sense, is estimated to be younger than 1.6 Ma, and is listed as part of the Crafton Hills fault zone. Surface expression of the fault is not identifiable in middle and upper Pleistocene deposits (Matti and others, 2003a), indicating that the fault could have been inactive prior to the deposition of these materials.
South Mesa Barrier
The South Mesa barrier is a westerly-northwesterly trending structure that was identified as a barrier to groundwater flow by Moreland (1970; fig. 5), who suggested that the structure was probably associated with the San Andreas fault zone and Banning fault and had down-to-the-south displacement. The mapped distribution of the structure was based on observed disparities in groundwater levels between several wells, geophysical data, and alignment with a mapped fault trace east of the area of investigation (Moreland, 1970). The structure is not included in Quaternary Fault and Fold Database of the United States (U.S. Geological Survey and California Geological Survey, 2016), and surface expression of the structure is not identifiable (Moreland, 1970; Matti and others, 2003a), indicating that movement on the structure had ended prior to the deposition of Quaternary materials.
San Gorgonio Pass Fault Zone and Cherry Valley Thrust Fault
The San Gorgonio Pass fault zone is a series of Quaternary reverse, thrust, and tear faults that extends from the eastern portal of San Gorgonio Pass (east of Cabazon, fig. 2) westward to the town of Calimesa (figs. 2, 5). Regionally, the fault zone has a distinctive zigzag character in which the elongate, northwestward segments appear to be high-angle tear faults having oblique right-lateral displacements and in which the shorter eastward-northeastward segments are thrust and reverse faults (fig. 2). The northwest-oriented segments have approximately the same orientation as right-lateral fault strands of the San Andreas fault zone (Matti and others, 1992a).
In the Yucaipa subbasin, the San Gorgonio Pass fault zone is represented by the Cherry Valley thrust fault of Bloyd (1971), a north-dipping thrust that appears to be the westernmost part of the zone of crustal convergence that is the San Gorgonio Pass fault zone (Matti and others, 2015). The age and duration of faulting of the Cherry Valley thrust fault are not documented, but contraction probably developed in the Pleistocene and continued intermittently for much of Quaternary time (Matti and others, 2015). East of the town of Calimesa, the Cherry Valley thrust fault carries folded strata of the San Timoteo Formation in the hangingwall south over younger sedimentary materials of the footwall. Traced westward across Interstate 10, the fault forms a scarp within the sedimentary deposits of Live Oak Canyon and locally places these rocks over middle Pleistocene alluvial deposits (unit Qof2 of Matti and others, 2015). Trench exposures show that the fault dips north about 15 degrees along the eastern segment (CHJ, Inc, 2004; Matti and others, 2015), and between 11 and 45 degrees along the western segment (Rasmussen and Associates, 1988a, b; Petra Consultants, 2004; Matti and others, 2015). The geometry of the Cherry Valley thrust fault at depth is uncertain; the fault could steepen northward and root into the Banning fault, or the fault could retain its shallow north dip beyond, and truncate, the Banning fault (Matti and others, 2015).
The Cherry Valley fault scarp is directly along trend with caliche zones (calcrete) that Burnham and Dutcher (1960, p. 100) originally associated with the Banning fault. Matti and others (2015) did not recognize the scarp west of where they depict it on their geologic map, but fracturing and pulverization of sedimentary material in the sedimentary deposits of Live Oak Canyon might have continued for an unknown distance beyond the westernmost scarp segment. If so, then displacement on the Cherry Valley thrust fault could be responsible for the carbonate accumulation observed by Burnham and Dutcher (1960) that they attributed to the Banning fault. Moreover, as a youthful fault that breaks not only sedimentary deposits of Live Oak Canyon but also middle and upper Pleistocene alluvial deposits, the Cherry Valley thrust fault south of the town of Calimesa may well account for local differences in groundwater levels that originally led Burnham and Dutcher (1960) and Bloyd (1971) to position the Banning fault and cite that structure as a barrier to groundwater flow.
Folds
A major northwest-trending anticlinal fold extends along much of The Badlands (fig. 5). This asymmetric fold, the San Timoteo anticline, plunges gently to the northwest. Sedimentary units in the southwestern limb of the San Timoteo anticline dip steeply toward the San Jacinto Valley, while sedimentary units in the northeastern limb dip shallowly toward the Yucaipa subbasin. Kendrick and others (2002) proposed that the fold originated as dextral slip on the San Jacinto fault and displaced the sedimentary sequence in The Badlands around an evolving left step in the fault southwest of the Yucaipa subbasin. Initiation of folding of the San Timoteo anticline likely coincides with the inception of the San Jacinto fault around 1.2 Ma (Matti and others, 2015) and likely terminated some time prior to 100 ka (Kendrick and others, 2002).
Hydrogeologic Framework Model
To develop the necessary hydrogeologic understanding from the mapped geology, a 3D HFM of the Yucaipa subbasin and the encompassing YVW was developed using geologic, geophysical, and hydrologic data. The HFM is a digital representation of thickness and extent of four hydrogeologic units (described below), and the structural geometry of hydrogeologically important faults and folds as interpreted from the input data and conceptual understanding of the geology. The HFM was constructed using EarthVision, a 3D geologic-modeling software package (Dynamic Graphics, Inc., 2015) and Esri ArcGIS version 10.7.1 GIS software. The HFM is archived in a USGS ScienceBase data release (Cromwell and others, 2022b).
Four hydrogeologic units were classified in the Yucaipa subbasin. The four units (from bottom to top) are (1) crystalline basement, which is composed of Mesozoic crystalline rocks and undifferentiated Tertiary sedimentary rocks of the San Andreas fault zone, (2) consolidated sedimentary materials, which comprises deep subsurface sedimentary rocks and the San Timoteo Formation, (3) unconsolidated sediment, which comprises the sedimentary deposits of Live Oak Canyon and parts of the middle and upper Pleistocene alluvial deposits, and (4) surficial materials, which comprises parts of the middle and upper Pleistocene alluvial deposits and latest Quaternary alluvial deposits. The consolidated sedimentary materials, unconsolidated sediment, and surficial materials units comprise the sedimentary basin-fill aquifer system and are underlain by the basal crystalline basement unit. The basin-fill hydrogeologic units vary in thickness and extent across the subbasin. The character and modeled extent of the hydrogeologic units are described in the following sections.
Geologic maps, borehole geophysical logs, drillers’ lithology logs, and depth-to-basement gravity data were used to map and define the extent of the three basin-fill units, and gravity-derived depth-to-basement models were used to estimate the geometry and depth of the crystalline basement unit. The resulting HFM is consistent with existing geologic concepts and the tectonic and structural history of the area. Several faults dissect the Yucaipa subbasin, causing structural relief between and within the sediment-filled basin and surrounding mountains and highlands; many of these faults have been previously identified as potential barriers to groundwater flow (Burnham and Dutcher, 1960; Moreland, 1970).
Hydrogeologic Units
Geologic units recognizable at land surface cannot routinely be distinguished from one another in the subsurface using drillers’ lithology logs and (or) borehole geophysical measurements. Moreover, subsurface stratigraphic intervals, where multiple geologic units are more likely to be present, can have hydraulic characteristics that are uniform throughout and not distinguishable based on geologic unit designations. Therefore, some geologic unit designations, differentiated and classified at the land surface on the basis of distinctive lithologic and stratigraphic features, are not relevant for a hydrogeologic analysis of the aquifer system including an analysis as groundwater flow. For this reason, a smaller set of hydrogeologic units appropriate for aquifer system analysis were classified from the recongizable geologic units in the Yucaipa subbasin. The geologic units (fig. 5) were classified into four hydrogeologic units (table 1; fig. 9) that represent the aquifer system. Summary hydrogeologic properties of each unit are described below.
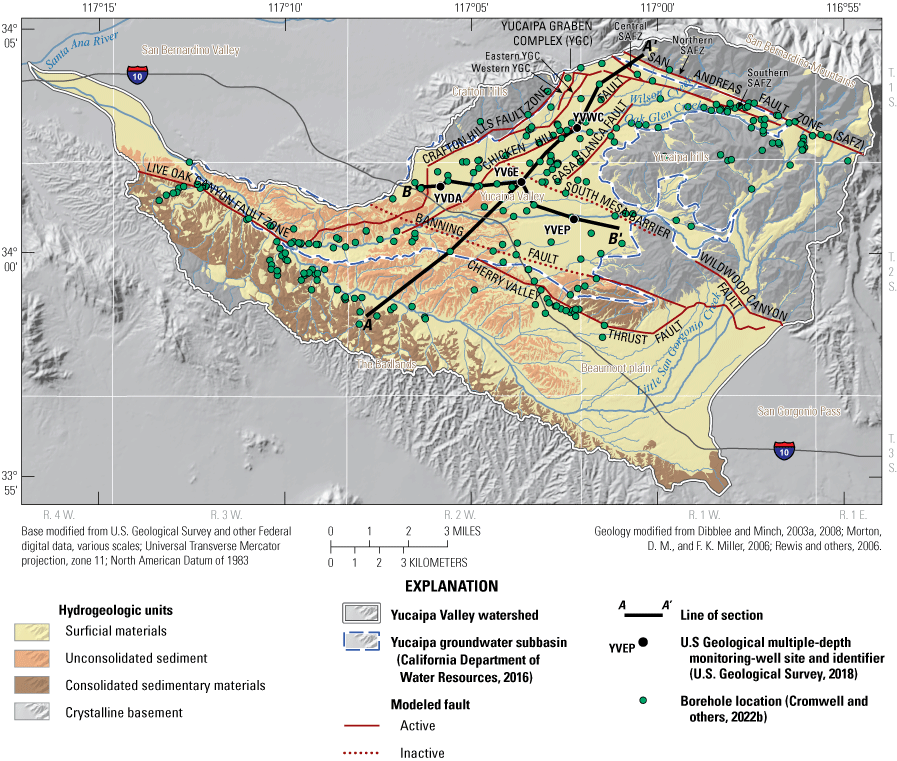
Hydrogeologic units and model faults used in the three-dimensional hydrogeologic framework model of the Yucaipa Valley watershed, San Bernardino and Riverside Counties, California. See table 3 for information on model faults.
Crystalline Basement
Crystalline basement forms the bottom boundary of the subbasin in which basin-fill aquifer materials are deposited (table 1; figs. 7, 9). The crystalline basement does not hold large volumes of groundwater; however, small-scale fractures, joints, and faults that are open and permeable provide conduits for transmitting precipitation and runoff into the crystalline subsurface and then laterally into sedimentary materials of the Yucaipa subbasin. Outcrops of crystalline basement in the Crafton Hills, San Bernardino Mountains, and Yucaipa hills (fig. 9) are cohesive blocks in many places but also include substantial regions of cataclastic, sheared, fractured, and broken rock (Matti and others, 2003a, 201561) that have potential to act as conduits for groundwater recharge and pathways for groundwater flow in the subsurface.
A zone of weathered saprolitic basement material is evident above the crystalline basement surface at depth and in outcrop (figs. 7, 8A, 8B; described in the “Interpretation of Crystalline Basement” section below). This 60–100 ft thick weathered saprolite zone is consistent with modern saprolite zones in temperate climates (Sequeira Braga and others, 2002; Dixon and others, 2009) and is observed in select USGS multiple-depth monitoring-well sites in the Yucaipa subbasin; however, the full geographic extent of this zone is unknown. A fairly continuous zone of weathered saprolitic basement material may be present above crystalline basement throughout the study area. In addition, this weathered saprolite zone may act as a conduit to flow or be a local source of groundwater storage. Uncertainty in the location, thickness, and spatial distribution of the weathered saprolite zone led to its exclusion from the HFM.
Consolidated Sedimentary Materials
The consolidated sedimentary materials unit comprises the deep subsurface sedimentary rocks south of the Banning fault and, if present, the Western Heights subarea, and the San Timoteo Formation (figs. 7, 9; table 1). The consolidated sedimentary materials unit crops out in the southwest part of the Yucaipa subbasin, mainly in the The Badlands where the San Timoteo Formation is present at land surface (figs. 5, 9; Morton and Matti, 2001; Matti and others, 2003b; Matti and others, 2015). The only other surface exposure of the consolidated sedimentary materials is on the hangingwall of the Cherry Valley thrust fault (fig. 9).
The parts of the consolidated sedimentary materials that represent the middle member of the San Timoteo Formation are in the southern half of the exposed San Timoteo Formation in the Yucaipa subbasin and generally consists of light-gray, sheetlike layers of pebble-cobble conglomerate, with medium to thick intervals of gray-brown fine- to coarse-grained sandstone and minor amounts of siltstone and mudstone intervals (figs. 5, 9; Frick, 1921; Matti and others, 2015). The parts of the consolidated sedimentary materials that represent the upper member of the San Timoteo Formation are in the northern half of the exposed San Timoteo Formation in the Yucaipa subbasin to the south and west of San Timoteo Canyon and the Live Oak Canyon fault zone and have a relatively consistent lithology of “gray, coarse grained, moderately indurated sandstone and conglomerate” (figs. 5, 9; Frick, 1921; Morton and Matti, 2001).
Consolidated sedimentary materials are more compacted, consolidated, cemented, and have a greater abundance of clay and silt relative to the overlying unconsolidated sediment and surficial materials. The consolidated sedimentary materials are likely the least transmissive basin-fill hydrogeologic unit in the study area; Dutcher and Fenzel (1972) calculated a permeability of about 5 gallons per day per square foot (gpd/ft2) in what they identify as the lower member of the San Timoteo Formation, which corresponds to the consolidated sedimentary materials hydrogeologic unit classified in this study. Similarly, Rewis and others (2006) designated the San Timoteo Formation as impermeable and inactive in their groundwater-flow model of the Beaumont plain area.
Unconsolidated Sediment
The unconsolidated sediment unit comprises the sedimentary deposits of Live Oak Canyon unit and likely parts of the middle and upper Pleistocene alluvial deposits (figs. 7, 8, 9; table 1). The unconsolidated sediment unit crops out north of the The Badlands where the sedimentary deposits of Live Oak Canyon are present at land surface (fig. 9). This unit is exposed along the walls of San Timoteo Canyon. In the subsurface, the unconsolidated sedimentary unit may be distinguished, in part, from the overlying unconsolidated surficial materials by reddish paleosol beds and local unconformities that are are found at the contact between the sedimentary deposits of Live Oak Canyon and the middle Pleistocene alluvial deposits (Matti and others, 2003a, 201561).
The unconsolidated sediment unit is the primary aquifer unit in the Yucaipa subbasin. The unit consists of unconsolidated materials (although the unit includes parts of the sedimentary deposits of Live Oak Canyon that are consolidated) and is dominated by outcrops of sand- and gravel-bearing deposits, with fewer outcrops of mud-bearing deposits. The unit is the most extensive and voluminous sedimentary unit in the subbasin, and the water table sits almost exclusively within it (about 200 to more than –300 ft below land surface; figs. 7B, 7D; Cromwell and others, 2022a). The unconsolidated sediment unit is substantially more coarse grained (sand, gravelly sand, and gravel) than fine grained (silt, mud, and clay), indicating likelihood of high permeability and capacity for groundwater flow and storage. Dutcher and Fenzel (1972) calculated a permeability of about 220 gpd/ft2, in what they identified as the upper San Timoteo Formation, now defined as sedimentary deposits of Live Oak Canyon, which are part of the unconsolidated sediment unit.
Surficial Materials
The surficial materials unit consists of latest Quaternary alluvial deposits and likely parts of the middle and upper Pleistocene alluvial deposits (figs. 5, 7, 8 and 9; table 1). The unit appears as continuous outcrops along the broad valley floor and in eroded stream channels incised into the crystalline bedrock and older hydrogeologic units (figs. 5, 9). The surficial materials unit is comprised mostly of alluvial-fan or alluvial axial-valley deposits, with local outcrops of landslide, wash, and colluvial materials. Alluvial-fan sediments are coarser grained, gravel rich, and more poorly sorted than the axial-valley sediments; axial-valley sediments typically have more fine-grained layers of silt and clay interbedded with sand and gravel beds (Matti and others, 2003a). This unit is relatively thin and is about 30–160 ft thick in most of the Yucaipa subbasin.
The surficial materials unit is often entirely above the water table (about 200–300 ft below land surface; figs. 7B, 7D; Cromwell and others, 2022a); therefore, this unit likely does not play a substantial role in groundwater storage, but the coarse-grained materials likely to allow water added to the hydrologic system to promote rapid recharge groundwater in the basin. Dutcher and Fenzel (1972) calculated a permeability of about 40 gpd/ft2 in materials that correspond, at least in part, with the surficial materials unit.
Framework Model Development
This section describes the data interpretation, construction, results, and implications of the HFM developed as part of this study. The HFM uses geologic, geophysical, and hydrologic data information from a variety of sources to produce a digital representation of the interpreted thickness and extent of hydrogeologic units and the geometry of folds and faults within the model extent. The HFM extent includes the Yucaipa subbasin and the surrounding YVW (fig. 9).
Construction of the HFM involved interpolating the hydrogeologic units from their exposures at land surface to their subsurface contacts with underlying hydrogeologic units. Surficial data from geologic mapping studies (Morton and Matti, 2001; Dibblee and Minch, 2003a; Matti and others, 2003a, b, 2015; Morton and Miller, 2006; Rewis and others, 2006; Dibblee and Minch, 2008) and structural faults and barriers (Moreland, 1970; Matti and others, 2003a, b, 20156061; Nicholson and others, 2013, 2014; U.S. Geological Survey and California Geological Survey, 2016) delineated the exposed extent of the units and their potential geometry at depth. The overall depth of the basin was interpolated from gravity-derived depth-to-basement studies (Anderson and others, 2004; Langenheim and others, 2005; Mendez and others, 2016; figs 6, 7). Drillers’ lithology logs and borehole geophysical measurements were used to interpolate and constrain the subsurface extent of the hydrogeologic units. These data were combined to create the input data of the HFM.
Data Sources
Surface and subsurface hydrogeologic data were used to quantify the subsurface extent of each hydrogeologic unit and evaluate the within-unit distribution of different lithology classes. Surface hydrogeology (fig. 9) was compiled from digital versions of geologic maps (Dibblee and Minch, 2003a, 200820; Morton and Miller, 2006; Rewis and others, 2006; fig. 5) and supported by additional geologic mapping investigations (Morton and Matti, 2001; Matti and others, 2003a, b, 20156061). The interpolated surface of the top of crystalline basement is derived from gravity-derived depth-to-basement studies of the Yucaipa subbasin area (Anderson and others 2004; Langenheim and others, 2005; Mendez and others, 2016; fig. 6).
Drillers’ lithology log descriptions and borehole geophysical measurements were the primary data used to evaluate subsurface geology; these data were acquired from a variety of sources, including DWR (https://water.ca.gov/Programs/Groundwater-Management/Wells/Well-Completion-Reports), the USGS National Water Information System (U.S. Geological Survey, 2018), a USGS report (Mendez and others, 2018), and a consultant report (Geoscience Support Services, Inc., 2014a). In total, lithology and geophysical logs from 272 boreholes were compiled within the study area (fig. 9). Four multiple-depth monitoring-well sites were previously drilled and constructed by the USGS (YVWC, YVDA, YV6E, and YVEP; figs. 8, 9; table 2). These well sites provide detailed lithology descriptions, continuous geophysical measurement data, drill cuttings and cores, and groundwater information at discrete depths from nested piezometers, and are some of the deepest boreholes in the study area (Mendez and others, 2018). Drillers’ lithology descriptions for all boreholes used in this study were standardized to a common set of textural classes and are available as part of a USGS ScienceBase data release (Cromwell and others, 2022b).
Table 2.
Well identifiers and construction information for U.S. Geological Survey multiple-well monitoring sites in the Yucaipa groundwater subbasin (Mendez and others, 2018), Yucaipa Valley watershed, San Bernardino and Riverside Counties, California.[USGS, U.S. Geological Survey; NAVD 88, elevation above North American Vertical Datum of 1988]
The HFM incorporates faults that have structural and (or) hydrologic importance (table 3; fig. 9). Spatial data for the model faults were compiled from three sources: (1) the surface (two-dimensional) distribution of faults from the Quaternary Fault and Fold Database of the United States (U.S. Geological Survey and California Geological Survey, 2016); (2) the surface and subsurface (three-dimensional) geometry of faults from the Southern California Earthquake Center’s Community Fault Model version 4.0 (v4.0; Nicholson and others, 2013) and version 5.0 (v5.0; Nicholson and others, 2014; see also https://www.scec.org/research/cfm); and (3) surface (two-dimensional) spatial data from the geologic maps of Matti and others (2003a, b, 20156061). Although the geologic map databases for the Yucaipa, Redlands, and El Casco 7.5-minute quadrangles (Matti and others, 2003a, b, 20156061) contain attributed geospatial data for many faults in the Yucaipa subbasin, these sources do not cover the entire extent of the subbasin nor do they consistently have fault-dip information. For these reasons, fault information for the HFM was compiled primarily from the Quaternary Fault and Fold Database of the United States and the Community Fault Model v4.0 and v5.0. These databases provide seamless geospatial coverage for faults in the Yucaipa subbasin, and the Community Fault Model especially models the subsurface geometry of faults in the subbasin.
In order to simplify structural features for the HFM, model faults were selected and (or) modified from the source datasets to best represent the predominant orientation and character of each mapped fault; fault zones having more than one individual trace (for example, discontinuous en echelen fault strands) are portrayed as continuous line features. The HFM represents some mapped faults and faults zones using a single model fault but others using two or three model faults. Single model faults include the Casa Blanca, Cherry Valley thrust, and Chicken Hill faults, the Crafton Hills and Live Oak Canyon fault zones, and the South Mesa barrier (table 3; figs. 5, 9). These model faults are derived from the digital datasets listed in table 3. Southeast of the Yucaipa subbasin the HFM incorporates another single-model fault, which is labeled as “Wildwood Canyon fault” (after Matti and others, 1992a) in table 3 and figure 9; the Quaternary Fault and Fold Database of the United States (U.S. Geological Survey and California Geological Survey, 2016) identifies this fault as part of the San Gorgonio Pass fault zone.
The Banning fault occurs in the southern and southeastern parts of the Yucaipa subbasin, and in the HFM is represented by “active” and “inactive” segments of a singular model-fault feature (table 3; fig. 9). The “inactive” segment applies to the Miocene Banning fault as mapped by Matti and others (1992a, 2003a, b, 2015)596061. The “active” segment applies to a segment southeast of the town of Calimesa that Matti and others (2015) referred to as the Miocene Banning fault that possibly was reactivated in Quaternary time (discussed above in the “Faults” section). The Quaternary Fault and Fold Database of the United States (U.S. Geological Survey and California Geological Survey, 2016) refers to this fault as the Banning fault while the Community Fault Model v4.0 (Nicholson and others, 2013) does not recognize this structure.
In the HFM the Yucaipa graben complex is narrower in geographic and geologic scope than indicated in the geology section of this report. Geologically, the graben complex is defined on the east by the Chicken Hill fault and by multiple north-trending subparallel fault scarps in the east of the Crafton Hills (Matti and others, 2003a; fig. 5). The HFM emphasizes two of the latter as singular model faults that are labelled as “western” and “eastern” faults of the Yucaipa graben complex (table 3; fig. 9).
In the HFM the San Andreas fault zone is represented by three model faults, labeled as “northern”, “central”, and “southern” San Andreas model faults (table 3; fig. 9). Fault usage between available sources is variable: (1) Matti and others (1992a, 2003a)59 applied individual fault-strand names to various San Andreas traces, including the Mission Creek and Mill Creek strands and the San Bernardino strand for the modern neotectonic trace (fig. 2); (2) the Quaternary Fault and Fold Database of the United States assigns these strands to their “San Andreas fault zone, San Bernardino Mountains section”; and (3) the Community Fault Model v4.0 applies the names “San Andreas fault”, “Mission Creek fault”, and “Mill Creek fault” to faults in this area, but somewhat differently than Matti and others (1992a, 2003a)59.
In the HFM, the northern model fault of the San Andreas zone coincides with the San Bernardino strand as mapped by Matti and others (1992a, 2003a59; figs. 2, 9), although its surface distribution and subsurface geometry are from the Community Fault Model v4.0 (Nicholson and others, 2013). The Community Fault Model v4.0 also is the source for the surface and subsurface extent of the central San Andreas model fault (fig. 9). The southern model fault is derived from geospatial information from the Quaternary Fault and Fold database of the United States (U.S. Geological Survey and California Geological Survey, 2016). The central model fault cuts southeast across the Yucaipa subbasin in the Triple Falls Creek subarea (fig. 4C) where it then trends southeast along the trace of the southern San Andreas model fault (fig. 9).
The central and southern San Andreas model faults differ from how Matti and others (1992a, 2003b)60 interpret structural relations in this part of the Yucaipa subbasin. This difference centers on the Oak Glen fault as originally named and mapped by Burnham and Dutcher (1960; also see Dutcher and Burnham, 1959). These studies recognized an east-trending fault scarp at the north end of Yucaipa Valley that they interpreted as a western segment of their Oak Glen fault (see “Faults” section), although they did not interpret the subsurface geometry or slip style for the Oak Glen fault. Matti and others (2003a) mapped curving en echelen faults at the north end of Yucaipa Valley, and interpreted these structures as bounding the north margin of their extensional Yucaipa graben complex (see above “Faults” section; note, Matti and others [1992a] originally included these faults within their “Crafton Hills horst-and-graben complex”). Subsequently, the Quaternary Fault and Fold Database of the United States (U.S. Geological Survey and California Geological Survey, 2016) and the Community Fault Model v4.0 (Nicholson and others, 2013) reinterpreted fault-distribution patterns and fault nomenclature at the northern head of Yucaipa Valley: the Quaternary Fault and Fold Database of the United States assigned the name “San Andreas fault zone, San Bernardino Mountains section” to the scarps mapped by Matti and others (1992a, 2003a59; see Harden and Matti, 1989, fig. 2); the Community Fault Model v4.0 does not incorporate faults mapped by Matti and others (2003a; Harden and Matti, 1989, fig. 2), but assigns the name “San Andreas fault” to a fault in this area having a broadly similar orientation and distribution. Owing to these interpretive differences—and especially owing to the need for a seamless tectonic framework—the central and southern San Andreas model fault in the HFM uses the geospatial distribution of the “San Andreas fault” reported by the Community Fault Model v4.0, and a trace of the “San Andreas fault zone, San Bernardino Mountains section” as reported by the Quaternary Fault and Fold Database of the United States.
Table 3.
Fault name, sources, dip angle, and dip azimuth information for digital faults included in the three-dimensional hydrogeologic framework model, Yucaipa groundwater subbasin, Yucaipa Valley watershed, San Bernardino and Riverside Counties, California.[—, not applicable]
Interpretation of Crystalline Basement
Crystalline basement was interpolated from gravity-derived depth-to-basement studies of the region surrounding the Yucaipa subbasin (Anderson and others 2004; Rewis and others, 2006; Mendez and others, 2016). Figure 6 shows the depth to the crystalline basement unit from the HFM and the extent of the input data incorporated from each of the three gravity-derived depth-to-basement studies. Figure 7 shows two sections, A-A’ and B-B’, through the Yucaipa subbasin, with figures 7A and 7C showing the interpolated crystalline basement surface underlying a conceptualization of the geology, and figure 7B and 7D showing the interpolated crystalline basement surface underlying the interpolated hydrogeologic units from the HFM. The previously published depth-to-basement studies estimated depth-to-basement over different, but overlapping, geographic extents using gravity, aeromagnetic, and seismic geophysical methods. The study area of Mendez and others (2016) covers most of the Yucaipa subbasin (fig. 6). The study areas of Anderson and others (2004) and Langenheim and others (2005) focused on the San Bernardino valley to the west, and the San Gorgonio Pass area to the east of the subbasin, respectively, and each study included parts of the Yucaipa subbasin and the surrounding YVW. Digital depth-to-basement point data were compiled from Mendez and others (2016) and Langenheim and others (2005) at resolutions of about 164 and 1,640 ft, respectively. Depth-to-basement contours were digitized from Anderson and others (2004) and converted to point data along the resulting contours. The combined depth-to-basement point data and surface data from geologic maps were interpolated using EarthVision, a 3D geologic-modeling software package (Dynamic Graphics, Inc., 2015), that uses a biharmonic cubic-spline algorithm that utilizes a minimum-tension (minimum curvature) gridding technique designed to generate horizon grids from 3D point data (Dynamic Graphics, Inc., 2015). The result of this interpolation is a continuous estimate of the top of crystalline basement at a resolution of about 492 ft (fig. 6).
Crystalline basement is exposed at land surface in the Crafton Hills, the Yucaipa hills, and the San Bernardino Mountains and varies in elevation from more than 3,000 ft above NAVD 88 to more than 8,700 ft above NAVD 88. Within the Yucaipa subbasin, crystalline basement forms a shallow depression, the orientation of which generally parallels that of the northeast-trending faults that transect the subbasin. In the Yucaipa subbasin, the crystalline basement unit is deepest in the Western Heights subarea between the Chicken Hill fault, the Live Oak Canyon fault zone, and Crafton Hills fault zone at about 4,000 ft below land surface (figs. 6, 7). At the southern margin of the Yucaipa subbasin and south of the Banning fault, crystalline basement forms a deep trough greater than 8,000 ft below land surface (figs. 6, 7). West of the Yucaipa subbasin and at the western end of the YVW, crystalline basement reaches depths between about 3,000 and 6,000 ft below land surface and underlies the adjoining San Bernardino groundwater subbasin.
Gravity-derived estimates of the depth-to-crystalline basement are complex and demonstrate the density contrast between the dense basement rocks and the less dense basin-fill materials. In the Yucaipa subbasin, the gravity-derived depth-to-crystalline basement included constraints at points where the depth-to-crystalline basement was estimated from direct observations in 15 boreholes, including USGS multiple-depth monitoring-well sites YV6E and YVEP (Mendez and others, 2016). The estimated depth-to-basement in these two well sites (900 and 800 ft below land surface, respectively; figs. 8A, 8B, “Geologic unit” columns) were derived from drillers’ lithology descriptions and geophysical logs and verified by cores from the bottom of each site (Mendez and others, 2016).
The depth of the gravity-derived crystalline basement surface at well sites YV6E and YVEP was 13 and 68 ft lower, respectively, than what was estimated from borehole data; in fact, the gravity-derived surface at YVEP was modeled to be 15 ft below the bottom of the borehole. The difference between the modeled surface and estimates from the borehole data could be due to the presence of weathered basement material that can be difficult to distinguish from overlying semi-consolidated alluvium (Mendez and others, 2016). The interpolated elevation of the crystalline basement surface in the HFM is lower than the gravity-derived surface of Mendez and others (2016) at well sites YV6E and YVEP (fig. 7) despite using the gravity-derived surface points from that study as an input dataset. The reason for this discrepancy is that the HFM surface was interpolated over a grid spacing that was three times coarser than the gravity-derived surface of Mendez and others (2016); therefore, the crystalline basement surface in the HFM is an approximation of the gravity-derived surface of Mendez and others (2016).
The borehole data for USGS multiple-depth monitoring-well sites YV6E and YVEP were analyzed for the presence of weathered basement material, or saprolite, as part of this study. The presence of weathered basement material in YV6E and YVEP can be inferred from the offset of the gravity-derived crystalline basement surface and the estimated depth-to-basement from borehole data by Mendez and others (2016) and from the lithologic descriptions and geophysical log data (figs. 8A, 8B). For example, Mendez and others (2018) noted the presence of mafic-rich material near the bottom of YVEP (840–850 ft below land surface), that was thought to be weathered mafic bedrock. The interpreted top of weathered basement material is depicted in the “Geologic unit” column for well sites YV6E and YVEP in figures 8A and 8B, and as dashed gray lines in figure 7, as is borehole-estimated top of crystalline basement from Mendez and others (2016). The gravity-derived crystalline basement surface depths at YV6E and YVEP (913 and 868 ft below land surface, respectively; Mendez and others, 2016) are not shown in figure 8.
Lithologic descriptions, geophysical logs, and drill cores (figs. 8A, 8B; Mendez and others, 2016, 2018) for YV6E and YVEP showed regular, alternating coarse gravel (including large cobbles and boulders) with clay- and sand-rich intervals that likely indicate cohesive boulders of crystalline rock surrounded by weathered, saprolitic basement material (similar to observed outcrops in the Yucaipa hills). The zones of weathered basement for YV6E and YVEP are estimated to be about 140 and 130 ft thick, respectively, above the gravity-derived, crystalline basement of Mendez and others (2016). This thickness is consistent with other weathered saprolite zones in temperate climates (Sequeira Braga and others, 2002; Dixon and others, 2009). Water-chemistry data from USGS multiple-depth monitoring-well site piezometers installed in and near this zone are consistent with groundwater stored in and recharged through regional basement material (Rewis and others, 2006; Cromwell and others, 2022a). This zone of weathered saprolitic basement material may be present above crystalline basement throughout the study area. Subsurface observations of this zone were limited to USGS multiple-depth monitoring-well sites YV6E and YVEP, prohibiting confident extrapolation across the study area; therefore, this zone is not included as a separate hydrogeologic unit in the HFM.
Interpretation of Basin-Fill Hydrogeologic Units
Geologic maps, drillers’ lithology log descriptions, and geophysical logs were the primary data sources used to interpret the subsurface basin-fill hydrogeologic units. Data were interpreted in two steps. First, basin-fill hydrogeologic units were identified and characterized in the four USGS multiple-depth monitoring-well sites (fig. 8), where the availability of high-quality lithology descriptions, geophysical logs, and physical sample material increased confidence in interpretations and descriptions of each unit. Next, hydrogeologic units identified in the multiple-depth monitoring-well sites were correlated to other boreholes by iteratively analyzing lithologic and geophysical logs relative to the multiple-depth monitoring-well sites and geologic maps. Figure 10 shows the subsurface input point locations for each basin-fill hydrogeologic unit.
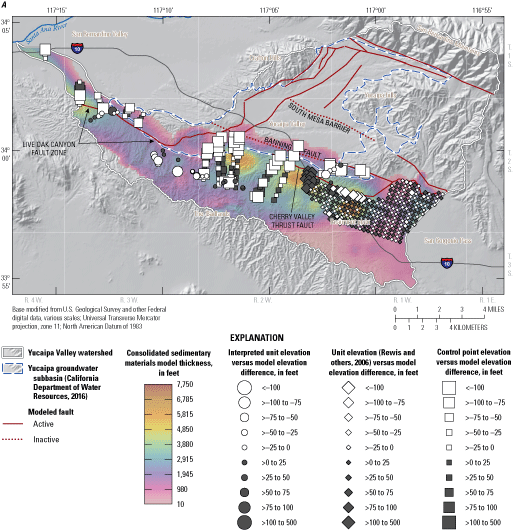
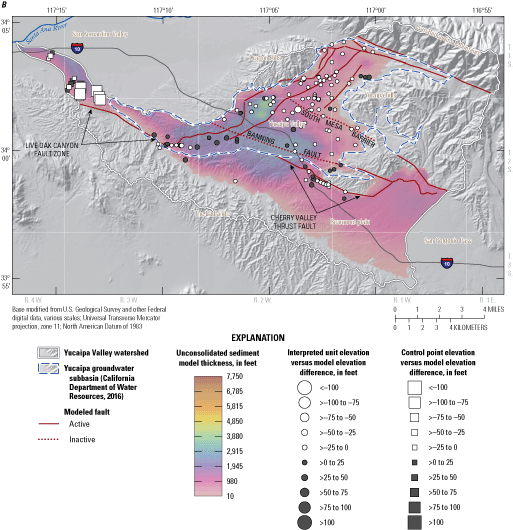
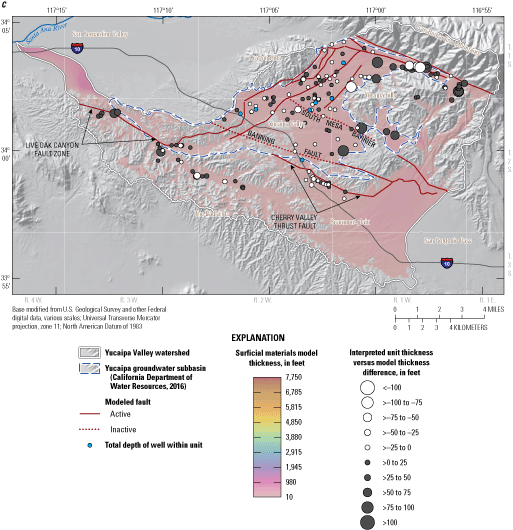
Interpolated thickness and extent of basin-fill hydrogeologic units in the three-dimensional hydrogeologic framework model, Yucaipa groundwater subbasin, Yucaipa Valley watershed, San Bernardino and Riverside Counties, California. Input data points are symbolized to show the difference between interpreted subsurface elevation or thickness of basin-fill hydrogeologic units and the interpolated units from the HFM: A, Consolidated sedimentary materials; B, unconsolidated sediment; and C, surficial materials.
The consolidated sedimentary materials unit was not identified in any USGS multiple-depth monitoring-well sites (figs. 8, 10A); however, the unit was identified in boreholes located in The Badlands and in wells in the hangingwall of the Cherry Valley thrust fault (fig. 10A). This unit was identified in drillers’ lithology logs based on the presence of consistent fine-grained materials, often in contrast to the substantially coarser-grained overlying material. The exact subsurface extent of this unit is unknown, but geologic information about the San Timoteo Formation, on which the consolidated sedimentary materials unit is primarily based, was used to inform the subsurface modeling of the unit. Geologic maps (Morton and Matti, 2001; Matti and others, 2003b, 201561; Morton and Miller, 2006) show that the San Timoteo Formation generally dips about 10–35 degrees to the northeast in the study area due to the regional influence of the San Timoteo anticline. The geologic cross section in figure 7A shows the formation dipping to the northeast and onlapping onto crystalline basement east of the Banning fault. Furthermore, the San Timoteo Formation was not identified in deep boreholes north and east of San Timoteo Canyon. Control points based on mapped dip angles were projected into the subsurface to provide structural controls of the consolidated sedimentary materials unit where it plunges beneath land surface (fig. 10A). The resulting modeled grid horizon of the unit was later manually adjusted to accommodate the inferred onlap of the unit across the Banning fault (fig. 7B). In the southeastern part of the study area, the modeled top of the San Timoteo Formation of Rewis and others (2006) was included in the HFM as the top of the consolidated sedimentary materials unit (fig. 10A).
The unconsolidated sediment unit was assumed to fill much of the basin to within several tens of feet of land surface, overlying the crystalline basement and consolidated sedimentary materials units (figs. 7B, 7D). Unconsolidated sediment was identified in all four USGS multiple-depth monitoring-well sites and in boreholes throughout the study area (figs. 8, 10B). The sedimentary deposits of Live Oak Canyon, middle and upper Pleistocene, and latest Quaternary alluvial deposits are all comprised of unconsolidated materials, but differentiating between the geologic units from lithologic and geophysical records in subsurface boreholes is difficult (see “Geologic Units” section). The top of the unconsolidated sediment unit was therefore interpreted to be the basal contact of the first (most shallow) prominent coarse-grained interval recorded in drillers’ lithologic logs or geophysical logs (fig. 8). Using this interpretation, the unconsolidated sediments hydrogeologic unit “crosses” stratigraphic boundaries. In drillers’ logs, this contact was generally interpreted to be where lithologic descriptions changed from primarily gravel to a mix of sand and gravel. In geophysical logs, the contact was generally interpreted to be at a decrease in the amplitude and magnitude of geophysical resistivity curves (fig. 8; Mendez and others, 2018). In several boreholes, red, indurated lithology intervals were identified and classified as the top of the unconsolidated sediment unit; these intervals were interpreted to represent pedogenic-soil horizons at the contact between the sedimentary deposits of Live Oak Canyon and the overlying middle and upper Pleistocene alluvial deposits (Matti and others (2003a, 2015)61. Control points based on mapped dip angles in the western part of the study area were projected into the subsurface to provide subsurface structural controls of the unit (fig. 10B).
The surficial materials unit was identified in the upper 50–150 ft of each USGS multiple-depth monitoring-well site (fig. 8) and in boreholes throughout the study area (primarily in the Yucaipa Valley area of the subbasin and along San Timoteo Canyon and Live Oak Canyon; fig 10C). The unit was interpreted to represent the first (most shallow) prominent coarse-grained interval recorded in drillers’ lithologic logs or geophysical logs (fig. 8). In drillers’ logs, the unit was generally classified as predominantly gravel rich with sands and minor clays, and was distinguished in geophysical logs from the underlying hydrogeologic units by the presence of high-amplitude and -magnitude resistivity curves (fig. 8; Mendez and others, 2018). The interpreted thicknesses of these deposits in USGS multiple-depth monitoring-well sites were consistent with field observations of Matti and others (2003a). Similar thicknesses of the unit were identified in the remainder of the borehole dataset (fig. 10C); therefore, an equivalent thickness is expected throughout the study area wherever the unit is present.
Model Construction
Digital datasets representing the top of each hydrogeologic unit were compiled as input data for the HFM. Each hydrogeologic unit dataset contains outcrop information from geologic maps. With the exception of the crystalline basement unit, each hydrogeologic dataset also contains subsurface picks from drillers’ lithology logs and geophysical logs.
Digital fault data for the HFM were created by generating a set of horizontal (x, y) and vertical (z) data points along the surface-model fault trace (table 3; fig. 9) and determining x, y, and z at depth from the fault-dip angle and -dip azimuth. The geologic modeling software utilizes fault-dip azimuth and fault-dip angle values to generate digital 3D fault planes for use in the model interpolation. Fault-dip azimuth is the geographic orientation at which the fault plane is projected into the subsurface, and fault-dip angle is the angle below the horizontal at which the fault plane descends into the subsurface. Fault-dip azimuth and fault dip angle values estimated for this report are listed in table 3. Fault dip-azimuths were estimated from the digital data sources (table 3). Fault-dip angles were assumed to be vertical for all faults, except for the Cherry Valley thrust fault and the northern strand of the San Andreas fault zone (table 3; fig. 9). Because of limitations of the geologic modeling software, most “vertical faults” were incorporated into the HFM with 85-degree-dip angles. The inactive strand of the Banning fault and the South Mesa barrier were assumed to only offset crystalline basement and were therefore incorporated in the HFM as proper vertical faults (90-degree dip angle) within that unit (table 3; fig. 7B; the geologic modeling software permits faults within a unit to be vertical). The Cherry Valley thrust fault is a low-angle structure, and the assigned dip angle of 20 degrees (table 3) is consistent with the range of measured dips from the geologic map of the El Casco 7.5-minute quadrangle (Matti and others, 2015); subsurface. Subsurface points along the northern San Andreas fault were taken directly from the Community Fault Model v4.0 (the Mission Creek strand of the San Andreas fault zone of Nicholson and others, 2013) and are therefore variable.
The geologic modeling software used to build the HFM, EarthVision, generates horizon grids from 3D point data (Dynamic Graphics, Inc., 2015)—in this case, the hydrogeologic unit datasets described above. Grid spacing of all hydrogeologic unit horizons was 492.1 ft in the x and y horizontal directions. Control points were added where subsurface borehole data were limited to enforce conceptual geologic structures and improve constraint of horizon interpolations (fig. 10). Each hydrogeologic unit horizon grid was constructed in stratigraphic order, oldest (deepest) to youngest (most shallow), with subsequently younger horizons built on top of previously constructed horizon grids. The total thickness of each hydrogeologic unit was defined as the difference between a given unit horizon and the upper surface of the unit horizon below. Finally, all horizon grids were clipped at land surface using a discretized digital elevation model (DEM) grid based on the National Elevation Dataset 10-meter DEM. The HFM is formed from a set of independent blocks (called fault blocks) that represent hydrogeologic materials within a particular volume defined by faults. Horizon tops are interpolated independently for each fault block, and offsets across each fault are maintained during the gridding process by utilizing data point elevations on either side of the fault surface for each hydrogeologic unit. In this manner, each of the fault blocks are modeled independently and then combined to form a single model. The resulting EarthVision horizon grids were exported to Esri ArcGIS version 10.7.1 GIS software and were manually adjusted to ensure that the grids were consistent with geologic principles, the geologic understanding of the Yucaipa subbasin area, and to enforce a minimum thickness of 9.8 ft for each hydrogeologic unit.
Framework Model Results
The HFM represents the input data and underlying geologic concepts of the Yucaipa subbasin that were used to guide construction of the model. Figures 7C and 7D show sections through the HFM. Figure 10 shows the mapped thicknesses and extents of the modeled basin-fill hydrogeologic units along with calculated differences between input data points and the resulting interpolated model units. Figure 11 is an egg-crate diagram of the HFM that shows slices through the basin-fill hydrogeologic units above the solid surface of the crystalline basement.
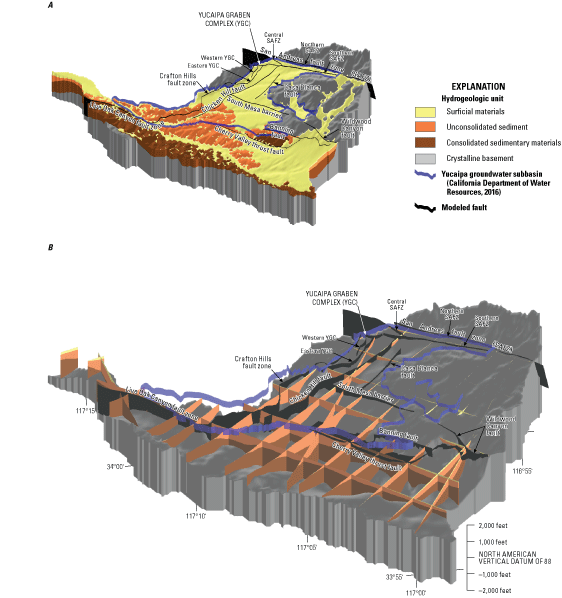
Visualization of the three-dimensional hydrogeologic framework model (HFM), including hydrogeologic units and model faults, Yucaipa groundwater subbasin, Yucaipa Valley watershed, San Bernardino and Riverside Counties, California. A, overview of the solid HFM; B, egg-crate diagram of the HFM showing slices of the basin-fill hydrogeologic units overlying the solid crystalline basement unit. See table 3 for information on model faults.
Modeled Hydrogeologic Units
The interpolated crystalline basement unit is exposed at land surface in the Crafton Hills, the Yucaipa hills, and the San Bernardino Mountains and underlies the three basin-fill hydrogeologic units (figs. 7, 11). The high elevations where crystalline basement is at land surface contrast with the top of crystalline basement in the relatively narrow, deep structural valley south of the inactive Banning fault (figs. 6, 7, 11). The unit varies at depth from tens of feet to more than 8,000 ft below land surface. In the HFM, all faults offset the crystalline basement unit, and areas of greatest structural relief are proximal to faults, especially the Live Oak Canyon fault zone, the Chicken Hill fault, and the inactive strand of the Banning fault (figs. 6, 7A, 7C, 10).
The consolidated sedimentary materials unit is limited in extent to the southern part of the HFM. The unit outcrops at land surface to the south and west along the The Badlands, and dips to the northeast with an average dip of about 20 degrees below the horizontal (figs. 7, 10, 11). The subsurface projection of the consolidated sedimentary materials unit carries it down to the northeast into the structural low south of the inactive Banning fault, but then it levels out and drapes onto the crystalline basement, pinching out northeast of the inactive Banning fault. (figs. 7B, 10, 11). In the HFM, all faults, with the exception of the inactive Banning fault and the South Mesa barrier, are permitted to displace the consolidated sedimentary materials unit; however, displacement is limited to those faults that intersect that unit, which are the Live Oak Canyon fault zone and the Cherry Valley thrust fault.
The consolidated sedimentary materials depicted in the Western Heights subarea structural low in cross section B-B’ (fig. 7D) were not modeled as part of the HFM (fig. 10A). The presence of these materials were not verified in available borehole data and were assumed to be located beneath the depth of hydrogeologic investigation (Cromwell and others, 2022a); therefore, for numerical simplicity, the unit was not included in this area in the HFM. Instead, the unconsolidated sediment unit was modeled to fill the entirety of the Western Heights structural low (fig. 10B; see below). Below depths of about 1,500 ft below land surface, this unit subarea should be considered to have the hydrogeologic properties of the consolidated sedimentary materials.
The unconsolidated sediment unit overlies the consolidated sedimentary materials unit in the southern part of the HFM and sits unconformably on top of crystalline basement in the northern half of the HFM where the consolidated sedimentary materials unit is absent (figs. 7B, 7D, 10, 11). The unconsolidated sediment unit fills in areas of structural relief above the consolidated sedimentary materials unit and crystalline basement, resulting in varying thickness (fig. 10B). The unconsolidated sediment unit is thinnest at the northern and southern margins of the HFM and thickest in the vicinity of the inactive Banning fault (fig. 10B). All faults in the HFM except the inactive strand of the Banning fault and the South Mesa barrier are active through this unit.
As indicated above, the unconsolidated sediment unit was modeled to fill the entirety of the Western Heights structural low (fig. 10B), even though consolidated sedimentary materials are likely present at depth (fig. 7D). Although the unconsolidated sediment unit comprises most of the basin-fill of the HFM in the Western Heights subarea, the hydrogeologic properties of the modeled unit are expected to vary with depth. At shallow depths where the unit is identified in available boreholes (from land surface down to about 1,500 ft below land surface; fig. 7D), the unconsolidated sediment is expected to have hydrogeologic properties consistent with the borehole observations. At depths below the available borehole data (deeper than about 1,500 ft below land surface; fig. 7D), at which the consolidated sedimentary materials are likely present, the unconsolidated sediment is expected to have hydrogeologic properties consistent with the consolidated sedimentary unit. See the “Textural Analysis of Basin-Fill Hydrogeologic Units” section below for more information.
The surficial materials unit is laterally extensive across the study area and overlies each of the older units at various locations (figs. 7B, 7D, 10C, 11). The surficial materials unit is continuous in the broad plains of the Yucaipa Valley and the Beaumont plain; elsewhere, the unit is present where stream channels incised the underlying hydrogeologic units (figs. 10C, 11). The surficial materials unit is generally less than about 100 ft thick, although the unit may be as thick as about 350 ft in parts of the Yucaipa Valley and Beaumont plain (fig. 10C; note that the total depth of some wells is less than the modeled thickness of the unit). All model faults except the inactive Banning fault and the South Mesa barrier are active through this unit.
Model Uncertainty
The HFM was constructed at a resolution appropriate for basin-scale hydrogeologic studies and for inclusion in an integrated hydrologic model. Emphasis was placed on quantifying the hydrogeology within the Yucaipa subbasin, which is the area of focus for this study. Areas outside the Yucaipa subbasin, and areas within the subbasin with little subsurface data (fig. 10), could be targets for future hydrogeologic modeling efforts.
The modeled hydrogeologic unit surfaces are interpolations of available input data; therefore, the modeled surfaces contain uncertainties related to the distribution and quality of the input data and uncertainties inherent to the interpolation algorithm used by the geologic modeling software. Input points derived from previously published geologic maps, gravity-derived depth-to-basement data, and fault catalogs are distributed across the study area and provide consistent and reliable interpretations of the Yucaipa subbasin geology and hydrogeology, within the documented uncertainties of those original publications. Input points derived from borehole data (or from structural control points) are discontinuous across the study area, and interpretations from these data are based on variable descriptions of downhole lithology and variable geophysical methods and measurements. These input points are consistent in their representation of the subsurface hydrogeology, but modeled surfaces in areas with more and higher quality borehole data are likely to be more representative of the subsurface hydrogeology than areas with fewer, or lower quality data. The EarthVision geologic modeling software uses a biharmonic cubic-spline algorithm that utilizes a minimum-tension (minimum curvature) gridding technique, meaning that the software does not “connect the dots” between input points but instead finds the easiest path through the available data; because of this algorithm, the resulting hydrogeologic unit surfaces are not expected to precisely match the input data.
Figure 10 shows calculated differences between the subsurface elevations or thicknesses of the basin-fill hydrogeologic units from input data (borehole data, structural control points, and other subsurface data) and from the interpolated hydrogeologic units from the HFM. In general, the differences between hydrogeologic unit elevations and thicknesses from borehole data and those of the interpolated model units were less than about 50 ft, and the differences between structural control points and the interpreted model units were about 100–150 ft (fig. 10). For the consolidated sedimentary materials, input points derived from Rewis and others (2006) were within about 100 ft of the interpreted model elevation. The largest differences between input point elevations and interpolated model elevations were at depths of several hundred to thousands of feet below land surface, such as for the structural control points and some compiled from Rewis and others (2006). Larger differences between input data and interpolated model elevations occurred in areas where manual adjustments were made to the model unit elevations to conform with geologic concepts. Manual adjustments were made, for example, where the consolidated sedimentary materials are believed to drape across the inactive Banning fault, and near hydrogeologic contacts where minimum thicknesses were enforced to ensure proper pinching-out thinning units.
Textural Analysis of Basin-Fill Hydrogeologic Units
Variability of lithology and grain size was analyzed for the consolidated sedimentary materials, unconsolidated sediment, and surficial materials unit. The primary variable used was sediment grain size, tabulated as a percentage of coarse-, medium-, and fine-grained textures. For each well, each downhole lithologic interval was generalized as either “coarse-grained,” “medium-grained,” or “fine-grained” based on the main texture from the drillers’ log descriptions. In this study, coarse-grained intervals were those with main textures classified as boulders, cobbles, conglomerate, gravel, pebbles, and rock. Medium-grained intervals were those classified as sand, sandstone, or hardpan, and fine-grained intervals were those classified as clay, shale, loam, or topsoil. Intervals with main textures classified as silt were generalized as fine-grained if the primary texture modifier was fine-grained (such as “clayey”) or defined as medium-grained if the primary texture modifier was medium- or coarse-grained (such as “sandy” or “gravelly”).
Textural data were generated by digitally intersecting the downhole lithologic interval data in each borehole with the elevation of the hydrogeologic unit tops from the HFM, thereby assigning specific lithologic intervals to a hydrogeologic unit at each borehole. The percentage of coarse-, medium-, and fine-grained material for a borehole within a given hydrogeologic unit was calculated as the aggregate thickness of coarse-, medium-, or fine-grained intervals penetrated by the borehole divided by the total thickness of the unit in that borehole. The percentage of the generalized grain-size groupings at each borehole are shown in figure 12, and the total percentages of each generalized grain-size grouping for each unit are shown in figure 13.
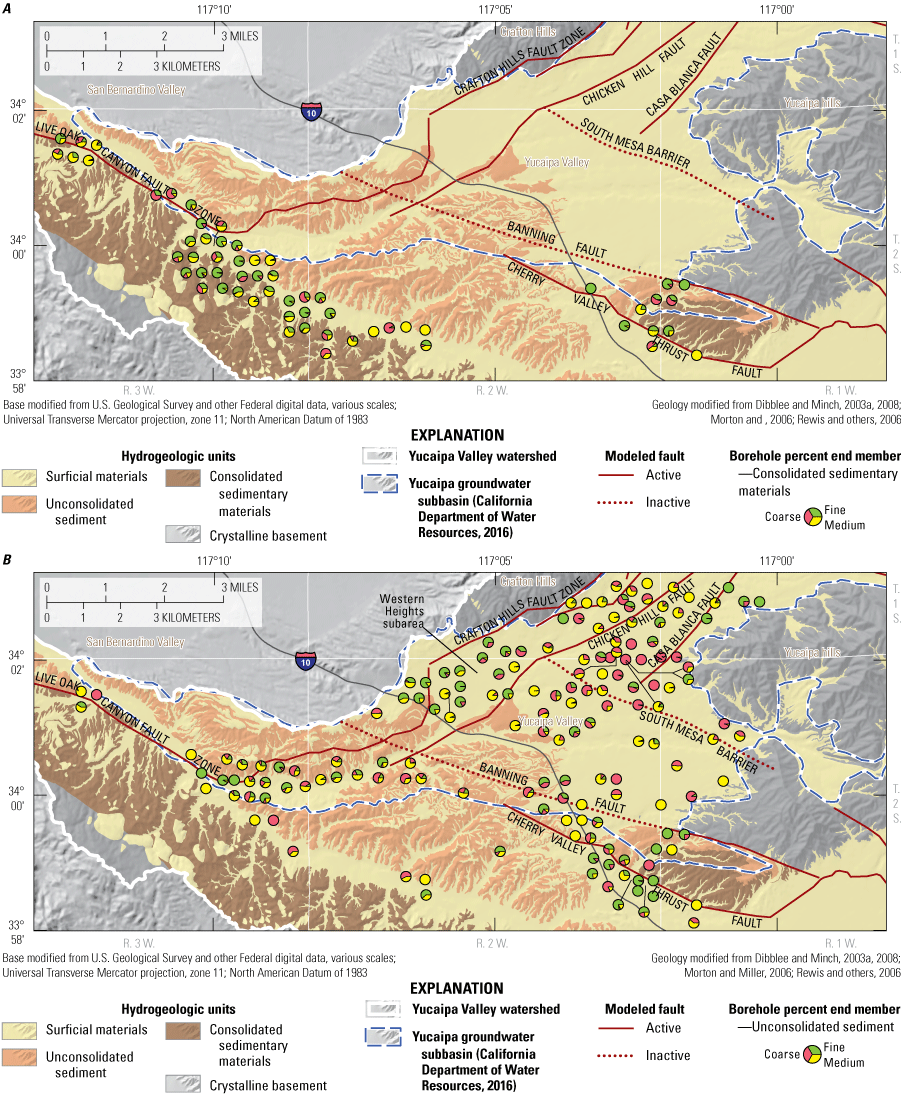
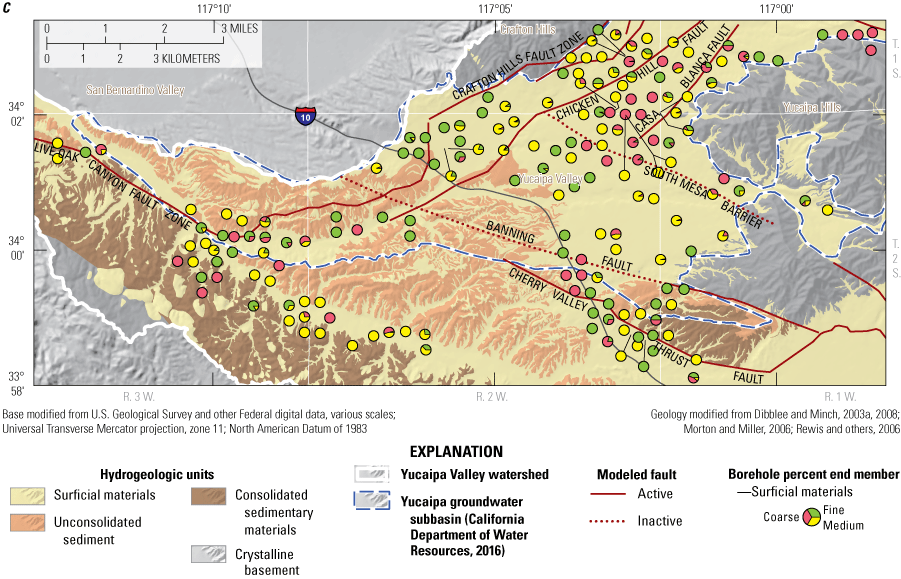
Estimated percentage of coarse-, medium-, and fine-grained materials identified in boreholes that penetrate A, consolidated sedimentary materials; B, unconsolidated sediment; and C, surficial materials, Yucaipa groundwater subbasin, Yucaipa Valley watershed, San Bernardino and Riverside Counties, California.
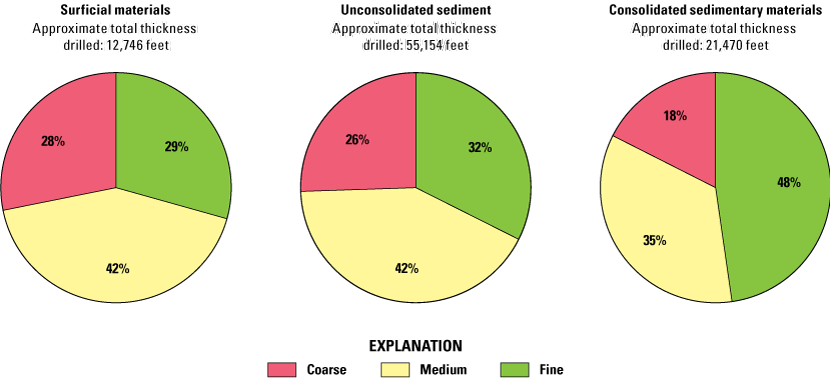
Frequency of the percentage of coarse-, medium-, and fine-grained materials in hydrogeologic units used in the three-dimensional hydrogeologic framework model (HFM) of the Yucaipa Valley watershed, San Bernardino and Riverside Counties, California. Frequency values are normalized by the total thickness of boreholes that penetrate each hydrogeologic unit.
Textural variability in the basin-fill sediment ultimately depends on the sedimentary facies, environment of deposition, and depositional history of the area. Boreholes in the consolidated sedimentary materials unit are predominantly fine grained across the modeled extent of the unit, which is consistent with previous geologic observations, and the total percentage of fine-grained materials in the unit is nearly 50 percent (figs. 12A and 13). Boreholes in the unconsolidated sediment have varying percentages of each of the three grain-size groupings across the modeled extent of that unit, although medium-grained materials comprise more than 40 percent of the unit (figs. 12B, 13). In the Yucaipa Valley, the unit is predominantly composed of coarse- and medium-grained materials, while elsewhere, the unit is predominantly composed of medium- and fine-grained materials. The predominance of fine-grained materials in the Western Heights subarea may be related to springs and peaty land that were historically present in this area (Moreland, 1970).
Boreholes in the surficial materials unit penetrated predominantly medium-grained material with nearly equal percentages of coarse- and fine-grained materials; the total percentage of medium-grained materials in the unit is about 40 percent, and the total percentage of both coarse- and fine-grained materials is about 30 percent (figs. 12C, 13). The spatial distribution of grain size in the modeled surficial materials unit is similar to the unconsolidated sediment unit with more coarse- and medium-grained materials in Yucaipa Valley and generally more medium- and fine-grained materials across the remainder of the modeled extent. An exception to this comparison is in the northern part of the study area between the San Bernardino Mountains and the Yucaipa hills where boreholes penetrating the surficial materials unit encountered mostly coarse-grained materials. In this area, fractured and weathered crystalline basement rocks are likely present in what is modeled as surficial materials; drillers’ descriptions often classify the main texture as “rock” which is generalized as coarse grained in this analysis.
Potential Barriers to Groundwater Flow
The geometry of the Yucaipa subbasin and the thick sedimentary sequences that overlie crystalline bedrock demonstrate potential for groundwater storage and extraction. Structural features in the HFM, especially the northeast dipping consolidated sedimentary materials unit and northeast-trending normal faults, control local stratigraphy and may affect groundwater flow. The northeasterly dip of the consolidated sedimentary materials in the HFM produces a non-horizontal, low-permeability barrier to groundwater flow (Rewis and others, 2006) at the contact with the unconsolidated sediment (figs. 7B, 11). The subsurface quantification of this contact and the extent and structure of the crystalline basement are important to understanding the total storage volume of the Yucaipa subbasin.
The HFM provides a quantitative framework with which to evaluate the potential effect of faults on groundwater flow in the Yucaipa subbasin. Faults can inhibit groundwater flow in permeable unconsolidated materials (such as the unconsolidated sediment and surficial materials units) through the presence of fine-grained gouge material, chemical cementation of proximal sediments, and the juxtaposition of layers across faults caused by sharp folds or vertical or horizontal displacement of beds. Faults in the HFM within the Yucaipa subbasin that were previously interpreted to inhibit groundwater flow include strands of San Andreas fault zone, strands of the Yucaipa graben complex, the Chicken Hill fault, the Casa Blanca fault, the South Mesa barrier, the Cherry Valley thrust fault, and to a lesser extent, the inactive Banning fault (Burnham and Dutcher, 1960; Bloyd, 1971; Dutcher and Fenzel, 1972; Moreland, 1970). Further evaluation of the effects of these faults and the Live Oak Canyon and Crafton Hills fault zones on groundwater flow can be found in Cromwell and others (2022a) and Alzraiee and others (2022).
The inactive Banning fault and the South Mesa barrier are modeled in the HFM as only present in crystalline basement and are not interpreted to directly offset or juxtapose layers within the basin-fill hydrogeologic units. These structures were previously identified as partial barriers to groundwater flow, but because the structures are not interpreted in the HFM to directly offset basin-fill materials, a different mechanism must be inferred. The inactive Banning fault and the South Mesa barrier may indirectly cause thinning or pinching out of hydrostratigraphic layers, or both, within the basin-fill hydrogeologic units that “drape” across structural crests in crystalline basement (fig. 7); the thinning of hydrostratigraphic layers may restrict the movement of groundwater and form a partial barrier to groundwater flow, as observed in groundwater basins near Los Angeles (Reichard and others, 2003).
Summary
To better understand the hydrogeology and water resources in the Yucaipa groundwater subbasin (“Yucaipa subbasin”), the San Bernardino Valley Municipal Water District (SBVMWD) and the United States Geological Survey (USGS) initiated a cooperative study to evaluate the hydrogeologic system of the Yucaipa subbasin and in the encompassing Yucaipa Valley watershed. The Yucaipa Valley watershed (YVW) is a semiarid inland area that straddles southwestern San Bernardino County and northwestern Riverside County, about 12 miles (mi) southeast of the City of San Bernardino and about 75 mi east of Los Angeles. The YVW is bounded on the north by the San Bernardino Mountains, on the southeast by the San Gorgonio Pass, on the south by the The Badlands, on the northwest by the San Bernardino Valley, and on the west by the Crafton Hills. The YVW is composed of three watersheds that encompass the Yucaipa subbasin: (1) Yucaipa Creek, (2) San Timoteo Canyon–San Timoteo Wash, and (3) Little San Gorgonio Creek (Watershed Boundary Dataset 12-digit hydrologic unit codes; HUC 12).
The Yucaipa groundwater subbasin (hereafter referred to as “Yucaipa subbasin”) is located within the YVW and was the area of hydrogeologic interest for this report. The Yucaipa subbasin encompasses 39 square miles, including the City of Yucaipa. The boundaries of the Yucaipa subbasin have been modified through time as the understanding of the geology and hydrology of the subbasin has improved with subsequent scientific studies. The current boundaries were defined by the California Department of Water Resources in 2016.
The geology of the Yucaipa subbasin is complex. Interpretations of the character, distribution, extent, age, and structural significance of geologic units, faults, and folds has varied over time. This report provides a synthesis of previous studies and a discussion of the geologic interpretations that were used as the foundation for the hydrogeologic framework model (HFM). Notably, this report (1) adopts the recently classified sedimentary deposits of Live Oak Canyon unit formation and extends the mapped distribution of the formation within the study area, and (2) adopts the interpretation that activity along the Banning fault predates the deposition of most basin-fill sedimentary materials in the Yucaipa subbasin.
A three-dimensional hydrogeologic framework model of the Yucaipa subbasin and YVW was developed using geologic modeling software and was based on a combination of geologic maps, borehole-lithology and -geophysical data, and gravity-derived depth-to-basement information. The HFM quantifies the extent and thickness of four hydrogeologic units (three basin-fill sedimentary units and one basal crystalline basement unit) in the Yucaipa subbasin and is consistent with existing geologic concepts and interpretations of available subsurface data. The HFM was constructed to be appropriate for basin-scale hydrogeologic applications.
The hydrogeology of the Yucaipa subbasin was classified into three basin-fill sedimentary units overlying a crystalline basement complex. The three basin-fill hydrogeologic units that comprise the basin-fill aquifer system were referred to as, from oldest (deepest) to youngest (most shallow), (1) consolidated sedimentary materials, (2) unconsolidated sediment, and (3) surficial materials. The consolidated sedimentary materials unit is more compacted, cemented, and has a greater abundance of clay and silt relative to the overlying unconsolidated sediment and surficial materials. The unconsolidated sediment unit is the primary aquifer unit in the Yucaipa subbasin and is composed of sediments that are more coarse than fine grained, indicating a likelihood of high permeability and capacity for groundwater flow and storage. The surficial materials unit is unconsolidated and coarse grained, and generally above the water table; therefore, this unit is unlikely to contribute to groundwater storage but might permit rapid recharge to the aquifer system.
Crystalline basement is the basal unit in the Yucaipa subbasin and underlies the three basin-fill hydrogeologic units. Rocks that comprised the crystalline basement unit likely do not host large volumes of groundwater; however, small-scale joints and fractures could be conduits to groundwater flow. A thin zone of weathered saprolitic basement material was observed above the crystalline basement surface in selected monitoring-well sites at depth and in outcrop. The full subsurface extent of this zone was unknown, but its presence may affect groundwater flow through the aquifer.
Faults dissect and bound the Yucaipa subbasin. Determing the effects of faults, barriers, and geologic structures on groundwater flow in the Yucaipa subbasin is beyond the scope of this report; however, the HFM provides a framework that can be used to evaluate the potential for these features to inhibit groundwater flow. Some faults were previously identified as partial barriers to groundwater flow, and some faults might permit groundwater flow because of their discontinuous nature (or limited offset of basin-fill hydrogeologic materials). Structural controls within the Yucaipa subbasin might also affect groundwater flow within the aquifer system, such as the geometry of the crystalline basement surface and its influence on the thickness and extent of the overlying hydrogeologic units.
References Cited
Albright, L.B., 1999, Magnetostratigraphy and biochronology of the San Timoteo Badlands, southern California, with implications for local Pliocene-Pleistocene tectonic and depositional patterns: Geological Society of America Bulletin, v. 111, no. 9, p. 1265–1293, https://doi.org/10.1130/0016-7606(1999)111%3C1265:MABOTS%3E2.3.CO;2.
Alzraiee, A.H., Engott, J.A., Cromwell, G., and Woolfenden, L., 2022, Yucaipa Valley integrated hydrological model, Chapter B in Hydrology of the Yucaipa groundwater subasin—Characterization and integrated numerical model, San Bernardino and Riverside Counties, California, USA: U.S. Geological Survey Scientific Investigations Report 2021–5118–B, 157 p., https://doi.org/10.3133/sir20215118B.
Allen, C.R., 1957, San Andreas fault zone in San Gorgonio Pass, southern California: Geological Society of America Bulletin, v. 68, no. 3, p. 315–350, https://doi.org/10.1130/0016-7606(1957)68[315:SAFZIS]2.0.CO;2.
Anderson, M., Matti, J.C., and Jachens, R., 2004, Structural model of the San Bernardino basin, California, from analysis of gravity, aeromagnetic, and seismicity data: Journal of Geophysical Research, v. 109, no. B4, 24 p., https://doi.org/10.1029/2003JB002544.
California Department of Water Resources, 2003, Bulletin 118—Interim Update 2003, California’s Groundwater: California Department of Water Resources, 226 p., accessed November 10, 2018, at https://water.ca.gov/Programs/Groundwater-Management/Bulletin-118.
California Department of Water Resources, 2016, Bulletin 118—Interim Update 2016, California's Groundwater, Working Toward Sustainability: California Department of Water Resources, 226 p., accessed November 10, 2018, at https://water.ca.gov/Programs/Groundwater-Management/Bulletin-118.
Cromwell, G., Engott, J.A., Alzraiee, A.H., Stamos, C.L., Mendez, G.O., Dick, M.C., and Bond, S., 2022a, Hydrogeologic characterization of the Yucaipa groundwater subbasin, Chapter A in Hydrology of the Yucaipa groundwater subbasin—Characterization and integrated numerical model, San Bernardino and Riverside Counties, California, USA: U.S. Geological Survey Scientific Investigations Report 2021–5118–A, 157 p., https://doi.org/10.3133/sir20215118A.
Cromwell, G., Matti, J.C., and Roberts, S.A., 2022b, Data release of hydrogeologic data of the Yucaipa groundwater subbasin, San Bernardino and Riverside Counties, California: U.S. Geological Survey Sciencebase data release, https://doi.org/10.5066/P9F7OYQR.
Danskin, W.R., McPherson, K.R., and Woolfenden, L.R., 2006, Hydrology, description of computer models, and evaluation of selected water-management alternatives in the San Bernardino area, California: U.S. Geological Survey Open-File Report 2005–1278, 194 p., https://doi.org/10.3133/ofr20051278.
Dibblee, T.W., Jr., 1968, Geologic map of the Yucaipa quadrangle, California: U.S. Geologic Survey Open-File Report 68–73, scale 1:24,000, accessed January 4, 2016, at https://doi.org/10.3133/ofr6873.
Dibblee, T.W., Jr., 1974, Geologic map of the Redlands quadrangle, California: U.S. Geological Survey Open-File Report 74–1022, scale 1:62,500, https://pubs.er.usgs.gov/publication/ofr741022.
Dibblee, T.W., and Minch, J.A., 2003a, Geologic map of the Beaumont quadrangle, Riverside County, California: Dibblee Geological Foundation, Dibblee Foundation Map DF–114, scale 1:24,000, accessed June 7, 2018, at https://ngmdb.usgs.gov/Prodesc/proddesc_71734.htm.
Dibblee, T.W., and Minch, J.A., 2003b, Geologic map of the El Casco quadrangle, Riverside County, California: Dibblee Geological Foundation, Dibblee Foundation Map DF–113, scale 1:24,000, accessed June 7, 2018, at https://ngmdb.usgs.gov/Prodesc/proddesc_71735.htm.
Dibblee, T.W., and Minch, J.A., 2003c, Geologic map of the Sunnymead/south 1/2 of Redlands quadrangles, San Bernardino and Riverside County, California: Dibblee Geological Foundation, Dibblee Foundation Map DF–110, scale 1:24,000, accessed June 7, 2018, at https://ngmdb.usgs.gov/Prodesc/proddesc_71736.htm.
Dibblee, T.W., and Minch, J.A., 2004, Geologic map of the Yucaipa quadrangle, Riverside County, California: Dibblee Geological Foundation, Dibblee Foundation Map DF–124, scale 1:24,000, accessed June 7, 2018, at https://ngmdb.usgs.gov/Prodesc/proddesc_71755.htm.
Dibblee, T.W., and Minch, J.A., 2008, Geologic map of the San Gorgonio Mountain and Morongo Valley quadrangles, San Bernardino and Riverside Counties, California Dibblee Geological Foundation, Dibblee Foundation Map DF–381, scale 1:62,500, accessed June 7, 2018, at https://ngmdb.usgs.gov/Prodesc/proddesc_84181.htm.
Dixon, J.L., Heimsath, A.M., and Amundson, R., 2009, The critical role of climate and saprolite weathering in landscape evolution: Earth Surface Processes and Landforms, v. 34, no. 11, p. 1507–1521, https://doi.org/10.1002/esp.1836.
Durbin, T.J., 1974, Digital simulation of the effects of urbanization on runoff in the upper Santa Ana Valley, California: U.S. Geological Survey Water-Resources Investigations Report 41–73, 44 p., https://doi.org/10.3133/wri7341.
Durbin, T.J., and Morgan, C.O., 1978, Well-response model of the confined area, Bunker Hill ground-water basin, San Bernardino, California: U.S. Geological Survey Water Resources Investigations Report 77–129, 39 p., https://doi.org/10.3133/wri77129.
Dutcher, L.C., 1956, Memorandum summarizing preliminary estimates of ground-water outflow from Bunker Hill basin at Colton Narrows, San Bernardino County, California: U.S. Geological Survey Open-File Report 56–41, 14 p., https://doi.org/10.3133/ofr5641.
Dutcher, L.C., and Burnham, W.L., 1959, Geology and ground-water hydrology of the Mill Creek area, San Bernardino County, California: U.S. Geological Survey Open-File Report 59–38, 229 p., https://doi.org/10.3133/ofr5938.
Dutcher, L.C., and Fenzel, F.W., 1972, Ground-water outflow, San Timoteo-Smiley Heights area, upper Santa Ana Valley, Southern California, 1927 through 1968: U.S. Geological Survey Open-File Report 72–97, 30 p., https://doi.org/10.3133/ofr7297.
Dynamic Graphics, Inc., 2015, EarthVision: accessed November 24, 2015, at https://www.dgi.com/earthvision-software-for-3d-modeling-and-visualization/.
Gibbard, P.L., Head, M.J., Walker, M.J.C., and the Subcommission on Quaternary Stratigraphy, 2010, Formal ratification of the Quaternary System/Period and the Pleistocene Series/Epoch with a base at 2.58 Ma: Journal of Quaternary Science, v. 25, no. 2, p. 96–102, https://doi.org/10.1002/jqs.1338.
Harden, J.W., and Matti, J.C., 1989, Holocene and late Pleistocene slip rates on the San Andreas Fault in Yucaipa, California, using displaced alluvial-fan deposits and soil chronology: Geological Society of America Bulletin, v. 101, no. 9, p. 1107–1117, https://doi.org/10.1130/0016-7606(1989)101%3C1107:HALPSR%3E2.3.CO;2.
Hardt, W.F., and Freckleton, J.R., 1987, Aquifer response to recharge and pumping, San Bernardino ground-water basin, California: U.S. Geological Survey Water-Resources Investigations Report 86–4140, 69 p., https://doi.org/10.3133/wri864140.
Hardt, W.F., and Hutchinson, C.B., 1980, Development and use of a mathematical model of the San Bernardino Valley ground-water basin, California: U.S. Geological Survey Open File Report 80–576, 84 p., https://doi.org/10.3133/ofr80576.
Head, M.L., 2019, Formal subdivision of the Quaternary System/Period: Present status and future directions, in Van Kolfschoten, T., ed., SI: Quaternary International, v. 500, p. 32–51, accessed July 3, 2021, at https://doi.org/10.1016/j.quaint.2019.05.018.
Kendrick, K.J., and McFadden, L.D., 1996, Comparison and contrast of processes of soil formation in the San Timoteo Badlands with chronosequences in California: Quaternary Research, v. 46, no. 2, p. 149–160, accessed October 16, 2021, at https://doi.org/10.1006/qres.1996.0055.
Kendrick, K.J., Morton, D.M., Wells, S.G., and Simpson, R.W., 2002, Spatial and temporal deformation along the northern San Jacinto Fault, Southern California—Implications for slip rates: Bulletin of the Seismological Society of America, v. 92, no. 7, p. 2782–2802, https://doi.org/10.1785/0120000615.
Langenheim, V.E., Jachens, R.C., Matti, J.C., Hauksson, E., Morton, D.M., and Christensen, A., 2005, Geophysical evidence for wedging in the San Gorgonio Pass structural knot, southern San Andreas fault zone, southern California: Geological Society of America Bulletin, v. 117, no. 11, p. 1554–1572, https://doi.org/10.1130/B25760.1.
Lippincott, J.B., 1902a, Development and application of water near San Bernardino, Colton, and Riverside, California, Part I: U.S. Geological Survey Water Supply Paper 59, 95 p., https://doi.org/10.3133/wsp59.
Lippincott, J.B., 1902b, Development and application of water near San Bernardino, Colton, and Riverside, California, Part II: U.S. Geological Survey Water-Supply Paper, v. 60, p. 97–141, https://doi.org/10.3133/wsp60.
Matti, J.C., 2018, Stratigraphic and structural relations in San Gorgonio Pass, southern California—Possible implications for the late Cenozoic West Salton Detachment system: Geological Society of America Joint 70th Rocky Mountain Annual Section/114th Cordilleran Annual Section Meeting, Paper No. 4–1, https://gsa.confex.com/gsa/2018RM/webprogram/Paper313736.html.
Matti, J.C., and Carson, S.E., 1991, Liquefaction susceptibility in the San Bernardino Valley and vicinity, southern California—A regional evaluation: U.S. Geological Survey Bulletin 1898, 53 p., https://doi.org/10.3133/b1898.
Matti, J.C., and Langenheim, V.E., 2008, Does the West Salton Detachment extend through San Gorgonio Pass, southern California: Eos, Transactions of the American Geophysical Union, v. 89, no. 53, Fall Meeting Supplement, abstract #T11A-1838, https://adsabs.harvard.edu/abs/2008AGUFM.T11A1838M.
Matti, J.C., and Morton, D.M., 1993, Paleogeographic evolution of the San Andreas fault in southern California—A reconstruction based on a new cross-fault correlation, chap. 2 in Powell, R.E., Weldon, R.J., II, and Matti, J.C., eds., The San Andreas fault system—Displacement, palinspastic reconstruction, and geologic evolution: Geological Society of America Memoir 178, p. 107–159, https://doi.org/10.1130/MEM178-p107.
Matti, J.C., Cox, B.F., and Iverson, S.R., 1983, Mineral resource potential map of the Raywood Flat Roadless Area, San Bernardino and Riverside Counties, California: U.S. Geological Survey Miscellaneous Field Studies Map MF–1563–A, scale 1:62,500, https://pubs.er.usgs.gov/publication/mf1563A.
Matti, J.C., Morton, D.M., and Cox, B.F., 1985, Distribution and geologic relations of fault systems in the vicinity of the Central Transverse Ranges, southern California: U.S. Geological Survey Open-File Report 85–365, 23 p., https://doi.org/10.3133/ofr85365.
Matti, J.C., Morton, D.M., and Cox, B.F., 1992a, The San Andreas fault system in the vicinity of the Central Transverse Ranges Province, southern California: U.S. Geological Survey Open-File Report 92–354, 49 p., https://doi.org/10.3133/ofr92354.
Matti, J.C., Morton, D.M., Cox, B.F., Carson, S.E., and Yetter, T.J., 1992b, Geologic setting of the Yucaipa Quadrangle, San Bernardino and Riverside counties, California: U.S. Geological Survey Open-File Report 92–446, 14 p., https://doi.org/10.3133/ofr92446.
Matti, J.C., Morton, D.M., Cox, B.F., Carson, S.E., and Yetter, T.J., 2003a, Geologic map and digital database of the Yucaipa 7.5′ quadrangle, San Bernardino and Riverside Counties, California: U.S. Geological Survey Open-File Report 2003–301, 23 p., https://doi.org/10.3133/ofr03301.
Matti, J.C., Morton, D.M., and Langenheim, V.E., 2015, Geologic and geophysical maps of the El Casco 7.5′ quadrangle, Riverside County, Southern California, with accompanying geologic-map database: U.S. Geological Survey Open-File Report 2010–1274, 141 p., https://doi.org/10.3133/ofr20101274.
Mendenhall, W.C., 1905, The hydrology of San Bernardino Valley, California: U.S. Geological Survey Water Supply Paper 142, 124 p., https://doi.org/10.3133/wsp142.
Mendenhall, W.C., 1908, Ground waters and irrigation enterprises in the foothill belt, southern California: U.S. Geological Survey Water Supply Paper 219, 180 p., https://doi.org/10.3133/wsp219.
Mendez, G.O., Anders, R., McPherson, K.R., and Danskin, W.R., 2018, Geologic, hydrologic, and water-quality data from multiple-well monitoring sites in the Bunker Hill and Yucaipa Groundwater subbasins, San Bernardino County, California, 1974–2016: U.S. Geological Survey Data Series 1096, 215 p., accessed November 10, 2018, at https://doi.org/10.3133/ds1096.
Mendez, G.O., Danskin, W.R., and Burton, C.A., 2001, Surface-water and ground-water quality in the Yucaipa area, San Bernardino and Riverside Counties, California, 1996–98: U.S. Geological Survey Water-Resources Investigations Report 2000–4269, 47 p., https://doi.org/10.3133/wri004269.
Mendez, G.O., Langenheim, V.E., Morita, A., and Danskin, W.R., 2016, Geologic structure of the Yucaipa area inferred from gravity data, San Bernardino and Riverside Counties, California: U.S. Geological Survey Open-File Report 2016–1127, 21 p., https://doi.org/10.3133/ofr20161127.
Moreland, J.A., 1970, Artificial recharge, Yucaipa, California: U.S. Geological Survey Open-File Report 70–232, 44 p., https://doi.org/10.3133/ofr70232.
Morton, D.M., 1978, Geologic map of the Redlands quadrangle, San Bernardino and Riverside Counties, California: U.S. Geological Survey Open-File Report 78–21, 1:24,000 scale, https://doi.org/10.3133/ofr7821.
Morton, D.M., and Matti, J.C., 1993, Extension and contraction within an evolving divergent strike-slip fault complex—The San Andreas and San Jacinto fault zones a their convergence in southern California, chap. 5 in Powell, R.E., Weldon, R.J., II, and Matti, J.C., eds., The San Andreas fault system—Displacement, palinspastic reconstruction, and geologic evolution: Geological Society of America Memoir 178, p. 217–230, https://doi.org/10.1130/MEM178-p217.
Morton, D.M., and Matti, J.C., 2001, Geologic map of the Sunnymead 7.5′ quadrangle, Riverside County, California: U.S. Geological Survey Open-File Report 2001–450, 18 p., https://doi.org/10.3133/ofr01450.
Morton, D.M., and Miller, F.K., 2006, Geologic map of the San Bernardino and Santa Ana 30′ x 60′ quadrangles, California: U.S. Geological Survey Open-File Report 2016–1217, 194 p., https://doi.org/10.3133/ofr20061217.
Nicholson, C., Plesch, A., Sorlien, C.C., Shaw, J.H., and Hauksson, E., 2013, Updating the 3D fault set for the SCEC Community Fault Model (CFM-v4) and revising its associated fault database: Southern California Earthquake Center Annual Meeting, SCEC Contribution #2053, accessed March 1, 2016, at https://www.scec.org/research/cfm.
Nicholson, C., Plesch, A., Sorlien, C.C., Shaw, J.H., and Hauksson, E., 2014, The SCEC 3D Community Fault Model (CFM Version 5.0)—An updated and expanded fault set of oblique crustal deformation and complex fault interaction for southern California: EOS (transactions of AGU), v. 95, no. 52, T31B-4585, accessed March 1, 2016, at https://www.scec.org/research/cfm.
Pillans, B., and Gibbard, P., 2012, The quaternary period, chap. 30 of Gradstein, F.M., Ogg, J.G., Schmitz, M.D., and Ogg, G.M., eds., The geologic time scale: Elsevier, p. 979–1010, accessed July 2, 2021, at https://doi.org/10.1016/B978-0-444-59425-9.00030-5.
Powers, W.R., III, and Hardt, W.F., 1974, Oak Glen water resources development study using modeling techniques, San Bernardino County, California: U.S. Geological Survey Water Resources Investigations Report 31–74, 59 p., https://doi.org/10.3133/wri7431.
Rasmussen, G.S., and Associates, 1988b, Preliminary engineering geology investigation, Oak Valley project, 6725 acres southwest of Interstate 10, northern Riverside County, California; Project No. 2529.1, August 9, 1988: unpublished consulting report on file with Riverside County Planning Department, 36 p., with many figures.
Reichard, E.G., Land, M., Crawford, S.M., Johnson, T.D., Everett, R.R., Kulshan, T.V., Ponti, D.J., Halford, K.J., Johnson, T.A., Paybins, K.S., and Nishikawa, T., 2003, Geohydrology, geochemistry, and ground-water simulation-optimization of the Central and West Coast Basins, Los Angeles County, California: U.S. Geological Survey Water Resources Investigations Report 2003–4065, 184 p., https://doi.org/10.3133/wri034065.
Rewis, D.L., Christensen, A.H., Matti, J.C., Hevesi, J.A., Nishikawa, T., and Martin, P., 2006, Geology, ground-water hydrology, geochemistry, and ground-water simulation of the Beaumont and Banning storage units, San Gorgonio Pass area, Riverside County, California: U.S. Geological Survey Scientific Investigations Report 2006–5026, 191 p., https://doi.org/10.3133/sir20065026.
Sequeira Braga, M.A., Paquet, H., and Begonha, A., 2002, Weathering of granites in a temperate climate (NW Portugal)—Granitic saprolites and arenization: Catena, v. 49, no. 1–2, p. 41–56, https://doi.org/10.1016/S0341-8162(02)00017-6.
Superior Court of the State of California, Riverside County, 2004, Judgement pursuant to stipulation adjudicating groundwater rights in the Beaumont Basin, filed February 4, 2004: http://documents.yvwd.dst.ca.us/bbwm/documents/formation/judgment.pdf.
U.S. Census Bureau, 2010, Decennial census of population and housing, accessed November 10, 2018, at https://www.census.gov/programs-surveys/decennial-census/decade.2010.html.
U.S. Geological Survey Geologic Names Committee, 2010, Divisions of geologic time—Major chronostratigraphic and geochronologic units: U.S. Geological Survey Fact Sheet 2010–3059, 2 p., accessed July 13, 2021, at https://pubs.usgs.gov/fs/2010/3059/.
U.S. Geological Survey and California Geological Survey, 2016, Quaternary fault and fold database for the United States: accessed October 18, 2016, at https://www.usgs.gov/natural-hazards/earthquake-hazards/faults?qt-science_support_page_related_con=4#qt-science_support_page_related_con.
U.S. Geological Survey, 2016, National hydrography dataset (ver. USGS National Hydrography Dataset Best Resolution (NHD) for Hydrologic Units (HU) 8-18070202 and 18070203 (published 20161105)), accessed November 11, 2016, at https://www.usgs.gov/core-science-systems/ngp/national-hydrography/access-national-hydrography-products.
U.S. Geological Survey, 2018, USGS water data for the Nation: U.S. Geological Survey National Water Information System database, accessed October 16, 2018, at https://doi.org/10.5066/F7P55KJN.
Conversion Factors
U.S. customary units to International System of Units
Temperature in degrees Celsius (°C) may be converted to degrees Fahrenheit (°F) as follows:
°F = (1.8 × °C) + 32.
Temperature in degrees Fahrenheit (°F) may be converted to degrees Celsius (°C) as follows:
°C = (°F – 32) / 1.8.
Datum
Vertical coordinate information is referenced to the North American Vertical Datum of 1988 (NAVD 88).
Horizontal coordinate information is referenced to the Universal Transverse Mercator (UTM) North American Datum of 1983 (NAD 83) Zone 11 North.
Altitude, as used in this report, refers to distance above the vertical datum.
For more information concerning the research in this report, contact the
Director, California Water Science Center
U.S. Geological Survey
6000 J Street, Placer Hall
Sacramento, California 95819
Publishing support provided by the U.S. Geological Survey
Science Publishing Network, Sacramento Publishing Service Center
Disclaimers
Any use of trade, firm, or product names is for descriptive purposes only and does not imply endorsement by the U.S. Government.
Although this information product, for the most part, is in the public domain, it also may contain copyrighted materials as noted in the text. Permission to reproduce copyrighted items must be secured from the copyright owner.
Suggested Citation
Cromwell, G., and Matti, J.C., 2022, Geology and hydrogeology of the Yucaipa groundwater subbasin, San Bernardino and Riverside Counties, California (ver. 1.1, May 2022): U.S. Geological Survey Scientific Investigations Report 2021–5129, 58 p., https://doi.org/10.3133/sir20215129.
ISSN: 2328-0328 (online)
Study Area
| Publication type | Report |
|---|---|
| Publication Subtype | USGS Numbered Series |
| Title | Geology and hydrogeology of the Yucaipa groundwater subbasin, San Bernardino and Riverside Counties, California |
| Series title | Scientific Investigations Report |
| Series number | 2021-5129 |
| DOI | 10.3133/sir20215129 |
| Edition | Version 1.0: January 19, 2022; Version 1.1: May 18, 2022 |
| Publication Date | January 19, 2022 |
| Year Published | 2022 |
| Language | English |
| Publisher | U.S. Geological Survey |
| Publisher location | Reston, VA |
| Contributing office(s) | California Water Science Center, Geology, Minerals, Energy, and Geophysics Science Center |
| Description | Report: ix, 58 p.; Data Release |
| Country | United States |
| State | California |
| County | San Bernardino County, Riverside County |
| Other Geospatial | Yucaipa groundwater subbasin |
| Online Only (Y/N) | Y |