

Substrate Particle-Size Distribution, Dissolved-Oxygen Concentrations, Sediment Temperatures, and Groundwater/Surface-Water Exchange in Shoreline Spawning Habitat of Sockeye Salmon (Oncorhynchus nerka) of Lake Ozette, Western Washington
Links
- Document: Report (3 MB pdf) , HTML , XML
- Data Release: USGS data release - Dissolved Oxygen, temperature, particle-size distribution, and groundwater flux in the nearshore of Lake Ozette, WA, October 2018 to May 2019
- Download citation as: RIS | Dublin Core
Abstract
Sockeye salmon (Oncorhynchus nerka) spawn at beaches along Lake Ozette’s shoreline and within its tributary streams including Umbrella Creek and Big River in western Washington. The tributary-spawning aggregate of the Lake Ozette sockeye salmon population has been increasing from very low abundance through hatchery supplementation, but the beach-spawning aggregate has decreased from the early 20th century resulting in an Endangered Species Act listing of the Lake Ozette sockeye salmon population as “Threatened” in 1999. Among several factors inhibiting the recovery of beach spawning sockeye salmon, the quality of spawning habitat in beaches and low dissolved-oxygen concentrations in beach gravels during incubation were identified as important limitations on the recovery of this population. Proliferation of primarily native near-shore vegetation during the 20th century, as a result of alterations in the lake hydroperiod, accompanied by fine-grained sediment deposition was hypothesized as a potential cause of low rates of water circulation and dissolved-oxygen concentrations in beach spawning gravels. The potential for shoreline vegetation removal to restore spawning habitat function, including dissolved-oxygen concentrations, was evaluated in this report by measuring continuous dissolved-oxygen concentrations with data-logging dissolved-oxygen sensors, by measuring particle-size distribution of beach sediment, and by estimating groundwater/surface-water exchange using vertical sediment temperature profiles at three shoreline sampling areas. These sampling areas included an area of current spawning devoid of shoreline vegetation, an adjacent vegetated area, and an adjacent treatment area where a 3-meter-wide swath of existing above-ground vegetation was removed in 2018 prior to the study. Substrate particle-size distributions, dissolved-oxygen concentrations, sediment temperatures, and groundwater/surface-water exchange were compared among the three shoreline sampling areas. Median grain size (D50) of sediment varied at sampling stations from medium sand fine to coarse gravel. The coarsest sediment generally occurred in the current spawning area that was devoid of vegetation; whereas the vegetated shoreline and the shoreline where above-ground vegetation was removed were characterized by finer sediment. Removal of above-ground vegetation resulted in increased D50 at the most shoreward station at the treatment sampling area from 8.2 millimeters in 2018 to 21.6 millimeters in 2019 but other changes in substrate particle-size distribution in the treatment area were negligible. Increased grain size from 2018 to 2019 at this site suggests that while higher wave energy was allowed to mobilize sediment in the backshore area of the treatment area and winnow fine sediment during the winter, residual root structure in the treatment area may have limited the ability of wave energy to mobilize sediment after removal. During the November 2018 to March 2019 incubation period for sockeye salmon, dissolved-oxygen concentrations at the depth of sockeye salmon egg pockets (15–25 centimeters) within all three shoreline sampling areas were less than 1 milligram per liter throughout the deployment time (October 2018—May 2019) and below the threshold to sustain sockeye salmon embryo development (3 milligrams per liter). In addition, the similarity of dissolved-oxygen concentrations among all three shoreline sampling areas indicates that above-ground vegetation removal did not increase subsurface dissolved-oxygen concentrations. Groundwater/surface-water exchange measured from sediment temperature profiles were variable both within and across shoreline sampling areas. At the most lakeward stations, groundwater discharge to the lake ranged from 0.25 to 0.007 meter per day and was highest at the control station and lowest at the vegetated station. However, in general, the differences in groundwater/surface-water exchange across the three shoreline sampling areas were negligible. Collectively, these results suggest the process of removing above-ground vegetation had little effect on subsurface dissolved-oxygen concentrations and groundwater/surface-water exchange during the study period, but limitations of the study design, including retention of below-surface root cohesion after above-ground vegetation removal, too narrow of a band of vegetation removal, and a limited duration of the monitoring period, may have prevented wave energy from winnowing fine-grained sediment along the shoreline and altering subsurface dissolved-oxygen concentrations during the study period. Response of the substrate particle-size distribution, groundwater/surface-water exchange, and subsurface dissolved-oxygen concentrations to shoreline vegetation removal that includes root-zone removal over a larger extent and longer periods than the 7-month study period from October 2018 to May 2019, however, remain unknown and warrant further investigation.
Introduction
Lake Ozette, located near the northwestern corner of the Olympic Peninsula in western Washington (fig. 1), is the third largest natural lake in Washington and the largest lake with an unregulated outlet in the State. Lake Ozette provides spawning and rearing habitat for several species of anadromous salmonids including sockeye salmon (Oncorhynchus nerka). Historical run sizes of Lake Ozette sockeye salmon may have approached 50,000 fish (Blum, 1988), but considerable uncertainty in this estimate exists because only harvest data, but not escapement data, were collected prior to 1977 (Haggerty and others, 2009). As the population of Lake Ozette sockeye salmon declined through the 20th century, harvest records, which peaked at 17,500 fish in 1949 (Washington Department of Fisheries, 1955), decreased to zero fish by 1974 and have remained at less than 100 fish through the present (Haggerty and others, 2009). Although hatchery supplementation of sockeye salmon in Lake Ozette occurred episodically from 1936 to 1983 using Baker Lake and Lake Quinault broodstock, the most recent efforts to rebuild Lake Ozette sockeye salmon populations using native broodstock began with the establishment of the Umbrella Creek Hatchery in 1983 (Haggerty and others, 2009).
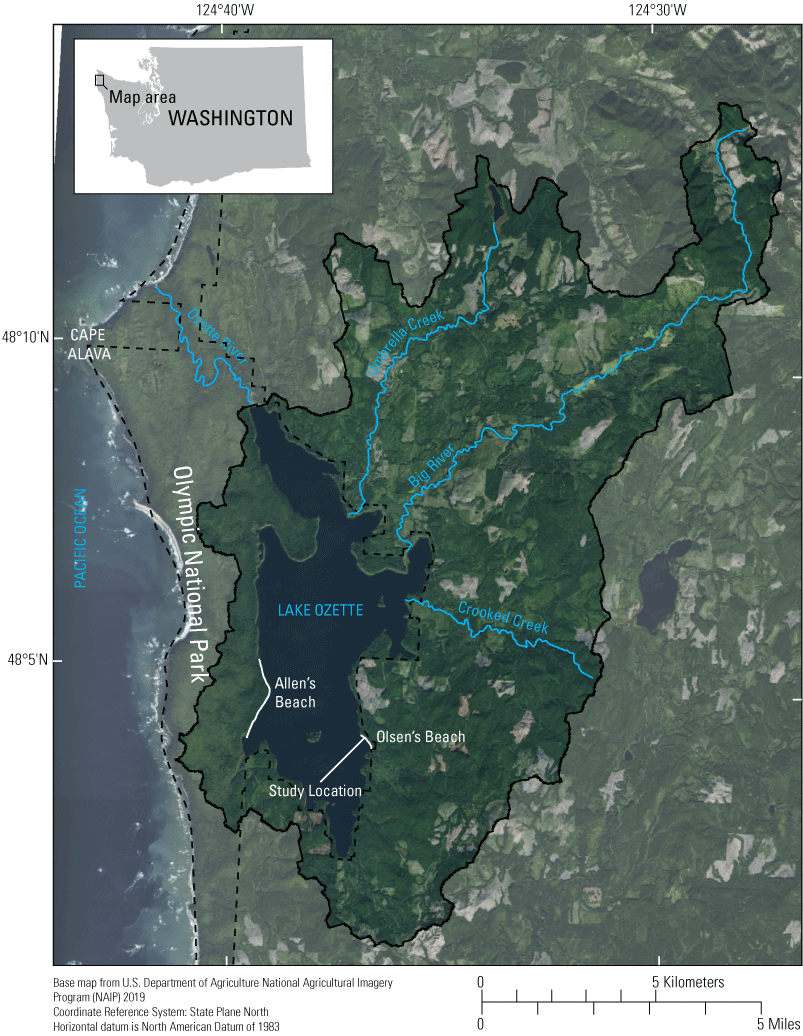
Preferred spawning locations of the Lake Ozette sockeye salmon, at Allen’s and Olsen’s Beaches, as well as the location of Olsen’s Beach sampling areas, Lake Ozette, Clallam County, western Washington.
The present Lake Ozette sockeye salmon population is comprised of two spawning aggregates— a beach spawning component and a tributary spawning component. Beach spawning in Lake Ozette is distributed from the seasonally inundated upper littoral zone, down to a depth of 10 meters (m) or more and presently only occurs within a fraction of its historical extent (Haggerty and others, 2009). At present (2019), most beach-spawning sockeye salmon spawn beginning in early November at two locations in Lake Ozette—Allen’s Beach and Olsen’s Beach along Lake Ozette’s eastern and western shores, respectively, in Olympic National Park. Tributary spawning sockeye salmon spawn in Umbrella Creek and Big River, which primarily lie outside of Olympic National Park. Although there is consensus on the historical presence of beach spawning sockeye salmon in Lake Ozette, there are conflicting reports on the historical presence of tributary spawning sockeye salmon in Lake Ozette basin (Haggerty and others, 2009). The first occurrence of sockeye salmon spawning in Lake Ozette tributaries was documented in 1988 following hatchery supplementation from the Umbrella Creek Hatchery.
Physical, biological, and water-quality conditions, including marine survival, predation of returning adults and rearing juveniles, and spawning habitat quality, have contributed to the decline of Lake Ozette sockeye salmon populations and limit population recovery (Haggerty and others, 2009). The availability of suitable spawning substrate and adequate subsurface dissolved-oxygen concentrations during incubation have been identified as important constraints on the quality of spawning habitat for the recovery of the beach spawning sockeye salmon in Lake Ozette (Brooks, 2010). During incubation, sockeye salmon require a dissolved-oxygen concentration of at least 3 milligram per liter (mg/L) (Foerster, 1968), but Brooks (2010) reported that only a fraction of sampling stations met this criterion at locations in the Lake Ozette shoreline during 2008–09 through the duration of the November–March incubation period. All sampled stations that exceeded the 3 mg/L dissolved-oxygen criterion were in areas of contemporary beach spawning, but some stations at these locations did not meet this concentration (Brooks, 2010). Although historical beach spawning by sockeye salmon was likely more extensive along Lake Ozette’s shoreline, contemporary observations of beach spawning have been limited to Olsen’s Beach and Allen’s Beach suggesting changes in the hydrologic and geomorphic conditions that support spawning habitat.
Beach spawning habitat has been limited by the availability of suitable spawning substrate and the occurrence of fine-grained sediment, flow through and dissolved oxygen in spawning gravels, and encroachment of shoreline vegetation. Some of the earliest reported shoreline surveys of Lake Ozette reported variable sediment containing a mixture of silt, sand, gravel, and cobbles and the encroachment of native grasses (Carex spp.) and shrubs, predominantly sweet gale (Myrica Gale), which reduced the shoreline area suitable for spawning (Bortleson and Dion, 1978). Ritchie and Bourgeois (2009) measured an overall 56-percent decrease in the area of unvegetated beaches in Lake Ozette from 1950 to 2003 from delineation of shoreline vegetation in aerial orthoimagery, but changes in unvegetated beach area were not uniform throughout the Lake. Decreases of 67 and 66 percent in unvegetated shoreline were measured at Allen’s and Olsen’s Beaches whereas the vegetated shoreline increased at some creek deltas, including Umbrella Creek due to increased sediment flux during the 20th century (Ritchie and Bourgeois, 2009).
Additional changes to Lake Ozette during the 20th century including removal of large wood from Lake Ozette’s outlet and increased fine-grained sediment deposition may have contributed to degradation of shoreline spawning habitat (Haggerty and others, 2009; Ritchie and Bourgeois, 2009). Sediment accumulation in Lake Ozette from 1960 to 1980 increased by two to eight times above long-term background rates (Ritchie and Bourgeois, 2009). Although the largest sediment accumulation rates were measured at the deltas of the two largest tributaries to Lake Ozette—Big River and Umbrella Creek—sediment accumulation increased throughout the lake. Ritchie and Bourgeois (2009) attributed increased sediment production in Lake Ozette basin to timber harvest and road development in the basin. In 1953, 89 percent of the Lake Ozette basin was primary forest and road density was less than 0.5 kilometer per square kilometer. By 2006, road density increased by a factor of six to 3.0 kilometer per square kilometer and 21 percent of the primary forest in Lake Ozette basin remained with most timber harvest and road development prior to 1985 (Ritchie and Bourgeois, 2009). The Ozette River, which serves as the only surface-water outlet of Lake Ozette, was altered during the 20th century through the removal of large wood thus affecting the range and duration of lake levels (Herrera Environmental Consultants, 2006). At low and moderate lake stage, the first riffle of the Ozette River forms the hydraulic control of outflow to the lake; however, at high stages, outflow is controlled by the capacity and hydraulic roughness of the Ozette River, which are affected by presence of large wood jams (Herrera Environmental Consultants, 2005). The removal of large wood in the Ozette River increased channel capacity and reduced hydraulic roughness of the outlet to Lake Ozette contributing to a decrease in the frequency and duration of high lake levels (Herrera Environmental Consultants, 2005). Decreased lake levels resulted in the loss of spawning habitat in the upper beach of the Lake Ozette shoreline and allowed for the encroachment of vegetation, which reduced wave energy that promoted fine-grained sediment deposition further degrading spawning habitat along the Lake Ozette shoreline. Collectively, these changes have contributed to the deposition of fine-grained sediment in nearshore substrate and encroachment of vegetation, which decreases the hydraulic conductivity of nearshore sediments and the circulation of oxygenated water within them.
As part of an effort to rebuild the beach spawning aggregate of the Lake Ozette sockeye salmon population, the National Park Service, in cooperation with Lake Ozette sockeye salmon fishery co-managers, are investigating approaches to increase the area of and restore the function of beach spawning habitat. One approach under consideration includes localized shoreline vegetation removal at historical spawning areas that became vegetated during the 20th century. The goal of vegetation removal was to (1) increase the wave energy available during winter storms when lake stage is high to entrain and remove fine-grained sediment from spawning gravels and (2) reduce root cohesion that retains fine-grained sediments within spawning gravels. Removal of fine-grained sediment was hypothesized to increase porosity of spawning gravels and promote groundwater and hyporheic exchange that sustains dissolved-oxygen concentrations necessary for incubating salmon embryos. In order to assess the effect of vegetation removal on enhancing dissolved-oxygen concentrations in beach sediments, a 3-meter-wide swath of above-ground vegetation was removed at a historical spawning area at Olsen’s Beach along the eastern shore of Lake Ozette in 2018. The particle-size distribution of sediment, shallow subsurface dissolved-oxygen concentrations, and groundwater/surface-water exchange was estimated at the vegetation removal sampling area and compared to an adjacent control sampling area where vegetation was not present before the above-ground vegetation removal and sockeye salmon currently spawn and a second control sampling area where vegetation was present and remained in place for the period of the study.
Purpose and Scope
This report describes the substrate particle-size distribution, sediment temperatures, shallow subsurface dissolved-oxygen concentrations of beach sediments, and groundwater/surface-water exchange measured at Olsen’s Beach in Lake Ozette from October 2018 to May 2019. These data were collected to assess the effects of a potential strategy for improving the function of beach spawning habitat of sockeye salmon along Lake Ozette’s shoreline. Sediment, dissolved oxygen, and groundwater/surface-water exchange data were collected in three sampling areas of the shoreline—(1) unvegetated shoreline currently used for spawning, (2) vegetated shoreline not known to be used for spawning by sockeye salmon, and (3) shoreline where vegetation was manually removed in autumn 2018. Data from each of the sampling areas measured in October 2018 to May 2019 were compared to determine if the vegetation removal in historical sockeye salmon spawning areas of Lake Ozette decreased fine-grained sediment, increased dissolved-oxygen concentrations above levels needed to support the successful incubation of sockeye salmon embryos, and improved groundwater/surface-water exchange. Data were collected at Olsen’s Beach on the eastern shoreline of Lake Ozette, which is one of two areas of Lake Ozette’s shoreline that currently supports sockeye salmon spawning.
Description of Study Area
Lake Ozette is located in the northwestern part of the Olympic Peninsula of Washington State and has a 30.6-square kilometer (km2) surface area, which makes it the third largest natural lake and largest lake with an unregulated outlet in the State (fig. 1). The only surface-water outlet of Lake Ozette is the Ozette River, which begins at the northern end of the lake at an elevation of 10.3 m and maintains a low-gradient (0.0014 m/m), sinuous path for 8.5 km to its outlet at the Pacific Ocean at Cape Alava. The lake drains a 179-km2 area of the coastal plain and foothills of the Olympic Peninsula with a maximum elevation of 591 m at the summit of Sekiu Mountain. Lake Ozette is entirely contained within Olympic National Park, but 75 percent of the drainage basin draining to Lake Ozette is privately owned with the rest publicly owned under the management of Olympic National Park (13 percent) and Washington State Department of Natural Resources (12 percent; Herrera Environmental Consultants, 2006). Except for the Lake Ozette basin in Olympic National Park, the privately owned land and public land managed by Washington Department of Natural Resources is mostly managed as industrial timberland. The largest tributaries to Lake Ozette include Big River, Crooked Creek, and Umbrella Creek, which have contributing drainage basin areas of 59.1, 30.9, and 29.9 km2, respectively. Lake Ozette has a mean depth of 40 m and a maximum depth of 98 m (Dlugokenski and others, 1981). Mean annual surface-water elevation of Lake Ozette measured from 1982 to 1994 and 1998 to 2003 was 10.3 m and ranged from a minimum of 9.4 m to a maximum of 12.6 m (Herrera Environmental Consultants, 2006); the mean annual range in surface-water elevation during this time period was 2.3 m. The temperate, maritime climate of Lake Ozette is characterized by warm, dry summers and cool, wet winters where most precipitation in the basin occurs as rainfall. Mean annual precipitation averaged over the Lake Ozette basin from 1980 and 2010 was 260 centimeters (cm) (PRISM Climate Group, 2014) but was not distributed evenly throughout the year with the highest mean monthly precipitation in November (41 cm) and the lowest mean monthly precipitation in July (5.7 cm). Surface-water elevation of Lake Ozette fluctuates in response to seasonal changes in precipitation with median monthly lake levels highest in December after the onset of the autumn and winter rainy season and lowest in September following the prolonged, dry summer (Haggerty and others, 2009). Mean annual precipitation in water year 2019 over the study period was 210 cm (81 percent of the 1980 to 2010 mean annual precipitation). During the winter, winds are predominantly from the south and the west, which results in increased wave energy imparted on the northern and eastern shores of Lake Ozette.
Lake Ozette and its tributaries support several populations of native and non-native, introduced fish that have both anadromous and resident life histories. Anadromous fish that spawn and rear within Lake Ozette include native salmonids, such as sockeye salmon (Oncorhynchus nerka), coho salmon (O. kisutch), chum salmon (O. keta), Chinook salmon (O. kisutch), steelhead (O. mykiss), and sea-run cutthroat trout (O. clarkii). The population of sockeye salmon within Lake Ozette was designated as an Evolutionary Significant Unit (ESU) in 1999 under the Endangered Species Act by NOAA-NMFS (National Oceanic and Atmospheric Administration, National Marine Fisheries Service). Kokanee, a non-anadromous, resident form of sockeye salmon (O. nerka) spawn in tributary streams of the Lake Ozette (Biological Review Team, 2003) but are not included in the Lake Ozette sockeye salmon ESU.
Study Design and Methods
Three sampling areas within a 50-meter-long section of Olsen’s Beach on the eastern shore of Lake Ozette (fig. 1) were selected for substrate particle-size distribution, continuous monitoring of dissolved-oxygen concentrations in shallow sediment, and monitoring of groundwater/surface-water exchange using vertical sediment temperature profiles during the 2018–19 sockeye salmon incubation period. This 50-m section of Olsen’s Beach was part of a 130-m section at the northern extent of Olsen’s Beach that was identified as a concentrated area of spawning by Haggerty and others (2009) during 1999, 2000, and 2001. Predominantly southerly and westerly winds during the winter rainy season impart higher wave energy on the northern and eastern shores of Lake Ozette, like Olsen’s Beach, relative to other aspects of the Lake Ozette shoreline. The three areas were near each other to minimize differences in external influences that could impact each area’s substrate particle-size distribution, dissolved-oxygen concentration, and groundwater/surface-water exchange. Two areas were unaltered and served as controls within our analyses and the third area, from which shoreline vegetation was removed, served as a treatment area. An unvegetated, gravel-bedded section of the shoreline at the southernmost extent of the study area, which is currently used by sockeye salmon for spawning, was selected to represent the targeted post-vegetation removal condition and is referred to as the spawning control. A second shoreline area at the northernmost extent of the study area, which was referred to as the vegetation control (VC), was typical of most of the shoreline of Olsen’s Beach and was not used by spawning sockeye salmon. This area was vegetated with shrubs, sedges, and grasses at the foreshore but was unvegetated at high elevations at the backshore, which was typically inundated only during high lake levels of the winter months. A third area, referred to as the vegetation treatment (TR) area, was located between the spawning control and vegetation control areas and had similar vegetation to the vegetation control area prior to October 2018 when all vegetation, including shrubs, sedges, and grasses, was manually removed from a 3-meter length of shoreline. All above-ground vegetation was removed from this area and an attempt was made to remove shallow roots but some roots persisted after vegetation removal with some new vegetation observed in spring 2018 during the retrieval of instrumentation. Like the vegetation control area, spawning has not been documented in the vegetation treatment area.
Substrate particle size, subsurface dissolved oxygen, and sediment temperatures in each of the three sampling areas were measured at four sampling stations arranged to capture longitudinal and lateral changes in these parameters (fig. 2). The four stations were consistently oriented within each sampling area with station 1 most lakeward, stations 2 and 3 were approximately 10 m closer to shore and about 3 m apart from each other, and station 4 was highest up on the lakebed and about 20 m from station 1. Prefixes were attached to each station name for the spawning control (SC), vegetation treatment (TR), and vegetation control areas (VC). Instrumentation was deployed prior to spawning when the lake level was low; at the time of deployment, only station 1 was submerged, with stations 2 and 3 emergent and within partially saturated sediments, and station 4 completely emergent within unsaturated sediments. During the winter incubation period, all areas became progressively submerged as the lake level rose. Four stations were deployed in each of the three shoreline areas, resulting in a total of 12 stations in the Olsen’s Beach study area where substrate particle-size distribution, dissolved-oxygen concentrations, and sediment temperatures were determined. At all sampling areas, instrumentation to measure dissolved oxygen and sediment temperature was deployed and particle-size distribution was characterized prior to sockeye salmon spawning season in undisturbed beach sediment.
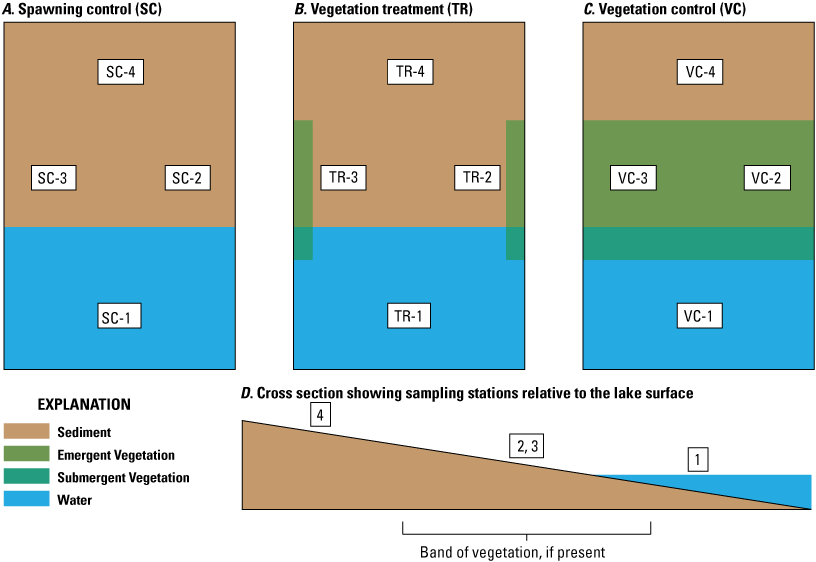
Olsen’s Beach sampling areas. During October 2018, four stations were deployed in each sampling area where substrate particle-size distribution, dissolved oxygen, and sediment temperature profiles were determined. Water level rose during autumn and winter progressively inundating shoreward stations.
Particle-Size Distribution
The particle-size distribution of the upper 25 cm of substrate was characterized at each of the 12 sampling stations in October 2018 and May 2019 before and after the 2018–19 sockeye salmon incubation period and winter high-lake levels, respectively. At each station, a bulk sediment sample integrating the upper 25 cm of sediment was collected at about 1 m from the dissolved oxygen and subsurface-water temperature sensors to characterize a similar sediment environment. Sediment collection took place at a different location near each station on the first and last day of the sensor deployments; therefore, disturbance of sediment collection on shallow subsurface flow of water at the sensors was assumed negligible. At emergent vegetation stations, the top 25 cm of substrate was collected using a shovel and was transferred into a bucket. Particle sizes larger than 8 millimeters (mm) were sieved and weighed in the field, whereas smaller particles were collected for particle-size distribution analysis at the U.S. Geological Survey–Cascades Volcano Observatory (USGS–CVO). Results from the field and laboratory-measured particle-size distributions were combined to estimate the complete particle-size distribution at each station. Bulk-sediment samples were collected at submergent vegetation stations using a McNeil sampler inserted into the lakebed (McNeil and Ahnell, 1964) from which sediment was extracted by hand to a depth of 25 cm below the lakebed and residual water containing suspended sediment was sampled. Particle-size distribution of sediment larger than 8 mm was sieved and weighed in the field and sediment less than 8 mm was sent to the USGS–CVO sediment laboratory for particle-size distribution analysis. The volume of residual water in the McNeil sampler was measured and its suspended-sediment concentration was analyzed at USGS–CVO. All particle-size data are available in a companion data release (Sheibley and others, 2021).
Dissolved-Oxygen Concentrations
Dissolved-oxygen concentrations in subsurface sediments were recorded hourly from October 2018 to May 2019 using a submersible optical dissolved-oxygen sensor (HOBO U26-001, Onset Computer Corp.) at each of the 12 sampling stations. Dissolved-oxygen sensors were housed inside 50-cm long sections of slotted polyvinyl chloride (PVC) well screen that was capped at both ends and installed into the lakebed (fig. 3A). Part of the well screen was sealed with PVC tape so that the slotted part of the screen exposed to the subsurface environment was limited to a 10-cm interval from 15 to 25 cm below the lake surface. This open interval corresponded to typical depths of egg pockets within gravel nests called redds formed by sockeye salmon spawning (Brooks, 2010), and it was assumed that water flowing through the open interval of the housing of deployed sensors was indicative of subsurface conditions at this depth. The top of each sensor housing was installed flush with the sediment-water interface by removing lakebed sediment using a hand auger. The top of the sensor housing had a screwcap to allow access to the sensor and remove it if needed during the deployment.
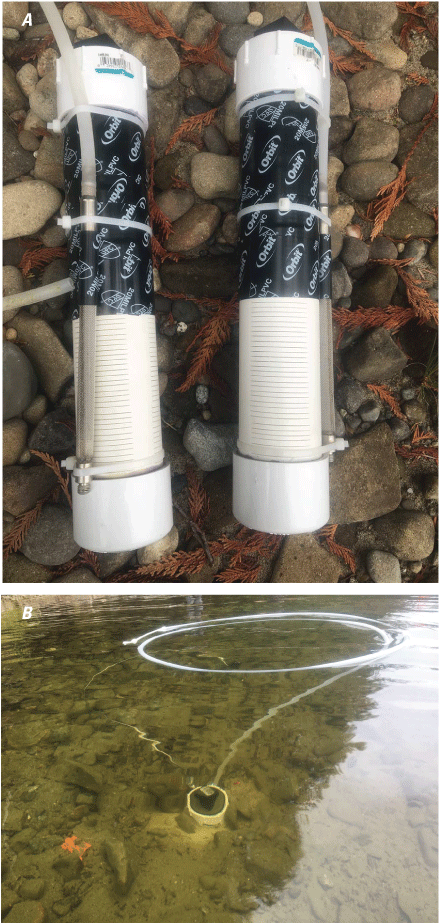
A, polyvinyl chloride (PVC) housing dissolved-oxygen sensors with attached stainless-steel screens used to sample in situ subsurface dissolved oxygen and B, housing and sample tubes installed at a sampling station. A peristaltic pump was attached to the plastic tubing to sample in situ subsurface water from stainless steel screen. [Photographs by Richard W. Sheibley, U.S. Geological Survey, 2018].
During the October 2018–May 2019 deployment, continuous dissolved-oxygen concentrations recorded by submersible optical dissolved-oxygen sensors were independently field checked using a field-calibrated sonde. The sonde also recorded other field parameters including water temperature, pH, and specific conductance. Water adjacent to the submersible optical dissolved-oxygen sensors was sampled through a 15-cm long sample tip made of rigid stainless-steel screen (0.14 mm mesh size) attached to a 0.9–1.2-meter section of polypropylene tubing and secured to the outside of the PVC well housings using a pipe clamp prior to installation into the lakebed (fig. 3B). A short flexible piece of tubing was attached to the end of the polypropylene tubing and sealed between field checks. Field checks took place at the beginning, middle, and end of the deployment by slowly pumping water from the polypropylene sample tubes using a field peristaltic pump at a rate of less than 100 milliliter per minute. The subsurface dissolved oxygen was measured using a field calibrated sonde (Aqua Troll 600; In Situ, Inc.) equipped with a low-volume flow through chamber to measure dissolved-oxygen concentrations in situ, with minimal disturbance. Dissolved-oxygen readings were recorded after several well volumes were removed and readings on the sonde were stable (within ±3 percent). All continuous dissolved oxygen and water temperature data from the submersible oxygen sensors are provided in a companion data release (Sheibley and others, 2021).
Sediment Temperature Monitoring and Modeling
Sediment temperature was analyzed to assess if thermal conditions at the locations of dissolved-oxygen measurements were adequate for salmon egg development. In addition, subsurface temperature profiles were determined at the sampling stations to estimate groundwater/surface-water exchange rates using a low-cost temperature rod (Briggs and others, 2014; Naranjo and Turcotte, 2015; Rosenberry and others, 2016). Temperature rods were constructed from 50 to 100 cm long piece of 1.9-cm plain galvanized pipe and four to five small temperature sensors (iButton model # DS1922L) (figs. 4A–D). Each section of pipe was crimped at the base of the temperature rod and four to five horizontal slots (about 0.6-cm thick) were cut into the pipe at 1, 4, 7, and 11 cm from the top of the temperature rod using a table router. For longer rods, an additional slit at 50 cm was included to better determine groundwater temperatures. Briggs and others (2014) and Rosenberry and others (2016) demonstrated that temperature sensors at these locations are optimal for modeling a range of groundwater exchange rates in aquatic systems. The pipe was filled with spray insulation to minimize thermal conduction within the pipe and a cavity excavated from each one of the horizontal slits to house the temperature sensors. Each temperature sensor was programmed to record temperature at 1-hour intervals and inserted into the horizontal slits of the pipe and sealed with silicone caulk to make them waterproof. The silicone was allowed to completely dry prior to deployment and a length of PVC tape was placed over the pipe where the horizontal slits were located to provide protection when inserting the rods into the lakebed (fig. 4D). Temperature rods were directly driven into lakebed sediments using a small sledgehammer so that the uppermost temperature sensor was installed to a depth of 1 cm. At some stations where coarse substrate prevented direct temperature-rod installation, a pilot hole was first created by driving a 1.9-cm diameter solid steel rod into the lakebed first before insertion of the temperature rod.
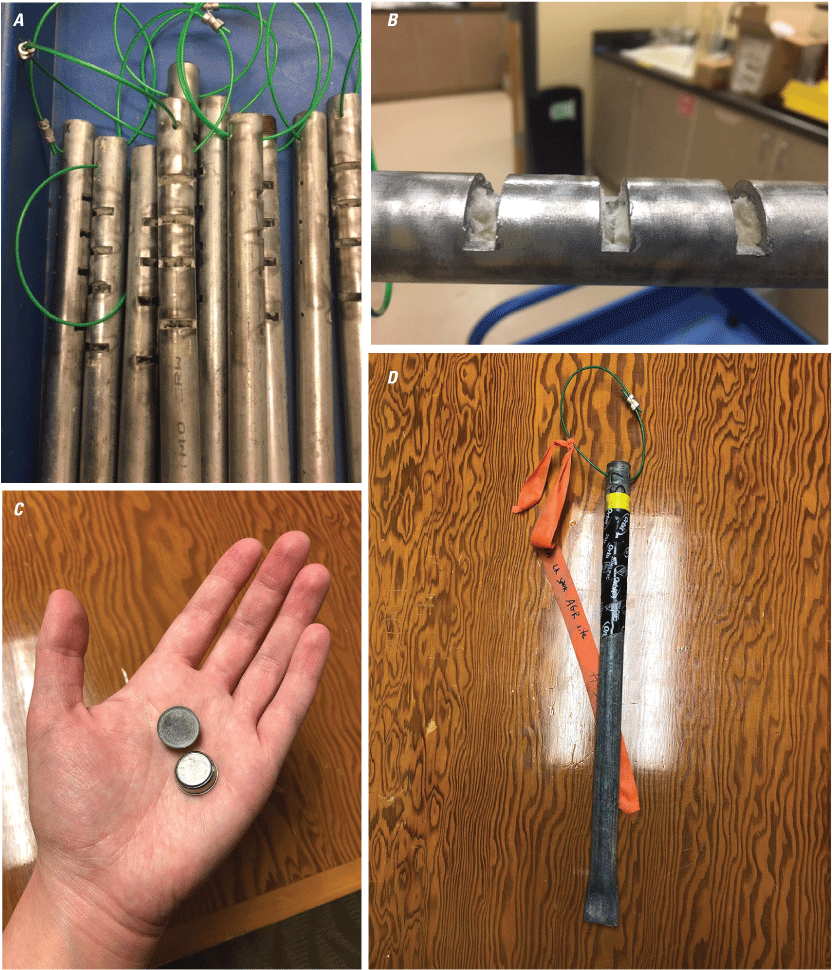
A, temperature rods prior to inserting iButton temperature loggers; B, close-up of slots in temperature rods where iButtons were placed; C, iButtons; and D, finished temperature rod prior to installation in the lakebed. [Photographs by Richard W. Sheibley, U.S. Geological Survey, 2018].
The deployment period for the temperature rods was shorter than the time period for dissolved oxygen because the internal memory of the temperature loggers reached capacity on April 9, 2019, and no further data were collected. During the final site visit in May 2019, the temperature rods were removed from the lakebed and returned to the office where sensors from each rod were removed and temperature data were downloaded. Prior to modeling the data, the temperature time-series sets were limited to the period when each station was fully submerged, as determined by the dissolved-oxygen data recorded at each sampling station.
These vertical profiles of subsurface temperatures were used to fit heat-flux models to infer rates of groundwater/surface-water exchange at each station. VS2DH heat-flux models (Healy and Ronan, 1996) that solve a one-dimensional heat-flux equation within saturated sediment were developed using the U.S. Geological Survey program, 1DTempPro V2 (https://water.usgs.gov/ogw/bgas/1dtemppro/), which provides a graphical user interface to run the VS2DH model allowing users to simulate subsurface-temperature profiles to infer groundwater-exchange rates (Koch and others, 2016). Input to each model included vertically distributed temperature data from at least three different depths measured by temperature rods and estimates of physical and thermal properties of saturated sediment obtained from published values (Irvine and others, 2020) and are provided in table 1. The 1DTempPro model did not automatically estimate variable exchange rates; therefore, we assumed constant groundwater exchange during each model simulation and limited the temporal extent of each model simulation to 5- to 7-day periods to reduce the chance of violating the assumption of constant exchange flux. All 1DTempPro model results were published in a data release (Sheibley and others, 2021). All simulations estimated the specific discharge in meters per day (m/d) from the field-collected sediment-temperature data. The 1DTempPro model domain defines upwelling groundwater, flow into the lake, as a negative flux, and downwelling, flow into the lakebed, as a positive flux.
Table 1.
Sediment parameters used for all 1DTempPro model simulations based on values published for a typical sand (Irvine and others, 2020).[W, Watt; m, meter; m3, cubic meter; °C, degrees Celsius; J, joule]
Data Quality and Quality Assurance
All field deployed sensors, including iButton temperature sensors and HOBO dissolved-oxygen/temperature sensors, were calibrated or checked prior to deployment. The calibration of iButton temperature sensors installed within temperature rods was verified prior to deployment using a five-point temperature calibration using a NIST-certified thermometer (Wagner and others, 2006; Conn and others, 2017). Temperature sensors that exceeded a ±0.2 degrees Celsius (°C) tolerance compared to the NIST thermistor were not used in the deployments. HOBO dissolved-oxygen sensors were either calibrated in the laboratory or in the field before the deployment depending on their availability. Seven of the 12 dissolved-oxygen sensors were calibrated in the laboratory and the remaining 5 were calibrated in the field using a similar procedure because they were sent to the manufacturer for service and battery replacement and were not available for laboratory calibration prior to the deployment.
For the laboratory calibration, seven dissolved-oxygen sensors were calibrated according to the manufacturer’s specifications, which included installation of a fresh sensor cap and calibrating of the sensor in saturated air and within a zero dissolved-oxygen solution. Dissolved-oxygen sensor calibrations were performed as closely to the field deployments as possible to ensure that expiration of the sensors, which occurs 7 months after their initial calibration according to the manufacturer, did not occur during the study deployment. After calibration, the dissolved-oxygen sensors were placed in a continuously aerated bucket along with a laboratory calibrated sonde (Aqua Troll 600) for several days to test accuracy (against the calibrated sonde) and sensor variability (when compared against each other). The remaining five dissolved-oxygen sensors that were sent to the manufacturer for service were tested in the field in a similar manner to the seven laboratory-calibrated sensors, except the bucket was not aerated, and the test only lasted about 1 hour before deployment.
Subsurface Particle-Size Distribution
Particle-size distributions of sediment collected from the upper 25 cm of the lakebed were estimated for each of the 12 sampling stations in October 2018 and May 2019. Statistics describing these particle-size distributions, including median (D50) and 90th percentile (D90), are presented in table 2. At each station, measured D50 ranged from medium sand to coarse gravel and D90 was coarse gravel. In general, the finest sediment for each station type (spawning control, treatment, and vegetation control) occurred at stations located farthest from the shore (SC-1, TR-1, and VC-1), and the coarsest sediment occurred at stations closest to the shore (SC-4, TR-4, and VC-4) as measured by both D50, D90, and the percentage of fine-grained sediment less than 4 mm. The change in D50 in the treatment sampling area from October 2018 to May 2019 was less than 3 mm except for at station TR-4 where D50 increased by 14 mm, which was the largest overall increase in D50 at any station; D90 commensurately increased by 18 mm at station TR-4 from October 2018 to May 2019.
Table 2.
Particle-size distribution statistics of upper 25 centimeters of lakebed sediment for each sampling station measured before field deployments in October 2018 and after field deployments in May 2019.[D10, 10th percentile, D50, 50th percentile (median), D90 90th percentile; percent fines, percent substrate finer than 4 mm]
| Station name (fig. 2) |
October 2018 | May 2019 | ||||||
|---|---|---|---|---|---|---|---|---|
| D10 (mm) |
D50 (mm) |
D90 (mm) |
Percentage of fines |
D10 (mm) |
D50 (mm) |
D90 (mm) |
Percentage of fines |
|
| SC-1 | 0.2 | 4.0 | 37.3 | 50.1 | 0.3 | 9.7 | 34.2 | 39.5 |
| SC-2 | 0.3 | 14.7 | 49.2 | 33.1 | 0.3 | 4.5 | 30.0 | 48.2 |
| SC-3 | 0.3 | 16.2 | 44.6 | 33.0 | 0.3 | 7.5 | 46.3 | 44.3 |
| SC-4 | 0.4 | 10.3 | 35.9 | 33.7 | 0.5 | 14.0 | 75.1 | 28.7 |
| TR-1 | 0.1 | 0.6 | 25.8 | 67.4 | 0.1 | 0.4 | 12.8 | 77.1 |
| TR-2 | 0.2 | 0.4 | 12.5 | 77.3 | 0.1 | 0.4 | 14.6 | 82.3 |
| TR-3 | 0.2 | 3.5 | 26.9 | 51.2 | 0.2 | 0.6 | 31.2 | 67.5 |
| TR-4 | 0.3 | 8.2 | 39.9 | 43.5 | 0.6 | 21.6 | 58.0 | 15.8 |
| VC-1 | 0.1 | 0.5 | 24.8 | 66.5 | 0.1 | 1.8 | 27.5 | 58.9 |
| VC-2 | 0.4 | 9.6 | 28.9 | 37.8 | 0.3 | 8.8 | 29.7 | 38.2 |
| VC-3 | 0.3 | 9.8 | 28.8 | 40.9 | 0.3 | 14.8 | 31.4 | 34.3 |
| VC-4 | 0.3 | 7.3 | 36.3 | 43.4 | 0.3 | 15.4 | 30.7 | 32.1 |
Dissolved-Oxygen Concentrations and Other Field Parameters
Dissolved-oxygen sensors were deployed for a 7-month period from October 18, 2018, to May 8, 2019. Prior to deployment, dissolved-oxygen sensors were calibrated in the laboratory or the field depending on the availability of sensors. All laboratory-calibrated dissolved-oxygen sensors were within 0.2 mg/L of the calibrated sonde and 6 of the 7 sensors read within less than 0.1 mg/L of each other, with the 7th sensor always being within 0.2 mg/L of the rest (fig. 5). Field-calibrated sensors showed similar results to the laboratory-calibrated sensors with all field-calibrated sensors within 0.1 mg/L of each other and within 0.2 mg/L or less of the calibrated sonde after the initial few minutes of the test (fig. 6). All these differences were within the USGS specifications for continuous dissolved-oxygen measurements (±0.3 mg/L; Wagner and others, 2006).
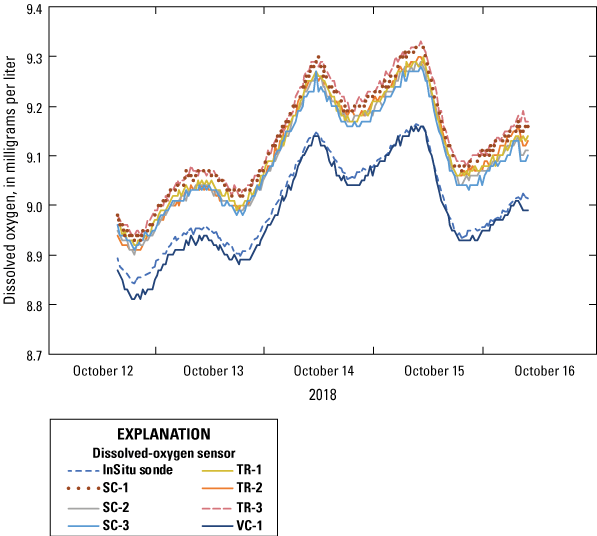
Laboratory tests of Hobo dissolved-oxygen sensors and laboratory calibrated water-quality sonde (in situ). [SC, spawning control; TR, vegetation treatment; VC, vegetation control].
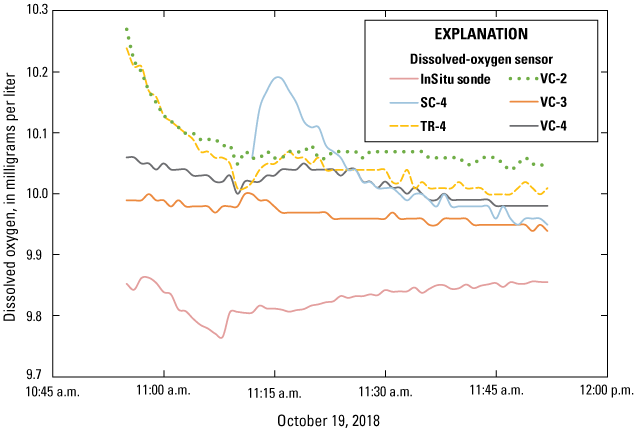
Field tests of Hobo dissolved-oxygen sensors and calibrated water-quality sonde (in situ). [SC, spawning control; TR, vegetation treatment; VC, vegetation control].
During the deployment, three field checks of the dissolved-oxygen sensors were completed—(1) pre-deployment (October 18, 2018, and October 19, 2018), (2) mid-deployment (March 5, 2019), and (3) post-deployment (May 8, 2019). During each of these field checks, subsurface-water temperature, dissolved-oxygen, specific conductance, and pH were determined using a laboratory calibrated sonde. Results from field checks showed that the specific conductance, pH, and temperature of subsurface water was similar across the three sample areas (table 3). Dissolved-oxygen concentrations were low, less than 1.0 mg/L at most stations during the mid- and post-deployment checks. For the initial checks when lake stage was near its annual minimum, adequate water was only present at the most lakeward station of each area (SC-1, TR-1, and VC-1) to obtain a reliable dissolved-oxygen reading, which all exceeded 1.0 mg/L of oxygen. Compared to the subsurface water, lake water was similar in temperature, but much lower in specific conductance, and much higher in dissolved-oxygen concentration (table 3).
Table 3.
Field parameters of shallow groundwater and lake water near Olsen’s Beach, Lake Ozette, Washington.[C, Celsius; uS/cm, microsiemens per centimeter; mg/L, miligram per liter; --, no data collected, not enough water]
| Station name (fig. 2) |
Sample date/time | Sediment temperature (degrees C) |
Specific conductance (uS/cm) |
Dissolved oxygen (mg/L) |
pH |
|---|---|---|---|---|---|
| SC1 | Oct. 18, 2018, 12:45 | 14.2 | 80 | 3.2 | 6.57 |
| SC2 | Oct. 18, 2018, 12:30 | 13.2 | 229 | -- | 6.33 |
| SC3 | Oct. 18, 2018, 12:20 | 13.2 | 179 | -- | 6.18 |
| SC4 | -- | -- | -- | -- | -- |
| TR1 | Oct. 18, 2018, 14:45 | 15.2 | 140 | 1.73 | 6.50 |
| TR2 | -- | -- | -- | -- | -- |
| TR3 | -- | -- | -- | -- | -- |
| TR4 | -- | -- | -- | -- | -- |
| VC1 | Oct. 19, 2018, 10:35 | 11.4 | 106 | 2.96 | 6.51 |
| VC2 | -- | -- | -- | -- | -- |
| VC3 | -- | -- | -- | -- | -- |
| VC4 | -- | -- | -- | -- | -- |
| Lake surface | Oct. 18, 2018, 12:35 | 14.2 | 44 | 10.37 | 7.15 |
| SC1 | Mar. 5, 2019, 10:25 | 6.3 | 137 | 0.61 | 6.78 |
| SC2 | Mar. 5, 2019, 10:42 | 6.2 | 238 | 0.72 | 6.33 |
| SC3 | Mar. 5, 2019, 10:35 | 6.4 | 188 | 0.67 | 6.18 |
| SC4 | -- | -- | -- | -- | -- |
| TR1 | Mar. 5, 2019, 10:55 | 6.3 | 316 | 0.7 | 6.68 |
| TR2 | Mar. 5, 2019, 11:00 | 6.2 | 262 | 0.53 | 6.03 |
| TR3 | Mar. 5, 2019, 11:05 | 6.3 | 355 | 0.61 | 5.88 |
| TR4 | -- | -- | -- | -- | -- |
| VC1 | Mar. 5, 2019, 11:15 | 6.3 | 239 | 0.64 | 6.65 |
| VC2 | Mar. 5, 2019, 11:25 | 5.9 | 299 | 0.91 | 6.01 |
| VC3 | Mar. 5, 2019, 11:35 | 5.8 | 115 | 14.01 | 5.97 |
| VC4 | -- | -- | -- | -- | -- |
| Lake surface | Mar. 5, 2019, 10:10 | 6.5 | 45 | 11.5 | 7.23 |
| SC1 | May 8, 2019, 15:13 | 18.1 | 185 | 0.7 | 6.58 |
| SC2 | May 8, 2019, 15:21 | 17.5 | 188 | 0.54 | 6.35 |
| SC3 | May 8, 2019, 15:31 | 16.2 | 144 | 0.97 | 6.03 |
| SC4 | May 8, 2019, 15:37 | 18.9 | 154 | 6.75 | 6.13 |
| TR1 | May 8, 2019, 15:41 | 17.4 | 269 | 0.83 | 6.52 |
| TR2 | May 8, 2019, 15:49 | 17.5 | 205 | 0.87 | 6.09 |
| TR3 | May 8, 2019, 15:57 | 17.4 | 184 | 0.46 | 5.95 |
| TR4 | -- | -- | -- | -- | -- |
| VC1 | May 8, 2019, 16:07 | 18.3 | 201 | 0.68 | 6.44 |
| VC2 | May 8, 2019, 16:15 | 16.1 | 114 | 0.68 | 5.95 |
| VC3 | May 8, 2019, 16:22 | 17 | 198 | 0.75 | 5.98 |
| VC4 | May 8, 2019, 16:43 | 15.3 | 106 | 3.26 | 5.92 |
| Lake surface | May 8, 2019, 14:57 | 18.9 | 43 | 9.89 | 7.28 |
At the end of the dissolved-oxygen sensor deployment in May 2019, dissolved-oxygen sensors were retrieved from the lakebed and submerged within a single bucket of lake water to perform a post-deployment comparison of all dissolved-oxygen sensors. Sensors continued to record data for several days before measurements were discontinued and data were downloaded. Variability across the sensors was similar to the pre-deployment inter-sensor comparisons. In general, all sensors were within 0.5 mg/L of each other for the duration on the post-deployment inter-sensor comparison (fig. 7). In addition, the temperature readings from the submersible oxygen sensors during this post deployment were within 0.2 °C of each other. When the dissolved-oxygen sensors were downloaded, communication could not be established with the sensor from station TR-4, the sensor highest up the bank at the vegetation treatment area. Therefore, the data in figure 7 only show results from 11 sensors.
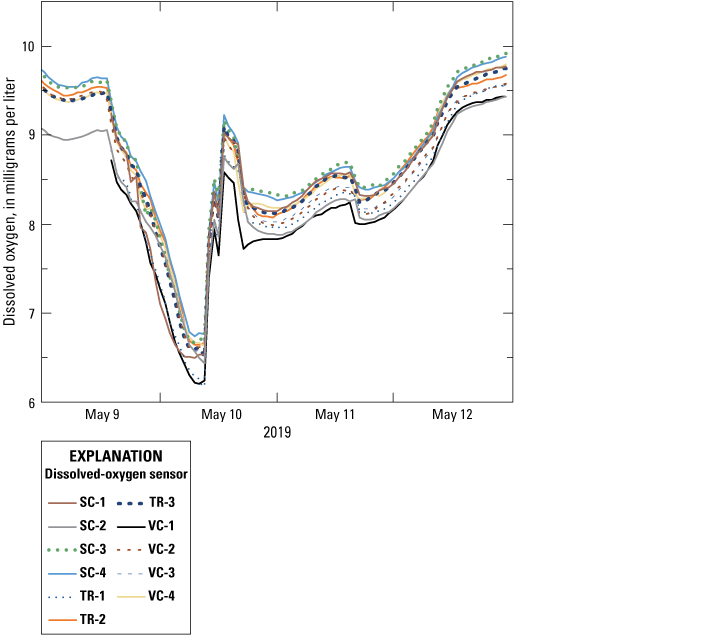
All dissolved-oxygen data after retrieving sensors from the field. [SC, spawning control; TR, vegetation treatment; VC, vegetation control].
These tests collectively demonstrated that the dissolved-oxygen sensors were accurate when compared to the calibrated sonde and had low variability when compared across the individual sensors. Furthermore, the sensors remained accurate throughout the duration of the deployment as shown by the post-deployment comparison. However, all these tests were made under relatively high oxygen conditions; at no time during these tests did the dissolved-oxygen concentration decrease to less than 6.0 mg/L. For reference, the manufacturer specifications for the accuracy of these sensors was ±0.2 mg/L for dissolved-oxygen concentrations as high as 8.0 mg/L.
Temporal changes in dissolved-oxygen concentrations measured from October 2018 to May 2019 were similar within all three sampling areas (fig. 8). Except a short period at the beginning and end of the 7-month deployment, when the lakebed in the vicinity of the sensor was not fully inundated, all 12 dissolved-oxygen sensors recorded 0.0 mg/L of dissolved oxygen for most of the deployment period. This interpretation is supported by the progressive shoreward inundation of the 12 sensors as lake levels rose during the weeks following the October 2018 dissolved-oxygen-sensor installation—for example, dissolved-oxygen sensors at stations SC-1, TR-1, and VC-1 were submerged in the lake upon installation and dissolved-oxygen concentrations decreased to 0.0 mg/L within days or less at these three stations. In contrast, stations SC-4, TR-4, and VC-4, which were the most shoreward and highest elevation stations, were completely dry during installation. At these stations, dissolved-oxygen concentrations decreased to 0.0 mg/L over a period of 2 months as lake stage increased due to increased precipitation and resulting tributary inflow to the lake. At the end of the deployment, dissolved- oxygen sensors recorded increased concentrations at the highest elevation, most shoreward stations that became emergent in the spring. As lake levels began to decline as early as March 2019, stations SC-4, TR-4, and VC-4 became emergent and samples could not be collected due to the lack of subsurface water.
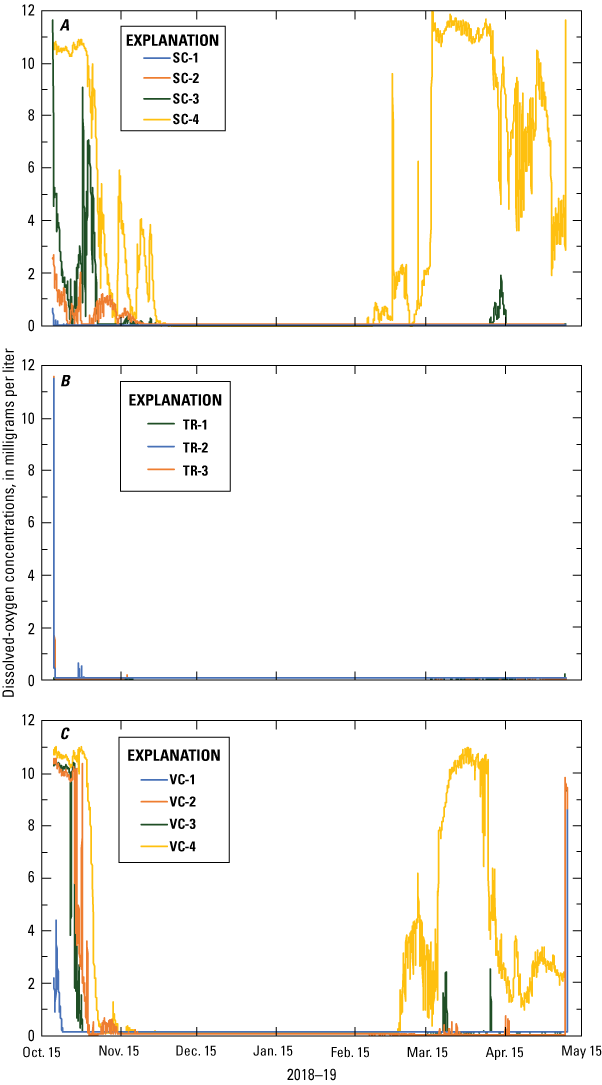
Dissolved-oxygen concentrations at A, spawning control (SC); B, vegetation treatment (TR); and C, vegetation control (VC) sampling areas, Lake Ozette, western Washington, October 2018–May 2019.
Field-check data (table 3), collected during the mid- and post-deployment checks, confirm that in situ dissolved-oxygen data were low, with values ranging from 0.46 to 0.97 mg/L in all cases except at station VC-3 in March 2019 and stations SC-4 and VC-4 in May 2019. These field-check data and pre- and post-deployment inter-sensor comparisons showed that all sensors were within 0.5 mg/L of each other. Field check data and inter-sensor comparisons suggest that the dissolved-oxygen sensors were working correctly and that low dissolved-oxygen concentrations during the October 2018 to May 2019 deployment were representative of subsurface conditions. Collectively, these data show that subsurface dissolved-oxygen concentrations did not exceed the 3 mg/L threshold required for successful egg incubation during most of the deployment period.
Sediment Temperatures
Sediment temperatures, as measured by the dissolved-oxygen sensors, were similar within and across each sampling area (fig. 9). After the initial period of variable saturation, sediment temperatures slowly decreased from about 15 °C in October 2018 to about 8 °C in February–March 2019. In March 2019, temperatures from stations SC-4, TR-4, and VC-4 became more variable due to a decrease in lake stage, and temperatures at the other sensors all slowly increased until the end of the deployment in May 2019. At the end of the deployment, sediment temperatures reached similar levels as the beginning of the deployment at about 15 °C and there was no difference among the spawning control, vegetation treatment, or vegetation control areas.
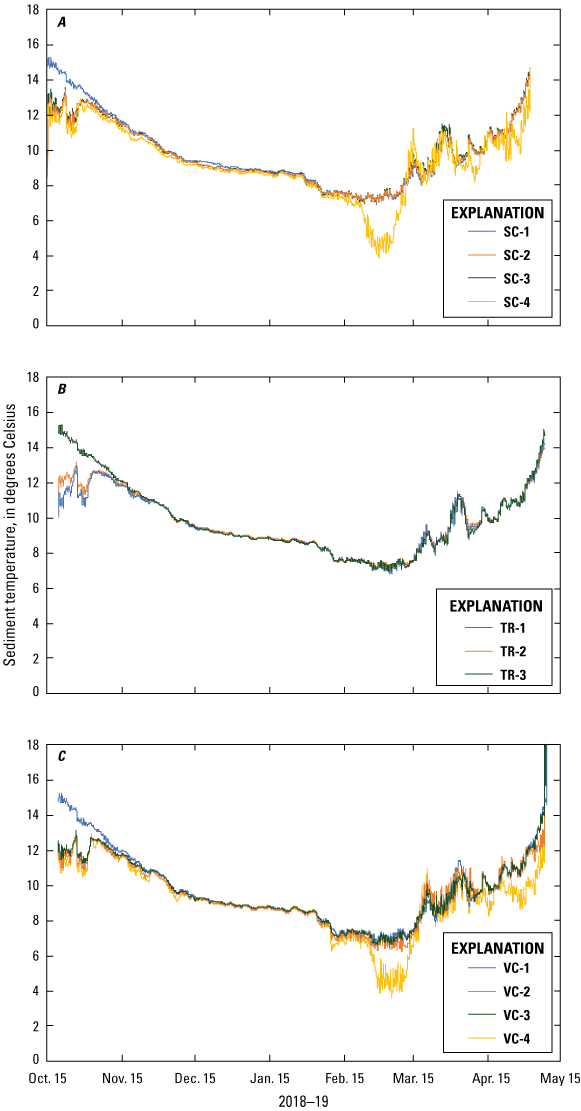
Sediment temperature measured at A, spawning control (SC); B, vegetation treatment (TR); and C, vegetation control (VC) sampling areas, Lake Ozette, western Washington, October 2018– May 2019.
Groundwater/Surface-Water Exchange
Temperature rods were installed at 11 of the 12 sampling stations to measure vertical temperature profiles to estimate groundwater/surface-water exchange. Temperature rods were not installed at station VC-4 due to equipment shortages at the time of installation. At the other 11 stations, continuous vertical temperature profiles were measured at 60-minute intervals. These temperature data were used to calibrate 1DTempPro models to estimate rates of groundwater/surface-water exchange at 8 of the 11 sampling stations where temperature rods were deployed. At station VC-3, temperature loggers were compromised, and data could not be retrieved. At stations TR-2 and TR-4, data from only two of the four loggers were available to model and did not meet data input requirements of 1DTempPro model, which needs continuous temperature data measured at three or more depths.
Results from 1DTempPro model indicated spatial and temporal variability in the rates and direction of groundwater/surface-water exchange during the October 2018–May 2019 deployment. In the spawning control area, groundwater upwelling was simulated at stations SC-1 and SC-4 throughout the entire deployment (fig. 10A). At the two intervening stations, upwelling was modeled at station SC-2 until mid-February 2019 when downwelling was modeled. At station SC-3, downwelling was modeled throughout the deployment period. Besides station SC-4, where specific discharge ranged from -4.97 to -1.08 m/d, specific discharge was relatively constant throughout the deployment period with average specific discharge rates of –0.204, –0.080, and –0.130 m/d for stations SC-1, SC-2, and SC-3, respectively. At the vegetation control sampling area, station VC-1 upwelling was modeled throughout the deployment with specific discharge averaging –0.048 m/d with little variation (fig. 10C). Upwelling also was modeled at station VC-2 throughout the deployment, but there was more variability in specific discharge, which ranged from –2.87 to –0.036 m/d. The vegetation treatment area showed similar behavior as the other two sampling areas (fig. 10B). Station TR-1 indicated upwelling throughout the deployment, and average specific discharge was –0.142 m/d. In contrast, station TR-3 indicated downwelling throughout the deployment with an average specific discharge of 0.109 m/d.
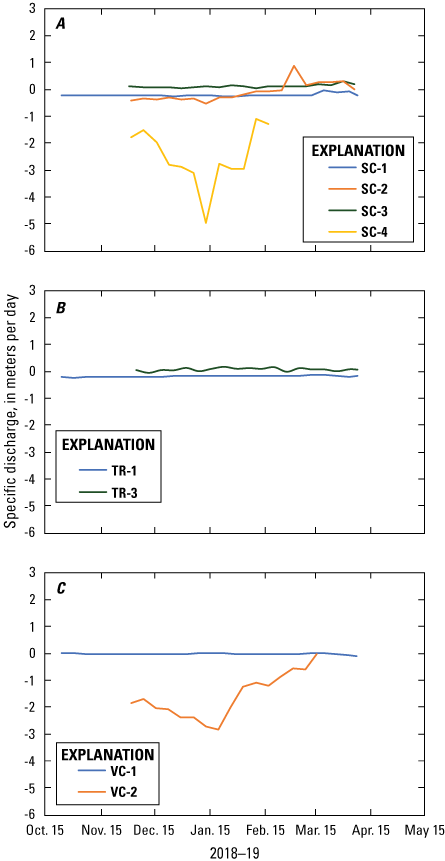
Specific discharge from 1DTempPro model simulations at the A, spawning control (SC); B, vegetation treatment (VT), and C, vegetation control (VC) sampling areas, Lake Ozette, western Washington, October 2018–April 2019. Flow into the lake (upwelling) is defined as a negative flux and into the lakebed (downwelling) is defined as a positive flux.
Across area comparisons among the three shoreline classifications were made with stations SC-1, TR-1, and VC-1 because they were under water the entire deployment, had the longest time period of data, and showed a consistent direction of specific discharge throughout the deployment (upwelling, or into the lake). Throughout the incubation period (November 2018–March 2019), the greatest upwelling rate was modeled at the spawning control station (SC-1) and the least amount of upwelling was modeled at the vegetated control station (VC-1), with the vegetation treatment in the middle station (TR-1; fig. 11). Average specific discharge values during this period were –0.216, –0.142, and –0.043 m/d for stations SC-1, TR-1, and VC-1, respectively.
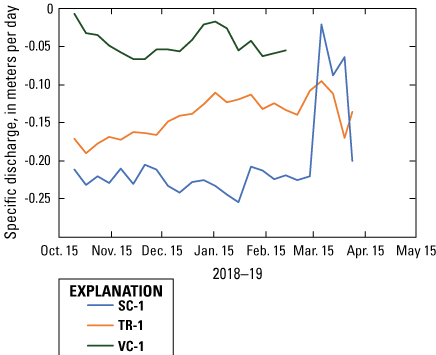
Specific discharge across sampling areas at stations that were underwater throughout the deployment period, Lake Ozette, western Washington, October 2018–April 2019. [SC, spawning control; TR, vegetation treatment; VC, vegetation control].
Discussion
Previous investigations in the shallow substrate of Lake Ozette’s beaches historically used for sockeye salmon spawning documented discrete dissolved-oxygen samples that were largely less than the 3 mg/L threshold needed to support incubation of sockeye salmon except for several sites at Olsen’s and Allen’s Beaches (Brooks, 2010). Continuous dissolved-oxygen concentrations were measured from October 2018 to May 2019 in shoreline sediments at a typical depth of incubating sockeye salmon eggs at 12 stations located in three shoreline sampling areas. At all three shoreline areas, continuous dissolved-oxygen concentrations measured were consistently near 0.0 mg/L when sample stations were inundated with lake water, which occurred at progressively higher elevation stations during the autumn and winter as lake level rose in response to increased precipitation and inflow. The presence of low dissolved-oxygen concentrations was supported by discrete field checks in the beginning, middle, and end of the deployment period; dissolved-oxygen concentrations were consistently less than 1.0 mg/L as measured by a laboratory calibrated sonde.
There were a few cases when field checked dissolved-oxygen concentrations were greater than 1.0 mg/L; at station VC-3 in March 2019 and at stations SC-4 and VC-4 in May 2019. The higher dissolved-oxygen concentrations at stations SC-4 and VC-4 in May 2019 were likely from unsaturated lakebed conditions at the end of the deployment. When sensors were retrieved, the sites farthest from the water (station 4 in each sampling area) were out of water, which can cause high subsurface dissolved-oxygen concentrations. The high concentration at station VC-3 was likely an artifact from sample collection. Air bubbles in the sample line of station VC-3 were noted during the March 2019 field check, potentially causing an erroneous value.
Dissolved-oxygen concentrations were less than the 3.0 mg/L threshold needed to support incubating sockeye salmon and indicated that even at the spawning-control area characterized by the coarsest sediment among the study areas, subsurface dissolved-oxygen concentrations remained impaired with respect to the requirements of incubating sockeye salmon eggs. Brooks (2010) also measured anaerobic conditions, in which dissolved- oxygen concentrations were less than 1.0 mg/L, during weekly discrete sampling of subsurface dissolved-oxygen concentrations at most locations. One exception was a location at Olsen’s Beach, the site of this current study, where some measurements were greater than 3.0 mg/L; however, dissolved-oxygen concentrations varied during the period of measurement (Brooks, 2010). In contrast to this previous work, differences were not measured in subsurface dissolved-oxygen concentrations between the spawning and vegetation control stations making it difficult to infer whether removing vegetation improves subsurface conditions. Furthermore, sockeye salmon eggs require a minimum of 3 mg/L for successful incubation (Foerster, 1968) and these conditions were not met during this study. In part, the anaerobic conditions measured throughout the three sampling areas may reflect the presence of fine-grained sediment that would have been removed from active redds as they were excavated. In egg-basket studies in cleaned and uncleaned sediment at Allen’s and Olsen’s Beaches in Lake Ozette, Haggerty and others (2009) reported increased survival of salmon embryos during 21-day eyed-egg survival trials in cleaned compared to uncleaned spawning gravels, suggesting that fine-grained sediment removal, which occurs during redd construction, may improve salmon embryo survival.
Although dissolved-oxygen concentrations measured at all stations were less than sockeye salmon incubation thresholds and differences were not measured between the shoreline sampling areas with respect to dissolved oxygen, particle-size distribution data measured at stations revealed both temporal variation from October 2018 to May 2019 and spatial variation within and across shoreline sampling areas. The coarsest sediment generally was measured at the highest elevation, most shoreward stations of each shoreline classification (SC-4, TR-4, and VC-4) and the finest sediment was measured in the most lakeward stations (SC-1, TR-1, and VC-1). These relations remained largely consistent from the beginning to the end of the deployment, but notably the D50 measured at station TR-4 increased from 8.2 to 21.6 mm with commensurate increases in D90. The twofold increase in D50 at station TR-4 within the vegetation treatment shoreline classification suggests that the removal of vegetation allowed wave energy to entrain sediment in the upper beach at the treatment area resulting in a coarsening of grain size at station TR-4. Despite coarsening measured in the upper beach from October 2018 to May 2019, particle size at stations TR-2 and TR-3, which were located in the formerly vegetated area, remained relatively fine (D50 < 3.5 mm). The retention of fine-grained sediment at sites TR-2 and TR-3 suggests that despite the removal of vegetation within the treatment shoreline sampling area, root cohesion might have persisted and prevented entrainment of sediment at stations TR-2 and TR-3 that occurred in the unvegetated upper beach near station TR-4. Similarly, fine-grained sediment (D50 < 0.6 mm) persisted at station TR-1, the most lakeward station, suggesting that vegetation removal did not affect substrate particle-size distribution lakeward of the vegetation removal.
Groundwater/surface-water exchange was variable within and across shoreline sampling areas. Sediment-temperature modeling indicated that upwelling (groundwater flow into the lake) occurred at most stations. Downwelling (flow from the lake into the lakebed) primarily occurred at stations where wave action from the changing lake stage would be greatest (SC-2, SC-3, and TR-3), indicating the importance of this area of the lakebed for potentially introducing oxygenated water to the subsurface. At the vegetation control area, upwelling occurred within the vegetation band that attenuated wave energy during winter storms (VC-2). Comparing the vegetation control and treatment areas that remained saturated throughout the deployment period, the highest upwelling rates occurred at the spawning control and lowest rates at the vegetation control with intermediate values in the treatment area (fig. 11). Differences in upwelling between the spawning control, vegetation control, and treatment areas imply that the process of removing vegetation influenced the amount of upwelling, with more upwelling in the treatment area compared to the vegetated area; however, more data across multiple seasons are needed to confirm changes in upwelling due to vegetation removal.
Study Limitations and Future Research
Several aspects of the study design limited our ability to interpret the effect of above-ground vegetation removal on substrate particle-size distribution, dissolved-oxygen concentrations, and groundwater/surface-water interactions within shoreline sediment. These limitations included the retention of root cohesion within the vegetation treatment shoreline classification, removal of above-ground vegetation limited to 3 meters of shoreline, and only one field season of monitoring of dissolved oxygen, sediment, and groundwater/surface-water exchange (October 2018–May 2019). In addition, dissolved-oxygen monitoring was limited to a 10-centimeter interval from 15 to 25 cm below the lake surface representative of typical sockeye salmon spawning depths, but dissolved-oxygen conditions may have differed at shallower depths. Although waves were able to pass through the vegetation treatment following above-ground vegetation removal, the persistence of root cohesion limited the movement of sediment within the area of vegetation removal. Coarsening of sediment, and the removal of fines, however, was measured at the most shoreward station of the vegetation treatment (station TR-4; table 1) where there were no pre-existing roots, suggesting that vegetation removal that includes the removal of roots may enhance sediment mobility and winnow fine-grained sediment. In addition, an increased length of shoreline vegetation removal may increase the amount of wave energy imparted on the shoreline. Future research may consider the removal of vegetation roots within a greater length of shoreline to determine the full potential of vegetation removal strategies on the enhancement of dissolved oxygen within beach sediment. Furthermore, monitoring over multiple field seasons during which beach sediment is reworked may be necessary to determine the full potential of vegetation-removal strategies. In addition to shoreline vegetation removal, the potential for shoreline structures that focus wave energy such as large wood to remove fine-grained material from beach-spawning sediment may be evaluated.
Summary
Low dissolved-oxygen concentrations in beach sediments used by spawning sockeye salmon in Lake Ozette were previously identified as a limiting factor for the recovery of the population of sockeye salmon in Lake Ozette (Haggerty and others, 2009). To test the hypothesis that the encroachment of shoreline sediment leads to decreased dissolved-oxygen concentrations in beach spawning habitat, continuous measurements of subsurface dissolved-oxygen concentrations were measured within three shoreline sampling areas in Olsen’s beach during the 2018–19 sockeye salmon incubation period. These shoreline classifications included areas of current spawning devoid of shoreline vegetation, vegetated area, and treatment area where existing vegetation was removed in 2018 prior to the study. Dissolved-oxygen concentrations measured in all three shoreline sampling areas from October 2018 to May 2019 were below the threshold needed to support intra-gravel incubation of developing sockeye salmon eggs. Although increases in dissolved-oxygen concentrations following shoreline vegetation removal were not measured, increased particle size of substrate in the upper beach of the treatment area were observed due to increased wave energy on the upper beach and the winnowing of fine-grained sediment. Although an effort was made to remove root masses in the vegetation treatment area, root cohesion that persisted following vegetation removal prevented substrate coarsening in the zone of vegetation removal itself. In addition, the removal of vegetation may have increased groundwater upwelling in the vegetation treatment area, but more data across multiple seasons are needed to confirm changes in groundwater/surface-water exchange. Notably, vegetation was removed over a 3-meter-wide section of shoreline in the treatment area and that field observations only took place over a single incubation season. Confidence in the effects of vegetation removal on subsurface dissolved-oxygen concentrations, substrate particle-size distribution, and groundwater/surface-water exchange could be increased by incorporating several changes to the design of future investigations. These changes include more extensive removal of shoreline vegetation including the removal of roots that retained substrate cohesion and over a longer length of shoreline, monitoring dissolved oxygen, sediment, and groundwater/surface-water exchange over multiple winter storm seasons, and simulating redd construction in sampling areas.
Acknowledgments
The authors would like to thank Pat Crain and David Conca of the National Park Service–Olympic National Park and Stephanie Martin, Angela Tetnowski, Joe MacDonald, Travis Butterfield, and Larry Cooke of the Makah Tribe for assistance in deploying equipment in the field. The authors would also like to thank Mike Haggerty, Larry Cooke, and Joe Hinton for consultation in sampling area selection. The authors would also like to thank Pat Crain for contributing to the development of the project scope and proposal that funded this study.
References Cited
Bortleson, G.C., and Dion, N.P., 1978, Preferred and observed conditions for sockeye salmon in Ozette Lake and its tributaries, Clallam County, Washington: U.S. Geological Survey Water-Resources Investigations Open File Report 78–64, 61 p., accessed November 27, 2020, at https://doi.org/10.3133/wri7864.
Briggs, M.A., Lautz, L.K., Buckley, S.F., and Lane, J.W., 2014, Practical limitations on the use of diurnal temperature signals to quantify groundwater upwelling: Journal of Hydrology, v. 519, p. 1739–1751, accessed December 2, 2020, at https://doi.org/10.1016/j.jhydrol.2014.09.030.
Conn, K.E., Huffman, R.L., and Barton, C., 2017, Quality-assurance plan for water-quality activities in the U.S. Geological Survey Washington Water Science Center: U.S. Geological Survey Open-File Report 2017–1044, 66 p., accessed December 7 2020, at https://doi.org/10.3133/ofr20171044.
Haggerty, M.J., Ritchie, A.C., Shellberg, J.G., Crewson, M.J., and Jalonen, J., 2009, Lake Ozette sockeye limiting factors analysis: Port Angeles, Washington, The Makah Indian Tribe and NOAA Fisheries, 565 p., accessed December 4, 2020, at https://repository.library.noaa.gov/view/noaa/4202.
Irvine, D.J., Kurylyk, B.L., and Briggs, M.A., 2020, Quantitative guidance for efficient vertical flow measurements at the sediment—Water interface using temperature—Depth profiles: Hydrological Processes, v. 34, p. 649–661, accessed September 27, 2020, at https://doi.org/10.1002/hyp.13614.
Koch, F.W., Voytek, E.B., Day-Lewis, F.D., Healy, R., Briggs, M.A., Lane, J.W., Jr., and Werkema, D., 2016, 1DTempPro V2—New Features for Inferring Groundwater/Surface‐Water Exchange: Ground Water, v. 54, no. 3, p. 434–439, accessed September 27, 2020, at https://doi.org/10.1111/gwat.12369.
Naranjo, R.C., and Turcotte, R., 2015, A new temperature profiling probe for investigating groundwater-surface water interaction: Water Resources Research, v. 51, no. 9, p. 7790–7797, accessed November 19, 2020, at https://doi.org/10.1002/2015WR017574.
PRISM Climate Group, 2014, 30-year normals data: PRISM Climate Group data, Oregon State University, accessed December 4, 2020, at http://www.prism.oregonstate.edu/normals/.
Rosenberry, D.O., Briggs, M.A., Delin, G., and Hare, D.K., 2016, Combined use of thermal methods and seepage meters to efficiently locate, quantify, and monitor focused groundwater discharge to a sand-bed stream: Water Resources Research, v. 52, no. 6, p. 4486–4503, accessed August, 5, 2020, at https://doi.org/10.1002/2016WR018808.
Sheibley, R.W., Gendaszek, A.S., and Foreman, J.R., 2021, Dissolved oxygen, temperature, particle-size distribution, and groundwater flux in the nearshore of Lake Ozette, WA, October 2018 to May 2019: U.S. Geological Survey data release, accessed June 1, 2021, at https://doi.org/10.5066/P9XC9XPR.
Wagner, R.J., Boulger, R.W., Jr., Oblinger, C.J., and Smith, B.A., 2006, Guidelines and standard procedures for continuous water-quality monitors—Station operation, record computation, and data reporting: U.S. Geological Survey Techniques and Methods 1–D3, 51 p., accessed November 27, 2020, at https://doi.org/10.3133/tm1D3.
Conversion Factors
International System of Units to U.S. customary units
Temperature in degrees Celsius (°C) may be converted to degrees Fahrenheit (°F) as follows:
°F = (1.8 × °C) + 32.
Datum
Vertical coordinate information is referenced to the North American Vertical Datum of 1988 (NAVD 88).
Horizontal coordinate information is referenced to the North American Datum of 1983 (NAD 83).
Elevation, as used in this report, refers to distance above the vertical datum.
Supplemental Information
Specific conductance is given in microsiemens per centimeter at 25 degrees Celsius (µS/cm at 25 °C).
Concentrations of dissolved oxygen in water are given in milligrams per liter (mg/L).
Publishing support provided by the U.S. Geological Survey
Science Publishing Network, Tacoma Publishing Service Center
For more information concerning the research in this report, contact the
Director, Washington Water Science Center
U.S. Geological Survey
934 Broadway, Suite 300
Tacoma, Washington 98402
Disclaimers
Any use of trade, firm, or product names is for descriptive purposes only and does not imply endorsement by the U.S. Government.
Although this information product, for the most part, is in the public domain, it also may contain copyrighted materials as noted in the text. Permission to reproduce copyrighted items must be secured from the copyright owner.
Suggested Citation
Gendaszek, A.S., and Sheibley, R.W., 2021, Substrate particle-size distribution, dissolved-oxygen concentrations, sediment temperatures, and groundwater/surface-water exchange in shoreline spawning habitat of sockeye salmon (Oncorhynchus nerka) of Lake Ozette, Western Washington: U.S. Geological Survey Scientific Investigations Report 2021–5134, 21 p., https://doi.org/10.3133/sir20215134.
ISSN: 2328-0328 (online)
Study Area
| Publication type | Report |
|---|---|
| Publication Subtype | USGS Numbered Series |
| Title | Substrate particle-size distribution, dissolved-oxygen concentrations, sediment temperatures, and groundwater/surface-water exchange in shoreline spawning habitat of sockeye salmon (Oncorhynchus nerka) of Lake Ozette, Western Washington |
| Series title | Scientific Investigations Report |
| Series number | 2021-5134 |
| DOI | 10.3133/sir20215134 |
| Publication Date | December 16, 2021 |
| Year Published | 2021 |
| Language | English |
| Publisher | U.S. Geological Survey |
| Publisher location | Reston, VA |
| Contributing office(s) | Washington Water Science Center |
| Description | Report: v, 21 p.; Data Release |
| Country | United States |
| State | Washington |
| Other Geospatial | Lake Ozette |
| Online Only (Y/N) | Y |