

Groundwater-Level Contour Map of Fauquier County, Virginia, October–November 2018
Links
- Document: Report (5.57 MB pdf) , HTML , XML
- Data Release: USGS data release - Raster and vector geospatial data of interpolated groundwater level altitude associated with a groundwater-level map of Fauquier County, Virginia, October - November 2018
- NGMDB Index Page: National Geologic Map Database Index Page (html)
- Download citation as: RIS | Dublin Core
Acknowledgments
The authors would like to acknowledge the assistance of the Fauquier County Board of Supervisors, Fauquier County Water and Sanitation Authority, and the residents of Fauquier County that participated in our groundwater-level survey.
The authors also thank Ryan Green, Janet Minerva, and Brad White of the Virginia Department of Environmental Quality, and Richie Dang, Mark Kozar, David Ladd, Mitchell McAdoo, Jason Pope, Karen Rice, and Robert Rosman of the U.S. Geological Survey for their contributions to the collection and analysis of data, and the review of the manuscript for this report.
Abstract
Groundwater withdrawals provide most public-water supplies and all private-domestic users in Fauquier County, Virginia, a fast-growing rural area southwest of Washington, D.C. Groundwater levels were measured in 129 wells during a county-wide synoptic survey from October 29 through November 2, 2018. Field measurements, combined with datapoints from the National Hydrography Dataset, were used to develop a county-wide groundwater-level contour map. Groundwater levels and withdrawals during the synoptic survey were near or slightly above long-term medians. Error analysis indicated that the estimated groundwater-level contours generally were lower than observed measurements, with a root-mean-squared error of 33.52 feet. Groundwater levels in Fauquier County are controlled largely by topography: low levels in the crystalline Blue Ridge aquifers in the northwestern part of the county contrast markedly with higher levels in the sedimentary Mesozoic Basin aquifers in the southeast. At current levels of groundwater withdrawal, and at the scale and scope of the synoptic survey, no cones of depression in the groundwater surface were detected. The Fauquier County groundwater-level contour map is available as a U.S. Geological Survey data release.
Introduction
Groundwater resources in Fauquier County, Virginia supply water to local communities, commercial and agricultural activity, and individual residences. The primary source of water for most rural households and the public-water systems that supply the majority of the county’s residents is water withdrawn from fractured-rock aquifers (Dieter and others, 2018). Fauquier County is a growing suburban area within commuting distance of Washington, D.C., and the demand on groundwater resources is expected to increase on the basis of projections from the Fauquier County Water and Sanitation Authority (Fauquier County Water Resources, undated). Between 1985 and 2015, population grew 71 percent, with a corresponding 56 percent increase in groundwater withdrawals (Dieter and others, 2018). Greater knowledge of the area’s groundwater is needed to understand how the resource can sustainably support the increasing population of Fauquier County.
This report continues the multi-year collaboration of the U.S. Geological Survey (USGS), the Fauquier County Water and Sanitation Authority (FCWSA), and the Virginia Department of Environmental Quality (VADEQ) to collect data and assess county-wide groundwater conditions. Previous activities in this collaborative effort include geophysical well logging, the installation of additional continuous groundwater-level monitoring wells, and the development of a water budget using a Soil-Water-Balance (SWB) model (McCoy and Ladd, 2019). Collectively, these hydrogeologic investigations build a scientific foundation that can be used for management and future planning of Fauquier County water resources.
Purpose and Scope
This report documents the collection of synoptic groundwater level data in Fauquier County, Virginia in late October and early November 2018. These field measurements were used in a geographic information system (GIS) to develop a county-wide groundwater-level contour map. A basic error analysis was performed on the estimated groundwater-levels. Antecedent conditions that influenced the field measurements, and the limitations of the model, also are discussed.
Description of Study Area
Fauquier County consists of 650 square miles (mi2) in north-central Virginia. The county straddles the drainage divide between the north-flowing tributaries of the Potomac River and the south-flowing tributaries of the Rappahannock River (fig. 1). The county includes parts of the Piedmont and Blue Ridge Physiographic Provinces, two geographic regions with large topographic differences. In the northwestern part of Fauquier County, the Blue Ridge Physiographic Province has steep slopes with altitudes up to 2,400 feet. In the southeastern part of the county, the Piedmont Physiographic Province is characterized by rolling terrain and lower altitudes, from 160 to 800 feet. These altitude differences account for the slight variation in mean annual precipitation, which averaged between 40 and 43 inches, across the county for the period from 1981 to 2010 (PRISM Climate Group, 2019).
Geologically, Fauquier County is underlain by crystalline rocks of the Blue Ridge Physiographic Province and the northwestern part of the Piedmont Physiographic Province. These rocks act as one principal aquifer and are referred to in this study as the Blue Ridge crystalline aquifer (fig. 1). The remainder of the Piedmont Physiographic Province is further divided by altitude and geologic structure. The central lowlands of the Piedmont Physiographic Province are underlain by Mesozoic sedimentary rocks deposited in a northeast-southwest trending rift basin, referred to as the Mesozoic basin aquifer for this study. The far southeastern corner of Fauquier County, part of the Piedmont Physiographic Province uplands, is underlain by rocks of multiple island-arc and volcanic origins and is referred to as the Piedmont crystalline aquifer in this study (Davis and others, 2001).
The City of Warrenton is the seat of local government in Fauquier County and the largest municipality. Nine service districts organized along major highways provide water and sewer utilities to low- and medium-intensity development areas (fig. 2). Most of the land area of Fauquier County, and 45 percent of its population, lie outside the nine service districts. Most of the county is rural, with major land cover consisting of deciduous forest or pasture (McCoy and Ladd, 2019).
As part of ongoing USGS investigations, groundwater levels are being continuously monitored at locations in and around Fauquier County. Continuous water-levels have been recorded in well 48U 26 since October 2007 and in well 49V 1 since September 2003. Continuous water-levels have been recorded in monitoring wells 48S 38, 48T 7, 48U 32, and 49U 81 since April 2018 (fig. 1). Water-levels are uploaded in near real time automatically by satellite telemetry to the USGS National Water Information System (NWIS) and verified with field measurements on a 6- to 8-week interval.
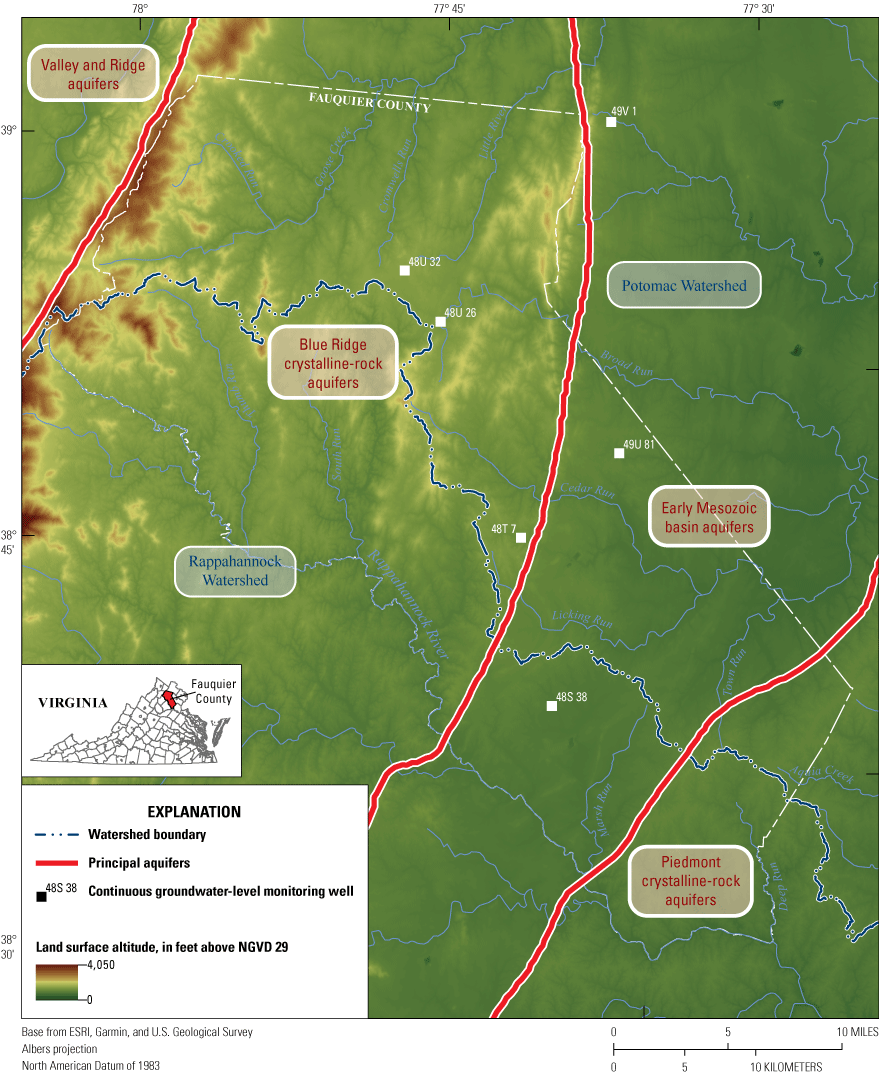
General location and hydrogeologic overview of Fauquier County, Virginia. NGVD 29, National Geodetic Vertical Datum of 1929.
Study Methods
Groundwater levels were measured to develop a groundwater-level contour map of Fauquier County. Standard USGS protocols were followed for the collection, processing, review, and approval of the water-level measurements (Cunningham and Schalk, 2011). The groundwater-level contour map was developed by applying methods adapted from those used in previous USGS efforts by McCoy and others (2015), Nottmeier (2015), and Peck and Payne (2003).
Collection of Groundwater-Level Data
A synoptic survey of groundwater levels in 129 wells across Fauquier County was conducted from October 29 through November 2, 2018 (appendix 1; fig. 2). Field personnel requested access to the wells and any available well information from private-domestic well owners. Water levels were measured manually with a calibrated steel tape to the nearest one-hundredth of a foot. A calibrated electric tape was substituted for the steel tape in wells where the depth to water could not be determined with the steel tape, most often because of moisture inside the well casing. At each visit, multiple measurements were made, at least five minutes apart, until a pair of measurements were within two one-hundredths of a foot. This standard procedure reduces error from any short-term groundwater-level fluctuations attributed to recent well pumping (Cunningham and Schalk, 2011). The water-level measurements and pertinent well information were entered, reviewed, and approved, then stored in the USGS National Water Information System (NWIS) database.
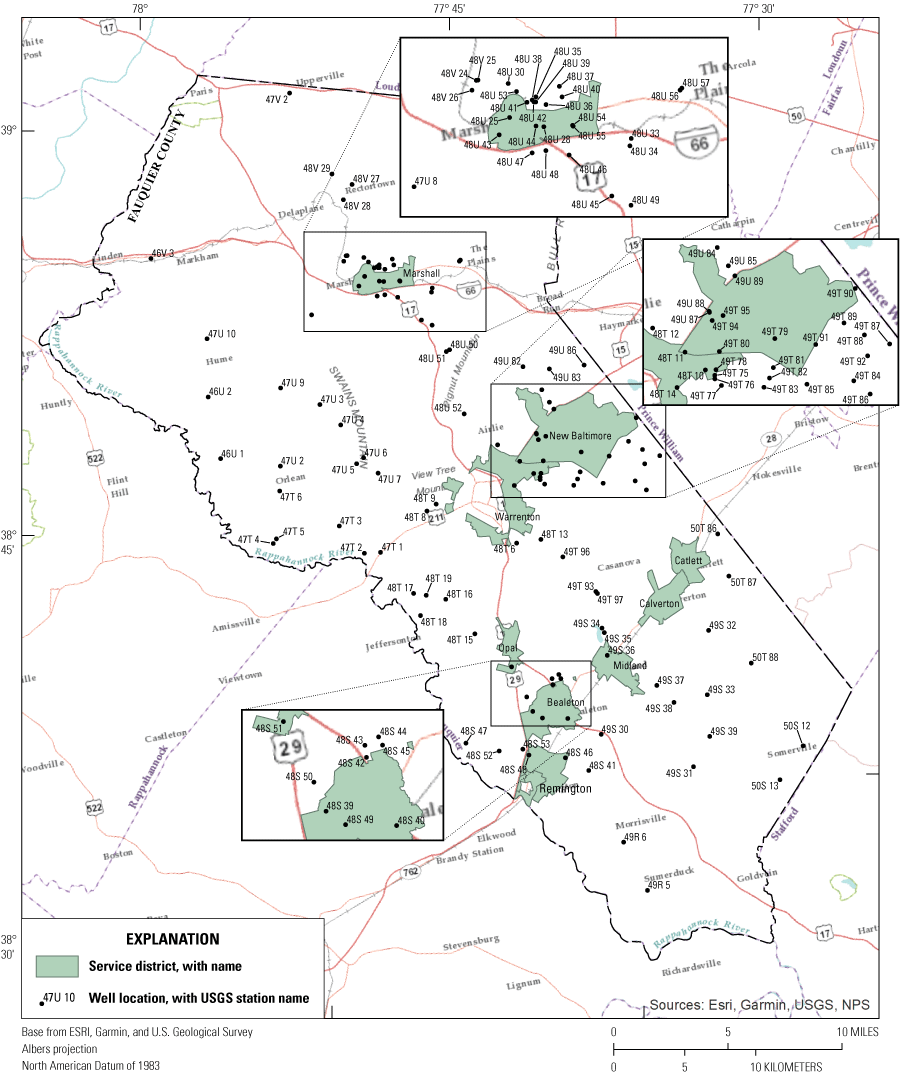
Location of service districts and wells used in groundwater-level survey of Fauquier County, Virginia, October 29–November 2, 2018.
Development of Groundwater-Level Contour Map
The synoptic groundwater-level data were used as one input in the development of a groundwater-level contour map for Fauquier County. Assuming that streams are a surficial expression of groundwater, the altitudes of key points in the stream network were selected to provide additional spatial coverage and help confine groundwater levels below land surface. These key stream points were defined as the intersections of streams from the National Hydrography Dataset (NHD) with a Strahler stream order of two or greater, with the intent to eliminate ephemeral headwaters that do not reliably indicate the presence of groundwater. Altitudes for the key stream points were obtained from a three-meter (9.84 ft) digital elevation model (DEM) of Fauquier County (U.S. Geological Survey, 2011). To avoid representing groundwater levels beyond the scope of field-verified measurements, key stream points were further restricted to those with an altitude less than the highest measured groundwater level. Stream points within 3 miles (mi) of the Fauquier County boundary were included in the analysis to avoid problematic interpolation along the county line.
Data from the synoptic groundwater-level survey and key stream points were merged into a geographic information system (GIS), which was used to create a spatially referenced raster surface of groundwater-level altitude using a natural-neighbor interpolation. A GIS contouring tool converted the interpolated raster surface into a line-based dataset. These contour lines represent an equal altitude of estimated groundwater levels above the NGVD 29 datum. To reduce errors where the interpolated groundwater levels were greater than three meters (9.84 feet) above the DEM land surface, contours were manually adjusted where steep hydraulic gradients are assumed to mimic the steep topography. Adjustments to groundwater-level contours also were required to depict groundwater discharge in stream bottoms. Gaining streams were an assumption embedded in this approach using stream altitude and are consistent with findings elsewhere in the Blue Ridge and Piedmont physiographic provinces (McCoy and others 2015).
The edited groundwater-level contours served as the primary dataset for the Fauquier County groundwater-level contour map, alongside the measured synoptic groundwater-level measurements and a background of land-surface altitude, also referenced to the NGVD 29 datum (fig. 3).
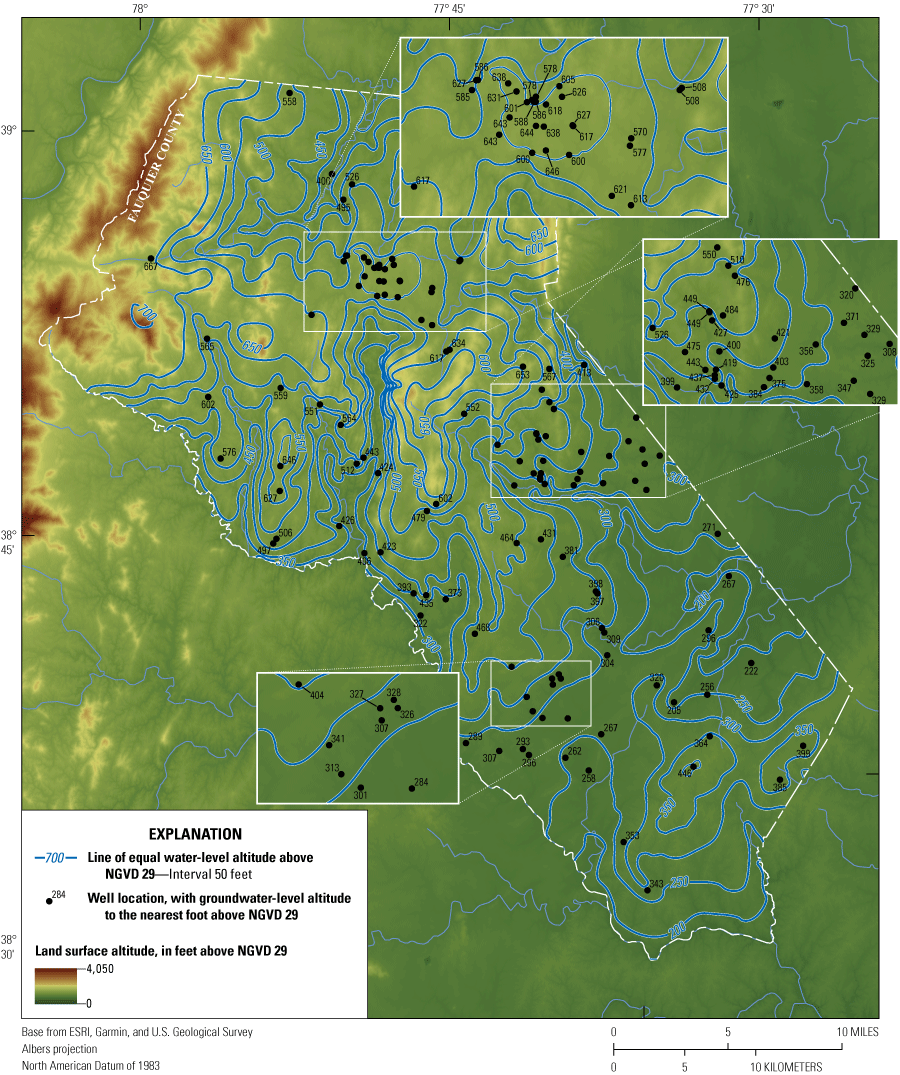
Groundwater-level contour map of Fauquier County, Virginia. NGVD 29, National Geodetic Vertical Datum of 1929.
A final GIS contour to raster tool was used to convert the estimated groundwater-level contours to a continuous, thirty-meter (98.4 ft) resolution, estimated groundwater-level altitude raster surface for subsequent error analysis. Both the contour lines and raster surface are available as a USGS data release (Kearns, 2022).
Factors Affecting Groundwater Levels
Antecedent Conditions
Although a synoptic survey of groundwater levels is an attempt to provide a snapshot in time, it is important to recognize that groundwater is a dynamic resource, responsive to changes to inputs to, or demands on, the hydrologic system. Groundwater levels can fluctuate on a seasonal basis or deviate dramatically from average conditions during exceptionally wet periods or drought. Groundwater withdrawals also impact the water levels, particularly during drought conditions or anytime withdrawals exceed recharge.
Precipitation and Groundwater Levels
The synoptic survey period was selected to occur around the time of the usual seasonal minimum in the annual cycle of groundwater fluctuations, which – due to factors including precipitation, temperature, and growing season – typically includes a period of recharge in the winter and spring followed by a general decrease throughout the summer and fall (McCoy and others, 2015). Conditions prior to the October-November 2018 synoptic survey, however, were abnormally wet. Monthly mean PRISM precipitation data for Fauquier County from June to September (fig. 4A) were twice the 30-year monthly mean for the period 1981 to 2010 (PRISM Climate Group, 2019). This likely contributed to above-normal groundwater levels for most of the summer, as shown by data from the two USGS monitoring wells in the region with records long enough to compute a 10-year daily median from data published in NWIS for the period 2007 to 2017 (fig. 4B,C).
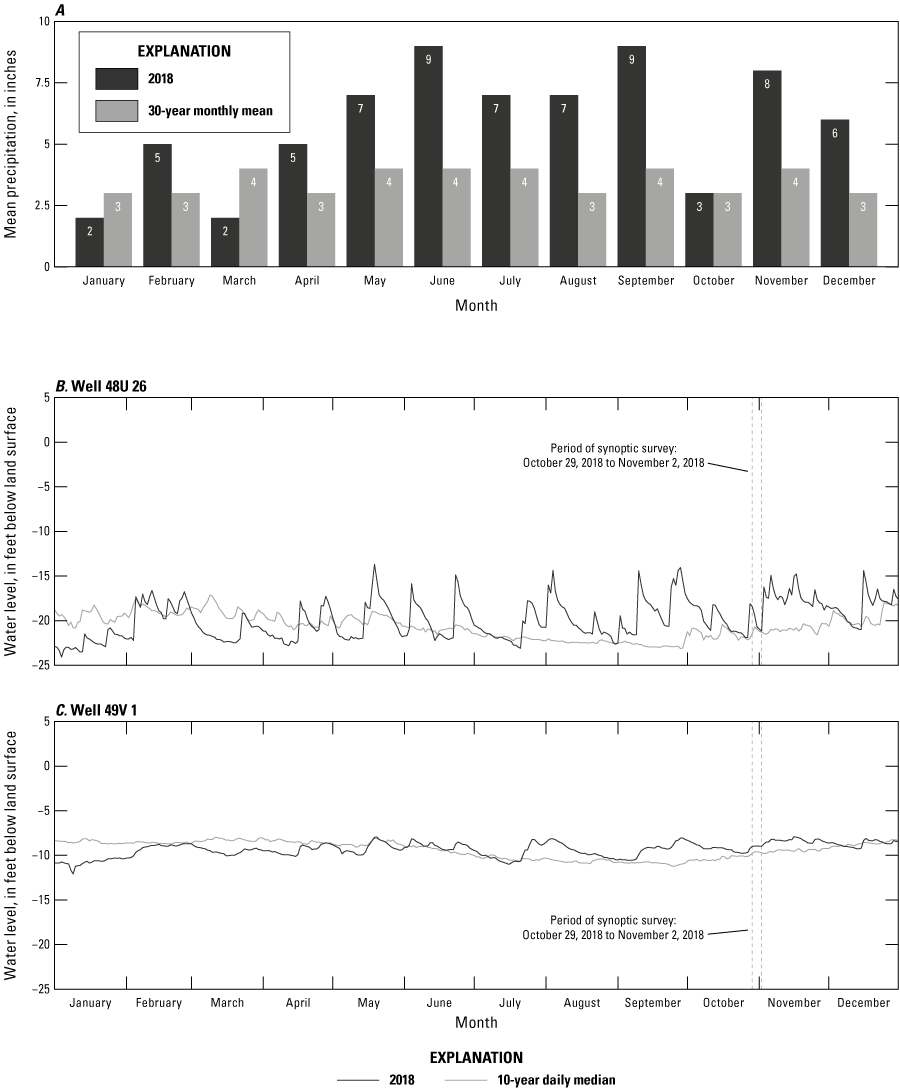
Antecedent conditions to October 29–November 2, 2018, groundwater survey in Fauquier County, Virginia: A, PRISM monthly precipitation in 2018 compared to 30-year monthly mean precipitation for 1981 to 2010, and B and C, 2018 daily groundwater levels in monitoring wells 48U 26 and 49V 1, respectively, compared to 10-year daily median for 2007 to 2017.
Monitoring well 48U 26 is in the Blue Ridge crystalline aquifer of northern Fauquier County. Water levels in 48U 26 were generally elevated during the summer, decreased throughout October 2018, and were nearing long-term median values during the period of the synoptic survey. Consistent with findings elsewhere in the crystalline aquifers of the Blue Ridge physiographic province (McCoy and others, 2015), well 48U 26 is highly sensitive to fluctuations in groundwater level; for wells less sensitive to short-term conditions, water levels that rose in response to the extreme summer precipitation would likely take even longer to return to normal. Monitoring well 49V 1 is completed in the Mesozoic basin aquifer approximately two kilometers east of Fauquier County. Water levels in well 49V 1 were consistently higher than 10-year daily median values for most of the summer of 2018. Although the groundwater level did decline throughout October, it rose again immediately before and during the period of the synoptic survey. Compared to well 48U 26, well 49V 1 appears less sensitive to fluctuations in water level and has a smaller range of median values throughout the year.
Evaluation of the combination of county-wide precipitation data and a monitoring well record in each of the two major aquifer systems indicates that it would be reasonable to conclude that groundwater levels in Fauquier County were likely at or above long-term median values during the October-November 2018 synoptic survey.
Groundwater Withdrawals and Use
The USGS, in cooperation with programs like the VADEQ’s Virginia Water Use Data System, provides national water-use estimates summarized by county every five years. Data for 2015 (U.S. Geological Survey, 2020; the most recent available at time of publication) show that nearly 99 percent of the estimated 4.32 million gallons per day (Mgal/d) of groundwater withdrawn in Fauquier County was used for public- or private-water supply. Most (1.76 Mgal/d) of the public-water supply in Fauquier County and all (2.51 Mgal/d) private-domestic-water supply comes from groundwater wells (table 1). Private-domestic supply is the largest categorical use of groundwater in the county. The remaining 1 percent (0.05 Mgal/d) of the estimated groundwater withdrawal supports livestock and the irrigation of approximately 200 acres on golf courses. From 1985 to 2015, the estimated public-supply demand for groundwater in Fauquier County rose from 0.6 to 1.76 Mgal/d—a nearly threefold increase. During the same period, estimated withdrawal from private-domestic wells rose 18 percent, from 2.13 to 2.51 Mgal/d (Dieter and others, 2018).
Table 1.
Estimated groundwater withdrawals in Fauquier County, Virginia, 1985–2015. Water volumes in million gallons per day (Mgal/d). Data from Dieter and others (2018) and U.S. Geological Survey (2020).[—, no data]
Water-use information is available on smaller and more recent spatio-temporal scales from VADEQ, but only for entities meeting reporting thresholds (withdrawing an average of 10,000 gal/day). This threshold would exclude private-domestic use but does capture public-water suppliers, golf course irrigation, and a small thermoelectric plant in Fauquier County. VADEQ data from 2015 to 2019 indicate an average annual reported groundwater withdrawal of 675 Mgal, or 1.85 Mgal/day—slightly greater than corresponding 2015 USGS estimates (Virginia Department of Environmental Quality, 2020). A monthly breakdown of VADEQ data for 2018 shows a clear seasonal fluctuation in groundwater withdrawals, with the highest demand from May to October, a peak in July, and the lowest demand in February (fig. 5). This seasonal demand contrasts with the annual pattern of groundwater availability in Fauquier County (as shown by the median conditions [water levels] in wells 48U 26 and 49V1 in figure 4B), in that demand is often highest when water levels typically are at their lowest. The groundwater withdrawal in October 2018 of 58.31 Mgal was 0.5 percent below the average October withdrawal and 3.6 percent above the average monthly withdrawal for 2015 to 2019 (Virginia Department of Environmental Quality, 2020). These values indicate that groundwater demand in Fauquier County was normal prior to the synoptic survey.
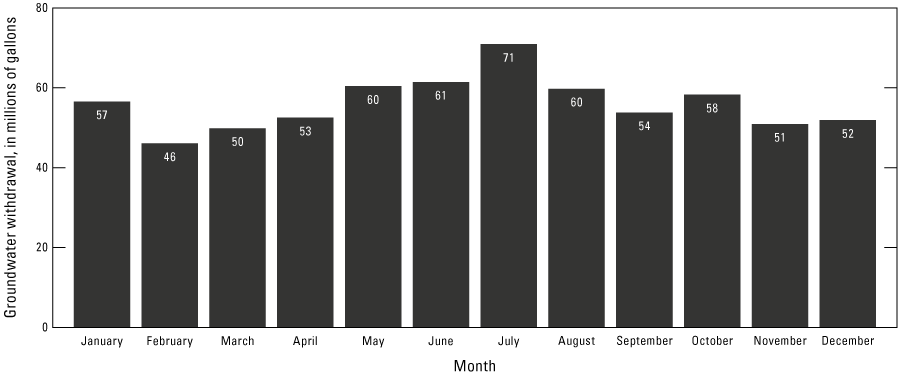
Monthly groundwater withdrawals in Fauquier County, Virginia, 2018, as reported by Virginia Department of Environmental Quality.
Precipitation and groundwater-levels prior to the synoptic survey suggest a slightly above-normal supply following a very wet summer. Estimated and reported groundwater withdrawals suggest normal seasonal demand. Determining the dominant force on groundwater levels from a single set of synoptic measurements is unlikely; however, the review of the data on antecedent precipitation, water levels, and withdrawals indicates the groundwater-level contour map was not developed from an extreme mismatch in groundwater conditions.
Error Analysis and Limitations of Estimated Groundwater Levels
Groundwater levels estimated from the contour map were compared to the levels measured during the synoptic survey. Root-mean-squared error (RMSE) of the estimated groundwater levels was 33.52 feet (eq. 1).
Root-mean-squared error
whereA plot of estimated groundwater levels against measured levels (fig. 6A) and residual error (fig. 6B) indicated that the estimated groundwater-level altitudes generally were lower than the measured altitudes. This bias generally was consistent across all groundwater levels, with a slight increase at greater altitudes. A GIS comparison of the groundwater-level raster surface and the DEM of Fauquier County indicated that the greatest error in estimated altitude of the groundwater-level surface was on hillsides and in stream valleys in steep terrain. On hillsides in particular, the depth-to-water and residual error are sensitive to small shifts of groundwater-level contour lines. Additionally, the horizontal resolutions of the raster and DEM used to estimate groundwater-level and land-surface altitudes are less accurate in high-relief terrain.
As discussed in the study methods, the groundwater-level contours were adjusted in areas of steep topographic gradient. Adjustments to contours resulted in lowering of estimated groundwater-level altitudes in comparison to actual water-level observations, increasing error in these steep areas. Thus, the development of a county-wide groundwater-level contour map is a balance between reducing local error between estimated and measured water levels while maintaining large-scale topographic and hydrologic integrity.
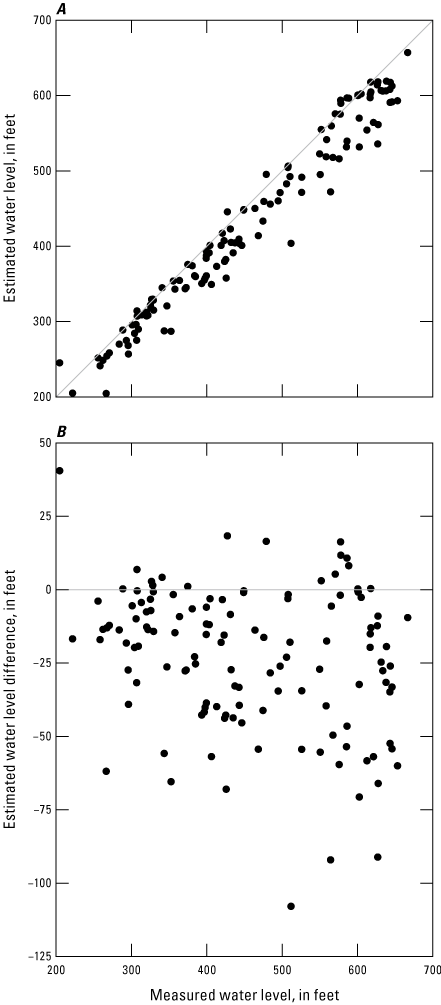
Estimated groundwater-level altitudes (National Geodetic Vertical Datum of 1929) from contour map plotted against measured groundwater levels in Fauquier County, Virginia: A, 1:1 plot and B, residuals.
The Fauquier County groundwater-level contour map was developed with the intent to represent steady-state groundwater conditions when recharge and groundwater levels were near their long-term averages. With only 129 observations across the 650-mi2 county, it was necessary to interpolate groundwater-level contours from limited data. The interpolations assumes that the groundwater occurs and moves within a single, unconfined system; however, gradients and pressures within the system are regionally controlled by surface topography and geology. Therefore, estimated groundwater levels differed from those measured in wells, as indicated by the RMSE and residuals. Extrapolation of the results of this study to smaller-scale investigations would require more hydrogeologic data than were available at the time of publication. Documenting changes in groundwater levels due to seasonal variation, extreme conditions, climate change, or groundwater withdrawals also are outside the scope of this report. Despite these limitations, the groundwater-level map presented here represents the best-available science concerning county-wide groundwater levels and serves as a solid basis for future modeling of Fauquier County groundwater resources.
Discussion of the Groundwater-Level Map
Groundwater levels measured in October-November 2018 in Fauquier County ranged from 667 ft NGVD 29 in the northwestern part of the county to 205 ft NGVD 29 in the southeast (fig. 3). Topography is the driving force for groundwater levels, in that the levels are generally a subdued reflection of the land surface configuration. This relation is similar to findings elsewhere in the Blue Ridge and Piedmont physiographic provinces (McCoy and others 2015). Streams in Fauquier County are assumed to be gaining streams, serving as discharge points for groundwater to enter the surface-water system. The topographic and geological differences between areas underlain by the crystalline aquifers in the Blue Ridge and Piedmont Uplands and by the sedimentary aquifer of the Mesozoic basin are readily apparent in the groundwater-level map. The crystalline system contains steep groundwater-level gradients and a much greater depth-to-water with distance away from streams. The Mesozoic basin is characterized by low groundwater gradients and a shallow depth-to-water.
The spatial coverage of the wells in which water levels were measured as part of this study was limited, but groundwater divides indicated by the measured levels are coincident with major surface-water drainage divides. Groundwater in the northern and eastern parts of the county generally flows toward the Potomac River, whereas groundwater in the southern and western parts of the county drains toward the Rappahannock River. The Marshall service district (fig. 2) straddles this groundwater divide on a small hydrologic plateau. This plateau limits the source area for the Marshall service district, as groundwater likely flows away from, rather than toward, the source area for the service district.
At the county-wide scale of this investigation, and during the median to above-median groundwater conditions at the time of the synoptic survey, in none of the Fauquier County service districts did the water-level contours exhibit noticeable cones of depression that would indicate an unsustainable demand on groundwater resources at current withdrawal rates. Further monitoring would be needed to detect local decreases in groundwater storage or cones of depression of limited areal extent.
Estimated groundwater levels generally were lower than measured values during the synoptic survey; however, groundwater levels fluctuate seasonally with recharge and withdrawal. The five USGS continuous monitoring wells in Fauquier County (fig. 1) provide additional context for the representation of estimated groundwater levels over time. These wells were not visited during the synoptic survey, nor used for the interpolation of the groundwater-level contour map. Instead, these wells represent independent observations at surveyed locations where the groundwater-level altitudes are known to within ±0.01 ft. Groundwater-level altitudes at the 129 synoptic survey wells depend upon GPS and DEM accuracy at the measuring point, which increases the level of uncertainty, especially in steep terrain.
For each USGS continuous monitoring well, the estimated water level was plotted with the NWIS daily maximum value for all available data during the 3-year period from April 2018 through March 2021 (fig. 7). Well 48S 38 was the only well at which the daily maximum value was consistently below the estimated level. In wells 48T 7 and 48U 32, daily maximum values were above the estimated water level, with the level at well 48T 7 being particularly shallow. The estimated water level for well 49U 81 plotted between seasonal maximum and minimum values, whereas the estimated level for well 48U 26 coincided only with the lowest daily values during the three-year period. Although the synoptic survey was conducted following a period of abnormally high precipitation and above-median groundwater levels, the interpolation and edits to the groundwater-level contour map produced consistently lower estimated groundwater levels and resulted in a final product that best approximates seasonal or annual minimums in the groundwater resources at a county-wide scale.

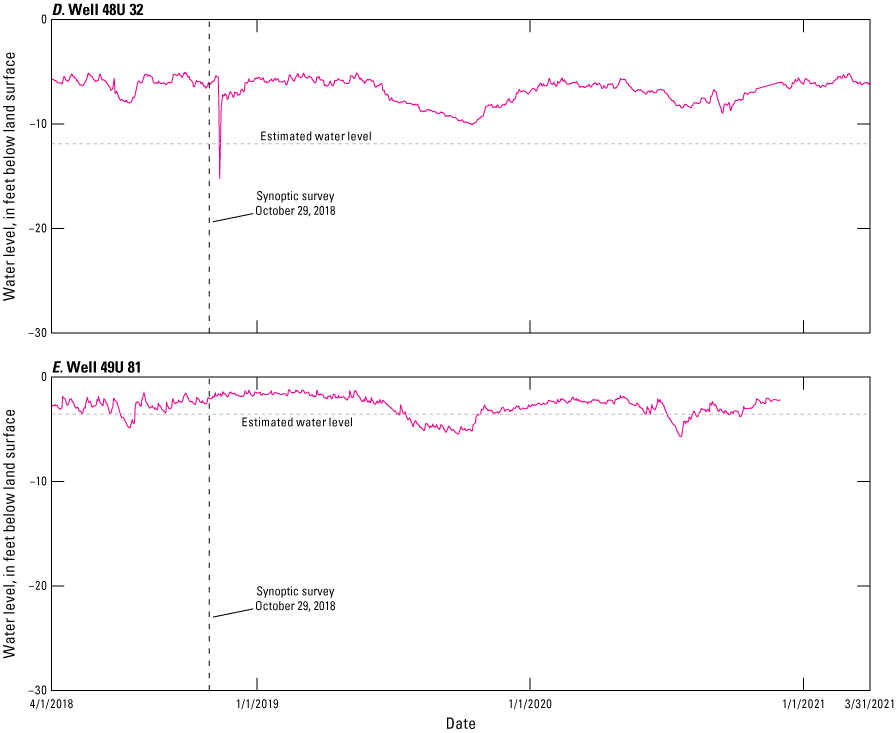
Daily-maximum values from U.S. Geological Survey continuous monitoring wells in Fauquier County, Virginia plotted with the estimated groundwater level from the contour map: A, Well 48S 38; B, Well 48T 7; C, Well 48U 26; D, Well 48U 32; and E, Well 49U 81.
Summary
Fauquier County, Virginia is a fast-growing rural area southwest of Washington, D.C. Groundwater provides most public water supplies and all private-domestic users in the county. Continuing U.S. Geological Survey (USGS) investigations of groundwater resources in Fauquier County support their management and planning. Groundwater levels were measured during a county-wide synoptic survey from October 29 through November 2, 2018. These field measurements were combined with data from the USGS National Hydrography Dataset and digital elevation models and used in the development of a county-wide groundwater-level contour map. The contour map was interpolated in a geographic information system (GIS) program and then manually edited to preserve major topographic features and reduce above-land-surface error of the groundwater levels.
Antecedent conditions suggest that groundwater levels and withdrawals during the synoptic survey were near or slightly above long-term median values. Error analysis indicated that estimated groundwater-level contours generally were lower than observed measurements, with root-mean-squared-error of 33.52 feet. A comparison of estimated groundwater levels to daily values in five USGS continuous monitoring wells over the 3-year period April 2018 through March 2021 suggests estimated groundwater levels coincide with seasonal or annual minimums.
Groundwater-levels in Fauquier County are primarily topographically driven, consistent with findings in other studies in the Blue Ridge and Piedmont Physiographic Provinces. Groundwater levels contrast markedly between those in the steep topography overlying the crystalline Blue Ridge aquifers in the northwestern part of the county and water levels in the rolling terrain of the sedimentary Mesozoic Basin in the southeastern part. At current levels of groundwater withdrawal, and at the scale and scope of this synoptic survey, no cones of depression in the groundwater-level contours were detected. The Fauquier County groundwater-level contour map is available as a USGS data release (Kearns, 2022).
References Cited
Davis, A.M., Southworth, C.S., Reddy, J.E., and Schindler, J.S., 2001, Geologic map database of the Washington DC area featuring data from three 30 x 60 minute quadrangles: Frederick, Washington West, and Fredericksburg: U.S. Geological Survey Open-File Report 01–227, accessed September 14, 2020, at https://pubs.usgs.gov/of/2001/of01-227/.
Fauquier County Water Resources, undated, Summary of water summit, September 23, 2014: Fauquier County web page, accessed February 17, 2021, at https://www.fauquiercounty.gov/government/departments-a-g/community-development/planning/long-range-planning/water-resources.
Kearns, M.R, 2022, Raster and vector geospatial data of interpolated groundwater level altitude associated with a groundwater-level map of Fauquier County, Virginia, October - November 2018: U.S. Geological Survey data release, https://doi.org/10.5066/P9JM7GYZ.
McCoy, K.J., and Ladd, D.E., 2019, Documentation of a soil-water-balance model to estimate recharge to Blue Ridge, Piedmont, and Mesozoic Basin fractured-rock aquifers, Fauquier County, Virginia, 1996 through 2015: U.S. Geological Survey Scientific Investigations Report 2019–5056, 22 p., accessed September 1, 2020, at https://doi.org/10.3133/sir20195056.
McCoy, K.J., White, B.A., Yager, R.M., and Harlow, G.E., Jr., 2015, Hydrogeology and simulation of groundwater flow in fractured-rock aquifers of the Piedmont and Blue Ridge Physiographic Provinces, Bedford County, Virginia: U.S. Geological Survey Scientific Investigations Report 2015–5113, 54 p., accessed September 1, 2020, at https://doi.org/10.3133/sir20155113.
Nottmeier, A.M., 2015, Regional potentiometric surface of the Ozark aquifer in Arkansas, Kansas, Missouri, and Oklahoma, November 2014 – January 2015: U.S. Geological Survey Scientific Investigations Map 3348, 1 sheet, accessed February 16, 2022, at https://doi.org/10.3133/sim3348.
Peck, M.F., and Payne, D.F., 2003, Development of an estimated water-table map for coastal Georgia and adjacent parts of Florida and South Carolina: Proceedings of the 2003 Georgia Water Resources Conference, April 23–24, 2003, at the University of Georgia, accessed October 22, 2020, at https://smartech.gatech.edu/bitstream/handle/1853/48492/Peck_6.10.31.pdf? sequence=1&isAllowed=y.
PRISM Climate Group, 2019, dataset Norm81m (created December 7, 2019): Oregon State University web page, accessed February 10, 2021, at http://prism.oregonstate.edu/normals.
Virginia Department of Environmental Quality, 2020, Status of Virginia’s water resources: Virginia Department of Environmental Quality web page, 56 p., accessed February 11, 2021, at https://www.deq.virginia.gov/home/showpublisheddocument?id=2119.
U.S. Geological Survey, 2011, 3D Elevation Data Program, 3-meter resolution digital elevation model: U.S. Geological Survey National Map web page, accessed September 14, 2020, at https://apps.nationalmap.gov/downloader/.
U.S. Geological Survey, 2020, Water use data for Virginia: U.S. Geological Survey National Water Information System database, accessed February 11, 2021, at https://waterdata.usgs.gov/va/nwis/water_use?format=html_table&rdb_compression=file&wu_area=County&wu_year=ALL&wu_county=061&wu_category=ALL&wu_county _nms=Fauquier%2BCounty&wu_category_nms=--ALL%2BCategories--.
Appendix 1. Site information for wells included in the groundwater-level survey of Fauquier County, Virginia, October–November 2018
Table 1.1.
Site information for wells included in the groundwater-level survey of Fauquier County, Virginia, October–November 2018[Site locations shown in figure 2 and listed roughly from north to south. DDMMSS.S, degrees minutes, and seconds of latitude or longitude]
Datum
Vertical coordinate information is referenced to the National Geodetic Vertical Datum of 1929 (NGVD 29).
Horizontal coordinate information is referenced to the North American Datum of 1983 (NAD 83).
Altitude, as used in this report, refers to distance above the vertical datum.
Abbreviations
blsd
below land surface datum (groundwater level and well depths)
DDMMSS
degrees, minutes, seconds (latitude and longitude)
DEM
digital elevation model
FCWSA
Fauquier County Water and Sanitation Authority
GIS
geographic information system
GPS
Global Positioning System
NHD
National Hydrography Dataset
NWIS
National Water Information System
RMSE
root-mean-squared error
USGS
U.S. Geological Survey
VADEQ
Virginia Department of Environmental Quality
For additional information, contact:
Director, Virginia and West Virginia Water Science Center
U.S. Geological Survey, 1730 East Parham Road, Richmond, Virginia 23228
Or visit our website at https://www.usgs.gov/centers/va-wv-water
Publishing support provided by the West Trenton Publishing Service Center.
Disclaimers
Any use of trade, firm, or product names is for descriptive purposes only and does not imply endorsement by the U.S. Government.
Although this information product, for the most part, is in the public domain, it also may contain copyrighted materials as noted in the text. Permission to reproduce copyrighted items must be secured from the copyright owner.
Suggested Citation
Kearns, M.R., and McCoy, K.J., 2022, Groundwater-level contour map of Fauquier County, Virginia, October–November 2018: U.S. Geological Survey Scientific Investigations Report 2022–5014, 17 p., https://doi.org/10.3133/sir20225014.
ISSN: 2328-0328 (online)
ISSN: 2328-031X (print)
Study Area
| Publication type | Report |
|---|---|
| Publication Subtype | USGS Numbered Series |
| Title | Groundwater-level contour map of Fauquier County, Virginia, October-November 2018 |
| Series title | Scientific Investigations Report |
| Series number | 2022-5014 |
| DOI | 10.3133/sir20225014 |
| Publication Date | March 21, 2022 |
| Year Published | 2022 |
| Language | English |
| Publisher | U.S. Geological Survey |
| Publisher location | Reston, VA |
| Contributing office(s) | Virginia and West Virginia Water Science Center |
| Description | Report: vi, 17 p.; Data Release |
| Country | United States |
| State | Virginia |
| County | Fauquier County |
| Online Only (Y/N) | N |
| Additional Online Files (Y/N) | N |