

Using Microbial Source Tracking To Identify Fecal Contamination Sources in Sag Harbor on Long Island, New York
Links
- Document: Report (1.69 MB pdf) , HTML , XML
- Related Work: Scientific Investigations Report 2021–5033 - Overview and Methodology for a Study To Identify Fecal Contamination Sources Using Microbial Source Tracking in Seven Embayments on Long Island, New York
- Data Release: USGS National Water Information System database - USGS water data for the nation
- NGMDB Index Page: National Geologic Map Database Index Page (html)
- Download citation as: RIS | Dublin Core
Acknowledgments
The authors wish to thank members of the Bureau of Shellfisheries at the New York State Department of Environmental Conservation Division of Marine Resources for their field efforts, the Suffolk County Department of Health Public and Environmental Health Laboratory for coordinating with field crews and sample analysis, and the Village of Sag Harbor’s Harbor Committee for providing local knowledge and field support.
Executive Summary
The U.S. Geological Survey worked collaboratively with the New York State Department of Environmental Conservation to assess the potential sources of fecal contamination entering seven estuarine embayments across Long Island, New York, from June 2018 to July 2019. Water samples are routinely collected by the New York State Department of Environmental Conservation in Long Island embayments and analyzed for fecal coliform bacteria, an indicator of fecal contamination, to determine the closure of shellfish beds for harvest and consumption. Concentrations of fecal coliform signify the potential for pathogenic (disease-causing) bacteria to be present.
Indicator bacteria alone cannot determine the biological or geographical sources of contamination. Microbial source tracking (MST) is a method used to determine these sources of contamination. Microbial source tracking laboratory techniques can ascertain whether genetic material obtained from Bacteroides or Helicobacter bacteria in water or sediment is consistent with humans, canines (dogs), ruminants (deer, sheep), or waterfowl. Bacteroides and Helicobacter are genera of bacteria found in the gut of most warm-blooded animals. These techniques can also quantify the concentration of genetic markers found.
Information such as the location, weather and season, surrounding land use, and additional water-quality data for the location where the sample was collected help determine the geographical source and conveyance of land-based water to the embayment. The presence of genetic material and fecal coliform in samples collected at the same time is important to show that the fecal coliform is likely from the host source detected. It is possible for waters with waste infiltration to have genetic material present but no fecal indicators, such as disinfected water from a sewage treatment plant or from groundwater that has passed through a sandy aquifer.
Water samples were collected in the summer and winter seasons. In each of the two seasons, one sample was collected in dry weather and one, after a substantial rainfall. Groundwater and sediment samples were also collected throughout the study. Surface-water source sites sampled for Sag Harbor on Long Island, New York, include the Ligonee Brook Culvert, Otter Pond Culvert, Paynes Creek near Marjorie Lane, and Sag Harbor Sewage Treatment Plant Outfall sites.
Human, canine, and waterfowl fecal contributions to Sag Harbor were detected across the landscape. Among the potential sources of fecal-contaminated water contributing to Sag Harbor—groundwater, pond and wetland drainage, stormwater (municipal separate storm sewer systems), marinas (boats), and the Sag Harbor sewage treatment plant—pond and wetland drainage and stormwater conveyances were the most likely transport mechanisms of fecal contamination into Sag Harbor.
The most substantial source of fecal contamination to Sag Harbor was found to be discharge from sites draining ponds and wetlands, particularly during the summer months when waterfowl are more concentrated and tourism peaks. Fecal coliform contamination at these site types is increased by stormwater runoff, which is another substantial source. Sites with high fecal coliform bacteria concentrations in the summer that are exacerbated by stormwater include the Ligonee Brook Culvert and Otter Pond Culvert sites. Contributions of fecal contamination did not appear to be attributable to the Sag Harbor sewage treatment plant or to boats and marinas in Sag Harbor. Given the lack of human-associated marker detections at source sites in Sag Harbor, the MST results indicated minimal influence from septic systems. Groundwater also showed minimal to no contributions to fecal coliform bacteria load into the harbor, which is consistent with results throughout Long Island. The sediment sampled at the Windmill Beach site did not contain fecal coliform bacteria and is unlikely to act as a source during resuspension events, such as an ebbing (outgoing) tide, storm-driven waves (particularly at low tide), and boat wakes.
A classification scheme was developed that considered conditions such as high fecal coliform concentrations (particularly in dry weather samples) and contributions from human and canine waste based on detection of MST markers. The classes of sites were assessed to assist stakeholders and resource managers in prioritizing which source sites are consistently contributing fecal coliforms to Sag Harbor throughout the year. The Ligonee Brook Culvert site was determined to contribute substantial fecal contamination to Sag Harbor of the sites tested in this study.
Introduction
To better understand fecal contamination sources in coastal embayments of Long Island, New York, the U.S. Geological Survey (USGS) collected microbial source tracking (MST) and fecal coliform bacteria (FC) data from seven embayments from June 2018 to July 2019 (U.S. Geological Survey, 2020a). The objective of this research is to identify the different pathogen sources, both the host organism (such as human, mammals, or birds) and geographic origin (such as urban and storm runoff and submarine groundwater discharge), to embayments with fecal contamination. The embayments selected represent a mix of sewered and unsewered areas, differing levels of impervious land cover, varying population density, and a variety of land-use types so as to transfer what is learned to other areas beyond the seven studied. In total, 353 samples were collected in the seven embayments on Long Island. These were primarily surface-water samples, but also include 17 groundwater, 11 sediment, 2 sewage influent, and 8 fecal samples.
The presence of fecal contamination in Sag Harbor on Long Island, New York, and resulting hazards posed to marine resources and human health are of increasing concern. Recreational uses of the harbor, including shellfishing and public bathing, are frequently restricted due to high counts of FC, which are used as indicators for when pathogens may be present. Pathogen loads can be influenced by watershed land use, proximity to point sources such as municipal separate storm sewer systems, tidal exchange and circulation transporting pathogens from outside the study area (Gao and others, 2015), sediment resuspension (O’Mullan and others, 2019), and human recreation (including boating). Sewage treatment plants can also act as point sources (through effluent discharge) for pathogens when standard operations and procedures for disinfection are compromised. Nonpoint sources may include shallow groundwater discharge because many of the areas surrounding Sag Harbor still rely on onsite wastewater disposal systems, such as cesspools and septic systems. Through routine FC monitoring, the New York State Department of Environmental Conservation (NYSDEC) has identified fecal contamination as a concern in Sag Harbor. Microbial source tracking techniques are necessary to determine the dominant source (human, canine, ruminant, waterfowl) and geographic origin of FC, using land use, topography, and hydrology to establish a framework. The success of future pathogen-control measures may be measured in the decline in FC concentrations.
Site Description
Sag Harbor is on the northern shore of the south fork of Long Island in the townships of Southampton and East Hampton, Suffolk County, New York. It includes Paynes Creek and several coves interconnected by narrow inlets. Otter Pond exchanges flow with Upper Sag Harbor Cove. Water from Upper Sag Harbor Cove and Morris Cove passes through The Little Narrows where it meets inputs from Ligonee Brook. Water from The Little Narrows and Paynes Creek flows through The Big Narrows to Sag Harbor Cove, through another narrow inlet, and into Sag Harbor Bay (fig. 1). Land use is mostly residential to the west and becomes more commercial to the east where marinas, the village of Sag Harbor, and the Sag Harbor sewage treatment plant are located. The sewage treatment plant primarily services the commercial areas in the village of Sag Harbor, whereas the majority of residences still rely on onsite wastewater disposal systems.
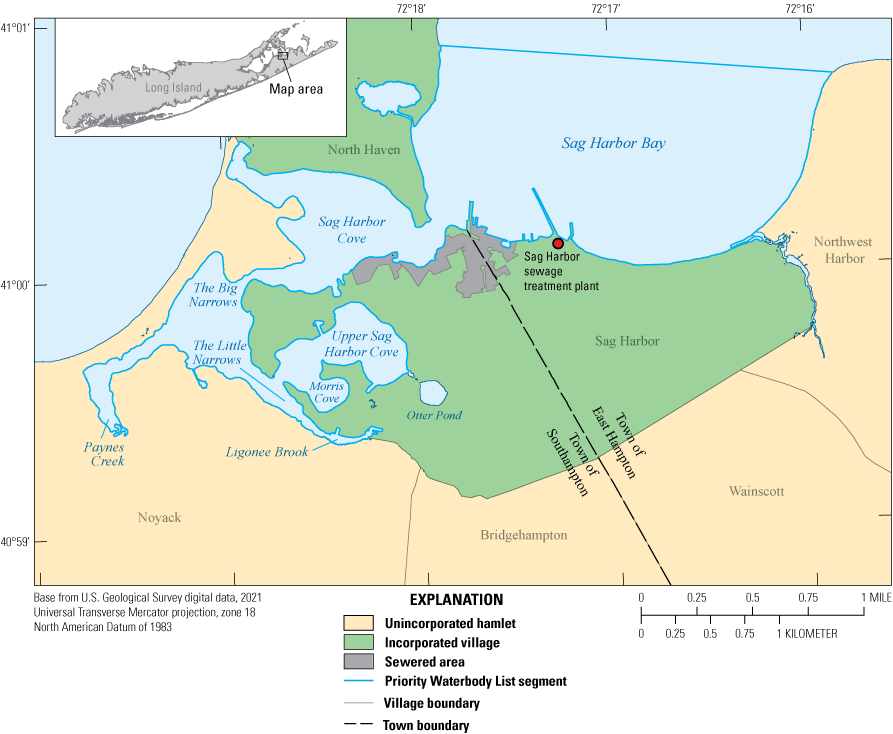
Map showing the extent of the Sag Harbor and Sag Harbor Cove Priority Waterbody List segment on Long Island, New York, as designated by the New York State Department of Environmental Conservation (2020), including the sewered area surrounding Sag Harbor and the Sag Harbor sewage treatment plant. Areas that are not sewered are served by cesspools or septic tanks.
Potential contamination sources to Sag Harbor include stormwater runoff, particularly at road ends, boat ramps, and marinas and from discharge from inland ponds and creeks. Illicit boat discharges and effluent from the Sag Harbor sewage treatment plant are also possible contributors of fecal contamination to the harbor. Surface-water source samples were collected (U.S. Geological Survey, 2020a) for the Sag Harbor study (fig. 2; table 1.1) at the following sites:
-
• The Ligonee Brook Culvert site flows continuously and is supplied by water from Long Pond, wetlands, and stormwater. The culvert drains into the southernmost point of Ligonee Brook and is surrounded by residential land use.
-
• The Otter Pond Culvert site drains water from Otter Pond, which is home to waterfowl and is surrounded by residential land use. The culvert flows under Main Street and discharges directly into the southeastern part of Upper Sag Harbor Cove.
-
• The Paynes Creek near Marjorie Lane sampling site is on a road end, approximately where Paynes Creek bends to the east. The shoreline is buffered by shallow wetlands and is primarily surrounded by low density residential properties and private boat docks. Contamination sources include wetlands, direct stormwater runoff from road ends, marinas (boats), and residential onsite wastewater disposal systems.
-
• The Sag Harbor Sewage Treatment Plant Outfall site is on the southeastern shore of Sag Harbor Bay. Water entering the sewage treatment plant undergoes tertiary treatment and disinfection by ultraviolet light. Most business and some residential areas in the village of Sag Harbor are served by this sewage treatment plant.
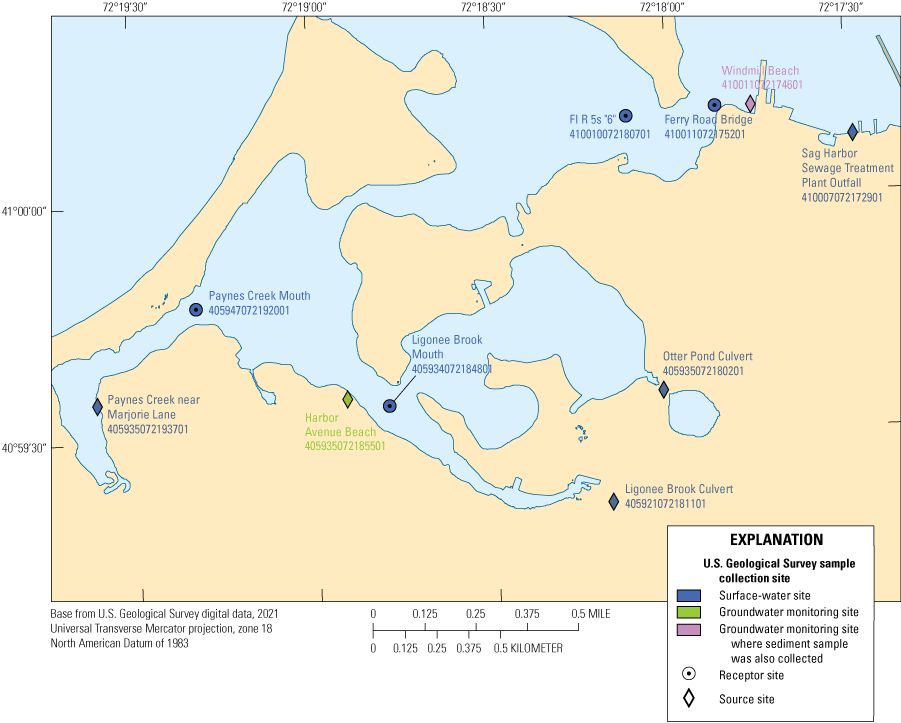
Map showing the locations where surface-water, groundwater, and sediment samples were collected by the U.S. Geological Survey for microbial source tracking in Sag Harbor on Long Island, New York. Data are from the U.S. Geological Survey (2020a).
Approach and Methods
Sampling Methods
Samples were collected and analyzed in accordance with methods detailed in Tagliaferri and others (2021). Surface-water samples in Sag Harbor were collected from June 2018 to June 2019, and groundwater and sediment samples were collected in June 2019. All water-quality and sediment data collected in the field and those analyzed in laboratories as part of this study are available from the U.S. Geological Survey (USGS) National Water Information System (NWIS) database (U.S. Geological Survey, 2020a).
Wet conditions were defined as more than 0.25 inch (in.) of precipitation in 24 hours or 0.50 in. in 48 hours. Dry conditions were defined as less than 0.25 in. of precipitation in 72 hours. Rainfall totaled 0.68 in. on August 12, 2018, designating samples collected in Sag Harbor on August 13, 2018, as summer wet samples (more than 0.25 in. within 24 hours). Winter wet samples were collected in Sag Harbor on March 4, 2019, with 1.30 in. of precipitation falling March 4, 2019. Rainfall values were obtained from the Montauk Airport weather station (KMTP; Weather Underground, 2022). From June 2018 to June 2019, 10 sites were sampled within Sag Harbor, yielding 31 surface-water samples, 2 groundwater samples, and 1 sediment sample collected concurrently with the groundwater sample at the Windmill Beach site. Of the surface-water sites, four were considered source sites (waters flowing directly into the harbor from the land through culverts and groundwater discharge), and four were considered receptor sites (the harbor itself). Sixteen surface-water samples were collected under wet conditions, and 15, under dry conditions; 15 surface-water samples were collected in the summer, and 16, in the winter.
Laboratory Methods
Laboratory methods used for this study are detailed in Fisher and others (2020). Samples for fecal coliforms were analyzed at Suffolk County Department of Health Services Public Environmental Health Laboratory (PEHL). Additional information was either observed or compiled to facilitate interpretation of data. Precipitation measurements from the Montauk Airport weather station (Weather Underground, 2022) were used to determine whether weather conditions were considered dry or wet. Relative tide stage as noted by USGS field personnel and verified based on tidal predictions available (National Oceanic and Atmospheric Administration, undated) was documented along with the sample information in NWIS (U.S. Geological Survey, 2020a). Land-cover and sewer district geographic information system coverages (Nassau County, 2015; Suffolk County, 2020; U.S. Geological Survey, 2020b) were used for data interpretation. These data support the MST results to increase confidence in the geographical source of the water and likely transport mechanisms of fecal contamination to Sag Harbor.
Results
Results of MST and FC were assessed based on concentrations, presence or absence, and relative abundance of host markers with respect to surface-water source and receptor sites. Differences in MST markers and FC concentrations were also compared seasonally and conditionally (that is, wet or dry), with dry weather discharges with high FC concentrations from municipal separate storm sewer system source sites being of particular concern.
Microbial Source Tracking
In Sag Harbor, at least one human-, canine-, or waterfowl-associated marker was detected in 14 of 31 surface-water samples. The only sample that contained multiple markers (human- and canine-associated) was the dry winter sample at the Sag Harbor Sewage Treatment Plant Outfall site. Human-associated Bacteroides (HF183) markers were the most frequently detected (eight positive detections), followed by waterfowl-associated Helicobacter (GFD) markers (five positive detections) and canine-associated Bacteroides (BacCan) markers (two positive detections). All samples collected at the Sag Harbor Sewage Treatment Plant Outfall (source) site were positive for HF183, as were three of four samples at the Ferry Road Bridge (receptor) site and one of four at the Paynes Creek Mouth (receptor) site. The BacCan marker was detected in two source samples and no receptor samples, suggesting minimal canine contamination in Sag Harbor during this study. There were five detections for the GFD marker, three in wet summer conditions and two in dry winter conditions. Two detections were in receptor sites, and three were in source sites, suggesting the presence of avian fecal contamination throughout the Sag Harbor landscape.
Host Specific Markers
Reporting limits for the three predominant MST markers (HF183, BacCan, and GFD) detected in Sag Harbor varied slightly because of analytical processes, such as required dilutions because of matrix interferences. Understanding occurrence of the predominant MST markers in Sag Harbor can be used to help prioritize locations for additional investigation and infrastructure improvement and provide a baseline for host contributions when prioritizing sites of concern for assessing FC and after total maximum daily load implementation.
HF183
At Sag Harbor, the human marker was detected at concentrations above the reporting limit in 8 of the 31 samples from 4 surface-water sites (table 1). The human marker was also detected at two receptor sites (Ferry Road Bridge and Paynes Creek Mouth) and one source site (Sag Harbor Sewage Treatment Plant Outfall). This is indicative of minimal inputs from potential inland sources (including illicit connections to the stormwater drain system). Concentrations of HF183 were of the same order of magnitude (hundreds of copies per 100 milliliters [mL]) at receptor sites and were variable at the single source site with positive detections (hundreds to tens of thousands of copies per 100 mL; fig. 3). Concentrations of positive HF183 detections within the harbor were close to the reporting limit and not associated with high FC concentrations (table 1.2; U.S. Geological Survey, 2020a), making it unlikely that the source was from boats and marina discharges. The Sag Harbor Sewage Treatment Plant Outfall site was the only source site where the human marker was detected in all four samples; however, these samples were associated with low to nondetectable FC concentrations. The concentrations of HF183 in samples collected during the winter (18,000 and 76,000 copies/100 mL) were considerably higher than in the summer (680 and 6,300 copies/100 mL). Of the eight samples positive for HF183, five had concentrations below detection for FC, one had just above the detection limit (20 most probable number per 100 mL [MPN/100 mL]), and two were not tested for FC (table 1.2; U.S. Geological Survey, 2020a). The sediment and groundwater samples at the Windmill Beach site and the groundwater sample collected at the Harbor Avenue Beach site were negative for HF183.
Table 1.
Summary of microbial source tracking results in surface-water samples for sites sampled in Sag Harbor on Long Island, New York.[Ratios are number of samples with detections greater than reporting limit per total number of samples. Reporting limits vary due to analytical processes and matrix interferences. BacCan, canine-associated Bacteroides marker; GFD, waterfowl-associated Helicobacter marker; HF183, human-associated Bacteroides marker; Rum2Bac, ruminant-associated Bacteroides marker]
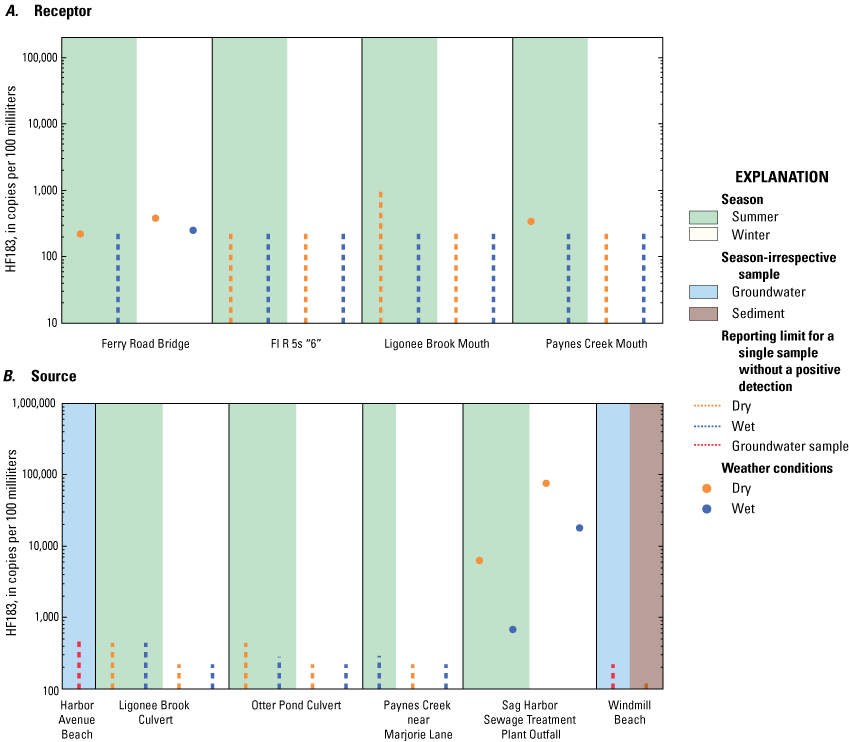
Graphs showing the concentrations of the human-associated Bacteroides (HF183) marker, in copies per 100 milliliters for water samples and copies per gram dry weight for sediment samples, from A, receptor and B, source sites in Sag Harbor on Long Island, New York, under various surface-water sample conditions. Dashed lines indicate reporting limit for a single sample without a positive detection. Reporting limits vary due to analytical processes and matrix interferences. Scales for marker concentrations are fixed to allow for easy comparison with other embayment study areas on Long Island.
BacCan
Twenty-nine of 31 surface-water samples had concentrations below the detection limit for the canine marker. Two positive BacCan detections were in dry conditions, one, in summer (2,400 copies/100 mL) at the Ligonee Brook Culvert site, and one, in winter (1,300 copies/100 mL) at the Sag Harbor Sewage Treatment Plant Outfall site (fig. 4). The positive BacCan detection at the Ligonee Brook Culvert site (2,400 copies/100 mL) corresponded to the second highest FC concentration detected within Sag Harbor (300 MPN/100 mL; table 1.2; U.S. Geological Survey, 2020a). The concentration of fecal coliform at the Sag Harbor Sewage Treatment Plant Outfall site was below detection (less than [<] 18 MPN/100 mL) despite a positive detection for the canine marker in the same sample. The sediment and groundwater samples collected at the Windmill Beach site and the groundwater sample collected at the Harbor Avenue Beach site were negative for BacCan. The absence of the canine marker in the majority of Sag Harbor samples during this study indicates little to no canine contribution to FC.
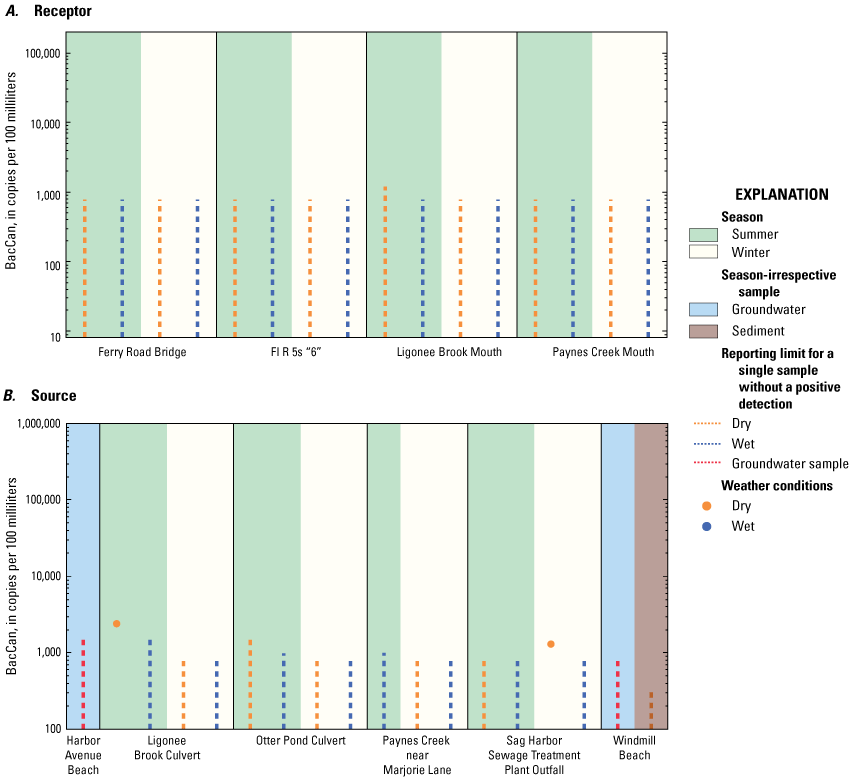
Graphs showing the concentrations of the canine-associated Bacteroides (BacCan) marker, in copies per 100 milliliters for water samples and copies per gram dry weight for sediment samples, from A, receptor and B, source sites in Sag Harbor on Long Island, New York, under various surface-water sample conditions. Dashed lines indicate reporting limit for a single sample without a positive detection. Reporting limits vary due to analytical processes and matrix interferences. Scales for marker concentrations are fixed to allow for easy comparison with other embayment study areas on Long Island.
GFD
The waterfowl marker was detected in 3 of 15 surface-water samples taken at source sites and 2 of 16 samples collected at receptor sites at Sag Harbor (table 1). Three of the five positive GFD detections were during wet summer conditions, with concentrations ranging from 960 to 4,600 copies/100 mL (fig. 5). The one positive waterfowl marker detection collected during dry conditions also had the lowest concentration (680 copies/100 mL) of GFD in all Sag Harbor. The highest concentration of GFD was at the FI R 5s “6” site (4,600 copies/100 mL), with a corresponding FC concentration of 40 MPN/100 mL (table 1.2; U.S. Geological Survey, 2020a). The second highest concentration of GFD (2,100 copies/100 mL) was at the Paynes Creek near Marjorie Lane site and corresponded to the highest FC concentration observed within Sag Harbor during this study (2,400 MPN/100 mL; table 1.2; U.S. Geological Survey, 2020a). Two of the five samples positive for the waterfowl marker exhibited FC concentrations above 49 MPN/100 mL, the 90th percentile concentration determined by the NYSDEC as part of the National Shellfish Sanitation Program (NSSP) closure criteria (U.S. Food and Drug Administration, 2019). The sediment and groundwater samples collected at the Windmill Beach site and the groundwater sample collected at the Harbor Avenue Beach site were negative for waterfowl markers.
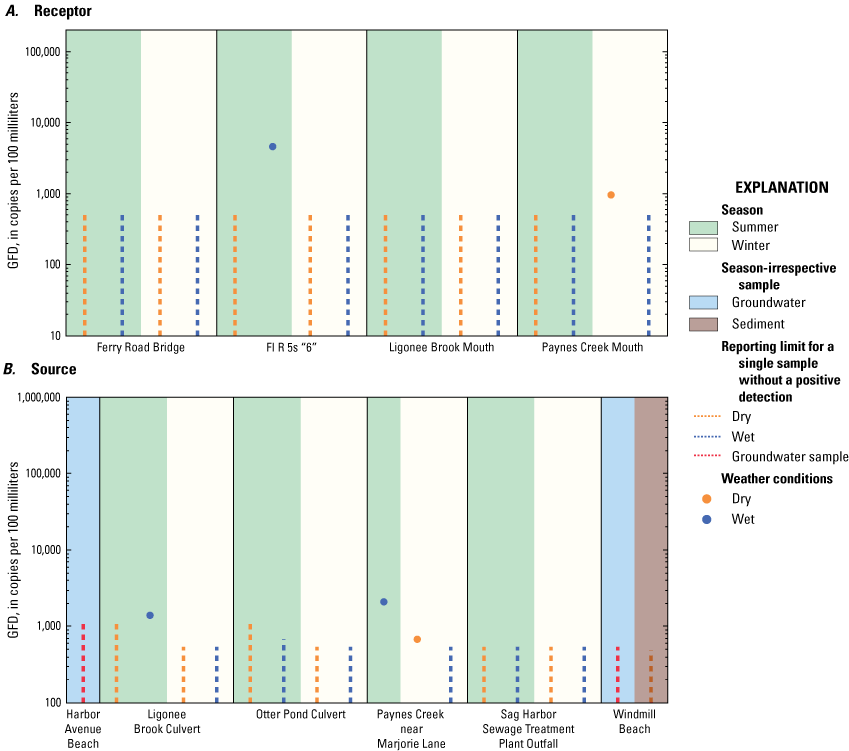
Graphs showing the concentrations of the waterfowl-associated Helicobacter (GFD) marker, in copies per 100 milliliters for water samples and copies per gram dry weight for sediment samples, from A, receptor and B, source sites in Sag Harbor on Long Island, New York, under various surface-water sample conditions. Dashed lines indicate reporting limit for a single sample without a positive detection. Reporting limits vary due to analytical processes and matrix interferences. Scales for marker concentrations are fixed to allow for easy comparison with other embayment study areas on Long Island.
Fecal Coliform Bacteria
Concentrations in samples from source sites ranged from at or below the reporting limit in 64 percent of samples to 2,400 MPN/100 mL in one summer sample from the Paynes Creek near Marjorie Lane site. Concentrations for samples collected at receptor sites ranged from at or below the reporting limit in 69 percent of samples to 80 MPN/100 mL in one summer sample from the Paynes Creek Mouth site (table 1.2; U.S. Geological Survey, 2020a). Of the 31 surface-water samples collected in Sag Harbor, the concentrations of 19 samples were below the FC reporting limit, 8 samples were above, and 4 samples were not tested for FC. Six of the eight FC samples with concentrations above the reporting limit for FC were sampled under wet conditions, suggesting that FC concentrations are influenced by weather-related events in this embayment. Six samples had concentrations that were greater than 49 MPN/100 mL.
The two culverts sampled during this study (the Ligonee Brook Culvert and Otter Pond Culvert sites) had similar FC concentrations but differing marker detections. The Ligonee Brook Culvert site exhibited FC concentrations similar to the Otter Pond Culvert site in the dry summer sample (300 copies/100 mL each) and the wet summer sample (110 and 130 MPN/100 mL respectively), but the Otter Pond Culvert site had no marker detections, whereas the Ligonee Brook Culvert site had positive detections for the canine and waterfowl markers. The only other site that exhibited no positive marker detections (and exhibited FC concentrations at or below the reporting limit for FC) was the Ligonee Brook Mouth site, which is just downgradient from the Ligonee Brook Culvert site.
The relation between FC and marker detection is not straightforward. Fecal coliform and specific host-associated markers may decay at different rates and be present in different abundances. Host-associated markers were shown to decay more rapidly than FC (Drozd and others, 2013; Rogers and others, 2011). In general, the highest FC concentrations were during wet weather conditions.
Nonpoint Sources of Fecal Coliform Bacteria
Potential nonpoint contributors of freshwater to Sag Harbor include groundwater seepage and direct stormwater runoff not conveyed by the municipal separate storm sewer systems. Groundwater collected from the Windmill Beach and Harbor Avenue Beach sites had concentrations below detection for all MST markers, making groundwater an unlikely contributor to fecal contamination to the harbor during this study. Another nonpoint source that can contribute to fecal contamination in water samples is sediment during resuspension (O’Mullan and others, 2019). To better understand the contribution of shoreline beach sediment, a sample was collected at the Windmill Beach site, in which no MST markers were detected (table 1.2; U.S. Geological Survey, 2020a).
Classification of Source Sites
The sites were assessed to better understand geographical sources and transport mechanisms to surface-water receptor sites and the relationship between FC and MST marker presence and abundance (table 2). Source sites were assigned a numeric classification as described in Tagliaferri and others (2021) to aid in conceptualizing the degree of contamination potential (table 3). Classifications are based on a sliding scale, with class 1 sites being the most contaminated and class 5 sites being the least contaminated.
Table 2.
Geographical sources of water for sample locations in Sag Harbor on Long Island, New York, and the potential for these sites to have contributed to the fecal coliform concentrations observed in the samples.[MST, microbial source tracking; FC, fecal coliform bacteria; X, potential contributor; —, not a likely contributor based on current data]
Table 3.
Sample results for fecal coliform and microbial source tracking markers by source site type at Sag Harbor on Long Island, New York.[Proposed classification considers concentrations of fecal coliform bacteria (FC) above 49 most probable number per 100 milliliters (MPN/100 mL), dry weather discharges, and influences of human sewage and canine waste. An FC concentration of 49 MPN/100 mL is the 90th percentile concentration determined by the New York State Department of Environmental Conservation as part of the National Shellfish Sanitation Program closure criteria (U.S. Food and Drug Administration, 2019). HF183, human-associated Bacteroides marker; BacCan, canine-associated Bacteroides marker; —, no data]
Ligonee Brook Culvert—Priority Rank 2
The samples collected at the Ligonee Brook Culvert site had the highest instance of canine markers in Sag Harbor along with elevated concentrations of FC in wet and dry summer samples (110 MPN/100 mL and 300 MPN/100 mL respectively). Human and ruminant markers were not detected; however, waterfowl markers were detected in the summer, wet weather sample, whereas canine markers were detected in the summer, dry weather sample. This is likely due to congregation of waterfowl and the use of public spaces for dog walking in summer months. Winter samples had no marker detections and low FC in both wet and dry weather. Seasonal influences on FC concentrations are predicted at this site due to the observed increase in FC concentration during the summer season relative to winter samples. The culvert flows continuously and is suspected to contribute high FC concentrations related to stormwater catch basins and inland ponds, particularly during the summer season.
Otter Pond Culvert—Priority Rank 4
The Otter Pond culvert collects stormwater and directs discharge from inland ponds and wetlands into Upper Sag Harbor Cove. This location is primarily affected by upland surface-water and stormwater drainage that contributes substantial FC to Upper Sag Harbor Cove during the summer season. Fecal coliform was detected only in the summer samples, both of which had concentration above 49 MPN/100 mL, the 90th percentile concentration determined by the NYSDEC as part of the NSSP closure criteria (U.S. Food and Drug Administration, 2019). Human, canine, waterfowl, and ruminant markers were not detected at this site during this study, indicating transport and degradation of the MST markers in the summer months or fecal contamination from an untested source organism.
Paynes Creek Near Marjorie Lane—Priority Rank 5
Samples collected at the Paynes Creek near Marjorie Lane site exhibited the highest instance of fecal coliform in Sag Harbor (2,400 MPN/100 mL). Waterfowl markers were detected in the wet, summer sample and the dry, winter sample. The highest waterfowl marker concentration at this site (2,100 copies/100 mL) also corresponded to the highest FC concentration at this site and the Harbor as a whole (2,400 MPN/100 mL). The low priority rank for Paynes Creek may be an artifact of missing the dry summer sample. Despite Paynes Creek having the highest FC and waterfowl marker concentrations, the median FC concentration is below detection and no human or canine markers were found in the three samples collected, designating this site as priority rank 5 (Tagliaferri, 2020). Populations of birds are greatest in the summer season and may contribute to the seasonal observation of FC. The lower FC and marker concentration (or lack thereof) in the winter samples contrasts with the higher FC and marker concentration in the wet summer sample. This suggests seasonal influence of FC in Sag Harbor; however, the dry, summer sample was unavailable for this analysis, thereby limiting our understanding of this FC source. Human, ruminant, and canine markers were not detected at this site during this study, indicating minimal to no FC contributions from onsite wastewater disposal systems or boat septic at this site.
Sag Harbor Sewage Treatment Plant Outfall—Priority Rank 5
The Sag Harbor Sewage Treatment Plant Outfall site exhibited low FC concentrations that ranged from nondetect (<18 MPN/100 mL) to 20 MPN/100 mL in samples analyzed by the PEHL (table 1.2; U.S. Geological Survey, 2020a). Human markers were detected in all four samples at concentrations of 680 to 76,000 copies/100 mL, which was consistently higher than other source sites. These results show that the sewage treatment plant outfall is not a significant source of FC to Sag Harbor but may contribute to the presence of human markers detected in receptor samples.
Sediment—Priority Rank 5
Recent research (Hassard and others, 2016; O’Mullan and others, 2019) has shown that resuspension of sediment along natural shorelines can cause a spike in FC concentrations. Therefore, it is likely that, during conditions that result in high wave energy, sediment can act as a source of FC when sediment is resuspended in the water column because of tidal movement, storms, or boat activity. Fecal coliform concentrations are not available for the sandy sediment sample collected at the Windmill Beach on the southeast side of Sag Harbor. Human, waterfowl, and canine markers were not detected, indicating minimal to no contribution of fecal contamination from these sources. Sediment in this area is likely not a significant source of FC to Sag Harbor.
Summary
The U.S. Geological Survey, in collaboration with the New York State Department of Environmental Conservation, assessed the potential sources of fecal contamination entering Sag Harbor on Long Island, New York, from June 2018 to June 2019. Water samples are routinely collected by the New York State Department of Environmental Conservation in Long Island embayments and analyzed for fecal coliform bacteria, an indicator of fecal contamination, to determine the closure of shellfish beds for harvest and consumption. Fecal indicator bacteria, such as fecal coliform, signify the potential for pathogenic (disease-causing) bacteria to be present.
Host sources of fecal contamination in Sag Harbor were assessed based on bacterial Bacteroides and Helicobacter microbial source tracking (MST) markers. Overall, human contributions were present; however, by evaluating the MST markers alongside fecal coliform data and land-use information, geographical sources of fecal contamination discharging from the culverts and outfalls sampled as part of this study were better differentiated. Among the potential sources of fecal-contaminated water contributing to Sag Harbor—groundwater, pond and wetland drainage, stormwater (municipal separate storm sewer system), marinas (boats), and the Sag Harbor sewage treatment plant—pond and wetland drainage and stormwater conveyances were the most likely transport mechanisms of fecal contamination into Sag Harbor. The most substantial source of fecal contamination to Sag Harbor was found to be discharge from sites draining ponds and wetlands, particularly during the summer months when tourism and waterfowl population in Sag Harbor are at a peak. Fecal coliform at sites that drain ponds and wetlands is increased by stormwater runoff, which is another substantial source. Sites with high fecal coliform bacteria (FC) concentrations in the summer that is exacerbated by stormwater include the Ligonee Brook Culvert and Otter Pond Culvert sites.
Three of the sites sampled for this study had high FC concentrations in the summer, one of which was positive for canine MST markers (Ligonee Brook Culvert), and another with positive waterfowl markers (Paynes Creek near Marjorie Lane). The Ligonee Brook Culvert, Paynes Creek near Marjorie Lane, and Otter Pond Culvert sites were identified as locations that contribute fecal contamination to Sag Harbor. Low concentrations of human markers within Sag Harbor coupled with low to no detections of FC suggests that boats do not substantially contribute to FC. The absence of FC and human MST markers in groundwater samples indicates that water from septic systems does not influence the harbor; however, elevated FC concentrations were not often detected. Further, the sandy sediment alongside Sag Harbor is unlikely to contribute FC when resuspended in the water column through tidal shifts or boat activity.
References Cited
Drozd, M., Merrick, N.N., Sanad, Y.M., Dick, L.K., Dick, W.A., and Rajashekara, G., 2013, Evaluating the occurrence of host-specific, general fecal indicators, and bacterial pathogens in a mixed-use watershed: Journal of Environmental Quality, v. 42, no. 3, p. 713–725, accessed June 23, 2021, at https://doi.org/10.2134/jeq2012.0359.
Fisher, S.C., McCarthy, B.A., Kephart, C.M., and Griffin, D.W., 2020, Assessment of water quality and fecal contamination sources at Hook Pond, East Hampton, New York: U.S. Geological Survey Scientific Investigations Report 2020–5071, 58 p., accessed June 23, 2021, at https://doi.org/10.3133/sir20205071.
Gao, G., Falconer, R.A., and Lin, B., 2015, Modelling the fate and transport of faecal bacteria in estuarine and coastal waters: Marine Pollution Bulletin, v. 100, no. 1, p. 162–168, accessed June 23, 2021, at https://doi.org/10.1016/j.marpolbul.2015.09.011.
Hassard, F., Gwyther, C.L., Farkas, K., Andrews, A., Jones, V., Cox, B., Brett, H., Jones, D.L., McDonald, J.E., and Malham, S.K., 2016, Abundance and distribution of enteric bacteria and viruses in coastal and estuarine sediments—A review: Frontiers in Microbiology, v. 7, article 1692, 31 p., accessed June 23, 2021, at https://doi.org/10.3389/fmicb.2016.01692.
Nassau County, 2015, Nassau County DPW sanitary sewer collection districts: Nassau County data, accessed March 30, 2021, at https://www.arcgis.com/home/item.html?id=26d010a660d047c495d2226df26af81a.
National Oceanic and Atmospheric Administration, [undated], NOAA tide predictions: National Oceanic and Atmospheric Administration web page, accessed April 26, 2021, at https://tidesandcurrents.noaa.gov/.
New York State Department of Environmental Conservation, 2020, Waterbody inventory/priority waterbodies list: New York State Department of Environmental Conservation data, accessed December 3, 2020, at https://www.dec.ny.gov/chemical/36730.html.
O’Mullan, G.D., Juhl, A.R., Reichert, R., Schneider, E., and Martinez, N., 2019, Patterns of sediment-associated fecal indicator bacteria in an urban estuary—Benthic-pelagic coupling and implications for shoreline water quality: The Science of the Total Environment, v. 656, p. 1168–1177, accessed June 23, 2021, at https://doi.org/10.1016/j.scitotenv.2018.11.405.
Rogers, S.W., Donnelly, M., Peed, L., Kelty, C.A., Mondal, S., Zhong, Z., and Shanks, O.C., 2011, Decay of bacterial pathogens, fecal indicators, and real-time quantitative PCR genetic markers in manure-amended soils: Applied and Environmental Microbiology, v. 77, no. 14, p. 4839–4848, accessed June 23, 2021, at https://doi.org/10.1128/AEM.02427-10.
Suffolk County, 2020, GIS viewer—Suffolk County: Suffolk County data, accessed March 30, 2021, at https://gisportal.suffolkcountyny.gov/gis/home/.
Tagliaferri, T.N., Fisher, S.C., Kephart, C.M., Cheung, N., Reed, A.P., and Welk, R.J., 2021, Overview and methodology for a study to identify fecal contamination sources using microbial source tracking in seven embayments on Long Island, New York: U.S. Geological Survey Scientific Investigations Report 2021–5033, 8 p., accessed November 11, 2021, at https://doi.org/10.3133/sir20215033.
U.S. Food and Drug Administration, 2019, National shellfish sanitation program—Guide for the control of molluscan shellfish—2019 revision: U.S. Food and Drug Administration, 502 p., accessed March 1, 2021, at https://www.fda.gov/food/federalstate-food-programs/national-shellfish-sanitation-program-nssp.
U.S. Geological Survey, 2020a, USGS water data for the nation: U.S. Geological Survey National Water Information System database, accessed July 31, 2020, at https://doi.org/10.5066/F7P55KJN.
U.S. Geological Survey, 2020b, National land cover database: U.S. Geological Survey data, accessed March 30, 2021, at https://www.usgs.gov/centers/eros/science/national-land-cover-database.
Weather Underground, 2022, Montauk, NY weather conditions—Montauk Station: Weather Underground data, accessed February 17, 2022, at https://www.wunderground.com/weather/us/ny/montauk/KMTP.
Appendix 1. Sample Collection in Sag Harbor on Long Island, New York
Table 1.1.
Locations where samples were collected in Sag Harbor on Long Island, New York, for bacterial genetic markers and fecal coliform analysis.[Data are from the National Water Information System (U.S. Geological Survey, 2020). Samples collected include blanks and replicates. Sample conditions of wet and dry indicate whether a sample was influenced by storm or nonstorm conditions, respectively; EST, eastern standard time; —, sample collected irrespective of wet or dry conditions]
Table 1.2.
Data summary of all samples collected in Sag Harbor on Long Island, New York, for bacterial genetic markers and fecal coliform analysis.[Samples collected include blanks and replicates. Bacterial genetic markers are human-associated Bacteroides (HF183), ruminant-associated Bacteroides (Rum2Bac), waterfowl-associated Helicobacter (GFD), and canine-associated Bacteroides (BacCan) markers. Station data are available on the National Water Information System web interface (U.S. Geological Survey, 2020). Bacteroides samples were analyzed by the U.S. Geological Survey Ohio Microbiology Laboratory (Columbus, Ohio). Fecal coliform samples were analyzed by the Suffolk County Department of Health Services Public and Environmental Health Laboratory (PEHL; Hauppauge, New York). Values in bold indicate that the concentration was greater than the reporting limit; values preceded by a less than (<) symbol indicate the reporting limit for a given assay when a nondetect occurred. Reporting limits vary due to analytical processes and matrix interference. mL, milliliter; MPN/100 mL, most probable number per 100 milliliters; *measured in copies of genetic marker per gram dry weight; E, estimate; b, concentration was greater than the limit of quantification but less than the reporting limit; ~, duplicate qPCR results do not agree; V, result may be affected by contamination; —, assay was not performed]
Reference Cited
U.S. Geological Survey, 2020, USGS water data for the nation: U.S. Geological Survey National Water Information System database, accessed July 31, 2020, at https://doi.org/10.5066/F7P55KJN.
Supplemental Information
Concentrations of fecal coliform bacteria are given in most probable number per 100 milliliters (MPN/100 mL).
Concentrations of microbial source tracking markers are given in marker copies per 100 milliliters (copies/100 mL) or marker copies per gram dry weight (copies/gdw).
Abbreviations
BacCan
canine-associated Bacteroides marker
FC
fecal coliform bacteria
GFD
waterfowl-associated Helicobacter marker
HF183
human-associated Bacteroides marker
MPN
most probable number
MST
microbial source tracking
NYSDEC
New York State Department of Environmental Conservation
NWIS
National Water Information System
Rum2Bac
ruminant-associated Bacteroides marker
USGS
U.S. Geological Survey
For more information, contact
Director, New York Water Science Center
U.S. Geological Survey
425 Jordan Road
Troy, NY 12180–8349
dc_ny@usgs.gov
or visit our website at
https://www.usgs.gov/centers/ny-water
Publishing support provided by the Pembroke Publishing Service Center
Disclaimers
Any use of trade, firm, or product names is for descriptive purposes only and does not imply endorsement by the U.S. Government.
Although this information product, for the most part, is in the public domain, it also may contain copyrighted materials as noted in the text. Permission to reproduce copyrighted items must be secured from the copyright owner.
Suggested Citation
Tagliaferri, T.N., Fisher, S.C., Kephart, C.M., Cheung, N., Reed, A.P., and Welk, R.J., 2022, Using microbial source tracking to identify fecal contamination sources in Sag Harbor on Long Island, New York: U.S. Geological Survey Scientific Investigations Report 2022–5028, 17 p., https://doi.org/10.3133/sir20225028.
ISSN: 2328-0328 (online)
Study Area
| Publication type | Report |
|---|---|
| Publication Subtype | USGS Numbered Series |
| Title | Using microbial source tracking to identify fecal contamination sources in Sag Harbor on Long Island, New York |
| Series title | Scientific Investigations Report |
| Series number | 2022-5028 |
| DOI | 10.3133/sir20225028 |
| Publication Date | April 05, 2022 |
| Year Published | 2022 |
| Language | English |
| Publisher | U.S. Geological Survey |
| Publisher location | Reston, VA |
| Contributing office(s) | New York Water Science Center |
| Description | Report: vi, 17 p.; Data Release |
| Country | United States |
| State | New York |
| City | Sag Harbor |
| Other Geospatial | Long Island |
| Online Only (Y/N) | Y |
| Additional Online Files (Y/N) | N |