

Assessment of Streamflow Trends in the Eastern Dakotas, Water Years 1960–2019
Links
- Document: Report (13.7 MB pdf) , HTML , XML
- Dataset: USGS National Water Information System database —USGS water data for the Nation
- NGMDB Index Page: National Geologic Map Database Index Page (html)
- Download citation as: RIS | Dublin Core
Abstract
Hydrologic extremes, whether periods of drought or flooding, are occurring more frequently with greater severity and can have substantial economic impacts. Along with flooding, the timing and volume of streamflow also is changing across the United States. The focus of this report is to characterize a unique trend in mean annual streamflow occurring in eastern North and South Dakota, hereafter referred to as the eastern Dakotas, that is not being observed anywhere else in the conterminous United States.
Streamflow records for 1,853 U.S. Geological Survey streamgages obtained from the U.S. Geological Survey National Water Information System database with a continuous record of mean annual streamflow during water years 1960–2019 were included in this study. Using a Kendall tau statistical test (p-value less than or equal to 0.10), 573 streamgages had a statistically significant upward trend in mean annual streamflow and are primarily located in the Midwest and northeastern United States. Of the streamgages, 182 had a statistically significant downward trend and are located primarily in the western and southeastern States. Several sites had increases in streamflow between 100 and 500 percent. Most of the streamgages with the highest increases in mean annual streamflow are along the same rivers in the eastern Dakotas, regardless of basin size.
A comparison of mean annual streamflow of the last decade (2010–19) to the first decade (1960–69) of the study period shows that the largest increases in annual streamflow volumes in the United States also are in the eastern Dakotas. Among all 1,853 streamgages in the United States, the Sheyenne River near Warwick, North Dakota (U.S. Geological Survey station 05056000), has the greatest percent change, with an increase of 486 percent. Several factors may be contributing to increasing trends in streamflow in the eastern Dakotas and may include, in part, precipitation changes owing to climatic variation within the region, geologic makeup of the subsurface, and land-use changes. A better understanding of these research areas will help producers, resource managers, and infrastructure engineers to make more informed environmental and economic decisions.
Introduction
Hydrologic extremes, whether periods of drought or flooding, are occurring more frequently with greater severity (Norton and others, 2014). Along with flooding, the timing and volume of streamflow also is changing across the United States. For example, since record keeping began by the U.S. Geological Survey (USGS) and National Weather Service in 1889, 9 of the 10 largest flooding events in the Missouri River Basin have occurred since 1970 (Livneh and others, 2016); more than one-half of the top 10 flood events in Fargo, North Dakota, and Grand Forks, N. Dak., have occurred in the last 25 years (Dunbar, 2017; U.S. Geological Survey, 2022). Each of these flood events had short- and long-term consequences, which affected land, water, and ecosystem resource management decisions. Some of the decisions include the installation of tile drains to assist in agricultural operations; changes to reservoir management to account for large changes in volume for the protection of life, property, and irrigation supply; changes in aquatic and avian habitat; and recreational opportunities. Flood events have also had substantial economic impacts; for example, the damages from flooding during 2011 on the Missouri and Souris Rivers were estimated at 2 billion dollars (National Weather Service, 2012). Since the devastating flood of 1997 in the Red River of the North, more than 1 billion dollars has been spent on flood-control projects, with a 2 billion dollar project to divert floodwater around Fargo, N. Dak., and Moorhead, Minnesota, currently (2022) underway (Gunderson, 2017).
Watershed regions across the conterminous United States have experienced dramatic climatic shifts between wet and dry periods, which directly affect streamflow and runoff. These climatic shifts have been observed over centuries in numerous studies that examined tree-rings, sediment cores, and climate data (Burn and Goel, 2001; Vecchia, 2008; Ryberg and others, 2014; Razavi and others, 201520; Kolars and others, 2016; Ryberg and others, 2016). Collectively, the understanding of these climatic shifts and resulting changes in flooding and in annual streamflow is necessary for producers, resource managers, and infrastructure engineers to make more informed environmental and economic decisions.
Previous monitoring and modeling efforts have gone into describing and understanding the rise of lakes levels in closed basins in the eastern Dakotas (Devils Lake Basin in North Dakota and the Waubay Lakes complex in South Dakota; Wiche, 1992; Wiche and Vecchia, 1996; Niehus and others, 1999a; Niehus and others, 1999b; Wiche and others, 2000; Vecchia, 2002; Shapley and others, 2005; Vecchia, 2008; Vecchia, 2011). These rising lakes and other lakes rising on smaller scales (such as the Cottonwood Lake Study Area; Mushet and Euliss, 2012) have resulted in greater connectivity in basins in the eastern Dakotas, providing more paths for runoff to rivers, and have contributed to flooding and increases in annual streamflow in rivers and streams. Rising lakes have been termed relentless creep (Breakey, 2018), implying a slow rise, whereas riverine flooding can quickly displace people in the region (Gunderson, 2017). Given the importance of these rising lakes, flood events, and increases in streamflow, the focus of this report is to characterize a hydrologically unique trend in the eastern Dakotas that is not being observed anywhere else in the conterminous United States. Specifically, streams in the eastern Dakotas have experienced the greatest increases in streamflow during the last 60 years in comparison to any other USGS gaged stream in the United States (U.S. Geological Survey, 2019). A recent (2020) and notable example is in eastern South Dakota where the James River at Columbia (USGS site 06471000) was measured above flood stage for more than 518 consecutive days (U.S. Geological Survey, 2019; Weather Channel, 2020).
The purposes of this report are (1) to characterize trends in mean annual streamflow in the eastern Dakotas and to compare trends and changes in annual streamflow volumes with streamflow at other streamgages within the conterminous United States, and (2) to identify potential environmental factors that may be drivers of increasing streamflow in the eastern Dakotas. USGS streamgages in the conterminous United States with a continuous period of record for water years (WYs) 1960–2019 were evaluated for statistically significant upward or downward trends in mean annual streamflow. A WY is the 12-month period, October 1 through September 30, and is designated by the calendar year in which it ends. Annual streamflow records were obtained from the USGS National Water Information System (NWIS) database (U.S. Geological Survey, 2019), resulting in 1,853 streamgages available for trend analyses. Kendall's tau nonparametric test (Kendall, 1938) was used to determine statistical significance of trends in mean annual streamflow from 1960 to 2019. This report does not quantify any of the forcing factors that may explain the observed streamflow trends, but rather it provides a discussion of potential environmental factors contributing to the trends, such as climate variability, land-use changes, or groundwater pumping.
Methods of Analysis Used in Assessing Streamflow Trends
Streamflow increases in eastern North and South Dakota were documented in context with other streamgages within the Missouri River Basin (Norton and others, 2014) and across the conterminous United States (Dudley and others, 2018; Hodgkins and others, 2019; Ryberg and others, 2020). Norton and others (2014) used trend analysis to determine whether mean annual streamflow was increasing or decreasing across the Missouri River Basin for WYs 1960–2011. Hodgkins and others (2019) documented gradual changes in annual peak streamflow for WYs 1916–2015, 1941–2015, and 1966–2015. The Red River of the North and James River Basins show a spatially cohesive pattern of increasing annual peak streamflow (fig. 4 of Hodgkins and others, 2019) even at regulated streamgages (fig. 5B of Hodgkins and others, 2019). Ryberg and others (2020) document abrupt changes in the median annual peak streamflow for the WYs 1916–2015, 1941–2015, and 1966–2015. Again, the Red River of the North and James River Basins are part of a spatially cohesive area of abrupt increases (fig. 1 of Ryberg and others, 2020). Many of these abrupt changes are in the 1990s (see animations in supplementary data 2 and 3 of Ryberg and others, 2020), coinciding with increasing flooding in the eastern Dakotas and increases in precipitation (Williams-Sether, 1999; Vecchia, 200835). The same methodology used by Norton and others (2014) is used herein to characterize trends in mean annual streamflow for WYs 1960–2019.
Mean annual streamflow was analyzed for significant trends using the Kendall's tau nonparametric test (Kendall, 1938) to determine the statistical significance of trends for a probability value (p-value) less than or equal to (≤) 0.10 where the Kendall's tau value equals zero. Streamflow records for 1,853 USGS streamgages were obtained from the USGS NWIS database (U.S. Geological Survey, 2019), and those with a continuous record of mean annual streamflow during WYs 1960–2019 were included in this study.
Changes in precipitation were estimated using output from the Parameter-elevation Regressions on Independent Slopes Model (PRISM; Daly and others, 1994, 2002), which interpolates monthly total precipitation from weather stations to a 2.5-arc-minute grid for the conterminous United States. Precipitation anomalies were obtained from the PRISM output comparing the mean annual total precipitation for WYs 1960–2019 to the mean annual total precipitation for WYs 2010–19. These precipitation anomalies were compared against the streamflow trends to highlight spatial variability in precipitation and streamflow in the conterminous United States.
A comparison of mean annual streamflow of the last decade (WYs 2010–19) to the first decade (WYs 1960–69) of the study period shows that the largest increases in annual streamflow volumes in the United States also are in the eastern Dakotas. Mean annual streamflow is a useful metric, but for many water-resource-related projects, such as detention design and reservoir sizing, operation streamflow volumes are also important. The percent change in annual streamflow volume was calculated by taking the difference of the mean annual streamflow of the second decade (WYs 2010–19) and the first decade of the study period (WYs 1960–69) divided by the first decade and represented as a percentage.
Spatial Analysis of Streamflow Trends
Trends in mean annual streamflow for 1,853 streamgages were analyzed and are described in the following section. Significant trends in mean annual streamflow were determined in 755 out of 1,853 streamgages. Streamgages within the conterminous United States with statistically significant trends in mean annual streamflow are compared spatially to precipitation anomalies (fig. 1).
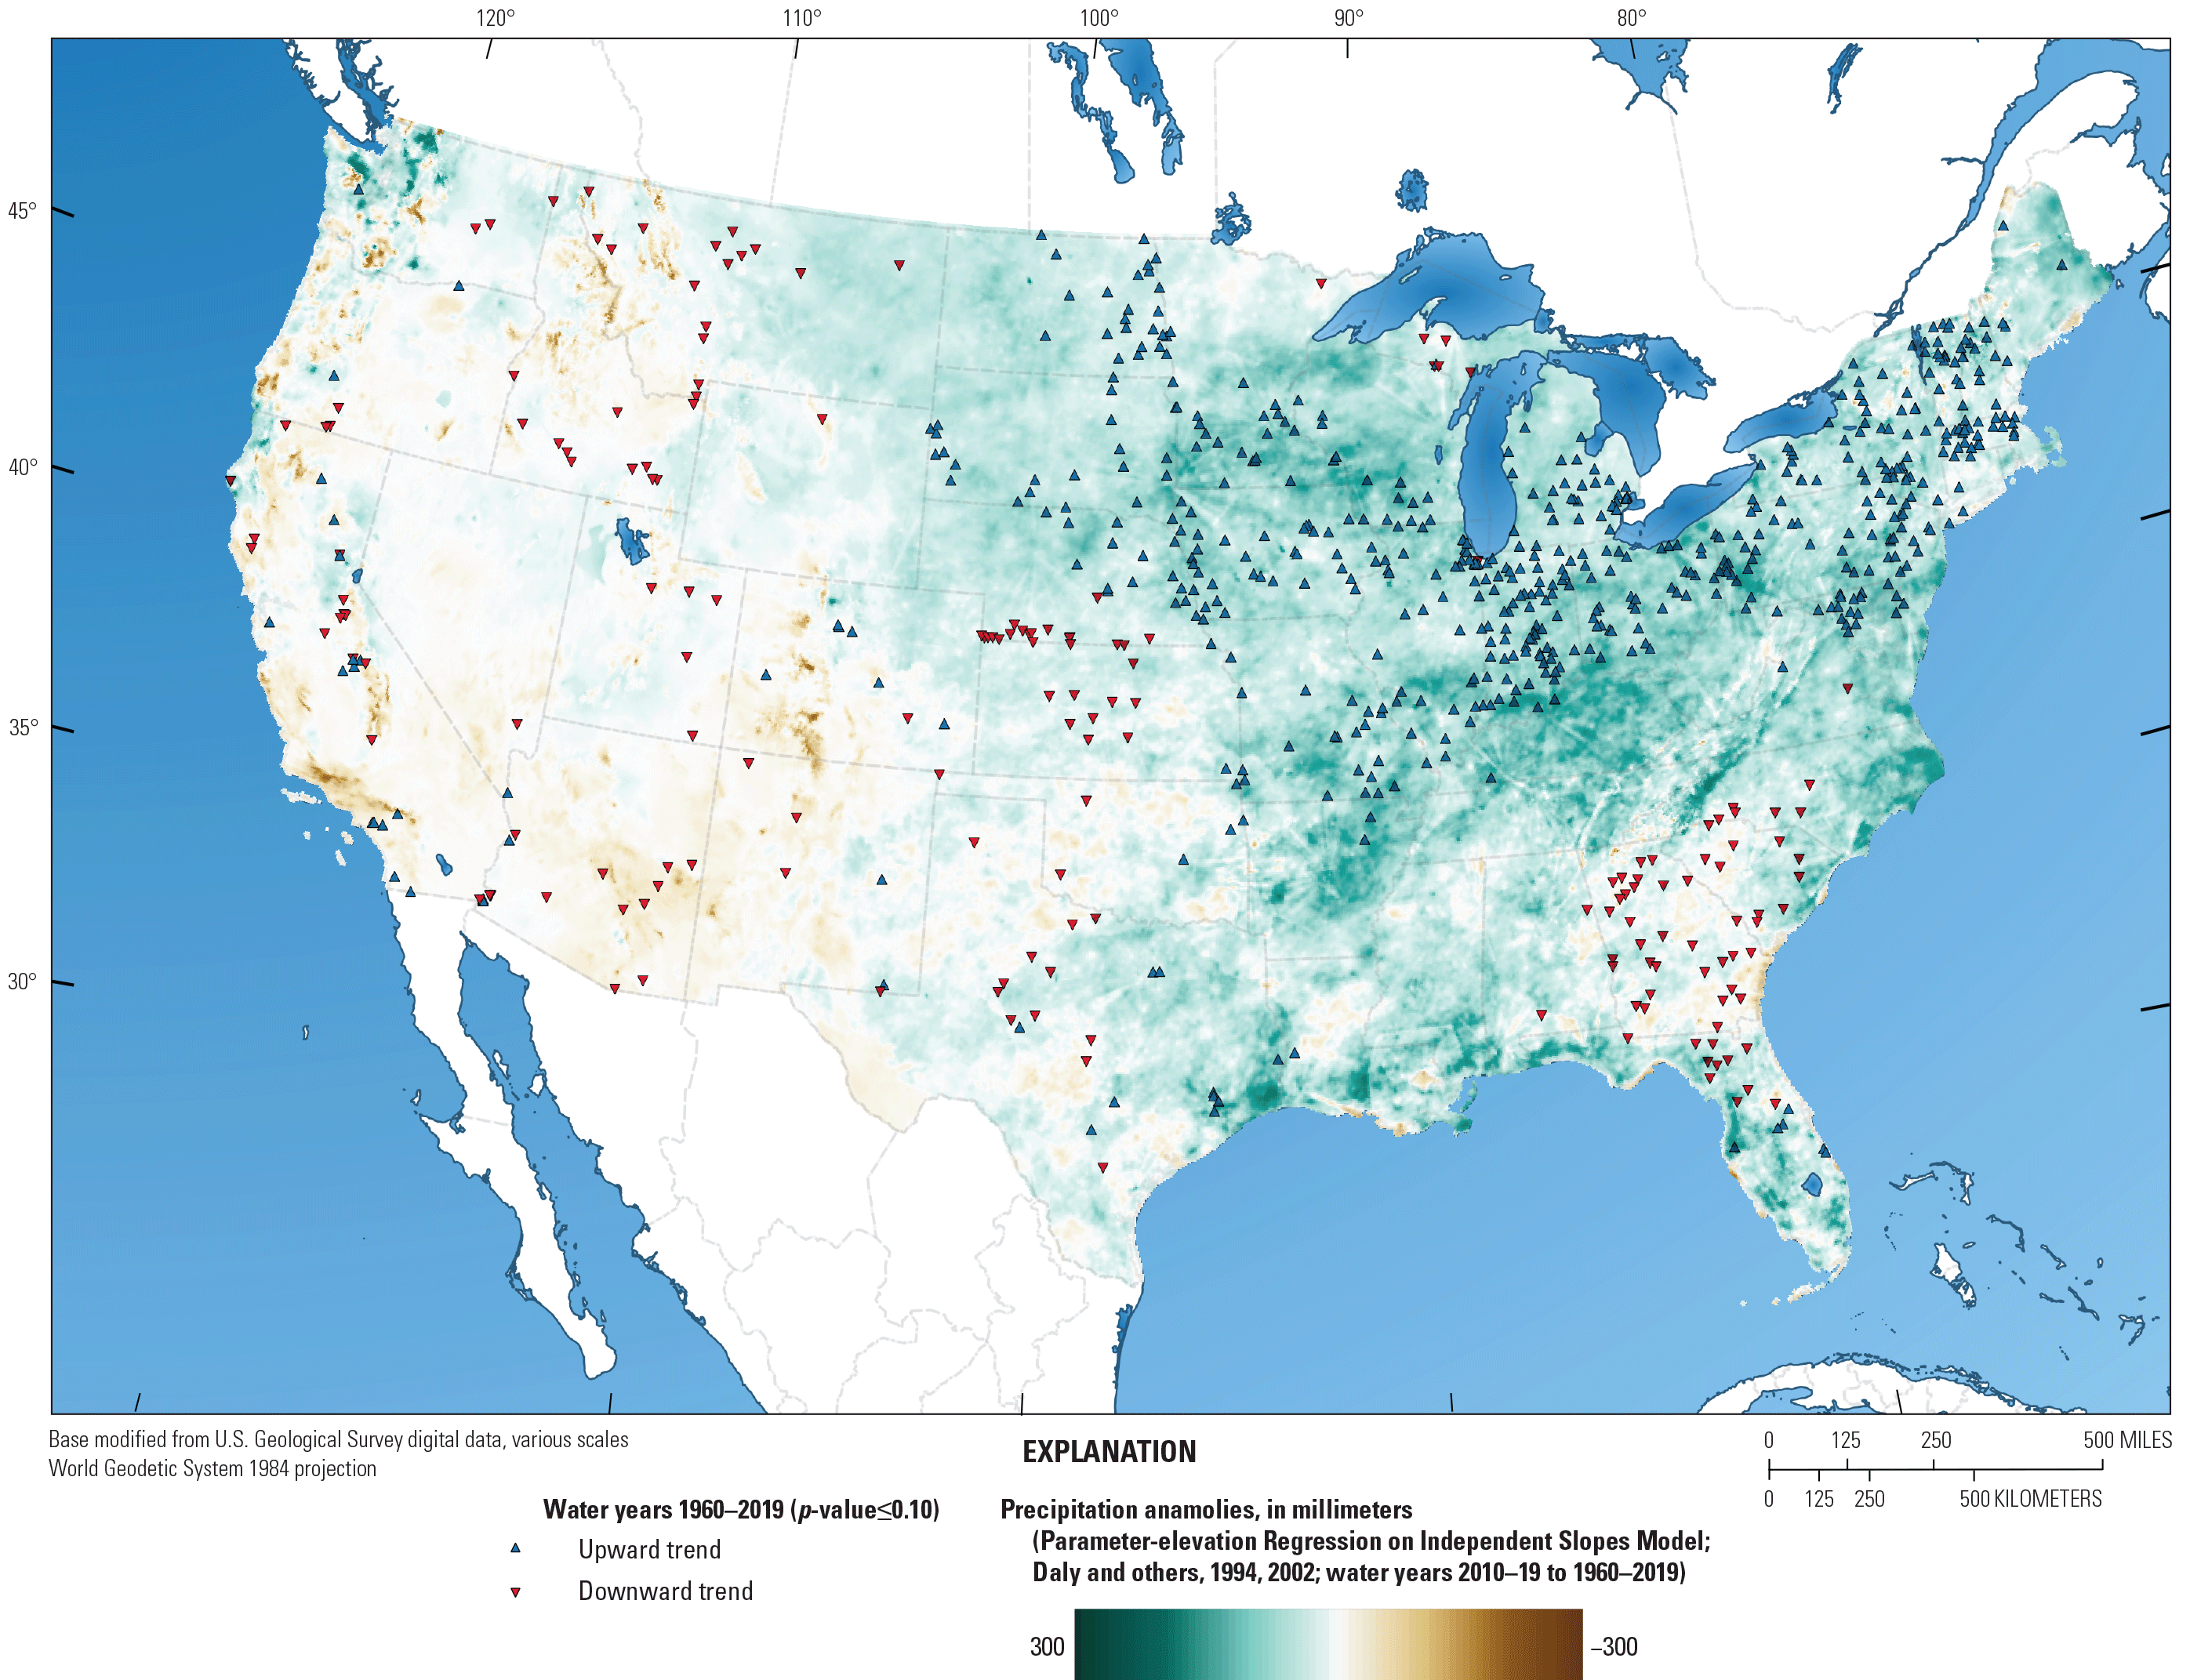
Streamgages in the conterminous United States with statistically significant trends in annual streamflow for water years 1960–2019 (U.S. Geological Survey, 2019).
Of the 1,853 streamgages, 573 had a significant upward trend in mean annual streamflow and are primarily located in the Midwest and northeastern United States, whereas 182 streamgages, located primarily in the western and southeastern States, had a significant downward trend (fig. 1). Precipitation anomalies are shown comparing the mean annual total precipitation of the last decade (WYs 2010–19) to the mean annual total precipitation of the study period (WYs 1960–2019). In general, significant upward trends in annual streamflow occurred in parts of the United States where precipitation increased (estimated using output from PRISM; Daly and others, 1994; 2002). Conversely, significant downward trends in annual streamflow occurred where precipitation decreased (fig. 1). In some areas, however, downward trends in streamflow are in areas with increased precipitation; for example, well capture of surface water in Nebraska from increased pumping for irrigation (Wen and Chen, 2006; McGuire, 2017), resulting in significant downward trends in annual streamflow even despite an increase in precipitation.
The trends in annual streamflow for streamgages in figure 1 do not account for the size of the watershed; therefore, for each site with a significant streamflow trend, the percent change in mean annual streamflow volume, using cubic feet per second, was compared to the corresponding drainage area (fig. 2). Simply, the streamgages represented by the blue triangles on figure 1 are plotted above the horizontal line on figure 2 and the red triangles are plotted below. Most of the streamgages with significant trends have a basin size less than 10,000 square miles. Several streamgages have increases in streamflow between 100 and 500 percent. Importantly, most of the streamgages with the greatest increases in mean annual streamflow are along the same rivers in the eastern Dakotas, regardless of basin size (fig. 2). These rivers include the Sheyenne and Souris Rivers in North Dakota and James River in North and South Dakota (fig. 3). Streamgage locations on these rivers have the greatest percent increase in streamflow volume compared to other rivers in the United States.
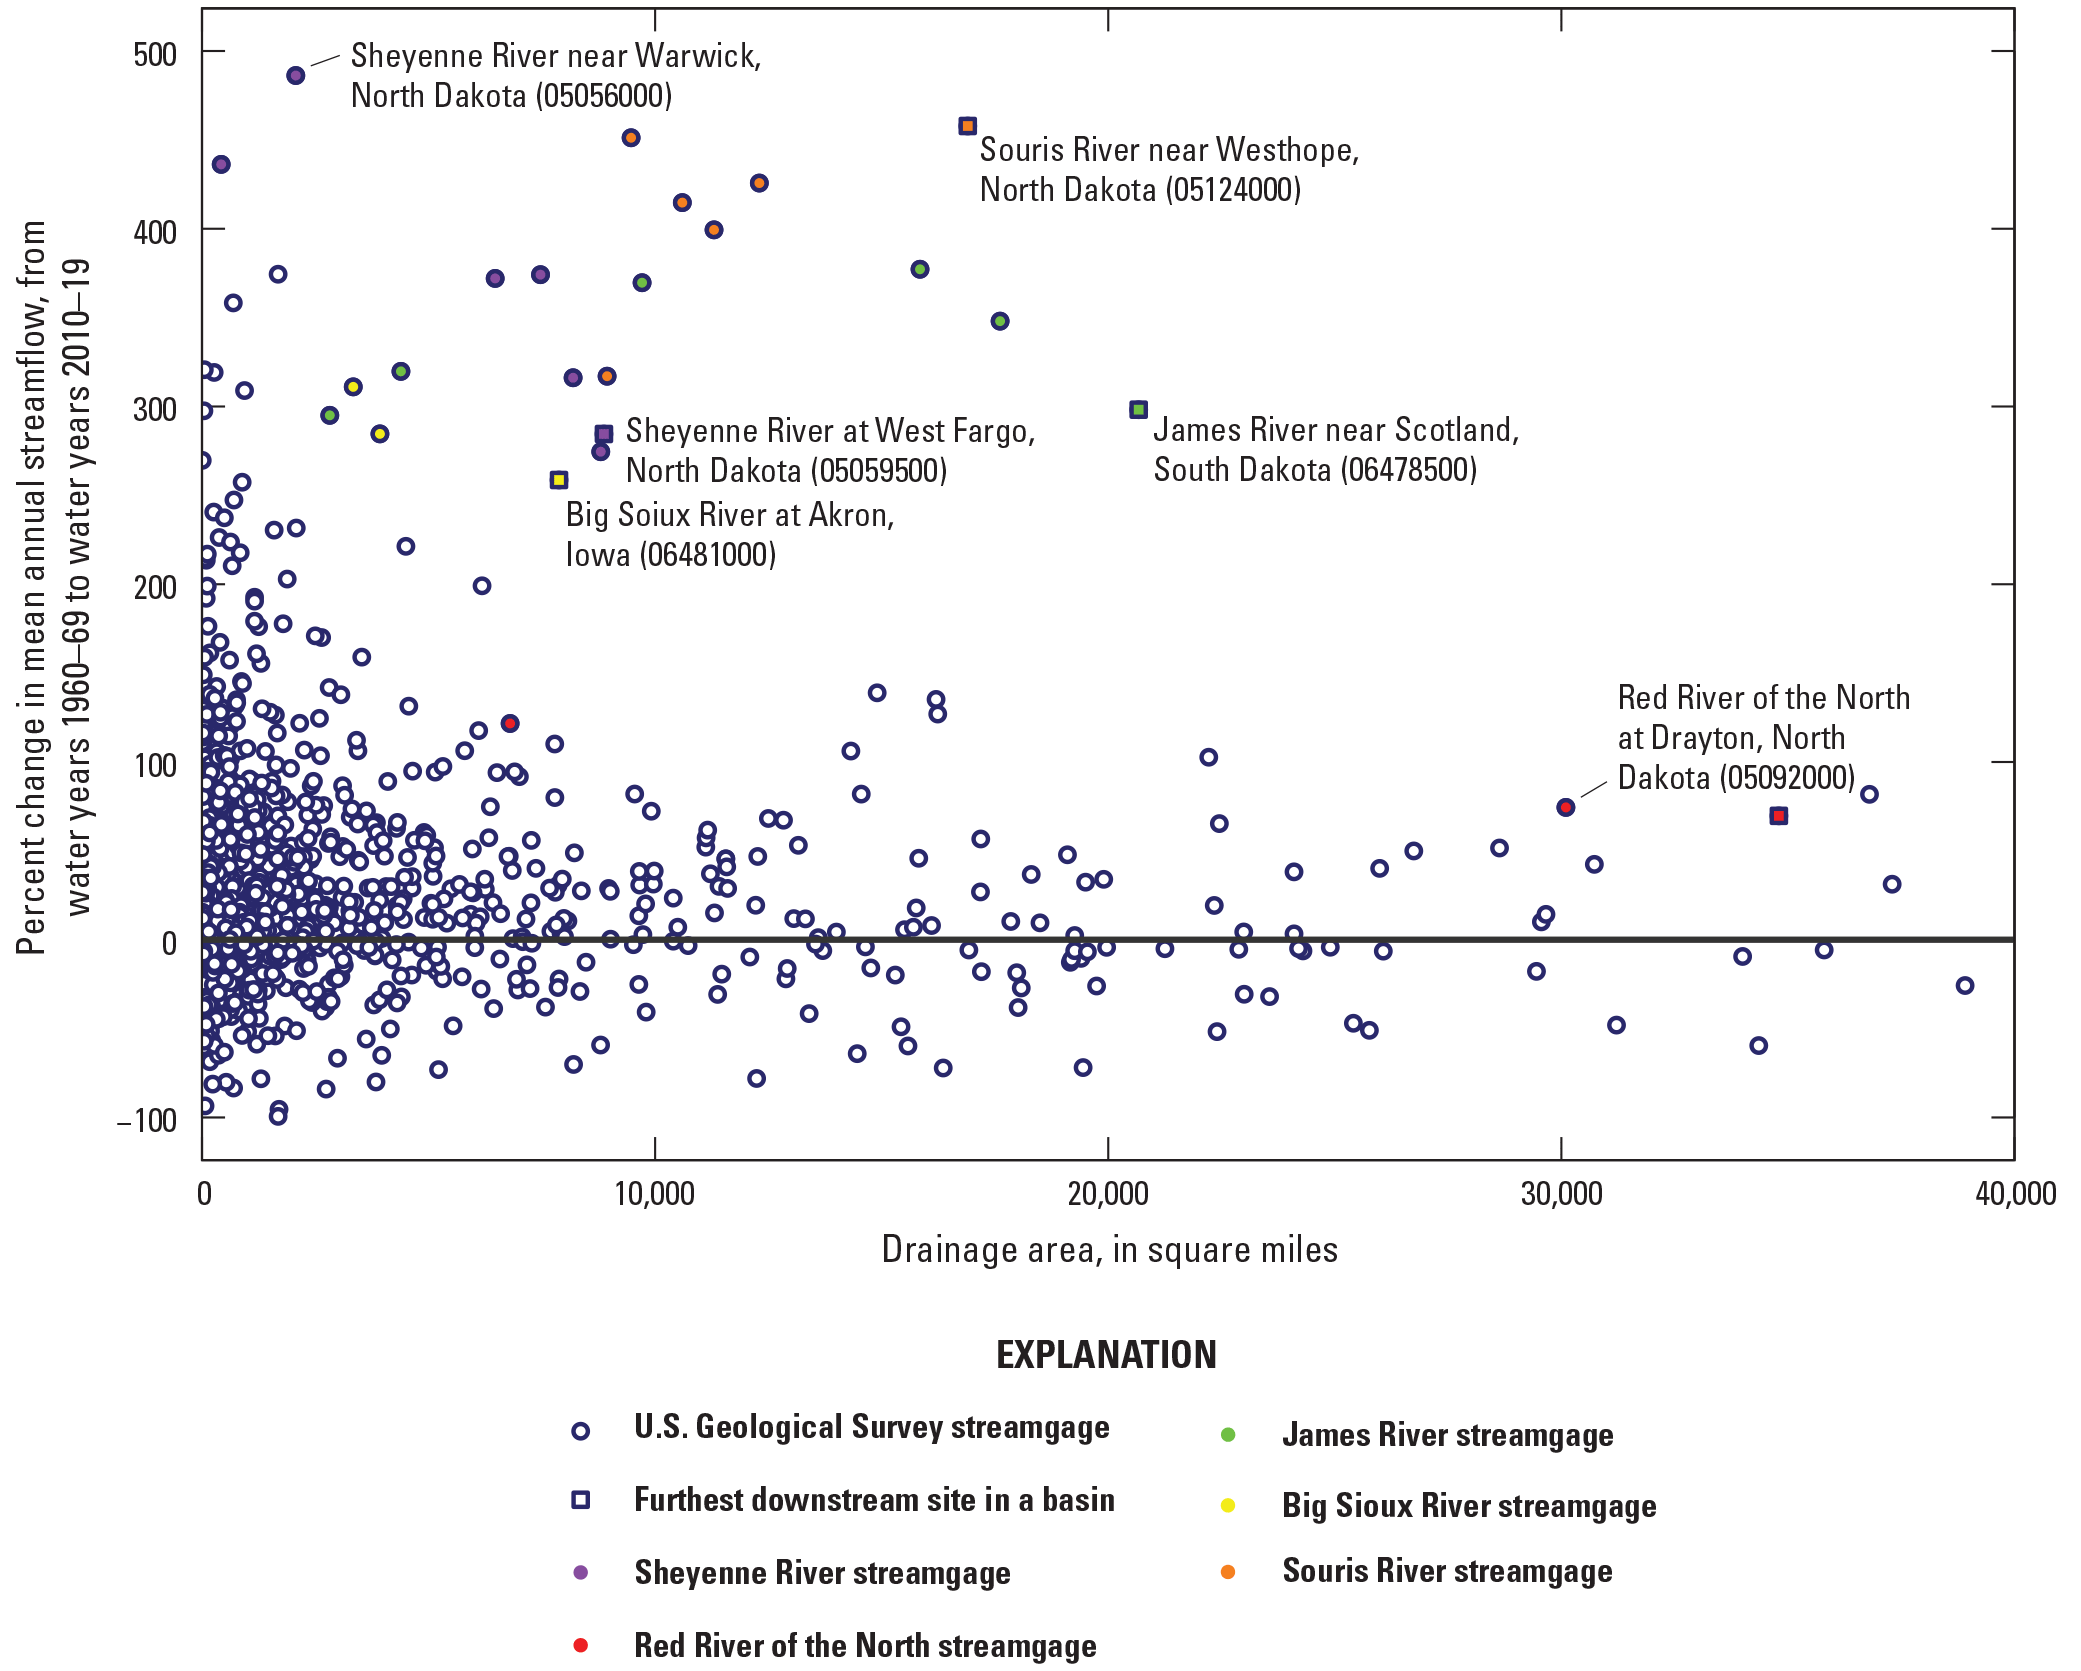
Percent change of annual streamflow compared to watershed drainage area for streamgages with statistically significant trends in mean annual streamflow, water years (WYs) 1960–2019.
Streamgages with at least a 100-percent increase in streamflow volume are shown in figure 3. Most of these streamgages are located in the eastern Dakotas, southern Minnesota, and northwestern Iowa. A few streamgages were located in California, Texas, Oregon, Colorado, Ohio, Wisconsin, Michigan, Maryland, Pennsylvania, and New York. These trends further highlight the unique phenomenon associated with the increased streamflow in the eastern Dakotas compared to other gaged locations in the United States and highlights the importance of understanding these localized hydrologic increases in flooding and annual streamflow volumes that affect resource management decisions.
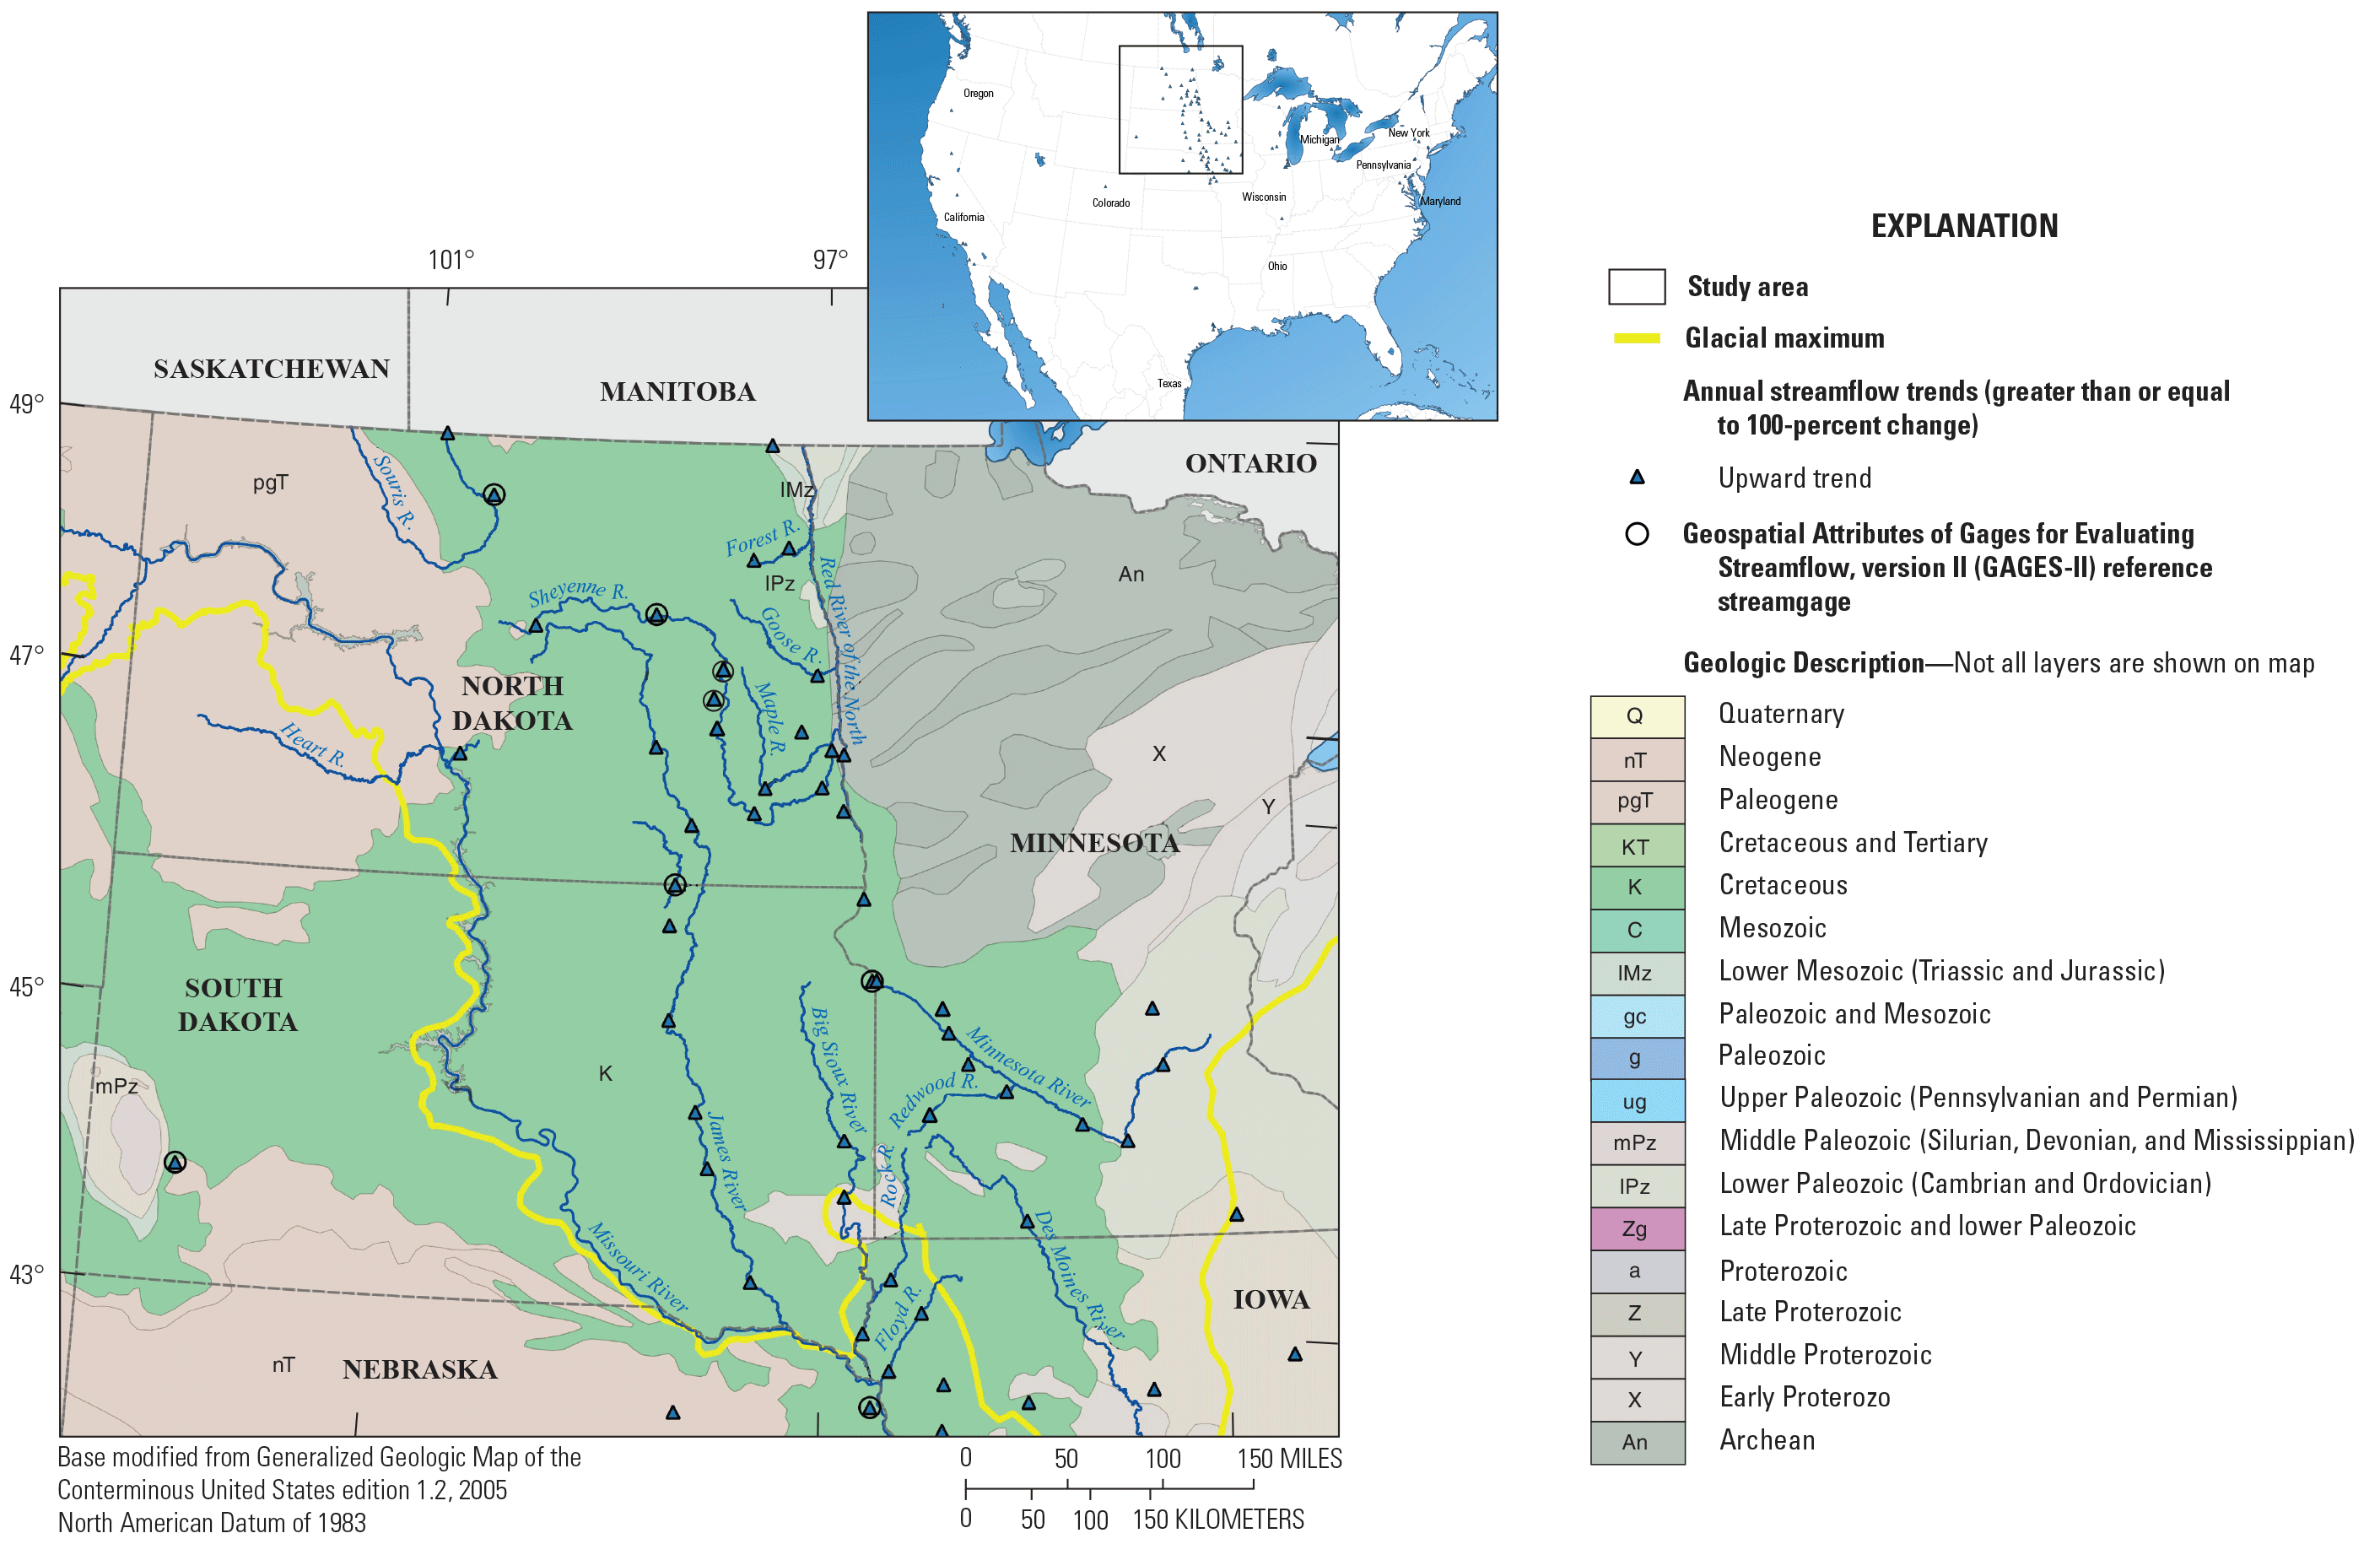
Streamgages with statistically significant upward trends in annual streamflow having at least a 100-percent increase in streamflow volume for water years 1960–2019 and location of the major geologic units in the conterminous United States (Reed and Bush, 2005).
Some of the greatest increases in streamflow volumes in the country are in the eastern Dakotas. The mean annual volume during the first decade compared to the last decade increased by 458, 298, and 285 percent for the Souris River near Westhope, N. Dak. (USGS station 05124000); the James River near Scotland, South Dakota (USGS station 06478500); and the Sheyenne River at West Fargo, N. Dak. (USGS station 05059500), respectively (figs. 2 and 4). These increases equate to an average of 549,174; 1,269,679; and 422,678 acre-feet more water, respectively, transported downstream each year for WYs 2010–19 compared to WYs 1960–69 (fig. 4). These three streamgages were highlighted because they represent the most downstream location on their respective rivers that had the greatest increases in percent change in streamflow. One site, which was not the most downstream site, among the 1,853 streamgages in the conterminous United States, the Sheyenne River near Warwick, N. Dak. (USGS station 05056000) has the greatest percent change in annual streamflow volume, with an increase of 486 percent comparing WYs 2010–19 to WYs 1960–69 (fig. 2).
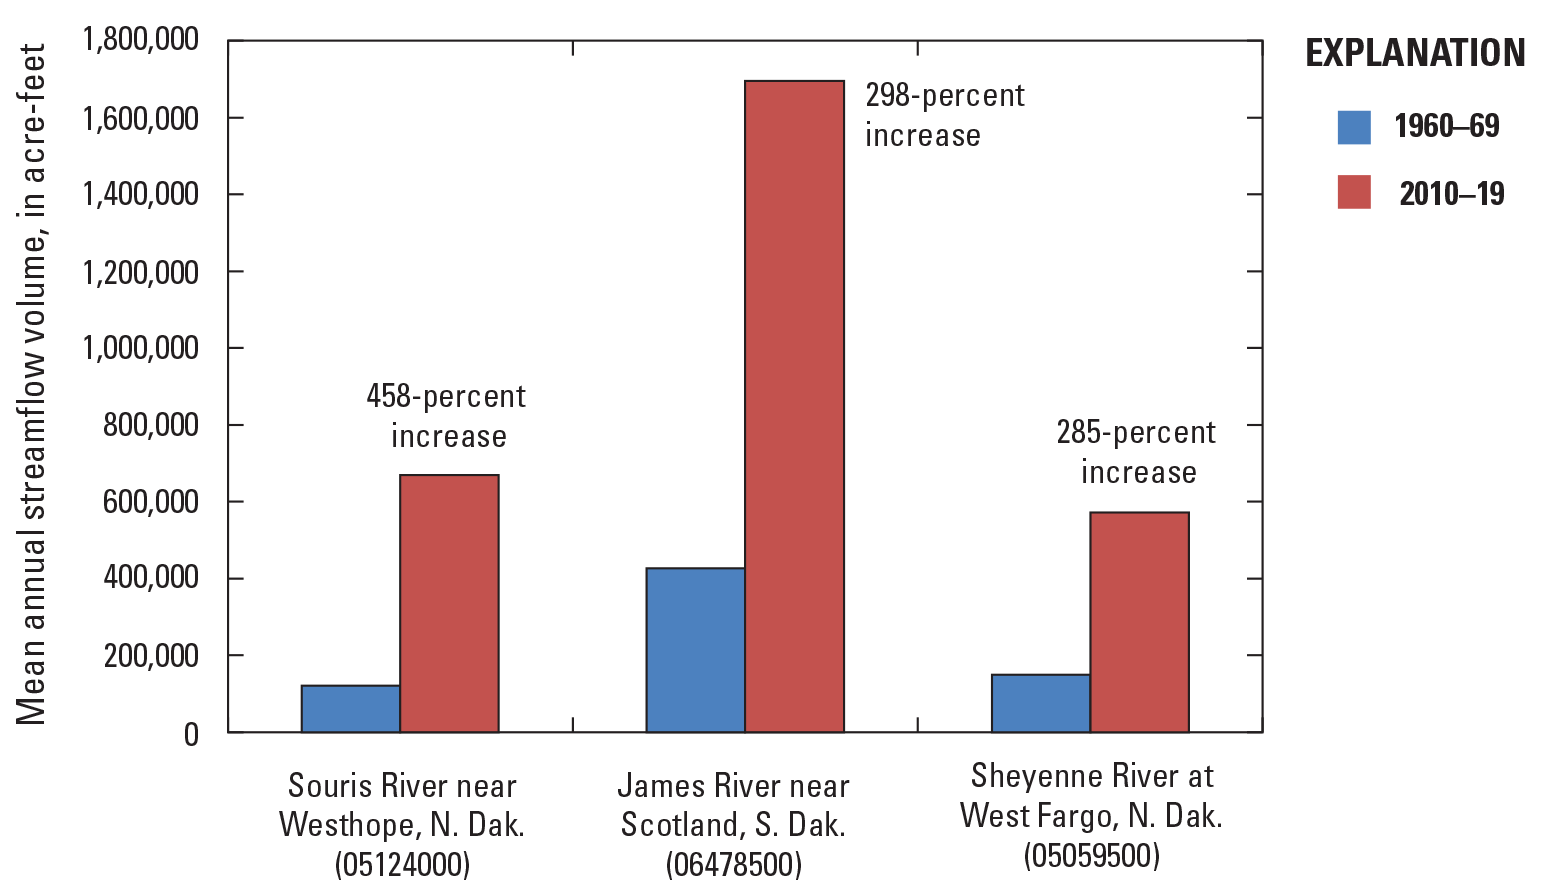
Percent difference of mean annual streamflow volume from water years 1960–69 to water years 2010–19 for the Souris River near Westhope, North Dakota (U.S. Geological Survey [USGS] station 05124000); the James River near Scotland, South Dakota (USGS station 06478500); and the Sheyenne River at West Fargo, North Dakota (USGS station 05059500).
Potential Factors Contributing to Increasing Streamflow Trends
Several factors may contribute to upward trends in streamflow in the eastern Dakotas, including precipitation changes owing to climatic variation within the region, geologic makeup of the subsurface, and land-use changes. Understanding these contributing factors is necessary for producers, resource managers, and infrastructure engineers to make more informed environmental and economic decisions.
In the Midwestern United States, there has been debate about the relative contribution of land-use changes and climatic changes to increases in highflows and flooding (Schilling and others, 2008; Tomer and Schilling, 2009; Schilling and others, 2010; Schilling and others, 2013; Ryberg and others, 2014; Gupta and others, 2015; Schilling, 2016). In a study area that included the Red River of the North in North Dakota and the James and Big Sioux Rivers in South Dakota, Ryberg and others (2014) used a nonlinear water-balance analysis to show that changes in precipitation and potential evapotranspiration explain most of the multidecadal spatial/temporal variability of runoff and flood magnitudes, with precipitation being the dominant driver. Historical changes in climate and runoff in the region appear to be more consistent with complex transient shifts in seasonal climatic conditions than with gradual climate change. A portion of the unexplained variability likely stems from land-use change.
Groundwater/surface-water interaction is another important consideration. Increases in precipitation owing to climatic variation, as shown in figure 1, may contribute to increased overland runoff, streamflow, infiltration, and increases in shallow groundwater levels. In parts of the eastern Dakotas, an increase in precipitation can oversaturate shallow glacial and alluvial aquifers and exceed the aquifer storage capacity (Valseth and Driscoll, 2021). The low permeability Cretaceous shale (fig. 3) underlying the shallow glacial and alluvial aquifers inhibits the infiltration of the groundwater, resulting in decreased localized storage capacity, rising groundwater levels, and increased overland runoff. Increases in overland runoff can contribute to increasing streamflow, which can affect sediment loads and water quality. Collectively, rising shallow groundwater levels can contribute to streamflow and increase the size of surface-water bodies, resulting in the reduction of available agricultural land and changes to aquatic and avian habitat (Lundgren and others, 2019).
Land-use changes can also lead to changes in overland runoff and affect the rates of infiltration from precipitation events. Examples of land-use changes that could affect streamflow include installation of tile drains, conversion of grasslands and Conservation Reserve Program areas to cropland, expansion of urban areas leading to more impervious surfaces, and removal of shelter belts (Schilling and others, 2008; Ryberg and others, 2014; Schilling, 2016). Collectively, the increased streamflow, expanding water bodies, and consistent land-use changes affect water quality and aquatic and avian habitat, and could have substantial economic impacts owing to the decreases in agricultural acreage and increases in culvert and bridge sizes and other infrastructure modifications to accommodate larger floods and streamflow volumes. Understanding the associated effects of these changes could address questions pertaining to the following:
-
• Changes in wetland sizes;
-
• Changes in watershed connectivity;
-
• Changes in soil salinity and soil health;
-
• Changes in agricultural acreage and yields;
-
• Habitat suitability for silver carp (Hypophthalmichthys molitrix) and bighead carp (Hypophthalmichthys nobilis);
-
• Best practices in fisheries management;
-
• Changes in aquatic and avian habitat;
-
• Impacts to avian migration routes;
-
• Changes in drinking water supplies;
-
• Increases in harmful algal blooms;
-
• Increases in bridge scour;
-
• Culvert and highway design;
-
• Changes in flood frequency;
-
• Contributions to hypoxia in the Gulf of Mexico;
-
• Interbasin transfer of water;
-
• Impacts to piping plover (Charadrius melodus), pallid sturgeon (Scaphirhynchus albus), and other endangered species; and
-
• Impacts to Cottonwood trees (Populus) and riparian areas.
Better understanding of these research areas will help producers, resource managers, and infrastructure engineers make more informed environmental and economic decisions (Daly and others, 2002; Schilling and others, 2008; Tomer and Schilling, 2009; Schilling and others, 2010; Mushetand Euliss, 2012; Schilling and others, 2013; Ryberg and others, 2014; Gupta and others, 2015; Schilling, 2016; Lundgren and others, 2019; Valseth and Driscoll, 2021).
Summary
Hydrologic extremes, whether periods of drought or flooding, are occurring more frequently with greater severity and can have substantial economic impacts. Along with flooding, the timing and volume of streamflow also is changing across the United States. The focus of this report is to characterize a unique trend in mean annual streamflow occurring in the eastern Dakotas that has not been observed anywhere else in the conterminous United States.
This report characterizes streamflow in the eastern Dakotas compared to streamgage locations within the conterminous United States and identifies environmental factors that may be drivers of the increasing flows in the eastern Dakotas. This report does not quantify any of the forcing factors that contribute to the streamflow trends, but rather it provides a discussion of potential factors contributing to the increasing trends, such as climate variability, land-use changes, or groundwater pumping.
Streamflow records for 1,853 U.S. Geological Survey (USGS) streamgages were obtained from the USGS National Water Information System database and those with a continuous record of mean annual streamflow during water years 1960–2019 were included in the analysis. Using a Kendall tau statistical test (p-value less than or equal to 0.10), 573 streamgages had a statistically significant upward trend in mean annual streamflow and are primarily located in the Midwest and northeastern United States. Of the streamgages, 182 had a statistically significant downward trend and are located primarily in the western and southeastern States. In general, upward trends in annual streamflow occurred in areas of the United States where precipitation increased. Conversely, downward trends in annual streamflow occurred in areas with less precipitation.
The percent change in streamflow volume for each site was compared to corresponding drainage area. Most of the streamgages with significant trends have basin sizes less than 10,000 square miles. Several streamgages have increases in streamflow between 100 and 500 percent. Importantly, most of these streamgages with the greatest increases in mean annual streamflow are along the same rivers in the eastern Dakotas, regardless of basin size. Streamgages with at least a 100-percent change in streamflow were identified and are primarily located in eastern Dakotas, southern Minnesota, and northwestern Iowa.
A comparison of mean annual streamflow of the last decade (2010–19) to the first decade (1960–69) of the study period shows that the largest increases in annual streamflow volumes in the United States also are in the eastern Dakotas. The mean annual volume during the first decade compared to the last decade increased by 458, 298, and 285 percent for the Souris River near Westhope, North Dakota (USGS station 05124000); the James River near Scotland, South Dakota (USGS station 06478500); and the Sheyenne River at West Fargo, North Dakota (USGS station 05059500), respectively. Among all 1,853 streamgages in the conterminous United States, the Sheyenne River near Warwick, North Dakota (USGS station 05056000) had the greatest percent change observed, with an increase of 486 percent comparing the first decade to the last decade of streamflow.
Several factors may be contributing to increasing trends in streamflow in the eastern Dakotas. These factors may include, in part, precipitation changes owing to climatic variation within the region, geologic makeup of the subsurface, and land-use changes. Understanding the associated impacts of these changes warrants more focused research to address questions pertaining to changes in wetland sizes, changes in soil salinity and soil health, decreases in agricultural yields, habitat suitability for silver carp (Hypophthalmichthys molitrix) and bighead carp (Hypophthalmichthys nobilis), best practices in fisheries management, changes in aquatic and avian habitat, impacts to migration routes, changes in drinking water supplies, increases in harmful algal blooms, increases in bridge scour, culvert and highway design, changes in flood frequency, contributions to Gulf hypoxia, interbasin transfer of water, impacts to piping plover (Charadrius melodus), pallid sturgeon (Scaphirhynchus albus), and other endangered species, and impacts to Cottonwood trees (Populus) and riparian areas. A better understanding of these research areas will help producers, resource managers, and infrastructure engineers to make more informed environmental and economic decisions.
References Cited
Breakey, S., 2018, Hell in high water—The story of Devils Lake, North Dakota: Modern Farmer, accessed February 2, 2022, at https://modernfarmer.com/2018/08/hell-in-high-water-the-story-of-devils-lake-north-dakota/.
Burn, D.H., and Goel, N.K., 2001, Flood frequency analysis for the Red River at Winnipeg: Canadian Journal of Civil Engineering, v. 28, no. 3, p. 355–362. [Also available at https://doi.org/10.1139/l00-122.]
Daly, C., Gibson, W.P., Taylor, G.H., Johnson, G.L., and Pasteris, P., 2002, A knowledge-based approach to the statistical mapping of climate: Climate Research, v. 22, no. 2, p. 99–113, accessed February 2, 2022, at https://doi.org/10.3354/cr022099.
Daly, C., Neilson, R.P., and Phillips, D.L., 1994, A statistical-topographic model for mapping climatological precipitation over mountainous terrain: Journal of Applied Meteorology, v. 33, no. 2, p. 140–158, accessed February 2, 2022, at https://doi.org/10.1175/1520-0450(1994)033<0140:ASTMFM>2.0.CO;2.
Dudley, R.W., Archfield, S.A., Hodgkins, G.A., Renard, B., and Ryberg, K.R., 2018, Basin characteristics and peak-streamflow trends and change-points for 2,683 USGS streamgages in the conterminous U.S.: U.S. Geological Survey data release, accessed June 6, 2019, at https://doi.org/10.5066/P9AEGXY0.
Dunbar, E., 2017, The 1997 Red River flood—What happened?: MPR News, accessed February 2, 2022, at https://www.mprnews.org/story/2017/04/17/1997-red-river-flood-what-happened.
Gupta, S.C., Kessler, A.C., Brown, M.K., and Zvomuya, F., 2015, Climate and agricultural land use change impacts on streamflow in the upper midwestern United States: Water Resources Research, v. 51, no. 7, p. 5301–5317. [Also available at https://doi.org/10.1002/2015WR017323.]
Gunderson, D., 2017, 20 years after epic flood, Red River towns no longer dread spring: MPR News, accessed February 2, 2022, at https://www.mprnews.org/story/2017/04/17/red-river-flood-20-year-anniversary-towns-transformed.
Hodgkins, G.A., Dudley, R.W., Archfield, S.A., and Renard, B., 2019, Effects of climate, regulation, and urbanization on historical flood trends in the United States: Journal of Hydrology, v. 573, p. 697–709. [Also available at https://doi.org/10.1016/j.jhydrol.2019.03.102.]
Kendall, M.G., 1938, A new measure of rank correlation: Biometrika, v. 30, no. 1–2, p. 81–93. [Also available at https://doi.org/10.1093/biomet/30.1-2.81.]
Kolars, K.A., Vecchia, A.V., and Ryberg, K.R., 2016, Stochastic model for simulating Souris River Basin precipitation, evapotranspiration, and natural streamflow: U.S. Geological Survey Scientific Investigations Report 2015–5185, accessed April 20, 2016, at https://doi.org/10.3133/sir20155185.
Livneh, B., Hoerling, M., Badger, A., and Eischeid, J., 2016, Causes for hydrologic extremes in the upper Missouri River Basin: National Oceanic and Atmospheric Administration Climate Assessment Report, 36 p., accessed August 16, 2021, at https://www.esrl.noaa.gov/psd/csi/factsheets/pdf/mrb-climate-assessment-report-hydroextremes_2016.pdf.
Lundgren, R.F., York, B.C., Stroh, N.A., and Vecchia, A.V., 2019, Water-balance modeling of selected lakes for evaluating viability as long-term fisheries in Kidder, Logan, and Stutsman Counties, North Dakota: U.S. Geological Survey Scientific Investigations Report 2019–5007, 22 p., accessed February 1, 2022, at https://doi.org/10.3133/sir20195007.
McGuire, V.L., 2017, Water-level changes in the High Plains aquifer, Republican River Basin in Colorado, Kansas, and Nebraska, 2002 to 2015 (ver. 1.2, March 2017): U.S. Geological Survey Scientific Investigations Map 3373, 10 p., 1 sheet with appendix, accessed February 2, 2022, at https://doi.org/10.3133/sim3373.
Mushet, D.M., and Euliss, N.H., Jr., 2012, The Cottonwood Lake study area, a long-term wetland ecosystem monitoring site: U. S. Geological Survey Fact Sheet 2012–3040, 2 p., accessed July 7, 2021, at https://doi.org/10.3133/fs20123040.
National Weather Service, 2012, The Missouri/Souris River Floods of May – August 2011: U.S. Department of Commerce Service Assessment, 104 p., accessed August 16, 2021, at https://www.weather.gov/media/publications/assessments/Missouri_floods11.pdf.
Niehus, C.A., Vecchia, A.V., and Thompson, R.F., 1999a, Lake-level frequency analysis for the Waubay Lakes Chain, northeastern South Dakota: U.S. Geological Survey Water-Resources Investigations Report 99–4122, accessed February 4, 2022, at https://doi.org/10.3133/wri994122.
Niehus, C.A., Vecchia, A.V., and Thompson, R.F., 1999b, Supplement to Water-Resources Investigations Report 99-4122, lake-level frequency analysis for the Waubay Lakes Chain, northeastern South Dakota: U.S. Geological Survey Water-Resources Investigations Report 99–4251, accessed February 4, 2022, at https://doi.org/10.3133/wri994251.
Norton, P.A., Anderson, M.T., and Stamm, J.F., 2014, Trends in annual, seasonal, and monthly streamflow characteristics at 227 streamgages in the Missouri River watershed, water years 1960–2011: U.S. Geological Survey Scientific Investigations Report 2014–5053, 128 p., accessed February 4, 2022, at https://doi.org/10.3133/sir20145053.
Razavi, S., Elshorbagy, A., Wheater, H., and Sauchyn, D., 2015, Toward understanding nonstationarity in climate and hydrology through tree ring proxy records: Water Resources Research, v. 51, no. 3, p. 1813–1830. [Also available at https://doi.org/10.1002/2014WR015696.]
Reed, J.C., and Bush, C.A., 2005, Generalized geologic map of the United States, Puerto Rico, and the U.S. Virgin Islands: U.S. Geological Survey National Atlas of the United States, accessed February 4, 2022, at http://pubs.usgs.gov/atlas/geologic/.
Ryberg, K.R., Hodgkins, G.A., and Dudley, R.W., 2020, Change points in annual peak streamflows—Method comparisons and historical change points in the United States: Journal of Hydrology, v. 583, p. 124307, accessed February 5, 2021, at https://doi.org/10.1016/j.jhydrol.2019.124307.
Ryberg, K.R., Lin, W., and Vecchia, A.V., 2014, Impact of climate variability on runoff in the north-central United States: Journal of Hydrologic Engineering, v. 19, no. 1, p. 148–158. [Also available at https://doi.org/10.1061/(ASCE)HE.1943-5584.0000775.]
Schilling, K.E., 2016, Comment on “Climate and agricultural land use change impacts on streamflow in the upper midwestern United States” by Satish C. Gupta et al: Water Resources Research, v. 52, no. 7, p. 5694–5696. [Also available at https://doi.org/10.1002/2015WR018482.]
Schilling, K.E., Chan, K.-S., Liu, H., and Zhang, Y.-K., 2010, Quantifying the effect of land use land cover change on increasing discharge in the Upper Mississippi River: Journal of Hydrology, v. 387, no. 3–4, p. 343–345. [Also available at https://doi.org/10.1016/j.jhydrol.2010.04.019.]
Schilling, K.E., Gassman, P.W., Kling, C.L., Todd, C., Jha, M.K., Wolter, C.F., and Arnold, J.G., 2013, The potential for agricultural land use change to reduce flood risk in a large watershed: Hydrological Processes, v. 28, no. 8, p. 3314–3325. [Also available at https://doi.org/10.1002/hyp.9865.]
Schilling, K.E., Jha, M.K., Zhang, Y.-K., Gassman, P.W., and Wolter, C.F., 2008, Impact of land use and land cover change on the water balance of a large agricultural watershed—Historical effects and future directions: Water Resources Research, v. 44, no. 7, 12 p. [Also available at https://doi.org/10.1029/2007WR006644.]
Shapley, M.D., Johnson, W.C., Engstrom, D.R., and Osterkamp, W.R., 2005, Late Holocene flooding and drought in the Northern Great Plains, reconstructed from tree rings, lake sediments and ancient shorelines: The Holocene, v. 15, no. 1, p. 29–41. [Also available at https://doi.org/10.1191/0959683605hl781rp.]
Tomer, M.D., and Schilling, K.E., 2009, A simple approach to distinguish land-use and climate-change effects on watershed hydrology: Journal of Hydrology, v. 376, no. 1-2, p. 24–33. [Also available at https://doi.org/10.1016/j.jhydrol.2009.07.029.]
U.S. Geological Survey, 2019, USGS water data for the Nation: U.S. Geological Survey National Water Information System database, accessed February 5, 2021, at https://doi.org/10.5066/F7P55KJN.
U.S. Geological Survey, 2022, Peak streamflow for the Nation in USGS water data for the Nation: U.S. Geological Survey National Water Information System database, accessed February 2, 2021, at https://doi.org/10.5066/F7P55KJN. [Information directly available at https://nwis.waterdata.usgs.gov/usa/nwis/peak.]
Valseth, K.J., and Driscoll, D.G., 2021, Characterization of factors affecting groundwater levels in and near the former Lake Traverse Indian Reservation, South Dakota, water years 1956–2017: U.S. Geological Survey Scientific Investigations Report 2020–5151, 64 p., accessed January 18, 2022, at https://doi.org/10.3133/sir20205151.
Vecchia, A.V., 2002, Simulation of a proposed emergency outlet from Devils Lake, North Dakota: U.S. Geological Survey Water-Resources Investigations Report 2002–4042, 129 p., accessed January 20, 2022 at https://doi.org/10.3133/wri024042.
Vecchia, A.V., 2008, Climate simulation and flood risk analysis for 2008-40 for Devils Lake, North Dakota: U.S. Geological Survey Scientific Investigations Report 2008–5011, accessed January 18, 2022, at https://doi.org/10.3133/sir20085011.
Vecchia, A.V., 2011, Simulation of the effects of Devils Lake outlet alternatives on future lake levels and water quality in the Sheyenne River and Red River of the North: U.S. Geological Survey Scientific Investigations Report 2011–5050, 50 p., accessed January 18, 2022, at https://doi.org/10.3133/sir20115050.
Weather Channel, 2020, South Dakota’s James River was in flood stage for a record 17 months: Weather Channel website, accessed January 21, 2022, at https://weather.com/news/weather/news/2020-09-01-south-dakota-river-record-flood-17-months.
Wen, F., and Chen, X., 2006, Evaluation of the impact of groundwater irrigation on streamflow in Nebraska: Journal of Hydrology, v. 327, no. 3–4, p. 603–617. [Also available at https://doi.org/10.1016/j.jhydrol.2005.12.016.]
Wiche, G.J., 1992, Hydrology and water-level fluctuations of Devils Lake, North Dakota, in Subitzky, S., ed., Selected papers in the hydrologic sciences 1988–92: U.S. Geological Survey Water Supply Paper 2340, p. 75–87. [Also available at https://doi.org/10.3133/wsp2340.]
Wiche, G.J., and Vecchia, A.V., 1996, Lake-level frequency analysis for Devils Lake, North Dakota: U.S. Geological Survey Water-Supply Paper 2469, 57 p., accessed March 20, 2020, at https://doi.org/10.3133/wsp2469.
Wiche, G.J., Vecchia, A.V., Osborne, L., Wood, C.M., and Fay, J.T., 2000, Climatology, hydrology, and simulation of an emergency outlet, Devils Lake Basin, North Dakota: U.S. Geological Survey Water-Resources Investigations Report 2000–4174, accessed January 18, 2022, at https://doi.org/10.3133/wri004174.
Williams-Sether, T., 1999, From dry to wet, 1988-97, North Dakota: U.S. Geological Survey Fact Sheet 075–99, 4 p., accessed June 6, 2016, at https://doi.org/10.3133/fs07599.
Datum
Vertical coordinate information is referenced to the North American Vertical Datum of 1983 (NAVD 83).
Horizontal coordinate information is referenced to the North American Vertical Datum of 1983 (NAVD 83).
For more information about this publication, contact:
Director, USGS Dakota Water Science Center
821 East Interstate Avenue, Bismarck, ND 58503
1608 Mountain View Road, Rapid City, SD 57702
605–394–3200
For additional information, visit: https://www.usgs.gov/centers/dakota-water
Publishing support provided by the
Rolla Publishing Service Center
Disclaimers
Any use of trade, firm, or product names is for descriptive purposes only and does not imply endorsement by the U.S. Government.
Although this information product, for the most part, is in the public domain, it also may contain copyrighted materials as noted in the text. Permission to reproduce copyrighted items must be secured from the copyright owner.
Suggested Citation
Norton, P.A., Delzer, G.C., Valder, J.F., Tatge, W.S., and Ryberg, K.R., 2022, Assessment of streamflow trends in the eastern Dakotas, water years 1960–2019: U.S. Geological Survey Scientific Investigations Report 2022–5055, 11 p., https://doi.org/10.3133/sir20225055.
ISSN: 2328-0328 (online)
Study Area
| Publication type | Report |
|---|---|
| Publication Subtype | USGS Numbered Series |
| Title | Assessment of streamflow trends in the eastern Dakotas, water years 1960–2019 |
| Series title | Scientific Investigations Report |
| Series number | 2022-5055 |
| DOI | 10.3133/sir20225055 |
| Publication Date | June 17, 2022 |
| Year Published | 2022 |
| Language | English |
| Publisher | U.S. Geological Survey |
| Publisher location | Reston, VA |
| Contributing office(s) | Dakota Water Science Center |
| Description | Report: iv, 11 p.; Dataset |
| Country | United States |
| State | North Dakota, South Dakota |
| Online Only (Y/N) | Y |