

Using Microbial Source Tracking To Identify Fecal Contamination Sources in Great South Bay on Long Island, New York
Links
- Document: Report (1.67 MB pdf) , HTML , XML
- Related Work: Scientific Investigations Report 2021–5033 - Overview and Methodology for a Study To Identify Fecal Contamination Sources Using Microbial Source Tracking in Seven Embayments on Long Island, New York
- Database: USGS National Water Information System database - USGS water data for the nation
- NGMDB Index Page: National Geologic Map Database Index Page (html)
- Download citation as: RIS | Dublin Core
Acknowledgments
The authors wish to thank The Nature Conservancy, the members of the Bureau of Shellfisheries at New York State Department of Environmental Conservation Division of Marine Resources for their field efforts, and the Suffolk County Department of Health Public and Environmental Health Laboratory for coordinating with field crews and sample analysis.
Executive Summary
The U.S. Geological Survey worked collaboratively with the New York State Department of Environmental Conservation to assess the potential sources of fecal contamination entering a part of Great South Bay near the hamlets of West Sayville, Sayville, and Bayport (referred to as Great South Bay for the purposes of this report) as part of a study of seven estuarine embayments across Long Island, New York, from June 2018 to June 2019. Water samples are routinely collected by the New York State Department of Environmental Conservation in Long Island embayments and analyzed for fecal coliform (FC) bacteria, an indicator of fecal contamination, to determine the closure of shellfish beds for harvest and consumption. Concentrations of fecal coliform signify the potential for pathogenic (disease-causing) bacteria to be present.
Indicator bacteria alone cannot determine either the biological or geographical sources of contamination. Microbial source tracking (MST) is a method used to determine these sources of contamination. Microbial source tracking laboratory techniques can ascertain whether genetic material obtained from Bacteroides or Helicobacter bacteria in water or sediment is consistent with humans, canines (dogs), ruminants (deer, sheep), or waterfowl (aquatic birds). Bacteroides and Helicobacter are genera of bacteria found in the gut of most warm-blooded animals. These techniques can also quantify the concentration of genetic markers found.
Information such as the sample location, weather and season, surrounding land use, and additional water-quality data for the location where the sample was collected help determine the geographical source and conveyance of land-based water to the embayment. The presence of genetic material and fecal coliform bacteria in samples collected at the same time is important to show that the fecal coliform is likely from the host source detected. It is possible for waters with waste infiltration to have genetic material present but no fecal indicators, such as disinfected water from a wastewater treatment plant or from groundwater that has passed through a sandy aquifer.
Water samples were collected in the summer and winter seasons. In each of the two seasons, one sample was collected in dry weather, and one, after substantial rainfall. Groundwater and sediment samples were also collected throughout the study. Surface-water source sites sampled for Great South Bay include Mill Pond Culvert near South Street, Brown Creek Culvert at Middle Road, Green Creek Culvert at Montauk Highway, and Green Creek County Park.
Of the potential sources of fecal-contaminated water—stormwater runoff, groundwater inputs, and drainage of coastal ponds, creeks, and wetlands—from Brown and Green Creeks that contribute to Great South Bay, the sources that are the most likely transport mechanism of fecal contamination to the bay are stormwater runoff and drainage from inland ponds and wetlands. Surface-water sites that are located where ponds and wetlands drain into Great South Bay were also found to have a high frequency of canine contamination, particularly during the summer months when dog walking is more frequent and tourism peaks. In general, and considering the available data, fecal coliform was higher in the summer season. No source sites were identified to have contributed substantial fecal contamination to Great South Bay during the winter months despite the entire area surrounding Brown and Green Creeks being uncertified by the National Shellfish Sanitation Program year-round.
Based on the results of the MST analyses, water quality in Great South Bay was heavily influenced by canine waste and less so by waterfowl, ruminant, or human wastewater (only one receptor sample had a detection of the human marker). MST results did not indicate influence from residential onsite wastewater disposal systems, and groundwater did not contribute to FC loads. Canine markers were nearly four times as prevalent as human markers, with positive detections in both seasons and weather conditions, but were seldom detected in receptor samples.
The groundwater sample collected at the Beach at Long Island Maritime Museum site contained FC below the reporting limit (less than 18 most probable number per 100 milliliters), indicating limited transport of bacteria in the subsurface groundwater through the sandy aquifer material. The groundwater sample at the Beach at Long Island Maritime Museum site had no detection of FC, which is consistent with results throughout Long Island. Sediment sampled at the Foster Avenue Beach and Beach at Long Island Maritime Museum sites contained low levels of human MST markers and has the potential to act as a source of FC during resuspension events, such as, tidal activity and storm-driven waves. Additional studies are needed to explore the potential of human waste contributions of FC loads to the bay via the shoreline sediment.
A classification scheme was developed that considered conditions such as high FC concentrations (particularly during dry weather samples) and contributions from human and canine waste based on detection of MST markers. The sites were assessed to assist stakeholders and resource managers in prioritizing the source sites that consistently contribute fecal coliforms to Great South Bay throughout the year. All surface-water source sites assessed in this study were classified to contribute equally to fecal contamination in Great South Bay, with groundwater being of least concern.
Introduction
To better understand fecal contamination sources in coastal embayments of Long Island, New York, microbial source tracking (MST) and fecal coliform bacteria (FC) data were collected from seven embayments from June 2018 to June 2019 (U.S. Geological Survey, 2020a). The objective of this research is to identify the different pathogen sources, both the host organism (such as human, mammals, or birds) and geographic origin (such as urban and storm runoff and submarine groundwater discharge), to embayments with fecal contamination. The embayments selected represent a mix of sewered and unsewered areas, differing levels of impervious land cover, varying population density, and a variety of land-use types in order to transfer what is learned to other areas beyond the seven embayments studied. In total, 353 samples were collected in the 7 embayments on Long Island. These were primarily surface-water samples but also included 17 groundwater, 11 sediment, 2 wastewater influent, and 8 fecal samples.
The presence of fecal contamination in Great South Bay and resulting hazards posed to marine resources and human health is of increasing concern. Recreational uses of the bay, including shellfishing and public bathing, are frequently restricted due to high counts of FC, which are used as indicators for when pathogens may be present. Pathogen loads can be influenced by watershed land-use, proximity to point sources such as municipal separate storm sewer systems, ponds and wetlands, as well as tidal exchange and circulation transporting pathogens from outside the study area (Gao and others, 2015), sediment resuspension (O’Mullan and others, 2019), and human recreation (including boating). Nonpoint sources may include shallow groundwater discharge because much of the area still relies on onsite wastewater disposal systems, such as cesspools and septic systems. Through routine FC monitoring, the New York Department of Environmental Conservation (NYSDEC) has identified fecal contamination as a concern in Great South Bay. Microbial source tracking techniques are necessary to determine the dominant source (human, canine, ruminant, waterfowl) and geographic origin of FC using land use, topography, and hydrology to establish a framework. The success of future pathogen-control measures may be measured in the decline in FC concentrations.
Site Description
Great South Bay is a natural embayment on the southern shore of Long Island that is approximately 45 miles long. The part of Great South Bay studied is bordered by the hamlets of West Sayville, Sayville, and Bayport to the north and Fire Island to the south and exists between two other waterbodies: Nicoll Bay to the west and Patchogue Bay to the east. For regulatory (shellfish) purposes, the NYSDEC distinguishes the studied portion of the bay as Great South Bay, Middle (fig. 1), referred to as Great South Bay for the purposes of this report. Great South Bay has deep navigation channels to support industrial and commercial facilities, including ferry services operating between the Long Island mainland and Fire Island. A large part of the waterfront is bulkheaded and is uncertified according to the National Shellfish Sanitation Program (NSSP) for shellfishing year-round (U.S. Department of Agriculture, 2019). The area is primarily unsewered and served by cesspools or septic tanks. Several tributaries, including Brown Creek and Green Creek, flow into Great South Bay (fig. 1).
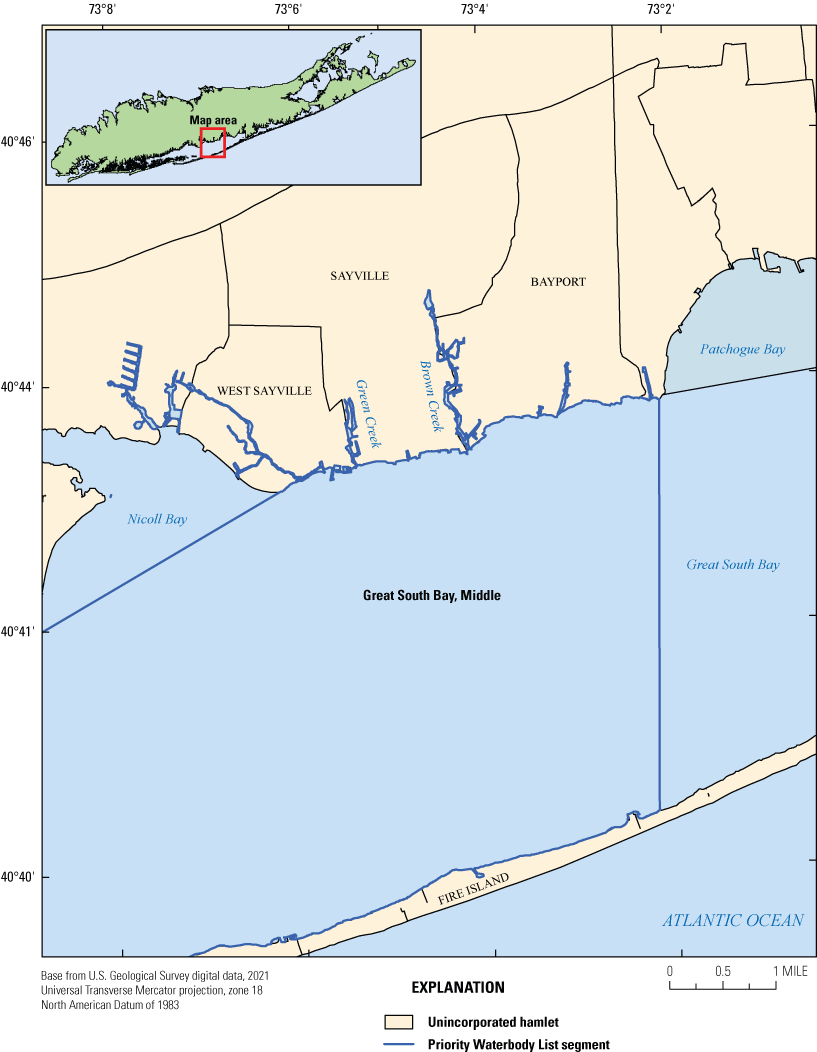
Map showing the extent of the Priority Waterbody List segments for Great South Bay on Long Island, New York, as designated by the New York State Department of Environmental Conservation (2020).
Areas around Brown and Green Creeks are a mix of residential and commercial land use, including public and private marinas. Potential contributions of contaminated water to the bay include storm runoff, groundwater inputs, and drainage of coastal ponds, creeks, and wetlands. There is a slight slope along the northern edge of Great South Bay, which allows for the slow delivery of stormwater from inland sources, such as through direct runoff or storm drains. The sites where surface-water samples were collected (U.S. Geological Survey, 2020a) for Great South Bay (fig. 2; table 1.1) are as follows:
-
• The culvert at the Mill Pond Culvert near South Street site is constructed from a wide, concrete pipe that runs under Montauk Highway and continuously discharges water from Mill Pond into Brown Creek. Mill Pond has a natural shoreline and is surrounded by large, deciduous trees and relatively low-density residential housing.
-
• The Brown Creek Culvert at Middle Road sampling site is a naturally narrowed part of Brown Creek with a paved, concrete overpass. The site is approximately 0.5 mile downstream from the Mill Pond Culvert sampling site and is bordered by natural shorelines, open space, and wetlands, with urban development and residential housing in the general vicinity.
-
• The Green Creek Culvert at Montauk Highway sampling site is downstream from the Brookside County Park historic and conservation site and is surrounded by impervious surfaces, such as roads and parking lots. The area consists of high-density urban development and residential housing that is positioned close to the creek’s shoreline.
-
• Greens Creek County Park is a small, grassy area with few trees and no walking trails and is located at the discharge point of Green Creek to Great South Bay. The park’s eastern perimeter is adjacent to Green Creek and consists of approximately 700 feet of bulkhead shoreline. This sampling site captures potential contamination from upstream urban development, residential housing, marinas, and road ends.
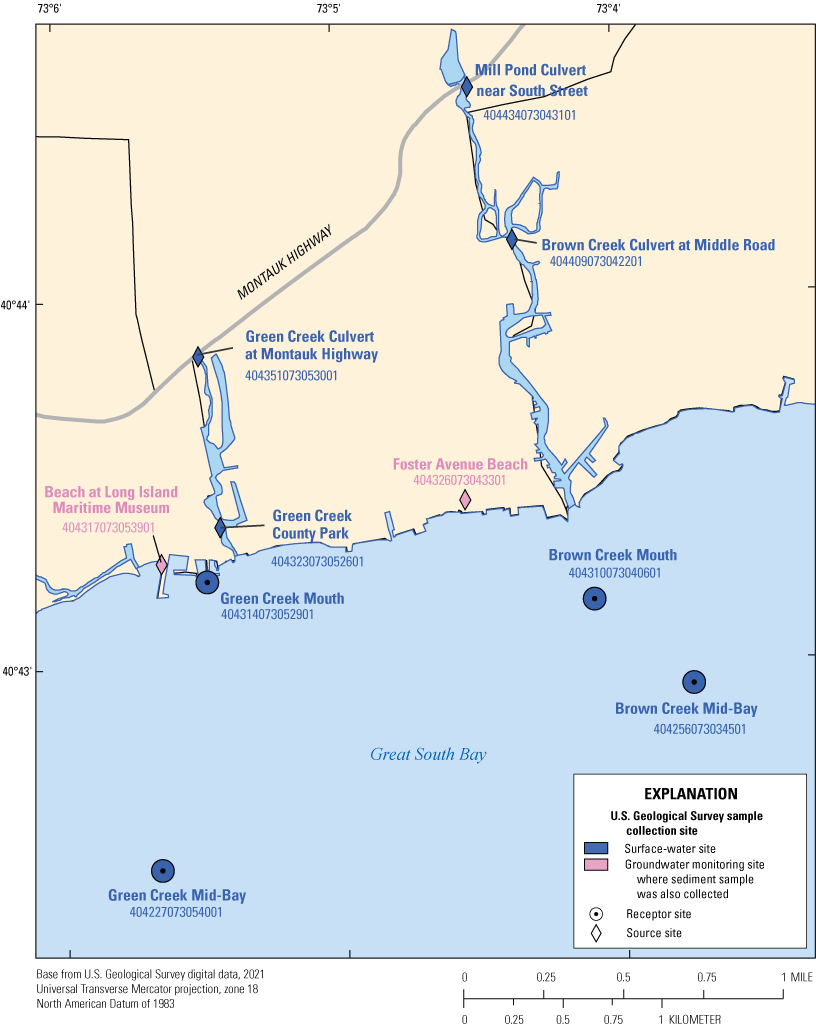
Map showing the locations where surface-water and groundwater plus sediment samples were collected for microbial source tracking analysis in Great South Bay on Long Island, New York. Data are from U.S. Geological Survey (2020a).
Approach and Methods
Sampling Methods
Sampling methods used for this study are detailed in Tagliaferri and others (2021). Sediment and groundwater samples were collected between June 2018 and June 2019 at selected sites along the northern shore of Great South Bay. All water-quality and sediment data collected in the field and those analyzed in laboratories as part of this study are available from the U.S. Geological Survey (USGS) National Water Information System (NWIS) database (U.S. Geological Survey, 2020a).
Wet conditions were defined as more than 0.25 inch of precipitation in 24 hours or 0.50 inch in 48 hours. Dry conditions were defined as less than 0.25 inch of precipitation in 72 hours. Rainfall totaled 0.20 inch on July 25, 2018, and 0.07 inch on July 26, 2018, designating samples collected on July 26, 2018, in Great South Bay as summer wet samples (more than 0.25 inch within 24 hours). Wet winter samples were collected in Great South Bay on April 16, 2019, with 0.75 inch of precipitation falling on April 15, 2019. Rainfall values were obtained from Islip Long Island MacArthur Airport (National Oceanic and Atmospheric Administration, 2021).
From June 2018 to June 2019, 8 surface-water sites were sampled in and around Great South Bay, yielding 32 surface-water samples, 2 groundwater samples, and 2 sediment samples. Of the surface-water sites, four were considered to be source sites (waters flowing directly into Great South Bay from the land), and four were considered to be receptor sites (the bay itself). Sixteen surface-water samples were collected under wet conditions, and 16, under dry conditions; 16 surface-water samples were collected in the summer, and 16, in the winter.
Laboratory Methods
Laboratory methods used for this study are detailed in Fisher and others (2020) and Tagliaferri and others (2021). Samples for fecal coliforms were analyzed at the Suffolk County Department of Health Services Public Environmental Health Laboratory (PEHL) and the NYSDEC Marine Laboratory. Additional information was either observed or compiled to facilitate interpretation of data. Precipitation measurements from the MacArthur Airport weather gage, which is approximately 7 miles from the center of Great South Bay (National Oceanic and Atmospheric Administration, 2021), were used to determine wet or dry conditions. Quality assurance for samples collected at MacArthur Airport weather gage is available in Menne and others (2012). Relative tide stage as noted by USGS field personnel and verified based on tidal predictions available (National Oceanic and Atmospheric Administration, undated) was documented along with the sample information in NWIS (U.S. Geological Survey, 2020a). Land-cover and sewer district geographic information system (GIS) coverages (Nassau County, 2015; Suffolk County, 2020; U.S. Geological Survey, 2020b) were used for data interpretation. These data support the MST results to increase confidence in the geographical source of the water and likely transport mechanisms of fecal contamination to Great South Bay.
Results
Results of MST and FC were assessed based on concentrations, presence or absence, and relative abundance of host markers with respect to surface-water source and receptor sites. Differences in MST markers and FC concentrations were also compared seasonally and conditionally (that is, wet or dry), with dry weather discharges with high FC concentrations from stormwater affected source sites being of particular concern.
Microbial Source Tracking
The canine Bacteroides (BacCan) marker was the most frequently detected MST marker with 15 positive detections in surface water across the landscape, followed by the waterfowl Helicobacter (GFD) marker with 9 detections and the human Bacteroides (HF183) marker with 4 detections in surface water (excluding 2 detections in sediment). The ruminant Bacteroides (Rum2Bac) marker was not detected in any samples collected during this study. The detection frequency of BacCan was similar for all sampling conditions and seasons (table 1), suggesting canine influence is unrelated to weather events and is a year-round occurrence. BacCan was detected in 14 of 16 source samples and only 1 of 16 receptor samples, which suggests that canine fecal contamination is likely diluted in the bay. There was a similar amount of marker detections when comparing sampling condition (wet or dry) and season (winter or summer), suggesting that fecal contamination was unrelated to weather events or time of year. Eight waterfowl marker detections were in samples collected during the winter, and only one during the summer, implicating seasonal avian fecal contamination throughout the embayment. The human marker was detected in only one surface-water receptor sample, during the wet winter sampling event at the Green Creek Mid-Bay site. Three of four human marker detections were in the samples collected during the wet winter sampling event, indicating that weather and season may influence the presence of human markers in Great South Bay, but human markers are not overly prevalent as a whole.
Table 1.
Summary of microbial source tracking results in surface-water samples for sites sampled in Great South Bay on Long Island, New York.[Ratios are number of samples with detections greater than reporting limit per total number of samples. Reporting limits vary due to analytical processes and matrix interferences. HF183, human-associated Bacteroides marker; Rum2Bac, ruminant-associated Bacteroides marker; GFD, waterfowl-associated Helicobacter marker; BacCan, canine-associated Bacteroides marker]
Host Specific Markers
Reporting limits for the three predominant MST markers (HF183, BacCan, and GFD) detected in Great South Bay varied slightly because of analytical processes, such as dilutions required because of matrix interferences. Understanding occurrence of the predominant MST markers in Great South Bay can help prioritize locations for additional investigation and infrastructure improvement. It can also provide a baseline for host contributions when prioritizing sites of concern for assessing FC and after total maximum daily load implementation.
HF183
The human marker was detected in 4 of 32 total surface water samples, all of which were in samples associated with Green Creek. Three of four samples with positive HF183 detections (450, 500, and 1,000 copies per 100 milliliters [copies/100 mL]) were in wet winter conditions, and the remaining sample (1,470 copies/100 mL) was collected during dry summer conditions (fig. 3). The Green Creek Mid-Bay site was the only surface-water receptor site with a positive HF183 detection. The highest concentration of HF183 was observed in a sample collected at the Green Creek County Park site (1,470 copies/100 mL) and was associated with relatively high FC concentration (1,300 most probable number per 100 milliliters [MPN/100 mL]; table 1.2). Sediment samples collected at the Foster Avenue Beach and Beach at Long Island Maritime Museum sites had positive detections of HF183 (200 and 670 copies per gram dry weight [copies/gdw], respectively), but the associated groundwater samples at both sites were negative for HF183 detection. HF183 in the sediment likely does not originate from groundwater in these areas but rather from tidal overwash.
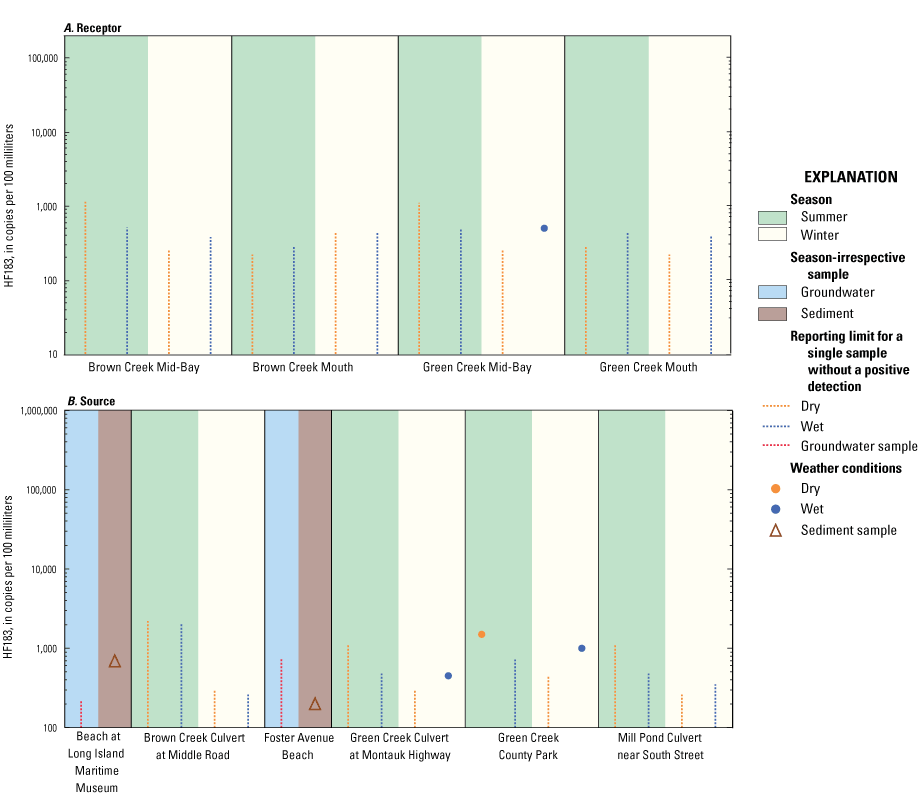
Graphs showing the concentrations of the human Bacteroides (HF183) marker, in copies per 100 milliliters for water samples and copies per gram dry weight for sediment samples, from A, receptor and B, source sites in Great South Bay on Long Island, New York, under various surface-water weather conditions. Vertical dashed lines indicate reporting limit for a single sample without a positive detection. Scales for marker concentrations are fixed to allow for easy comparison with other embayment study areas on Long Island.
BacCan
The canine marker was detected in 15 of 32 surface water samples and was found in samples associated with both Brown and Green Creeks. The concentration of BacCan in all samples was of the same order of magnitude (thousands of copies per 100 milliliters [mL]), except at the Green Creek Culvert at Montauk Highway site (121,000 copies/100 mL in the sample collected under summer wet conditions). The relatively even split of positive BacCan detections between sampling conditions (wet versus dry) and season (summer versus winter) suggests year-round canine influence across the Great South Bay landscape (table 1). The highest concentration (121,000 copies/100 mL) of BacCan in the sample collected at the Green Creek Culvert at Montauk Highway site during wet summer conditions was associated with the second highest FC concentration observed in Great South Bay during this study (1,700 MPN/100 mL; table 1.2; U.S. Geological Survey, 2020a). The Brown Creek Culvert at Middle Road and Green Creek County Park sites were the two sites where all samples collected contained positive detections of BacCan. The Brown Creek Mid-Bay site was the only receptor site with a sample positive for BacCan, which was in dry summer conditions (fig. 4). There were no positive detections of BacCan in the sediment or groundwater samples collected at the Foster Avenue Beach or Beach at Long Island Maritime Museum sites.
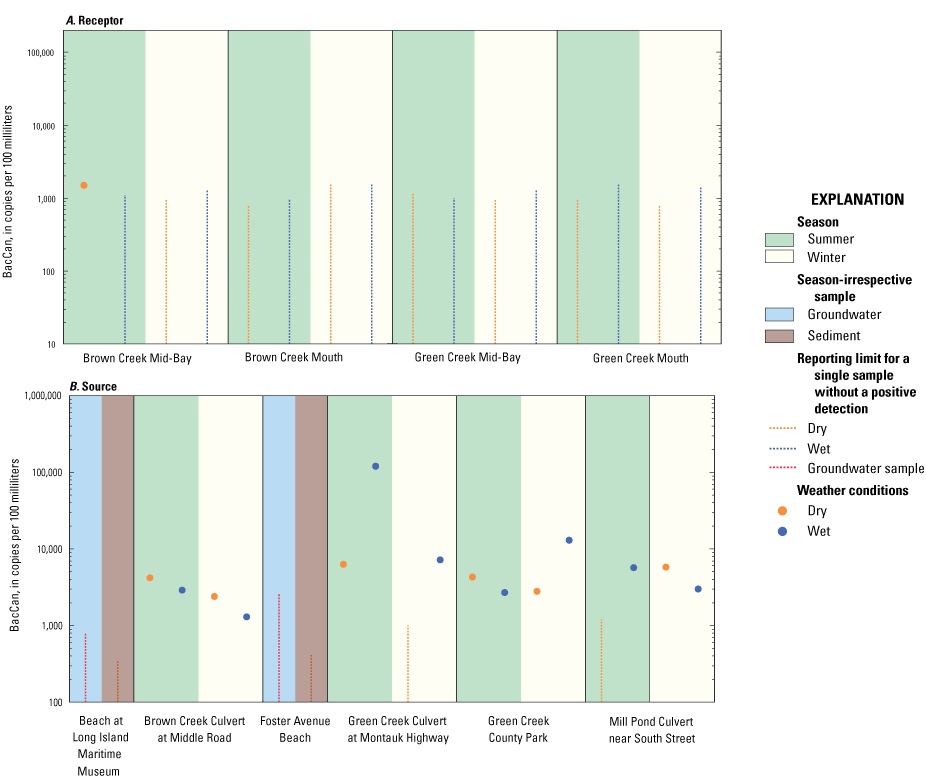
Graphs showing the concentrations of the canine Bacteroides (BacCan) marker, in copies per 100 milliliters for water samples and copies per gram dry weight for sediment samples, from A, receptor and B, source sites in Great South Bay under various surface-water weather conditions. Vertical dashed lines indicate reporting limit for a single sample without a positive detection. Scales for marker concentrations are fixed to allow for easy comparison with other embayment study areas on Long Island.
GFD
The waterfowl marker was detected in 9 of 32 total samples and was in samples associated with both Brown and Green Creeks. All positive detections were between hundreds and thousands of copies per 100 mL. The Green Creek County Park site was the only site with no GFD detections (fig. 5). Positive GFD detections were split roughly between weather condition (wet or dry) and sample type (source or receptor; table 1). Eight of nine positive detections were in samples collected during the winter season, implicating seasonal avian fecal contamination throughout the embayment (fig. 5). The waterfowl marker was present in each receptor sample collected in dry, winter conditions, whereas detections in source samples primarily occurred in wet conditions. The highest concentrations of GFD were in samples collected at two different receptor sites and both during dry winter conditions, at the Green Creek Mid-Bay (3,300 copies/100 mL) and Green Creek Mouth (2,500 copies/100 mL) sites. The highest frequencies of positive GFD detections were in samples collected at the Green Creek near Montauk Highway and Mill Pond Culvert near South Street sites, each with positive detections in two of four samples. There were no positive detections of GFD in the groundwater samples collected at the Foster Avenue Beach or Beach at Long Island Maritime Museum sites.
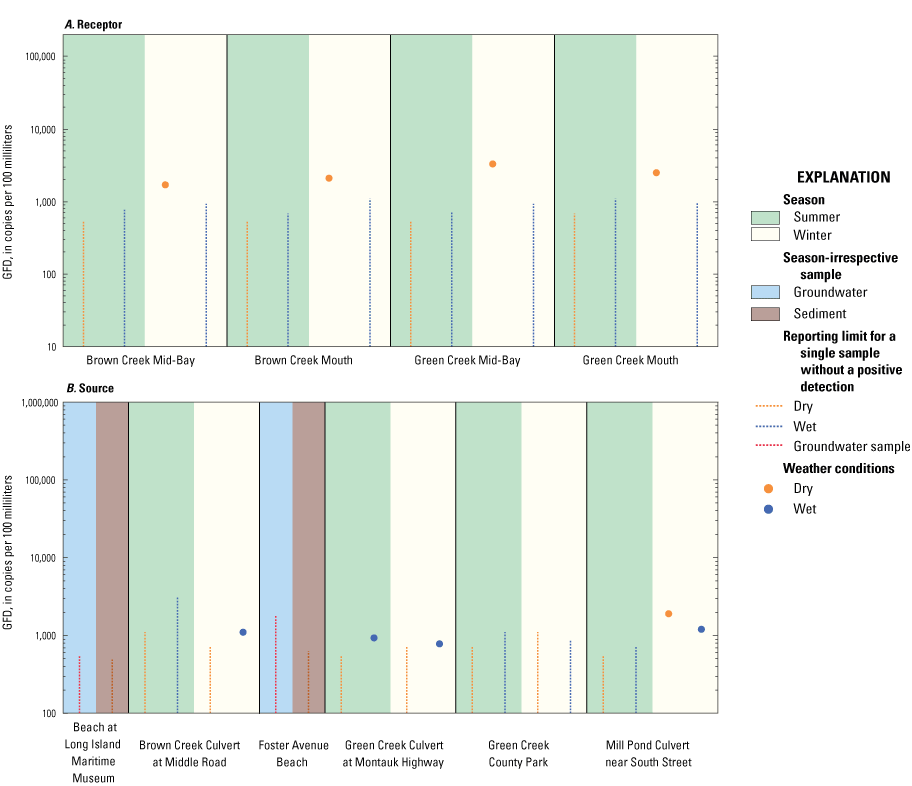
Graphs showing the concentrations of the waterfowl Helicobacter (GFD) marker, in copies per 100 milliliters for water samples and copies per gram dry weight for sediment samples, from A, receptor and B, source sites in Great South Bay under various surface-water weather conditions. Vertical dashed lines indicate reporting limit for a single sample without a positive detection. Scales for marker concentrations are fixed to allow for easy comparison with other embayment study areas on Long Island.
Fecal Coliform Bacteria
All 16 receptor samples had concentrations that were below the NSSP-defined 49 MPN/100 mL threshold for shellfish bed closure, despite the area surrounding Brown and Green Creeks being uncertified under the NSSP year-round (U.S. Food and Drug Administration, 2019). The highest FC concentrations in receptor sites were at the Brown Creek Mouth (45 MPN/100 mL) and Green Creek Mouth (43 MPN/100 mL) sites under wet sampling conditions. In contrast, 11 of 16 source samples had concentrations that exceeded 49 MPN/100 mL, indicating a high potential for inland contamination to affect the bay. The highest FC concentration observed in all Great South Bay samples was 5,000 MPN/100 mL, collected at the Brown Creek Culvert near Middle Road site in wet, summer conditions. The highest FC concentrations for each source site were during the summer season and were associated with high concentrations of canine markers.
The relation between FC and marker detection is not straightforward. Fecal coliform and specific host-associated markers may decay at different rates and be present in different abundances. Host-associated markers were shown to decay more rapidly than FC in Drozd and others (2011) and Rogers and others (2011). In general, high FC concentrations were in samples collected during the summer season and in wet weather.
Nonpoint Sources of Fecal Coliform Bacteria
A potential, major nonpoint contributor of FC to Great South Bay includes groundwater seepage from the widespread use of onsite wastewater disposal systems, which have the potential for leakage and failure, which in turn would contaminate the groundwater. Fecal coliform concentrations for groundwater collected at the Beach at Long Island Maritime Museum site were below detection and fecal coliform was not analyzed for the Foster Beach Avenue site. There were no MST markers associated with these groundwater samples.
Recent research (O’Mullan and others, 2019; Hassard and others, 2016) indicated that resuspension of sediment along natural shorelines can cause a spike in fecal indicator bacteria in the water column. Therefore, it is possible that during conditions that result in high wave energy, sediment (particularly organic-rich material) can act as a source of FC when resuspended in the water column as a result of tidal movement, storms, or boat activity. Human markers were detected in the sediment at the Beach at Long Island Maritime Museum (670 copies/gdw) and Foster Avenue Beach (200 copies/gdw) sites. Data from sediment samples collected throughout Long Island for the area-wide MST study strongly suggest that sandy sediment is an unlikely contributor of FC in all embayments, including Great South Bay.
Classification of Source Sites
The sites were assessed to better understand geographical sources and transport mechanisms to surface-water receptor sites and the relationship between FC and MST marker presence and abundance (table 2). Source sites were assigned a numeric classification as described in Tagliaferri and others (2021) to aid in conceptualizing the degree of contamination potential (table 3). Classifications are based on a sliding scale, with class 1 sites being the most contaminated and class 5 sites being the least contaminated.
Table 2.
Geographical sources of water for sample locations in Great South Bay on Long Island, New York, and the potential for these sites to have contributed to the fecal coliform concentrations observed in the samples.[MST, microbial source tracking; FC, fecal coliform bacteria; X, potential contributor, —, not a likely contributor based on current data]
Table 3.
Sample results for fecal coliform and microbial source tracking markers by source site type at Great South Bay on Long Island, New York.[Proposed classification considers concentrations of fecal coliform above 49 most probable number per 100 milliliters (MPN/100 mL), dry weather discharges, and influences of human sewage and canine waste. A fecal coliform concentration of 49 MPN/100 mL is the 90th percentile concentration determined by the New York State Department of Environmental Conservation as part of the National Shellfish Sanitation Program closure criteria (U.S. Food and Drug Administration, 2019). FC, fecal coliform bacteria; HF183, human Bacteroides marker; BacCan, canine-associated Bacteroides marker; —, no data]
Green Creek Culvert at Montauk Highway—Class 1
The highest instances of FC concentrations at the Green Creek Culvert at Montauk Highway site were in the summer samples, with 1,700 MPN/100 mL detected in the wet summer sample, and 800 MPN/100 mL, in the dry summer sample. Waterfowl and canine markers were most frequently detected in addition to one human detection, which was in the wet winter sample. The one human marker detection at this site was at a relatively low concentration (450 copies/100 mL) and corresponded with an FC concentration of 110 MPN/100 mL. The highest FC concentration at this site (1,700 MPN/100 mL) corresponded to the highest canine marker detection (121,000 copies/100 mL) in Great South Bay. Fecal coliform concentrations in the dry winter sample were right at the detection limit (20 MPN/100 mL) and were negative for all markers. Fecal coliform concentrations were higher in the summer (1,700 and 800 MPN/100 mL) than in the winter (20 and 110 MPN/100 mL), which may be explained by an increase in human, canine, and waterfowl populations in the summer season. The higher FC concentrations in summer and winter wet samples compared with their respective dry samples suggest an influence from stormwater conveyances and runoff from impervious surfaces.
Green Creek County Park—Class 1
All fecal coliform concentrations at the Green Creek County Park site were at or above the 20-MPN/100 mL reporting limit, ranging from 20 to 1,300 MPN/100 mL. Canine markers were detected in all samples, with the second highest concentration in Great South Bay in the wet winter sample from this site (13,000 copies/100 mL). Of all Great South Bay samples, human marker concentrations at this site were the highest, with concentrations that exceeded 1,000 copies/100 mL, and were associated with high FC concentrations during wet and dry weather. Private boat docks along the bank of Green Creek and a marina (just upstream from Green Creek County Park) are a potential source of these human marker detections, particularly in dry weather during the summer boating season; however, the human marker detected in the wet winter samples was also detected upstream at the Green Creek Culvert at Montauk Highway site and may be related to failing septic systems along the densely populated shoreline. More targeted sampling is needed in this area to determine human waste contributions to FC loads. The wet and dry summer samples at the Green Creek County Park site exhibited FC concentrations of more than 1,100 and 1,300 MPN/100 mL, respectively, whereas the samples taken upstream at the Green Creek Culvert at Montauk Highway site contained 1,700 and 800 MPN/100 mL respectively, suggesting high FC concentrations throughout the length of Green Creek in all weather conditions during the summer. These data demonstrate that Green Creek is a source of FC to Great South Bay, particularly during the summer, primarily attributed to the increased presence of canine markers in the surrounding area.
Brown Creek Culvert at Middle Road—Class 2
The sample collected at the Brown Creek Culvert at Middle Road site during wet summer conditions had the highest fecal coliform concentration (5,000 MPN/100mL) in all Great South Bay. Canine markers were detected in all samples, but these detections were not always associated with high FC. For example, the dry winter sample contained canine markers but had concentrations below detection for FC, whereas the summer samples contained both high FC and canine marker concentrations. No human or ruminant markers were detected at this site. Fecal coliform concentrations were higher in samples collected under wet conditions than dry, which implies that stormwater was flushing canine waste from the open grassy areas and surrounding residential communities into Brown Creek. Higher fecal coliform concentrations in the summer than the winter may reflect heavier use of the surrounding area for dog walking.
Mill Pond Culvert near South Street—Class 2
Fecal coliform concentrations at the Mill Pond Culvert near South Street site ranged from below the detection level in the wet winter sample to 300 MPN/100 mL in the wet summer sample. Canine markers were detected in three of four samples at concentrations ranging from 3,000 copies/100 mL in the wet winter sample to 5,800 copies/100 mL in the dry winter sample. Waterfowl markers were only detected in the winter samples and were associated with low to no detections of FC. Wet summer samples generally had higher FC concentrations than dry summer samples, suggesting that stormwater runoff is an important contributor of FC at the Mill Pond Culvert site and to Brown Creek.
Sediment—Class 5
Fecal coliform concentrations are not available for sediment samples collected at the Foster Avenue Beach or Beach at Long Island Maritime Museum sites; however, these samples appeared to be low in organic matter and therefore less likely to retain bacteria (Lee and others, 2006). Low levels of human markers were detected in these samples (200 copies/100 mL at the Foster Avenue Beach and 670 copies/100 mL at the Beach at Long Island Maritime Museum site), indicating minimal human fecal contamination potential to Great South Bay through the sediment. Additional sediment sampling is needed to determine the full potential of human fecal contamination from beach sediments to Great South Bay.
Groundwater—Class 5
The lack of positive detections for FC in groundwater throughout the study suggests that direct groundwater seepage is an unlikely contributor of FC to Great South Bay. Human MST markers were not detected at the Foster Avenue Beach or Beach at Long Island Maritime Museum site during this study, suggesting that septic waste is not a contributor of FC to the bay.
Summary
The U.S. Geological Survey, in collaboration with the New York State Department of Environmental Conservation (NYSDEC), assessed the potential sources of fecal contamination entering Great South Bay on Long Island, New York, from June 2018 to June 2019. Water samples are routinely collected by NYSDEC in Long Island embayments and analyzed for fecal coliform bacteria, an indicator of fecal contamination, to determine the closure of shellfish beds for harvest and consumption. Concentrations of fecal coliform signify the potential for pathogenic (disease-causing) bacteria to be present.
Host sources of fecal contamination in Great South Bay were assessed based on bacterial Bacteroides and Helicobacter microbial source tracking (MST) markers. Overall, canine markers were most frequently present across the Great South Bay landscape; however, by evaluating the MST markers alongside fecal coliform data and land-use information, geographical sources of fecal contamination discharging from the culverts and creeks sampled as part of this study were better differentiated. Among the potential sources of fecal-contaminated water contributing to Great South Bay from Brown and Green Creeks, stormwater runoff and drainage from inland ponds and wetlands are the most likely transport mechanisms of fecal contamination into Great South Bay. Sites draining ponds and wetlands were also found to have a high frequency of canine contamination, particularly during the summer months when dog walking is more frequent and tourism peaks. Fecal coliform at these site types is increased by stormwater runoff, which is another substantial source. Sites with high concentrations of fecal coliform bacteria in the summer exacerbated by stormwater include the Brown Creek Culvert at Middle Road, Mill Pond Culvert near South Street, and Green Creek Culvert near Montauk Highway sites.
When considering Brown and Green Creeks, the highest frequency of fecal coliform bacteria detections in source sites was found during wet weather in the summer season, as evidenced by fecal coliform concentrations exceeding 1,000 most probable number per 100 milliliters at three of four surface-water source sites. The absence of fecal coliform bacteria and human MST markers in groundwater samples indicates that water from septic systems is unlikely to influence the bay. The sandy sediment collected at the Foster Avenue Beach and Beach at Long Island Maritime Museum sites contained low levels of human MST markers. Because fecal coliform bacteria concentrations were not measured in the sediment samples in this study, additional, targeted investigation is needed to determine the degree of fecal coliform bacteria contributions to the bay through tidal shifts or boat activity. This study encompasses the potential for fecal contamination from Brown and Green Creeks into Great South Bay; however, there are other tributaries to Great South Bay that may be considered for fecal coliform bacteria monitoring in future studies.
References Cited
Drozd, M., Merrick, N.N., Sanad, Y.M., Dick, L.K., Dick, W.A., and Rajashekara, G., 2013, Evaluating the occurrence of host-specific, general fecal indicators, and bacterial pathogens in a mixed-use watershed: Journal of Environmental Quality, v. 42, no. 3, p. 713–725, accessed June 23, 2021, at https://doi.org/10.2134/jeq2012.0359.
Fisher, S.C., McCarthy, B.A., Kephart, C.M., and Griffin, D.W., 2020, Assessment of water quality and fecal contamination sources at Hook Pond, East Hampton, New York: U.S. Geological Survey Scientific Investigations Report 2020–5071, 58 p., https://doi.org/10.3133/sir20205071.
Gao, G., Falconer, R.A., and Lin, B., 2015, Modelling the fate and transport of faecal bacteria in estuarine and coastal waters: Marine Pollution Bulletin, v. 100, no. 1, p. 162–168, accessed June 23, 2021, at https://doi.org/10.1016/j.marpolbul.2015.09.011.
Hassard, F., Gwyther, C.L., Farkas, K., Andrews, A., Jones, V., Cox, B., Brett, H., Jones, D.L., McDonald, J.E., and Malham, S.K., 2016, Abundance and distribution of enteric bacteria and viruses in coastal and estuarine sediments—A review: Frontiers in Microbiology, v. 7, article 1692, 31 p., accessed June 23, 2021, at https://doi.org/10.3389/fmicb.2016.01692.
Lee, C.M., Lin, T.Y., Lin, C.-C., Kohbodi, G.N.A., Bhatt, A., Lee, R., and Jay, J.A., 2006, Persistence of fecal indicator bacteria in Santa Monica Bay beach sediments: Water Research, v. 40, no. 14, p. 2593–2602, accessed June 23, 2021, at https://doi.org/10.1016/j.watres.2006.04.032.
Menne, M.J., Durre, I., Vose, R.S., Gleason, B.E., and Houston, T.G., 2012, An overview of the Global Historical Climatology Network-daily database: Journal of Atmospheric and Oceanic Technology, v. 29, no. 7, p. 897–910, accessed November 30, 2021, at https://doi.org/10.1175/JTECH-D-11-00103.1.
Nassau County, 2015, Nassau County DPW sanitary sewer collection districts: Nassau County data, accessed March 30, 2021, at https://www.arcgis.com/home/item.html?id=26d010a660d047c495d2226df26af81a.
National Oceanic and Atmospheric Administration, 2021, Daily summaries station details—Islip LI MacArthur Airport, NY US: National Oceanic and Atmospheric Administration data, accessed April 12, 2021, at https://www.ncdc.noaa.gov/cdo-web/datasets/GHCND/stations/GHCND:USW00004781/detail.
National Oceanic and Atmospheric Administration, [undated], NOAA tide predictions: National Oceanic and Atmospheric Administration data, accessed 2020 at https://tidesandcurrents.noaa.gov/tide_predictions.html.
New York State Department of Environmental Conservation, 2020, Waterbody inventory/priority waterbodies list: New York State Department of Environmental Conservation data, accessed December 3, 2020, at https://www.dec.ny.gov/chemical/36730.html.
O’Mullan, G.D., Juhl, A.R., Reichert, R., Schneider, E., and Martinez, N., 2019, Patterns of sediment-associated fecal indicator bacteria in an urban estuary—Benthic-pelagic coupling and implications for shoreline water quality: The Science of the Total Environment, v. 656, p. 1168–1177, accessed June 23, 2021, at https://doi.org/10.1016/j.scitotenv.2018.11.405.
Rogers, S.W., Donnelly, M., Peed, L., Kelty, C.A., Mondal, S., Zhong, Z., and Shanks, O.C., 2011, Decay of bacterial pathogens, fecal indicators, and real-time quantitative PCR genetic markers in manure-amended soils: Applied and Environmental Microbiology, v. 77, no. 14, p. 4839–4848, accessed June 23, 2021, at https://doi.org/10.1128/AEM.02427-10.
Suffolk County, 2020, GIS viewer—Suffolk County: Suffolk County data, accessed March 30, 2021, at https://gisportal.suffolkcountyny.gov/gis/home/.
Tagliaferri, T.N., Fisher, S.C., Kephart, C.M., Cheung, N., Reed, A.P., and Welk, R.J., 2021, Overview and methodology for a study to identify fecal contamination sources using microbial source tracking in seven embayments on Long Island, New York: U.S. Geological Survey Scientific Investigations Report 2021–5033, 8 p., https://doi.org/10.3133/sir20215033.
U.S. Food and Drug Administration, 2019, National shellfish sanitation program—Guide for the control of molluscan shellfish—2019 revision: U.S. Food and Drug Administration, 502 p., accessed March 1, 2021, at https://www.fda.gov/food/federalstate-food-programs/national-shellfish-sanitation-program-nssp.
U.S. Geological Survey, 2020a, USGS water data for the nation: U.S. Geological Survey National Water Information System database, accessed July 31, 2020, at https://doi.org/10.5066/F7P55KJN.
U.S. Geological Survey, 2020b, National land cover database: U.S. Geological Survey data, accessed March 30, 2021, at https://www.usgs.gov/centers/eros/science/national-land-cover-database?qt-science_center_objects=0#qt-science_center_objects.
Appendix 1. Sample Collection in Great South Bay on Long Island, New York
Table 1.1.
Locations where samples were collected in Great South Bay on Long Island, New York, for bacterial genetic markers and fecal coliform analysis.[Samples collected include blanks and replicates. Data are from the National Water Information System (U.S. Geological Survey, 2020). Sample conditions of wet and dry indicate whether a sample was influenced by storm or nonstorm conditions, respectively. EST, eastern standard time; USGS, U.S. Geological Survey; NYSDEC, New York State Department of Environmental Conservation; PEHL, Public Environmental Health Laboratory; —, sample collected irrespective of wet or dry conditions]
Table 1.2.
Data summary of all samples collected in Great South Bay on Long Island, New York, for bacterial genetic markers and fecal coliform analysis.[Data are from the National Water Information System (U.S. Geological Survey, 2020). Samples collected include blanks and replicates. Bacterial genetic markers are human-associated Bacteroides (HF183), ruminant-associated Bacteroides (Rum2Bac), waterfowl-associated Helicobacter (GFD), and canine-associated Bacteroides (BacCan) markers. Bacteroides samples were analyzed by the U.S. Geological Survey Ohio Microbiology Laboratory. Fecal coliform samples were analyzed by the Suffolk County Department of Health Services Public and Environmental Health Laboratory (PEHL) unless denoted with a double asterisk (**), which indicates the sample was analyzed by the New York Department of Environmental Conservation Marine Laboratory. Bacterial genetic marker values in bold indicate that the concentration was greater than the reporting limit; values preceded by a less than (<) symbol indicate the reporting limit for a given assay when a nondetect occurred; values preceded by a greater than (>) symbol indicate the upper reporting limit for a given assay. EST, eastern standard time; copies/100 mL, copies per 100 milliliters; MPN/100 mL, most probable number per 100 milliliters; E, estimate; b, concentration was greater than the limit of quantification (Fisher and others, 2020) but less than the reporting limit; V, result may be affected by contamination; c, contamination was found in a blank sample and was used to appropriately qualify associated samples; ~, duplicate quantitative polymerase chain reaction (qPCR) results do not agree; *, measured in copies of genetic marker per gram dry weight; —, assay was not performed]
Reference Cited
U.S. Geological Survey, 2020, USGS water data for the nation: U.S. Geological Survey National Water Information System database, accessed July 31, 2020, at https://doi.org/10.5066/F7P55KJN.
Supplemental Information
Concentrations of genetic markers are given in copies per 100 milliliters (copies/100 mL) for water samples and copies per gram dry weight (copies/gdw) for sediment samples.
Concentrations of fecal coliform bacteria are given in most probable number per 100 milliliters (MPN/100 mL).
Abbreviations
BacCan
canine-associated Bacteroides marker
FC
fecal coliform bacteria
GFD
waterfowl-associated Helicobacter marker
HF183
human-associated Bacteroides marker
MPN
most probable number
MST
microbial source tracking
NWIS
National Water Information System
NYSDEC
New York State Department of Environmental Conservation
Rum2Bac
ruminant-associated Bacteroides marker
USGS
U.S. Geological Survey
For more information, contact
Director, New York Water Science Center
U.S. Geological Survey
425 Jordan Road
Troy, NY 12180-8349
dc_ny@usgs.gov
or visit our website
https://www.usgs.gov/centers/ny-water
Publishing support provided by the Pembroke and Reston Publishing Service Centers
Disclaimers
Any use of trade, firm, or product names is for descriptive purposes only and does not imply endorsement by the U.S. Government.
Although this information product, for the most part, is in the public domain, it also may contain copyrighted materials as noted in the text. Permission to reproduce copyrighted items must be secured from the copyright owner.
Suggested Citation
Tagliaferri, T.N., Fisher, S.C., Kephart, C.M., Cheung, N., Reed, A.P., and Welk, R.J., 2022, Using microbial source tracking to identify fecal contamination sources in Great South Bay on Long Island, New York: U.S. Geological Survey Scientific Investigations Report 2022–5057, 19 p., https://doi.org/10.3133/sir20225057.
ISSN: 2328-0328 (online)
Study Area
| Publication type | Report |
|---|---|
| Publication Subtype | USGS Numbered Series |
| Title | Using microbial source tracking to identify fecal contamination sources in Great South Bay on Long Island, New York |
| Series title | Scientific Investigations Report |
| Series number | 2022-5057 |
| DOI | 10.3133/sir20225057 |
| Publication Date | June 23, 2022 |
| Year Published | 2022 |
| Language | English |
| Publisher | U.S. Geological Survey |
| Publisher location | Reston, VA |
| Contributing office(s) | New York Water Science Center |
| Description | Report: vi, 19 p.; Database |
| Country | United States |
| State | New York |
| Other Geospatial | Great South Bay, Long island |
| Online Only (Y/N) | Y |
| Additional Online Files (Y/N) | N |